is climbing difficult? a gendered analysis on the use of …anon-ftp.iza.org/dp7688.pdf · ·...
TRANSCRIPT

DI
SC
US
SI
ON
P
AP
ER
S
ER
IE
S
Forschungsinstitut zur Zukunft der ArbeitInstitute for the Study of Labor
Is Climbing Difficult? A Gendered Analysis on the Use of Financial Services in Ghana and South Africa
IZA DP No. 7688
October 2013
Samuel AnnimThankom Arun

Is Climbing Difficult? A Gendered Analysis
on the Use of Financial Services in Ghana and South Africa
Samuel Annim University of Central Lancashire
Thankom Arun
University of Central Lancashire and IZA
Discussion Paper No. 7688 October 2013
IZA
P.O. Box 7240 53072 Bonn
Germany
Phone: +49-228-3894-0 Fax: +49-228-3894-180
E-mail: [email protected]
Any opinions expressed here are those of the author(s) and not those of IZA. Research published in this series may include views on policy, but the institute itself takes no institutional policy positions. The IZA research network is committed to the IZA Guiding Principles of Research Integrity. The Institute for the Study of Labor (IZA) in Bonn is a local and virtual international research center and a place of communication between science, politics and business. IZA is an independent nonprofit organization supported by Deutsche Post Foundation. The center is associated with the University of Bonn and offers a stimulating research environment through its international network, workshops and conferences, data service, project support, research visits and doctoral program. IZA engages in (i) original and internationally competitive research in all fields of labor economics, (ii) development of policy concepts, and (iii) dissemination of research results and concepts to the interested public. IZA Discussion Papers often represent preliminary work and are circulated to encourage discussion. Citation of such a paper should account for its provisional character. A revised version may be available directly from the author.

IZA Discussion Paper No. 7688 October 2013
ABSTRACT
Is Climbing Difficult? A Gendered Analysis on the Use of Financial Services in Ghana and South Africa
This paper examines the gender gaps in the use of higher-order financial services such as investment and insurance, draws on the FinMark national-level data from Ghana and South Africa. The main observation is that females in South Africa are more likely to use general financial and investment products than in Ghana. The results also reveal that in Ghana, a substantial part of the gender differentials in the use of financial services can be attributed to unobserved characteristics, mostly related to attitude and perceptions that inhibit women’s use of financial services. JEL Classification: G21, J16 Keywords: gender gaps, types and levels of access to finance, Ghana and South Africa Corresponding author: Thankom Arun Institute of Global Finance and Development Lancashire Business School, University of Central Lancashire Preston, PR1 2HE United Kingdom E-mail: [email protected]

3
Introduction
Although better provision of access to financial resources available to women is believed to
promote entrepreneurship and enhance women’s participation in economic activity, most of
the debates assume access is homogeneous rather than focusing on types and levels of
financial service. Access to financial services can improve ownership and serve as a catalyst
to greater economic empowerment among women, and further engender the achievement of
Millennium Development Goals (MDG) 2 and 7 (Napier et al., 2013). Demirgüç-Kunt et al.
(2013) argue that even a basic financial tool such as a deposit account can help significantly
by creating a reliable payment connection between family members, employer and
government. Nevertheless, in reality, female-managed firms are less likely to obtain a bank
loan in many countries, and the probability of receiving a loan is about 5 per cent lower for
female-owned/managed firms than for male-owned/managed enterprises (Muravyev et al.,
2009). Based on the Business Environment and Enterprise Performance Survey (BEEPS)
across 34 countries (mostly in Europe and Asia), Muravyev et al. (2009) noticed that the
gender-based discrimination is lower in countries with more developed financial markets, a
view supported by Becker-type discrimination. There is an absolute difference in terms of the
use of financial services between the developed and developing countries. According to a UN
Survey, 89 per cent of the population of the EU have access to a bank account whereas in
developing countries, this ranges from 6 to 47 per cent (Narain, 2009). As expected, in high
income countries 87.4 per cent of women have an account with a formal financial institution,
whereas the figure is 21.5 per cent in sub-Saharan Africa (GFI, 2011). In terms of using the
accounts for business purposes, the figures for high-income countries and sub-Saharan Africa
are 22.1 per cent and 4 per cent respectively. However, Aterido et al. (2011) found no
evidence of a gender gap in access and use of financial services by women entrepreneurs in
sub-Saharan Africa. Given these varied empirical findings, this paper contributes to the on-
going debate by examining the types and levels of access and use of financial services, and
the sources of gender differentials in two vibrant economies in sub-Saharan Africa: Ghana
and South Africa.
Background
The discussion on the universal use of financial services and products has been intense,
mostly on the issues of provision and use of financial services. The supply-side issues have

4
mainly emphasised the aspects of accessibility that are making financial products both
available and affordable, and on designing products in a reliable and flexible manner
(Claessens, 2006). The discourse has been extended to the regulatory framework for
protecting consumers and making sure that new financial markets integrate well into the
industry (Annim et al., 2012). One would expect these attempts to reduce the incidence of
financial exclusion; however, the prevalence of financial exclusion remains high in
developing countries.
Intermittent downturns in access and use of financial services have been observed in
South Africa, irrespective of the fact that the country enjoys better access to finance than
other countries in the region. For instance, the FinMark Trust (2009) reports a 3 per cent drop
in the proportion of South Africans using a bank service. These findings indicate the need for
more evidence on the demand side, which has led to a recent increase in the number of
studies that have concentrated on the demand-side factors of access to financial markets
(Annim et al., 2012; Baue et al, 2012; Kostov et al., 2011; Narain, 2009). Narain (2009)
outlines inadequate information about bank products and services, long and frustrating
application processes, perception that banks do not grant loans to low-income people, lack of
collateral, and lack of repayment capacity because of insufficient secured income, as some of
the leading demand-side issues that adversely affect financial inclusion. The literature has
also explored how issues such as perception, behaviour and attitudes contribute to financial
access and inclusion (Annim et al., 2012).
While both men and women may be faced with the constraints outlined above, by
reasons of culture, institutional structures and traditional rational collateral, females are
perceived to have stiffer barriers than males, and the effects of exclusion vary across gender.
The cultural and traditional factors that result in gender discrimination in the access and use
of financial services are mostly intangible and innate, and therefore unobservable for
measurement. However, from a policy perspective, it would be of interest to know if these
gender differences in access and the use of financial services can be explained mainly by
differences in socio-economic characteristics, or whether they are mainly due to behavioural
characteristics associated with males and females. In line with this broad policy objective,
this paper specifically seeks to examine the effect of gender on access and use of (i) general
accounts and services, (ii) investment accounts, and (iii) insurance and life assurance
services. As indicated, it is also the objective of this paper to decompose the gender

5
difference to identify how much of it is a result of differences in behaviour. Based on these
objectives we test the following hypotheses: (1) there is no gender difference in access and
use of financial services; (2) gender differences, if any, are not explained by unobservable
characteristics, and (3) patterns of gender differentials, if any, vary between Ghana and South
Africa for the three types of financial service.
Since 1987, Ghana has implemented reforms in the financial sector; interest rate caps
and allocation of credit to priority sectors were abolished as part of the reform. Recent
legislation on venture capital (2004), insolvency (2006) and credit reporting (2006) shows the
desire to create an enabling atmosphere in Ghana. Further, changes in the regulatory
framework ensure significant improvements in the legal basis for financial intermediation,
particularly on prudential supervision, capital adequacy, bank risk management, and more on-
site supervision. During this period, the financial environment in South Africa has also
witnessed substantial changes in financial regulations and innovations, and partnerships
across all financial institutions (Annim et al., 2012). For instance, the Mzansi initiative was
introduced in 2004 by the four major private banks in South Africa, ABSA, Nedbank,
Standard and First National, to reach the “unbanked”. Financial regulation in South Africa is
on a single regulatory regime with a bias to adopt the “twin peak” financial regulation system
to overcome differences in the skill sets needed for prudential and market conduct
regulations. In recent times regulatory interventions such as the promulgation of the
Consumer Protection Act (Act No. 68 of 2008) have also taken place, adjusting the industry
to emerging global trends. The introduction of these many policies and regulations in both
Ghana and South Africa could stifle innovation in the sector and constrain attempts to
increase financial access and inclusion.
While it is apparent that in both Ghana and South Africa conscious efforts have been
instituted to ensure access to financial services, it is worth noting that this does not
automatically translate to use of financial services. Thus, cognizant of the emerging
consensus that access to finance is mainly a supply-side issue that has to do with the supply
of reasonable quality financial services at reasonable costs (Claessens, 2006), the issue of
reasonability with regard to cost should be expressed holistically to encompass both monetary
and non-monetary costs. Use of financial services, on the other hand, has been explained to
mean the actual consumption of these services. Thus, whilst access can be viewed as a purely
supply-side problem, the use of financial services has both supply and demand as its

6
determinants. Access should therefore be viewed as a prerequisite to the use of financial
services.
The important question that needs to be answered is what causes voluntary and
involuntary exclusion in financial services. In most cases, voluntary exclusion is caused by
lack of access, assumed rejection based on socio-economic characteristics, and high costs that
put services out of reach of the unbanked. That is, some individuals will not have access if
there are no distribution points of financial institutions in their locality. The supply curve is
vertical at zero for such people. Other consumers are deterred from seeking financial services
from the market because they are charged high-risk premiums as a result of lack of credit
information. The last resort for this group then becomes the informal money lenders. It
should also be noted that the lack of a credit history may arise from such barriers as a weak
institutional environment, including poorly functioning credit information bureaus
(Claessens, 2006). Finally, those who are excluded may have their own perceived economic
and social barriers.
Involuntary exclusion leads to disequilibrium in the demand and supply of financial
services. Whilst the notion that use will vary with access is a standard result of demand and
supply, the work of Stiglitz and Weiss (1981) has shown that in the face of information
asymmetries, lenders will not only adjust the price but also the quantity of credit they are
willing to supply. In the view of Claessens (2006), depending on the distribution of
borrowers’ risk and return and other factors such as the level of income, the demand for
financial services can be backward bending, leading to quantity rationing. This will lead to
involuntary exclusion, although from the supply side it is a rational market response. Having
to estimate the effect of adverse selection and moral hazards can make it hard to separate
them empirically, and this goes further to compound the difficulty in determining whether an
individual or firm has voluntarily decided not to use financial services or whether such
individuals or firms are “rationed out”. The extent to which one can distinguish between
access and use of financial services also depends on the aspect of the service that is being
considered: insurance, investment, savings mobilisation or issuing credit. In view of the
different types of financial service, it is important to indicate the nature of exclusion in the
event where an individual uses just a fraction of the different types of financial service. The
foregoing suggests that identifying, understanding and addressing the issue of exclusion can
be daunting.

7
To make the issue of definition easier, some practitioners have restricted the concept
of access to availability, cost, range type and quality of financial services. The dimensions of
availability include: are financial services available, and if so in what quantity? Second is the
question of cost: what is the monetary value of the available financial services, including the
opportunity costs of having to wait in line for a teller or having to travel a long distance to a
bank branch? Third is the range, type and quality of the services being offered. Following
Morduch (1999), these dimensions can be identified as reliability (is financial service
available when needed?); convenience (is access to financial service easy?); continuity (can
financial service be accessed repeatedly?); and flexibility (is the financial product tailored to
individual needs?).The third component is particularly hard to measure and so has been
excluded from empirical papers. Cognizant of this complexity, in conceptualising access to
and use of financial services, this paper disaggregates the concept of access into types and
levels. Details of the disaggregation are provided in the next section.
The rest of this paper is organised as follows: the next section looks at the data and
models of estimation and measurement of variables. The third section presents a discussion of
the results of the analysis, as well as the major conclusions that are drawn from the paper;
and, finally, policy recommendations.
Data and Methods
This paper uses data from the FinScope surveys rolled out in Ghana and South Africa
in 2010. The roll-out of FinScope surveys is an initiative of the FinMark Trust (an
independent trust funded primarily by UKaid, the United Kingdom’s Department for
International Development). The survey is nationally representative and conducted in a
number of sub-Saharan African countries with the aim of contributing to an understanding of
consumers’ perceptions and behaviour in terms of their use of financial services. The survey
also captures information on attitudes, quality of life and consumption patterns. In view of
this mandate, the survey collects information on a broad range of issues including financial
services and socio-economic characteristics.
8
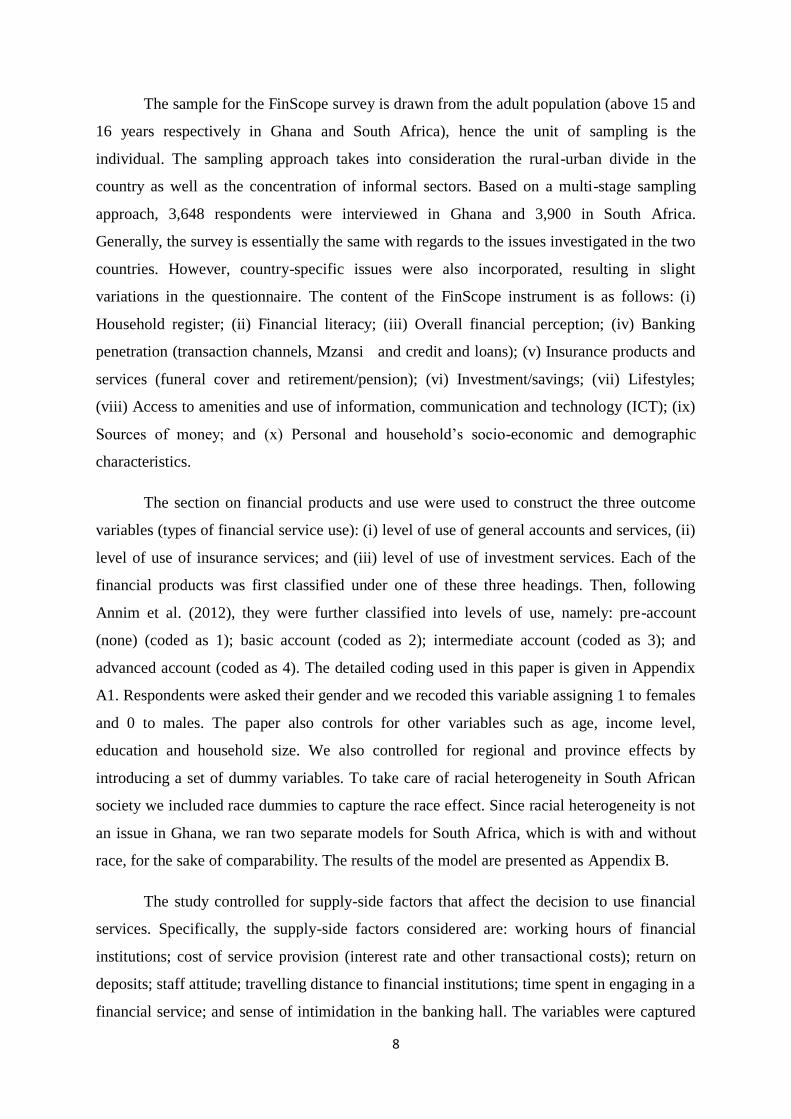
The sample for the FinScope survey is drawn from the adult population (above 15 and
16 years respectively in Ghana and South Africa), hence the unit of sampling is the
individual. The sampling approach takes into consideration the rural-urban divide in the
country as well as the concentration of informal sectors. Based on a multi-stage sampling
approach, 3,648 respondents were interviewed in Ghana and 3,900 in South Africa.
Generally, the survey is essentially the same with regards to the issues investigated in the two
countries. However, country-specific issues were also incorporated, resulting in slight
variations in the questionnaire. The content of the FinScope instrument is as follows: (i)
Household register; (ii) Financial literacy; (iii) Overall financial perception; (iv) Banking
penetration (transaction channels, Mzansi and credit and loans); (v) Insurance products and
services (funeral cover and retirement/pension); (vi) Investment/savings; (vii) Lifestyles;
(viii) Access to amenities and use of information, communication and technology (ICT); (ix)
Sources of money; and (x) Personal and household’s socio-economic and demographic
characteristics.
The section on financial products and use were used to construct the three outcome
variables (types of financial service use): (i) level of use of general accounts and services, (ii)
level of use of insurance services; and (iii) level of use of investment services. Each of the
financial products was first classified under one of these three headings. Then, following
Annim et al. (2012), they were further classified into levels of use, namely: pre-account
(none) (coded as 1); basic account (coded as 2); intermediate account (coded as 3); and
advanced account (coded as 4). The detailed coding used in this paper is given in Appendix
A1. Respondents were asked their gender and we recoded this variable assigning 1 to females
and 0 to males. The paper also controls for other variables such as age, income level,
education and household size. We also controlled for regional and province effects by
introducing a set of dummy variables. To take care of racial heterogeneity in South African
society we included race dummies to capture the race effect. Since racial heterogeneity is not
an issue in Ghana, we ran two separate models for South Africa, which is with and without
race, for the sake of comparability. The results of the model are presented as Appendix B.
The study controlled for supply-side factors that affect the decision to use financial
services. Specifically, the supply-side factors considered are: working hours of financial
institutions; cost of service provision (interest rate and other transactional costs); return on
deposits; staff attitude; travelling distance to financial institutions; time spent in engaging in a
financial service; and sense of intimidation in the banking hall. The variables were captured

9
in this paper by counting the number of such constraints faced by each individual. In the case
of Ghana, eight such questions were identified, with five for South Africa.
The current paper employs ordered logit models in its analysis. The choice of
ordered logit is appropriate because the dependent variables are ranked from 1 to 4 in each
case, with higher values representing higher levels of use of these products. We then estimate
the odds ratios since the coefficients in themselves mean very little in terms of interpretation.
To decompose the coefficient of sex (gender) into the relative contributions of observed and
unobserved characteristics of males and females, we employ the Blinder-Oaxaca
decomposition for non-linear regression models (Sinning, Hahn, & Bauer, 2008).
Given a linear regression model for two groups ( ) of the form
where and . The ordinary Blinder-Oaxaca decomposition of this
model will be given as:
( ) ( ) (1)
This type of decomposition will not be appropriate in our model because the outcome
variable is nonlinear because the conditional expectation of ( | ) may differ from
(Sinning et al., 2008). (Sinning et al., 2008) transforms the (1) to obtain a general
version of the blinder Blinder-Oaxaca decomposition as:
[ ( | ) ( | )] [ ( | ) ( | )] (2)
where ( | ) is the conditional expectation of and ( | ) represents the
conditional expectation of evaluated at the parameter vector . In this set up ( )
and . The first term on the right hand side displays the differential in the outcome variable
between A and B as a result of differences in the explanatory variables in , and the other term
shows the part differential that is due to differences of the coefficient. The ologit sample counterpart
of this technique is given by:
[{ ( ) ( )} { ( ) ( )}
{ ( )}]

10
Where is the number of possible outcomes and are the estimated threshold values of the
ordered logit.
Results and Discussion
The results from the econometric analysis are preceded by a descriptive overview of
the use of financial services across the different types and the levels of each type. Figures 1 to
3 present the descriptive results based on gender differences for both Ghana and South
Africa. Consistent with the respective FinScope reports, the proportion of females is greater
than males in both Ghana and South Africa. Figure 1 shows that more than half of both men
and women in Ghana either do not use a general account or service, or use a pre-account.
This pattern is also observed for the use of investment products (Figure 2) and insurance
services (Figure 3).
For South Africa, we observe a 1 per cent gender difference in all the levels for the
general accounts and services, with the exception of the advanced level where a 3 per cent
difference in favour of men is observed. In sum, for general accounts and services, larger
gender differences in favour of men are observed in Ghana relative to differences in South
Africa. In spite of this, the Chi-square test shows that the gender difference is statistically
significant, suggesting that the difference is not by chance in either country and is therefore
driven by either observed or unobserved factors.
Figure 2 shows that in South Africa, about half of both men and women do not use an
investment product, while in Ghana only one out of ten people uses an investment product.
Also from Figure 2, we observe a significant difference in the proportion of use of basic
investment products in both Ghana and South Africa. While in South Africa about half of the
adult population use some form of basic investment product, in Ghana less than 10 per cent
of the adult population use a basic investment product. In a gender context, more females in
both countries use basic investment products while more males in both countries use
advanced investment products. Thus men are likely to have advanced investment products
such as mutual fund, provident fund and ownership of treasury bills and shares and stocks.
On the other hand, the use of investment products such as the collection of antiques, unit
trusts, livestock and so forth is more common among women (52%) than men (50%) in South
Africa.

11
Figure 3 presents the descriptive analysis of the use of insurance services in Ghana
and South Africa by gender. As with the observation on the use of investment products,
Figure 3 shows that about half the adult population in South Africa use insurance services,
while in Ghana only 5 per cent and 11 per cent of the female and male adult population
respectively use an insurance service. In terms of gender differences, 4 per cent of females
use intermediate insurance services, compared to 9 per cent of males. Though negligible, the
proportion of males and females who use advanced insurance services in Ghana is the same
for adult males and females, that is 1 per cent. In South Africa, more males use advanced
insurance services than do their female counterparts (Figure 3). However, in terms of basic
insurance services such as funeral, provident, pension and education, the proportion of
females using these services is greater than that of their male counterparts. The FinMark
Trust (2011) report indicates that about 21 per cent of females patronise burial and funeral
insurance services, compared to 11 per cent of males. This corroborates our evidence that
more females (29%) than males (19%) use basic insurance services.
Figure 1: Levels of Use of General Accounts and Services by Sex in Ghana and South Africa in 2010

12
Figure 2: Levels of Use of Investment Products by Sex in Ghana and South Africa in 2010
Figure 3: Levels of Use of Insurance Products by Sex in Ghana and South Africa in 2010
Tables 1 and 3 present the ordered logit results for each of the three financial services
in Ghana and South Africa respectively. The summary statistics of the variables used in the
ordered logit models are presented in Appendix C. The two tables show that gender
significantly influences use of general accounts and services and insurance in both Ghana and
South Africa. However, the estimated results fail to find evidence of differences in terms of
use of investment services across gender in either country. The sign of the gender variable in
Table 1 is consistent with a priori expectations. According to the results, the females are 29

13
per cent less likely to use general account and services and 44 per cent less likely to use
insurance services. However, central to expectations, females in South Africa are more likely
to use general account and insurance services than their male counterparts. From Table 3, the
odds of using general account are 26 per cent higher for females than for males, and 54 per
cent higher when considering insurance services. Thus the results show that females in Ghana
are financially excluded, but we fail to find the same evidence for South Africa.
We observe that age is a significant determinant of the use of all the products in
Ghana. However, in the case of South Africa, age is significant only in explaining the use of
insurance services. From Table 1, a unit increase in age is associated with about a 3 per cent
chance that the person will use a higher level of general account and services and insurance,
and about a 2 per cent chance that they will use a higher level investment service in Ghana.
For South Africa, on the other hand, the odds of using insurance services increase by 3 per
cent per unit increase in age. Our findings are consistent with earlier works by Annim et al.
(2012) and Barslund & Tarp (2008).
Levels of education tend to be highly significant in explaining levels of use of
financial services in both Ghana and South Africa. The effect of education is confirmed in all
the models except the investment model of South Africa. The signs of the set of education
dummies are consistent with a priori expectations. The implication of this finding is that
educated people are more likely to use higher levels of these financial services. This is
because education tends to enlighten individuals on the benefits of engaging the services of a
financial institution, specifically for higher-level financial products; thus, insurance, savings
and investment receive their patronage.
A dummy variable (urban) was introduced to capture the rural-urban divide. In these
countries, as in the case of most African countries, rural areas are inhabited by poor agrarian
people whose demand for financial services may be constrained by their socio-economic
conditions. These may be either supply or demand-side issues, such as low income or absence
of financial institutions. However, residing in an urban area proves to increase the chance of
using all the financial services and general account and investment services in South Africa.
To examine the effect of being married on the use of these financial services, a married
dummy was introduced in the model. In both countries, this variable is significant in some of
the models. For example, in Ghana being married increases one’s of chance of using an
investment account by 33.4 per cent. In South Africa, on the other hand, married people have

14
about a 94 per cent higher chance of using general account and services and a 90 per cent
chance of using an insurance service. Intuitively, the sign of this variable is expected since
married people may have greater responsibilities that cause them to save and invest for the
future.

15
Table 1: Ordered Logit Estimation of Usage of Various Financial Services in Ghana
(1) (2) (3)
General Account and Service Insurance Investment
female -0.325*** -27.74 -0.560*** -42.90 -0.0181 -1.790
(-4.16)
(-3.64)
(-0.15)
Age 0.0270*** 2.734 0.0341*** 3.473 0.0169*** 1.705
(10.27)
(7.10)
(4.18)
HH. Size 0.0248 2.510 0.00113 0.113 -0.0414 -4.054
(1.07)
(0.03)
(-1.12)
Urban 0.782*** 118.7 0.845*** 132.7 0.644*** 90.50
(8.85)
(4.62)
(4.72)
No. Of reasons -0.506*** -39.70 -0.259+ -22.84 -0.0897 -8.581
(-6.01)
(-1.65)
(-0.83)
Married 0.320***
0.208
0.288* 33.4
(4.02)
(1.32)
(2.31)
Education
Basic sch. 0.923*** 151.6 0.643* 90.19 0.594** 81.16
(7.54)
(2.35)
(3.04)
Secondary sch. 1.687*** 440.4 1.369*** 293.0 0.891*** 143.7
(11.61)
(4.62)
(3.94)
Post sec. 2.609*** 1258.8 2.452*** 1061.2 1.531*** 362.1
(10.98)
(6.90)
(4.89)
University 2.959*** 1828.7 2.712*** 1406.2 2.583*** 1224.1
Income
Below 600 1.016*** 176.1 1.178*** 224.8 0.865*** 137.6
(8.27)
(3.82)
(3.95)
Betw. 601 and 1200 1.286*** 261.8 1.519** 356.8 1.311*** 270.8
(4.65)
(3.25)
(3.38)
Betw. 1201 and 1800 1.400* 305.6 -0.430 -34.9 0.720 105.4
(2.53)
(-0.28)
(0.94)
Over 1801 1.132+ 210.2 0.0902 9.4 0.727 106.9
(1.67)
(0.09)
(0.76)
Region
Western -0.110 -10.45 -0.681* -49.38 0.0176 1.776
(-0.72)
(-2.26)
(0.07)
Central 0.352* 42.17 -0.870* -58.10 0.00187 0.187
(2.18)
(-2.46)
(0.01)
Volta -0.239 -21.27 0.0696 7.213 -0.0603 -5.848
(-1.38)
(0.24)
(-0.20)
Eastern 0.493*** 63.72 -0.373 -31.11 0.246 27.84
(3.35)
(-1.31)
(0.99)
Ashanti 0.424*** 52.74 -0.204 -18.49 0.984*** 167.4
(3.53)
(-0.97)
(5.46)
Brong Ahafo 0.152 16.47 -1.389** -75.06 -0.538 -41.61

16
(0.89)
(-2.81)
(-1.47)
Northern -0.976*** -62.30 -0.709* -50.81 0.548* 72.97
(-4.90)
(-1.98)
(2.02)
Upper East -0.352 -29.69 -0.205 -18.57 0.823* 127.8
(-1.46)
(-0.46)
(2.42)
Upper West -0.650+ -47.79 -0.150 -13.96 0.586 79.77
(-1.95)
(-0.26)
(1.30)
cut1
Constant 3.443***
5.841***
4.851***
cut2
Constant 5.095***
5.922***
5.925***
cut3
Constant 7.393***
8.304***
6.626***
N 3072 3072 3072
Percentage change in second column
z statistics in parentheses
="+ p<0.1 * p<0.05 ** p<0.01 *** p<0.001"
In terms of income, we observe that higher income levels compared with no income
consistently show a positive and significant effect on the use of the various financial services
across all models in the two countries. This finding corroborates the proposition that demand
for financial services is an increasing function of income (Outreville, 1990). We also observe
regional variation across countries and models. Compared to people in the Upper West
region, inhabitants of the Central, Greater Accra, Eastern, Ashanti and Brong Ahafo regions
are likely to use general account services. The situation is no different in South Africa, where
the Western Cape is the reference province. The paper also included a set of dummy variables
to control for the race of the respondent. Using blacks as the reference group, this paper show
that the three other groups, i.e. Coloured, Asian and White, are more likely to use higher
levels of these financial products. As discussed earlier, perceived and actual supply
constraints tend to influence financial inclusion in developing countries. The models in
Tables 1 and 2 show that as the number of perceived problems an individual has are reduced,
the probability of using higher-level general accounts and services in Ghana and the use of
insurance services in South Africa. However, this variable proves not be statistically
significant in the other models.

17
Table 2: Ordered Logit Estimation of Usage of Various Financial Services in South
Africa
(1) (2) (3)
General Account and Services Insurance Investment
Coef % Coef % Coef %
Female 0.23* 25.80 0.43*** 54.36 0.02 1.72
(2.15)
(4.12)
(0.16)
Age 0.00 0.237 0.03*** 3.461 0.00 0.17
(0.56)
(7.91)
(0.41)
HH. Size -0.01 -0.737 -0.02 -1.914 0.01 0.56
(-0.31)
(-0.75)
(0.26)
Urban 0.405** 49.99 -0.15 -14.16 -0.21+ -18.79
(3.10)
(-1.18)
(-1.66)
No. of Reason 0.01 0.726 -0.195+ -17.71 -0.06 -5.90
(0.06)
(-1.81)
(-0.59)
Married 0.66*** 94.30 0.64*** 89.70 0.06 5.70
(5.94)
(5.80)
(0.49)
Education
High sch. 0.85*** 132.90 0.51** 66.51 0.05 5.10
(4.98)
(3.11)
(0.31)
Technical sch. 2.13*** 741.70 1.35*** 286.70 -0.37 -30.98
(5.79)
(3.30)
(-0.96)
Matriculation/Univ. 1.55*** 372.70 1.11*** 202.10 -0.15 -14.01
(8.76)
(5.83)
(-0.85)
Income
Below Average 0.63** 87.23 0.40* 49.44 -0.23 -20.79
(3.20)
(2.07)
(-1.44)
Average Inc. 1.36*** 289.20 0.77*** 116.0 0.05 5.540
(6.64)
(3.87)
(0.33)
Above Av. Inc. 1.79*** 501.40 1.57*** 381.60 0.16 17.41
(9.41)
(8.46)
(1.02)
High inc. 3.80*** 4352.40 4.20*** 6566.20 0.44* 55.94
(14.89)
(17.65)
(2.18)
Province
Eastern Cape -0.34+ -28.89 -0.34+ -28.46 -0.01 -0.831
(-1.93)
(-1.72)
(-0.04)
Northern Cape -0.38+ -31.67 -0.34 -28.51 -1.50*** -77.60
(-1.86)
(-1.56)
(-6.00)
Free State -0.36+ -30.45 -0.33 -27.87 0.39* 48.19
(-1.89)
(-1.47)
(2.26)
KwaZulu-Natal -0.18 -16.55 -0.44* -35.87 0.16 17.31
(-1.01)
(-2.28)
(0.86)
North West 0.03 2.926 -0.67** -48.63 -0.58* -43.89
(0.12)
(-2.62)
(-2.52)
Gauteng -0.19 -17.31 -0.25 -22.24 0.18 20.10

18
(-1.02)
(-1.34)
(1.03)
Mpumlanaga 0.14 14.51 -0.78** -54.09 0.22 24.27
(0.60)
(-3.10)
(1.05)
Limpopo -0.28 -24.62 -0.87*** -58.19 -0.32 -27.25
(-1.34)
(-3.71)
(-1.38)
cut1
Constant 2.37***
2.97***
-0.42
cut2
Constant 3.50***
5.06***
2.54***
cut3
Constant 7.17*** 6.92*** 4.00***
N 3123 3123 3123
Percentage change in second column
z statistics in parentheses
+ p<0.1 * p<0.05 ** p<0.01 *** p<0.001
In line with the second objective of decomposing the coefficient of gender to identify
the relative contributions by economic characteristics and behavioural differences, we
employed the non-linear version of the Blinder-Oaxaca decomposition technique (Sinning et
al., 2008). The results of the decomposition for the various models are presented in
Appendices D1 to D9. The results show that more 70 per cent of the coefficient of female in
the general account and insurance models is explained by unobserved characteristics across
gender. This implies that variation across gender in terms of financial use is explained by
behavioural and perception characteristics other than the observed socio-economic
characteristics analysed in these models. In the case of investment services, about 47 per cent
of the gender differences are explained by unobserved characteristics.
Conclusions
This paper has used FinScope data to examine gender differentials in access to and
use of financial products in Ghana and South Africa. The rationale was to contribute to the
debate on the mixed empirical results as to whether there is gender discrimination in the use
of financial services, and fuelled the discourse by identifying the sources of gender
differentials in financial use, if any. The paper also contributes to the existing literature by
way of examining the presence of gender discrimination in the use of financial services based
on levels and types of financial transaction rather than on perceptions of financial barriers and
aggregation of access and use of financial services. In this regard, the specific hypotheses
tested in this paper are: (1) there is no gender difference in access and use of financial
services; (2) gender differences, if any, are not explained by unobservable characteristics, and

19
(3) patterns of gender differentials, if any, vary between Ghana and South Africa for the three
types of financial service. The ordered logit regression model and non-linear decomposition
technique akin to the Blinder-Oaxaca decomposition are employed to test the three
hypotheses. As part of the data management, financial products were grouped under three
main types of account: (1) general account and services, (2) insurance services, and (3)
investment services.
Our results suggest that on the whole there is gender discrimination in the use of
financial services in both Ghana and South Africa. The descriptive analysis shows that for
each of the three types of financial service, the proportion of males is higher for advanced
products. The evidence of gender discrimination in both Ghana and South Africa is
statistically supported in the case of general accounts and services, and insurance products.
The main observation is that females in South Africa are more likely to use general financial
and investment products than in Ghana. Based on a stepwise regression analysis, we observed
that in South Africa, the income effect offsets the observation from the descriptive analysis
that more males use financial services. This suggests that one of the strategies for Ghana to
address female discrimination in the use of financial service is to bridge the gender income
gap. In most cases our decomposition results show that differences in unobserved
characteristics are the major contributors to the observed coefficients. In Africa, a concerted
effort is been made to enhance the provision of financial services and make them available at
an affordable cost. However, this effort will be meaningful only when we focus on the
specific sections of the population, such as women, who have been excluded significantly in
the past. The findings of the paper contribute to the knowledge of levels and types of
financial transactions among women, information that is useful in developing relevant
products and policies, by removing perceived barriers.
20
References
Annim, S., Arun, T., & Kostov, P. (2012). Effect of perceptions and behaviour on access
to`and use of financial service: Evidence from South Africa. IZA Discussion Paper series No
7042, Bonn.
Aterido R., Beck T. and Iacovone L. (2011) Gender and Finance in Sub-Saharan Africa: Are
Women Disadvantaged? Policy Research Working Paper 5571, The World Bank,
Washington D. C.
Barslund, M., & Tarp, F. (2008). Formal and informal rural credit in four provinces of
Vietnam. The Journal of Development Studies, 44(4), 485–503.
Bauer, M., Chytilová, J., & Morduch, J. (2012). Behavioral foundations of microcredit:
Experimental and survey evidence from rural India. The American Economic Review, 102(2),
1118–1139.
Bawumia, M., Owusu-Danso, T., & McIntyre, A. (2008). Ghana’s reforms transform its
financial sector. IMF Survey Magazine: Countries & Region, 1–4.
Claessens, S. (2006). Access to financial services: A review of the issues and public policy
objectives. The World Bank Research Observer, 21(2), 207–240.
Daymont, T. N., and P. J. Andrisani. 1984. Job preferences, college major, and thegender gap
in earnings. Journal of Human Resources,19, 408–428.
Demirgüç-Kunt, A., Klapper, L. F., & Singer, D. (2013). Financial Inclusion and Legal
Discrimination Against Women: Evidence from Developing Countries (SSRN Scholarly
Paper No. ID 2254240). Rochester, NY: Social Science Research Network. Retrieved from
http://papers.ssrn.com/abstract=2254240
Finmark Trust. (2011). FinScope South Africa Small Business Survey 2010. Midrand:
Finmark Trust.
Kostov, P., Arun, T., & Annim, S. (2011). Determinants of access to finance: an investigation
into the Mzansi intervention. European Journal of Development Research, 24(3), 397–412.
Morduch, J. (1999). The microfinance promise. Journal of economic Literature, 37(4), 1569–
1614.
Muravyev, Alexander & Talavera, Oleksandr & Schäfer, Dorothea, 2009. "Entrepreneurs'
gender and financial constraints: Evidence from international data," Journal of Comparative
Economics, Elsevier, vol. 37(2), pages 270-286, June.

21
Napier, M., Melamed, C., Taylor, G., & Jaeggi, T. (2013). Promoting women’s financial
inclusion: A toolkit - Publications - GOV.UK. Department for International Development.
Retrieved from https://www.gov.uk/government/publications/promoting-womens-financial-
inclusion-a-toolkit
Narain, S. (2009). Gender and Access to Finance. Analytical Paper, World Bank. Retrieved
from http://siteresources.worldbank.org/EXTGENDERSTATS/Resources/SushmaNarain-
AccesstoFinanceAnalyticalPaper.doc
Osei-Assibey, E. (2009). Financial Exclusion: What drives supply and demand for basic
financial services in Ghana? Savings and Development, 33(3), 207–238.
Outreville, J. F. (1990). The Economic significance of insurance markets in developing
countries. The Journal of Risk and Insurance, 57(3), 487–498. doi:10.2307/252844
Sinning, M., Hahn, M., & Bauer, T. K. (2008). The Blinder-Oaxaca decomposition for
nonlinear regression models. The Stata Journal, 8(4), 480–492.
Stiglitz, J. E., & Weiss, A. (1981). Credit rationing in markets with imperfect information.
The American Economic Review, 71(3), 393–410.
22
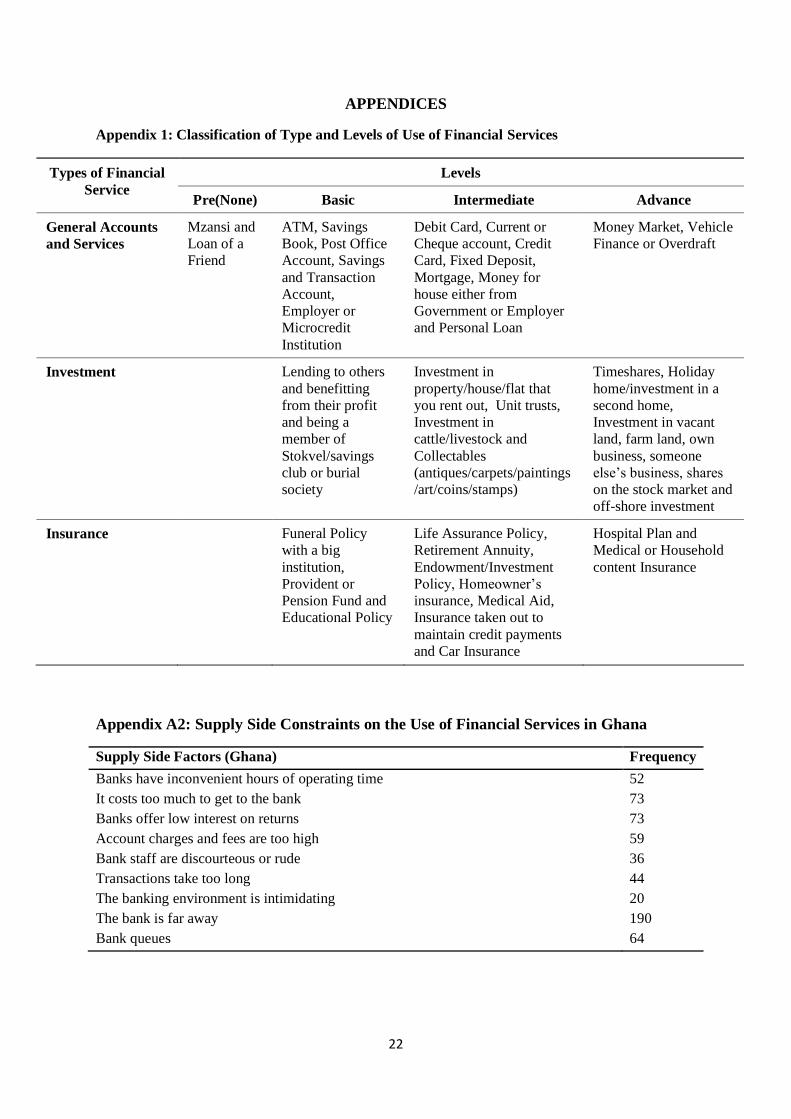
APPENDICES
Appendix 1: Classification of Type and Levels of Use of Financial Services
Appendix A2: Supply Side Constraints on the Use of Financial Services in Ghana
Supply Side Factors (Ghana) Frequency
Banks have inconvenient hours of operating time 52
It costs too much to get to the bank 73
Banks offer low interest on returns 73
Account charges and fees are too high 59
Bank staff are discourteous or rude 36
Transactions take too long 44
The banking environment is intimidating 20
The bank is far away 190
Bank queues 64
Types of Financial
Service
Levels
Pre(None) Basic Intermediate Advance
General Accounts
and Services
Mzansi and
Loan of a
Friend
ATM, Savings
Book, Post Office
Account, Savings
and Transaction
Account,
Employer or
Microcredit
Institution
Debit Card, Current or
Cheque account, Credit
Card, Fixed Deposit,
Mortgage, Money for
house either from
Government or Employer
and Personal Loan
Money Market, Vehicle
Finance or Overdraft
Investment Lending to others
and benefitting
from their profit
and being a
member of
Stokvel/savings
club or burial
society
Investment in
property/house/flat that
you rent out, Unit trusts,
Investment in
cattle/livestock and
Collectables
(antiques/carpets/paintings
/art/coins/stamps)
Timeshares, Holiday
home/investment in a
second home,
Investment in vacant
land, farm land, own
business, someone
else’s business, shares
on the stock market and
off-shore investment
Insurance Funeral Policy
with a big
institution,
Provident or
Pension Fund and
Educational Policy
Life Assurance Policy,
Retirement Annuity,
Endowment/Investment
Policy, Homeowner’s
insurance, Medical Aid,
Insurance taken out to
maintain credit payments
and Car Insurance
Hospital Plan and
Medical or Household
content Insurance

23
Appendix A3: Supply Side Constraints on the Use of Financial Services in South Africa
Supply Side Factors (South Africa) Frequency
The bank is too far from where I live 25
It is expensive to have a bank account 49
It is too much hassle and not worht the effort 39
it is too expensive to save 397
The interest is too high 296

24
Appendix B: Ordered Logit Estimation of Usage of Various Financial Services in South
Africa – With Race
(1)
(2)
(3)
General Account and Services Insurance Investment
Coef. % Coef. % Coef. %
Female 0.22* 24.89 0.42*** 52.10 0.02 2.36
(2.08)
(3.94)
(0.22)
Age -0.00136 -0.136 0.03*** 3.236 0.00 0.488
(-0.31)
(7.23)
(1.13)
HH. Size -0.01 -0.598 -0.02 -1.789 0.00 0.57
(-0.25)
(-0.69)
(0.26)
Urban 0.31* 35.96 -0.21 -19.28 -0.09 -8.36
(2.31)
(-1.61)
(-0.68)
No. of Reason -0.01 -1.481 -0.21+ -18.88 -0.04 -4.022
(-0.12)
(-1.94)
(-0.39)
Married 0.62*** 85.20 0.61*** 84.3 0.13 14.2
(5.45)
(5.48)
(1.14)
Education
High sch. 0.76*** 113.10 0.45** 56.61 0.12 13.26
(4.44)
(2.71)
(0.75)
Technical sch. 1.99*** 629.00 1.23** 241.80 -0.23 -20.20
(5.46)
(2.92)
(-0.56)
Matriculation/Univ. 1.40*** 307.10 0.99*** 170.30 0.00 0.474
(7.89)
(5.17)
(0.03)
Income
Below average 0.62** 86.61 0.40* 48.89 -0.22 -19.57
(3.13)
(2.03)
(-1.32)
Average inc 1.41*** 311.10 0.79*** 120.90 0.01 0.90
(6.85)
(3.94)
(0.05)
above av. Inc 1.86*** 544.00 1.59*** 390.70 0.13 13.61
(9.54)
(8.41)
(0.81)
High inc. 3.74*** 4103.70 4.17*** 6337.20 0.58** 78.75
(14.63)
(17.44)
(2.77)
Province
Eastern cape -0.14 -12.79 -0.31 -26.91 -0.28 -24.49
(-0.75)
(-1.64)
(-1.46)
Northern Cape -0.37+ -30.81 -0.32 -27.42 -1.55*** -78.84
(-1.80)
(-1.46)
(-6.21)
Free State -0.18 -16.36 -0.31 -26.88 0.10 10.03
(-0.89)
(-1.40)
(0.51)
KwaZulu-Natal -0.07 -6.466 -0.50* -39.34 0.01 0.700
(-0.34)
(-2.44)
(0.03)
North West 0.18 19.41 -0.69** -49.60 -0.82*** -56.01
(0.71)
(-2.71)
(-3.36)

25
Gauteng 0.01 0.54 -0.24 -21.51 -0.12 -11.25
(0.03)
(-1.31)
(-0.63)
Mpumlanaga 0.38 45.48 -0.75** -52.61 -0.11 -10.70
(1.58)
(-2.96)
(-0.52)
Limpopo -0.08 -7.51 -0.86*** -57.83 -0.60* -45.32
(-0.35)
(-3.66)
(-2.53)
Race
Coloured 0.25 28.02 -0.03 -2.81 -0.49** -38.66
(1.51)
(-0.17)
(-2.95)
Asian 0.87*** 137.60 0.67+ 94.65 -1.30*** -72.85
(3.44)
(1.94)
(-4.67)
White 1.07*** 191.40 0.60** 81.67 -1.04*** -64.68
(5.65)
(3.13)
(-4.88)
cut1
Constant 2.36***
2.82***
-0.50
cut2
Constant 3.49***
4.91***
2.51***
cut3
Constant 7.27*** 6.80*** 3.10***
N 3123 3123 3123
Percentage change in second column
z statistics in parentheses
+ p<0.1 * p<0.05 ** p<0.01 *** p<0.001

26
Appendix C1 : Descriptive statistics for Ghana model
Variable Mean Std. Dev. Min Max
General account and services 1.65 0.84 1 4
Investment 1.19 0.60 1 4
Insurance 1.16 0.57 1 4
Gender (Female) 0.55 0.50 0 1
Age 37.16 15.82 15 97
Basic sch. 0.53 0.50 0 1
Secondary Sch. 0.16 0.37 0 1
Post sec sch. 0.03 0.16 0 1
University 0.05 0.21 0 1
HH size 2.89 1.81 1 15
Urban 0.41 0.49 0 1
Supply Side Constraints 0.23 0.60 0 7
Married 0.55 0.50 0 1
Below 600 0.82 0.39 0 1
Betw. 601 and 1200 0.02 0.15 0 1
Betw. 1201 and 1800 0.00 0.06 0 1
Over 1801 0.00 0.05 0 1
Western 0.11 0.32 0 1
Central 0.07 0.26 0 1
Volta 0.08 0.27 0 1
Eastern 0.11 0.31 0 1
Ashanti 0.21 0.41 0 1
Brong Ahafo 0.08 0.26 0 1
Northern 0.10 0.30 0 1
Upper East 0.05 0.21 0 1
Upper West 0.03 0.16 0 1

27
Appendix C2: Descriptive statistics for South Africa models
Variable Mean Std. Dev. Min Max
General account and services 2.03 0.98 1 4
Investment 1.70 0.67 1 4
Insurance 1.78 0.97 1 4
Gender (Female) 0.54 0.50 0 1
Age 35.25 15.56 16 95
HH. Size 3.57 3.14 0 30
Urban 0.63 0.48 0 1
Supply Side Constraints 0.21 0.47 0 3
Married 0.35 0.48 0 1
High sch. 0.42 0.49 0 1
Technical sch. 0.02 0.14 0 1
Matriculation/Univ. 0.40 0.49 0 1
Below average 0.20 0.40 0 1
Average 0.14 0.35 0 1
Above average 0.28 0.45 0 1
High income 0.17 0.37 0 1
Eastern cape 0.14 0.35 0 1
Northern Cape 0.02 0.15 0 1
Free State 0.07 0.25 0 1
KwaZulu-Natal 0.21 0.41 0 1
North West 0.06 0.24 0 1
Gauteng 0.21 0.41 0 1
Mpumlanaga 0.09 0.28 0 1
Limpopo 0.11 0.31 0 1
Coloured 0.09 0.28 0 1
Asian 0.03 0.17 0 1
White 0.09 0.28 0 1

28
Appendix D1: Decomposition of general account and services - South Africa
Coef Percentage Std. Err Z
Explained -0.11 3451.13 0.03 -3.96
Unexplained 0.11 -3351.13 0.06 1.75
Total 0.00 100.00 0.07 -0.05
Note: Bootstrap standard errors; 100 repetitions
Appendix D2: Decomposition of insurance model - South Africa
Coef Percentage Std. Err Z
Explained -0.11 1086.52 0.02 -5.00
Unexplained 0.10 -986.52 0.06 1.68
Total -0.01 100.00 0.07 -0.15
Note: Bootstrap standard errors; 100 repetitions
Appendix D3: Decomposition of investment model - South Africa
Coef Percentage Std. Err Z
Explained -0.01 10.91 0.02 -0.63
Unexplained -0.12 89.09 0.15 -0.78
Total -0.13 1.00 0.15 -0.9.00
Note: Bootstrap standard errors; 100 repetitions
Appendix D4: Decomposition extended general account and services model-South
Africa
Coef Percentage Std. Err Z
Explained -0.12 406.08 0.02 -4.85
Unexplained 0.09 -306.08 0.06 1.42
Total -0.03 100.00 0.07 -0.42
Note: Bootstrap standard errors; 100 repetitions

29
Appendix D5: decomposition extended insurance model-South Africa
Coef Percentage Std. Err Z
Explained -0.12 1322.90 0.03 -4.35
Unexplained 0.11 -1222.90 0.06 1.70
Total -0.01 100.00 -0.12 0.91
Note: Bootstrap standard errors; 100 repetitions
Appendix D6: Decomposition of extended investment model-South Africa
Coef Percentage Std. Err Z
Explained 0.00 8.33 0.02 -0.18
Unexplained -0.05 91.67 0.14 -0.32
Total -0.05 100.00 0.14 -0.35
Note: Bootstrap standard errors; 100 repetitions
Appendix D7: Decomposition of general account and services model-Ghana
Coef Percentage Std. Err Z
Explained -0.06 32.36 0.02 -3.14
Unexplained -0.12 67.64 0.04 -2.87
Total -0.18 100.00 0.04 -4.65
Note: Bootstrap standard errors; 100 repetitions
Appendix D8: Decomposition of insurance model-Ghana
Coef Percentage Std. Err Z
Explained -0.12 23.25 0.03 -4.35
Unexplained 0.11 76.75 0.06 1.70
Total -0.24 100.00 0.09 -2.67
Note: Bootstrap standard errors; 100 repetitions
Appendix D9: Decomposition of investment model-Ghana
Coef Percentage Std. Err Z
Explained -0.06 53.42 0.02 -2.43
Unexplained -0.19 46.58 0.09 -2.09
Total -0.24 100.00 0.09 -2.67
Note: Bootstrap standard errors; 100 repetitions