is aid to agricultural innovation a priority for the ... · a priority for the international...
TRANSCRIPT
Is aId to agrIcultural InnovatIon a prIorIty for the InternatIonal communIty? A comprehensive AnAlysis of 2002 to 2012 oecD DAtA on foreign AssistAnce to reseArch AnD extension in Agriculture, forestry AnD fishing.
occAsionAl pApers on InnovatIon In famIly farmIng
©FA
O/Am
i Vita
le

Cristina Angelico, Christian Grovermann, Karin Nichterlein and Andrea Sonnino
ReseaRch and extension Unit
occAsionAl pApers on InnovatIon In famIly farmIng
Food and agRicUltURe oRganization oF the United nations
Rome, 2015
Is aId to agrIcultural InnovatIon a prIorIty for the InternatIonal communIty? A comprehensive AnAlysis of 2002 to 2012 oecD DAtA on foreign AssistAnce to reseArch AnD extension in Agriculture, forestry AnD fishing.
The designations employed and the presentation of material in this information product do not imply the expression of any opinion whatsoever on the part of the Food and Agriculture Organization of the United Nations (FAO) concerning the legal or development status of any country, territory, city or area or of its authorities, or concerning the delimitation of its frontiers or boundaries. The mention of specific companies or products of manufacturers, whether or not these have been patented, does not imply that these have been endorsed or recommended by FAO in preference to others of a similar nature that are not mentioned.
The views expressed in this information product are those of the author(s) and do not necessarily reflect the views or policies of FAO.
ISBN 978-92-5-108961-3
© FAO, 2015
FAO encourages the use, reproduction and dissemination of material in this information product. Except where otherwise indicated, material may be copied, downloaded and printed for private study, research and teaching purposes, or for use in non-commercial products or services, provided that appropriate acknowledgement of FAO as the source and copyright holder is given and that FAO’s endorsement of users’ views, products or services is not implied in any way.
All requests for translation and adaptation rights, and for resale and other commercial use rights should be made via www.fao.org/contact-us/licence-request or addressed to [email protected].
FAO information products are available on the FAO website (www.fao.org/publications) and can be purchased through [email protected].
iiioccAsionAl pApers on innovAt ion in fAmily fArming
contents
Acknowledgements ....................................................................................................................................................... ivAbbreviations used in the text ....................................................................................................................................... vSummary ........................................................................................................................................................................ vi
CHAPTER 1INtrOduCtION:the ImpOrtANCe OF reSeArCh ANd exteNSION IN AGrICulture, FOreStry ANd FIShING .........................1
CHAPTER 2mAterIAl ANd methOdS ..................................................................................................................................3THE OECD CREDITOR REPORTINg SySTEm ..................................................................................................................... 3DEFINITIONS ..................................................................................................................................................................... 5DATA .................................................................................................................................................................................. 8
CHAPTER 3reSultS .........................................................................................................................................................10OvERvIEw: ODA TO AgRICUlTURE, FORESTRy AND FISHINg By SUBSECTORS ..........................................................10glOBAl TRENDS OF FOREIgN ASSISTANCE ..................................................................................................................11AllOCATION OF ODA TO AgRICUlTURAl, FORESTRy AND FISHERy RESEARCH By INCOmE ClASS OF RECIPIENT COUNTRIES .............................................................................................................. 14AllOCATION OF ODA TO AgRICUlTURAl, FORESTRy AND FISHERy RESEARCH By REgIONS AND COUNTRIES ........................................................................................................................................16ODA COmmITmENTS TO AgRICUlTURAl ExTENSION By INCOmE ClASS AND REgION OF RECIPIENT COUNTRIES .............................................................................................................................................22vOlATIlITy IN ODA TO AgRICUlTURAl, FORESTRy AND FISHERy RESEARCH ............................................................25mAIN DONOR COUNTRIES IN TERmS OF ODA COmmITmENTS TO AgRICUlTURAl, FISHINg AND FORESTRy RESEARCH AND AgRICUlTURAl ExTENSION (2002–2012) ...................................................................27
CHAPTER 4dISCuSSION ANd pOlICy reCOmmeNdAtIONS ...............................................................................................29
References .....................................................................................................................................................................31
ANNex 1: dONOr COuNtrIeS .........................................................................................................................32
ANNex 2: reCIpIeNt COuNtrIeS lISted by reGION ......................................................................................33
ivoccAsionAl pApers on innovAt ion in fAmily fArming
Is aId to agrIcultural InnovatIon a prIorIty for the InternatIonal communIty?
acknowledgements
This publication has been written by Cristina Angelico, Christian grovermann, Karin Nichterlein and Andrea Sonnino. The authors would like to thank Nienke Beintema and gert-Jan Stads of the Agricultural Science and Technology Indicators (ASTI) initiative as well as Sarah lowder of FAO’s Agricultural Development Economics Division and magdalena Blum of FAO’s Research and Extension Unit for reviewing the paper and providing valuable feedback. Final language editing was done by Thorgeir lawrence.
voccAsionAl pApers on innovAt ion in fAmily fArming
abbrevIatIons used In the text
Ar4d Agricultural Research for DevelopmentAStI Agricultural Science and Technology Indicators CrS Creditor Reporting SystemdAC Development Assistance Committee
GFAr global Forum on Agricultural ResearchIdA International Development Association
IFAd International Fund for Agricultural DevelopmentldC least Developed CountriesOdA Official Development Aid
OeCd Organisation For Economic Co-operation and Developmentr&d Research and DevelopmentSdG Sustainable Development goaluSd United States Dollars

vioccAsionAl pApers on innovAt ion in fAmily fArming
Is aId to agrIcultural InnovatIon a prIorIty for the InternatIonal communIty?
summary
For a wide range of developing countries data concerning public and private spending on agricultural research and development is collected and assessed by the Agricultural Science and Technology Indicators (ASTI) initiative. Assessment of foreign assistance to agricultural, forestry and fishery research and to agricultural extension has received less attention. The present study used OECD data to analyse, during the period of 2002 to 2012, the amount and variability of foreign aid directed to agricultural research and extension, as well as to forestry and fishery research.
Overall investments in agricultural research and development have been consistently low, which also applies to foreign assistance. Out of the total Official Development Assistance (ODA) that went to the agriculture, forestry and fishing, on average, seven percent have found to be allocated to research and two percent to extension. From 2002 to 2012, the share of foreign assistance invested into research and extension has decreased or remained steady rather than increased. Furthermore, aid flows are concentrated in high-income as well as in a few large middle-income countries. The top ten contributors to ODA for agricultural, forestry and fishery research are France, the world Bank, UK, Australia, the EU Institutions, USA, Canada, germany, Sweden and the Netherlands, while the top ten contributors to ODA for agricultural extension are the world Bank, IFAD, Canada, Sweden, Norway, UK, germany, USA, Belgium and Australia.
like public and private spending, foreign assistance proved to be volatile, causing challenges for planning and implementation. This corroborates existing evidence of sizable deadweight loss for developing countries due to volatile aid flows. Even if the volatility of ODA commitments is, in relative terms, lower for least developed and other low-income countries than for other regions, it remains high. Also, it has a comparatively more profound impact, since these countries are more reliant on foreign assistance. The international community needs to give more priority to addressing the problems brought about by insufficient and unpredictable investments in research and extension.

1
IntroductIon: the Importance of research and extensIon In agrIculture, forestry and fIshIng
occAsionAl pApers on innovAt ion in fAmily fArming
chapter 1
IntroductIon: the importAnce of reseArch AnD extension in Agriculture, forestry AnD fishing
Empirical evidence shows that agricultural, forestry and fishery research, as well as agricultural extension, are key elements for increasing and improving the production of goods and services from agriculture, forestry and fishing achieving food security and promoting sustainable management of natural resources in developing countries (world Bank, 2007; FAO, 2014). less developed countries cannot merely rely on the transfer of knowledge and technologies from more advanced economies, because innovations are often site-specific. Research and extension activities must be tailored taking into consideration the local environmental and social conditions, available resources and market requirements. Developing countries therefore require capacities to locally develop knowledge and technical expertise that fits the needs of their producers, especially small-scale producers, and other actors along agricultural value chains.
Nevertheless, investments in agricultural research and development at global level can be considered consistently low (Kennedy, 2014) and are concentrated in high-income countries as well as in a few large middle-income countries (Beintema et al., 2012). many low-income countries, especially least-developed countries (lDCs), constantly underinvest in agricultural research and extension, with foreign assistance often being the major source of funding for these activities (Beintema and Stads, 2014).
while the Agricultural Science and Technology Indicators (ASTI) initiative provides data and analysis of domestic public and private spending on agricultural research and development for a wide range of developing countries, the scholarly literature pays little attention, if any, to volume and quality of foreign assistance to agricultural, forestry and fishery research and agricultural extension.
2occAsionAl pApers on innovAt ion in fAmily fArming
Is aId to agrIcultural InnovatIon a prIorIty for the InternatIonal communIty?
The objective of the present study is to fill this gap. we use OECD data to analyse, across countries and regions, the amount and variability of foreign assistance directed to agricultural research and extension, as well as to fishery and forestry research, during the period 2002–2012. The first section of the paper presents the OECD database, the working definitions and the methodology. The second section describes the trends of overall foreign assistance commitments during the period 2002–2012 and of foreign assistance allocation across income classes and regions. This is followed by an analysis of aid volatility. The paper ends with a brief discussion of the results and puts forward some policy considerations.
© F
AO/g
iulio
Nap
olita
no
3
materIal and methods
occAsionAl pApers on innovAt ion in fAmily fArming
chapter 2
materIal and methods
the oecd credItor reportIng system
The present study uses the OECD’s Creditor Reporting System (CRS) to provide information on Official Development Aid (ODA) to agricultural, forestry and fishery research, as well as agricultural extension1. This is a well-known database, which reports data on ODA at project level and represents the most comprehensive source of information on foreign assistance flows to agriculture, fishing and forestry. The CRS was selected because of three characteristics: it provides accurate and comparable information on assistance flows; it includes a large number of donors and receivers; and it allows differentiating assistance by subsectors, regions, recipient countries and donors.
The donor list (see Annex 1) includes all member states of the OECD’s Development Assistance Committee (DAC), 30 multilateral organizations, 8 non-DAC countries, and 1 private donor2. The DAC list of ODA recipients includes all low- and middle-income countries, based on the world Bank definition, and excludes g8 members, EU members, and countries with a definite date for EU accession. Besides DAC recipients, the CRS also includes a few non-DAC recipients. while CRS statistics dating back to the 1970s are available, reliable in-depth analysis can only be carried out from 2000 onwards because of the limited coverage of earlier data and changes in reporting guidelines (Piva and Dodd, 2009). The number of countries for which foreign assistance is recorded has increased over the years. The completeness of CRS data on ODA commitments by DAC members has increased from 70 percent in 1995 to over 90 percent in 2000, and achieved almost 100 percent from 2003 onwards, whereas the coverage for CRS data on disbursements has exceeded 90 percent since 2002 and reached approximately 100 percent from 2007 onwards. This study therefore focuses on commitments rather than disbursements. The quality of CRS data on commitments can be considered good for the period of investigation, with missing data being of very little concern.
1 Data are available at www.oecd.org/dac/stats/idsonline.2 Bill and Melinda Gates Foundation.
4occAsionAl pApers on innovAt ion in fAmily fArming
Is aId to agrIcultural InnovatIon a prIorIty for the InternatIonal communIty?
OECD member states report their bilateral ODA to the CRS. Data are collected through donors’ statements based on their official statistics on commitments. The quality of the reported aid activity data are continuously monitored and verified by the OECD/DAC Secretariat 3 focusing on the completeness of reporting and its conformity with definitions.
Strict statistical reporting requirements and definitions are established in order to obtain detailed and comparable data over time and across countries (Petras, 2009). Destination sectors are selected considering the economic or social area for which the resources are intended. Each activity can be assigned only to one purpose and one recipient country, to avoid double counting.
The CRS states that not all ODA can be assigned to a specific sector or country as each project might benefit several sectors or countries. In the first case, ODA is recorded as non-sector-allocable aid. In the latter, it may be recorded as regional or developing countries, unspecified. The flows that benefit several recipients in one region are classified as regional, e.g. Africa or Africa, South of Sahara, while those that benefit several regions are classified as developing countries unspecified. This classification represents a weakness of the database, as a significant share of reported ODA is classified as such, which creates uncertainty in terms of where the aid really went. In fact, several studies and reports4 point out that OECD/DAC data do not necessarily reflect the correct aid amounts for agricultural research or extension of the reporting donors, since investments in agricultural research for development (AR4D) might be reported under other CRS codes. multi-sectoral projects with several components might be classified under only one sector. Also, donors might report activities as AR4D, which strictly could not be considered as ODA. greater clarity and consensus on definitions and country reporting guidelines for agricultural research and extension could improve the ability of donors to report and facilitate the assessment of how and where resources are being invested. Donors could be allowed to indicate more than one sector or subsector for each project and to specify the amount, or the percentage of the total budget, directed to each of them. The same approach might be applied to identify recipient countries within regional projects.
multilateral aid is excluded and is reported as multilateral contribution by the corresponding agency. Data on multilateral flows are submitted by the agencies concerned on a voluntary
3 See OECD (2013) for a detailed description on data collection methodology.4 Reports and studies include US government report on accountability (http://www.state.gov/documents/organization/189889.pdf),
Overseas Development Institute Brief on aid (http://www.odi.org/sites/odi.org.uk/files/odi-assets/publications-opinion-files/7588.pdf) and a analysis of European assistance to agriculture in sub-Saharan Africa by several universities (https://workspace.imperial.ac.uk/africanagriculturaldevelopment/Public/Preliminary%20Analysis%20of%20European%20Assistance%20to%20Agriculture%20in%20SSA%20FINAL.pdf).
5
materIal and methods
occAsionAl pApers on innovAt ion in fAmily fArming
basis and are included in the database to the extent possible. The CRS excludes private grants. Another limitation is that OECD statistics do not include funds provided by non-OECD governments, such as China and India, and by wealthy middle-Eastern countries. The real magnitude of aid flows might therefore be higher (Piva and Dodd, 2009).
A stakeholder workshop organized in 2012 by the global Forum on Agricultural research (gFAR) on the subject of tracking investments in agricultural research for development (AR4D)5 provided a range of recommendations on improving data collection, management and dissemination: (i) measurement of global ODA flows (inputs) is not sufficient in itself to improve aid effectiveness in food security. It should be complemented by measuring private flows, and combined with assessing specific investment in AR4D, as well as measuring outputs (developmental impact) at a later stage; (ii) decision-makers in bilateral and multilateral agencies need to be better informed concerning the design and functioning of the OECD/DAC tracking system, and its setup and current data disaggregation; (iii) the feasibility of improving data quality and reporting under the OECD/DAC system by including data on agriculture (and specifically AR4D) needs to be further discussed.
defInItIons
The present work relies on the definitions used in the CRS and its classification of regions and sectors in order to be consistent with the standard reporting of the OECD.
ODA is defined as
“Flows of official financing administered with the promotion of the economic development and welfare of developing countries as the main objective, and which are concessional in character with a grant element of at least 25 percent (using a fixed 10 percent rate of discount). By convention, ODA flows comprise contributions of donor government agencies, at all levels, to developing countries (“bilateral ODA”) and to multilateral institutions. ODA receipts comprise disbursements by bilateral donors and multilateral institutions. Lending by export credit agencies—with the pure purpose of export promotion—is excluded”.6
5 Workshop report available at http://www.egfar.org/news/summary-report-stakeholder-workshop-tracking-investments-agricultural- research-development.
6 OECD DAC Glossary of Key Terms and Concepts. http://stats.oecd.org/glossary/detail.asp?ID=6043.
6occAsionAl pApers on innovAt ion in fAmily fArming
Is aId to agrIcultural InnovatIon a prIorIty for the InternatIonal communIty?
grants or loans to countries and territories on the DAC list of ODA recipients and to multilateral agencies are provided by official agencies, including state and local governments, or by their executive agencies (OECD, 2013). In addition to financial flows, technical cooperation is included in aid. grants, loans and credits for military purposes are excluded. Transfer payments to private individuals (e.g. pensions, reparations or insurance payouts) are in general not counted.
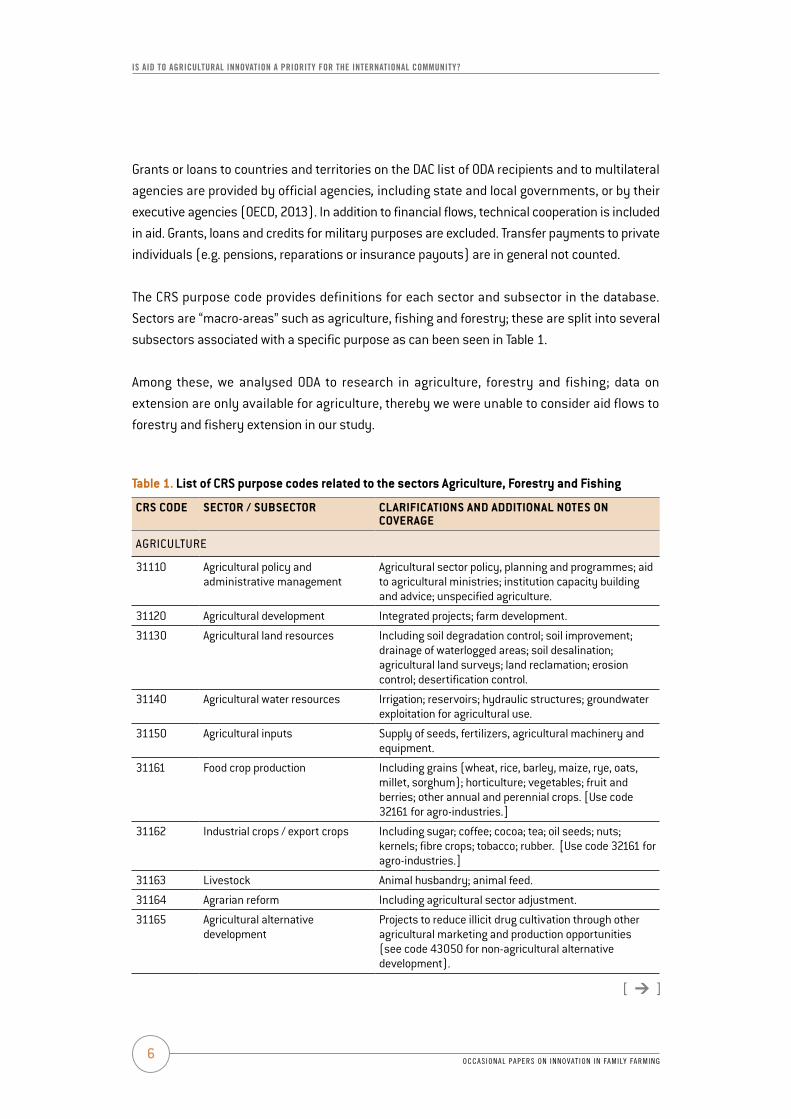
The CRS purpose code provides definitions for each sector and subsector in the database. Sectors are “macro-areas” such as agriculture, fishing and forestry; these are split into several subsectors associated with a specific purpose as can been seen in Table 1.
Among these, we analysed ODA to research in agriculture, forestry and fishing; data on extension are only available for agriculture, thereby we were unable to consider aid flows to forestry and fishery extension in our study.
table 1. list of CrS purpose codes related to the sectors Agriculture, Forestry and Fishing
CrS COde SeCtOr / SubSeCtOr ClArIFICAtIONS ANd AddItIONAl NOteS ON COverAGe
AGRICULTURE
31110 Agricultural policy and administrative management
Agricultural sector policy, planning and programmes; aid to agricultural ministries; institution capacity building and advice; unspecified agriculture.
31120 Agricultural development Integrated projects; farm development.
31130 Agricultural land resources Including soil degradation control; soil improvement; drainage of waterlogged areas; soil desalination; agricultural land surveys; land reclamation; erosion control; desertification control.
31140 Agricultural water resources Irrigation; reservoirs; hydraulic structures; groundwater exploitation for agricultural use.
31150 Agricultural inputs Supply of seeds, fertilizers, agricultural machinery and equipment.
31161 Food crop production Including grains (wheat, rice, barley, maize, rye, oats, millet, sorghum); horticulture; vegetables; fruit and berries; other annual and perennial crops. [Use code 32161 for agro-industries.]
31162 Industrial crops / export crops Including sugar; coffee; cocoa; tea; oil seeds; nuts; kernels; fibre crops; tobacco; rubber. [Use code 32161 for agro-industries.]
31163 livestock Animal husbandry; animal feed.
31164 Agrarian reform Including agricultural sector adjustment.
31165 Agricultural alternative development
Projects to reduce illicit drug cultivation through other agricultural marketing and production opportunities (see code 43050 for non-agricultural alternative development).

7
materIal and methods
occAsionAl pApers on innovAt ion in fAmily fArming
CrS COde SeCtOr / SubSeCtOr ClArIFICAtIONS ANd AddItIONAl NOteS ON COverAGe
31166 Agricultural extension Non-formal training in agriculture.
31181 Agricultural education / training
31182 Agricultural research Plant breeding, physiology, genetic resources, ecology, taxonomy, disease control, agricultural biotechnology; and livestock research (animal health, breeding and genetics, nutrition, physiology).
31191 Agricultural services marketing policies and organization; storage and transportation; creation of strategic reserves.
31192 Plant and post-harvest protection and pest control
Including integrated plant protection, biological plant protection activities, supply and management of agrochemicals, supply of pesticides, plant protection policy and legislation.
31193 Agricultural financial services Financial intermediaries for the agricultural sector, including credit schemes; crop insurance.
31194 Agricultural cooperatives Including farmers’ organizations.
31195 livestock / veterinary services Animal health and management, genetic resources, feed resources.
FORESTRY
31210 Forestry policy and administrative management
Forestry sector policy, planning and programmes; institution capacity building and advice; forest surveys; unspecified forestry and agro-forestry activities.
31220 Forestry development Afforestation for industrial and rural consumption; exploitation and utilization; erosion control; desertification control; integrated forestry projects.
31261 Fuelwood / charcoal Forestry development whose primary purpose is production of fuelwood / charcoal.
31281 Forestry education / training
31282 Forestry research Including artificial regeneration, genetic improvement, production methods, fertilizer, harvesting.
31291 Forestry services
FISHINg
31310 Fishing policy and administrative management
Fishing sector policy, planning and programmes; institution capacity building and advice; ocean and coastal fishing; marine and freshwater fish surveys and prospecting; fishing boats / equipment; unspecified fishing activities.
31320 Fishery development Exploitation and utilization of fisheries; fish stock protection; aquaculture; integrated fishery projects.
31381 Fishery education / training
31382 Fishery research Pilot fish culture; marine / freshwater biological research.
31391 Fishery services Fishing harbours; fish markets; fishery transport and cold storage.

8occAsionAl pApers on innovAt ion in fAmily fArming
Is aId to agrIcultural InnovatIon a prIorIty for the InternatIonal communIty?
data
Currently, the database includes data on ODA to agricultural, forestry and fishery research and agricultural extension for 38 donors and 152 recipients for the period 2002–2012. we are only considering those donor and recipient countries that actually targeted ODA to or received ODA for at least one of the subsectors of interest during the period 2002 to 2012. This means that all the countries of the 2012–2013 DAC list of ODA recipients are included, together with four non-DAC countries and territories.7 Several donors and multilateral agencies are excluded since they did not provide assistance to the three subsectors analysed.8 The choice of the period of analysis, 2002 to 2012, is based on two criteria:
› Data quality for the selected period (country coverage and the completeness of CRS data).
› Higher validity of comparisons within a well-defined time frame (consistent reporting of data and consistent definitions of evolving subsectors).
Our analysis predominantly focuses on ODA to agricultural, forestry and fishery research as well as to agricultural extension at the aggregate level. In this context, forestry and fishery research play a minor role in terms of amounts received. Therefore, in this study, CRS data for these two subsectors was combined with data on agricultural research.9 Data on agricultural extension, in contrast, was analysed separately.
CRS provides information on ODA in terms of both commitment and disbursement. A commitment is a firm written obligation by a government or official agency, backed by the appropriation or availability of the necessary funds, to provide resources of a specified amount under specified financial terms and conditions and for specified purposes. A disbursement, in contrast, is defined as the placement of resources at the disposal of a recipient country or agency (OECD, 2013).
ODA commitments and disbursements to agriculture are highly correlated at aggregate level (lowder and Carisma, 2011). CRS data on agricultural, forestry and fishery research show that the two measures have the same trend, although disbursements are usually smaller in terms of amounts; there are exceptions, however, where disbursements exceed commitments, as shown in Figure 1. Similarly, the two measures of funding are correlated in terms of ODA to agricultural
7 Four non DAC-countries and territories are included in the database: Croatia, States of Ex-Yugoslavia, Mayotte and Trinidad and Tobago. ODA to these countries are included for completeness and consistency with the CRS, although they are almost negligible. For instance, they overall account for about 0.3 percent of total ODA to agricultural, fishery, and forestry research in 2002–2012, and 0.13 percent of total ODA to agricultural extension in the same period. Further, a few countries included in the 2012–2013 DAC list of recipients countries did not receive any aid to the four subsectors; however, we included these countries for consistency with the DAC classification.
8 The donor list is provided in Annex I. 9 The choice of considering the three subsectors, agricultural, forestry and fishery research, is consistent with the proposed SDG
number 2 which include forestry and fishery in addition to agriculture.

9
materIal and methods
occAsionAl pApers on innovAt ion in fAmily fArming
extension, except for 2006, when commitments increased sharply and disbursements remained steady. Differences between the two amounts might depend on several factors. First, multi-year commitments are fully recorded in the year they are signed, while disbursements are recorded when they are transferred from donors to recipients. Second, events might occur that partially prevent or postpone project implementation and the related disbursement.
Figure 1. OdA commitments and disbursements (uSd million at constant 2012 value) to agriculture, forestry and fishery research and agricultural extension, 2002-2012
The paper focuses mainly on commitments since we are interested in understanding donors’ aid policies rather than actual aid delivery. Commitments are good proxies of donors’ intentions; they fluctuate as aid policies change and allow for analysis on how resources are targeted to specific purposes and recipient countries year by year (OECD, 2013). Furthermore, the CRS states that data on commitments are more reliable than those on disbursements. For the period 2002–2012, data are generally complete and reliable both in terms of commitment and disbursement flows, which permits comparison of the two measures, if necessary.
Aid is expressed in United States Dollars (USD) at constant 2012 prices. This allows analysis of trends in assistance flows over an extended period, since data reflect both changes in prices of goods and services in the donor currency, as well as variations in the exchange rate between donor currency and USD over the same period.10
10 Detailed information on DAC deflators are provided http://www.oecd.org/dac/stats/informationnoteonthedacdeflators.htm.
800
600
400
200
0
2002 2004 2006 2008 2010 2012
oda
flow
s (U
sd m
illio
n, c
onst
ant 2
012
pric
es)
YeaR
ReseaRch
extension
Commitment
Disbursement

10occAsionAl pApers on innovAt ion in fAmily fArming
Is aId to agrIcultural InnovatIon a prIorIty for the InternatIonal communIty?
chapter 3
results
overvIew: oda to agrIculture, forestry and fIshIng by subsectors
As shown in Figure 2, the subsectors that received most of the resources during the period from 2002 to 2012 were: (i) agricultural development (code 31120); (ii) agricultural policy and administration management (code 31110); (iii) forestry policy and administration management (code 31210); (iv) agricultural water resources (code 31140); and (iv) agricultural research (code 31182).11 These subsectors accounted for more than 50 percent of total ODA to agriculture, forestry and fishing during 2002 to 2004, and for more than 70 percent during 2011 to 2012. Other subsectors, including extension (ca. 2 percent during 2011 to 2012), attract the remaining ODA.
while the five subsectors listed above maintained their position as main ODA channels, it can be said that the share of agricultural, forestry and fishery ODA aimed at individual subsectors varied considerably over the years.12 Over the whole period, flows to agricultural, forestry and fishery research represented on average 7.2 percent of the total ODA allotted to the three sectors. Of these flows, 94 percent was directed to agricultural research and 3 percent each to forestry and fishery research. This difference is mainly due to the fact that foreign assistance to agriculture as a whole is also much bigger than foreign assistance directed to the other two sectors. Furthermore, within the agricultural sector, a comparatively larger share of total external funding is dedicated to research activities (see Table 2). generally however, ODA to research represents only a small share of total development assistance to agriculture, forestry and fishing, with the percentage of agricultural extension being even smaller.
11 The 2012 CRS purpose code lists and defines all the subsectors involved in agriculture, forestry and fishing. It is available at http://www.oecd.org/dac/stats/purposecodessectorclassification.htm#bottom.
12 Similar results are observed in terms of disbursements.

11
results
occAsionAl pApers on innovAt ion in fAmily fArming
global trends In foreIgn assIstance
Using constant 2012 prices, ODA allocated annually to agriculture, forestry and fishing increased almost constantly from USD 5 billion in 2002 to USD 11.5 billion in 2012, equivalent to an increase of 228 percent. The overall commitments to research in agriculture, forestry and fishing increased markedly between 2005 and 2008, when they reached USD 839 million, but then dropped dramatically to USD 523.9 million in 2009. After this year, a slight increase was recorded in 2010, but a cut was experienced in 2012, when ODA to agricultural, forestry and fishery research amounted to USD 486.7 million. It is interesting to note that the reduction of commitments in 2009 followed a decline in disbursements after 2007 (see Figure 1). This trend is mainly driven by external assistance to agricultural research, which, as mentioned before, is much bigger than the other subsectors. Foreign funding to agricultural research, indeed, increased from USD 296.4 million in 2002 to USD 811 million in 2008, declined to USD 495 million in the following year, and then rose again to USD 635 million in 2011. Finally, it decreased once more to USD 467.9 million in 2012, as the data in Table 2 demonstrate.
Figure 2. OdA commitments to agriculture, forestry and fishing by main subsectors
other
agricultural development
agricultural policy and admin
Forestry policy and admin
agricultural water resources
agricultural research
agricultural extension
400 5 10 15 20 25 30 35
oda commitments (%)
Average 2011 − 2012
Average 2008 − 2010
Average 2005 − 2007
Average 2002 − 2004

12occAsionAl pApers on innovAt ion in fAmily fArming
Is aId to agrIcultural InnovatIon a prIorIty for the InternatIonal communIty?
Foreign assistance to forestry and fishery research shows frequent and wide fluctuations over the years. ODA to fishery research ranged between USD 5 million in 2006 and USD 48 million in 2011, after which it dropped to USD 8 million in 2012. ODA to forestry research reached its peak of USD 33 million in 2007, and then dropped to USD 8 million in 2009, increasing again to USD 30 million in 2011. As in the case of fishery and agricultural research, ODA to forestry research was sharply reduced in 2012, when it amounted to USD 11 million.
table 2. relevant sector/subsector OdA commitments (in uSd million at constant 2012 value)
yeAr OdA tO AF&F OdA tO AF&F reSeArCh ANd AGrI.
exteNSION
OdA tO AGrI.
exteNSION
OdA tO AF&F reSeArCh
OdA tO AGrI.
reSeArCh
OdA tO FIShery
reSeArCh
OdA tO FOreStry reSeArCh
1 2 3 (= 4+5) 4 5 (= 6+7+8) 6 7 8
2002 5 042.1 378.2 52.6 325.6 296.4 18.8 10.4
2003 5 012.2 475.2 78.2 397.0 355.8 28.8 12.5
2004 5 048.2 510.8 134.9 375.8 354.5 7.2 14.0
2005 5 677.8 451.5 80.09 371.4 351.0 8.2 12.2
2006 5 680.9 977.3 471.6 505.7 484.5 5.2 16.0
2007 7 577.5 943.0 117.9 825.2 768.7 23.5 33.0
2008 8 230.4 933.1 93.9 839.3 811.0 13.2 15.1
2009 9 331.7 607.9 84.0 523.9 494.9 20.6 8.3
2010 9 922.5 782.6 119.3 663.3 625.0 19.7 18.6
2011 10 344.8 935.5 222.7 712.8 635.3 47.5 29.9
2012 11 473.3 633.2 146.4 486.8 467.9 7.8 11.1
Average 7 576.5 693.4 145.6 547.9 513.2 18.2 16.5
Note: AF&F = agriculture, forestry and fishing.
ODA allocated to agricultural extension also varied substantially from year to year. It reached a climax in 2006 (USD 472 million), but fell to USD 118 million the next year. In 2011 it increased to USD 223 million, and then fell again to USD 146 million in 2012 (Table 2).
The percentage of ODA to agricultural, forestry and fishing committed to research and extension varied considerably over the years, ranging from 17 percent in 2006 to 6 percent in 2012, which is illustrated by Figure 3. Even if there is an upward trend for total funding flows to

13
results
occAsionAl pApers on innovAt ion in fAmily fArming
agricultural, forestry and fishing in absolute terms, the share aimed at research has actually been decreasing over the last decade. This result suggests that research activities have become less attractive for donors over time.
Overall, aid flows to agricultural extension are significantly smaller than those aimed at agricultural research; the share of agricultural ODA directed to extension has tended to remain stable over time, with a peak in 2006. In contrast to research and extension, flows to other subsectors tended to increase during the period 2002–2012, including agricultural development, and agricultural as well as forestry policy and administration management. whereas agricultural research appears to become less important in terms of ODA flows within agriculture, forestry and fishing, the following subsectors have gained ground: agricultural land resources, agricultural financial services, and food crop production.
Figure 3. Share of total agriculture, forestry and fishery OdA allocated to research and extension, 2002-2012
12
10
8
6
4
2
0
Perc
enta
ge (
%) o
f tot
al o
da a
lloca
ted
to a
gric
ultu
re, f
ores
try
& f
ishi
ng
YeaR
ReseaRch
2002 2004 2006 2008 2010 2012
extension
14occAsionAl pApers on innovAt ion in fAmily fArming
Is aId to agrIcultural InnovatIon a prIorIty for the InternatIonal communIty?
allocatIon of oda to agrIcultural, forestry and fIshery research by Income class of recIpIent countrIes
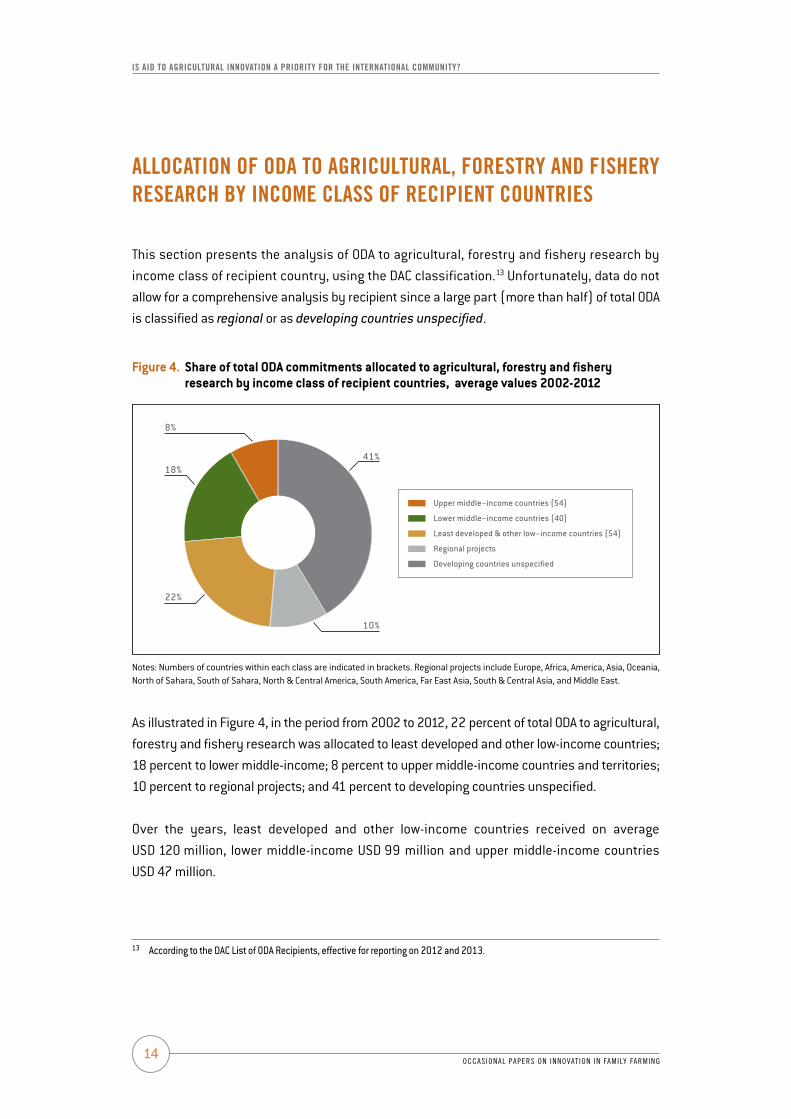
This section presents the analysis of ODA to agricultural, forestry and fishery research by income class of recipient country, using the DAC classification.13 Unfortunately, data do not allow for a comprehensive analysis by recipient since a large part (more than half) of total ODA is classified as regional or as developing countries unspecified.
Figure 4. Share of total OdA commitments allocated to agricultural, forestry and fishery research by income class of recipient countries, average values 2002-2012
Notes: Numbers of countries within each class are indicated in brackets. Regional projects include Europe, Africa, America, Asia, Oceania, North of Sahara, South of Sahara, North & Central America, South America, Far East Asia, South & Central Asia, and middle East.
As illustrated in Figure 4, in the period from 2002 to 2012, 22 percent of total ODA to agricultural, forestry and fishery research was allocated to least developed and other low-income countries; 18 percent to lower middle-income; 8 percent to upper middle-income countries and territories; 10 percent to regional projects; and 41 percent to developing countries unspecified.
Over the years, least developed and other low-income countries received on average USD 120 million, lower middle-income USD 99 million and upper middle-income countries USD 47 million.
13 According to the DAC List of ODA Recipients, effective for reporting on 2012 and 2013.
Upper middle−income countries (54)
Lower middle−income countries (40)
Least developed & other low−income countries (54)
Regional projects
Developing countries unspecified
41%
10%
22%
18%
8%

15
results
occAsionAl pApers on innovAt ion in fAmily fArming
Figure 5 shows how allocation of ODA to agricultural, forestry and fishery research varied across income classes during the last eleven years. In 2002 least developed and other low-income countries received 11 percent of the total amount (USD 36 million); lower middle-income countries received 26 percent (USD 86 million); and upper middle-income countries and territories 10 percent (USD 31 million); the remainder was split between developing countries unspecified (49 percent) and regional projects. In the following years, the distribution of ODA to agricultural, forestry and fishery research among income classes of recipient countries varied constantly, without an apparently consistent trend. In 2012, the ODA share directed to least developed and other low-income countries accounted for 17 percent (USD 81 million), while lower and upper middle-income countries received 16 percent (USD 78 million) and 6 percent (USD 28 million) respectively. The commitments classified as developing countries unspecified increased from 40 percent in 2011 to 54 percent in 2012. The high share of this category creates significant uncertainty for more detailed analysis of aid allocation.
Figure 5. OdA commitments allocated to agricultural, forestry and fishery research by income class of the recipient country, 2002-2012
900
800
700
600
500
400
300
200
100
02002 2003 2004 2005 2006 2007 2008 2009 2010 2011 2012
oda
com
mit
men
ts (
Usd
mill
ion,
con
stan
t 201
2 pr
ices
)
Upper middle−income countries (54)
Lower middle−income countries (40)
Least developed & other low−income countries (54)
Regional projects Developing countries unspecified
Notes: Numbers of countries within each class indicated in brackets. Regional projects include Europe, Africa, America, Asia, Oceania, North of Sahara, South of Sahara, North & Central America, South America, Far East Asia, South & Central Asia, and middle East.
16occAsionAl pApers on innovAt ion in fAmily fArming
Is aId to agrIcultural InnovatIon a prIorIty for the InternatIonal communIty?
allocatIon of oda to agrIcultural, forestry and fIshery research by regIons and countrIes
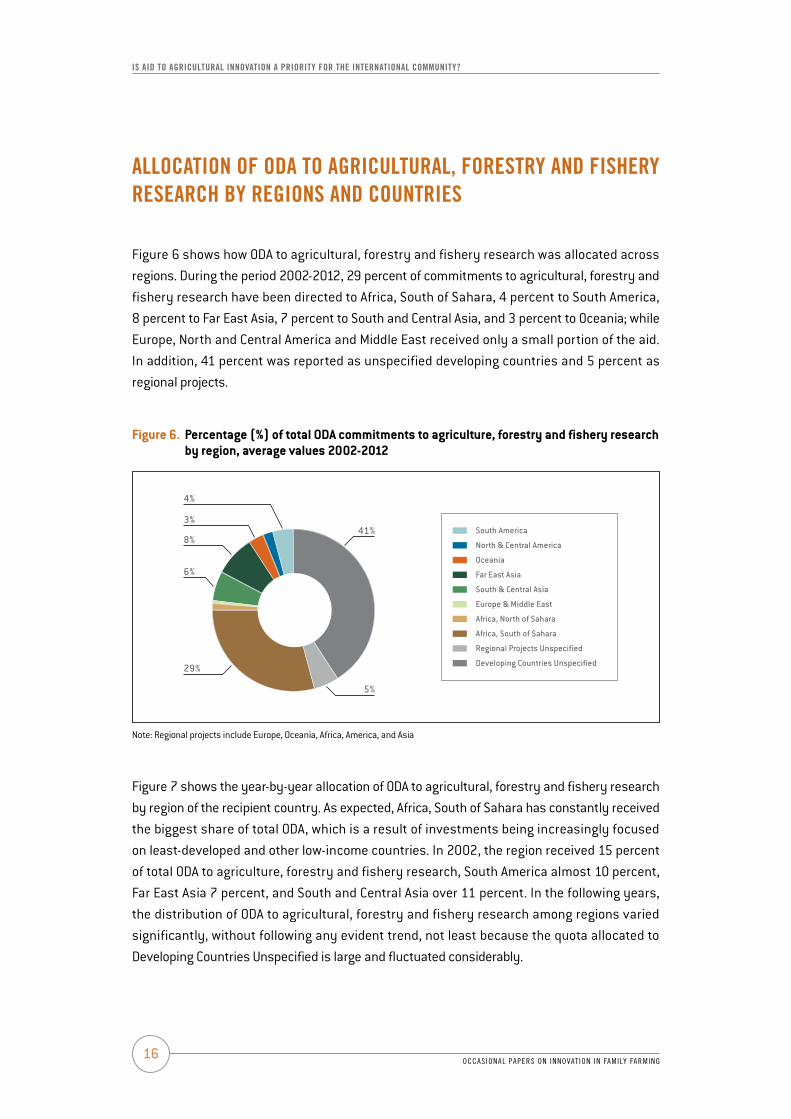
Figure 6 shows how ODA to agricultural, forestry and fishery research was allocated across regions. During the period 2002-2012, 29 percent of commitments to agricultural, forestry and fishery research have been directed to Africa, South of Sahara, 4 percent to South America, 8 percent to Far East Asia, 7 percent to South and Central Asia, and 3 percent to Oceania; while Europe, North and Central America and middle East received only a small portion of the aid. In addition, 41 percent was reported as unspecified developing countries and 5 percent as regional projects.
Figure 6. percentage (%) of total OdA commitments to agriculture, forestry and fishery research by region, average values 2002-2012
Note: Regional projects include Europe, Oceania, Africa, America, and Asia
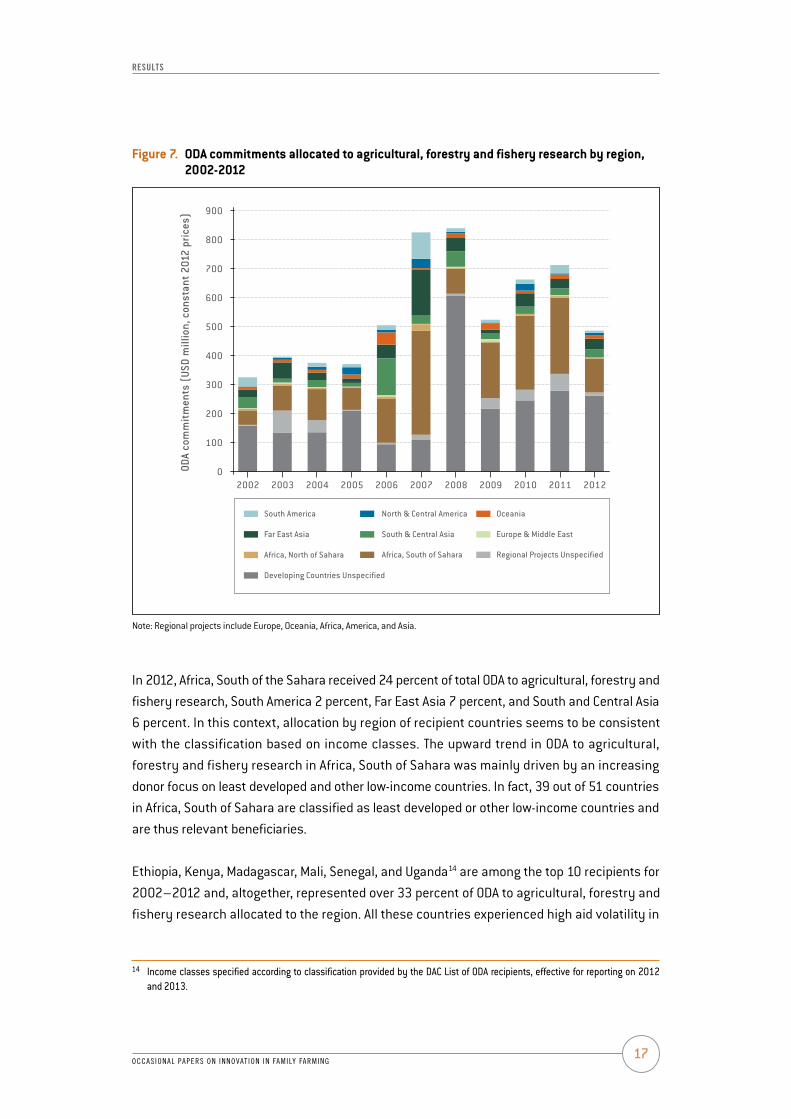
Figure 7 shows the year-by-year allocation of ODA to agricultural, forestry and fishery research by region of the recipient country. As expected, Africa, South of Sahara has constantly received the biggest share of total ODA, which is a result of investments being increasingly focused on least-developed and other low-income countries. In 2002, the region received 15 percent of total ODA to agriculture, forestry and fishery research, South America almost 10 percent, Far East Asia 7 percent, and South and Central Asia over 11 percent. In the following years, the distribution of ODA to agricultural, forestry and fishery research among regions varied significantly, without following any evident trend, not least because the quota allocated to Developing Countries Unspecified is large and fluctuated considerably.
4%
3%
8%
6%
29%
5%
South America
Europe & Middle East
Africa, North of Sahara
Developing Countries Unspecified
Regional Projects Unspecified
North & Central America
Africa, South of Sahara
Oceania
Far East Asia
South & Central Asia
41%
17
results
occAsionAl pApers on innovAt ion in fAmily fArming
In 2012, Africa, South of the Sahara received 24 percent of total ODA to agricultural, forestry and fishery research, South America 2 percent, Far East Asia 7 percent, and South and Central Asia 6 percent. In this context, allocation by region of recipient countries seems to be consistent with the classification based on income classes. The upward trend in ODA to agricultural, forestry and fishery research in Africa, South of Sahara was mainly driven by an increasing donor focus on least developed and other low-income countries. In fact, 39 out of 51 countries in Africa, South of Sahara are classified as least developed or other low-income countries and are thus relevant beneficiaries.
Ethiopia, Kenya, madagascar, mali, Senegal, and Uganda14 are among the top 10 recipients for 2002–2012 and, altogether, represented over 33 percent of ODA to agricultural, forestry and fishery research allocated to the region. All these countries experienced high aid volatility in
14 Income classes specified according to classification provided by the DAC List of ODA recipients, effective for reporting on 2012 and 2013.
Figure 7. OdA commitments allocated to agricultural, forestry and fishery research by region, 2002-2012
Note: Regional projects include Europe, Oceania, Africa, America, and Asia.
900
800
700
600
500
400
300
200
100
02002 2003 2004 2005 2006 2007 2008 2009 2010 2011 2012
oda
com
mit
men
ts (
Usd
mill
ion,
con
stan
t 201
2 pr
ices
)
South America
Europe & Middle East
Africa, North of Sahara
Developing Countries Unspecified
Regional Projects Unspecified
North & Central America
Africa, South of Sahara
Oceania
Far East Asia South & Central Asia

18occAsionAl pApers on innovAt ion in fAmily fArming
Is aId to agrIcultural InnovatIon a prIorIty for the InternatIonal communIty?
terms of amounts received across years. South American countries are mainly classified as lower or upper middle-income economies. Among the 13 countries included in this area, Bolivia and Brazil are the major beneficiaries of ODA to agricultural, forestry and fishery research. Brazil is classified as an upper middle-income country and for the region received more than 45 percent of the total ODA commitments studied here, whereas Bolivia is a lower middle-income country and totaled 26 percent of ODA commitments to agricultural, forestry and fishery research in South America in 2002–2012.
Far East Asia includes several main recipients, such as China, Indonesia, laos, Thailand and viet Nam. viet Nam was the beneficiary of 32 percent of ODA to agricultural, forestry and fishery research allocated to this region during the period analysed, while China absorbed 16 percent of these resources.
During the period 2002–2012, India received more than USD 200 million, equal to over 54 percent of total ODA to agricultural, forestry and fishery research allocated to South and Central Asia. Flows to Bangladesh have always been modest, except for 2008, when it received USD 44.6 million.
Oceania accounted for 3 percent of ODA to agricultural, forestry or fishery research; Papua New guinea received 66 percent of external resources to this region from 2002 to 2012. For instance, in 2006, it was given more than USD 41 million, while total assistance directed to Oceania was USD 42.9 million USD.
Northern African countries received no more than 1 percent of total ODA to agricultural, forestry and fishery research during the period 2002–2012. This result is not surprising as only 5 countries are included in this category and most of them are lower or upper middle-income countries. Among these, morocco is the major recipient; it received over 50 percent of the ODA to agricultural, forestry and fishery research in the region.
From 2002 to 2012, North and Central American countries attracted 2 percent of total ODA to agricultural, forestry and fishery research; Costa Rica and Nicaragua received the biggest share, followed by Honduras and mexico.
Finally, European countries do not receive significant assistance to agricultural, forestry or fishery research, since only few countries are included in the DAC list of ODA recipients and most of these are upper middle-income countries. Similarly, middle East does not benefit from development assistance to research in the three subsectors.
19
results
occAsionAl pApers on innovAt ion in fAmily fArming
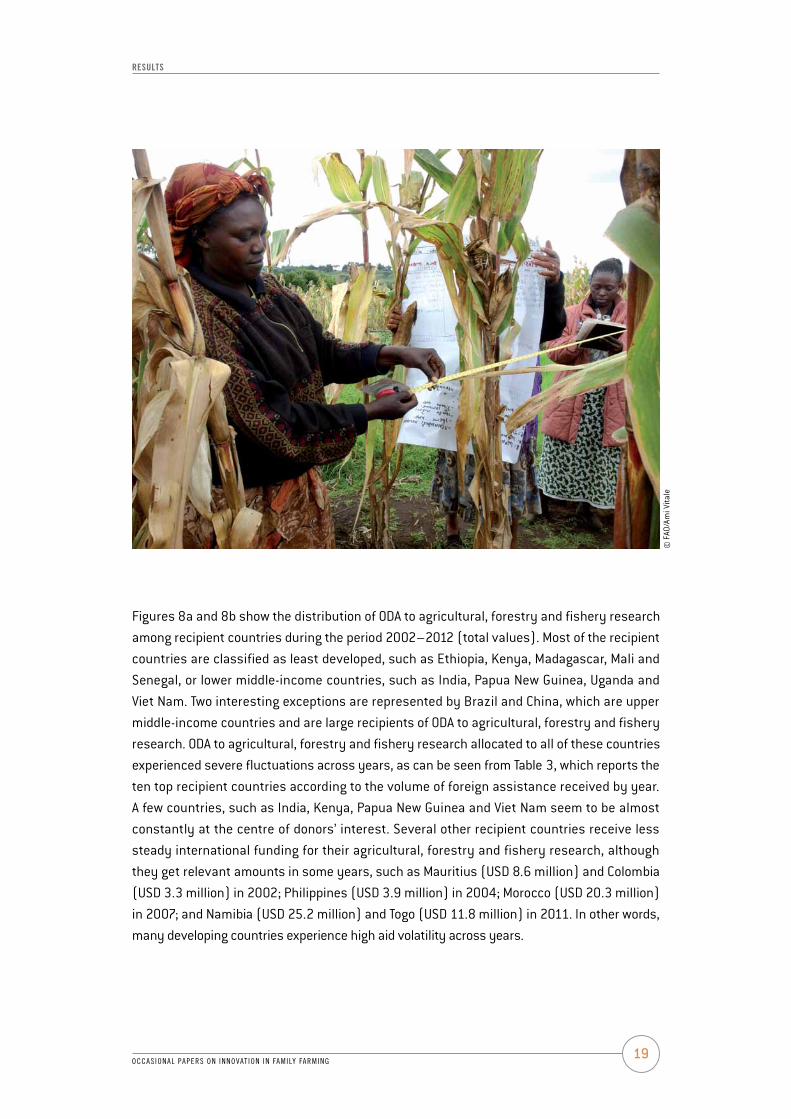
Figures 8a and 8b show the distribution of ODA to agricultural, forestry and fishery research among recipient countries during the period 2002–2012 (total values). most of the recipient countries are classified as least developed, such as Ethiopia, Kenya, madagascar, mali and Senegal, or lower middle-income countries, such as India, Papua New guinea, Uganda and viet Nam. Two interesting exceptions are represented by Brazil and China, which are upper middle-income countries and are large recipients of ODA to agricultural, forestry and fishery research. ODA to agricultural, forestry and fishery research allocated to all of these countries experienced severe fluctuations across years, as can be seen from Table 3, which reports the ten top recipient countries according to the volume of foreign assistance received by year. A few countries, such as India, Kenya, Papua New guinea and viet Nam seem to be almost constantly at the centre of donors’ interest. Several other recipient countries receive less steady international funding for their agricultural, forestry and fishery research, although they get relevant amounts in some years, such as mauritius (USD 8.6 million) and Colombia (USD 3.3 million) in 2002; Philippines (USD 3.9 million) in 2004; morocco (USD 20.3 million) in 2007; and Namibia (USD 25.2 million) and Togo (USD 11.8 million) in 2011. In other words, many developing countries experience high aid volatility across years.
© F
AO/A
mi V
itale
© F
AO/A
mi v
itale

20occAsionAl pApers on innovAt ion in fAmily fArming
Is aId to agrIcultural InnovatIon a prIorIty for the InternatIonal communIty?
Figure 8. OdA commitments to agricultural, forestry and fishery research by main recipient countries, 2002-2012
b) share of oda commitments
50
40
30
20
10
0
INDI
AVI
ETN
AMSE
NEG
ALKE
NYA
PAPU
A N
EW G
UIN
EABR
AzIL
UGAN
DAET
hIO
PIA
MAL
IM
ADAG
ASCA
RCh
INA
INDO
NES
IABU
RKIN
A FA
SOLA
OSGh
ANA
CAM
EROO
NBA
NGL
ADES
hBO
LIVI
AN
IGER
IAN
IGER
ThAI
LAN
DBE
NIN
MOz
AMBI
qUE
TAN
zAN
IACO
TE D
’IVOI
RESO
UTh
AFR
ICA
MOR
OCCO
PAKI
STAN
RWAN
DACE
NTR
AL A
FRIC
AN R
EP.
NAM
IBIA
COST
A RI
CAM
ALAW
IN
ICAR
AGUA
CON
GO,
DEM
. REP
.SI
ERRA
LEO
NE
PhIL
IPPI
NES
zIM
BABW
ECh
ADGA
BON
COLO
MBI
AM
ExIC
Oh
ONDU
RAS
CAM
BODI
APE
RUEC
UADO
RTO
GO
Perc
enta
ge (%
) of t
otal
oda
allo
cate
d to
ag
ricul
ture
, for
estr
y &
fish
ing
Upper middle−income countries Lower middle−income countries Least developed & other low−income countries
a) Value of oda commitments
oda
com
mitm
ents
(Usd
mill
ion,
con
stan
t 201
2 pr
ices
)
INDI
AVI
ETN
AMSE
NEG
ALKE
NYA
PAPU
A N
EW G
UIN
EABR
AzIL
UGAN
DAET
hIO
PIA
MAL
IM
ADAG
ASCA
RCh
INA
INDO
NES
IABU
RKIN
A FA
SOLA
OSGh
ANA
CAM
EROO
NBA
NGL
ADES
hBO
LIVI
AN
IGER
IAN
IGER
ThAI
LAN
DBE
NIN
MOz
AMBI
qUE
TAN
zAN
IACO
TE D
’IVOI
RESO
UTh
AFR
ICA
MOR
OCCO
PAKI
STAN
RWAN
DACE
NTR
AL A
FRIC
AN R
EP.
NAM
IBIA
COST
A RI
CAM
ALAW
IN
ICAR
AGUA
CON
GO,
DEM
. REP
.SI
ERRA
LEO
NE
PhIL
IPPI
NES
zIM
BABW
ECh
ADGA
BON
COLO
MBI
AM
ExIC
Oh
ONDU
RAS
CAM
BODI
APE
RUEC
UADO
RTO
GO
200
150
100
50
0

21
results
occAsionAl pApers on innovAt ion in fAmily fArming
rAN
K20
0220
0320
0420
0520
0620
0720
0820
0920
1020
1120
12
1In
dia
Chin
aKe
nya
Cong
o, D
RSe
nega
lBr
azil
Bang
lade
shKe
nya
Ugan
daNi
ger
Indi
a
29.0
43.7
25.0
11.6
32.9
71.6
44.6
50.1
59.7
29.9
20.8
2Bo
livia
Chad
Indi
aCe
nt. A
fr. R
ep.
Ethi
opia
viet
Nam
viet
Nam
Ethi
opia
Nige
riaNa
mib
iagh
ana
24.3
8.5
11.7
10.9
26.2
59.9
21.0
30.1
40.2
25.2
19.8
3m
aurit
ius
PNg
Chad
Nica
ragu
aBu
rkin
a Fa
som
adag
asca
rm
ozam
biqu
eTa
nzan
iaCo
te d
’Ivoi
reBo
livia
Sene
gal
8.6
7.69.
910
.719
.753
.713
.525
.527
.119
.615
.5
4PN
gBa
ngla
desh
Ugan
daHo
ndur
asla
osm
ali
mal
iIn
dia
viet
Nam
ghan
avi
et N
am
8.3
7.08.
99.
116
.641
.38.
112
.426
.418
.79.
7
5vi
et N
amNi
geria
Sene
gal
mal
awi
Keny
aSe
nega
lBr
azil
Ugan
dam
ali
Rwan
daEt
hiop
ia
8.0
6.8
7.89.
112
.338
.57.1
8.7
22.1
18.5
9.2
6Ch
ina
viet
Nam
viet
Nam
Sene
gal
Thai
land
Cam
eroo
nCh
ina
moz
ambi
que
Burk
ina
Faso
Beni
nNi
ger
7.65.
27.8
6.8
11.7
36.1
6.7
7.214
.917
.66.
6
7Ni
ger
yem
enBe
nin
mau
ritan
iaNi
geria
laos
laos
Sene
gal
Paki
stan
moz
ambi
que
Cam
eron
5.8
3.2
6.3
5.5
9.9
33.1
6.4
6.5
13.3
15.2
6.3
8Be
nin
Tanz
ania
Cam
eroo
nSi
erra
leo
neCo
te d
’Ivoi
reIn
done
sia
mad
agas
car
mad
agas
car
Nica
ragu
aTo
goIn
done
sia
5.7
3.0
5.1
4.3
9.6
33.1
5.2
5.1
8.2
11.8
5.3
9In
done
sia
Nepa
lTh
aila
ndTh
aila
ndvi
et N
amgh
ana
ghan
aIra
qEt
hiop
iaSi
erra
leo
nela
os
3.6
2.9
4.5
3.7
9.5
22.9
4.6
4.6
7.711
.74.
8
10Co
lom
bia
Rwan
daPh
ilipp
ines
viet
Nam
Boliv
iam
oroc
coIn
dia
Braz
ilKe
nya
Burk
ina
Faso
Chin
a
3.3
2.8
3.9
3.5
8.9
20.3
4.4
4.6
5.4
10.8
4.6
Note
s: P
Ng =
Pap
ua N
ew g
uine
a;
table 3. main recipient countries in terms of OdA commitments (in uSd million at constant 2012 values) to agricultural, forestry and fishery research, 2002–2012, by year
22occAsionAl pApers on innovAt ion in fAmily fArming
Is aId to agrIcultural InnovatIon a prIorIty for the InternatIonal communIty?
oda commItments to agrIcultural extensIon by Income class and regIon of recIpIent countrIes
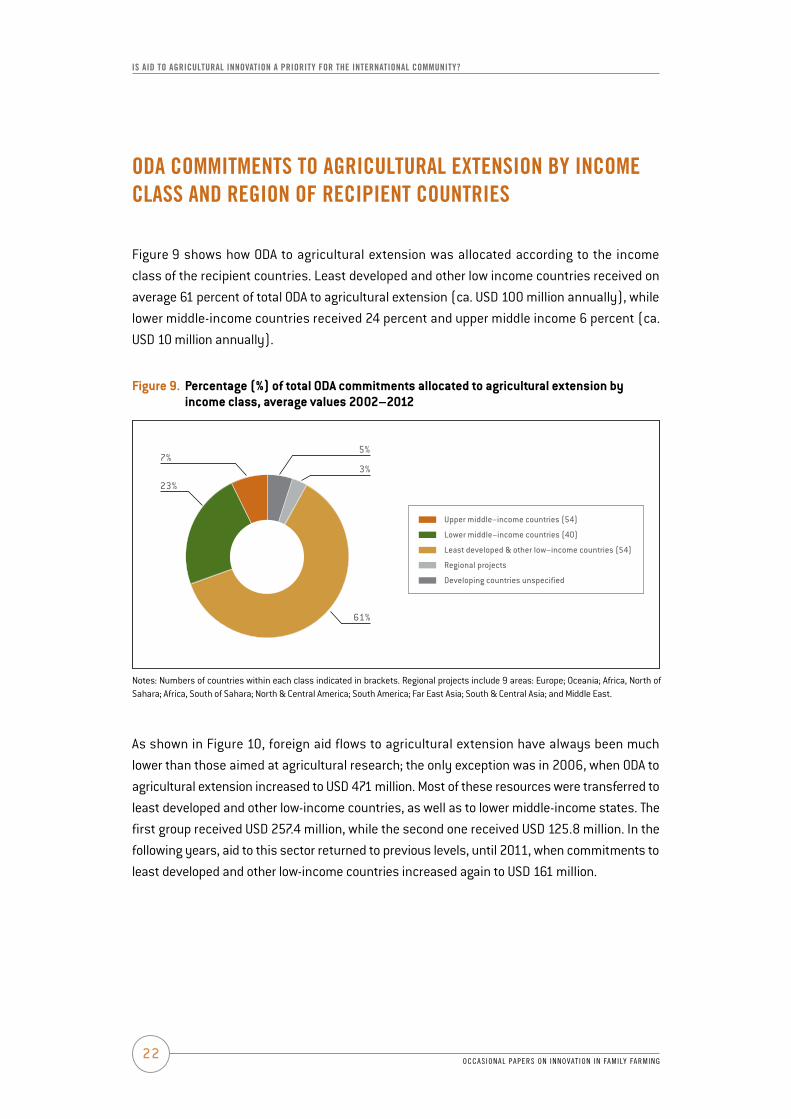
Figure 9 shows how ODA to agricultural extension was allocated according to the income class of the recipient countries. least developed and other low income countries received on average 61 percent of total ODA to agricultural extension (ca. USD 100 million annually), while lower middle-income countries received 24 percent and upper middle income 6 percent (ca. USD 10 million annually).
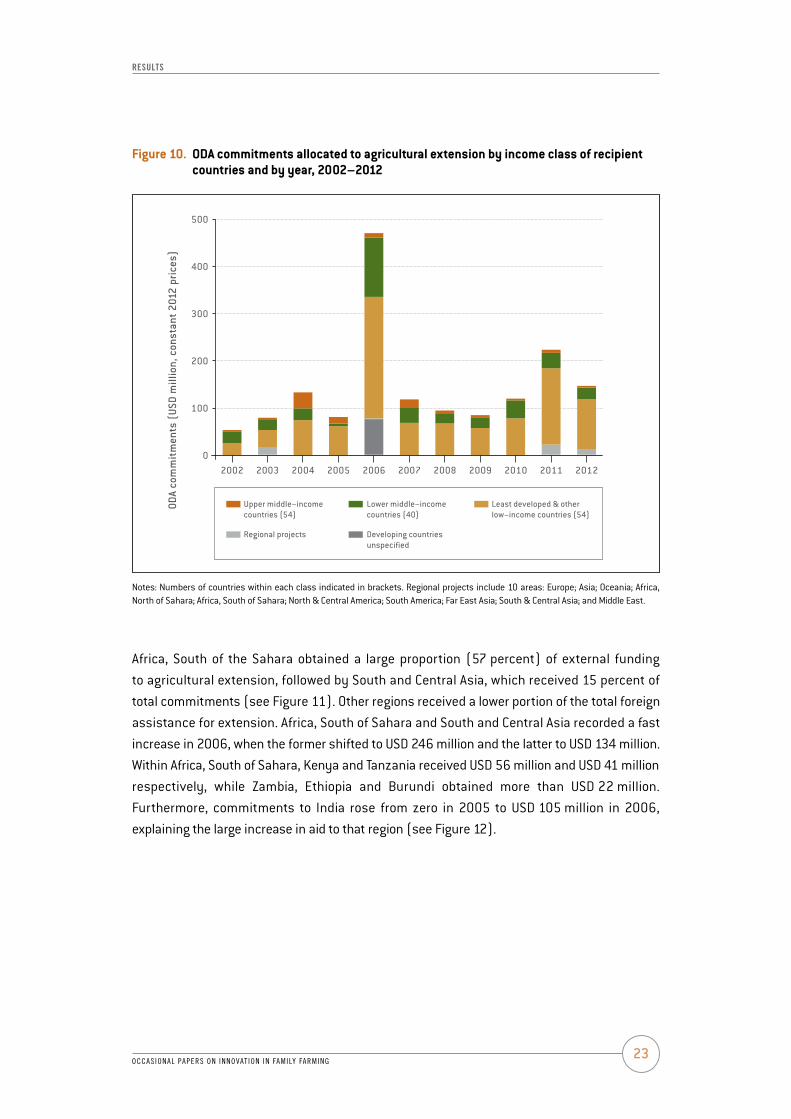
As shown in Figure 10, foreign aid flows to agricultural extension have always been much lower than those aimed at agricultural research; the only exception was in 2006, when ODA to agricultural extension increased to USD 471 million. most of these resources were transferred to least developed and other low-income countries, as well as to lower middle-income states. The first group received USD 257.4 million, while the second one received USD 125.8 million. In the following years, aid to this sector returned to previous levels, until 2011, when commitments to least developed and other low-income countries increased again to USD 161 million.
Figure 9. percentage (%) of total OdA commitments allocated to agricultural extension by income class, average values 2002–2012
Notes: Numbers of countries within each class indicated in brackets. Regional projects include 9 areas: Europe; Oceania; Africa, North of Sahara; Africa, South of Sahara; North & Central America; South America; Far East Asia; South & Central Asia; and middle East.
3%
5%7%
23%
61%
Upper middle−income countries (54)
Lower middle−income countries (40)
Least developed & other low−income countries (54)
Regional projects
Developing countries unspecified
23
results
occAsionAl pApers on innovAt ion in fAmily fArming
Figure 10. OdA commitments allocated to agricultural extension by income class of recipient countries and by year, 2002–2012
Notes: Numbers of countries within each class indicated in brackets. Regional projects include 10 areas: Europe; Asia; Oceania; Africa, North of Sahara; Africa, South of Sahara; North & Central America; South America; Far East Asia; South & Central Asia; and middle East.
Africa, South of the Sahara obtained a large proportion (57 percent) of external funding to agricultural extension, followed by South and Central Asia, which received 15 percent of total commitments (see Figure 11). Other regions received a lower portion of the total foreign assistance for extension. Africa, South of Sahara and South and Central Asia recorded a fast increase in 2006, when the former shifted to USD 246 million and the latter to USD 134 million. within Africa, South of Sahara, Kenya and Tanzania received USD 56 million and USD 41 million respectively, while Zambia, Ethiopia and Burundi obtained more than USD 22 million. Furthermore, commitments to India rose from zero in 2005 to USD 105 million in 2006, explaining the large increase in aid to that region (see Figure 12).
500
400
300
200
100
02002 2003 2004 2005 2006 2007 2008 2009 2010 2011 2012
oda
com
mit
men
ts (
Usd
mill
ion,
con
stan
t 201
2 pr
ices
)
Upper middle−income countries (54)
Lower middle−income countries (40)
Least developed & other low−income countries (54)
Regional projects Developing countries unspecified

24occAsionAl pApers on innovAt ion in fAmily fArming
Is aId to agrIcultural InnovatIon a prIorIty for the InternatIonal communIty?
Figure 11. percentage (%) of total OdA commitments allocated to agricultural extension by region, average values 2002–2012
Figure 12. OdA commitments allocated to agricultural extension by region and by year, 2002–2012
Note: Regional projects include Europe, Oceania, Africa, the Americas, and Asia.
South America
Europe & Middle East
Africa, North of Sahara
Developing Countries Unspecified
Regional Projects Unspecified
North & Central America
Africa, South of Sahara
Oceania
Far East Asia
South & Central Asia
9%
15%
2%
7%
3%5%
57%
500
400
300
200
100
02002 2003 2004 2005 2006 2007 2008 2009 2010 2011 2012od
a co
mm
itm
ents
(Us
d m
illio
n, c
onst
ant 2
012
pric
es)
South America
Europe & Middle East
Africa, North of Sahara
Developing Countries Unspecified
Regional Projects Unspecified
North & Central America
Africa, South of Sahara
Oceania
Far East Asia
South & Central Asia
25
results
occAsionAl pApers on innovAt ion in fAmily fArming
volatIlIty In oda to agrIcultural, forestry and fIshery research
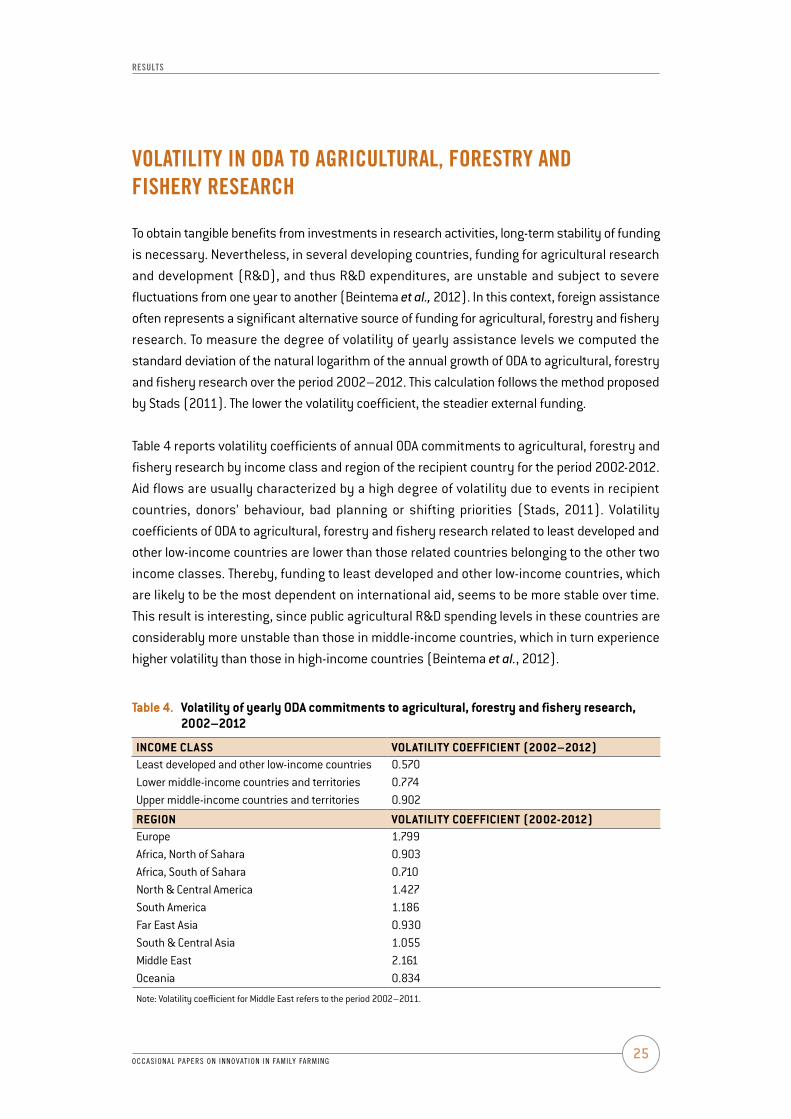
To obtain tangible benefits from investments in research activities, long-term stability of funding is necessary. Nevertheless, in several developing countries, funding for agricultural research and development (R&D), and thus R&D expenditures, are unstable and subject to severe fluctuations from one year to another (Beintema et al., 2012). In this context, foreign assistance often represents a significant alternative source of funding for agricultural, forestry and fishery research. To measure the degree of volatility of yearly assistance levels we computed the standard deviation of the natural logarithm of the annual growth of ODA to agricultural, forestry and fishery research over the period 2002–2012. This calculation follows the method proposed by Stads (2011). The lower the volatility coefficient, the steadier external funding.
Table 4 reports volatility coefficients of annual ODA commitments to agricultural, forestry and fishery research by income class and region of the recipient country for the period 2002-2012. Aid flows are usually characterized by a high degree of volatility due to events in recipient countries, donors’ behaviour, bad planning or shifting priorities (Stads, 2011). volatility coefficients of ODA to agricultural, forestry and fishery research related to least developed and other low-income countries are lower than those related countries belonging to the other two income classes. Thereby, funding to least developed and other low-income countries, which are likely to be the most dependent on international aid, seems to be more stable over time. This result is interesting, since public agricultural R&D spending levels in these countries are considerably more unstable than those in middle-income countries, which in turn experience higher volatility than those in high-income countries (Beintema et al., 2012).
table 4. volatility of yearly OdA commitments to agricultural, forestry and fishery research, 2002–2012
INCOme ClASS vOlAtIlIty COeFFICIeNt (2002–2012)least developed and other low-income countries 0.570lower middle-income countries and territories 0.774Upper middle-income countries and territories 0.902
reGION vOlAtIlIty COeFFICIeNt (2002-2012)Europe 1.799Africa, North of Sahara 0.903Africa, South of Sahara 0.710North & Central America 1.427South America 1.186Far East Asia 0.930South & Central Asia 1.055middle East 2.161Oceania 0.834
Note: volatility coefficient for middle East refers to the period 2002–2011.
26occAsionAl pApers on innovAt ion in fAmily fArming
Is aId to agrIcultural InnovatIon a prIorIty for the InternatIonal communIty?
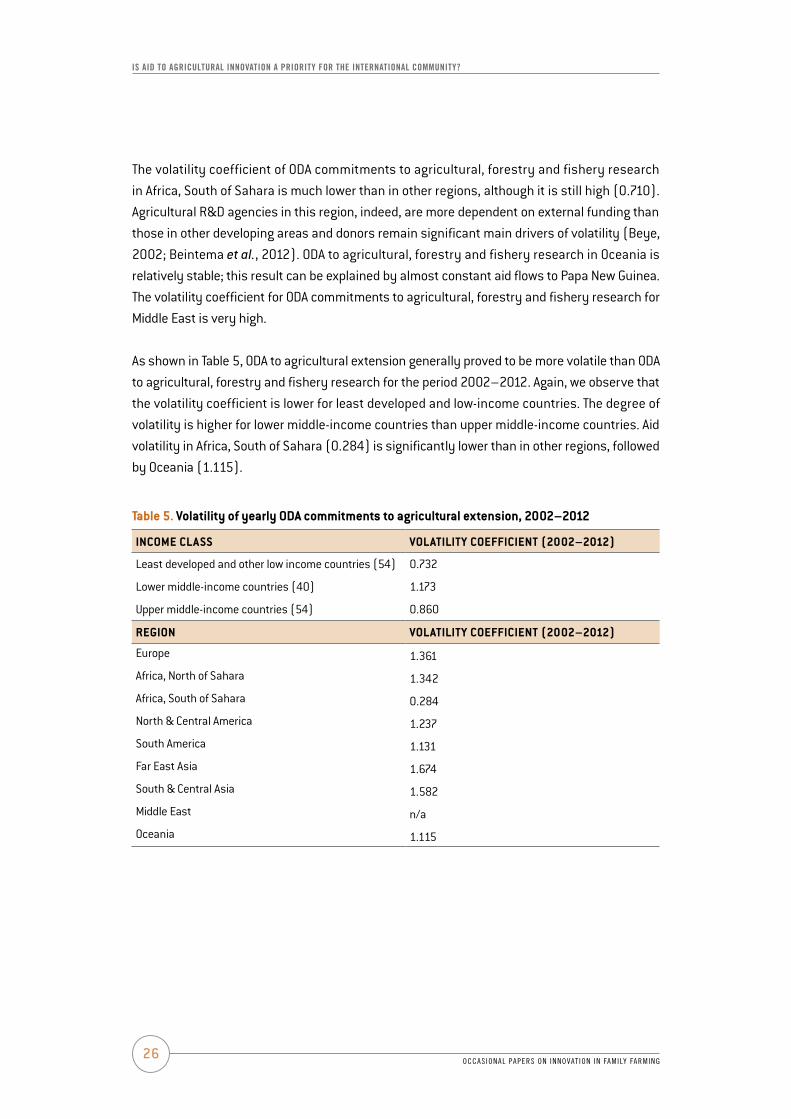
The volatility coefficient of ODA commitments to agricultural, forestry and fishery research in Africa, South of Sahara is much lower than in other regions, although it is still high (0.710). Agricultural R&D agencies in this region, indeed, are more dependent on external funding than those in other developing areas and donors remain significant main drivers of volatility (Beye, 2002; Beintema et al., 2012). ODA to agricultural, forestry and fishery research in Oceania is relatively stable; this result can be explained by almost constant aid flows to Papa New guinea. The volatility coefficient for ODA commitments to agricultural, forestry and fishery research for middle East is very high.
As shown in Table 5, ODA to agricultural extension generally proved to be more volatile than ODA to agricultural, forestry and fishery research for the period 2002–2012. Again, we observe that the volatility coefficient is lower for least developed and low-income countries. The degree of volatility is higher for lower middle-income countries than upper middle-income countries. Aid volatility in Africa, South of Sahara (0.284) is significantly lower than in other regions, followed by Oceania (1.115).
table 5. volatility of yearly OdA commitments to agricultural extension, 2002–2012
INCOme ClASS vOlAtIlIty COeFFICIeNt (2002–2012)
least developed and other low income countries (54) 0.732
lower middle-income countries (40) 1.173
Upper middle-income countries (54) 0.860
reGION vOlAtIlIty COeFFICIeNt (2002–2012)
Europe 1.361
Africa, North of Sahara 1.342
Africa, South of Sahara 0.284
North & Central America 1.237
South America 1.131
Far East Asia 1.674
South & Central Asia 1.582
middle East n/a
Oceania 1.115
27
results
occAsionAl pApers on innovAt ion in fAmily fArming
maIn donor countrIes In terms of oda commItments to agrIcultural, forestry and fIshery research and agrIcultural extensIon (2002–2012)
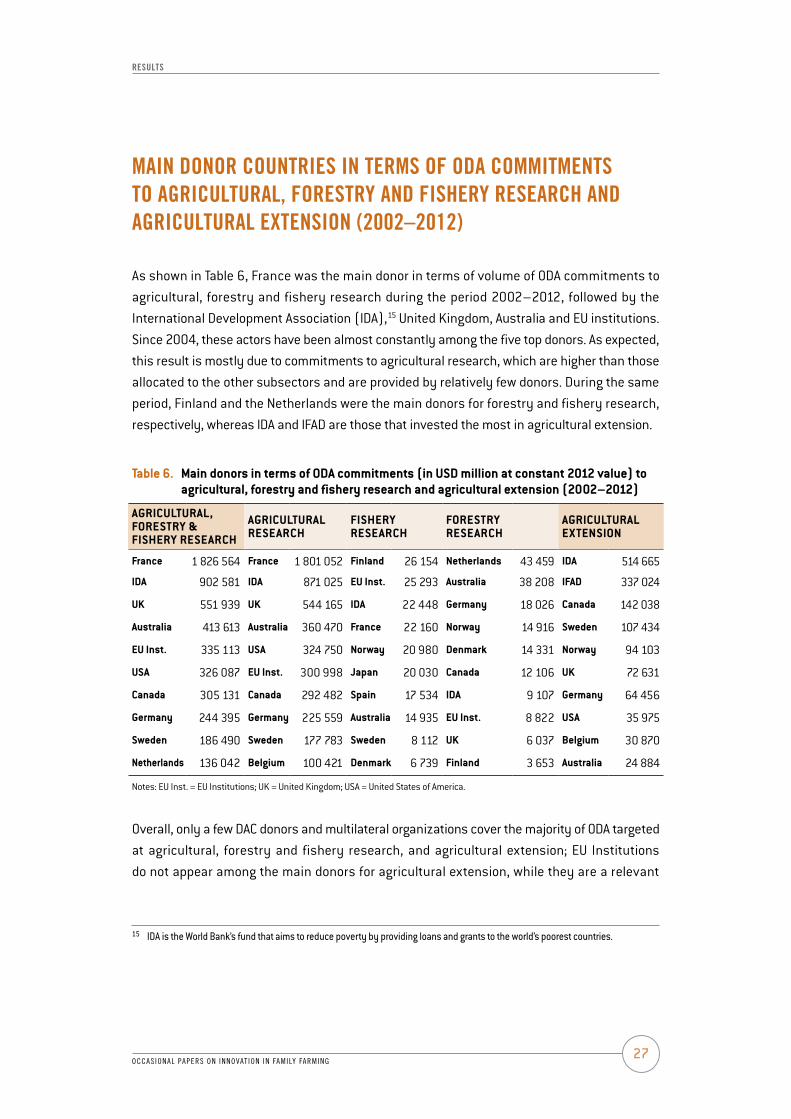
As shown in Table 6, France was the main donor in terms of volume of ODA commitments to agricultural, forestry and fishery research during the period 2002–2012, followed by the International Development Association (IDA),15 United Kingdom, Australia and EU institutions. Since 2004, these actors have been almost constantly among the five top donors. As expected, this result is mostly due to commitments to agricultural research, which are higher than those allocated to the other subsectors and are provided by relatively few donors. During the same period, Finland and the Netherlands were the main donors for forestry and fishery research, respectively, whereas IDA and IFAD are those that invested the most in agricultural extension.
table 6. main donors in terms of OdA commitments (in uSd million at constant 2012 value) to agricultural, forestry and fishery research and agricultural extension (2002–2012)
AGrICulturAl, FOreStry & FIShery reSeArCh
AGrICulturAl reSeArCh
FIShery reSeArCh
FOreStry reSeArCh
AGrICulturAl exteNSION
France 1 826 564 France 1 801 052 Finland 26 154 Netherlands 43 459 IdA 514 665
IdA 902 581 IdA 871 025 eu Inst. 25 293 Australia 38 208 IFAd 337 024
uK 551 939 uK 544 165 IdA 22 448 Germany 18 026 Canada 142 038
Australia 413 613 Australia 360 470 France 22 160 Norway 14 916 Sweden 107 434
eu Inst. 335 113 uSA 324 750 Norway 20 980 denmark 14 331 Norway 94 103
uSA 326 087 eu Inst. 300 998 Japan 20 030 Canada 12 106 uK 72 631
Canada 305 131 Canada 292 482 Spain 17 534 IdA 9 107 Germany 64 456
Germany 244 395 Germany 225 559 Australia 14 935 eu Inst. 8 822 uSA 35 975
Sweden 186 490 Sweden 177 783 Sweden 8 112 uK 6 037 belgium 30 870
Netherlands 136 042 belgium 100 421 denmark 6 739 Finland 3 653 Australia 24 884
Notes: EU Inst. = EU Institutions; UK = United Kingdom; USA = United States of America.
Overall, only a few DAC donors and multilateral organizations cover the majority of ODA targeted at agricultural, forestry and fishery research, and agricultural extension; EU Institutions do not appear among the main donors for agricultural extension, while they are a relevant
15 IDA is the World Bank’s fund that aims to reduce poverty by providing loans and grants to the world’s poorest countries.

28occAsionAl pApers on innovAt ion in fAmily fArming
Is aId to agrIcultural InnovatIon a prIorIty for the InternatIonal communIty?
donor for agricultural, forestry and fishery research. In addition to the donors listed in Table 6, Iceland (USD 600 000), luxemburg (USD 100 000), greece (USD 1.9 million), Portugal (USD 7.7 million), Italy (USD 10 million), Austria (USD 12 million), New Zealand (USD 14 million) and Ireland (USD 22 million) offered ODA to research activities in agriculture, forestry and fishing during the period 2002–2012.
Countries in Africa, South of Sahara, including Ethiopia, Kenya, madagascar, mali and Senegal, received ODA for agricultural, forestry and fishery research, mainly from IDA (USD 607.8 million), France (USD 508.5 million), Canada (USD 115.3 million) and EU Institutions (USD 110.6 million). India received most of its external funding from IDA (USD 156 million), and viet Nam from France (USD 40 million), Australia (USD 36 million) and Asian Development Bank (USD 34 million). In addition, Papa New guinea received assistance almost exclusively from Australia (USD 111.8 million), while Brazil received substantial assistance from France, which donated USD 102.8 million. The main donor for China was Spain, which donated about USD 40 million to agricultural research in 2003.16
During the period 2002–2012, ODA to agricultural extension to countries in Africa, South of the Sahara was mainly provided by IDA (USD 229 million), IFAD (USD 184 million) and Sweden (USD 107 million). Similarly, for South and Central Asia countries the main donor was IFAD, which donated USD 137 million. most of these funds were directed to India, receiving USD 121 million in the same period.
16 Once again, it is important to recall that the most of these aid flows are aimed at agricultural research rather than forestry and fishery research. For instance, Papa New Guinea received USD 112 million for agricultural, forestry and fishery research, but USD 107.8 million of this was aimed at agricultural research. Similarly, in Brazil, USD 106.8 million were directed to agricultural research out of USD 109.7 million aimed at agriculture, forestry and fishery research as a whole.

29
dIscussIon and polIcy recommendatIons
occAsionAl pApers on innovAt ion in fAmily fArming
chapter 4
dIscussIon and polIcy recommendatIons
The first conclusion that can be drawn from the analysis of the data presented in this paper is that donor commitments to both research and extension are relatively small, considering that from 2002 to 2012 they allocated only an average of 7 percent to research and 2 percent to extension out of total ODA to agriculture, forestry and fishing. Furthermore, the share of agricultural ODA committed to agricultural research and extension has decreased over the period investigated as overall aid flows to agriculture, forestry and fishing have increased faster than ODA allotted to agricultural, forestry and fishery research and agricultural extension over the period.
If adequate levels of funding for research are crucial, long-term stability of funding is equally vital (FAO, 2014). In his analysis of the cost of aid volatility, Kharas (2008) provided evidence of sizable deadweight loss for developing countries due to volatile aid flows. Research projects in particular require several years of steadily funded activities to produce results that can be reliably translated into practice. High volatility in external funding may have a negative impact on research and extension outputs, especially for those developing countries that are highly dependent on external resources. It should be noted, however, that in cases where government funding is substantial and stable, the volatility of donor investment is less likely to be of great concern. Beintema et al. (2012) maintain that the main driver of volatility has been the short-term perspective of donors and development banks. The high dependency on donor funding is often the main cause of the high volatility in expenditures in R&D in many developing countries, especially in Africa, South of Sahara (Stads, 2011).
Unfortunately, we were not able to analyse aid dependency at country level, because data on external assistance and public expenditure are not comparable, and we believe that this should be the object of future research. It is interesting to observe that, overall, international aid privileges least developed and other low income countries and countries in Africa, South of Sahara. Donor funding as a share of total agricultural R&D funding is quite small in most South American or middle Eastern countries, while in Africa, external assistance accounted for nearly

30occAsionAl pApers on innovAt ion in fAmily fArming
Is aId to agrIcultural InnovatIon a prIorIty for the InternatIonal communIty?
30 percent of total agricultural R&D funding in 201117. If you exclude salary costs from total R&D costs (which are typically funded by governments), the donor share to African agricultural R&D would be even higher. Therefore, the volatility of ODA commitments has a comparatively more profound impact in least developed and other low-income countries, even if the volatility coefficient is, in relative terms, lower than for other regions, but still quite high. middle-income countries received progressively less ODA for agricultural, forestry and fishery research and extension, and underwent a higher growth rate in public expenditures in agricultural R&D; among these countries, India and China were the forerunners, together with Brazil.18 The volatility of ODA commitments might be higher here, but is of lesser importance.
In conclusion, ODA flows for agricultural, forestry and fishery research have been and are becoming more and more insufficient and unpredictable. The same applies to ODA flows for agricultural extension, which are smaller in volume, and more volatile. These results confirm the findings of three regional assessment studies recently conducted in low-income countries by the Tropical Agriculture Platform (Aerni et al., 2015).
17 See chapter 8 of ASTI Africa regional report 2014: http://www.asti.cgiar.org/pdf/AfricaRegionalReport2014.pdf18 Agricultural innovation is on the agenda of all these countries who have substantially increased their funding to agricultural R&D,
although they were among the main ODA recipients for this subsector; for instance, ODA to agricultural research in China has been decreasing over time, while public expenditures increased significantly, up to 13 percent of total public spending on agricultural R&D in 2008 (Beintema et al., 2012).
© F
AO/S
erge
y Ko
zmin

occAsionAl pApers on innovAt ion in fAmily fArming31
references
references
Aerni, p., Nichterlein, K., rudgard, S. & Sonnino, A. 2015. making Agricultural Innovation Systems (AIS) work for development in tropical countries. Sustainability, 7: 831–850.
beintema, N. & Stads, G.J. 2014. Is Africa investing enough? 2013 global Food Policy Report. International Food Policy Research Institute, washington DC, USA.
beintema, N., Stads, G.J., Fuglie, K. & heisey, p. 2012. ASTI global Assessment of Agricultural R&D Spending. International Food Policy Research Institute, washington DC, USA.
beye, G. 2002. Impact of foreign assistance on institutional development of national agricultural research systems in Sub-Saharan Africa. Research and Technology Paper, no. 10. FAO, Rome, Italy.
Kharas, h. 2008. measuring the cost of aid volatility. Wolfensohn Center for Development Working Paper, No. 3. Brookings Institution, washington, DC, USA.
FAO. 2014. State of Food and Agriculture: Innovation in family farming. FAO, Rome, Italy.
Kennedy, d. 2014. Building agricultural research. Science, 346(6205): 13.
lowder, S.K. & Carisma, b. 2011. Financial resource flows to agriculture. A review of data on government spending, official development assistance and foreign direct investment. ESA Working Paper, No. 11., See www.fao.org/economic/esa.
OeCd [Organisation for economic Co-operation and development]. 2013. Converged Statistical Reporting Directives for the Creditor Reporting System (CRS) and the Annual DAC Questionnaire, OECD, Paris. http://www.oecd.org/dac/stats/documentupload/DCD-DAC(2013)15-FINAl-ENg.pdf.
petras, r. 2009. Comparative Study of Data Reported to the OECD Creditor Reporting System (CRS) and to the Aid management Platform (AmP). OECD/DgF, Paris, France.
piva, p. & dodd, b. 2009. where did all the aid go? An in-depth analysis of increased health aid flows over the past 10 years. Bulletin of the World Health Organization, No. 87.
Stads, G.J. 2011. Africa’s agricultural R&D funding rollercoaster: an analysis of the elements of funding volatility. In: Agricultural R&D: Investing in Africa’s Future – Analysing Trends, Challenges, and Opportunities. IFPRI, washington, DC, USA, and FARA, Africa.
World bank. 2007. world Development Report 2008. Agriculture for Development. world Bank, washington, DC, USA.

occAsionAl pApers on innovAt ion in fAmily fArming32
Is aId to agrIcultural InnovatIon a prIorIty for the InternatIonal communIty?
annex I
donor lIst 2002–201219
dAC membersAustralia, Austria, Belgium, Canada, Denmark, EU Institutions, Finland, France, germany, greece, Iceland, Ireland, Italy, Republic of Korea, Japan, luxembourg, Netherlands, New Zealand, Norway, Portugal, Spain, Sweden, Switzerland, United Kingdom, United States of America.
Non-dAC CountriesKuwait
multilateral OrganizationsAsDB (Special Funds), Asian Development BankAfDF, African Development FundIDA, International Development Association (world Bank)IDB (Special Funds), Inter-American Development BankIFAD, International Fund for Agricultural Development gEF, global Environment FacilityIslamic Development BankUNDP, United Nation Development Programme
19 All those countries or multilateral organization which are not in listed above but are included in the DAC data submitter did not report positive ODA to agricultural, forestry and fishery research nor agricultural extension, during the period 2002–2012.

occAsionAl pApers on innovAt ion in fAmily fArming33
annexes
annex II
recIpIent countrIes lIsted by regIon
eurOpe Albania, Belarus, Bosnia-Herzegovina, Croatia, Kosovo, Former yugoslav Republic of macedonia, moldova, montenegro, Serbia, Ex-yugoslavia States, Turkey, Ukraine.
AFrICA, NOrth OF SAhArA Algeria, Egypt, libya, morocco, Tunisia.
AFrICA, SOuth OF SAhArA Angola, Benin, Botswana, Burkina Faso, Burundi, Cameroon, Cape verde, Central African Republic, Chad, Comoros, Congo, Democratic Republic of Congo, Cote d’Ivoire, Djibouti, Equatorial guinea, Eritrea, Ethiopia, gabon, gambia, ghana, guinea, guinea-Bissau, Kenya,lesotho, liberia, madagascar, malawi, mali, mauritania, mauritius, mayotte, mozambique, Namibia, Niger, Nigeria, Rwanda, Sao Tome & Principe, Senegal, Seychelles, Sierra leone, Somalia, South Africa, South Sudan, St. Helena, Sudan, Swaziland, Tanzania, Togo, Uganda, Zambia, Zimbabwe.
NOrth & CeNtrAl AmerICA Anguilla, Antigua and Barbuda, Belize, Costa Rica, Cuba, Dominica, Dominican Republic, El Salvador, grenada, guatemala, Haiti, Honduras, Jamaica, mexico, montserrat, Netherlands Antilles, Nicaragua, Panama, St. Kitts-Nevis, St. lucia, St.vincent & grenadines, Trinidad and Tobago.
SOuth AmerICA Argentina, Bolivia, Brazil, Chile, Colombia, Ecuador, guyana, Paraguay, Peru, Suriname, Uruguay, venezuela
FAr eASt ASIA Brunei, Cambodia, China, Indonesia, Democratic People’s Republic of Korea, laos, macao, malaysia, mongolia, Philippines, Thailand, Timor-leste, viet Nam.
SOuth & CeNtrAl ASIA Afghanistan, Armenia, Azerbaijan, Bangladesh, Bhutan, georgia, India, Kazakhstan, Kyrgyz Republic, maldives, myanmar, Nepal, Pakistan, Sri lanka, Tajikistan, Turkmenistan, Uzbekistan.
mIddle eASt Iran, Iraq, Jordan, lebanon, Syria, west Bank & gaza Strip, yemen.
OCeANIA Cook Islands, Fiji, Kiribati, marshall Islands, Fed. States of micronesia, Nauru, Niue, Palau, Papua New guinea, Samoa, Solomon Islands, Tokelau, Tonga, Tuvalu, vanuatu, wallis & Futuna.

OccasiOnal papers On InnovatIon In FamIly FarmIng

food and agrIculture organIzatIon of the unIted natIons (fao)
www.fao.org/nr/research-extension-systems/res-home/en
I5127E/1/11.15
ISBN 978-92-5-108961-3
9 7 8 9 2 5 1 0 8 9 6 1 3
For a wide range of developing countries data concerning public and private spending on agricultural research and development is collected and assessed by the agricultural science and technology indicators (asti) initiative. assessment of foreign assistance to agricultural, forestry and fishing research and to agricultural extension has received less attention. the present study used oecd data to analyse the amount and variability of foreign aid directed to agricultural research and extension, as well as to forestry and fishery research, during the period of 2002 to 2012.