is 15610 (2006): guidelines for measurement of customer ...is 15610:2006 january 2006 m indian...
TRANSCRIPT
Disclosure to Promote the Right To Information
Whereas the Parliament of India has set out to provide a practical regime of right to information for citizens to secure access to information under the control of public authorities, in order to promote transparency and accountability in the working of every public authority, and whereas the attached publication of the Bureau of Indian Standards is of particular interest to the public, particularly disadvantaged communities and those engaged in the pursuit of education and knowledge, the attached public safety standard is made available to promote the timely dissemination of this information in an accurate manner to the public.
इंटरनेट मानक
“!ान $ एक न' भारत का +नम-ण”Satyanarayan Gangaram Pitroda
“Invent a New India Using Knowledge”
“प0रा1 को छोड न' 5 तरफ”Jawaharlal Nehru
“Step Out From the Old to the New”
“जान1 का अ+धकार, जी1 का अ+धकार”Mazdoor Kisan Shakti Sangathan
“The Right to Information, The Right to Live”
“!ान एक ऐसा खजाना > जो कभी च0राया नहB जा सकता है”Bhartṛhari—Nītiśatakam
“Knowledge is such a treasure which cannot be stolen”
“Invent a New India Using Knowledge”
है”ह”ह
IS 15610 (2006): Guidelines for measurement of customersatisfaction [MSD 3: Statistical Methods for Quality andReliability]


IS 15610:2006
January 2006
m
Indian
GUIDELINES FOR
Standard
MEASUREMENT OFCUSTOMER SATISFACTION
ICS 03.120.10
. ,,
OBIS 2006
BUREAU OF INDIAN STANDARDSMANAK BHAVAN, 9 BAHADUR SHAH ZAFAR MARG
NEW DELHI 110002
Price Group 9
IS 15610:2006
Indian Standard
GUIDELINES FOR MEASUREMENT OFCUSTOMER SATISFACTION
1 SCOPE
1.1 This standard provides guidelines to anorganization to develop its processes for measuringcustomer satisfaction in all areas of interest to thecustomer andlor the organization which are generic,independent of any specific product, process, industry,or economic sector.
L.2 These guidelines cover objectives, provideelements of customer satisfaction measurementexercise, and suggest methods of evaluation.
2 REFERENCES
The following standards contain provisions whichthrough reference in this text constitute provisions crfthis standard. At the time of publication, the editionsindicated were valid. All standards are subject torevision and parties to agreements based on thisstandard are encouraged to investigate the possibilityof applying the most recent editions of the standardsindicated below:
1S/1S0 No. Title
9001:2000 Quality management systems —Requirements
9004:2000 Quality mana-gement systems —Guidelines for performanceimprovements
15280:2003 Quality fi.mction deployment
3 TERMINOLOGY
3.1 “Customer — Organization or person that receivesa product.
Example: Consumer, client, end-user, retailer,beneficiary and purchaser.
NOTE — A customer can be internal or external to theorganization,
3.2 Customer Satisfaction — Customer’s perceptionof the degree to which the customer’s requir~entshave been fulfilled.
3.3
NOTES
1 Customer complaints are a common indicator of lowcustomer satisfaction but their absence does not necessarilyimply high customer satisfaction.
2 Even when customer requirements have been agreed withthe customer and fulfilled, this does not necessarilyensure highcustomer satisfaction.
Satisfaction — Satisfaction is the consumer’s
fulfillment response. It is a judgment that a productandlor service feature, or the product or service itself,provided (or is providing) a pleasurable level ofconsumption — related fulfillment, iricluding levelsof under — or over — fulfillment. Satisfaction with aproduct and/or service is a construct that requiresexperience and use of a product andlor service.
NOTES
1 Satisfaction is a feeling. It is a short term attitude that canreadily change given a constellation of circumstances. It residesin the users mind and it is different from observable behaviors,such as, product choice, complaining, and repurchase.
2 Satisfaction commonly has thresholds at both a lower level(in sufficiencyOYunder fulfillment) and an upper level (excessor over fulfillment).
3.4 Measurement — Creating an instrument usingwhich an organization can gauge customer’s sense offulfillment with respect to organization’s offer — beit product and/or service or part. Also included inmeasurement is customer’s sense of 17.rlfillmentwithrespect to offers made “by other competitors or fromexperiences of substitutable products/services (;eeIS 15280).
3.5 Process — Set of interrelated or interactingactivities which transform inputs into outputs.
3.6
1
NOTES
1 Inputs to a process are generally outputs of other processes.
2 Processes in an organization are generally planned andcarried out under controlled conditions to add value.
3 A process where the conformity of the resulting productcannotbe readily or economically verified is frequently referredto as a ‘special process’,
Product — Result of a process.
NOTES
1 There are four generic product categories, as follows:
a) services (for example, transport);
b) software (for example, computer program, dictionary);
c) hardware (for example, engine mechanical part); and
d) processed materials (for example, lubricant),
Many products comprise elements belonging to differentgeneric product categories. Whether the product is then catledservice, software, hardware or processed material dependson the dominant element, For example, the offeredproduct ‘automobile’ consist of hardware (for example, tyres),processedmaterials(for.example,tirel, cooling liquid), software(for example, engine control software, driver’s manual), andservice (for example, operating explanations given by thesalesman),
2 Service is the result of at least one activity necessarilyperformed at the interface between the supplier and customer ,
IS 15610:2006
is generally intangible. Provision ofaservice caoinvolve, forexample, the following:
O
b)
c)
d)
e)
an activity performed on a customer-supplied tangibleproduct (for example, automobile to-be repaired);
an activity performed on a customer-supplied intangibleproduct (for example, the income statement needed toprepare a tax return);
the delivery of an intangible product (for example, thedelivery of information inthecontext of knowledgetransmission); and
the creation of ambience for the customer (for example,in hotels and restaurants).
Software consists of information and is generallyintangible and can be in the form of approaches,transaction or procedures.
Hardware is generally tangible and its amount is acountable characteristic. Processed materials aregenerally tangible and their amount is a continuouscharacteristic. Hardware and processed materials oftenare referred to as goods.
Quality assurance is mainly focused on intendedproduct.
4 OBJECTIVES OF CUSTOMERSATISFACTION MEASUREMENT
The basic objectives of any customer satisfactionmeasurement include:
a) Determination of overall satisfaction with
b)
c)
d)
e)
0
g)
h)
j)
k)
m)
regard to product, service, or buying experience,
Gaining deeper insight into customers’experience,
Determination of areas of dissatisfaction onwhich to focus correctivelpreventive actions,
Determination of areas of satisfaction thatneed to be maintained (or enhanced),
Identification of performance or functionallimitations as seen by the customer,
Benchmarkin-g how the customers rate theproducts and/or services relative toorganization’s competitors products and/orservices,
Providing the framework to develop acomprehensive corrective/preventive actionplan to respond to the customers’ concerns andissues,
Soliciting customer inputs for product andprocess improvement,
Linking customer satisfaction to internalperformance and employee satisfaction,
Determination of the effective complaintredressal mechanism, and
Determination of customers’ perceptions and/or satisfaction with, organization’s performancein ar~as such as parameters of quality, serviceand processes.
5 CUSTOMER SATISFACTIONMEASUREMENT EXERCISE — CONCEPTS,GAPS AND BENEFITS
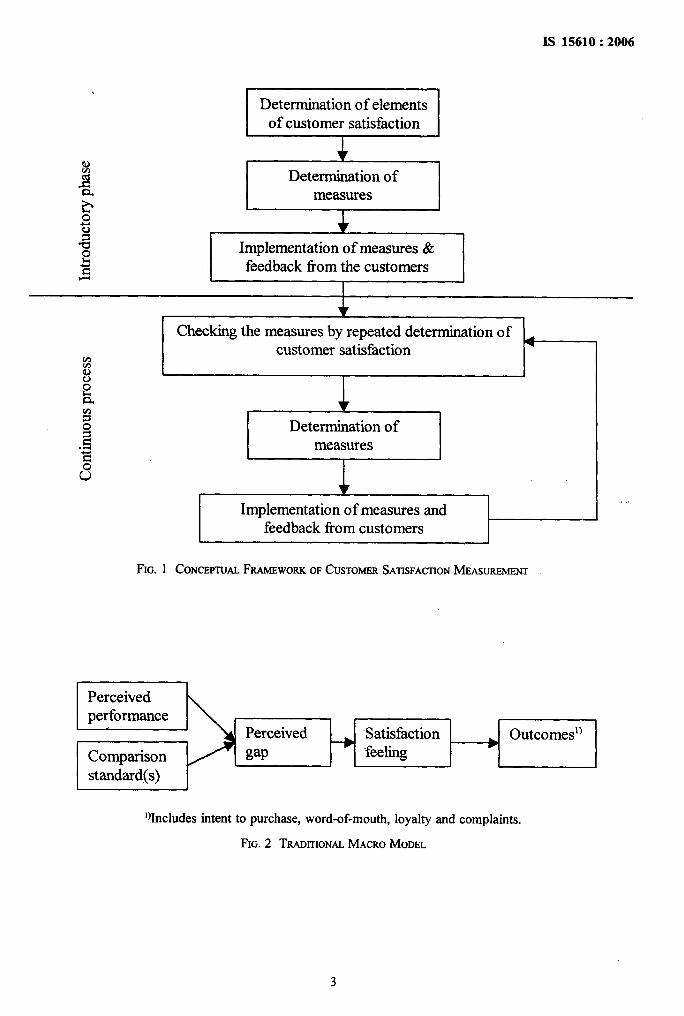
Customer satisfaction measurement is a continuousprocess. The overall concept of customer satisfactionmeasurement can be best described pictorially asshown in Fig. 1. The effectiveness of the measure istested by repeated surveys and other methods. Theprocess of determination is subject to continuousadaptation and improvement.
5.1 As a usefhl strategic management tool, mertsure-ment of customer satisfaction is uset%l in determiningwhether there are gaps between:
a) What the business believes the customers wantand the customer actually wants?
b) What the business believes it has to produceand What it ends up producing?
c) What the business actually delivers and whatthe customers actually get?
5.2 Effective customer satisfaction measurement canfacilitate improving the bottom line by:
a)
b)
c)
d)
e)
f)
g)
h)
j)
Supporting management decision making.
Defmirtg and directing continuous improvementefforts— including areas of improvingemployee performance.
Incorporating increased awareness of customerneeds throughout the organization.
Increasing customer retention, loyalty andenthusiasm.
Improving existing products and services.
Anticipating fhture customer needs.
Leveraging opportunities for productinnovation.
Improving the image of organization’sreputation and its brands.
Attracting new customers.
k) Providing a more effective resource allocationprocess.
m) Improving brand image.
6 MODELS
Customer satisfaction measurement can be modelledinto some traditional macro models and micro models.
6.1 Macro Models
6.1.1 The traditional macro model of customersatisfaction is shown in 13g. 2.
6.1.2 Another macro model would be the linkage ofoverall service satisfaction, encounter satisfaction andperceived service quality as shown in Fig. 3.
2
*‘i? I IoE4 Implementation of measures&~e feedback born the customers
I
Checking the measures by repeated determination ofcustomer satisfaction
t-
4Implementation of measures and
feedback from customers
FIG. 1 CONCEPTUALFRAMEWORKOF CUSTOMERSATISFACTIONMEASUREMENT
Perceivedperformance
Perceived Satisfaction Outcomesl)●
Comparison gap feeling
standard(s)
‘Uncludes intent to purchase, word-of-mouth, loyalty and complaints.
FIG.2 TRADITIONALMACRO MODEL
3
IS 15610:2006
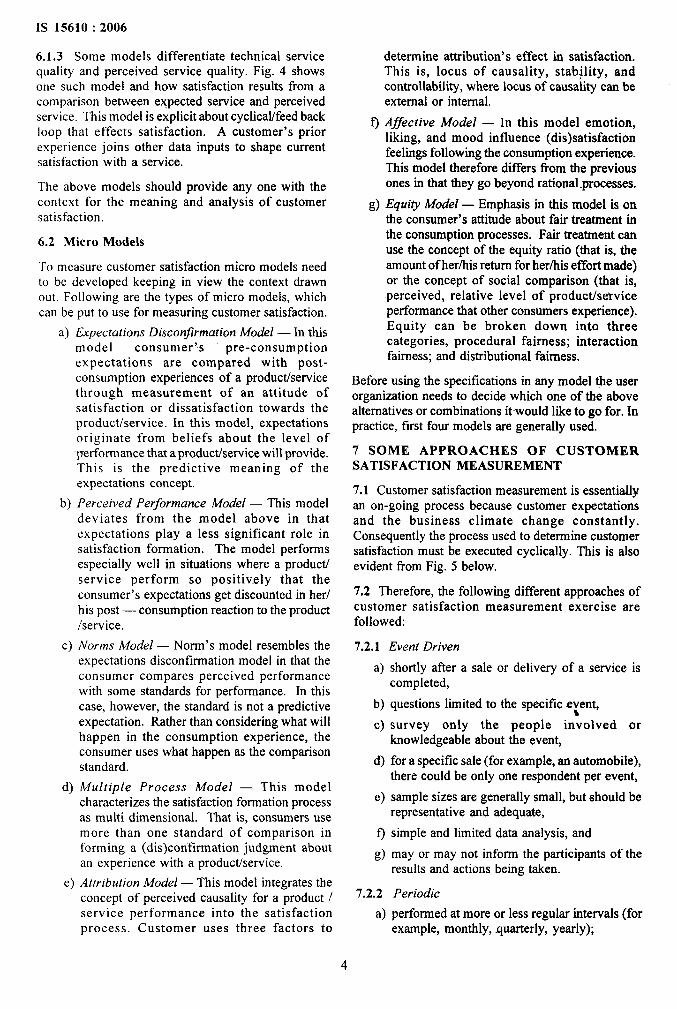
6.1.3 Some models differentiate technical servicequality rind perceived service quality. Fig. 4 showsone such model and how satisfaction results from acomparison between expected service and perceived
.service. This model is explicit about cyclical/feedback!OOp that effects satisfaction. A customer’s priorexperience joins other data inputs to shape currentsatisfaction with a service.
The above models should provide any one with thecontext for the meaning and analysis of customersatisfaction.
6.2 Micro Models
To measure customer satisfaction micro models needto be developed keeping in view the context drawnout. Following are the types of micro models, whichcan be put to use for measuring customer satisfaction.
a)
b)
c)
d)
e)
Expectations Disconfrmation Model — In thismodel consumer’s pre-.consumptionexpectations are compared with post-consumption experiences of a productlservicethrough measurement of an attitude ofsatisfaction or dissatisfaction towards theproduct/service. In this model, expectationsoriginate from beliefs about the level ofperformance that a productiservice will provide.This is the predictive meaning of theexpectations concept.
Perceived Performance Model — This modeldeviates from the model above in thatexpectations play a less significant role insatisfaction formation. The model performsespecially well in situations where a productiservice perform so positively that theconsumer’s expectations get discounted in herlhis post — consumption reaction to the product/service.
Norms Model — Norm’s model resembles theexpectations disconfirmation model in that theconsumer compares perceived performancewith some standards for performance. In thiscase, however, the standard is not a predictiveexpectation. Rather than considering what willhappen in the consumption experience, theconsumer uses what happen as the comparisonstandard.
Multiple Process Model — This modelcharacterizes the satisfaction formation processas multi dimensional. That is, consumers usemore than one standard of comparison informing a (dis)confirmation judgment aboutan experience with a productlservice,
Attribution Model — This model integrates theconcept of perceived causality for a product /service performance into the satisfactionprocess. Customer uses three factors to
f)
!3)
determine attribution’s effect in satisfaction.This is, locus of causality, stability, andcontrollability, where locus of causaiity can beexternal or internal.
Affective Model — In this model emotion,liking, and mood influence (dissatisfactionfeelings following the consumption experience.This model therefore differs horn the previousones in that they go beyond rational processes.
Equity Model — Emphasis in this model is onthe consumer’s attitude about fair treatment inthe consumption processes. Fair treatment canuse the concept of the equity ratio (that is, theamount of her/his return for her/his effort made)or the concept of social comparison (that is,perceived, relative level of productfse~viceperformance that other consumers experience).Equity can be broken down into threecategories, procedural fairness; interactionfairness; and distributional fairness.
Before using the specifications in any model the userorganization needs to decide which one of the abovealternatives or combinations itwould like to go for. Inpractice, first four models are generally used.
7 SOME APPROACHES OF CUSTOMERSATISFACTION MEASUREMENT
7.1 Customer satisfaction measurement is essentiallyan on-going process because customer expectationsand the business climate change constantly.Consequently the process used to determine customersatisfaction must he executed cyclically. This is alsoevident from Fig. 5 below.
7,2 Therefore, the following different approaches ofcustomer satisfacti-on measurement exercise arefollowed:
7.2.1 Event Driven
a)
b)
c)
d)
e)
f)
g)
7.2.2
a)
4
shortly after a sale or delivery of a service iscompleted,
questions limited to the specific e~ent,
survey only the people involved orknowledgeable about the event,
for a specific sale (for example, an automobile),there could be only one respondent per event,
sample sizes are generally small, but -should berepresentative and adequate,
simple and limited data analysis, and
may or may not inform the participants of theresults and actions being taken.
Periodic
performed at more or less regular intervals (forexample, monthly, -quarterly, yearly);

IS 15610:2006
..
Y
Overall service Service encounter
satisfaction satisfaction
Perceived service
FIG.3 MODELFORSERVICEQuALrrY
Other data Expected Satisfaction Perceived
inputs’) service service
Contact Technical servicepersonnel -p quality
‘}Includes word-of-mouth, past experiences and advertising.
FIG.4 MODELFORSPECtFICATtONSVHLWJSCUSTOMERPERCEPTIONS
Actual Status 2
FIG.5 CUSTOMERSATISFACTIONIMPROVEMENTCYCLE
IS 15610:2006
b)
c)
d)
e)
f)
g)h)
j)
k)
m)
7.2.3
broad range of questions coverjng related facetsof a organization’s performance;
in-depth probing for information to identifyareas for improvement (concerns anddissatisfaction);
identification of what is important to thecustomer;
survey sample should include executives,decision makers, influencers, operational andmaintenance workers to get views from everysector;
sample sizes are relatively larger. This shouldbe representative and adequate for the purpose;
extensive data analysis possible;
formal reports issued for all those with a needto-know;
comprehensive corrective/preventive actiionplans initiated to address issues andconcerns;
top management needs to be involved andstrongly supportive of the actions being takento resolve customer’s issues and concerns; and
feedback of survey results and actions beingtaken should be formally presented to thecustomers who participated.
Continuous
Performed continuously.
8 SURV.EY -DESIGN
A normal survey design will have the following keysteps:
a)
b)
c)
d)
e)
9
g)h)
J
Statement of the objective of the survey,
Definitions of the population to be sampled,
Determination of the data to be collected,
Methods of measurement,
Choice of the sampling unit,
Select of the sampling design,
Select of the sample,
Organization of the field survey,
Summary and analysis of the data, and
k) Information gained for future surveys.
9 CHOICE OF METHODOLOGY
9.1 The methodology will depend on several factors.The vital four among these are:
a) Organization Type — Public versus privateorganizations, business size, number ofbranches, are all factors that will influence howthe organization can best use its own resourcesto make contact with and collate informationfrom customers.
b)
c)
d)
Product Type — I=iow often customers buy theproduct and from whom, whether they areconsumables or durables, whether the costrepresents a major expenditure on behalf of theconsumer, are all factors that will dictate howoften one can contact the customer andhow willingly one will “be to another in anyresearch.
Customer Type — Whether they are productandlor service buyers, etc, whether they arebuying for themselves or on behalf of others,are factors that will influence the level and typeof contact with customers that would be themost appropriate for the purpose of measuringcustomer satisfaction.
Environmental Type — Regional/culturalbackground whether terminal influence on theorganizationlproducticustomer.
9.2 Essentially the methodology will involve thefollowing steps which an organization will have toundertake:
a) Scope and Purpose of the Survey Prior toMeasurement should be Clearly Defined— Theorganization should know precisely what itshould expect out of the process. How will thedata be used? Should the data coverall product
b)
c)
d)
e)
lines? All geographical boundaries?
Data Collection Method Needs to” ‘beDetermined — The organization must be clearhow it will collect customer experience data.Whether -to collect it through traditional mailresponse, a face-to-face interview, responsesthrough intemet, through telephone or by someother mechanism. This determination isimportant because not all of the modes are bestvehicles for collecting the kind of data theorganization may actually want to collect.Though different methods may be suitable indifferent situations, face-to-face interview ispreferable for its small sample size more indepth information.
How the Data should be Stratlfled is to beDetermined — One must know how one isgoing to analyze and use the data beforedesigning the instrument.
Appropriate Sample Size is to be Determined— One must consider the margin of error toensure validity. It is not necessary to surveyall the customers of the organization if it has toget a 95 percent degree of corrfictence in thefindings. Once the sample size is known onecan create the needed data base of the customersone is looking for.
Drivers of Satisfaction are to be Identl~ed —One may easily get carried away by what one
6

IS 15610:2006
0
.d
h)
j)
is providing instead of being focused on to whatthe customer is looking for.
Instrument to Assess the Relative Importanceof the Drivers of Customer Satisfaction Needrto be Designed — This is important becauseone would not like to waste money on thingsthat will provide limited return.
A Method to Ver@ the Buying Criteria Neea!rto be Developed — Such data can be used tocompare with the satisfaction so as to be ableto predict future buying intentions based onperformance.
Structure for Getting Competitive Analysis isto be Developed — This helps in knowingcustomers’ assessment not only of theorganization’s product but also that of itscompetitors’.
Scale Neeak to be Developed — This is usefulnot only to measure the intensity of customerssense of fulfillment but also creating greaterability to statistically differentiate performanceof various competitors, namely, theorgan ization.
k) Administration of the Survey — Periodic checksare necessary to ensure that there is adequatecoverage of all markets segments. The data can
be input into statistical packages for makingappropriate analysis.
9.3 Duration of determining customer satisfaction mayvary widely based on the scope and criteria used formeasuring satisfaction. Atypical example for 28 weeksduration is given in Fig. 6.
9.4 The goals and strategiesaf the satisfaction analysisare to be defined which are based on the goals andstrategies of the unit as a whole. The customersatisfaction surveys will generate expectations ofimprovements-among customers. It should be possibleto fulfil these. In the conception phase, the-following,steps should be defined and documented in a roughstructure:
a) Internal users of the analysis results,
b) Customer target groups,
c) Organizational procedure,
d) Time schedules, and
e) Cost factors.
9.5 The customer satisfaction measurements arestructured in such a way that the results can becompared over a period of time. Having defined thegoals, the budget should be planned which shall takeinto account the following:
,,
Cost determining variables are:
Conception a) Internal and external+
consultants Ib) Performance of organization’s
I
Operative Data Collection a) Number of officesb) Number of regionsc) Size of sampled) Type of survey and cyclee) Type of questioning
Evaluation > a) Methodsb) Degree of detailc) Comparisond) Presentation
Implementation of MeasuresCosts depend on the extent on themeasures determined on the basisof the analysis.
7

Typical Time Schedule in weeksPlanning Steps
2 4 5 6 8 10 12 14 16 18 20 22 24 26 28
1. Goals, strategies, concepts m Goal, strategiesForming work team, selecting service partners, determining and conceptstimeframes, budget w’%
2. Iriternal user target group m*Internal user target
Selection information of participants groupm
3. Customer target groups -
Selection of customer target groups determining samplingCustomer
collating addresses, checking addressestarget
m
4. Assessment variables
Determining assessment variables to be measured. Creating Assessmentcatalog of questions, agreeing on catalog of questions with variablesinternal user group
m
5. Method of intewiew
Setting up questionnaire, testing questiomaire wi~ selected Method ofparticipant, announcing survey campaign, submitting interview
addresses to service partners, holding the interviews
6. Evaluation and documentationEvaluation and
Evaluation of the captured&@ plausibility check of the data documentationdocumentation, presentation
Em
7. Integration of additional variableq Integration ofComplaint dath, guarantee cases, sales statistics (call additionalfrequency), structured sales force information variables .
DEFINE E
inmo..
FIG.6 DURATIONOFATYPICALCusTOrmaSA’FISFA~ONMEASUREMENTEXERCISE
IS 15610:2006
Cost reduction should be undertaken using the existing collection methods according to:know how and experience gained in the other groupsand through method transfer.
a) Customer type and their accessibility,
b) Deadlines or timelines for submission and use
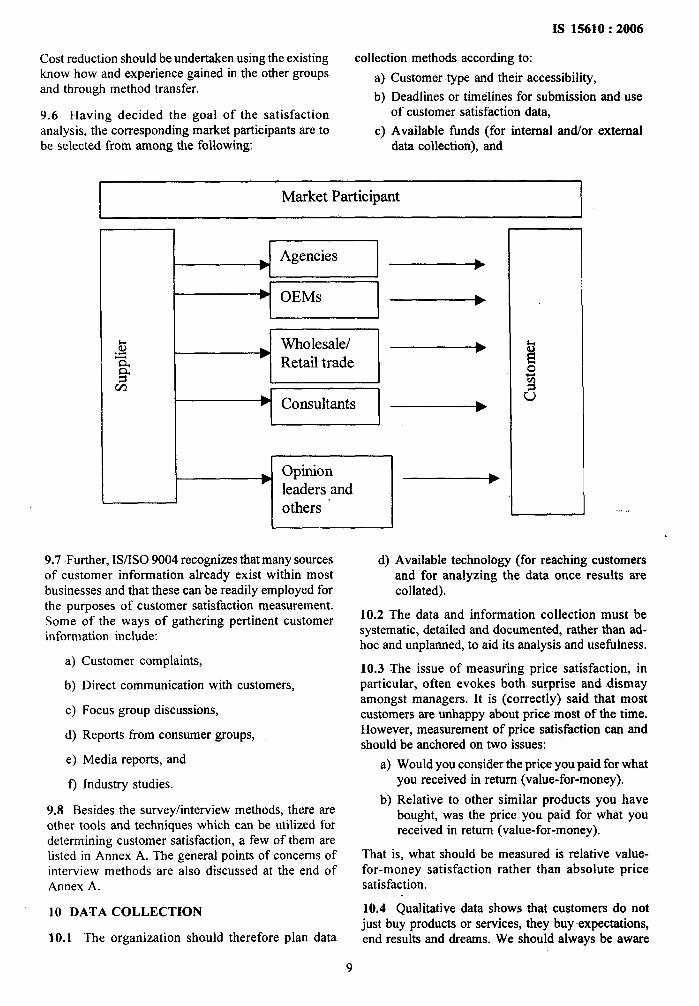
9.6 Having decided the goal of the satisfaction of customer satisfaction data,
analysis, the corresponding market participants are to c) Available finds (for internal and/or externalbe selected from among the following data collection), and
Market Participant
I I I
bWholesale/Retail trade
ConsultantsI J
I t
u ,,
9.7 Further. 1S/1S0 9004 recomizes that many sources d) Available technology (for reaching customersof customer information already exist within mostbusinesses and that these can be readily employed forthe purposes of customer satisfaction measurement.Some of the ways of gathering pertinent customerinformation include:
a)
b)
c)
d)
e)
f)
Customer complaints,
Direct communication with customers,
Focus group discussions,
Reports from consumer groups,
Media reports, and
Industry studies.
9.8 Besides the survey/interview methods, there areother took and techniques which can be utilized fordetermining customer satisfaction, a few of them arelisted in Annex A. The general points of concerns ofinterview methods are also discussed at the end ofAnnex A.
10 DATA COLLECTION
10.1 The organization shmld therefore plan data
and for analyzing the data once results arecollated).
10.2 The data and information collection must besystematic, detailed and documented, rather than ad-hoc and unplanned, to aid its analysis and usefidness.
10.3 The issue of measuring price satisfaction, inparticular, often evokes both surprise and dismayamongst managers. It is (correctly) said that mostcustomers are unhappy about price most of the time.However, measurement of price satisfaction can andshould be anchored on two issues:
a) Would you consider the price you paid for whatyou received in return (value-for-money).
b) Relative to other similar products You havebcmght, was the price you’ paid for ‘what youreceived in return (value-for-money).
That is, what should be measured is relative value-for-money satisfaction rather than absolute pricesatisfaction.
10.4 Qualitative data shows that customers do notjust buy products or services, they buy expectations,end results and dreams. We should always be aware
9
1S 15610:2006
of what we are promising the consumer, either as adirect promise or an implied one. We must know andunderstand the needs that provide the basis onwhich consumers purchase or do not purchase ourproducts. Meeting 1S/1S0 9001 at its most fundamentallevel, therefore, means understanding the underlyingneeds of customers and having in place a series ofmechanisms for measuring and satisfying these needs.This obviously goes well beyond collection ofcomplaints data.
11 ELEMENTS/ATTRIBUTES OF CUSTOMERSATISFACTION MEASUREMENT
11.1 Attributes describe the key characteristics ofproducts from the customers’ point of view. Thewording of attributes must clearly portray the customerexperience and avoid terms and descriptions that reflecthow an organization perceives its products andservices. For this:
a) Use standard attributes.
b) Or involve customers in creating attributes.
11.2 The main attributes of concern are:
a) Image — overall beliefs/impressions, businesspractice ethics, social responsibility.
b) Expectations — from quality, service, life,reliability, availability, maintainability, cost perunit of availability, product and quality service
c)
d)
e)
11.3
parameters.
Satisfaction — To sum up perceived qualityand value versus expectations and idealperceptions including economic success, pricerepurchase.
Loyalty — Retention, intention to buy againsame and other products, intention torecommend to others, in contrast intention tochange.
Voice — Complaints; customer dialogue easyaccess and communication, satisfactory andtimely redressal.
The expectations (from a product or service). .could be fi-wtherclassified in terms of cme or more ofthe following parameters.
11.3.1 Product
a) Performance — primary — operatingcharacteristics.
b) Features — supplements, attributes,distinctiveness, differences.
c) Conformance — compliance with pre-established specifications, standards.
d) Aesthetics — appeal to the human senses,elegance, tastefulness.
e) Reliability — the ability to meet criteriaconsistently, dependability, trustworthiness.
f) Durabili~ — useful operating life, endurance,hardiness, toughness.
g) Maintainability — ease and convenience ofrepair/rectification.
h) Safety — safe operation of product or safedelivery of procedures.
j) Warranty provisions and implementation.
k) Value — perceived quality relative to price.
11.3.2 Service
a)
b)
c)
d)
e)
f-)
@h)
j)k)
m)
Promptness — timeliness of delivery,punctuality.
Responsiveness — ability to react to specificneeds, awareness, willingness, alertness.
Consideration — tact, recognition, regard,thoughtfulness, empathy.
Confidence — reputation, assurance, credence,dependability.
Value — perceived quality relative to price.
Competence
Access
Courtesy
Communication
Credibility
Security
n) Knowing the customer.,, ,
11.3.3 Process
a) Information — instructions, data, facts,knowledge, communications.
b) Product recall procedures — effective recallprocedures.
c) Value — perceived quality relative to price.
d) Perceived quality
e) Financial assistance
Q Sales procedures and experience
g) Billing process (accuracy and timeliness)
11.4 The elements should be clearly defined andunderstood after the purpose (or need) for obtainingcustomers’ perceptions (for example, desire to improvecustomer satisfaction, need to acquire more marketshare) What do you need to know to improve businessresults?
11.5 The total performance segments or factors areevaluated in two dimensions, namely:
a) Importance — How important is theperformance feature for the customer?
b) Satisfaction — How satisfied is the customerwith performance features?
11.6 These conclusions regarding overall performance
10

should also be considered with respect to competition.How does the competitor rate with respect to thisperformance feature?
12 QUESTIONNAIRE DEVELOPMENT
12.1 It is a complex job, to select the areas forincluding, and the sub-set of questions within thoseareas to provide sufficient detail to gain the knowiedgeone needs to improve business. If questionnaire lengthis a problem, the questionnaire could be divided intoseveral smaller questionnaires with a core set ofquestions to be asked to each respondent and a sub-set of the total questionnaire for different respondents.Questionnaires should be designed such that themaximum time to complete is less than 20 min (includesamples of sub-set questions).
12.2 Product and/or service being surveyed needs tobe clearly defined up front.
12.3 Scale of measurement needs to be clearly defined.It may depend upon how questions are worded. Forexample, if the question is a positive statement, suchas, ‘The service you received was satisfactory’, thenthe answers might be, ‘Strongly agree, agree, neitheragree nor disagree, disagree, strongly disagree’ thatis, a five point scale. Scale of measurement can besometimes on a six-point scale to prevent a customershow indifference to a particular characteristic. Ahigher-level scale up to 1“0can be used based on thecritically of the parameter being assessed for customersatisfaction.
12.4 Anonymity needs to be offered and guaranteed.
12.5 Selection of research organization to conductthe survey needs to be investigated. Time frame toconduct the survey needs to be appropriate and meetorganization needs. Selection of whom to survey, andhow to contact them needs to be accomplished.Methodology needs to be-determined like:
a) mail surveys,
b) phone interviews,
c) web-based, and
d) face-to-face interviews.
For survey design see Annex B.
13 ESTABLISHING VALIDITY ANDRELIABILITY OF QUESTIONNAIRE
13.1 Validity
Ability of an instrument to measure what it is designedto measure.
13.2 Face and Content Validity
a) Systematic evaluation of how well the contentof instrument represents the measurement taskat hand.
IS 15610:2006
b) Each item must have logical Iink with anobjective.
c) Items and questions cover full range of issue orattitude -being measured.
d) Coverage should be balanced eachlaspectshould have similar and adequaterepresentations in question.
e) Done by designer or panel of judges.
13.3 Reliability
Extend to which a scale produces consistent resultswhen repeated measurements are made.
13.3.:1 Test/Retest Reliability
Instrument is administered once and then again undersame or similar conditions at different timing. Thesame set of respondents complete the questionnaire.attwo different points in time to see how stable theresponses are. Degree of correlation (r) between twoset of responses gives questionnaire’s test—retestreliability. ‘
133.2 Parallel Form Reliability/A Iterative FormReliability
Two equivalent forms of scale/instruments areconstructed that measure the same issues. The samerespondents are measured at different time points andresults compared. Low correlation reflects poorreliability.
14 SAMPLING METHOD AND SIZE
14.1 First step is to identify a representative sampleof customers to be close to true value for accuracyand second is to fix appropriate sample size (numberof customers) to be surveyed or approached for feed-back for precision. With a reasonable organizationsfor the response. Assessing non-respondents througha sample is worth while in improving validity andaccuracy of estimates.
14.2 Customers can be stratified on the basis of factorsincluding (The list is not exhaustive)
a) Exposure of product to environmenticlimate;
b) Knowledge about the product;
c) Size (individual, retailer, wholesaler;organization);
d) Degree of usage;
e) Expectations/affordability;
t) Attitude (tolerant/complaining);
g) Gender/age of customers; and
h) Geographical boundaries.
14.3 In a given situation the customers may beclassified into at least three levels of each of the factorsconsidered above. The weighted sample may be taken
11

IS 15610:2006
from these strata depending upon the expected numberof customers in each strata to constitute a sample ofonly 100 to 250/400 by striking a balance on costand desired accuracy. Where population of customers,is less than 100, complete enumeration may beworth it.
14.4 These sampled customers should be visitedpersonally with prior appointment, a standardquestionnaire developed for the purpose to elicit theirsatisfaction and reasons for disenchantment. This pro-active approach is worth its effort, by a competentperson who can examine the condition of the productin service and elicit information and minor and major
\
Influence byinterviewer
>
Rate of returns\
Informationquality
>
Question scope>
=2Timerequirements
Customergroups
/
Written
interview
problems faced if any and his expectations to dtwelopfuture models. A sample of one hundred maybe goodenough for most purposes.
14.5 For economic considerations the questionnairemay be mailed and non-respondents contacted onphone, and the remaining non-respondents visited.However, this is bound to give rise to more errors anddilute effectiveness. The sample size shall need to beaugmented, however not beyond 250/400.
15 METHODS OF INTERVIEW
The various interview forms and the forms ofinvestigation are given in-the Fig. 7 and 8.
No factor
Relatively low whenunannouncedor withoutincentive
No control over whofills out questionnaireand how questionnaireis filled out.
Severely limited
rRelatively high
All
“Low
uTelephoneinterview
Possiblefactor butcontrollable
Very good
Well suited both forqualitative andquantitative questionsNo optical aids possible
Not possible to posequestionswith multipleresponses
Can be performedrapidly
All
Medium
Personal
interview
I
1Always a factor andless controllable
,,,
Particularly good forqualitative questionsvery good info onconfidential areas
Virtually unlimited canalso be extended indiscussions
Large and importantcusomers with goodconnections
Large and importantcusomers with goodconnections
Very high
FIG.7 INTERVIEWFoam
12
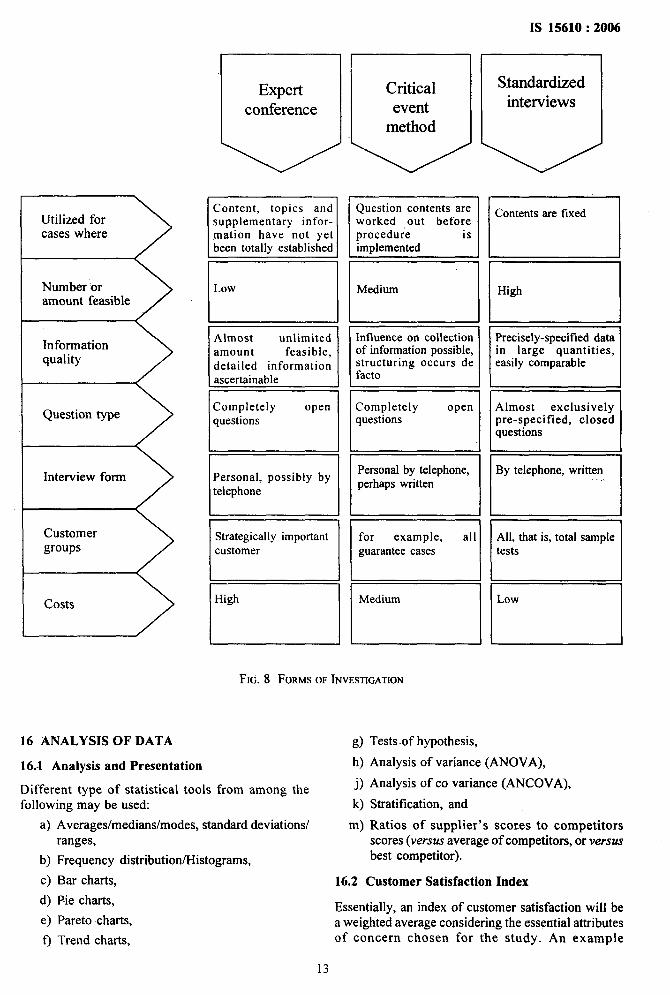
IS 15610:2006
Utilized forcases where >xNumber oramount feasible
Informationquality
Question type
Interview form
--?
Customergroups
costs
Expertcotierence uCritical
eventmethod JStandardized
interviews
Content, topics and Question contents are Contents are fixedsupplementary infor- worked out before I
Low
Almost unlimitedamount feasible,detailed informationascertainable
Completely openquestions
Personal, possibly bytelephone
Strategically importantcustomer
for example, allguarantee cases
FIG.8 FormmOF INVESTIGATION
16 ANALYSIS OF DATA
16.-1 Analysis and Presentation
Different type of statistical tools from among thefollowing may be used:
a)
b)
c)
d)
e)
9
Averageslmedianslmodes, standard deviationsranges,
Frequency distribution/Histograms,
Bar charts,
Pie charts,
Pareto charts,
Trend charts,
High
Precisely-specified datain large quantities,easily comparable
Almost exclusivelypre-specified, closedquestions
By telephone, written
?3)h)
j)
k)
m)
Tests of hypothesis,
Analysis of variance (ANOVA),
Analysis of co variance (ANCOVA),
Stratification, and
Ratios of supplier’s scores to competitorsscores (versus average of competitors, or versusbest competitor).
16.2 Customer Satisfaction Index
Essentially, an index of customer satisfaction will bea weighted average considering the essential attributesof concern chosen for the study. An example
IS 15610:2006
calculation of Customer Satisfaction Index for fourwheeler servicing is given in Annex C.
16.3 Reports
The reports should be tailored for the needs of theaudience, which should include summaries,conclusions, and recommendations and includecomments on organization scores relative tocompetitors’ scores.
17 WHAT LEVEL OF SATISFACTION ISSATISFACTORY?
17.1 Each organization will make its own decisionabout the level of satisfaction that would be deemedacceptable and at what level remedial action will needto be -taken. Furthermore, action benchmarks maybeset either internally or with reference to externalcomparisons. One broad indicator of satisfaction,which is normally used, is as under:
a) 80 percent or more customers are satisfied,and
b) 10 percent or fewer customers are dissatisfied.
17.2 Whilst this can be a usefhl ‘rule of thumb’, it isimportant to check for any differences in the level of
customer satisfaction by:
a) Customer Groups — (for example, repeatcustomers versus one-off buyers, small versuslarge buyers, gender of buyer, Iocation ofpurchase, branch of purchase, age of buyers.)It is important to ensure that all types ofcustomers are being satisfied because theoverall satisfaction figure could be hiding anumber of customer sub-groups who areless than satisfied with the product.
b) Product Dimension — (for example, price,quality) Is the level of satisfaction uniformlyhigh across different product dimensions or arecustomers satisfied with, for example, qualityof the product but not delivery and after-salesservice.
Checking and analyzing for any differences insatisfaction across customer groups and productdimensions is a usefid strategic tool in itself, regardlessof whether or not one is doing so for the purposes ofmeeting the requirements of the standard. Emphasisshould be on reasons of dissatisfaction and reducingthe gap between maximum possiblescore assigned andscore obtained.
,,
14
IS 15610:2006
ANNEX A
(Clause 9.8)
A FEW OTHER TOOL!YTECHNIQUES USED FOR DETERMINING4.XSTOMER SATISFACTION—
S1No. Too[/Technique Description
i) Advisory group It is a volunteer group of customers. The main purpose ofadvisory group is to:
a)
b)
c)
d)
e)
Provide idea for technical or service innovations,
Detail dissatisfies,
Test products or services,
Represent wide range of inputs, and
Act as Ambassadors of the organization.
ii) Focus groups Focus groups consists 6 of 12 well-selected customers gatheredfor a specific purpose.
Focused interview is one-to-one telephone interview or face-to-face interview with the same mission.
Focus group members are not randomly chosen. Theirconclusions are to be tested over a broad stratifmd randomsample.
Focus groups are an effective way of evaluating and refining arange of design concepts and prototypes, to encourage anexternalization of the decision making process.
However, they can also provide valuable insights into perceptions,,, ,
and preferences of existing or competitive products and can bea useful way of exploring new requirements and desires.
The
a)
b)
c)
purpose of the focus group:
Invent the future — Customer brainstorm about futureservices and products: ( groups while using or after usingthe producthervice).
Stratification — Customers defines the nuances ofsatisfiers and dissatisfies.
Pricing — Customers give feedback on process versus
iii) Complaint tracking
v) Lead user analysis
features.
d) Ad-hoc problem — Customers provide ideas on how toresolve product or service issues.
It is a mechanism to register complaint by a customer and itsfollow up. Organizations can keep toll free telephone numbersfor customers to call and express their complaints andcompliments.
iv) Customer value maps A customer value map compares price and quality, which arerelated, to give customer — perceived value.
Customers have a perception of the relative quality of productsor services and their relative price.
Lead users are an extremely valuable cluster of customers andpotential customers who can contribute to identification of futureopportunities’ and evaluation of emerging concepts.
15
IS 15610:2006
S1No. Tool/Technique Description
Understanding these users can provide richness of informationrelatively efficiently. The concept of’ Lead Users’ was introducedby Eric von Hippel in the mid 1980s. He defined the lead user asthose users who display the following two characteristics:
a) They face the needs that will be general in the market place,but face them months or years before the bulk of that marketplace encounters them.
b) They are positioned to benefit significantly by obtaining asolution to those needs.
vi) Stakeholder analysis —Iifecycle approach
vii) Delphi technique
viii) Contextual enquiry
A simple tool to encourage the design team to consider the needsof all people who may be influenced by design decisions, bothwithin and without the organization.
This approach helps to focus attention on the needs of the criticalstakeholders and a range of potential downstream issues.
It is often difficult to identi~ who the critical stakeholders are,particularly in complex distribution chains where the end usermay not be the same person as the person who specifies therequirement or signs the purchase requisition.
Furthermore, there may be tensions between the needs of differentsets of stakeholders. It is thus beneficial to formally consider thedifferent.groups and types of stakeholders who will be influencedby the product design, throughout the product’s Iifecycle.
An excellent tool for gaining input from recognized sources.ofexpertise, without the need for face-to-face meetings. It providesa highly disciplined way of addressing or solving a problem. Itcan be time consuming and the information gained is only asgood as the selection of the experts.
The Delphi technique uses a highly structured and focusedquestionnaire approach in order to establish a consensus opinionfrom ‘experts’. Recognizing that these experts may begeographically dispersed, it was designed to be conducted by post,although this does not preclude its use in face-to-face interviews.
The method is iterative, and first-aims to obtain a broad range ofopinions ffom the target group.
The results of the initial survey are collated, summarized andthen form the basis of a second, follow on questionnaire. Resultsfrom the second questionnaire inform a third and finalquestionnaire.
A hybrid between face-to-face interviews and observations, wherethe customer and the researcher are equal partners in investigatingand understanding the usage of a product. It is a powerfid approachto gaining rich information, but complex and time consuming.
A specific name for a style of user interview, conducted withinthe context of the customer’s activities. This approach enablescombining the benefits of observational approaches and thestandard face-to-face interview. It is intended to be an interactiveexploration of the issues, hence the reason for being called enquiryrather than interview.
16
IS 15610:2006
S1 No. Tool/Technique Description
The main difference between the contextual enquiry and thetraditional interview is that the enquiry demands a partnershipbetween customer and product development team. The productdevelopers bring special product knowledge, and the customersbring special knowledge about his or her job or specific needs.Both can be viewed as experts and the enquiry is a joint searchfor information.
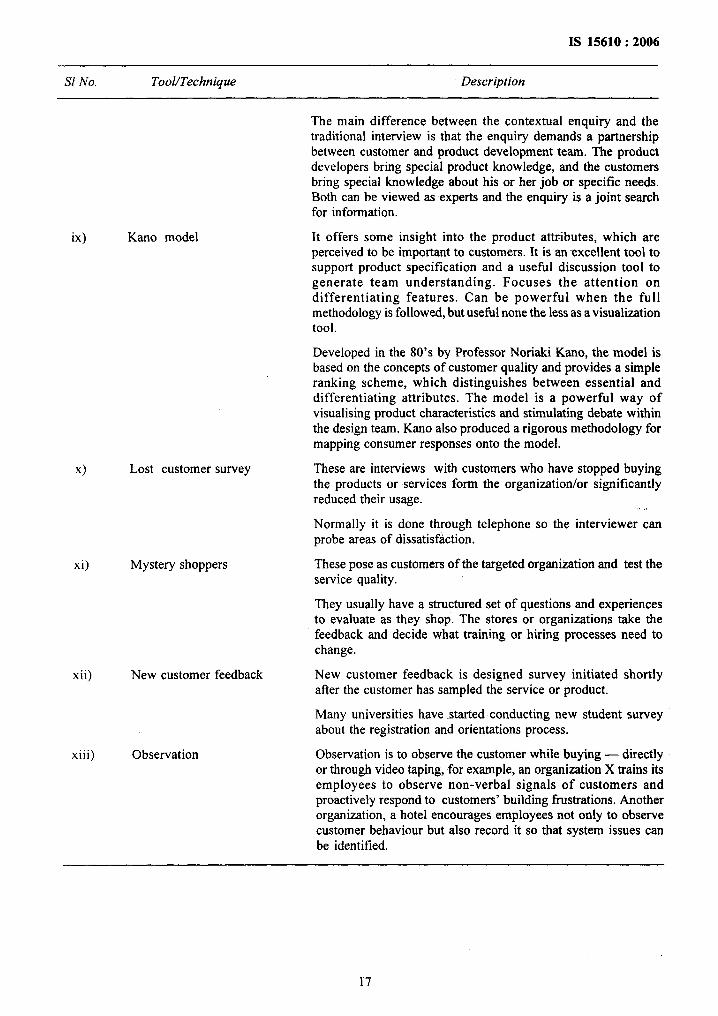
ix) Kano model It offers some insight into the product attributes, which areperceived to be important to customers. It is an excellent tool tosupport product specification and a useful discussion tool togenerate team understanding. Focuses the attention ondifferentiating features. Can be powerful when the fullmethodology is followed, but usefhl none the less as a visualizationtool.
Developed in the 80’s by Professor Noriaki Kane, the model isbased on the concepts of customer quality and provides a simpleranking scheme, which distinguishes between essential anddifferentiating attributes. The model is a powerful way ofvisualizing product characteristics and stimulating debate withinthe design team. Kano also produced a rigorous methodology formapping consumer responses onto the model.
x) Lost customer survey These are interviews with customers who have stopped buyingthe products or services form the organization/or significantlyreduced their usage. ,,, ,
Normally it is done through telephone so the interviewer canprobe areas of dissatisfaction.
xi) Mystery shoppers These pose as customers of the targeted organization and test theservice quality.
They usually have a structured set of questions and experiencesto evaluate as they shop. The stores or organizations take thefeedback and decide what training or hiring processes need tochange.
xii) New customer feedback New customer feedback is designed survey initiated shortlyafter the customer has sampled the service or product.
Many universities have started conducting new student surveyabout the registration and orientations process.
xiii) Observation Observation is to observe the customer while buying — directlyor through video taping, for example, an organization X trains itsemployees to observe non-verbal signals of customers andproactively respond to customers’ building frustrations. Anotherorganization, a hotel encourages employees not only to observecustomer behaviour but also record it so that system issues canbe identified.
17
IS 15610:2006
ANNEX B
(Clauses 12.5)
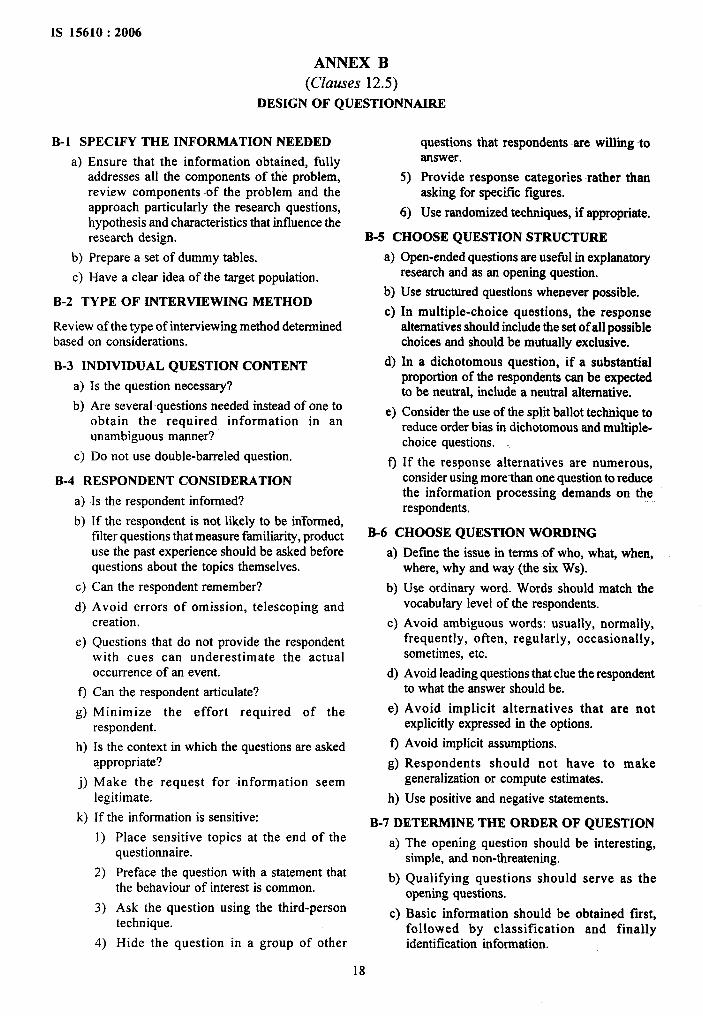
DESIGN OF QUESTIONNAIRE
B-1 SPECIFY THE INFORMATION NEEBED
a) Ensure that the information obtained, fullyaddresses all the components of the problem,review components -of the problem and theapproach particularly the research questions,hypothesis and characteristics that influence theresearch design.
b) Prepare a set of dummy tables.
c) Have a clear idea of the target population.
B-2 TYPE OF INTERVIEWING METHOD
Review of the type of interviewing method determinedbased on considerations.
B-3 INDIVIDUAL QUESTION CONTENT
a) Is the question necessary?
b) Are several questions needed instead of one toobtain the required information in anunambiguous manner?
c) Do not use double-barreled question.
B-4 -RESPONDENT CONSIDERATION
a)
b)
c)
d)
e)
0
g)
h)
j)
Is the respondent informed?
If the respondent is not likely to be informed,filter questions that measure familiarity, productuse the past experience should be asked beforequestions about the topics themselves.
Can the respondent remember?
Avoid errors of omission, telescoping andcreation.
Questions that do not provide the respondentwith cues can underestimate the actualoccurrence of an event.
Can the respondent articulate?
Minimize the effort required of therespondent.
Is the context in which the questions are askedappropriate?
Make the request for information seemlegitimate.
k) If the information is sensitive:
1)
2)
3)
4)
Place sensitive topics at the end of thequestionnaire.
Preface the question with a statement thatthe behaviour of interest is common.
Ask the question using the third-persontechnique.
Hide the question in a group of other
questions that respondents -are willing -toanswer.
5) Provide response categories rather thanasking for specific figures.
6) Use randomized techniques, if appropriate,
B-5 CHOOSE QUESTION STRUCTURE
a) Open-ended questions are usefid in explanatoryresearch and as an opening question.
b) Use structured questions whenever possible.
c) In multiple-choice questions, the responsealternatives should include the set of all possiblechoices and should be mutually exclusive.
d) In a dichotomous question, if a substantialproportion of the respondents can be expectedto be neutral, include a neutrrd alternative.
-e) Consider the use of the split ballot technique toreduce order bias in dichotomous and multiple-choice questions.
0 If the response alternatives are numerous,consider using more-than one question to reducethe information processing demands on the,.respondents.
B-6 CHOOSE QUESTION WORDING
a)
b)
c)
d)
e)
9
g)
Define the issue in terms of who, wha~ when,where, why and way (the six Ws).
Use ordinary word. Words should match thevocabulary level of the respondents.
Avoid ambiguous words: usually, normally,frequently, often, regularly, occasionally,sometimes, etc.
Avoid leading questions that clue the respondentto what the answer should be.
Avoid implicit alternatives that are notexplicitly expressed in the options.
Avoid implicit assumptions.
Respondents should not have to make
h)
generalization or compute estimates.
Use positive and negative statements.
B-7 DETERMINE THE ORDER OF QUESTION
a) The opening question should be interesting,
b)
c)
simple, and non-threatening.
Qualifying questions should serve as theopening questions.
Basic information should be obtained first,followed by classification and finallyidentification information.
18

d) Difflcul~ sensitive, or complex questions shouldbe placed late in the sequence.
e) General questions should precede the specificquestions.
~ Questions should beaskedi nalogicalorder.
g) Branching questions should be designedcarefully to cover all possible contingencies.
h) The question being branched should be placedas close as possible to the question causing thebranching, and the branching questions shouldbe ordered so that the respondents cannotanticipate what additional information will berequired.
k-8 FORM AND LAYOUT
a) Divide a questionnaire into several parts.
b) Questions in each part should be numbered.
c) The questionnaire should be pre-coded.
d) The questionnaires themselves should benumbered serially.
B-9 REPRODUCE THE QUESTIONNAIRE
a)
b)
c)
d)
e)
f)
g)
B-10
a)
b)
c)
d)
e)
9
The questionnaire should have a professionalappearance.
A booklet format should be used for longquestionnaires.
Each question should be reproduced on a singlepage (or double-page spread)
Vertical response columns should be used.
Grids are usefid when there are a number ofrelated questions that use -the same set ofresponse categories.
The tendency to crowd questions to make thequestionnaire look shorter should be avoided.
Directions or instructions for individualquestions should be placed as close to thequestions as possible.
PRETEST
Pretesting should always be done.
All aspects of the questionnaire should betested, including -questions content, wording,sequence, form and layout, question difllculty,and instructions.
The respondents in the pretest should be similarto those who will be included in the actualsurvey.
Begin the pretest by using personal interviews.
The pretest should also be conducted by mailor telephone if those methods are to be used inthe actual survey.
A variety of interviewers should be used forpretests.
19
IS 15610:2006
g) The pretest sample size is small, varying from15 to 30 respondents for the initial testing.
h) Use protocol analysis and debriefing to identifiproblems.
j) After each significant revision of the.questionnaire, another pretest should beconducted, using a different sample ofrespondents.
k) The responses obtained horn the pretest shouldbe coded and analyzed in terms of
1)
2)
3)
4)
5)
6)
Who wanted it?
What was the scope?
When: Day, hour, date of observation?
Where: Inside the store, at the checkbutcounter, in a particular department withinthe store?
Why: Influence of price, brand name,package size, promotion, family memberson the purchase?
Way: Personal observer disguised as salesclerk, undisguised personal observer, hiddencamera, and obtrusive mechanical device.
B-11 CONSIDERATIONS IN PRETEST
The prototype of the questionnaire is administratedon a small sample of respondents. A number of factorsare checked out at this stage.
a)
b)
c)
d)
e)
o
13)
h)
j)
k)
m)
Whether the respondent understands all thequestions.
The time taken to administer the entirequestionnaire.
Whether certain words in the questions needexplanation.
Whether the respondent interprets the questioncorrectly.
Whether there is tendency for the respondentto mark out categories like ‘don’t know’, etc,more frequently. To narrow the choice, certainoptions might have to be dropped.
Does the opening question generate interest?
Does the fatigue effect creep in very early inthe questionnaire?
Is the respondent embarrassed about certainquestions?
Does he require to think a lot to answer thequestion?
A~e there many open questions taking a lot oftime?
Are there any unnecessary questions?
The deficiencies in the questionnaire are ironed out inthe pretest stage. The questionnaire designed by youcould be administered on a pilot sample forunderstanding the questioning process better.
1S 15610: 2006
ANNEX C
(Clause 16.2)
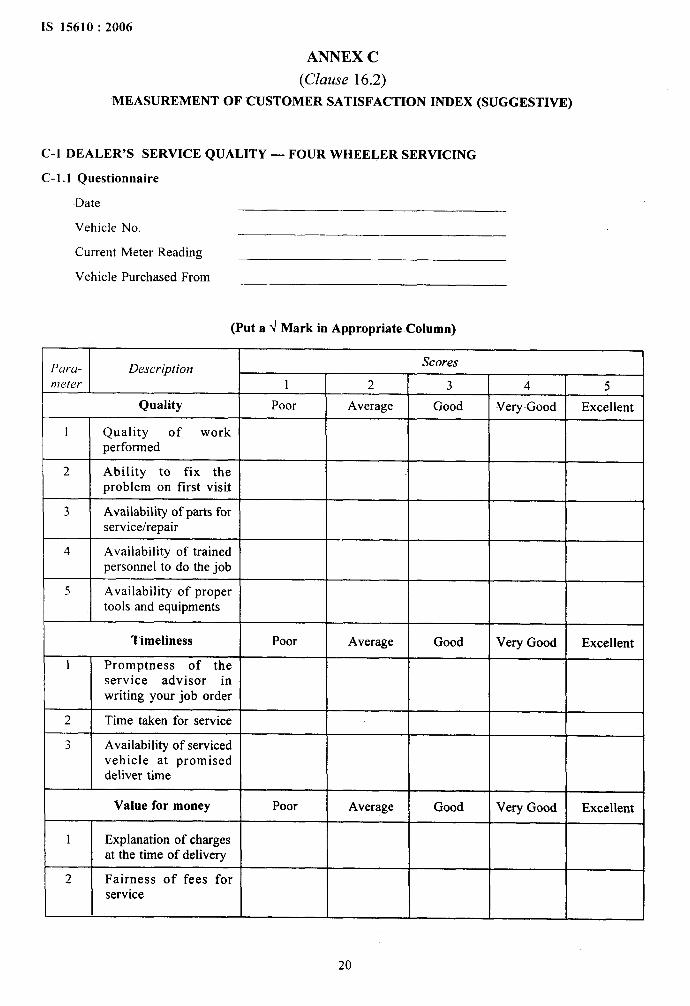
MEASUREMENT OF CUSTOMER SATISFACTION INDEX (SUGGESTIVE)
C-1 DEALER’S SERVICE QUALITY — FOUR WHEELER SERVICING
C-1.1 Questionnaire
Date
Vehicle No.
Current Meter Reading
Vehicle Purchased From
(Put a ~ Mark in Appropriate Column)
Puru- DescriptionScores
meter 1 2 3 4 5
Quality Poor Average Good VeryGood Excellent
1 Quality of workperformed
2 Ability to fix theproblem on first visit
3 Availability of parts forserviceh-epair
4 Availability of trainedpersonnel to do the job
5 Availability of propertools and equipments
Timeliness Poor Average Good Very Good Excellent
1 Promptness of theservice advisor inwriting your job order
2 Time taken for service
3 Availability of servicedvehicle at promiseddeliver time
Value for money Poor Average Good Very Good Excellent
I1 Explanation of charges
at the time of delivery
2 Fairness of fees forservice
20

1S 15610: ~006
Para- DescriptionScores
meter 1 2 3 4 5
.Definitely Probably ‘May or Probably DefinitelyImage not not may not Recommend Recommend
Recommend Recommend Recommend
1 Will you recommendthis dealer to yourfriends
2 Based on your mostrecent experiencewould you like to comego back to the samedealer
Housekeeping Poor Average Good Very Good Excellent
1 Cleanliness andappearance of servicearea and workshop
2 Cleanliness andappearance of customerlounge
3 Cleanliness -andappearance of frontoffice
,,
Personnel Behaviour Poor Average Good Very Good Excellent
1 Helpfulness of serviceadvisor in listening toyour needs
2 Understanding of thespecific problem withyour vehicle %
3 Courtesy extended -inserving you
4 Helpfulness of spareparts department inproviding spare partsfor service
21
IS 15610:2006
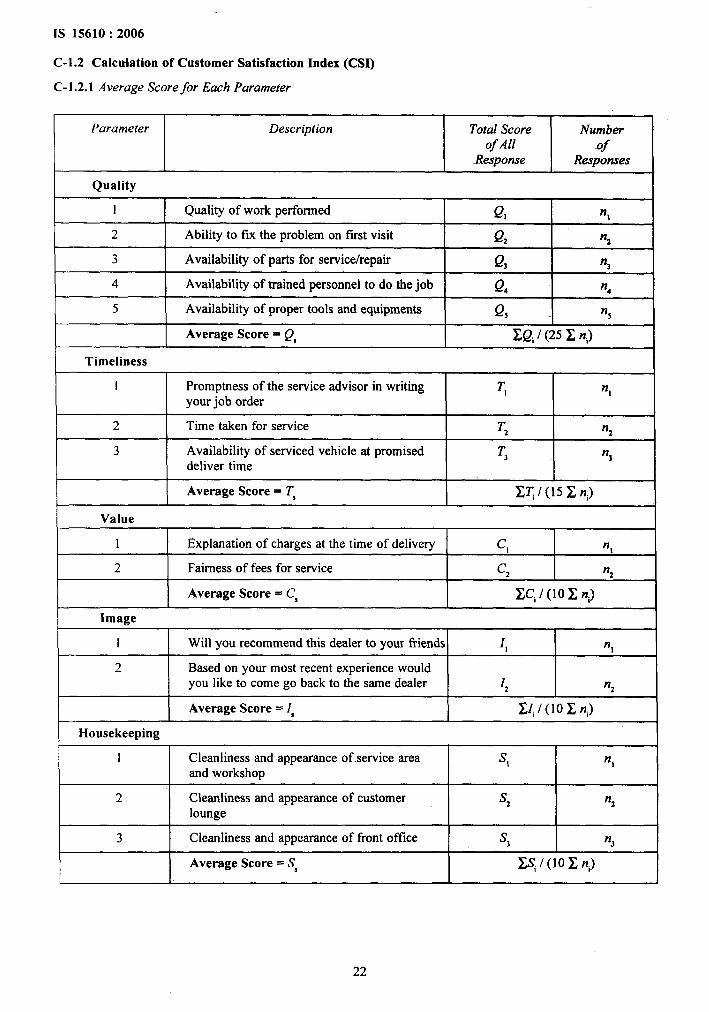
C-1.2 Calculation of Customer Satisfaction Index (CSI)
C-1.2.1 Average Score for Each Parameter
,Parameter Description Total Score Number
of All of.Response Responses
Quality
1 Quality of work performed Q, %
2 Ability to fix the problem on fust visit Q, 332
3 Availability of parts for service/repair Q, n3
4 Availability of trained personnel to do the job Q, n,
5 Availability of proper tools and equipments Q, %
Average Score = Q, Z.Qi / (25 Z ni)
Timeliness
1 Promptness of the service advisor in writing T, n,your job order
2 Time taken for service ‘Tznz
3 Availability of serviced vehicle at promised T,deliver time
%
Average Score = T, x~/(15zni).
Value
1 Explanation of charges at the time of delivery c1 n,
2 Fairness of fees for service c,nl
Average Score = C, XCi/(lOXni)
Image
1 Will you recommend this dealer to your friends I, n,
2 Based on your most recent experience wouldyou like to come go back to the same dealer 12 %
Average Score = I, xzi/(lozni)\
Housekeeping
1 Cleanliness and appearance of service area s, %and workshop
2 Cleanliness and appearance of customer S2 n2lounge
I 3 I Cleanliness and appearance of front office I S3 I n31 1 ,
Average Score = S, .Xi /(lO-z n,)
22

Parameter Description Total Score Numberof All of
Response Responses
Personnel Behaviour
1 HelpMness of service advisor in listening to P, n,your needs
2 Understanding of the specific problem with P2 nzyour vehicle
3 Courtesy extended in serving you P,n3
4 Helpfulness of spare parts department in P, n4providing spare parts for service
[Average Score = P, ZP, / (20 z n,)
C-1 .2.2 Weighted Scores
Weighted scores for each parameter is calculated as follows:
Parameter Average Score I Weights I Weighted Scores
Quality Q, w, w, Q,
Timeliness T,W2
W2 T,
Value c, w,,,,,
W3C,
Image 1, W4 W41,
Housekeeping s, Ws W5S,
Personnel behaviour P,‘6
W6P,
CSI = w,Q, + W2T,+ Wlc, + W4]~ + w& + w,f’,
NOTES
I The weights are to be assigned based on the importance of the parameter.
2 w,+w2+w3+ w4+w$+w6= loo.
C-1 .2.3 Customer Satisfaction Index (CSI)
The customer satisfaction index (in percent) is the sum af weighted scores for all the parameters.
CSI (percent)= WIQ,+ WZT,+ WJC,+ w,l, + w~S, + WCP,
23

IS 1561 O: ZOO6
ANNEX D
(Foreword)
COMMITTEE COMPOSITION
Statistical Methods for Quality and Reliability Sectional Committee, MSD 3
Organization
Indian Statistical Institute, New Delhl
Bharat Heavy Electrical Ltd, New Delhi
Birla Celhslosic, Bharuch
Continental Devices India Ltd, NewDelhi
Defence Research and Development Organization, Laser Scienceand Technology Centre, Delhi
Dhectorate General Quality Assurance, Krmpur
Electronics Regional Test Laboratory (North), New Delhi
Indian Agricultural Statistics Research Institute, New Delhi
Indian Association for Productivity Quality and Reliability, Kolkata
Indian Institute of Management LucknowIndian Institute of Management, KozMkodeMaruti Udyog Limited, GurgaonNewage Electrical India Ltd, PuneNational Institution for Qurdity and Reliability (NIQR), New Delhi
Polyutrusions Private Limited, Kilpauk
POWERGRID Corporation of India Ltd, New Delhi
Reliance Industries Limited, Surat
Samtel Color Ltd, New DelhiSona Koyo Steering Systems Ltd, Gurgaon
SRF Limited, -ManaIiTata Motors Ltd, Jamshedpur
In personal capacity (B-109, Malviya Nagar, New Delhi 11001 ?)In personal capacity (20/1, Krishna Nagar, Safdarjung Enclave,
New De/hi 110029)BIS Directorate General
Representative(s)
DR ARVrNOSEIH (Chdrnm)PROFS. R. MOWN (Alternate)
SHRSS.N.JHASHRIA.V. KIUSHNAN(Alternate)
SHRIvAIOYANAIW41i
SHIOSANSESVSAOAVARTI(Alternate)Sr-nuNAVSNKAPUR
SssruVrPuLGUFTA(Alternate)DR ASHOKKUMAR
Smu S. K. SSUVASTAVALT. Co L. C. P. VUAYAN (Alternate)
SrsruS. K. KxMoTHISHSUR. P. SONOHI(Alternate)
DRV. K. GUFTASrnuV. K. BHATIA(Afternate)
DR BISWANATHDAS
DR DEBASRATARAY (Alternate)PROFS. &WMBORTV
DRR. P. SUM?SHSsrrrrR. B. MAD~SmuNrrINGHAMANDISr-rrrrG. W. DATEY
SrsruY. K. BHAT(Aftemate)SHFUR PATTALU
Smu S.MVENKATPrMSAO(Alternate)Smu K. K. AGARWAL
SruuDHANANJAYCILUCRMORTY(Alternate)
DR S. ARVSNOANATH
Smu A. K. BNATNAGAR(Alternate)SHRIS. R. PRASAO
SHIUKIRAN DE5KhiUIOi
W-m DrNSSHK. Srmsrm (Alternate)SHSUC. DESIGAN
sHro SHANTISARUF
SrnuA. KUMAR(Alternate)PROFA. N. NANKANA
SHRSD. R. SSN
SHRIP. K. GAMRHIFLScientist ‘F’and Head (MSD)~epresenting Director General (&o@cioMerrrber)]
Member”SecretarySHRIL.MJTMEHTA
Joint Director (MSD), BIS
24
(Continuedfrom second cover)
The overall aim is to enhance customer satisfaction. Its measurement helps to:
a) assesses performance from the customer’s viewpoint; and
b) provide a platform for strategic alignment of organizational resources to deliver whatever is most importantto customers.
Used effectively and strategically, customer satisfaction measurement can be a management information systemwhich continuously captures the voice of the customer.
The composition of the Committee responsible for the formulation of this standard is given in Annex D.

Bureau of Indian Stastdards
-BIS is a statutory institution established under the Bureau of Indian Standard Act, 1986 to promoteharmonious development of the activities .of standardization, marking and quality certification of goods andattending to connected matters in the country.
Copyright
BIS has the copyright of all its publications. No part of these publications may be reproduced in any formwithout the prior permission in writing of BIS. This does not preclude the free use, in the course of implementingthe standard, of necessary details, such as symbols and sizes, type or grade designations. Enquiries relating tocopyright be addressed to the Director (Publications), BIS.
Review of Indian Standards
Amendments are issued to standards as the need arises on the b%sisof comments. Standards are also reviewedperiodically; a standard along with amendments is reaffirmed when such review indicates that no changes areneeded; if the review indicates that changes are needed, it is taken up for revision. Users of Indian Standardsshould ascertain that they are in possession of the latest amendments or edition by referring to the latest issue of‘BIS Catalogue’ and ‘Standards: Monthly Additions’.
This Indian Standard has been developed from Dot: No. MS13 3 (164).
Amendments Issued Since -Publication
Amend No. Date of Issue Text Affected
BUREAU OF INDIAN STANDARDS
Headquarters:
Manak Bhavan, 9 Bahadur Shah Zafar Marg, New Delhi 110002Telephones: 23230131,23233375,2323 9402 website : www.bis.org.in
Regional Offices: Telephones
Central :
Eastern :
Northern :
Southern :
Western :
Branches :
Manak Bhavan, 9 Bahadur Shah Zafar Marg{
23237617NEW DELHI 110002 23233841
1/14 C.I.T. Scheme VII M, V.I.P. Road, Kartkurgachi{
233’78499,23378561KOLKATA 700054 23378626,23379120
SCO 335-336, Sector 34-A, CHANDIGARH 160022{
26038432609285
C.I.T. Campus, IV Cross Road, CHENNAI 600113{
22541216,2254144222542519,22542315
Manakalaya, E9 MIDC, Marol, Andheri (East){
28329295,28327858MUMBAI 400093 28327891,28327892
AHMEDABAD. BANGALORE. BHOPAL. BHUBANESHWAR. COIMBATORE. FARIDABAD.GHAZIABAD. GUWAHATI. HYDERABAD. JAIPUR. KANPUR. LUCKNOW. NAGPUR.NALAGARH. PATNA. PUNE. RAJKOT. THIRUVANANTHAPURAM. VISAKHAPATNAM.
i
Printed at Simco Printing .Press, Delhi