iron metabolism md, ii, md, human body shows great - blood
TRANSCRIPT
IRON METABOLISM
UTILIZATION OF INTRAVENOUS RADIOACTIVE IRON
By CLEMENT A. FINCH, M.D., JOHN G. GIBSON II, M.D., WENDELL C. PEACOCK,
PH.D., AND REX G. FLUHARTY, PH.D.
T HE HUMAN body shows great economy in its handling of iron. Only small
amounts of iron arefound in the excreta, and these amounts cannot be ap-
preciably increased through loading body iron stores by oral ingestion,’ by paren-
teral iron administration2 or by multiple blood transfusions.3 These observations
imply that iron is rigidly conserved by the body and that no attention need be
directed toward excretion of iron in the absence of blood loss. This conservation
serves to emphasize the importance of the metabolic cycle in the body where iron
is reused again and again for hemoglobin formation.
With the exception of the red cell iron, any estimate of the distribution of iron
in man is at best an approximation because of the difficulty in separating tissue from
hemoglobin iron. Circulating erythrocytes account for the largest mass of body
iron, some 2. to 3 grams. This includes all erythrocytes in the body other than those
developing in the bone marrow, since there appear to be no reserve depots of
erythrocytes.4 From analogy with animal data,5 tissue iron available for hemo-
globin production is perhaps one-fourth as much. Myoglobin, cell enzyme iron,
and fixed tissue iron represent even smaller fractions whose iron turnover is not
known. However, the work of Hahn and Whipple would indicate that myoglobin
iron remains relatively constant despite marked changes in red cell and storage
iron.6
The following studies were undertaken to determine the dynamic relationship
between storage and circulating iron in normal subjects and in patients with a
variety of hematologic disorders. When single tracer doses of radioactive iron
(Fe55 and Fe59) are given intravenously in man, �he radioiron rapidly enters the
hemoglobin cycle and “tagged” erythrocytes begin to appear in the circulation
within twenty-four hours. Thereafter, the radioactivity of circulating red cells
rises and reaches a plateau in from two to three weeks. Similar findings have been
reported by Dubach, Moore, and Minnich.7 This procedure appears to offer a
method of measuring the participation of injected iron in the hemoglobin cycle.
In the subsequent discussion the term utilization curve refers specifically to the
utilization of the injected radioiron for hemoglobin production.
METHODS
The preparation of the two isotopes employed (Fc’5and Fe59) by bombardment in the Massachusetts
Institute of Technology cycletron, the separation of the isotopes from the targets and synthesis of the
From the Department of Medicine, Harvard Medical School, and the Medical Clinic, Peter Bent
Brigham Hospital, Boston, Massachusetts, Radioactivity Center, Department of Physics, Massachusetts
Institute of Technology, Cambridge, Mass.
This work was supported by a grant from the United States Public Health Service.
905
For personal use only.on January 5, 2019. by guest www.bloodjournal.orgFrom
Subje�Num- RBC Hgb Hct MCV MCH MCHC Retics
I. Normal Group
8 5.1 14.a. 41.5 84 a.8 33 1.5
9 5.5 i6.a. 49.a. 89 a.9 33 .8
10 5.1 15.5 46.0 90 31 34 .6
�8 4.8 14.1 44.1 91 a.9 32. .8
87 �.6 ,6.o 46.5 8a. a.3 34 1.3
9’ 5.5 15.7 44.0 8o a.9 36 i.6
9a. 4.9 15.1 44.0 88 31 34 .9
93 5.1 45.5 88 30 33 1.1
94 4.8 14.6 44.0 91 30 33 1.5
Miscellaneous
71 4.13 11.5 35.4 86 a.8 3a. 1.3
4a. 16.3 50.3 91 a.9 3a. .7
43 4.39 13.1 41.0 96 30 31 .9
II. Iron Deficiency
10 1.48 7.4 2.4.5 99 30 30 17.3
5 3.’ 8.6 a.6.i 84 a.8 33 3.2.
19 a..68 8.7 a.8.3 io6 33 31 l.a.
a.6 3.48 6.3 a.5.0 7a. i8 a.5 7.7
a.4 2.92. 8.� a.8.7 98 2.9 30 5.3
7 3,33 5.3 a.4.4 73 ,6 a.a. a..’ -111. Hemochromatosis
io8 4.Ia. 13.7 38.8 94 33 35 .9
86 4.86 15.4 47.5 98 3a. 32. i.6
83 3.85 11.4 36.3 94 32. 34 .8
IV. Refractory Anemia
II 3.74 11.0 35.2. 94 30 31 .75
14 a..0 6.7 a.O.4 ioa. 33 33 2.7
66 3.32. 9.3 a.7.4 83 a.8 34 1.5
V. Uremia
4.2.
a..I3
3.35�
a.. a.8
12.5
7.2.
‘I.,
6.2.
6.3
44 5.1 14.9 44.2. 87 2.9
57 4.7’ 13.1 40.0 8� 2.8
i8 ia..8 87 2.8
a.7 3.62. 11.0 35.6 98 31
46 4.76 13.9 43.8 9a. 2.9
17 4.11 11.1 40.2. 98 2.9
69 4.58 12.2. 40.0 87 2.7
47 3.67 9.9 33.8 92. 2.7
936
TABLE I
a.9
4’
6a.
‘514
39.7 95 30
a.a..8 107 34
31.5 97 33
a.,.o 8a. a.6
a.o 88 a.8
VI. Infection
31 1.0
3’ 5.’
34 1.0
32. 2.1
31 2.1
34 1.1
33 ‘.433 1.0
3’ ‘932. s.6
30 1.5
30
a.9 3.9
For personal use only.on January 5, 2019. by guest www.bloodjournal.orgFrom
Subje�tNum- RBC Hgb Hct MCV MCH MCHC Retics
VII. Hemolytic Anemia
40 .97
5a. I.a.9
a. 3.3a.
75 i.8i
.99
3.7
8.o
9.8
�.8
3.6
,a..8 13a.
a.4.3 98
31.0 93
� io8
10.5 io6
40
3a.
a.9
3a.
36
a.9
33
31
30
34
38.0
3.6
7.0
8.6
a..o
VIII. Pernicious Anemia
49 .67 a..9 9 34 43 3a..a.
55 1.48 5.0 i6.a. 109 34 3’
53 3.14 10 30.1 96 31.9 33.2.
lx. Malaria
.4
a..0
1.1
a.8 4.3 11.9 38.8 90 a.8
51 3.49 10.5 35 100 31 31
64 4.77 13.0 4a. 88 a.7 31
8o (IC) 42.
X. Malignancy
45 3.5 9.2. 30.7 88 2.7 31
4.16 10.7 34.6 83 a.6 31
.5
.7
II
1.4
XI. Hepatic Disease
12.
34
6
3.35 11.7 35.5 ,o6
a..5a. 7.5 a.�.8 ioa.
4.47 13.3 39.1 87
35
30
30
33
a.9
34
4.5
i.6
1.7
XII. Endocrinological Disease
54 3.0 9.8 31 103 3a. 33
a.3 3.54 9.6 30.5 86 a.7 32. a..6
35 4.8 ‘4.’ 4a..3 88 a.9 33 1.7
33 4.07 11.5 35.9 88 a.8 32. 1.,
a.5 3.92. 10.5 32.9 84 a.7 32. a..’
2.2. 4.58 13.7 43.5 95 30 31 1.0
XIJI. Polycythemia
63
3’
5.5 14.8 49.0 88 a.7
7.82. 16.4 �8.i 74 a.’
FINCH, GIBSON, PEACOCK, AND FLUHARTY 907
TABLE i-Continued
30 1.0
a.8
metal into compounds suited for intravenous injection, the preparation of blood samples for radioactivity
measurement, and the use of differential counters for the simultaneous measurement of Fe55 (by x-rays)
and of Fe59 (by beta ray) have been described by Peacock et al.8 For most of the experiments, Fe55 (half
life four years) was used. Various acidified salts were employed including ferric chloride, ferric-ammo-
nium citrate, and ferrous ammonium sulfate. Carrier iron had been added to bring the total iron content
injected to o.i and o.� mg, and each injection contained approximately one million counts per minute.
As far as could be determined, these compounds were handled in identical fashion in the body when given
intravenously. Over a period of two to three weeks after the injection of radioiron, samples of venous
For personal use only.on January 5, 2019. by guest www.bloodjournal.orgFrom
908 IRON METABOLISM
blood were obtained in the morning; the patient was fasting in most instances. Hematologic studies were
done according to the following methods: Hematocrit determinations were performed in Wintrobe tubes
with centrifugation for one hour at 3,000 r.p.m. (International Centrifuge, Size I, Type C); hemoglobin
was determined in duplicate by the oxyhemoglobin method on an Evelyn colorimeter9; red counts were
done in duplicate pipets and were repeated if they did not check within � per cent. Reticulocyte counts
were done according to the method of Osgood and Wilhelm)0 Cell constants were determined and
reticulocyte counts were performed at least twice during the study of each patient. In all patients whose
blood picture was stabilized during the period of study, the figures were averaged in table � for the sake
of brevity. In the others, blood values at the initiation of the study are recorded.6 Bilirubin determina-
tions were made according to the method ofEvelyn and Malloy.#{176} Blood volumes were determined by the
method of Gibson and Evans)2 Four to six samples of blood were drawn between ten to thirty minutes
after injection of the dye and read in the Evelyn photo-electric microcolorimeter. The circulating red cell
volume was taken as 8� per cent of the cell volume calculated from the plasma volume and venous hema-
merit.’3 The radioactivity present in the blood stream, which was solely intracellular after the first day,
was expressed as per cent utilization of the total quantity given, according to the formula: Per cent‘. . (counts per minute/cc. red cells) X (red cell volume) . . . . .
utilization = -�--�- ‘ �;�;- . Since a dilution of the iron injectedTotal counts/minute injected
was run with the samples obtained from the patient, decay in radioactivity and variation in counting
efficiency were automatically corrected.
EXPERIMENTAL DATA
I. Normal subjects (Nos. 8, 9, 10, ;8, 87, 91, 93, 94)
Nine normal male volunteers between the ages of 2.4 and 30 were used as sub-
jects. None had recently given blood or suffered any other blood loss. Blood
volumes were determined at the beginning and in five instances at the end of the
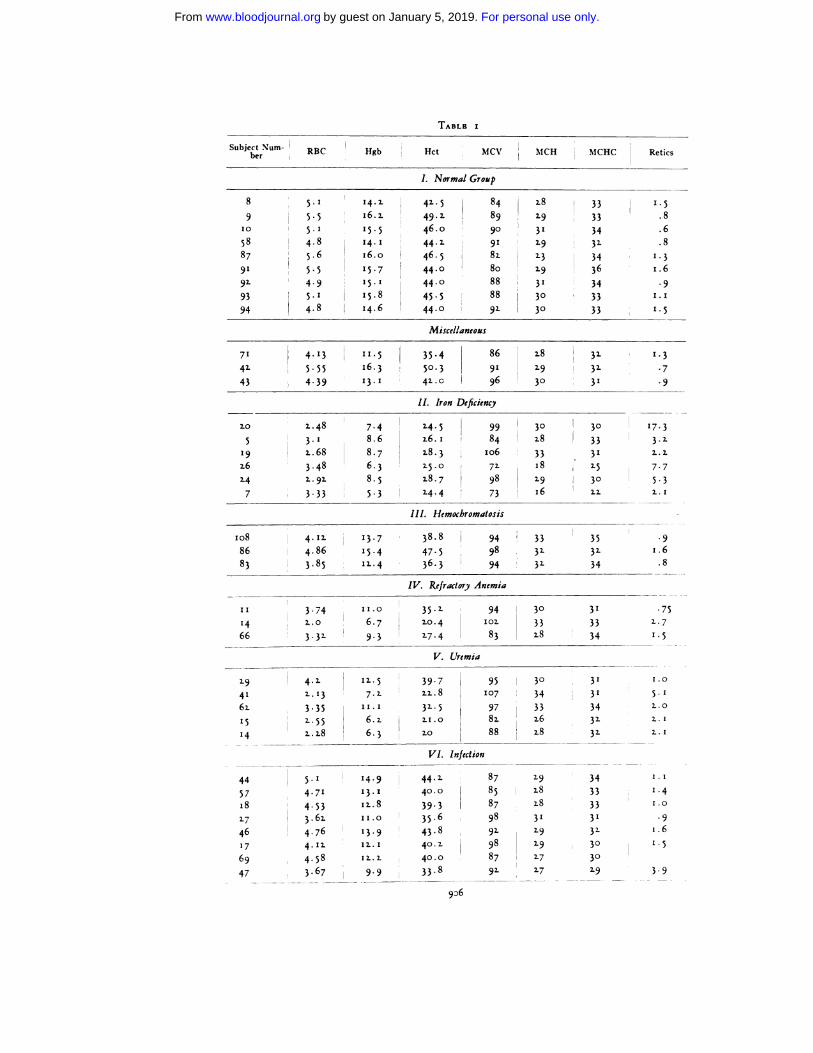
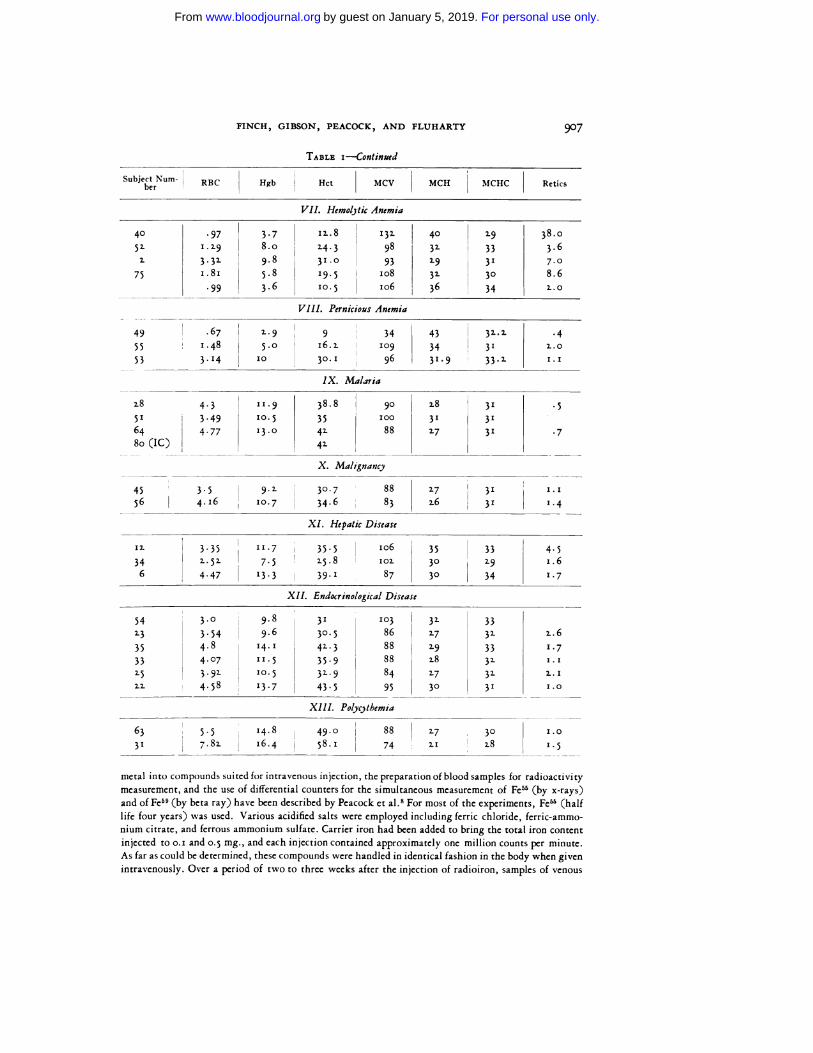
experimental period. Hematologic data are recorded in table i. Utilization of
intravenously injected radioiron is recorded in figure i. Over a period of fifteen to
eighteen days, 8 of these subjects showed a utilization of between 68 and 83 per
Cent, averaging 74 per cent.t
Three subjects (71, 42., 43) with miscellaneous diseases not expected to alter iron
metabolism were studied in a similar manner. These included a 59 year old female
diabetic (‘i) recovering from mild diabetic acidosis, a 53 year old male with
typical myocardial infarction (42.) but without any fever or evidence of heart
failure during the period of study, and a 71 year old asthmatic (��) in no acute
distress. Their utilization curves shown in figure 2. were similar to the composite
curve of normal subjects.
II. Iron Deficiency and Blood Loss Anemia (j, 7, 19, 20, 24, 26)
Six patients with acute or chronic blood loss were given radioiron (Fe55) intra-
venously. The patients represented varying degrees of iron deficiency as shown in
table i by their degree of microcytosis and hypochromia. Slight increases in mean
cell size found in acute blood loss are undoubtedly due to the appearance of
younger cells which are larger. Some patients had continued bleeding, some were
* In the reprints of this article, charts are included portraying the clinical course of these patients
similar to those shown in figure 7. While a correlation of the clinical factors affecting erythropoiesis and
the utilization curve was thought to be important, space did not permit its inclusion in the Journal.
t Subject 93 was excluded because of his variation from the others and because of the finding of a
decreased amount of iron binding protein in his serum.
For personal use only.on January 5, 2019. by guest www.bloodjournal.orgFrom
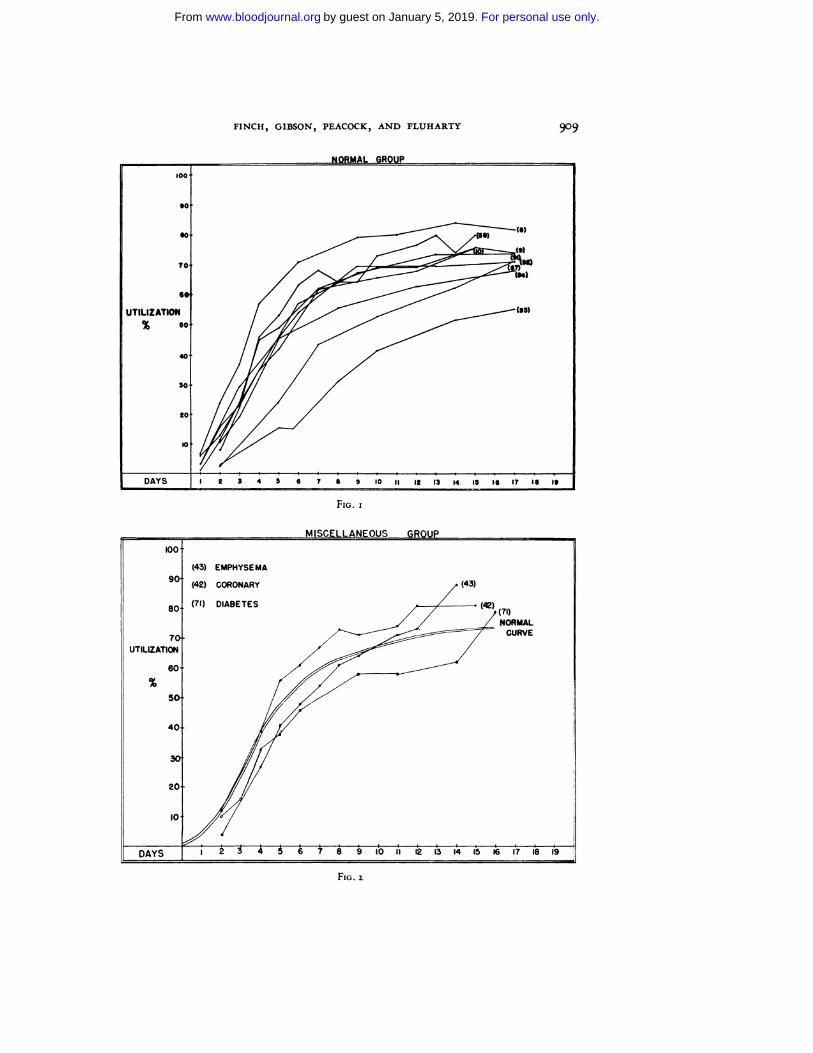
FIG. I
FINCH, GIBSON, PEACOCK, AND FLUHARTY 909
FIG. 2.
For personal use only.on January 5, 2019. by guest www.bloodjournal.orgFrom

Fio. 3
910 iRON METABOLISM
I
given iron therapy, some showed limited red cell production due to iron lack,
while in others red cell regeneration was rapid. Patients 7, 19 and 2.6 showed a fall
in the utilization curve during the second week. This may be related to changes in
the total blood volume, since only an initial blood volume determination was
made and subsequent changes in cell mass were calculated from the hematocrit.
It might also be explained by continued blood loss. All patients, however, showed
a rapid utilization of the injected radio-iron (fig. 3).
III. Hemochromatosis (83, 86, io8)
Three patients with hemochromatosis confirmed by liver biopsy were studied.
While 2. patients had slight anemia and microcytosis, patient 86 had normal blood
values (Table i) The radioiron utilization curve of all patients was depressed
(fig. 4) in the presence of fairly normal red cell production.
IV. Refractory, Aplastic, and Myelophthisic Anemia (ii, � 66)
Three different types of bone marrow dysfunction were studied. Patient i i was a
2.2. year old woman with refractory anemia and a hyperplastic bone marrow.
Patient 14, had acute disseminated lupus erythematosis with an aplastic marrow
at post mortem examination, and Patient 66, had extensive lymphosarcomatous
involvement of the bone marrow. In these cases only small amounts of radioactivity
appeared in the peripheral blood (Fig. �).
For personal use only.on January 5, 2019. by guest www.bloodjournal.orgFrom

NORMAL
CURVE
Fio. 4
(II) MACROCYTIC ANEMIA
(14) DISSEMINATED LUPUS ERYT HE MATtEIS
(66) LYMPHOSARCOMA
REFRACTORY APLASTIC_AND MYELOPHTHISIC ANEM(AS
NORMALCUR�
(II)
14 5 4 1 5 9
F,o. �
FINCH, GIBSON, PEACOCK, AND FLUHARTY 911
For personal use only.on January 5, 2019. by guest www.bloodjournal.orgFrom

Fio. 6
VI. Infection (i’, i8, 27, 44, 48, 57, 69)
912. IRON METABOLISM
V. Uremia (4, If, 29, 41, 62)
The five cases of renal disease included one patient with acute glomerulonephritis
(2.9), 2. patients with lower nephron damage (41, 6i) and 2. with chronic nephritis
without edema (is, 4). In Patients 4, 15, and 41 blood transfusions had previously
been given. All showed some degree of anemia (table i), thought to be due to the
uremic state, except for 41, where severe hemolysis had resulted in both renal
damage and anemia. Utilization curves (fig. 6) were all depressed below normal.
Eight patients with infection of viral, bacterial, and protozoal etiology were
studied. These infections were of variable duration: 44, 57, 2.7, and 17 were of less
than two weeks’ duration; 69 and 46 of about one month, and the two patients
with subacute bacterial endocarditis (i8 and 47) of several months’ duration.
In figure 7 are shown the clinical course of a patient with a mild viral pneumonitis
and a patient with severe pneumococcal pneumonia. Iron utilization curves, shown
in Figures 8 and 9 are extremely depressed in the severely ill patients.
VII. Hemolytic Anemia (2, 3, 52, 40, 75)
One patient with sickle cell anemia (2.), one with congenital hemolytic anemia
(�) and three with acquired hemolytic anemia were studied. Several of these
For personal use only.on January 5, 2019. by guest www.bloodjournal.orgFrom

t� 2 � �IoAcr,f (44�
DAYS(MAY26.44511 2”s,/’4 5 6 7 8 9 0 Ii 2 lB 146 6 rr IS IS
TEMPERATURE 1� � �-.
PULSE
HEMATOCRIT
� I4,0��
RLMMER�iNE �9R9RSC 510 R8C 4.70
08 4.9 HOB 5.5
I4CT 44.2 CT 400MCV 87 NOV 85
ICHC 34 UCHC 34
UGH 29 UGH 29�T1GS 1.1% 211GB L4�
By 2884 By 3220
CV 1164 CV 1170PV 172.0 PV2OSO
FINCH, GIBSON, PEACOCK, AND FLUHARTY 913
FIG. 7
For personal use only.on January 5, 2019. by guest www.bloodjournal.orgFrom
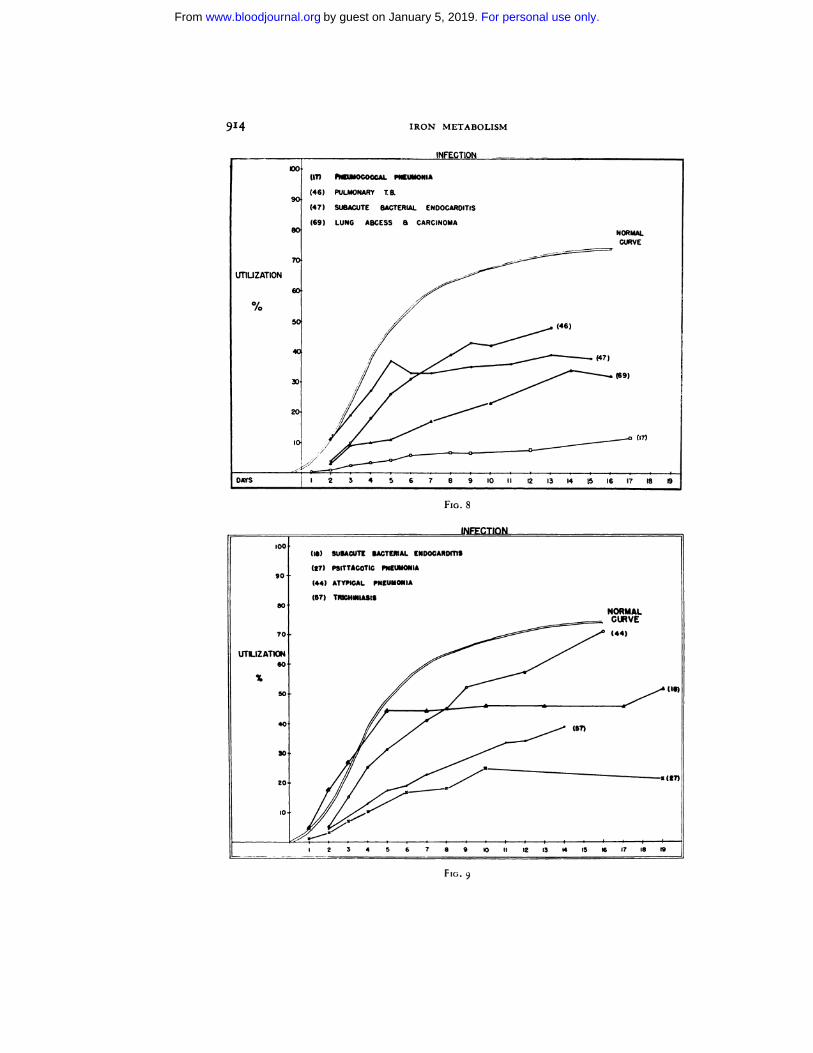
FIG. 8
FIG. 9
914 IRON METABOLISM
For personal use only.on January 5, 2019. by guest www.bloodjournal.orgFrom
HEMOLYTIC ANEMIA
(2) SICKLE CELL ANEMIA
(3) ACQUIRED HEMOLYTIC ANEMIA
(4Q CONGENITAL HEMOLYTIC ANEMIA
(5Z ACQUIRED HEMOLYTIC ANEMIA
(7� ACQUIRED HEMOLYIC ANEMIANORMAL
VIII. Pernicious Anemia � � .#{231}.#{231})
F,o. 10
FINCH, GIBSON, PEACOCK, AND FLUHARTY 915
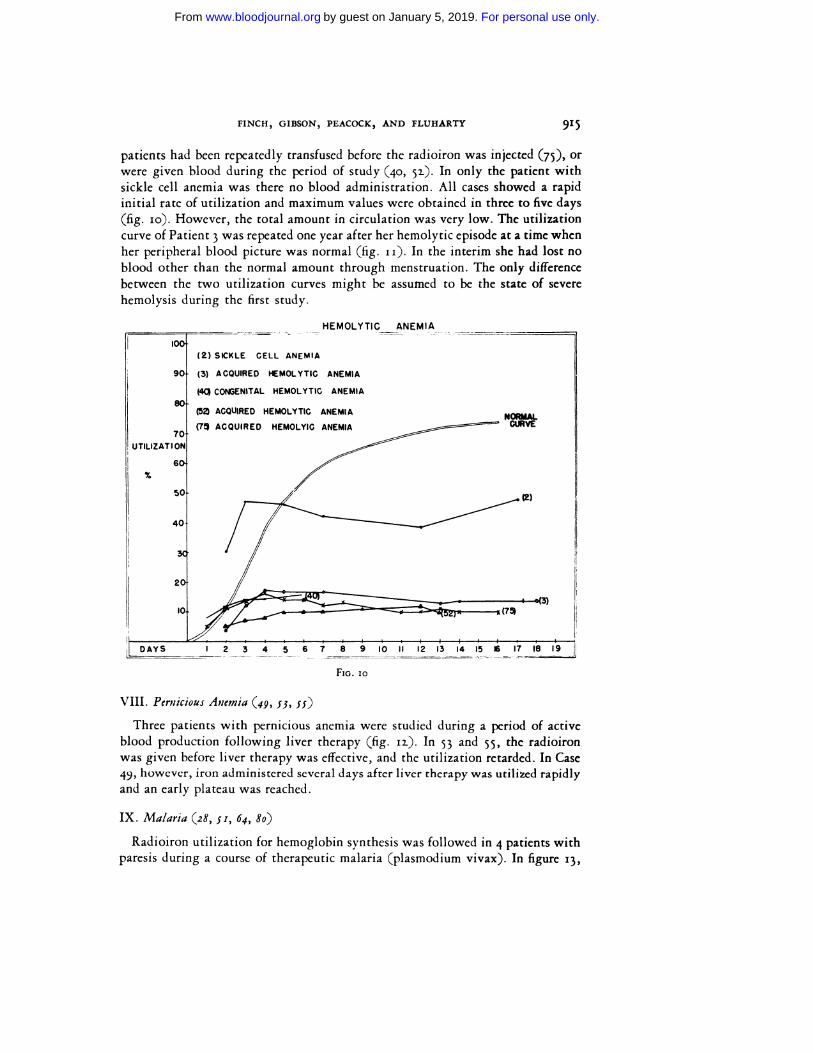
patients had been repeatedly transfused before the radioiron was injected (75), or
were given blood during the period of study (40, 52.). In only the patient with
sickle cell anemia was there no blood administration. All cases showed a rapid
initial rate of utilization and maximum values were obtained in three to five days
(fig. 10). However, the total amount in circulation was very low. The utilization
curve of Patient 3 was repeated one year after her hemolytic episode at a time when
her peripheral blood picture was normal (fig. ii). In the interim she had lost no
blood other than the normal amount through menstruation. The only difference
between the two utilization curves might be assumed to be the state of severe
hemolysis during the first study.
Three patients with pernicious anemia were studied during a period of active
blood production following liver therapy (fig. ii). In � and �, the radioiron
was given before liver therapy was effective, and the utilization retarded. In Case
49, however, iron administered several days after liver therapy was utilized rapidly
and an early plateau was reached.
IX. Malaria (28, �i, 64, 8o)
Radioiron utilization for hemoglobin synthesis was followed in 4 patients with
paresis during a course of therapeutic malaria (plasmodium vivax). In figure 13,
For personal use only.on January 5, 2019. by guest www.bloodjournal.orgFrom
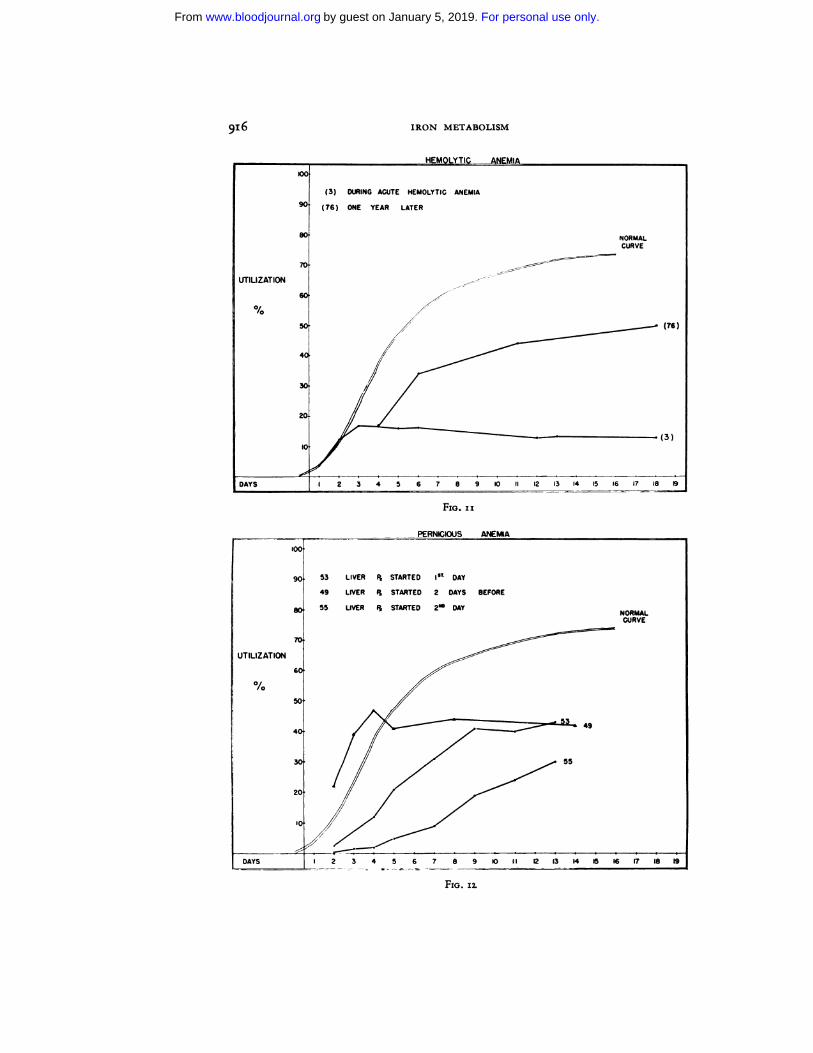
FIG. II
916 IRON METABOLISM
Fio. n.
For personal use only.on January 5, 2019. by guest www.bloodjournal.orgFrom

Fio. 13
FINCH, GIBSON, PEACOCK, AND FLUHARTY 917
the dotted line represents periods of fever. It will be observed that the utilization of
radioiron was markedly depressed during the malarial paroxysms and that in one
instance the level of radioactivity fell (si). A fall in hematocrit also occurred in
these patients during the active infection.
X. Malignancy (45, �6)
Patient 45 was a 6� year old woman with probable adenocarcinoma of the
left kidney and metastases to the right femur. Patient �6 was a 42. year old man
with a bronchogenic carcinoma, confirmed at autopsy. Both patients were afebrile
and had no blood loss. Utilization curves were depressed (fig. 14).
XI. Endocrine disease (23, 25, 33, 35, 54)
Four patients with typical Addison’s disease with a mild normocytic anemia
were studied and utilization curves (fig. i�) were found to be within normal range.
A patient with postoperative myxedema (2.2.) with a basal metabolism of -31
also approximated normal utilization. However, patient 54, a �8 year old woman
with anterior pituitary hypofunction showed a definite decrease in radioiron
utilization (fig. i6).
XII. Miscellaneous (6, 12, 34, 31, 63)
A 2.3 year old girl with mild acute infectious hepatitis (6) showed normal
utilization. A patient with Laennec’s cirrhosis and obstructive jaundice (ii) and
For personal use only.on January 5, 2019. by guest www.bloodjournal.orgFrom

FIG. 14
918 IRON METABOLISM
Fio. i�
For personal use only.on January 5, 2019. by guest www.bloodjournal.orgFrom

FIG. 16
FINCH, GIBSON, PEACOCK, AND FLUHARTY .919
Patient 34, a �i year old woman with toxic cirrhosis both showed utilization of
40-45 per cent at the end of eighteen days.
A patient with polycythemia vera (31) who had been treated for two years by
phlebotomies showed a rapid utilization to 90 per cent within the first week, while
a patient with chronic congestive failure and secondary polycythemia (63), showed
a normal utilization of iron for hemoglobin production.
DIScUSSION
The preceding data represents the utilization of injected radioiron for hemo-
globin production in man. Problems which are raised in this type of study include:
(i) the irradiation hazard of the isotope injected, particularly since it is not
excreted from the body, (2.) the exchange rate between hemoglobin iron and other
body iron, (�) the nature of the utilization curve including the pathway taken
by injected iron and factors influencing its synthesis into hemoglobin, (�) the
interpretation of the utilization curve in the various pathological states investi-
gated.
Irridation Hazard
An approximation of the radiation produced by the injected iron can be made.
The normal adult has a bone marrow space ranging from i,6oo to 3,700 cc. aver-
aging i,6oo cc.’4 It is likely that only about one-half of this marrow is active in the
sense that it is engaged in the formation of erythrocytes and leukocytes. Only
For personal use only.on January 5, 2019. by guest www.bloodjournal.orgFrom
92.0W IRON METABOLISM
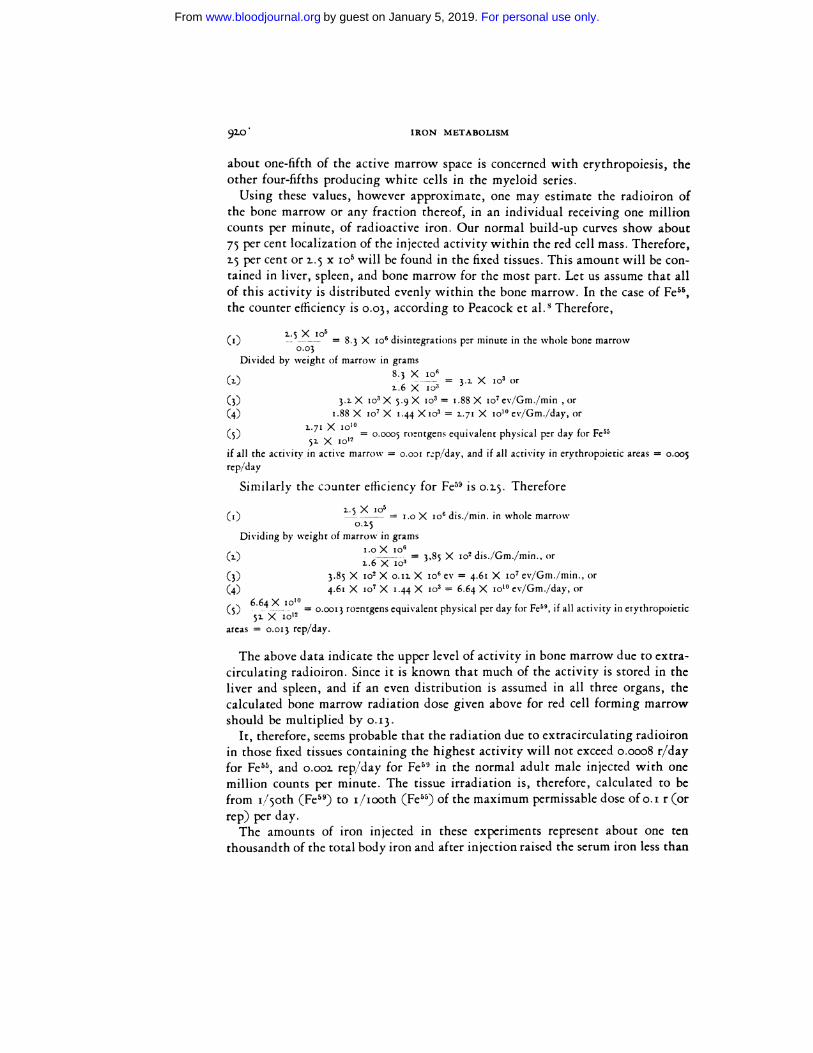
about one-fifth of the active marrow space is concerned with erythropoiesis, the
other four-fifths producing white cells in the myeloid series.
Using these values, however approximate, one may estimate the radioiron of
the bone marrow or any fraction thereof, in an individual receiving one million
counts per minute, of radioactive iron. Our normal build-up curves show about
75 per cent localization of the injected activity within the red cell mass. Therefore,
2.5 per cent or 1.5 x Io� will be found in the fixed tissues. This amount will be con-
tamed in liver, spleen, and bone marrow for the most part. Let us assume that all
of this activity is distributed evenly within the bone marrow. In the case of Fe55,
the counter efficiency is 0.03, according to Peacock et al.8 Therefore,
2.5 X io� . . .
(i) -� - = 8.3 X io� disintegrations per minute in the whole bone marrow
Divided by weight of marrow in grams
8.3 )( io6(2.) - 3.2. X � or
1.6 X j�3
(�) 3.1X io3X 5.9X io�= ‘.88X ,o7ev/Gm./min ,or
(�) i.88 X Io� X 1.44 X ,o� = 1.71 X IO�� ev/Gm./day, or
2..71X = o.ooo5 ro:ntgens equivalent physical per day for Fe”
if all the activity in active marrow = 0.03! r:p/day, and if all activity in erythropoietic areas = o.oo5
rep/day
Similarly the counter efficiency for Fe” is 0.2.5. Therefore
2.5 X 10� .
(i) �-�- = 1.0 X io� dis./m�n. in whole marrow0.2.5
Dividing by weight of marrow in grams
1.0 X ,o�(a.) - --- = 3,85 X io� dis./Gm./min., or
1.6 X ‘o�
(�) 3.85 X � X ala. X � cv = 4.61 X ioT ev/Gm./min., or
(�) 4.61 X � X 1.44 X � = 6.64 X io�� ev/Gm./day, or
6.6�Xio = o.ooi3 roentgens equivalent physical per day for Fe59, if all activity in erythropoietic
areas = 0.013 rep/day.
The above data indicate the upper level of activity in bone marrow due to extra-
circulating radioiron. Since it is known that much of the activity is stored in the
liver and spleen, and if an even distribution is assumed in all three organs, the
calculated bone marrow radiation dose given above for red cell forming marrow
should be multiplied by 0.13.
It, therefore, seems probable that the radiation due to extracirculating radioiron
in those fixed tissues containing the highest activity will not exceed o.ooo8 r/day
for Fe”, and 0.002. rep/day for Fe” in the normal adult male injected with one
million counts per minute. The tissue irradiation is, therefore, calculated to be
from i/�oth (Fe59) to 1/100th (Fe”) of the maximum permissable dose of o.i r (or
rep) per day.
The amounts of iron injected in these experiments represent about one ten
thousandth of the total body iron and after injection raised the serum iron less than
For personal use only.on January 5, 2019. by guest www.bloodjournal.orgFrom

FINCH, GIBSON, PEACOCK, AND FLUHARTY 92.1
Io�y/I00 cc. Thus the radioiron may be regarded as a true tracer dose of iron which
would enter into the normal body iron turnover without altering it in any way.
Exchange of Hemoglobin and Tissue Iron
Iron gains access to the red cell only in its developmental stage, to be synthesized
into hemoglobin. Studies with reticulocytes have shown an active uptake of
radioiron by these cells in vitro.1’ When mature erythrocytes are incubated with
radioiron, no uptake occurs. When radioiron is injected into patients with little
or no bone marrow function, little or no radioactivity appears in the red cell mass.
Once incorporated in the cell, the iron remains fixed there until the cell is de-
stroyed. In patients with large iron reserves it is possible to determine the life span
of transfused tagged cells, since the iron liberated from senescent erythrocytes is
diluted by the large reserve stores and only a small portion is reutilized. Free
exchange of iron does not occur, therefore, between erythrocytes and plasma or
tissues.
Nature of the Utilization Curve
The amount of radioactivity entering the circulation over a period of fifteen
to twenty days is a composite of three interdependent parts of iron metabolism:
the serum iron transport mechanism, the size and availability of iron stores, and
bone marrow function.
Within ten minutes after injection, one-third to one-fourth of the radioactivity
has disappeared from circulation and the remainder clears exponentially from the
serum, �o per cent in about one and one-half hours.’6 This latter fraction is bound
in the plasma to a B1 globulin which functions as a transport protein for iron,’7
The amount of injected radioiron initially bound to this protein is fairly constant,
unless the protein is already saturated with iron.
Much of the radioiron may be found in the liver within a few hours after injec-
tion.’8 Granick and Hahn have found this to be in the form of ferritin iron which
probably represents the more labile form of storage iron. The radioiron is then
rapidly rerouted to the bone marrow for hemoglobin production. About half of the
total utilization of radioiron for hemoglobin production occurs over a period of
2.2. days. Assuming that this radioiron was first mixed with tissue stores and then
carried to the bone marrow, we may calculate the reserve iron to be about ioo mg.
Storage iron in man is considerably greater than this; therefore, radioiron can not
completely mix with iron in storage. This has led to the postulation of a very small
labile iron reserve.* It seems more in harmbny with our observations to think of
this not as a special form of storage iron, but to postulate that the iron has fallen
on the “topsoil” of iron stores which would be more labile from a physical stand-
point as suggested by Dubach, Moore, and Minnick.7
* Red cell life span has been established in man at about 12.0 days. Therefore, 0.83 per cent of blood is
broken down and rebuilt each day. In a blood volume of ,ooo cc. containing about l,5oo mg. of iron, this
amounts to a.i mg of iron. If radioiron labels a small active compartment, �o per cent of which turns over
every 1.2. days, the compartment size to the first approximation would be 92. mg.
For personal use only.on January 5, 2019. by guest www.bloodjournal.orgFrom
92.2. IRON METABOLISM
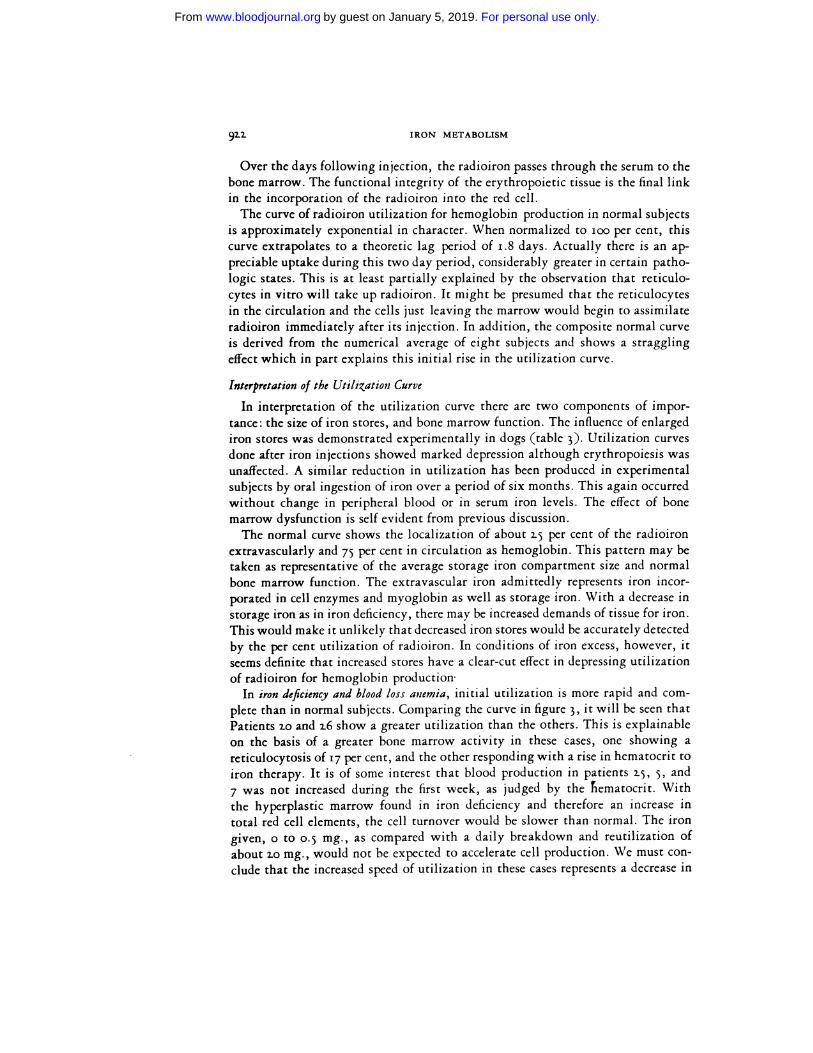
Over the days following injection, the radioiron passes through the serum to the
bone marrow. The functional integrity of the erythropoietic tissue is the final link
in the incorporation of the radioiron into the red cell.
The curve of radioiron utilization for hemoglobin production in normal subjects
is approximately exponential in character. When normalized to 100 per cent, this
curve extrapolates to a theoretic lag period of i.8 days. Actually there is an ap-
preciable uptake during this two day period, considerably greater in certain patho-
logic states. This is at least partially explained by the observation that reticulo-
cytes in vitro will take up radioiron. It might be presumed that the reticulocytes
in the circulation and the cells just leaving the marrow would begin to assimilate
radioiron immediately after its injection. In addition, the composite normal curve
is derived from the numerical average of eight subjects and shows a straggling
effect which in part explains this initial rise in the utilization curve.
Interpretation of the Utilization Curve
In interpretation of the utilization curve there are two components of impor-
tance: the size of iron stores, and bone marrow function. The influence of enlarged
iron stores was demonstrated experimentally in dogs (table 3). Utilization curves
done after iron injections showed marked depression although erythropoiesis was
unaffected. A similar reduction in utilization has been produced in experimental
subjects by oral ingestion of iron over a period of six months. This again occurred
without change in peripheral blood or in serum iron levels. The effect of bone
marrow dysfunction is self evident from previous discussion.
The normal curve shows the localization of about 2.5 per cent of the radioiron
extravascularly and 75 per cent in circulation as hemoglobin. This pattern may be
taken as representative of the average storage iron compartment size and normal
bone marrow function. The extravascular iron admittedly represents iron incor-porated in cell enzymes and myoglobin as well as storage iron. With a decrease in
storage iron as in iron deficiency, there may be increased demands of tissue for iron.
This would make it unlikely that decreased iron stores would be accurately detected
by the per cent utilization of radioiron. In conditions of iron excess, however, it
seems definite that increased stores have a clear-cut effect in depressing utilization
of radioiron for hemoglobin production’
In iron deficiency and blood loss anemia, initial utilization is more rapid and com-
plete than in normal subjects. Comparing the curve in figure 3, it will be seen that
Patients 2.0 and 2.6 show a greater utilization than the others. This is explainable
on the basis of a greater bone marrow activity in these cases, one showing a
reticulocytosis of 17 per cent, and the other responding with a rise in hematocrit to
iron therapy. It is of some interest that blood production in patients 2.5, �, and
7 was not increased during the first week, as judged by the riematocrit. With
the hyperplastic marrow found in iron deficiency and therefore an increase in
total red cell elements, the cell turnover would be slower than normal. The iron
given, o to 0.5 mg, as compared with a daily breakdown and reutilization of
about 2.0 mg., would not be expected to accelerate cell production. We must con-
clude that the increased speed of utilization in these cases represents a decrease in
For personal use only.on January 5, 2019. by guest www.bloodjournal.orgFrom
FINCH, GIBSON, PEACOCK, AND FLUHARTY 92.3
storage, and in serum turnover time and perhaps a slightly shorter period of
hemoglobinization of the red cell in the marrow. As the rate of erythropoiesis is
increased by supplying more building materials, the utilization is further ac-
celerated. It is of interest that ioo per cent utilization is not attained, suggesting
that certain tissue requirements are met even with anemia. In hemochromatosis,
radioiron utilization is profoundly depressed, while there is nothing fundamentally
wrong with erythrocyte production. This clearly indicates, as did animal experi-
ments (table 2.), that radioiron to some extent measures tissue iron stores in that
its utilization is inversely proportional to their size.
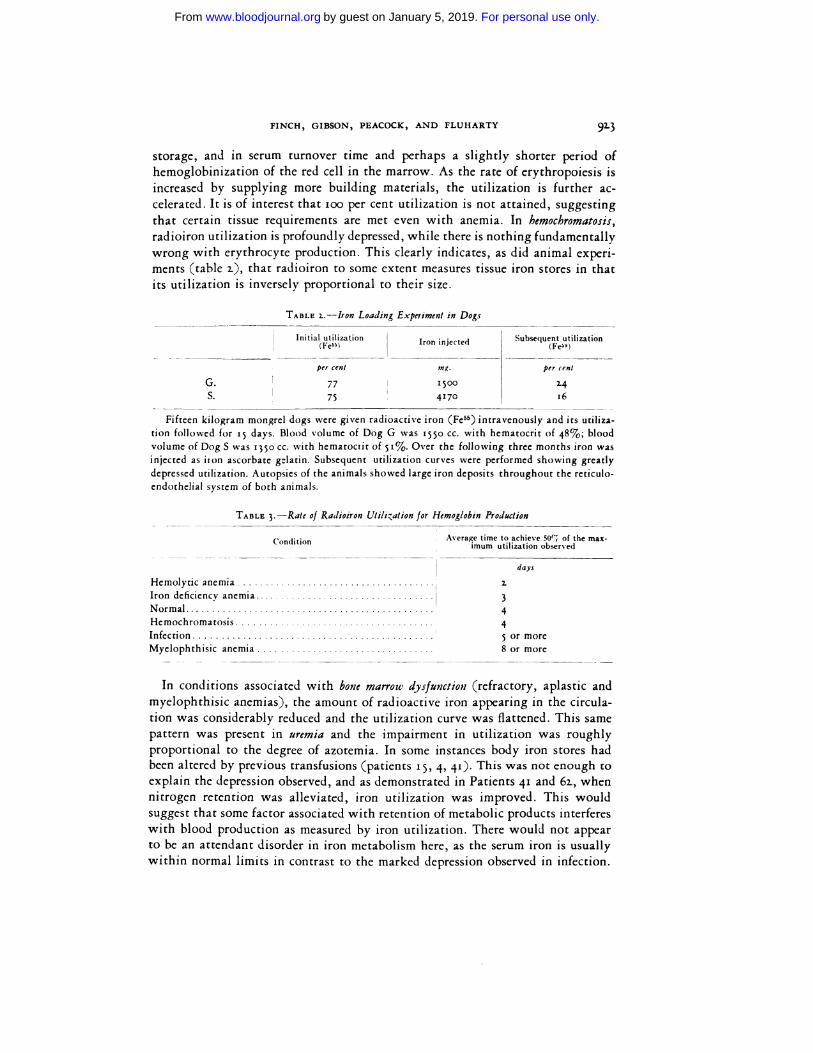
TABLE i--Iron Loading Experiment in Dogs
Iron injected
mg.
Subsequent utilization
per centper cent
G. I 1500 14
S. 75 4170 16
Fifteen kilogram mongrel dogs were given radioactive iron (Fe”) intravenously and its utiliza-
tion followed for 15 days. Blood volume of Dog G was 1550 cc. with hematocrit of 48%; blood
volume of Dog S was 1350 cc. with hematoctit of 51%. Over the following three months iron was
injected as iron ascorbate gelatin. Subsequent utilization curves were performed showing greatly
depressed utilization. Autopsies of the animals showed large iron deposits throughout the reticulo-
endothelial system of both animals.
TABLE 3.-Rate of Radioiron Utilization for Hemoglobin Production
� �. . Average time to achieve 5O”� of the max-on� ition mum utilization observed
days
Hemolytic anemia a.
Iron deficiency anemia 3
Normal 4
Hemochromatosis 4
Infection or more
Myelophthisic anemia 8 or more
In conditions associated with bone marrow dysfunction (refractory, aplastic and
myelophthisic anemias), the amount of radioactive iron appearing in the circula-
tion was considerably reduced and the utilization curve was flattened. This same
pattern was present in uremia and the impairment in utilization was roughly
proportional to the degree of azotemia. In some instances body iron stores had
been altered by previous transfusions (patients i�, �, 41). This was not enough to
explain the depression observed, and as demonstrated in Patients 41 and 6i, when
nitrogen retention was alleviated, iron utilization was improved. This would
suggest that some factor associated with retention of metabolic products interferes
with blood production as measured by iron utilization. There would not appear
to be an attendant disorder in iron metabolism here, as the serum iron is usually
within normal limits in contrast to the marked depression observed in infection.
For personal use only.on January 5, 2019. by guest www.bloodjournal.orgFrom

92.4 IRON METABOLISM
Among the eight patients with infection studied, there was no reason to believe
that any difference in iron utilization existed attributable to the etiologic agent.
Rather, the depression in utilization curves appeared to be proportionate to the
general severity of the infection. The curves showed the same gradual daily mere-
ments characteristic of decreased red cell production with the exception oh patients
( i8 and 47). Both of these had subacute bacterial endocarditis with associated
splenomegaly. The rapid initial rise and early plateau in their utilization curves are
similar to the curves in hemolytic anemia and raise the question as to whether
increased hemolysis may have been present. This depressed utilization of radioiron
in infection associated with a profound lowering in serum iron has been described
in experimental animals.” The patients with hemolytic anemia show a different type
of curve. Maximum utilization is reached on an average by the fourth day in con-
trast to the more gradual plateau normally found. A second feature of interest is
the extremely low utilization observed in most instances. Previous blood trans-
fusions may have depressed the utilization to some extent. In only Patient 2. was
the experimental period entirely free of blood administration. However, while
larger iron stores are to be expected in hemolytic anemia, these do not begin to
reach the size found in hemochromatosis. This would suggest that, in hemolytic
anemia, the serum iron binding protein is almost completely saturated with iron
from broken down erythrocytes with the result that the injected radioiron is at once
deposited in inactive tissue stores. Figure ii substantiates this, for the utilization
curve during the acute hemolytic stage was only i� per cent, while at a later date
the utilization was �o per cent. There was no reason to believe that iron stores had
changed appreciably in the interim. This may indicate either that hemoglobin iron
is necessarily used in preference to injected iron or that the transport mechanism
was already saturated with iron and that the injected iron was therefore more
rapidly taken out of circulation. Destruction of newly formed erythrocytes un-
doubtedly occurred in these patients. This would hasten the mixing of iron but
would not necessarily effect the per cent utilization for hemoglobin production.
Pernicious anemia presents a more complex situation. It will be observed that there
are two types of curves. When the iron had opportunity to mix with the enlarged
iron stores before liver therapy, its subsequent appearance in the circulation was
slow. However, when the iron was given at a time when hematopoiesis was pro-
ceeding rapidly after liver therapy, utilization was rapid. This latter patient
showed an early plateau, suggesting that by the fifth day there may be some
destruction of the newly formed cells. Other observations on the viability of the
reticulocytes in pernicious anemia” and studies2#{176}on the viability of erythrocytes
in pernicious anemia substantiate this. In malaria, the decline in radioactivity in
Case �i indicates destruction of young cells in keeping with the previous observa-
tion that parasitized cells contain most of the radioactivity.2’ It will be observed
that during the periods of fever there is little iron utilization, while after irradia-
tion of the infection there is more rapid utilization.
Little is known of the mechanism of anemia in malignancy. The general contour
of the utilization curve was fairly normal, but the utilization was less than half
of normal. There was no evidence of hemolysis in these cases. It is impossible to
For personal use only.on January 5, 2019. by guest www.bloodjournal.orgFrom
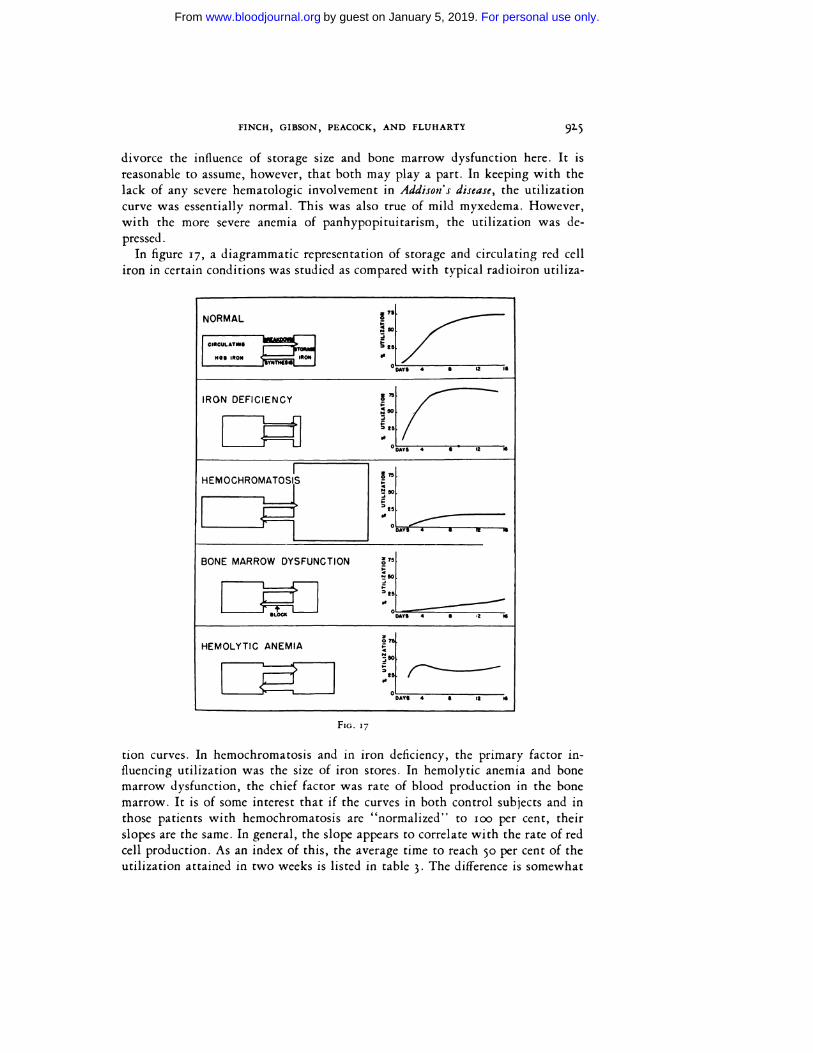
FIG. 17
FINCH, GIBSON, PEACOCK, AND FLUHARTY 92.5
divorce the influence of storage size and bone marrow dysfunction here. It is
reasonable to assume, however, that both may play a part. In keeping with the
lack of any severe hematologic involvement in Addison’s disease, the utilization
curve was essentially normal. This was also true of mild myxedema. However,
with the more severe anemia of panhypopituitarism, the utilization was de-
pressed.
In figure 17, a diagrammatic representation of storage and circulating red cell
iron in certain conditions was studied as compared with typical radioiron utiliza-
NORMAL
YNYNC$$
I�,5
�IO
055 DAYS 4 S �
BONE MARROW DYSFUNCTION �‘
�5O
LI�
tion curves. In hemochromatosis and in iron deficiency, the primary factor in-
fluencing utilization was the size of iron stores. In hemolytic anemia and bone
marrow dysfunction, the chief factor was rate of blood production in the bone
marrow. It is of some interest that if the curves in both control subjects and in
those patients with hemochromatosis are “normalized” to 100 per cent, their
slopes are the same. In general, the slope appears to correlate with the rate of red
cell production. As an index of this, the average time to reach �o per cent of the
utilization attained in two weeks is listed in table 3. The difference is somewhat
For personal use only.on January 5, 2019. by guest www.bloodjournal.orgFrom
92.6 IRON METABOLISM
greater than apparent from the data when the period of lag is taken into considera-
tion.
These data are similar in general to the studies of iron utilization reported by
Dubach, Moore, and Minnick.7 Our lower utilization values may be accounted for
in part by the assumption of blood volumes on the part of these authors without
the additional correction factor of o.8� per cent found necessary by Gibson et al.
Ross22 finds a slightly lower normal utilization, in the neighborhood of 6o per
cent. It seems likely that injected iron is used interchangeably with iron liberated
from hemoglobin, for the utilization curves are quite similar from broken down
hemoglobin and injected radioiron.22’ 23 The blocking action found in hemolytic
anemias would appear to be due to the more saturated state of the serum iron bind-
ing protein forcing the injected iron into storage depots. In absorption studies
employing radioiron, it is obvious, as previously suggested,7 that the percentage
utilization cannot be taken as the amount absorbed and that the studies of Hahn
Ct al.24 must be interpreted according to the expected utilization of iron, once
this material gains access to the blood stream. The simultaneous intravenous in-
jection and oral administration ofdifferent isotopes ofradioiron might be expected
to circumvent this.
SUMMARY
By determining the percentage utilization of intravenously administered radio-
iron for hemoglobin production over a period of two to three weeks, certain
measurements of internal iron metabolism can be made.
With a normal rate of blood production, changes in per cent utilization reflect
alteration in iron stores. Iron depletion is characterized by more rapid and more
complete utilization of radioiron. States of iron excess in hemochromatosis can be
identified by their profound depression of radioiron utilization.
If, on the other hand, storage iron is not greatly altered, the percentage utiliza-
tion is determined by the function of the erythropoietic tissue. In myelophthisic
anemias, in uremia, and in infection, a similar depression of the curve is found.
The rate of erythropoiesis may further be estimated by the slope of the utiliza-
tion curve, and evidence of abnormal red cell destruction is found in early and
abrupt plateau of the utilization curve.
A correlation has been made in a variety of hematologic disorders between the
radioiron utilization for hemoglobin production and the clinical factors which
might be expected to affect iron metabolism in these patients.
REFERENCES
I MCCANCE, R. A., AND WInDowsoN, E. M.: Absorption and excretion of iron following oral and intra-
venous administration. J. Physiol. 9g.’ 148-154, 1938.
2 LITTLE, A. G., POWER, M. H., AND WAKEFIELD, E. G.: Absorption and excretion of iron. Ann. Int.
Med. 23.’ 62.7-633, 1945.
MCCANCE, R. A., AND WIDDOWSON, E. M.: Iron excretion and metabolism in man. Nature 152.’ 32.6-32.7,
1943.
G��sor’r, J. G. II, SELIGMAN, A. M., PEACOCK, W. C., AUB, J. C., FINE, J., AND EVANS, R. D.: The dis-
tribution of red cells and plasma in large and minute vessels of the normal dog, determined by ra
dioactive isotopes of iron and iodine. J. Clin. Investigation 25.’ 848-857, 1946.
For personal use only.on January 5, 2019. by guest www.bloodjournal.orgFrom
FINCH, GIBSON, PEACOCK, AND FLUHARTY 92.7
5 HAHN, P. F. : The metabolism of iron. Medicine i6.’ 2.49-2.66, 1937.
6 , WHIPPLE, G. H. , II. : Iron metabolism, its absorption, storage, and utilization in experimental
anemia. Am. J. M. Sc. ‘9’.’ 2.4, 1943.
7 DUBACH, R. , MOORE, C. V. , MINNICH, V. : Studies in Iron Transportation and Metabolism. V. Utiliza-
tion of intravenously injected radioactive iron for hemoglobin synthesis, and an evaluation of the
radioactive iron method of studying iron absorption. J. Lab. & Clin. Med. 3!.’ 1101-1111, 1946.
8 PEACOCK, W. C., EVANS, R. D., IRVINE,J. W., GooD, W. M., KIP, A. F., WEISS, S., AND GIBSON, J. G.
md. : The use of two radioactive isotopes of iron in tracer studies of erythrocytes. J. Exper. Med. �j:
6o�-6i5, 1946.
9 EVELYN, K. A. : Stabilized photo-electric colorimeter with light filters. J. Biol. Chem. us.’ 63-75, 1936.
10 OsGooD E. E., ANDWILHELM, M. M.:Reticulocytes.J. Lab. &Clin. Med. 19.’ IIa.9-1135, 1934.
11 MALLOY, H. T. , AND EVELYN, K. A. : Determination of bilirubin with photoelectric colorimeter. J.
Biol. Chem. “9.’ 481490, 1937.
12 GIBSON J. G. a.nd, EVANS, W. A. , Jr. : Clinical studies of blood volume : Clinical application of method
employing Azo dye “Evans blue” and spectrophotometer. J. Clin. Investigation z6.’ 301-3 16, 1937.
13 �, WEISS, S., EVANS, R. D., PEACOCK, W. C., IRVINE, J. W., GooD, W. M., KIP, A. F.: The measure-
ment of circulating red cell volume by means of two radioactive isotopes of iron. J. Clin. Investiga-
tion �j: 6,6-6i6, 1946.
14 MECHANIcK, N.: Untersuchungen #{252}berdas Gewicht des Knochenmarkes des Menschen. Ztschr. Ges.
Ar.at. 79.’ �8, 1916.
15 RATH, C. E., FINCH, C. A., KOLLER, F., GIBSON, J. G. a.nd, Fluharty, R. G.: Observations on reticulo-
cytes. To be published.-‘ Gi�soisr, J. G. II, FLUHARTY, R. G.: Iron transport. II. Turnover rate. To be published.
17 RATH, C. E., AND FINCH, C. A.: Chemical, clinical, and immunological studies on the products of
human plasma fractionation. XXXVIII, Serum iron transport measurement of iron binding capacity
of serum in man. J. Clin. Investigation 28.’ 79-85, 1949.
18 GRANICK, S., AND HAHN, P. F.: Ferritin. VIII. Speed of uptake of iron by the liver and its conversion
to ferritin iron. J. Biol. Chem. 155. 661-669, 1944.
19 GREENBERG, G. R., ASHENDRUCKER, H., LAURITSEN, M., WORTH, W., HUMPHREYS, S. R., WINTROBE,
M. M.: The anemia of infection. V. Fate of injected radioactive iron in the presence of inflammation.
J. Clin. Investigation 26.’ 111-115, 1947.
20 CALLENDER, S. T., LOUTIT, J. F., AND JOPE, E. M.: Discussion on the life and death of the red blood
corpuscle. Proc. Roy. Soc. Med. � 755-762., 1946.
21 FERREBEE, J. W., GIBSON, J. G. LND, AND PEACOCK, W. C.: Studies on malarial parasites. IV. Some
observations regarding the age of the erythrocyte invaded by plasmodium vivax. J. Infect. Dis. 78.’
i8o-i8i, 1946.
� Ross, J.: Personal communication.
23 GIBSON, J. G. a.ND, AUB, J. C., EVANS, R. D., PEACOCK, W. C., IRVINE, J. W., SACK, T.: The measure-
ment of post-transfusion survival of preserved stored human erythrocytes by means of two isotopes
of radioactive iron. J. Clin. Investigation 26: 704-714, 1947.
24 BALFOUR, W. M., HAHN, P. F., BALE, W. F., POMMERENKE, W. T., AND WHIPPLE, G. W.: Radioactive
iron absorbtion in clinical conditions: Normal, pregnancy, anemia, and hemochromatosis. J. Exper.
Med. 76: 1530, 1941.
For personal use only.on January 5, 2019. by guest www.bloodjournal.orgFrom
1949 4: 905-927
CLEMENT A. FINCH, JOHN G. GIBSON II, WENDELL C. PEACOCK and REX G. FLUHARTY IRON METABOLISM: UTILIZATION OF INTRAVENOUS RADIOACTIVE IRON
http://www.bloodjournal.org/content/4/8/905.full.htmlUpdated information and services can be found at:
Articles on similar topics can be found in the following Blood collections
http://www.bloodjournal.org/site/misc/rights.xhtml#repub_requestsInformation about reproducing this article in parts or in its entirety may be found online at:
http://www.bloodjournal.org/site/misc/rights.xhtml#reprintsInformation about ordering reprints may be found online at:
http://www.bloodjournal.org/site/subscriptions/index.xhtmlInformation about subscriptions and ASH membership may be found online at:
Copyright 2011 by The American Society of Hematology; all rights reserved.Hematology, 2021 L St, NW, Suite 900, Washington DC 20036.Blood (print ISSN 0006-4971, online ISSN 1528-0020), is published weekly by the American Society of
For personal use only.on January 5, 2019. by guest www.bloodjournal.orgFrom