iron deficiency, anemia & folate deficiency: national micronutrient survey 2011-12 dr. tahmeed...
TRANSCRIPT
Iron deficiency, Anemia & Folate Deficiency: National Micronutrient Survey 2011-12
Dr. Tahmeed AhmedDirector, Centre for Nutrition and
Food Security, icddr,b

Sampling
15000 Primary Sampling Units (MICS 2009)
1st stage: 150 Primary Sampling Units
2nd stage: 50 household segments
3rd stage: 20 households
50 Rural
50 Urban
50 Slum

Primary Sampling Units of the Survey

Iron Deficiency & Anemia
Preschool children (6-59 month)School age Children (6-14 years)Non Pregnant Non Lactating Women (15-49 years)
Folate Deficiency
Non Pregnant Non Lactating Women (15-49 years)
Study Population
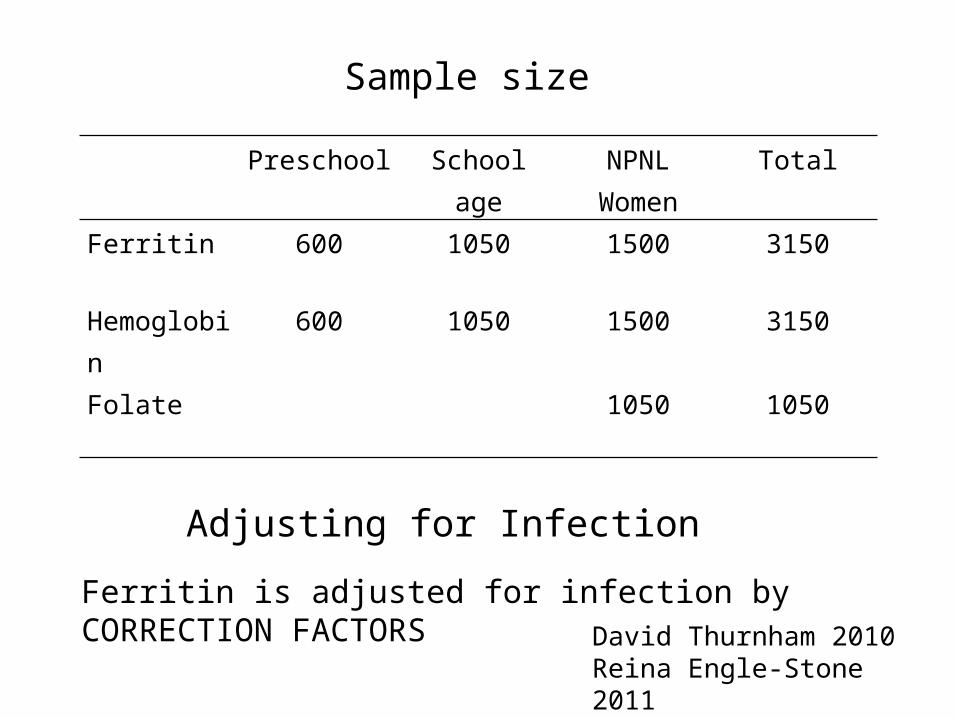
Preschool School age NPNL Women
Total
Ferritin 600 1050 1500 3150
Hemoglobin 600 1050 1500 3150
Folate 1050 1050
Sample size
Adjusting for Infection
Ferritin is adjusted for infection by CORRECTION FACTORSDavid Thurnham 2010Reina Engle-Stone 2011

Results

Preschool age
NPNL women
School age (6-11 y)
School age (12-14 y)
0
5
10
15
20
25
30
10.7
7.1
3.9
9.5
National
Rural
Urban
Slums
Iron deficiency: S. ferritin <12ng/ml (Pre-school) S. ferritin <15ng/ml (NPNL and School age)
Prevalence Iron Deficiency(%)
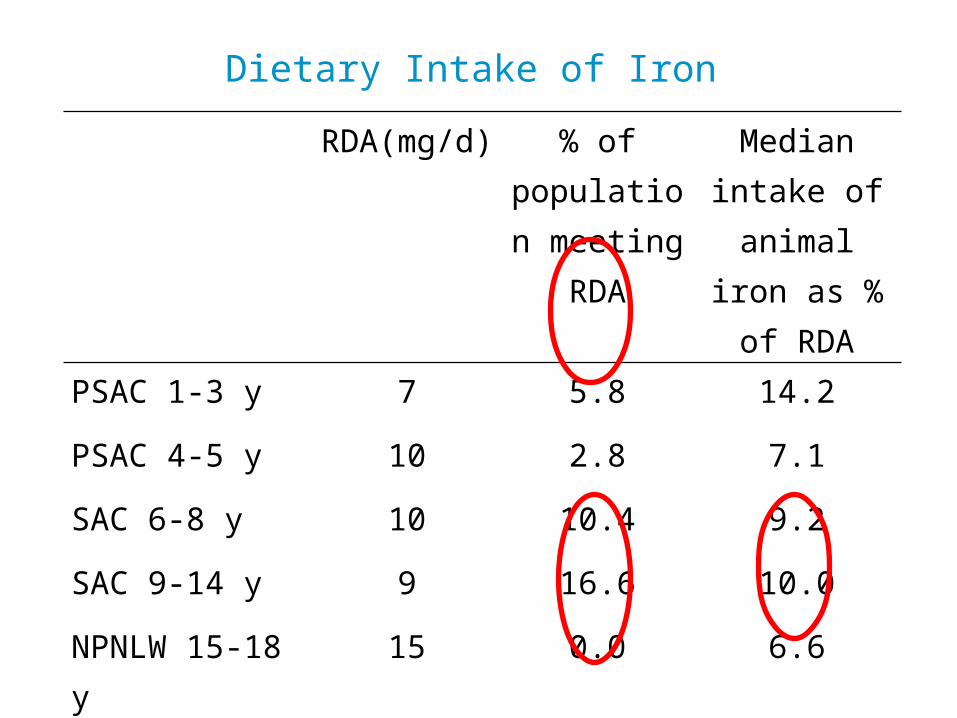
RDA(mg/d) % of population
meeting RDA
Median intake of animal iron as % of RDA
PSAC 1-3 y 7 5.8 14.2
PSAC 4-5 y 10 2.8 7.1
SAC 6-8 y 10 10.4 9.2
SAC 9-14 y 9 16.6 10.0
NPNLW 15-18 y 15 0.0 6.6
NPNLW 19-49 y 18 0.0 5.2
Dietary Intake of Iron
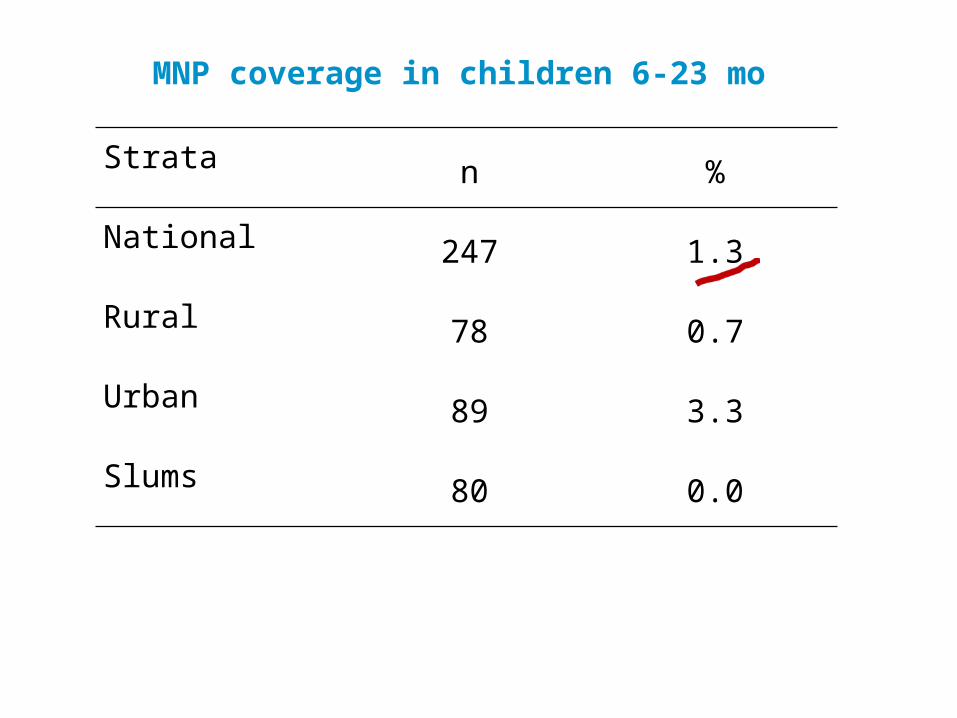
Stratan %
National247 1.3
Rural78 0.7
Urban89 3.3
Slums80 0.0
MNP coverage in children 6-23 mo

Groundwater Iron Status in Bangladesh
NPNLW68 ng/ml vs.
44 ng/ml (p<0.001)
PSAC39 ng/ml vs.
23 ng/ml (p<0.001)
NPNLW57 ng/ml vs.
42 ng/ml (p<0.001)
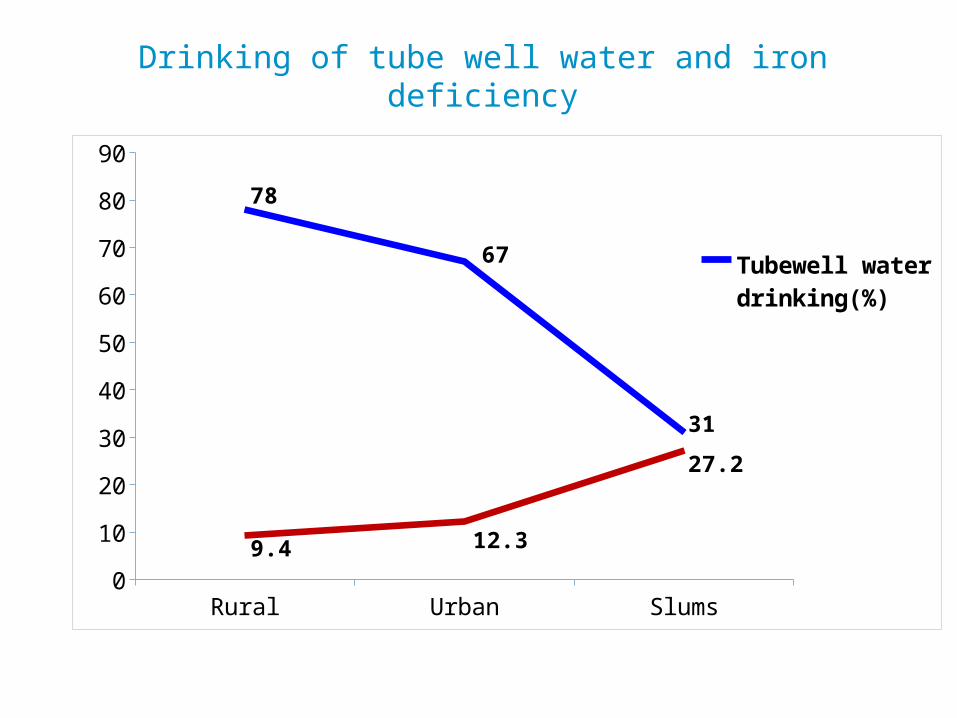
Rural Urban Slums0
10
20
30
40
50
60
70
80
90
78
67
31
9.4 12.3
27.2
Tubewell water drinking(%)
Prevalence of iron deficiency(%)
Drinking of tube well water and iron deficiency

Multivariate Regressions showing association of ferritin
Independent Variables: Age, Education, Occupation, Residence, Morbidity, Dietary Intake, SES, Household Food Insecurity, Knowledge about iron related health issues, serum level of retinol, zinc, folate and hemoglobin and Groundwater iron level
Dependent Variable: Serum Ferritin
Variables t p Effect sizeHemoglobin 5.85 <0.001 0.25Agricultural profession (Ref: Non-agricultural) 1.67 0.09 0.08Age 7.11 <0.001 0.30Slum residence (Ref: Rural) -2.05 0.04 -0.08Wealth index (Ref: Poorest) Poorer 1.41 0.16 0.08Middle -0.62 0.53 -0.03Richer -1.39 0.16 -0.07Richest -1.01 0.31 -0.06“high” IRON area (Ref: “low” Iron area) 3.35 0.001 0.21Household food insecurity (Ref: food secure) Mild food insecure 0.76 0.45 0.03Moderate food insecure -1.21 0.22 -0.05Severe food insecure 0.63 0.52 0.03
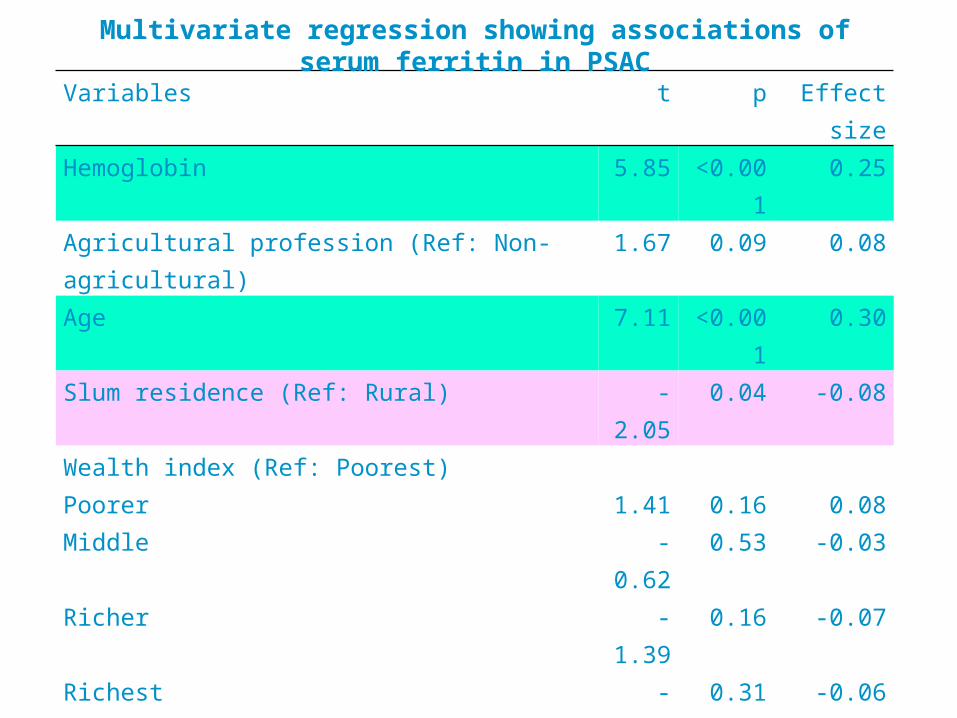
Multivariate regression showing associations of serum ferritin in PSAC

Variables t p Effect sizeHemoglobin 3.25 0.001 0.14Household’s spending -0.94 0.35 -0.05Profession (Reference: non-agricultural profession) Agricultural profession 2.48 0.01 0.13Female (Ref: male) 1.15 0.25 0.05Diarrhea in last 2 weeks (Ref: history of diarrhea) No diarrhea in last 2 weeks 2.11 0.03 0.10Connection of electricity (Ref: electricity connected) No connection of electricity 0.19 0.85 0.01Groundwater iron (Ref: “low” GWI area) “High” IRON area (Ref: “Low” Iron area) 2.95 0.003 0.15Knowledge about eating iron rich foods Did not mention, iron rich food is “good for health” (Ref: Did mention) -2.87 0.004 -0.13Knowledge about eating iron rich foods
“Do not know” (Ref: Knows “which foods are rich source of iron”) 1.34 0.18 0.06
Serum retinol 3.37 0.001 0.15Household food insecurity (Ref: food secure) Mild food insecure -1.62 0.1 -0.07Moderate food insecure -0.99 0.32 -0.06Severe food insecure -1.01 0.31 -0.06
Multivariate regressions showing associations of serum ferritin in SAC
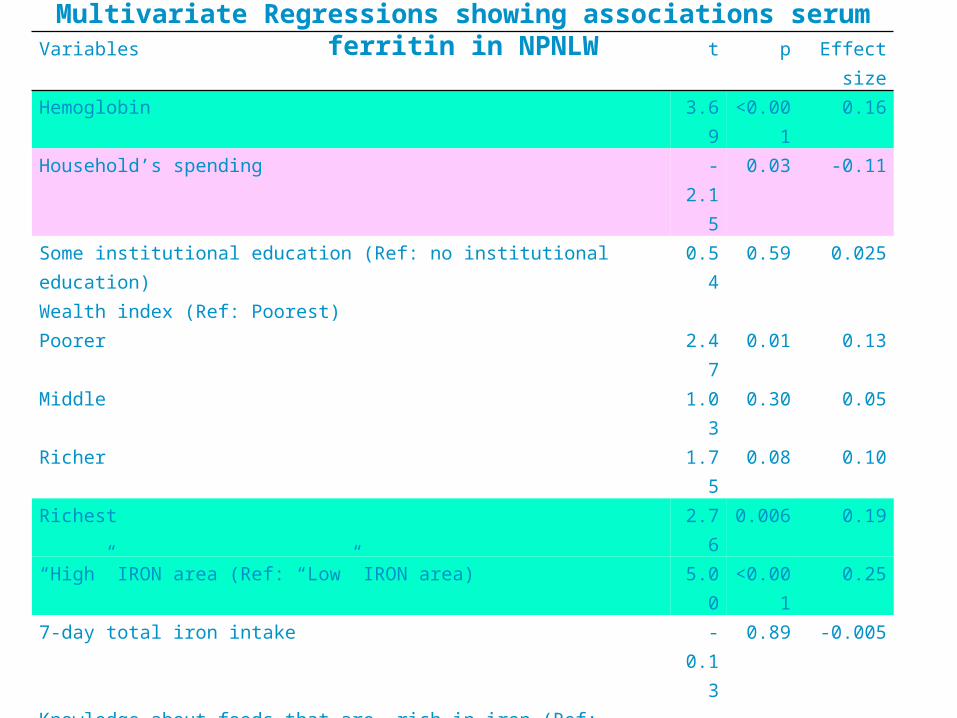
Variables t p Effect sizeHemoglobin 3.69 <0.001 0.16Household’s spending -2.15 0.03 -0.11Some institutional education (Ref: no institutional education) 0.54 0.59 0.025Wealth index (Ref: Poorest) Poorer 2.47 0.01 0.13Middle 1.03 0.30 0.05Richer 1.75 0.08 0.10Richest 2.76 0.006 0.19“High” IRON area (Ref: “Low” IRON area) 5.00 <0.001 0.257-day total iron intake -0.13 0.89 -0.005Knowledge about foods that are rich in iron (Ref: “knows”) “Do not know” -0.13 0.89 -0.006Location of residence (Ref: Rural) Urban -0.23 0.82 -0.01Slum -0.12 0.90 -0.005Serum retinol -0.53 0.60 -0.02No. of para -0.45 0.65 -0.02Serum zinc 0.48 0.63 0.02Household food insecurity (Ref: food secure) Mild food insecure 1.26 0.21 0.06Moderate food insecure 2.60 0.01 0.12Severe food insecure 1.00 0.32 0.05Serum B12 2.06 0.04 0.09Serum folate 3.19 0.002 0.13Possession of refrigerator (Ref: non possession) Possess a refrigerator 2.58 0.01 0.15
Multivariate Regressions showing associations serum ferritin in NPNLW
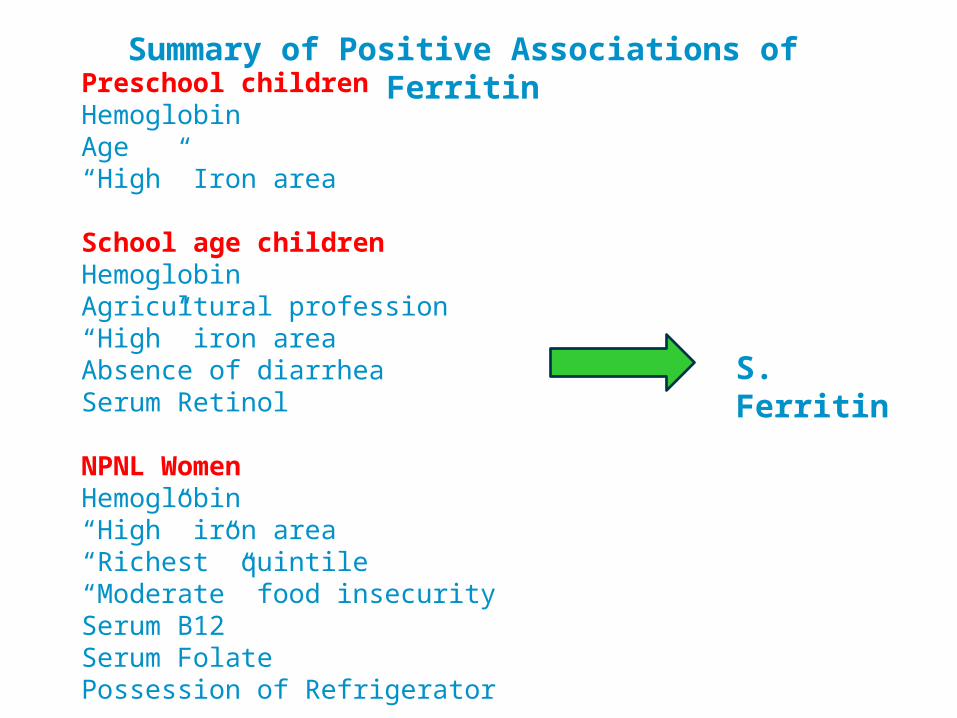
Summary of Positive Associations of FerritinPreschool childrenHemoglobinAge“High” Iron area
School age childrenHemoglobinAgricultural profession“High” iron areaAbsence of diarrheaSerum Retinol
NPNL WomenHemoglobin“High” iron area“Richest” quintile“Moderate” food insecuritySerum B12Serum FolatePossession of Refrigerator
S. Ferritin
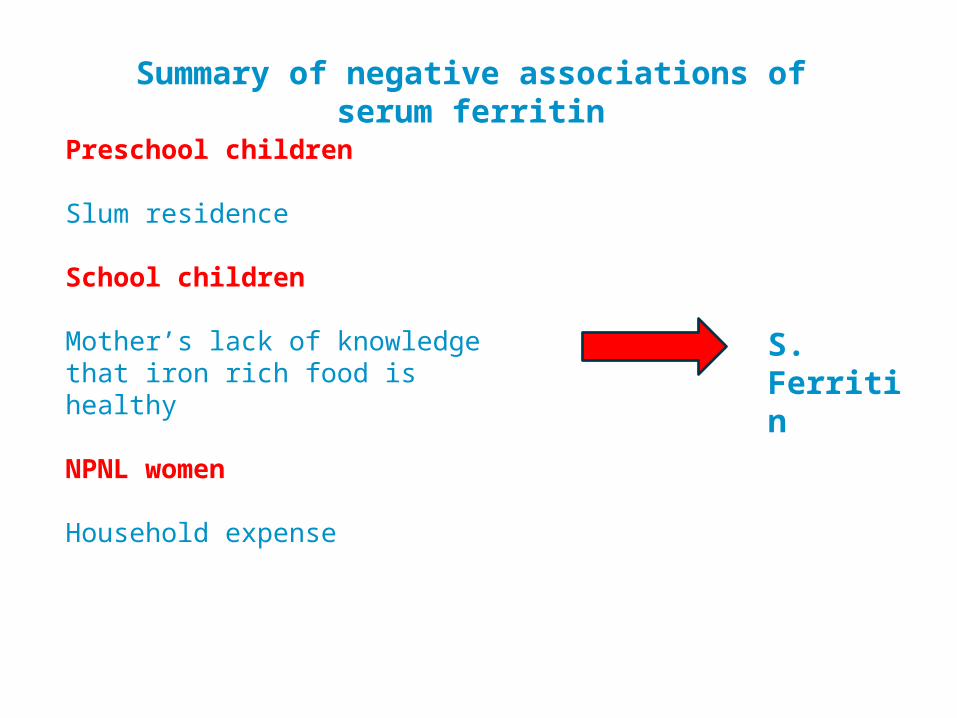
Summary of negative associations of serum ferritin
Preschool children
Slum residence
School children
Mother’s lack of knowledge that iron rich food is healthy
NPNL women
Household expense
S. Ferritin
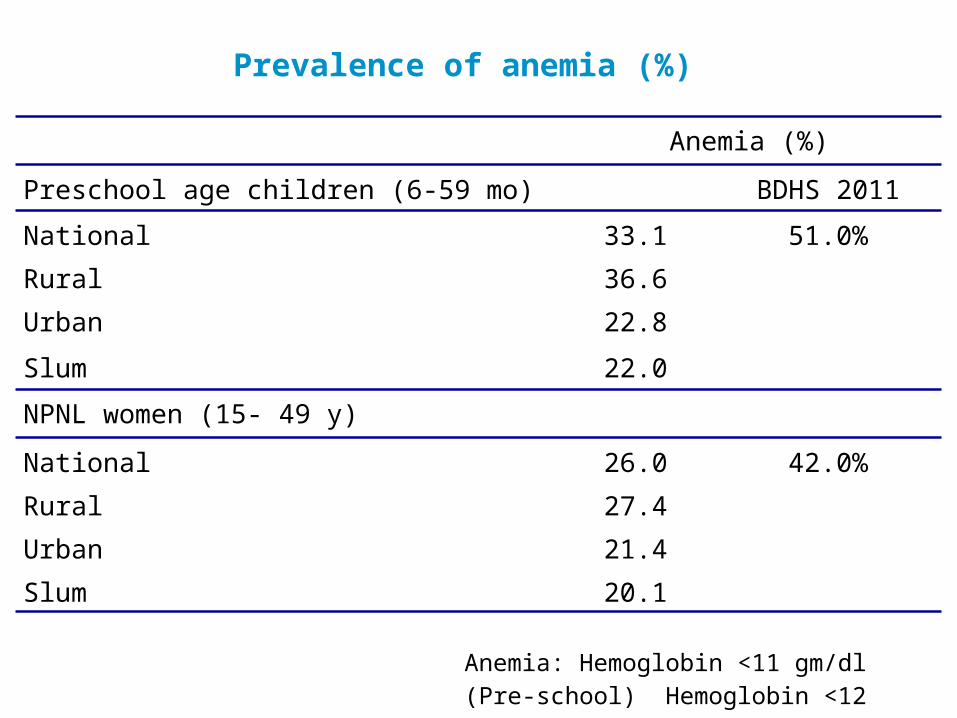
Anemia (%)
Preschool age children (6-59 mo) BDHS 2011
National 33.1 51.0%
Rural 36.6
Urban 22.8
Slum 22.0
NPNL women (15- 49 y)
National 26.0 42.0%
Rural 27.4
Urban 21.4
Slum 20.1
Anemia: Hemoglobin <11 gm/dl (Pre-school) Hemoglobin <12 gm/dl (NPNLW)
Prevalence of anemia (%)

School age children (6-11 yrs) Urban anemia survey 2001-3
National 19.1 24
Rural 21.7
Urban 11.8
Slum 13.2
School age children (12-14 year)
National 17.1
Rural 18.1
Urban 13.2
Slum 18.1
Anemia: Hemoglobin <11.5 gm/dl (School age, 6-11 y) Hemoglobin <12 gm/dl (School age, 12-14 y)
Prevalence of anemia (%)
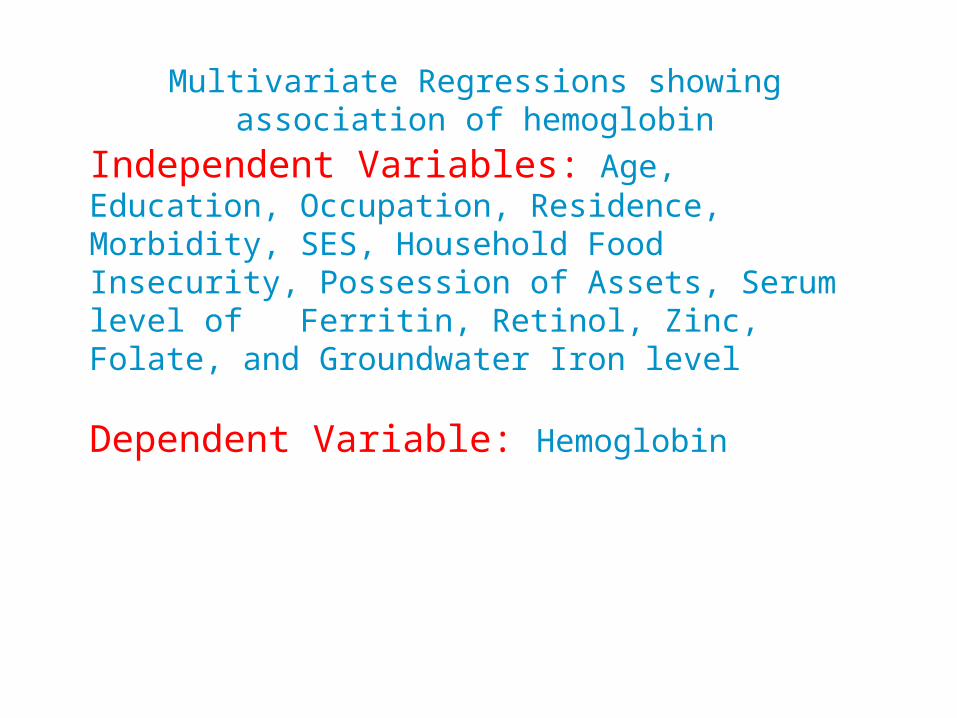
Multivariate Regressions showing association of hemoglobin
Independent Variables: Age, Education, Occupation, Residence, Morbidity, SES, Household Food Insecurity, Possession of Assets, Serum level of Ferritin, Retinol, Zinc, Folate, and Groundwater Iron level
Dependent Variable: Hemoglobin
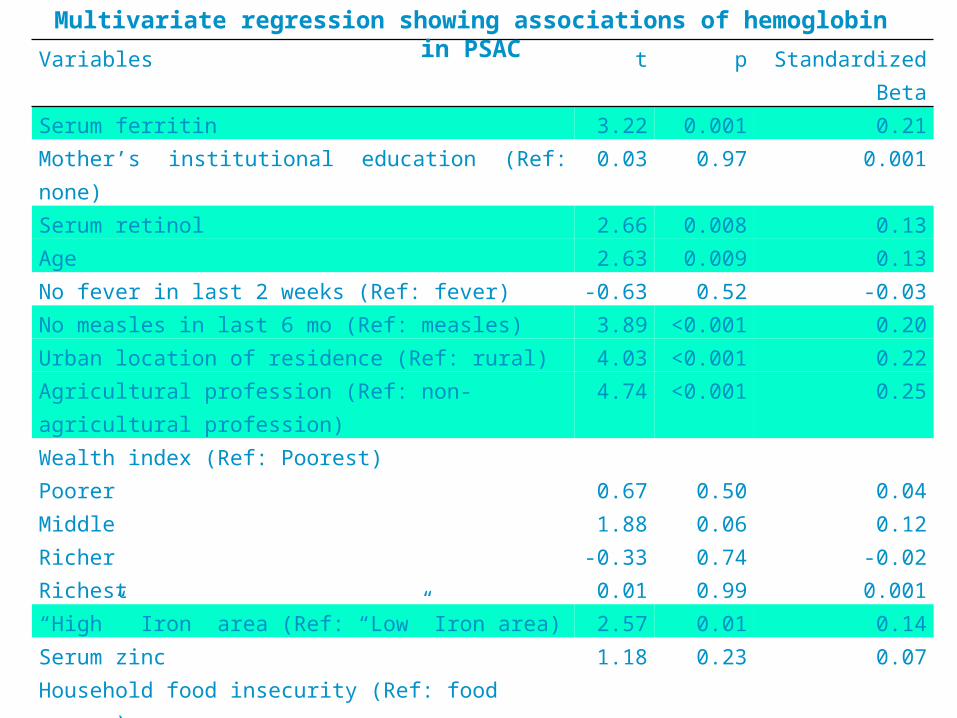
Variables t p Standardized BetaSerum ferritin 3.22 0.001 0.21Mother’s institutional education (Ref: none) 0.03 0.97 0.001Serum retinol 2.66 0.008 0.13Age 2.63 0.009 0.13No fever in last 2 weeks (Ref: fever) -0.63 0.52 -0.03No measles in last 6 mo (Ref: measles) 3.89 <0.001 0.20Urban location of residence (Ref: rural) 4.03 <0.001 0.22Agricultural profession (Ref: non-agricultural profession) 4.74 <0.001 0.25Wealth index (Ref: Poorest) Poorer 0.67 0.50 0.04Middle 1.88 0.06 0.12Richer -0.33 0.74 -0.02Richest 0.01 0.99 0.001“High” Iron area (Ref: “Low” Iron area) 2.57 0.01 0.14Serum zinc 1.18 0.23 0.07Household food insecurity (Ref: food secure) Mild food insecure -0.43 0.66 -0.02Moderate food insecure -3.73 <0.001 -0.21Severe food insecure -0.37 0.73 -0.02Possession of refrigerator (Ref: non possession) 1.38 0.16 0.12Do not possess a mobile phone (Ref: possession) -4.36 <0.001 -0.23
Multivariate regression showing associations of hemoglobin in PSAC
Variables t p Standardized BetaHousehold’s spending 2.17 0.03 0.07Serum ferritin 3.76 <0.001 0.11Wealth index (Ref: Poorest) Poorer -3.16 0.002 -0.11Middle -2.29 0.02 -0.08Richer -1.44 0.15 -0.05Richest -1.20 0.23 -0.05Serum retinol 5.14 <0.001 0.14Agricultural profession (Ref: non-agricultural) -3.09 0.002 -0.09Age 6.97 <0.001 0.20Female (Ref: male) -3.68 <0.001 -0.10No fever in last 2 weeks (Ref: fever) -1.94 0.06 -0.05Do not possess a mobile phone (Ref: Possession) -1.28 0.20 -0.04Do not possess a refrigerator (Ref: possession) -1.99 0.04 -0.08Urban location of residence (Ref: Rural) 2.58 0.01 0.08
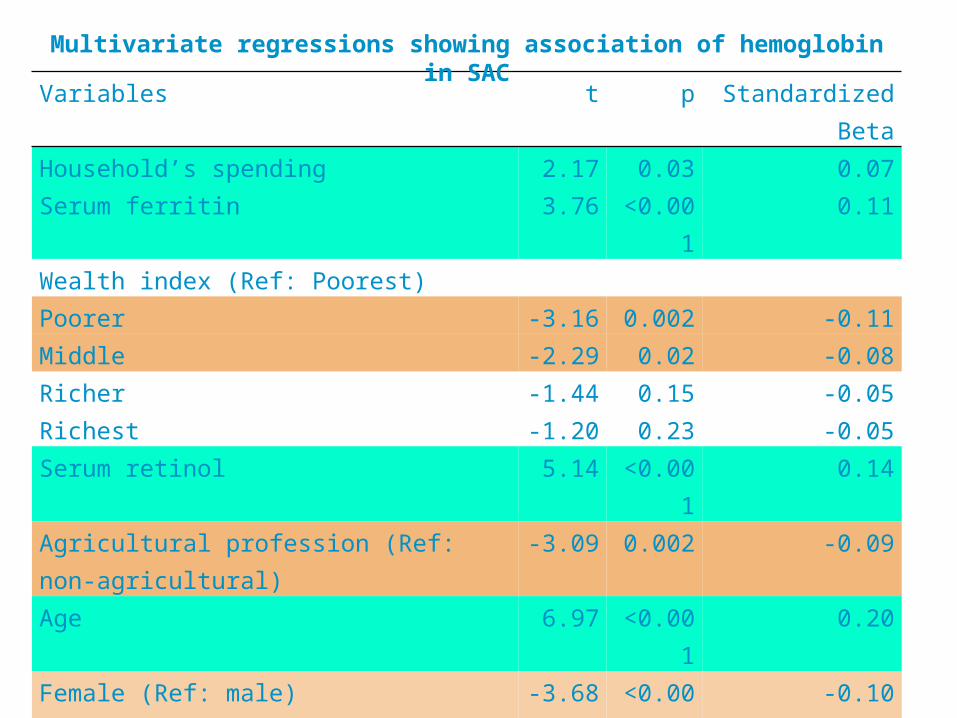
Multivariate regressions showing association of hemoglobin in SAC
Variables t p Standardized BetaHousehold’s spending -0.05 0.95 -0.003Serum ferritin 3.1 0.002 0.137-day animal source iron intake 2.46 0.01 0.127-day total iron intake -0.46 0.64 -0.02No. of para -1.42 0.15 -0.06Serum folate 2.13 0.03 0.09Serum retinol 2.93 0.004 0.13Location of residence (Ref: Rural Urban 1.52 0.13 0.06Slum 1.34 0.18 0.05Wealth index (Ref: Poorest) Poorer -1.04 0.30 -0.05Middle -1.67 0.10 -0.09Richer -1.59 0.11 -0.09Richest -0.35 0.72 -0.02Serum zinc 1.80 0.07 0.08Household food insecurity (Ref: food secure) Mild food insecure -4.34 <0.001 -0.20Moderate food insecure -1.14 0.25 -0.05Severe food insecure -0.24 0.81 -0.01
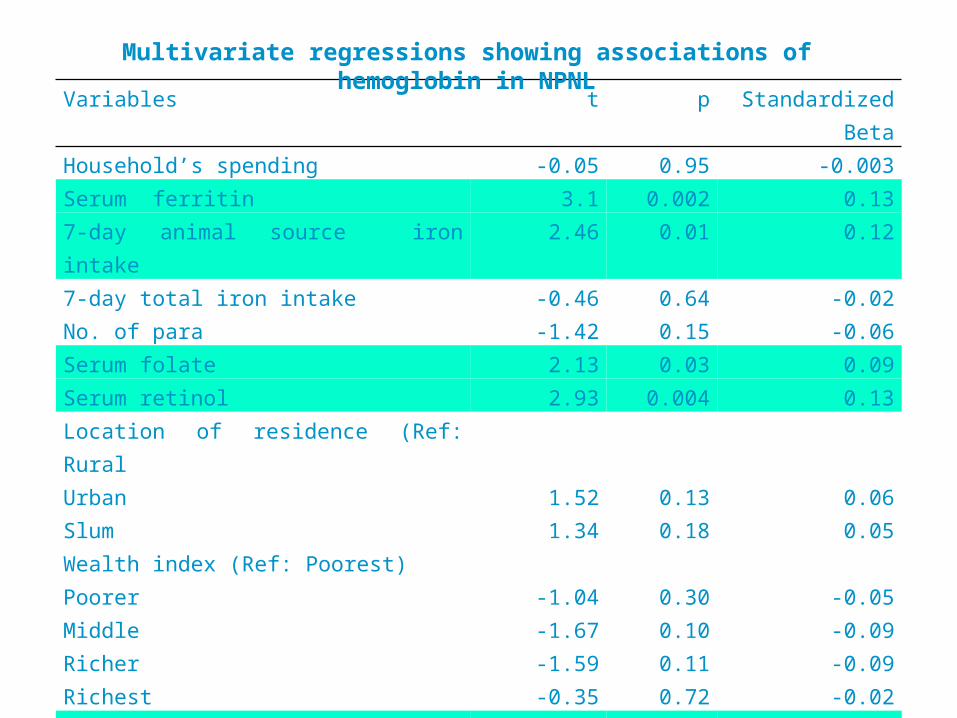
Multivariate regressions showing associations of hemoglobin in NPNL

Summary of positive associations of hemoglobinPreschool childrenSerum ferritinSerum retinolAge“High” iron in waterAbsence of measles in last 6 moUrban residenceAgricultural profession
School childrenHousehold expenseSerum ferritinSerum retinolAgeUrban residence
NPNL women7-day animal iron intakeSerum ferritinSerum retinolSerum folateSerum zinc
Hemoglobin
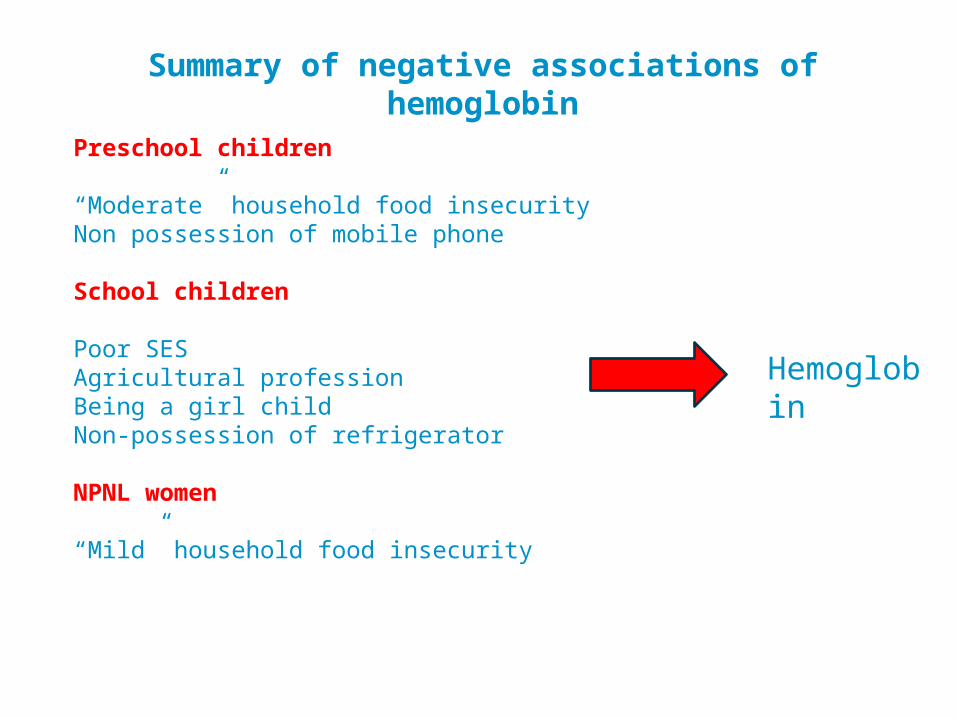
Summary of negative associations of hemoglobin
Preschool children
“Moderate” household food insecurityNon possession of mobile phone
School children
Poor SESAgricultural professionBeing a girl childNon-possession of refrigerator
NPNL women
“Mild” household food insecurity
Hemoglobin

Prevalence of folate deficiency n % 95% CI
National849 9.1 5.3-12.9
Rural294 8.6 3.6-13.5
Urban288 11.4 6.6-16.3
Slum267 7.9 3.3-12.4
Prevalence of folate deficiency(%)
S. Folate level <6.8 nmol/l (Lindstorm et al 2011)

7-day plant folate intake
7-day animal folate intake
7-day folate intake
National 1031 87 1118
Rural 951 86 1037
Urban 1237 93 1330
Slum 1550 74 1624
Dietary intake of folate by strata

7d Plant source folate
(microgram)
7d Animal source folate
( microgram)
7d total folate ( microgram)
Food secure 1057.5 109.3 1166
Mild insecure 946.9 90.5 1037
Moderate insecure
935.5 62.6 998
Severe insecure 1153.1 39.6 1192
Dietary Intake of folate by household food security in women
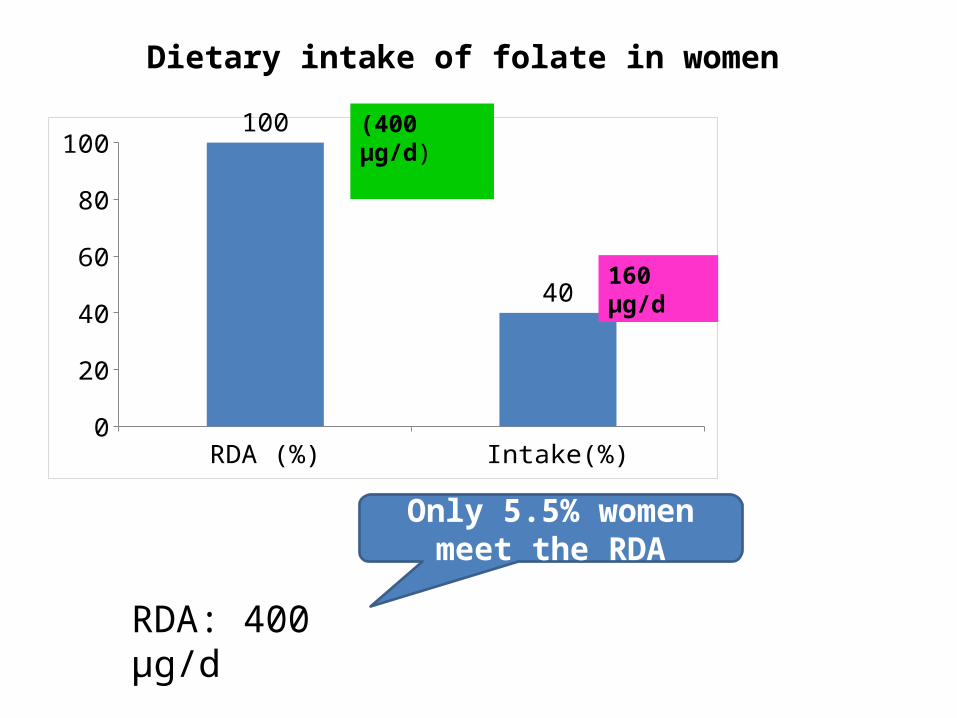
RDA (%) Intake(%)0
102030405060708090
100100
40
RDA: 400 µg/d
Only 5.5% women meet the RDA
Dietary intake of folate in women
(400 µg/d)
160 µg/d

Multivariate regressions showing association of serum folate in women
Independent Variables: Household expense, Dietary folate intake, Residence, Assets, Serum level of ferritin, retinol, SES, Household food insecurity
Dependent Variable: Serum Folate
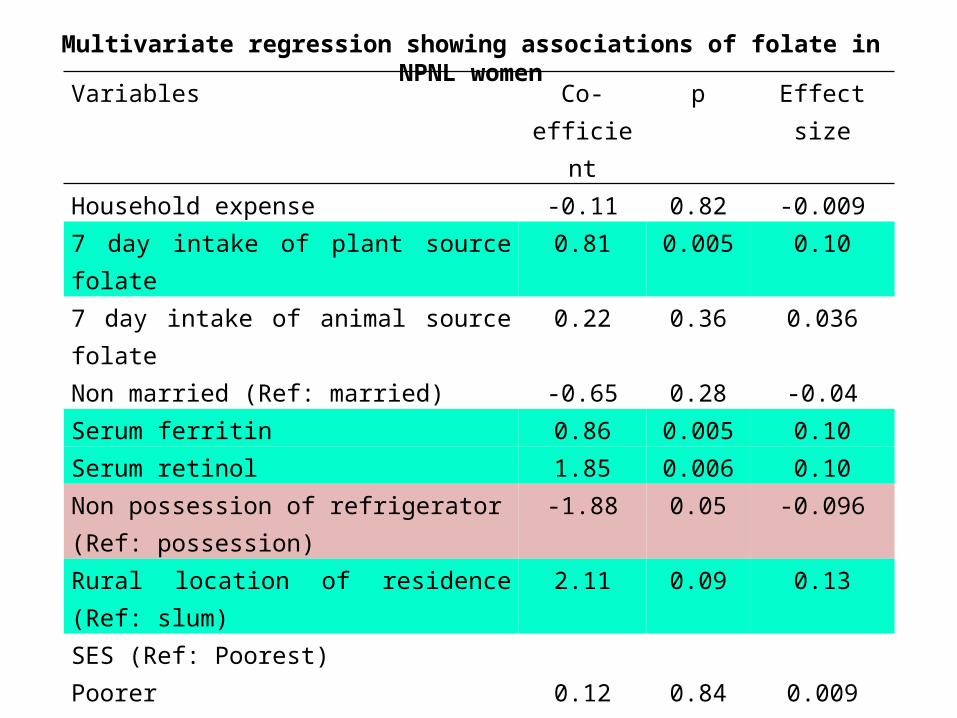
Variables Co-efficient p Effect sizeHousehold expense -0.11 0.82 -0.0097 day intake of plant source folate 0.81 0.005 0.107 day intake of animal source folate 0.22 0.36 0.036Non married (Ref: married) -0.65 0.28 -0.04Serum ferritin 0.86 0.005 0.10Serum retinol 1.85 0.006 0.10Non possession of refrigerator (Ref: possession)
-1.88 0.05 -0.096
Rural location of residence (Ref: slum) 2.11 0.09 0.13SES (Ref: Poorest) Poorer 0.12 0.84 0.009Middle 0.67 0.37 0.04Richer 1.44 0.14 0.07Richest 1.85 0.13 0.09Household food insecurity (Ref: Food secure) Moderate insecure -0.72 0.36 -0.03Moderate insecure -0.38 0.53 -0.02Severe insecure -0.83 0.28 -0.04
Multivariate regression showing associations of folate in NPNL women

Summary of positive associations of folate in women
Intake of plant source folateSerum ferritinSerum retinolRural residence
S. Folate
Summary of negative associations of folate in women
Non-possession of refrigerator
S. Folate