irish historical studies - history.columbian.gwu.edu · highest levels of emigration. the data also...
TRANSCRIPT

Irish Historical Studies
http://journals.cambridge.org/IHS
Additional services for Irish Historical Studies:
Email alerts: Click hereSubscriptions: Click hereCommercial reprints: Click hereTerms of use : Click here
Which Irish men and women immigrated to the United States during
the Great Famine migration of 1846–54?
Tyler Anbinder and Hope McCaffrey
Irish Historical Studies / Volume 39 / Issue 156 / November 2015, pp 620 - 642DOI: 10.1017/ihs.2015.22, Published online: 18 December 2015
Link to this article: http://journals.cambridge.org/abstract_S002112141500022X
How to cite this article:
Tyler Anbinder and Hope McCaffrey (2015). Which Irish men and womenimmigrated to the United States during the Great Famine migration of 1846–54?.Irish Historical Studies, 39, pp 620-642 doi:10.1017/ihs.2015.22
Request Permissions : Click here
Downloaded from http://journals.cambridge.org/IHS, IP address: 192.153.213.50 on 12 Jan 2016
Irish Historical Studies (2015), 39 (156), 620–642. © Irish Historical Studies Publications Ltd 2015doi:10.1017/ihs.2015.22
Which Irish men and women immigrated tothe United States during the Great Famine
migration of 1846–54?TYLER ANBINDER* and HOPE MCCAFFREY*
George Washington University, Washington D.C.
AB S TRAC T . Despite the extensive scholarly literature on both the Great Famine in Irelandand the Famine immigration to the United States, little is known about precisely which Irishmen and women emigrated from Ireland in the Famine era. This article makes use of a newdataset comprised of 18,000 Famine-era emigrants (2 per cent of the total) who landed at theport of New York from 1846 to 1854 and whose ship manifests list their Irish county of origin.The data is used to estimate the number of emigrants from each county in Ireland who arrived inNew York during the Famine era. Because three-quarters of all Irish immigrants intending tosettle in the United States took ships to New York, this dataset provides the best meansavailable for estimating the origins of the United States’s Famine immigrants. The authors findthat while the largest number of Irish immigrants came from some of Ireland’s most populouscounties, such as Cork, Galway, and Tipperary, surprisingly large numbers also originated inCounties Cavan, Meath, Dublin, and Queen’s County, places not usually associated with thehighest levels of emigration. The data also indicates that the overall level of emigration in theFamine years was significantly higher than scholars have previously understood.
In most ways, James Garvin of Castletownroche, Ireland, is typical of themore than 1,000,000 men, women, and children whose immigration to the
United States in the wake of the Great Famine can be traced in the survivingarchival record. From the manifest of the Princeton, the ship that carried him toAmerica, we learn that Garvin was, like most immigrants, a young adult in hisearly twenties when he landed in New York in 1852. Garvin did not boardthe Princeton in Ireland but, like most Irish immigrants of his era, he savedmoney by travelling via Liverpool, even though some ships sailed directlyto New York from Dublin, Cobh, and other Irish ports. Like hundreds ofthousands of other Irish immigrants, Garvin initially settled in NewYork City inone of its predominantly Irish neighbourhoods. As was often the case, Garvinmade it to theUnited States as a result of the process known as ‘chain migration’.
* Department of History, George Washington University, [email protected]* Department of History, George Washington University, [email protected]
620
James was the fourth member of his nuclear family to immigrate to New York –his older sister Ellen, who he lived with initially, had arrived in New York in1845, and his younger brothers John andWilliam had made the journey in 1850.Like most New Yorkers of his day, James opened a bank account, a fact docu-mented in the Emigrant Savings Bank records preserved at the NewYork PublicLibrary. By 1859, he had saved $103.45, the equivalent of about $2,700 today.1
But there is one way in which the documentation of Garvin’s immigrationsaga is unusual. While the vast majority of ship manifests from this era housedin the U.S. National Archives merely list each Famine refugee as a native ofIreland, the Princeton’s passenger roll records in precisely which Irish countyhe and the other 268 Irish immigrants travelling with him were born. Garvinand seventy-two of his fellow passengers were natives of County Cork,Ireland’s most populous county. Twenty-eight were from County Tipperary,twenty-six from County Cavan, and fifteen from County Dublin. In all,twenty-three of Ireland’s thirty-two counties were represented among thePrinceton’s 269 Irish-born passengers. The surprisingly detailed birthplacedata recorded in the Princeton’s manifest and dozens of others like it providean opportunity to answer a question that has tantalized historians for morethan a century: exactly where in Ireland did the United States’s Famineimmigrants originate?
Despite the vast literature on the Great Famine in Ireland and the Famineimmigration to the United States, few scholars have attempted to determineprecisely who left Ireland in the Famine era. Those studying particular Irish-American communities have noted when such places had a disproportionatenumber of immigrants from a specific Irish locale. Cleveland, for example, hadan unusually large number of immigrants from County Mayo; in Savannah,immigrants from County Wexford predominated; and refugees from CountiesSligo and Kerry were especially numerous in New York’s Five Pointsneighbourhood.2 But for the most part, historians of the Irish-Americanexperience, recognizing that ‘hard evidence is scarce’, have not been able todetermine the origins of the Famine immigrants in any detail. As a result, thescholarship on Irish-American immigration is largely silent on this question.3
1 Manifest of the Princeton, 11 June, 1852, (New York passenger lists, 1820–1957,Record Group 36, U.S. National Archives, accessed via Ancestry.com); family 506, 6thdistrict of the Fourteenth Ward, 1855 New York state census (Old RecordsDivision, New York County Clerk’s Office, accessed via familysearch.org); testbook and deposit ledgers for accounts 12,174, 17,871, 38,131, and 46,028, EmigrantSavings Bank (Emigrant Savings Bank papers, New York Public Library, accessed viaAncestry.com).
2 Nelson J. Callahan and William F. Hickey, The Irish Americans and theircommunities of Cleveland (Cleveland, 1978), p. 176; Edward M. Shoemaker, ‘Strangersand citizens: the Irish immigrant community of Savannah, 1837–1861’ (Ph.D. thesis,Emory University, 1990), p. 106; Tyler Anbinder, Five Points: the nineteenth-centuryNew York neighborhood that created tap dance, stole elections, and became the world’smost notorious slum (New York, 2001), p. 98.
3 Quotation from Cormac Ó Gráda, Black ’47 and beyond: the Great Irish Famine inhistory, economy, and memory (Princeton, 1999), p. 228. Among the most importantworks on the Famine Irish in America are Oscar Handlin, Boston’s immigrants,1790–1880: a study in acculturation (Cambridge, 1941); Robert Ernst, Immigrant life inNew York City: 1825–1863 (1949; reprint ed., Syracuse, 1994); Hasia R. Diner, Erin’sdaughters in America: Irish immigrant women in the nineteenth century (Baltimore, 1983);
ANBINDER AND MCCAFFREY–Which Irish men and women immigrated 621
There is an equally large historical literature on the Famine itself and manyof these works discuss emigration. Many are micro-histories that study theFamine in a single location but say little about their subjects once they boardthe emigrant ships. Macro-studies of the Famine sometimes devote a bit moreattention to the flight to America, but rarely say more than that the Famineemigrants came largely from northern, eastern, and central Ireland in the earlyyears of the Famine, while in the later years more emigrants originated in thesouth and west.4
When these authors do consider which parts of Ireland sent out the mostemigrants during the Famine, reliance is often placed on the half-century-oldwork of English geographer S. H. Cousens. To determine the flow ofemigration from each Irish county, Cousens compared the population of eachcounty listed in the 1841 census to that in 1851 (when the population of everycounty except Dublin had declined due to the Famine). Then Cousensexamined government reports of famine-related deaths in each county. Heattributed population decline greater than the reported famine-related deathsto emigration, and in that manner estimated the emigration ‘rate’ from eachIrish county (not the actual number of emigrants, but the proportion of thecounty’s population decline that seemed attributable to emigration). Since itspublication in 1960, Cousens’s work has been used by almost every historianseeking to quantify regional variation in the Famine emigration from Ireland.5
J. Matthew Gallman, Receiving Erin’s children: Philadelphia, Liverpool, and the Irishfamine migration, 1845–1855 (Chapel Hill, 2000); David T. Gleeson, The Irish in theSouth, 1815–1877 (Chapel Hill, 2001).
4 William Forbes Adams, Ireland and Irish emigrants to the New World from 1815 tothe Famine (New Haven, 1932); Arnold Schrier, Ireland and the American emigration1850–1900 (Minneapolis, 1958); Cecil Woodham-Smith, The Great Hunger: Ireland1845–1849 (New York, 1962); Joel Mokyr, Why Ireland starved: an analytical and quan-titative study of Irish poverty, 1800–1851 (Boston, 1983); Christine Kinealy, This greatcalamity: the Irish Famine, 1845–52 (Boulder, 1995); Robert Scally, The end of hiddenIreland: rebellion, famine, and emigration (New York, 1995); Ciarán ÓMurchadha, Sablewings over the land: Ennis, County Clare, and its wider community during the Great Famine(Ennis, 1998); Gerard Moran, Sending out Ireland’s poor: assisted emigration to NorthAmerica in the 19th century (Portland, 2004); Cormac Ó Gráda, Ireland’s Great Famine:interdisciplinary perspectives (Dublin, 2006); Mary Lee Dunn, Ballykilcline rising: fromFamine Ireland to immigrant America (Amherst, 2008); Ciarán Ó Murchadha, The GreatFamine: Ireland’s agony 1845–1852 (NewYork, 2011). For an example of the observationthat Irish emigration originated more in the north and east early on and more in the southand west toward the end of the Famine migration, see David Fitzpatrick, ‘Emigration,1801–70’, in W. E. Vaughan (ed.), A new history of Ireland, v- Ireland Under the Union, I,1801–70 (Oxford, 1989), pp 571, 608.
5 S. H. Cousens, ‘The regional pattern of emigration during the Great Irish Famine,1846–1851’ in Transactions and papers of the Institute of British Geographers, xxviii(1960), pp 119–34; Cousens, ‘The regional variation in emigration from Ireland between1821 and 1841’ in Transactions of the Institute of British Geographers, xxxvii (Dec. 1965),pp 15–30; Cousens, ‘Emigration and demographic change in Ireland, 1851–1861’ inEconomic History Review, new series, xiv (1961), pp 275–88. Examples of scholars whohave relied on Cousens’s data include OliverMacDonagh, ‘The Irish Famine emigrationto the United States’ in Perspectives in American History, x (1976), pp 419–21; Kerby A.Miller, Emigrants and exiles: Ireland and the Irish exodus to North America (New York,1985), p. 297; James S. Donnelly Jr., ‘Excess mortality and emigration’, in Vaughan (ed.),
622 Irish Historical Studies

A few scholars, most notably David Fitzpatrick, William J. Smyth, andCormac Ó Gráda, have attempted to refine, revise, or augment Cousens’swork.6 Beginning in May 1851, the British government tracked emigrationfrom Ireland at the county level, and many scholars, including Fitzpatrick,Ó Gráda, and Kerby Miller, make extensive use of this data in their work. Butgiven that we do not knowwhich Irish emigrants relocated to the United States(the remainder moved primarily to Great Britain, Canada, and Australia),we cannot be sure that the Irish emigration from 1851 onward matched theIrish-American immigration during the entirety of the Famine years. As aresult, the Irish emigration data that commences in mid-1851 does not provideanswers to the questions that historians of the Irish-American immigrationexperience are seeking.7
Some scholars have previously examined ship passenger lists in an attemptto better understand the demographics of the Famine immigration. But theyfocused on age, gender, and occupations and did not address the birthplaces ofthe Irish immigrants.8 Economic historians and those interested in the historyof trans-Atlantic shipping have also made some profitable use of ship manifestdata, but they have also ignored the question of the origins of America’s Irishimmigrants.9 Attempts to infer the geographic origins of the United States’s
Ireland under the Union, I, 1801–70, p. 354; Cormac Ó Gráda and Kevin H. O’Rourke,‘Mass migration as disaster relief’, in Ó Gráda, Ireland’s Great Famine, p. 131.
6 Fitzpatrick, ‘Emigration, 1801–70’, p. 620; William J. Smyth, ‘Exodus fromIreland – patterns of emigration’, in John Crowley, William J. Smyth, and MikeMurphy (eds), Atlas of the Great Irish Famine (New York, 2012), pp 496–7; Cormac ÓGráda, ‘A note on nineteenth-century Irish emigration statistics’ in Population Studies,xxix (1975), pp 143–9.
7 David Fitzpatrick has calculated that only about 40 per cent of the Irish who livedoutside of their county of birth in 1851 were residing in the United States. Another20 per cent, he estimates, were living in other parts of Ireland, and the remaining40 per cent had relocated to England, Canada, or Australia: David Fitzpatrick, Irishemigration, 1801–1921 (Dublin, 1984), p. 6. But by 1851, approximately three-quartersof Irish emigrants were relocating to the U.S., though the proportion could varysignificantly from year to year: Miller, Emigrants and exiles, pp 570–9; Ó Gráda, ‘Noteon nineteenth-century Irish emigration statistics’, pp 143–4.
8 Charlotte Erickson, ‘The uses of passenger lists for the study of British and Irishimmigration’ in Ira A. Glazier and Luigi De Rosa (eds), Migration across time andnations: population mobility in historical contexts (New York, 1986), pp 318–35;Deirdre Mageean, ‘Ulster emigration to Philadelphia, 1847–1865: a preliminary ana-lysis using passenger lists’, ibid., pp 276–86; Cormac ÓGráda, ‘Across the briny ocean:some thoughts on Irish emigration to America, 1800–1850’, ibid., pp 79–94; Ira A.Glazier, Deirdre Mageean, and Barbara Okeke, ‘Socio-demographic characteristics ofIrish immigrants, 1846–1851’ in Klaus Friedland (ed.), Maritime aspects of migration(Cologne, 1989), pp 243–78; Miller, Emigrants and exiles, p. 295.
9 Terry Coleman, Passage to America: a history of emigrants from Great Britain andIreland to America in the mid-nineteenth century (London, 1972); Robert Scally,‘Liverpool ships and Irish emigrants in the age of sail’ in Journal of Social History, xvii(1983), pp 5–30; Edward Laxton, The Famine ships: the Irish exodus to America 1846–51(London, 1996); Joseph P. Ferrie, Yankeys now: immigrants in the Antebellum UnitedStates 1840–1860 (New York, 1999); Kevin H. O’Rourke and Jeffrey G. Williamson,Globalization and history: the evolution of a nineteenth-century Atlantic economy (Boston,1999); Raymond L. Cohn, Mass migration under sail: European emigration to theAntebellum United States (New York, 2009).
ANBINDER AND MCCAFFREY–Which Irish men and women immigrated 623
Irish immigrants using the records of a single New York savings bank or themissing persons advertisements in a single Boston newspaper are admirablebut limited, and exemplify the desperate situation scholars face in trying todetermine where in Ireland the American Famine immigrants originated.10
Believing that manifests such as the one that recorded the arrival of JamesGarvin could help create a better estimate of the Irish county origins of theFamine immigrants than any published previously, a sample of Irishimmigrants arriving in New York from 1846 to 1854 was constructed fromthe passenger lists that provide such information.11 The year 1846 was chosenas the starting point because it is the first year in which observers noted anincrease in immigration due to the failure of the potato crop in Ireland. Theyear 1854 was selected as an end date because after that year immigrationplummeted to pre-Famine levels, in part because of a recession in the UnitedStates and in part because the rise of the anti-immigrant Know Nothingmovement made the United States seem like a less desirable destination.12 Thesepassenger lists were compiled not by American immigration officials but, as inGarvin’s case, by an officer on each emigrant ship and then submitted tocustoms officials upon arrival.This sample has several limitations which must be acknowledged at the
outset. First, the study was limited to the port of New York, where 74 per centof Irish immigrants to the United States landed from 1846 to 1854.13
Relatively few manifests from the other ports are extant in American archives,and very few of these list the Irish county of origin, but it must be noted thatthe findings might differ somewhat had every American port been included. Inparticular, not examining immigrants who arrived in Philadelphia probablymeans a slight undercounting of American immigrants from Ulster, sinceemigrants from that part of Ireland found Pennsylvania an especiallyattractive destination. Because ship traffic from Belfast and Londonderry toPhiladelphia decreased sharply after 1847, and virtually disappeared after1851, there was not much of a direct Ulster to Philadelphia migration duringthe Famine years. But even ships sailing from Liverpool to Philadelphiacarried significantly more Ulster emigrants than the Liverpool ships headedfor New York.14 The number of Irish who arrived in this period at each
10 Cormac Ó Gráda, ‘The Famine, the New York Irish, and their bank’ in Ó Gráda,Ireland’s Great Famine, pp 182–3; David Noel Doyle, ‘The remaking of Irish America,1845–1880’ in J. J. Lee and Marion R. Casey (eds), Making the Irish American: thehistory and heritage of the Irish in the United States (New York, 2006), pp 219–21,245 n. 21.11 Accessed via Ancestry.com. A total of sixty-nine New York ship manifests for
these years provide Irish immigrants’ county of birth, and these are listed in AppendixOne. Of the sixty-nine manifests, sixty-three are for ships sailing from Liverpool toNew York.12 For the number of Irish immigrating per year to the United States, see Susan B.
Carter, et al., (eds), Historical statistics of the United States (5 vols, New York,2006), i, 560.13 For the 74 per cent figure, see Table One.14 On the two ships sailing from Liverpool to Philadelphia whose manifests listed the
emigrants’ county of origin, slightly more than a third of the passengers originated inthe six northernmost Irish counties – Antrim, Armagh, Derry, Donegal, Down, andTyrone. In contrast, only 13 per cent of the Irish emigrants on ships sailingfrom Liverpool to New York originated in these counties. For the Philadelphia
624 Irish Historical Studies
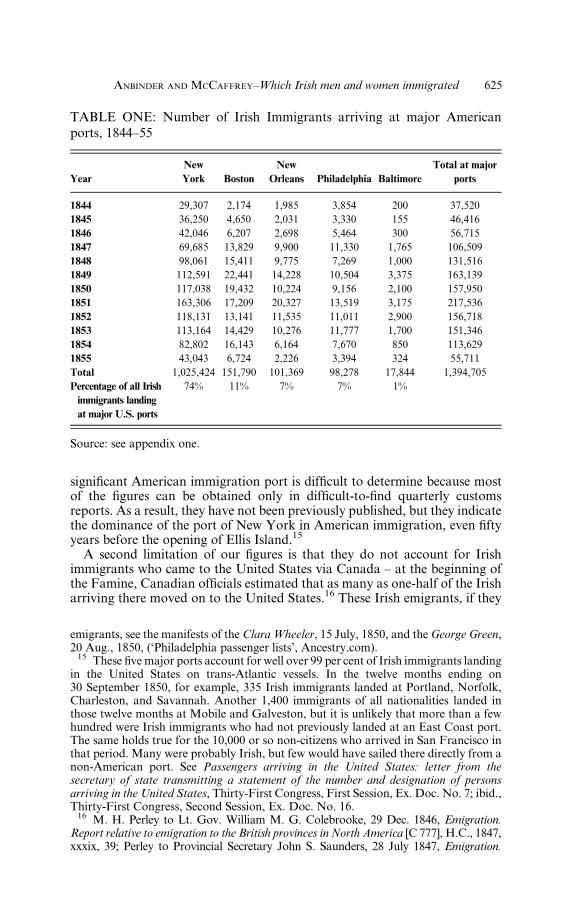
significant American immigration port is difficult to determine because mostof the figures can be obtained only in difficult-to-find quarterly customsreports. As a result, they have not been previously published, but they indicatethe dominance of the port of New York in American immigration, even fiftyyears before the opening of Ellis Island.15
A second limitation of our figures is that they do not account for Irishimmigrants who came to the United States via Canada – at the beginning ofthe Famine, Canadian officials estimated that as many as one-half of the Irisharriving there moved on to the United States.16 These Irish emigrants, if they
TABLE ONE: Number of Irish Immigrants arriving at major Americanports, 1844–55
YearNewYork Boston
NewOrleans Philadelphia Baltimore
Total at majorports
1844 29,307 2,174 1,985 3,854 200 37,5201845 36,250 4,650 2,031 3,330 155 46,4161846 42,046 6,207 2,698 5,464 300 56,7151847 69,685 13,829 9,900 11,330 1,765 106,5091848 98,061 15,411 9,775 7,269 1,000 131,5161849 112,591 22,441 14,228 10,504 3,375 163,1391850 117,038 19,432 10,224 9,156 2,100 157,9501851 163,306 17,209 20,327 13,519 3,175 217,5361852 118,131 13,141 11,535 11,011 2,900 156,7181853 113,164 14,429 10,276 11,777 1,700 151,3461854 82,802 16,143 6,164 7,670 850 113,6291855 43,043 6,724 2,226 3,394 324 55,711Total 1,025,424 151,790 101,369 98,278 17,844 1,394,705Percentage of all Irishimmigrants landingat major U.S. ports
74% 11% 7% 7% 1%
Source: see appendix one.
emigrants, see the manifests of the Clara Wheeler, 15 July, 1850, and the George Green,20 Aug., 1850, (‘Philadelphia passenger lists’, Ancestry.com).15 These five major ports account for well over 99 per cent of Irish immigrants landing
in the United States on trans-Atlantic vessels. In the twelve months ending on30 September 1850, for example, 335 Irish immigrants landed at Portland, Norfolk,Charleston, and Savannah. Another 1,400 immigrants of all nationalities landed inthose twelve months at Mobile and Galveston, but it is unlikely that more than a fewhundred were Irish immigrants who had not previously landed at an East Coast port.The same holds true for the 10,000 or so non-citizens who arrived in San Francisco inthat period. Many were probably Irish, but few would have sailed there directly from anon-American port. See Passengers arriving in the United States: letter from thesecretary of state transmitting a statement of the number and designation of personsarriving in the United States, Thirty-First Congress, First Session, Ex. Doc. No. 7; ibid.,Thirty-First Congress, Second Session, Ex. Doc. No. 16.16 M. H. Perley to Lt. Gov. William M. G. Colebrooke, 29 Dec. 1846, Emigration.
Report relative to emigration to the British provinces in North America [C 777], H.C., 1847,xxxix, 39; Perley to Provincial Secretary John S. Saunders, 28 July 1847, Emigration.
ANBINDER AND MCCAFFREY–Which Irish men and women immigrated 625

finished their journey by sea, were labelled on American manifestsas originating in British North America rather than Ireland, and if theycame by land (as the majority did) their crossings were not recorded at all.But after 1847, when Canadians passed laws to discourage the immigrationof Irish ‘paupers’, about 85 per cent of Irish emigrants heading toNorth America sailed directly to U.S. ports, so the lack of Canadian databecomes less of a problem after that date.17 Finally, we must note that only 2per cent of the arriving Irish immigrants listed their Irish birthplaceinformation – a larger sample would have been better. But given that916,000 Irish immigrants arrived at the port of New York in the nineyears under consideration, our sample of 18,000 Irish passengers is sound, ifnot perfect.18 Despite its limitations, this sample allows us to analyzethe sources of Irish immigrants to the United States far more accurately thanany previous study.19
The information from the manifests provides a number of insights into theFamine immigration. First and foremost, it enables us to calculate fairlyreliable estimates of the number of immigrants from each Irish county whoarrived in New York from 1846 to 1854.It is not surprising that County Cork, by far the most populous Irish county,
sent the most immigrants to the United States in the Famine years, nor thatGalway and Tipperary, the second and third most populous Irish counties,also appear near the top of the list. But other counties that rank near the topare somewhat surprising. Cavan, not a particularly populous county, ranks
Papers relative to emigration to the British provinces in North America, and to the Aus-tralian colonies. Part I. British provinces in North America, H.C. 1847–48 (50) xlvii, 89–90.17 Colonial Land and Emigration Commission, Twelfth general report of the Colonial
Land and Emigration Commissioners, 1852 [C 1499], H.C., 1852, 13–14; JonathanKeljik, ‘Canadians’ consternation: Irish immigration, competition, and Canada’srelationship to the United States and the British empire in the 1840s’, 49th Parallel: aninterdisciplinary journal of North American Studies, xxvii (Winter 2012): 9-11 (e-journalavailable at http://www.49thparallel.bham.ac.uk/back/issue27/Keljik.pdf). The 85%figure is based on the number of British subjects sailing to all Canadian and Americanports from 1848 to 1851.18 The figure of 916,000 Irish passengers arriving in NewYork from 1846 to 1854 was
derived as follows: precise figures fromMay 1847 through the end of 1854 are availablein theAnnual reports of the Commissioners of Emigration of the State of New York, fromthe Organization of the Commission, May 5, 1847, to 1860 (New York, 1861), p. 288.For 1846 and the first four months of 1847, see Passengers Arriving in the United States,Twenty-Ninth Congress, Second Session, House of Representatives, Doc. No. 98,pp 18–21, and Passengers arriving in the United States, Thirtieth Congress, FirstSession, House of Representatives, Ex. Doc. No. 47, pp 32–5. For reasons that are notentirely clear, the New York customs officials in 1846 and 1847 subsumed all Irishimmigrants under the total from ‘Great Britain’, even though the collectors in Bostonand Philadelphia distinguished the Irish from other British immigrants. In order todetermine the number of Irish immigrants among the ‘Great Britain’ passengersarriving in New York in 1846 and early 1847, we estimated that the proportion of Irishamong the British immigrants landing in New York was the same as that in Boston andPhiladelphia (80 per cent in 1846 and 82 per cent in the first half of 1847).19 The entire data set can be found in Excel format at https://dataverse.harvard.edu/
dataverse/anbinder, the website of the Harvard University Institute for QuantitativeSocial Science. Information derived from this sample will be cited below as ‘Irishemigrants manifest database’.
626 Irish Historical Studies
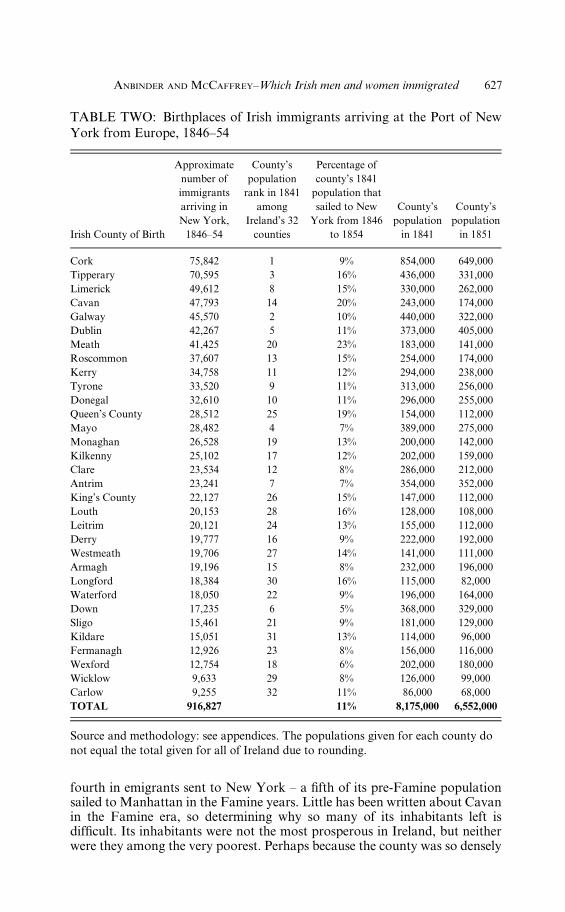
fourth in emigrants sent to New York – a fifth of its pre-Famine populationsailed to Manhattan in the Famine years. Little has been written about Cavanin the Famine era, so determining why so many of its inhabitants left isdifficult. Its inhabitants were not the most prosperous in Ireland, but neitherwere they among the very poorest. Perhaps because the county was so densely
TABLE TWO: Birthplaces of Irish immigrants arriving at the Port of NewYork from Europe, 1846–54
Irish County of Birth
Approximatenumber ofimmigrantsarriving inNew York,1846–54
County’spopulationrank in 1841
amongIreland’s 32counties
Percentage ofcounty’s 1841population thatsailed to New
York from 1846to 1854
County’spopulationin 1841
County’spopulationin 1851
Cork 75,842 1 9% 854,000 649,000Tipperary 70,595 3 16% 436,000 331,000Limerick 49,612 8 15% 330,000 262,000Cavan 47,793 14 20% 243,000 174,000Galway 45,570 2 10% 440,000 322,000Dublin 42,267 5 11% 373,000 405,000Meath 41,425 20 23% 183,000 141,000Roscommon 37,607 13 15% 254,000 174,000Kerry 34,758 11 12% 294,000 238,000Tyrone 33,520 9 11% 313,000 256,000Donegal 32,610 10 11% 296,000 255,000Queen’s County 28,512 25 19% 154,000 112,000Mayo 28,482 4 7% 389,000 275,000Monaghan 26,528 19 13% 200,000 142,000Kilkenny 25,102 17 12% 202,000 159,000Clare 23,534 12 8% 286,000 212,000Antrim 23,241 7 7% 354,000 352,000King’s County 22,127 26 15% 147,000 112,000Louth 20,153 28 16% 128,000 108,000Leitrim 20,121 24 13% 155,000 112,000Derry 19,777 16 9% 222,000 192,000Westmeath 19,706 27 14% 141,000 111,000Armagh 19,196 15 8% 232,000 196,000Longford 18,384 30 16% 115,000 82,000Waterford 18,050 22 9% 196,000 164,000Down 17,235 6 5% 368,000 329,000Sligo 15,461 21 9% 181,000 129,000Kildare 15,051 31 13% 114,000 96,000Fermanagh 12,926 23 8% 156,000 116,000Wexford 12,754 18 6% 202,000 180,000Wicklow 9,633 29 8% 126,000 99,000Carlow 9,255 32 11% 86,000 68,000TOTAL 916,827 11% 8,175,000 6,552,000
Source and methodology: see appendices. The populations given for each county donot equal the total given for all of Ireland due to rounding.
ANBINDER AND MCCAFFREY–Which Irish men and women immigrated 627
populated, even by Irish standards, there was also a strong tradition ofseasonal labour migration in Cavan. Thousands temporarily left the countyeach year, travelling to England in search of work, but returning in autumn toharvest their potatoes. When the potato blight struck, Cavan was not one ofthe very worst hit areas, yet neither was it one of the eastern and north-easterncounties in which suffering and death were below average. It seems likely thatthe people of Cavan were hit hard enough by the Famine to want to emigrate,but not so badly affected that they lacked the capacity to do so. As a result,once the potato blight struck in 1845 and persisted in subsequent years,residents of Cavan once again walked to Dublin and boarded ships forLiverpool. But now, instead of dispersing across England, they transferred tothe trans-Atlantic sailing ships that left Liverpool almost daily for New York.These same factors probably help explain the larger-than-expected emigrationfrom Meath and Queen’s County as well.20
Perhaps the most surprising county near the top of our list is Dublin. BecauseDublin was the only one of Ireland’s thirty-two counties to gain populationduring the Famine (due to in-migration from other parts of the island), Cousensand scholars drawing on his work could not detect any emigration from there atall. As a result, Dublin is rarely mentioned in the Famine literature as a majorsource of American immigrants, even though the proximity of its residents toDublin’s busy port made emigration from there relatively easy. Yet theAmerican ship manifests prove that County Dublin sent large numbers of Irishimmigrants to the United States. By the end of 1854, about 45,000 residents ofDublin, one-eighth of its pre-Famine population, had immigrated to theUnitedStates via New York.21One might wonder if the high number of immigrantsrecorded in the manifests from Dublin could be accurate given Dublin’spopulation increase during the Famine years. Perhaps ship passengers toldofficials where they had last lived rather than where they were born. But theevidence suggests that the manifest figures indicating high levels of emigrationof Dublin natives are not erroneous. At the Irish-run Emigrant Savings Bankthat opened in 1850 in New York, bank employees asked all Irish-borndepositors specifically for their parish and county of birth. County Dublinranked sixth out of Ireland’s thirty-two counties in terms of Irish customerbirthplaces, just as it ranks sixth in the manifests. It should not surprise us thatthe fifth most populous Irish county, one with a major seaport, sent the sixthmost emigrants to New York.22
20 Smyth and Murphy (eds), Atlas of the Great Irish Famine, pp 7, 9, 34, 60, 89, 93,108–9, 117; Kevin O’Neill, Family and farm in pre-Famine Ireland: the parish ofKilleshandra (Madison, 1984), pp 32–124, 167–92; Margaret Crawford, ‘Poverty andthe Famine in County Cavan’, in Raymond Gillespie (ed.), Cavan: essays on the historyof an Irish county (2nd edn, Dublin, 2004), pp 139–58; Danny Cusack, The GreatFamine in County Meath (Navan, 1996), pp 13–20.21 There is surprisingly little written about the Famine in Dublin, but see Frank
Corrigan, ‘Dublin workhouses during the Great Famine’ in Dublin Historical Record,xxix, no. 2 (1975–6), pp 59–65; Timothy Guinnane and Cormac ÓGráda, ‘Mortality intheNorthDublinUnion during theGreat Famine’ inEconomicHistory Review, lx (2002),pp 487–506; Sinéad Collins, Balrothery Poor Law Union, County Dublin, 1839–1851(Dublin, 2005); Ó Gráda, Black ’47, pp 157–90.22 Data on the Irish county of birth of 10,900 immigrants who opened accounts
at the Emigrant Savings Bank come from the database listing each individualwho, from 1850 to 1858, opened one of the bank’s first 18,000 accounts. This data was
628 Irish Historical Studies
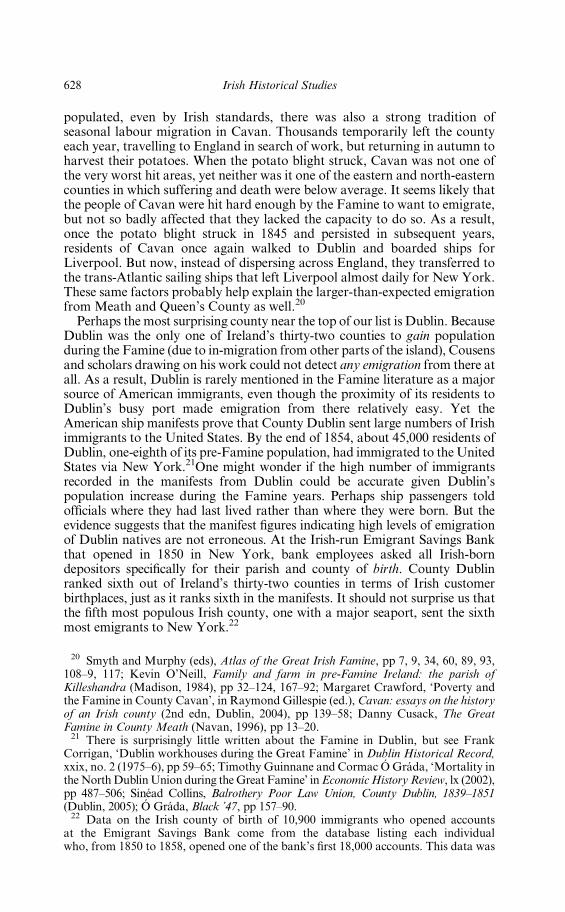
Equally noteworthy are the populous counties that did not rank as high inimmigrants sent to New York as they did in total population. Counties Downand Antrim, which converge at the city of Belfast and ranked sixth and seventhin population in 1841, were twenty-sixth and seventeenth respectively inthe number of immigrants sent to New York. This fact may stem from therelative prosperity of those counties, perhaps giving their residents less reason
Map One: Irish immigrants landing in New York, 1846–1854 by county of birth
compiled by Tyler Anbinder in collaboration with economic historians Cormac ÓGráda and Simone Wegge. A 5 per cent sample of this data is currently available athttps://dataverse.harvard.edu/dataverse/anbinder and the entire data set will be placedin the same location after work on it is completed.
ANBINDER AND MCCAFFREY–Which Irish men and women immigrated 629
to emigrate. Emigrants from these north-east counties may also have chosen torelocate to other places including Great Britain or Canada. The Ulster Irish asa whole definitely preferred Pennsylvania to New York, and this factor mayaccount for the low immigration rate to New York from these counties. Manytook ships from Belfast directly to Philadelphia. The relative dearth ofemigrants from another populous county, Mayo, however, cannot be ascribedto the same causes.23
The Irish immigration varied not only by place but also over time. It haslong been understood that the north and east of Ireland sent more immigrantsto North America in the early years of the Famine, while the south and westcame to dominate the outflow by about 1851. Our data in some ways confirmsthese long-held views about the differences between the early and later Famineemigration, albeit with some significant wrinkles. The most striking thingabout Tables Two and Three, in our opinion, is less the variation between thetwo periods, which is usually emphasized in the historical literature on theFamine, and more the striking continuities. Seven of the ten leading sources ofIrish immigration in the early years of the Famine were also the leadingsources of immigrants in its later years. Cavan,Meath, and Roscommon in thenorthern midlands, Cork, Tipperary, Limerick, and Galway in the south andwest, Dublin in the east, and Donegal in the northwest sent large numbers ofimmigrants to the United States throughout the Famine years. Only Tyrone inthe north fell off the top-ten list from the early to the late years, replaced byKerry in the southwest. But overall, in terms of Irish county of origin,continuity was more significant than change over the course of the IrishFamine immigration.24
Comparing Table Four to the official data on Irish emigration that theBritish government began compiling on May 1, 1851 indicates that ourestimates of Irish immigration to New York are fairly accurate. The Britishrecords and our manifest data both suggest that the same five counties – Cork,Tipperary, Limerick, Galway, and Kerry – sent the most emigrants out ofIreland from 1851 to 1854. But further down the list, our rankings differ fromthose of port officials tallying all Irish emigration, something to be expectedwhen the difference from county to county is only a few hundred people peryear. Both lists also place Cavan andDonegal in the top ten, but while the NewYork manifests indicate that Dublin, Meath, and Roscommon rounded outthe top ten, the British figures for Irish emigration from 1851 to 1854 placeClare, Waterford, and Kilkenny ahead of those three. In the case of Kilkenny,the British government ranked it eighth in emigration from 1851 to 1854
23 This Ulster to Philadelphia emigration is well documented in the J. & J. Cooke,Shipping Agents collection, Public Record Office of Northern Ireland. Also seeMageean, ‘Ulster emigration to Philadelphia’. On the situation in Antrim and Downduring the Famine, see Christine Kinealy and Gerard Mac Atasney, The hidden Famine:poverty and sectarianism in Belfast, 1840–1850 (London, 2000); onMayo consult DonaldJordan, Land and popular politics in Ireland: County Mayo from the Plantation to theLand War (New York, 1994), pp 103–18.24 The data on early Irish Famine immigration needs to be used with some caution,
because we know that many Irish in these years immigrated to Canada, and that manyof them later moved to the United States. It is impossible, however, to determinewhether the Irish who went to Canada in these years came from different parts ofIreland than those who went to New York.
630 Irish Historical Studies
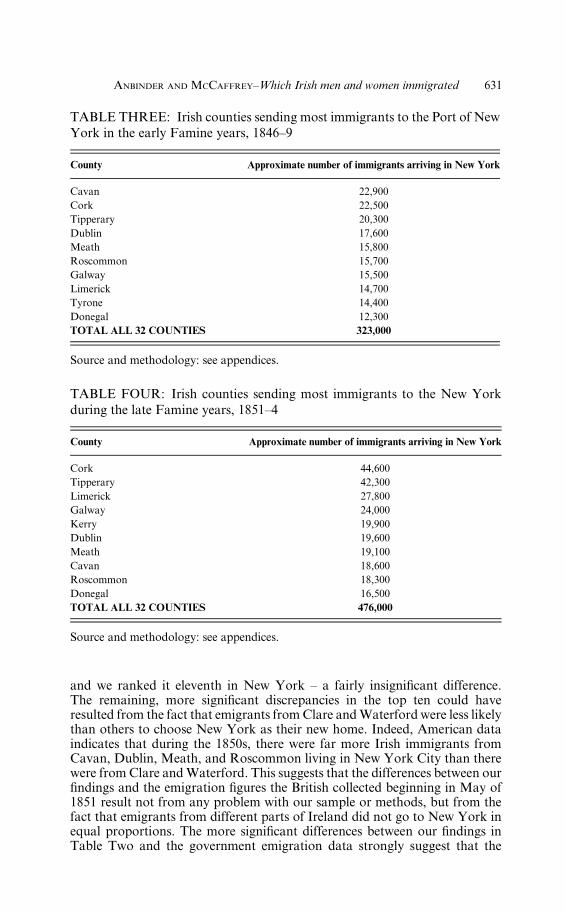
and we ranked it eleventh in New York – a fairly insignificant difference.The remaining, more significant discrepancies in the top ten could haveresulted from the fact that emigrants from Clare andWaterford were less likelythan others to choose New York as their new home. Indeed, American dataindicates that during the 1850s, there were far more Irish immigrants fromCavan, Dublin, Meath, and Roscommon living in New York City than therewere from Clare andWaterford. This suggests that the differences between ourfindings and the emigration figures the British collected beginning in May of1851 result not from any problem with our sample or methods, but from thefact that emigrants from different parts of Ireland did not go to New York inequal proportions. The more significant differences between our findings inTable Two and the government emigration data strongly suggest that the
TABLE THREE: Irish counties sending most immigrants to the Port of NewYork in the early Famine years, 1846–9
County Approximate number of immigrants arriving in New York
Cavan 22,900Cork 22,500Tipperary 20,300Dublin 17,600Meath 15,800Roscommon 15,700Galway 15,500Limerick 14,700Tyrone 14,400Donegal 12,300TOTAL ALL 32 COUNTIES 323,000
Source and methodology: see appendices.
TABLE FOUR: Irish counties sending most immigrants to the New Yorkduring the late Famine years, 1851–4
County Approximate number of immigrants arriving in New York
Cork 44,600Tipperary 42,300Limerick 27,800Galway 24,000Kerry 19,900Dublin 19,600Meath 19,100Cavan 18,600Roscommon 18,300Donegal 16,500TOTAL ALL 32 COUNTIES 476,000
Source and methodology: see appendices.
ANBINDER AND MCCAFFREY–Which Irish men and women immigrated 631
government figures for 1851 onward are not the best source for understandingthe sources of the entire Famine emigration, which began in 1846.25
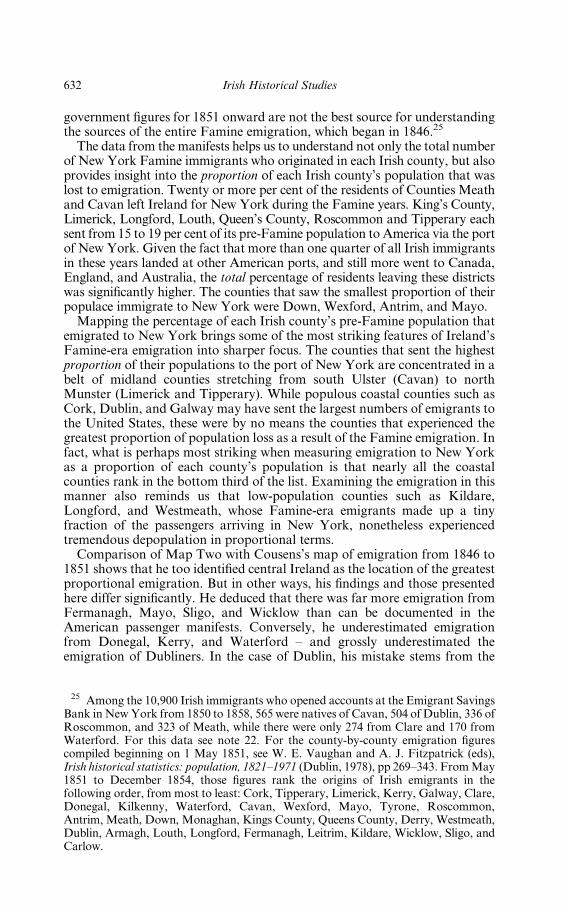
The data from the manifests helps us to understand not only the total numberof New York Famine immigrants who originated in each Irish county, but alsoprovides insight into the proportion of each Irish county’s population that waslost to emigration. Twenty or more per cent of the residents of Counties Meathand Cavan left Ireland for New York during the Famine years. King’s County,Limerick, Longford, Louth, Queen’s County, Roscommon and Tipperary eachsent from 15 to 19 per cent of its pre-Famine population to America via the portof New York. Given the fact that more than one quarter of all Irish immigrantsin these years landed at other American ports, and still more went to Canada,England, and Australia, the total percentage of residents leaving these districtswas significantly higher. The counties that saw the smallest proportion of theirpopulace immigrate to New York were Down, Wexford, Antrim, and Mayo.Mapping the percentage of each Irish county’s pre-Famine population that
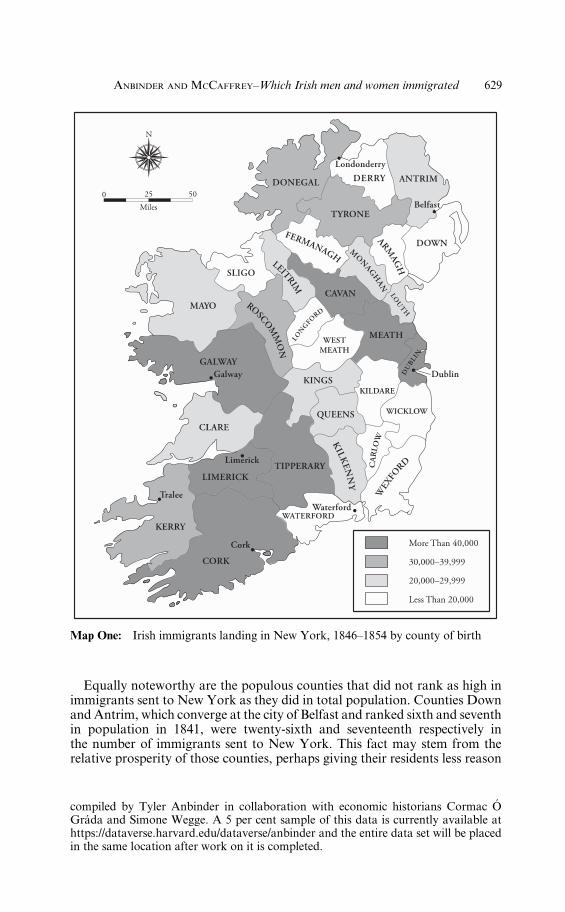
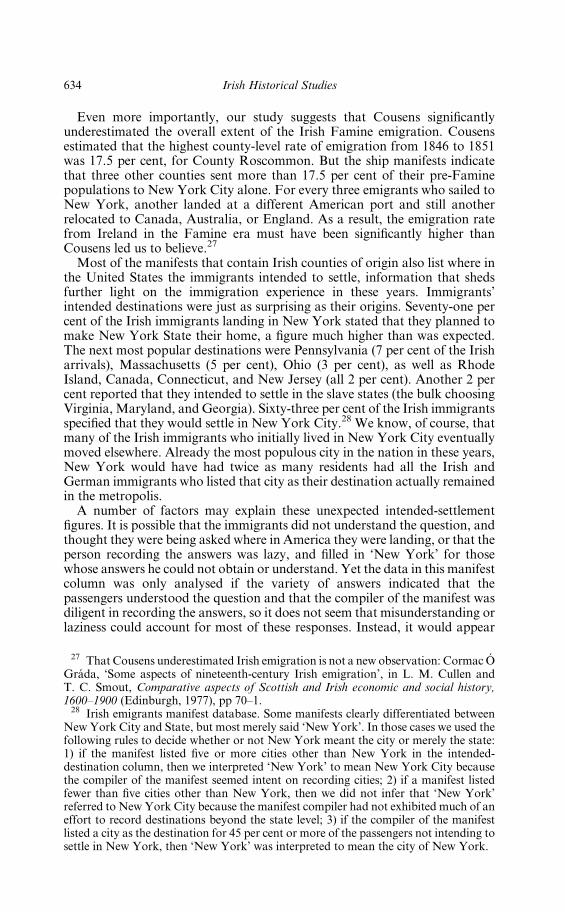
emigrated to New York brings some of the most striking features of Ireland’sFamine-era emigration into sharper focus. The counties that sent the highestproportion of their populations to the port of New York are concentrated in abelt of midland counties stretching from south Ulster (Cavan) to northMunster (Limerick and Tipperary). While populous coastal counties such asCork, Dublin, and Galway may have sent the largest numbers of emigrants tothe United States, these were by no means the counties that experienced thegreatest proportion of population loss as a result of the Famine emigration. Infact, what is perhaps most striking when measuring emigration to New Yorkas a proportion of each county’s population is that nearly all the coastalcounties rank in the bottom third of the list. Examining the emigration in thismanner also reminds us that low-population counties such as Kildare,Longford, and Westmeath, whose Famine-era emigrants made up a tinyfraction of the passengers arriving in New York, nonetheless experiencedtremendous depopulation in proportional terms.Comparison of Map Two with Cousens’s map of emigration from 1846 to
1851 shows that he too identified central Ireland as the location of the greatestproportional emigration. But in other ways, his findings and those presentedhere differ significantly. He deduced that there was far more emigration fromFermanagh, Mayo, Sligo, and Wicklow than can be documented in theAmerican passenger manifests. Conversely, he underestimated emigrationfrom Donegal, Kerry, and Waterford – and grossly underestimated theemigration of Dubliners. In the case of Dublin, his mistake stems from the
25 Among the 10,900 Irish immigrants who opened accounts at the Emigrant SavingsBank in NewYork from 1850 to 1858, 565 were natives of Cavan, 504 of Dublin, 336 ofRoscommon, and 323 of Meath, while there were only 274 from Clare and 170 fromWaterford. For this data see note 22. For the county-by-county emigration figurescompiled beginning on 1 May 1851, see W. E. Vaughan and A. J. Fitzpatrick (eds),Irish historical statistics: population, 1821–1971 (Dublin, 1978), pp 269–343. FromMay1851 to December 1854, those figures rank the origins of Irish emigrants in thefollowing order, from most to least: Cork, Tipperary, Limerick, Kerry, Galway, Clare,Donegal, Kilkenny, Waterford, Cavan, Wexford, Mayo, Tyrone, Roscommon,Antrim, Meath, Down, Monaghan, Kings County, Queens County, Derry, Westmeath,Dublin, Armagh, Louth, Longford, Fermanagh, Leitrim, Kildare, Wicklow, Sligo, andCarlow.
632 Irish Historical Studies

limitations of his methodology. In the other instances, his figures may differfrom those presented here because his method did not allow him to considerthe significant Famine-related emigration in 1852, 1853, and 1854. It is alsopossible that in cases where he estimated more emigration than the Americanmanifests document, residents of these counties might have chosen toimmigrate to destinations other than New York. But the data presented here,which is based on documented immigrants rather than deduction fromunreliable Famine death records, and covers the entirety of the Famine-eraemigration, can be considered to present a more reliable set of figures.26
Map Two: Proportion of each Irish county’s 1841 population that emigrated toNew York, 1846–1854
26 Cousens, ‘Regional pattern of emigration’, p. 121.
ANBINDER AND MCCAFFREY–Which Irish men and women immigrated 633
Even more importantly, our study suggests that Cousens significantlyunderestimated the overall extent of the Irish Famine emigration. Cousensestimated that the highest county-level rate of emigration from 1846 to 1851was 17.5 per cent, for County Roscommon. But the ship manifests indicatethat three other counties sent more than 17.5 per cent of their pre-Faminepopulations to New York City alone. For every three emigrants who sailed toNew York, another landed at a different American port and still anotherrelocated to Canada, Australia, or England. As a result, the emigration ratefrom Ireland in the Famine era must have been significantly higher thanCousens led us to believe.27
Most of the manifests that contain Irish counties of origin also list where inthe United States the immigrants intended to settle, information that shedsfurther light on the immigration experience in these years. Immigrants’intended destinations were just as surprising as their origins. Seventy-one percent of the Irish immigrants landing in New York stated that they planned tomake New York State their home, a figure much higher than was expected.The next most popular destinations were Pennsylvania (7 per cent of the Irisharrivals), Massachusetts (5 per cent), Ohio (3 per cent), as well as RhodeIsland, Canada, Connecticut, and New Jersey (all 2 per cent). Another 2 percent reported that they intended to settle in the slave states (the bulk choosingVirginia, Maryland, and Georgia). Sixty-three per cent of the Irish immigrantsspecified that they would settle in New York City.28 We know, of course, thatmany of the Irish immigrants who initially lived in New York City eventuallymoved elsewhere. Already the most populous city in the nation in these years,New York would have had twice as many residents had all the Irish andGerman immigrants who listed that city as their destination actually remainedin the metropolis.A number of factors may explain these unexpected intended-settlement
figures. It is possible that the immigrants did not understand the question, andthought they were being asked where in America they were landing, or that theperson recording the answers was lazy, and filled in ‘New York’ for thosewhose answers he could not obtain or understand. Yet the data in this manifestcolumn was only analysed if the variety of answers indicated that thepassengers understood the question and that the compiler of the manifest wasdiligent in recording the answers, so it does not seem that misunderstanding orlaziness could account for most of these responses. Instead, it would appear
27 That Cousens underestimated Irish emigration is not a new observation: Cormac ÓGráda, ‘Some aspects of nineteenth-century Irish emigration’, in L. M. Cullen andT. C. Smout, Comparative aspects of Scottish and Irish economic and social history,1600–1900 (Edinburgh, 1977), pp 70–1.28 Irish emigrants manifest database. Some manifests clearly differentiated between
New York City and State, but most merely said ‘New York’. In those cases we used thefollowing rules to decide whether or not New York meant the city or merely the state:1) if the manifest listed five or more cities other than New York in the intended-destination column, then we interpreted ‘New York’ to mean New York City becausethe compiler of the manifest seemed intent on recording cities; 2) if a manifest listedfewer than five cities other than New York, then we did not infer that ‘New York’referred to New York City because the manifest compiler had not exhibited much of aneffort to record destinations beyond the state level; 3) if the compiler of the manifestlisted a city as the destination for 45 per cent or more of the passengers not intending tosettle in New York, then ‘New York’ was interpreted to mean the city of New York.
634 Irish Historical Studies
that the intended-settlement responses indicate that for any number of reasons(lack of money, exhaustion, health, economic opportunity), the majority ofIrish immigrants landing in New York did initially intend to live there. It ispossible that even if these immigrants planned to eventually move elsewhere,they may have believed that New York was the best place to start life inAmerica. On the other hand, it is possible that the decision to leave New Yorkwas only made after the immigrants had already lived in the United Statesand learned more about the nation and the geographic variation in employ-ment opportunities. Whatever the case might be, while most Irish immigrantsdid eventually decide that it would be preferable to leave New York, the factthat so many initially intended to settle there has not been previouslyunderstood.29
An immigrant’s county of origin in Ireland also affected, to some extent, hisor her intended place of settlement in the United States. Immigrants arriving inNew York from the five north-eastern counties of Ulster (Armagh, Antrim,Down, Derry, and Tyrone) were nearly three times more likely to continue onto Pennsylvania than other Irish immigrants. It is not clear whether theseimmigrants moved to Pennsylvania because they could more easily afford todo so, because they considered Pennsylvania more welcoming to Ulsterimmigrants, or because they sought to join Ulster immigrants who had settledin Pennsylvania before the Famine. All three factors may have been involved.We do know that there were longstanding trade connections between Belfast,Londonderry, and Philadelphia, and that the transportation of large numbersof immigrants from these Irish ports to Philadelphia predated the Famine.30
The manifests also reveal that a disproportionately large number of theimmigrants from the northern half of Ireland (not Ulster alone) settled inIllinois. Again, it is unclear whether this pattern was a result of the financialability of these immigrants to continue their journeys to the west or if otherfactors pulled them there. Other than these two correlations, there was notsignificant variation in settlement patterns among the Famine Irish whencontrolling for county of birth.31
The Irish occupations of the immigrants also varied by county of birth.Immigrants from north-east Ireland were much less likely to have worked aslabourers before emigrating than those from other counties. About half themale emigrants from Antrim, Armagh, Derry, and Down were labourers,while from the rest of Ireland the proportion was typically about 70 per cent,and grew as high as 85 per cent for the male immigrants from Roscommon,Cavan, and Kerry. The rest of the male emigrants were not primarily farmers –only 6 per cent reported that to be their occupation – but rather artisans. Notsurprisingly, the county that sent the highest proportion of tradesmen to NewYork was Dublin. Forty-three per cent of immigrants arriving in New Yorkfrom Dublin reported following a trade. Conversely, only 35 per cent ofDublin’s adult male immigrants called themselves labourers. Many Ulstercounties (Antrim, Armagh, Derry, Down, and Tyrone) also sent an above-average proportion of artisans to New York, but the counties on the southernperiphery of that province did not. The proportion of tradesmen among the
29 Irish emigrants manifest database.30 Mageean, ‘Ulster Emigration to Philadelphia’, pp 276–86.31 Irish emigrants manifest database.
ANBINDER AND MCCAFFREY–Which Irish men and women immigrated 635
immigrants from Cavan, for example, was not merely below the averagefor Ulster, but was below average for all Irish emigrants who sailed toNew York.32
For women, the only significant occupational trend was that women fromDublin and the northeast were much less likely to report working for pay thanthose from other parts of Ireland. Only about a third of the women fromDublin and about half from Antrim and Down stated that they had anoccupation, whereas 80 per cent or more from Queen’s County, Galway,Roscommon, and Cavan called themselves domestic servants of one kind oranother. Age difference does not explain this disparity, as the average ageof the working-age female immigrant from Dublin, Antrim, and Down(twenty-six) was only one year higher than that of the women from Cavan,Galway, Queen’s County, and Roscommon. We surmise that because theemigrants from Dublin and the northeast were more likely than otheremigrants to have spouses, brothers, and fathers who were business ownersand tradesmen, necessity did not push these women into the paid workforce asoften as those from other parts of Ireland.The authors had anticipated conducting further analysis of the passengers’
pre-emigration occupations, to look for additional county-of-origin patterns,but came to the conclusion that the occupational data was too unreliable toallow for such fine-grained analysis. Some manifest compilers recorded minutevariety for place of birth but seemed to put little effort into the occupationcategory, labelling nearly every steerage passenger as a ‘labourer’ when theremust have been at least some variety in their occupational backgrounds. As aresult, analysis of the occupational patterns was restricted to the broadcategories discussed above. With the manifest data on all 18,000 Irishemigrants available online, the opportunity exists for scholars to seek todiscover other occupational patterns in the manifest data.Of course, an immigrant did not necessarily need to follow the same
occupation in the United States as he or she had in Ireland. That was oneof the attractions America held for the Famine Irish. James Garvin fromCastletownroche, for example, reported being a labourer when he arrived inNew York in 1852, but by 1855 he had learned a trade and worked as a gasfitter, laying gas lines in the city’s booming construction industry. Garvin stillfollowed that trade in 1870, the last time he appears in American censusrecords.33
The manifests that document the immigration of James Garvin and morethan 900,000 other Irish men, women, and children to New York during theera of the Great Famine shed significant new light on the Famine migration tothe United States. First, while the Irish would eventually fan out across everyAmerican state (especially those without slavery), it appears that initially thevast majority intended to go no further than New York City. Second, a largerproportion of the residents of many Irish counties sailed to NewYork than hasbeen previously understood. Nearly a quarter of the pre-Famine inhabitants of
32 Irish emigrants manifest database.33 Irish emigrants manifest database. ‘Working-age’ was defined as sixteen or higher.
For Garvin, in addition to the documents cited in note 1, see family 293, 1st division,15th Ward, New York County, New York, 1860 manuscript census, and family 888,14th district, 19th Ward, New York County, New York, 1870 manuscript census(National Archives, Washington, D.C., accessed via Ancestry.com).
636 Irish Historical Studies

County Meath and a fifth from Cavan and Queen’s County took trans-Atlantic vessels to New York. One in six inhabitants of Tipperary, Louth, andLongford also made the journey. Because additional residents of thesecounties immigrated to the United States via Boston, Philadelphia, Baltimore,New Orleans, and Canada, while still others settled permanently in Canada,Australia, or England, the population loss due to emigration is certainly muchhigher than the figures provided by Cousens that continue to dominate theFamine scholarship. Third, there appears to have been less variation in theFamine emigration from the early to later years than we have previouslyimagined. The emigration from some northern counties, such as Cavan andTyrone, did fall significantly as a percentage of the whole in the later Famineemigration years. But that seems less significant than the fact that nine of theten counties that sent the most immigrants to New York in the early Famineyears also made the top-ten list for the later years.
Finally, this study provides the first estimate of Irish county-levelimmigration to the United States based on hard data. It must be emphasizedthat what has been provided are only estimates, based on an imperfecttwo per cent sample, and they should be treated as such. But to betterunderstand the Famine Irish immigrants’ experience, more serious considera-tion of their county of origin is needed. When Famine immigrants met oneanother in New York or almost anywhere else in North America, presumablyone of the first questions one newcomer would have asked the other was wherein Ireland he or she was from. They must have identified to some degree withtheir county of birth, because we know that the Famine Irish often self-segregated, with those from one county living in one neighbourhood (or partof a neighbourhood) and those from another living somewhere else. Otherimmigrant groups did the same thing, and today’s American immigrantssurely do so as well.34 Understanding the Famine immigrants’ origins enablesus to better comprehend the effects of the Famine emigration – part of anunprecedented flow of people out of Europe and into North America – on bothIreland and the new world the immigrants found and remade in the UnitedStates.
Appendix one: sources
Data on county of origin used to estimate immigration to NewYork from eachIrish county, in tables two to four and throughout the article are drawn fromthe sixty-nine New York ship manifests found to provide immigrants’ countyof birth. These are (with date of arrival in brackets):1846: Macedonia (7 May); Virginian (15 May); Elizabeth (16 May); Liverpool(18 June); Virginian, (27 Aug.).1847: Niagara (26 Feb.); Thartus (18 Nov.); Niagara (25 Nov.).1848: Charles (29 May); St. George (21 Aug.);David Cannon (30 Sept.); Fingal(7 Nov.).
34 John Ridge, ‘Irish county colonies in New York City (part I)’ in New York IrishHistory, xxv (2011), pp 58–68; Ridge, ‘Irish county colonies in New York City(part II)’ in New York Irish History, xxvi (2012), pp 47–55; John Mariano, The Italiancontribution to American democracy (Boston, 1921), pp 19–22.
ANBINDER AND MCCAFFREY–Which Irish men and women immigrated 637
1849: Princeton (31 Jan.); Roscius (7 Mar.); Queen of the West (5 Apr.);Garrick (25 May); Sea (4 June); John Fulden (18 Aug.); Abby Pratt (25 Aug.);Princeton (20 Sept.).1850: Aberdeen (13 Mar.); Princeton (19 Apr.); Fanny (1 May); Seraphine (16May);35 Adaline (8 June); Princeton (14 Aug.); Cornelia (4 Sept.); William D.Sewall (5 Sept.); Princeton (11 Nov.).1851: William Wirt (28 Feb.); Princeton (3 Mar.); Niagara (28 Apr.);Vesta (9 Apr.); Columbus (9 May); Harmony (22 May); Trumbull (23 May);Princeton (3 July); Shannon (10 July); Mortimer Livingston (6 Sept);Mechanic’s Own (15 Sept.); Lucania (26 Sept); Western World (13 Oct.);Princeton (27 Oct.).1852: Rhoderick Dhu (6 Jan. ); A.Z. (17 Feb.); Princeton (3 Mar.); Princeton(11 June); Jane E. Walsh (21 June); Henry Grinnell (16 Aug.); Sam Lawrence(21 Sept.); Princeton (25 Sept.); William D. Sewall (15 Oct.).1853: Marathon (9 Mar.); William D. Sewall (4 May); John and Lucy(20 May); Australia (5 July); Star of the West (13 July); Princeton (18 July);Excelsior (27 Sept.); Sarah G. Hyde (5 Dec.).1854: Leibovitz (4 Jan.); Princeton (26 Feb.); John Bright (21 Apr. and28 Aug.); Sea Nymph (24 July); Siddons (19 Sept.); May Flower (7 Oct.);Princeton (24 Oct.); Western Empire (21 Nov.).All these manifests are in the New York passengers list collection, NationalArchives, available as ‘New York Passenger Lists, 1820–1927’ (Ancestry.com).In order to obtain data on Irish county of origin from ports under- orunrepresented in the New York manifest collection, use was also made of thefollowing manifests recording arrivals at other American ports:Limerick to Baltimore: Huntington (24 Jan. 1849); Charles (1 Feb. 1849) in‘Baltimore Passenger Lists, 1820–1948’ (Ancestry.com);Cobh (County Cork) to Boston: Niagara (5 Dec. 1848) in ‘Boston Passengerand Crew Lists, 1820–1954’(Ancestry.com);Londonderry to Philadelphia: Unicorn (17 July 1849); Fanny (12 July 1852);Hartford (departing 17 Apr. 1847);Envoy (Mar. 1849 andMar. 1850);Garland(Apr. 1849); Competitor (July 1851) – the first two manifests are found in‘Philadelphia Passenger Lists’ (Ancestry.com), the remainder in J. & J. Cooke,Shipping Agents collection (P.R.O.N.I).
The figures in Table One come from the following sources: Passengers arrivingin the United States: letter from the secretary of state transmitting statements ofthe number and designation of passengers arriving in the United States, 28thCongress, Second Session, House of representatives Doc. No. 13; Passengersfrom foreign countries: letter from the secretary of state transmitting statementsof the number of passengers who arrived in the United States, 29th Congress,First Session, House of Representatives, Doc. No. 216; Passengers arrivingin the United States: letter from the secretary of state transmitting statementsof the number and designation of passengers arriving in the United States,Twenty-Ninth Congress, Second Session, House of Representatives, Doc. No.98; Ibid., Thirtieth Congress, First Session, House of Representatives, Ex.Doc. No. 47; Passengers arriving in the United States: letter of the secretary ofstate communicating the number and designation of passengers arriving in the
35 This manifest is filed as the last three pages of the El Dorado on Ancestry.com.
638 Irish Historical Studies
United States, Thirtieth Congress, Second Session, House of Representatives,Ex. Doc. No. 10; Passengers arriving in the United States: letter from thesecretary of state transmitting a statement of the number and designation ofpersons arriving in the United States, Thirty-First Congress, First Session, Ex.Doc. No. 7; Ibid., Thirty-First Congress, Second Session, Ex. Doc. No. 16;Ibid., Thirty-Second Congress, First Session, House of Representatives, Ex.Doc. No. 100; Passengers arriving in the United States: letter from the secretaryof state transmitting tabular statements showing the number, &c., of passengerswho arrived in the United States during the last year, Thirty-Second Congress,Second Session, Ex. Doc. No. 35; Ibid., Thirty-Third Congress, SecondSession, Ex. Doc. No. 77; Ibid., Thirty-Fourth Congress, First Session, Ex.Doc. No. 29. However, figures for Massachusetts after 1848 are taken fromCommonwealth of Massachusetts, Fifteenth annual report of the Board ofState Charities of Massachusetts, 1878, Public Doc. 17, pp. 34–5. Figures forNew York after 1847 are taken from Annual reports of the Commissioners ofEmigration of the State of New York, from the organization of the Commission,May 5, 1847, to 1860 (New York, 1861), p. 288.
Some points are worth noting about the recording of data at different ports,as used in Table 1.Baltimore: data for Baltimore in these sources is very unreliable. The officialwho provided the Baltimore figures for these reports at times seems to havemade no effort to tally the manuscript manifests and seems instead to havemade wild guesses. Instead of relying on these clearly erroneous figures forBaltimore, estimates have been made based on the assumption that two-thirdsof the British immigrants landing there were Irish from 1844 to 1846 and that90 per cent were Irish from 1847 to 1852 (this latter figure based on the readingof actual manifests of ships sailing to Baltimore from Liverpool). Beginning in1853, when a new customs officer took office, the Baltimore figures seem tobecome reliable.New Orleans: custom house officials here did not provide data on immigrationfor the first quarter of 1844, the middle two quarters of 1848, and the lastquarter of 1852. The number of Irish immigrants for those quarters has beenestimated based on the number documented in the same quarter in the yearsmost similar to the ones missing. From October 1850 to December 1854,New Orleans records differentiate Irish immigrants from English, Scottishand Welsh immigrants, and during that period 85 per cent of theBritish immigrants were Irish. For the period before October 1850 when theIrish are not differentiated from the rest of the British immigrants, wehave estimated that 85 per cent of the immigrants from Great Britainwere Irish.Philadelphia: these returns do not differentiate between Irish and English/Scottish/Welsh immigrants in the fourth quarter of 1844 and the secondquarter of 1845. In 1846, 88 per cent of British immigrants were Irish, and wehave used that percentage to determine the Irish portion of the Britishimmigration in those two quarters.New York: New York returns do not differentiate between Irish and otherBritish immigrants until May 1847. For the period before that date, theproportion of Irish immigrants among the British immigrants to Boston hasbeen used to estimate the number of New York’s British immigrants who wereIrish. In 1846, that was 70 per cent, so for 1846, for example, this meantmultiplying 60,065 (the number of British immigrants arriving in New York)
ANBINDER AND MCCAFFREY–Which Irish men and women immigrated 639
by 0.7 to arrive at an estimate that 42,046 Irish immigrants arrived in NewYork in 1846.Boston: Boston immigration returns do not differentiate the Irish from otherBritish immigrants in the middle two quarters of 1844. The proportion of Irishamong the British immigrants in the middle two quarters of 1845 was used toestimate the number of Boston’s British immigrants who were Irish in the sametwo quarters in 1844.
Appendix two: methodology for county-level estimates
The estimate of county-by-county immigration figures to New York wasarrived at using the following methods and sources. In order to gather themanifests for our sample, all of the 4,000 or so manifests submitted by theofficers of ships that sailed from ports that typically carried Irish immigrantsand that arrived in New York from 1846 to 1854 were examined. For theearliest years under consideration, not many manifests were found. So inpreparing estimates of total immigration from Ireland, the sample wasweighted to compensate for the relative dearth of detailed manifests fromthose early Famine years and for the relative abundance of such manifestsfrom the 1850s. Care was also taken to ensure inclusion of the properproportion of immigrants from each significant Irish port of embarkation,because one would expect that ships from a given Irish port would be morelikely to carry passengers from that part of Ireland than ships from other ports.If vessels departing from Cork were under-represented, for example, the resultwould likely be to under-count immigrants from Cork and the countiesimmediately surrounding it.With the data from these manifests in hand, the following method was used
to estimate the number of immigrants from each Irish county. To determinethe number and source of Irish immigrants arriving in New York from portsother than Liverpool, we looked at every extant ship manifest from those portsand counted the total number of Irish passengers (the manifests do notdistinguish between immigrants and visitors; for the purposes of our studywe have assumed that all Irish passengers were immigrants). For some ofthese ports (Belfast, Cobh, Dublin, Galway, Glasgow/Greenock, Limerick,London, Londonderry, and Newry) manifests were found that listed the Irishimmigrants’ counties of origin. For example, on ships sailing from Cobh thatspecified Irish county of birth, 72 per cent of the passengers were natives ofCounty Cork. The total number of passengers sailing to New York from Cobh(18,299) was multiplied by .72 to estimate that 13,175 passengers sailing fromCobh to New York were born in County Cork.For those ports for which there are no manifests that list Irish county of
origin, the passengers’ origins were estimated based on the patterns found forsimilar ports where manifests that specified county of origin are available.Surviving manifests show, for example, that ships from Tralee in CountyKerry carried 4,840 passengers to New York in these nine years. Based on thepatterns we found in nearby Cork and Limerick, it was estimated that 80 percent of the Tralee passengers were natives of County Kerry, while another10 per cent were from Limerick and the remainder was from County Cork.It was therefore estimated that 3,872 natives of County Kerry immigrated tothe United States on ships from Tralee from 1846 to 1854. This method was
640 Irish Historical Studies
also used to estimate the origins of immigrants sailing from the Irish ports ofNew Ross, Sligo, Waterford, Westport, and Wexford. County estimates forIrish ports such as Donegal, Drogheda, Killybegs, Kilrush, and Youghal thatsent fewer than 500 passengers to New York in the nine years underconsideration were not made because the figures were statistically insignificant.For the same reason Irish county estimates for ports in the Caribbean or SouthAmerica, or for British ports other than Glasgow, Liverpool, and London werenot calculated, because no basis for estimating where in Ireland theseimmigrants came from was available. For present purposes, it was assumedthat these immigrants, just 1.2 per cent of the total, came from the same varietyof counties as those from Liverpool.
Indeed, Liverpool was the port from which the vast majority of Irishimmigrants travelling to New York (approximately 82 per cent) boarded theirtrans-Atlantic ships. The proportion embarking from that port did varysignificantly from year to year, however, from 94 per cent in 1846 and 93 percent in 1854 to as low as 68 per cent in 1849, the peak year for emigrationdirectly from Ireland to the United States. The estimate of the number ofimmigrants from each Irish county who arrived via Liverpool is based on thesixty-three ships in the sample that originated in Liverpool, vessels that carried22,943 passengers to New York (17,013 of these 22,943 were Irish). For sevenof the nine years under consideration, the sample contains Irish county of birthfor about 2.5 per cent of the Irish passengers who emigrated via Liverpool. Butthe proportion was only 1.6 per cent for 1850 and 0.5 per cent for 1847.
Because the sample is not large enough to enable us to accurately estimatecounty-by-county emigration via Liverpool on a year-by-year basis, thefollowing method was adopted. The sample was used to determine theproportion of immigrants emigrating via Liverpool from each county in whatwas determined to be the Famine migration’s early years, 1846–9 (based on thepatterns seen when the county of origin from Liverpool was calculated on ayear-by-year basis). The total number of Liverpool-emigrating Irish in thosefour years was multiplied by that proportion that the sample indicatedbelonged to each county to estimate the number of Irish immigrants travellingvia that port to New York. For example, 8.9 per cent of all Irish immigratingto New York via Liverpool from 1846 to 1849 in the sample indicated thatthey were from County Cavan. The total number of Irish sailing fromLiverpool to New York in those years (256,107) was therefore multiplied by0.088637 (the precise proportion) to estimate that 22,701 of the Liverpool Irishheading for New York from 1846 to 1849 were from Cavan.
The same method was used to determine the number of people from eachIrish county who emigrated to New York from 1851 to 1854, the later years ofthe Famine immigration. The proportion of emigrants from each Irish countyin the sample for those years was multiplied by the total number of LiverpoolIrish travelling to New York in that four-year period (411,707) to estimate thenumber of immigrants leaving each county for New York. Finally, themanifests from 1849 to 1851 were used to estimate the proportion ofimmigrants from each county sailing via Liverpool in 1850, and thoseproportions were then multiplied by the actual number of Irish emigrantssailing from Liverpool to New York to determine the number from eachcounty in that year.
In terms of the county population figures for 1841 and 1851, it should benoted that the county-by-county population figures from the censuses taken in
ANBINDER AND MCCAFFREY–Which Irish men and women immigrated 641

these two years vary from one government publication to the next. The figuresused here are taken from the most detailed account of the census, the county-by-county returns, published in Census of Ireland for the year 1851. Part I.Showing the area, population, and number of houses, by townlands and electoraldivisions. [C 1465, 1481, 1486, 1492, 1494, 1503, 1504, 1527, 1542–1555, 1557,1560, 1563, 1565, 1567, 1570, 1571, 1574, 1575, 1579, 1581], H.C. 1852-3,xci–xcii.
642 Irish Historical Studies