ireland handbook - linesight.com · welcome to the linesight ireland handbook 2017. ... completions...
TRANSCRIPT

Knowledge Center 2017
1 | Linesight
Ireland Handbook2017
linesight.com

Knowledge Center 2017
2 | Linesight
Opening up a world of data for the Irish construction industry.Welcome to the Linesight Ireland Handbook 2017.
Each year, we bring together all the important indices
and trends in construction in Ireland to give you the most
comprehensive industry overview possible. The handbook
represents just part of our global Linesight Knowledge
Center, which you can find at linesight.com/knowledge.
Strategy | Management | Consultancy
linesight.com/knowledge

Ireland Handbook 2017
Linesight | 1Velasco, Dublin 2

Knowledge Center 2017
2 | Linesight
Global ReviewGeopolitical uncertainty — a major concern to the global economy 4
Ireland Market ReviewIrish construction review and outlook 11
1. Macro indicators
1.1. Value of construction output 2007–2018 12
1.2. Construction output 2010–2017 12
1.3. Gross National Product (GNP) 2010–2017 12
1.4. Multi annual public capital investment allocations 2017–2019 13
1.5. Public capital investment allocations 2017–2019 13
1.6. PPP programme 14
1.7. Employment in construction 15
2. Linesight average Irish construction costs 2017 18
3. Indices
3.1. Linesight tender and cost indices 2007–2017 22
3.2. SCSI tender price index 2006–2016 23
3.3. SCSI construction cost index 2006–2016 23
3.4. Wholesale price index building materials 24
3.5. Consumer vs construction price inflation 2006–2016 24
3.6. Construction Purchasing Managers’ Index 25
3.7. Historical property performance total return % per quarter 26
Contents

Ireland Handbook 2017
Linesight | 3
4. Main and sub-contractors’ turnover
4.1. Irish main contractors’ turnover 28
4.2. Irish services sub-contractors’ turnover 29
5. Wage rates and charges
5.1. Basic hourly wage rates 30
5.2. Basic hourly wage rates – mechanical 31
5.3. Basic hourly wage rates – electrical 31
5.4. Planning charges 2017 32
5.5. Fire certificate charges 2017 32
6. Housing
6.1. Annual housing completions 2006–2016 34
6.2. New housing completions by type 2006–2016 35
6.3. House construction cost index 35
6.4. SCSI house rebuilding costs 2016 36
Global InsightsBrexit – What’s next? 42
Lean construction – early decision making through collaboration 44
The importance of project schedule integrity 46
Trends in Safety Management 48
EU public procurement rules 50
The NEC3 contract philosophy; collaborative and proactive 54
Bigger, faster, cheaper 56
Life Sciences – a constantly evolving market 58

Knowledge Center 2017
4 | Linesight
Geopolitical uncertainty — a major concern to the global economy
by Kim Hegarty, Associate Director
The Brexit referendum result and the US presidential election have dominated international media discussion over the last year, and this is expected to continue for the foreseeable future. Fundamentally, both have created uncertainty, which is likely to negatively impact GDP for a number of economies.
Brexit
The UK economy has performed better than anticipated following the Brexit referendum. Estimates from the Office of National Statistics suggest that GDP grew 0.5 percent in the third quarter of 2016 when compared to the
second quarter of 2016, and was 2.3 percent higher than the same period in 2015. This is a far cry from the expected recessionary scenario many feared after the referendum; the outcome of the referendum would appear not to have affected the pattern of growth in the economy. However, this growth is largely driven by consumer spending and the services sector, with construction growing by 0.1 percent in 2016.
Sterling has depreciated against the euro, and this is supporting the UK economy in the short term through higher exports. Nonetheless, it is likely that there will be negative impact in the form of import inflation over the coming years. The growth experienced at the end of 2016 is unsustainable if based on a consumer spending spree, and with consumer borrowing increasing at
Both the Brexit referendum result and the US presidential election have created uncertainty, which is likely to negatively impact GDP for a number of economies
Global Review
The year 2016 has been tumultuous to say the least, with a number of unexpected political decisions looking set to shape the global economy over the coming years.
Ireland Handbook 2017
Linesight | 5
a rapid rate, the Bank of England is concerned about the formation of a debt bubble.
The full impact of Brexit will not be realised for some time, with the negotiation process for leaving the EU just beginning. The general consensus is that it will take several years before agreement is reached on the terms of the exit and this will have a considerable impact on the common market. Ultimately, the long term effect of Brexit on the UK economy will be determined by the kind of trade agreement negotiated by the EU and the UK.
A tumultuous time for the EU
The EU is facing a challenging period with the two-speed economy, with countries like Ireland recording significant GDP growth while Italy, with its banking system under duress, has yet to face the full consequences of the global financial crisis. The European Central Bank (ECB) is attempting to boost the economy with a stimulus package of quantitative easing, and while lower interest rates may be helping to boost the weaker economies, it also has potentially negative impacts. The Trump administration has accused the ECB of maintaining a grossly undervalued euro, which helps exports and economies such as Germany, in particular, benefit from an unfair trade advantage. However, the ECB asserts that Germany’s large trade surplus is based on economic competitiveness and not currency advantage. Such
is the strength of the German economy that German politicians and German members of the ECB’s Board campaigned, in vain, for a higher interest rate policy that would instead strengthen the euro.
The European project is facing a challenging period, not only with the Brexit referendum, but with elections due in Germany, the Netherlands, France and possibly Italy this year. Anti-EU sentiment is coming to the fore with the rising popularity of anti-EU political figures, such as Marine le Pen in France. This could be a very tumultuous time for the region, with many unknowns giving rise to economic uncertainty.
President Trump
The new President of the United States and his administration have stated their intention to provide a boost to the economy by means of a more expansionary fiscal policy, based on tax cuts and increased infrastructure and defence spending. This has led to an improved outlook in consumer sentiment, which was clearly indicated when the Dow rose significantly after the outcome of the election was announced. This subsequently went on to break through the 20,000 mark after a sharp increase in infrastructure stocks, when President Trump reaffirmed his commitment to build a wall along the Mexican border.
The administration is, however, also implementing protectionist
policies, with one of the first orders to be drafted titled “Auditing and Reducing US Funding of International Organizations”. Furthermore, Trump has stated that they plan to pull out of the Trans-Pacific Partnership (TPP) and re-negotiate the North American Free Trade Agreement (NAFTA). He had indicated that he intended to pick a trade fight with China by recognising Taiwan - a policy which many warned against due to the size of the Chinese economy. He has recently backed down from this policy by agreeing with the One China policy, which forms the bedrock of US-China diplomatic ties.
The approach of the administration is creating a lot of uncertainty for the longer-term economic outlook. The President is seeking to create more jobs in the US, particularly in manufacturing, with his promise to bring jobs back to the rust belt. While the US may seek to lay blame for less manufacturing jobs on Mexico and China, most economic commentators are of the belief that the loss of manufacturing jobs is largely attributable to changes in the manufacturing processes, as well as advances in technology.
UN
ITED STATES OF AM
ERICA
PR
ESIDENT OF THE
Knowledge Center 2017
6 | Linesight
In the long run, the policy of increased spending on infrastructure, together with the promised reduction in corporation and income taxes, is likely to be counterproductive, resulting in an increase in the government deficit.
Oil prices
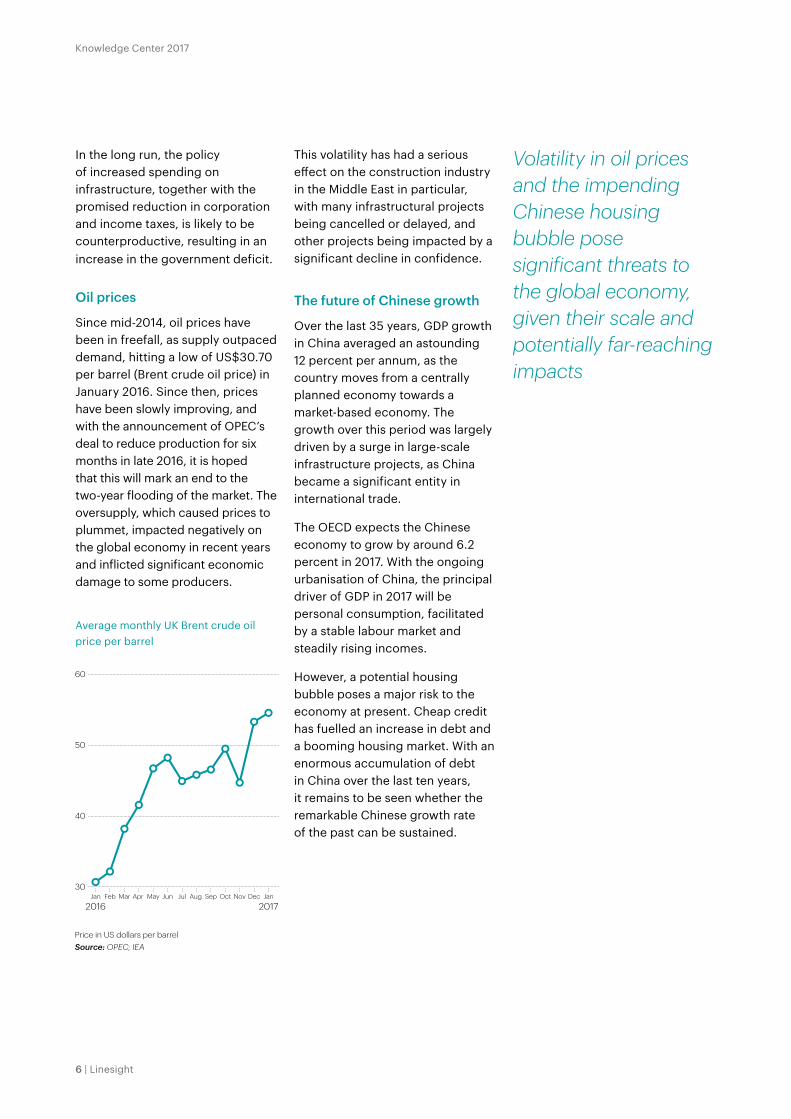
Since mid-2014, oil prices have been in freefall, as supply outpaced demand, hitting a low of US$30.70 per barrel (Brent crude oil price) in January 2016. Since then, prices have been slowly improving, and with the announcement of OPEC’s deal to reduce production for six months in late 2016, it is hoped that this will mark an end to the two-year flooding of the market. The oversupply, which caused prices to plummet, impacted negatively on the global economy in recent years and inflicted significant economic damage to some producers.
This volatility has had a serious effect on the construction industry in the Middle East in particular, with many infrastructural projects being cancelled or delayed, and other projects being impacted by a significant decline in confidence.
The future of Chinese growth
Over the last 35 years, GDP growth in China averaged an astounding 12 percent per annum, as the country moves from a centrally planned economy towards a market-based economy. The growth over this period was largely driven by a surge in large-scale infrastructure projects, as China became a significant entity in international trade.
The OECD expects the Chinese economy to grow by around 6.2 percent in 2017. With the ongoing urbanisation of China, the principal driver of GDP in 2017 will be personal consumption, facilitated by a stable labour market and steadily rising incomes.
However, a potential housing bubble poses a major risk to the economy at present. Cheap credit has fuelled an increase in debt and a booming housing market. With an enormous accumulation of debt in China over the last ten years, it remains to be seen whether the remarkable Chinese growth rate of the past can be sustained.
Volatility in oil prices and the impending Chinese housing bubble pose significant threats to the global economy, given their scale and potentially far-reaching impacts
Average monthly UK Brent crude oil price per barrel
Source: OPEC; IEAPrice in US dollars per barrel
30
40
50
60
Jan
2017DecNovOctSepAug JulJunMayApr MarFebJan
2016

Ireland Handbook 2017
Linesight | 7Oisín House, Trinity College Dublin
Ireland Handbook 2017
Linesight | 7

Knowledge Center 2017
8 | LinesightHanover Quay, Dublin 2
Knowledge Center 2017

Ireland Handbook 2017
Linesight | 9
Ireland Market Review
Further regional market reviews available at linesight.com/knowledge

Knowledge Center 2017
10 | Linesight
Note: (f) forecastSource: DKM / Dept of Environment / CIF
€bn
0
510
15
20
25
3035
40
2017(f)20112007
Value of construction output
Source: CSO
Source: CSO
100,000
150,000
200,000
250,000
300,000
Q4Q3Q2Q1Q4Q3Q2Q1Q4Q3Q2Q1
201620112007
115
125
135
145
155
165
175
2017(f)20112007Note: (f) forecastSource: Linesight Average Tender Price Construction Input Cost
Tender price and cost indices
10,000
20,000
30,000
40,000
50,000
60,000
70,000
80,000
201620112007
Annual housing completions
Employment in construction
Knowledge Center 2017
10 | Linesight
From peak to trough to today

Ireland Handbook 2017
Linesight | 11
Irish construction review and outlook
Derry Scully, Group President, reviews the Ireland construction industry performance over the last number of years and looks forward to 2017 and 2018.
Output of the Irish construction industry in 2016 was just under €15 billion, which represented an impressive increase of 18 percent above the 2015 level. The recovery in industry output is expected to continue during 2017 and 2018, growing to approximately €17 billion and €19.5 billion respectively. These projections represent increases of almost 15 percent per annum. However, even with these sizeable growth rates, the output in 2018 will still only be at 2001 levels and approximately half of the 2007 peak output of over €38 billion. While this peak output was unsustainably high, the predicted output level for 2017 only represents 7.5 percent of GNP, which is well below the recognised European sustainable level of between 10 to 12 percent. Using these benchmarks, the output of the Irish construction industry in 2017 should be between €23 and €27 billion.
All sectors of the industry are now starting to contribute to its recovery. The private sector revival was initially led by new commercial office space and office fit-outs in the Greater Dublin Area. This recovery is now starting to be seen in other major urban centres, and there is increased activity in the Hospitality and Retail sectors also. The IDA continues to attract FDI and multinational companies from the
High-Tech Industrial, Data Centre and Life Sciences sectors to invest in Ireland.
In the public sector, the Government published its Multi-Annual Public Capital Investment Allocations for 2017–2019. These show planned expenditure of €4.5 billion in 2017, €5.3 billion in 2018 and just over €6 billion in 2019. The major areas of Government expenditure will be in transport, education, enterprise, housing and health, which together account for over 70 percent of the planned outlay. These numbers do not include non-exchequer investment by semi-state bodies including ESB, Irish Water and Ervia, which will add significantly to the total of public sector capital expenditure.
Residential construction has traditionally represented a major component of the overall industry, but output in recent years has been well below the annual requirement, which has led to significant accommodation shortages and increased rental costs. Thankfully, this important sector is now also showing signs of recovery, prompted by Government initiatives, the increasing viability of residential construction and easing of funding restrictions. Hopefully these improvements will continue and the industry will be able to reach the required output targets in coming years.
While it is encouraging to see the recovery in the construction industry, there are a number of challenges and risks which are already impacting, or may impact on this recovery. The most pressing
concern at present is the level of resources in the industry. During the recession, employment in construction fell to a quarter of its peak level. These skills shortages are now manifesting themselves across both main contractor and specialist sub-contractor organisations, as well as the design professions. Given that it takes four to five years to train
construction professionals, and a similar timescale to train skilled craftsmen, the industry will take some time to remedy this shortfall, even with resources being attracted from abroad. These shortages are impacting on tender levels, and construction inflation levels are running well ahead of general inflation.
There are also external influences which could impact the recovery of the industry in Ireland – primarily Brexit in the UK and the new Trump administration in the US. It is uncertain how these will affect both the construction industry and the Irish economy as a whole. Brexit could be positive in the short term, if multinational financial institutions decide to relocate out of the UK and choose Ireland. In contrast, the Trump administration could have a negative impact if it implements policies which discourage US firms from investing abroad.
The most pressing concern for the industry at present is the skills shortage manifesting itself across all disciplines, and impacting on tender levels, and construction inflation levels
Knowledge Center 2017
12 | Linesight
1. Macro indicators
2010 2011 2012 2013 2014 2015 2016(f) 2017(f)
Value of Output at Current Prices (€m)
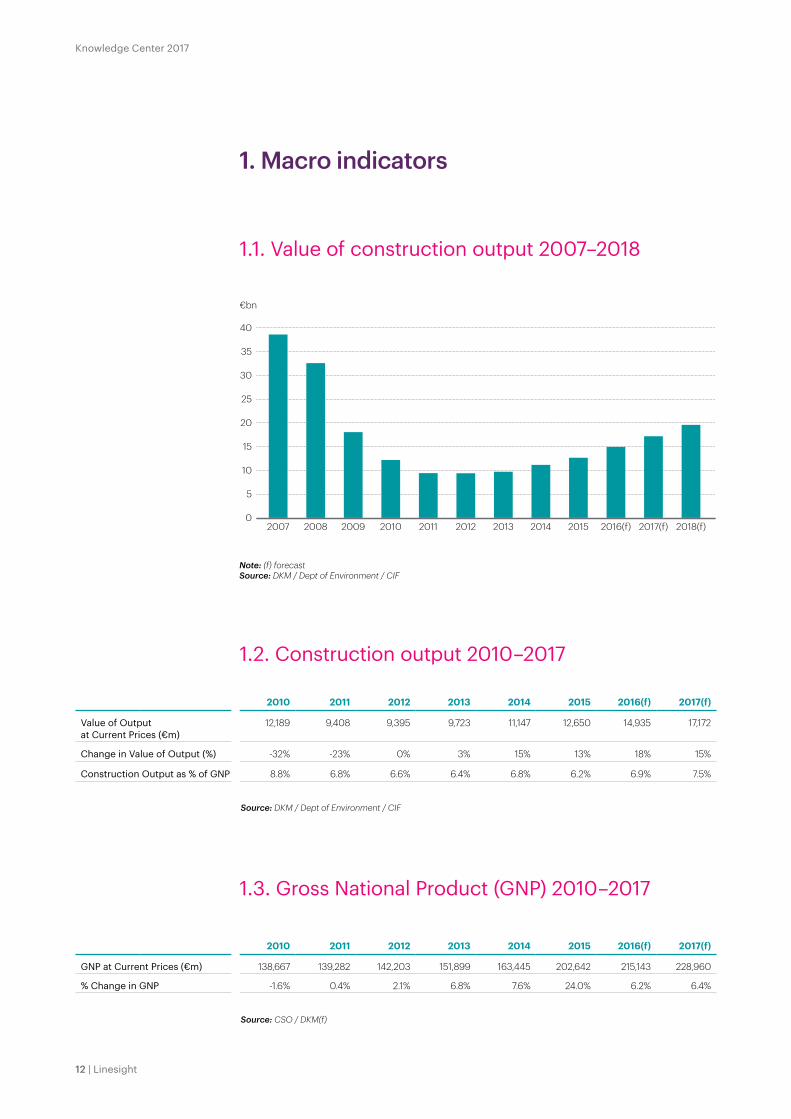
12,189 9,408 9,395 9,723 11,147 12,650 14,935 17,172
Change in Value of Output (%) -32% -23% 0% 3% 15% 13% 18% 15%
Construction Output as % of GNP 8.8% 6.8% 6.6% 6.4% 6.8% 6.2% 6.9% 7.5%
Source: DKM / Dept of Environment / CIF
1.2. Construction output 2010–2017
2010 2011 2012 2013 2014 2015 2016(f) 2017(f)
GNP at Current Prices (€m) 138,667 139,282 142,203 151,899 163,445 202,642 215,143 228,960
% Change in GNP -1.6% 0.4% 2.1% 6.8% 7.6% 24.0% 6.2% 6.4%
Source: CSO / DKM(f)
1.3. Gross National Product (GNP) 2010–2017
1.1. Value of construction output 2007–2018
€bn
0
5
10
15
20
25
30
35
40
2018(f)2017(f)2016(f)201520142013201220112010200920082007
Note: (f) forecastSource: DKM / Dept of Environment / CIF
Ireland Handbook 2017
Linesight | 13
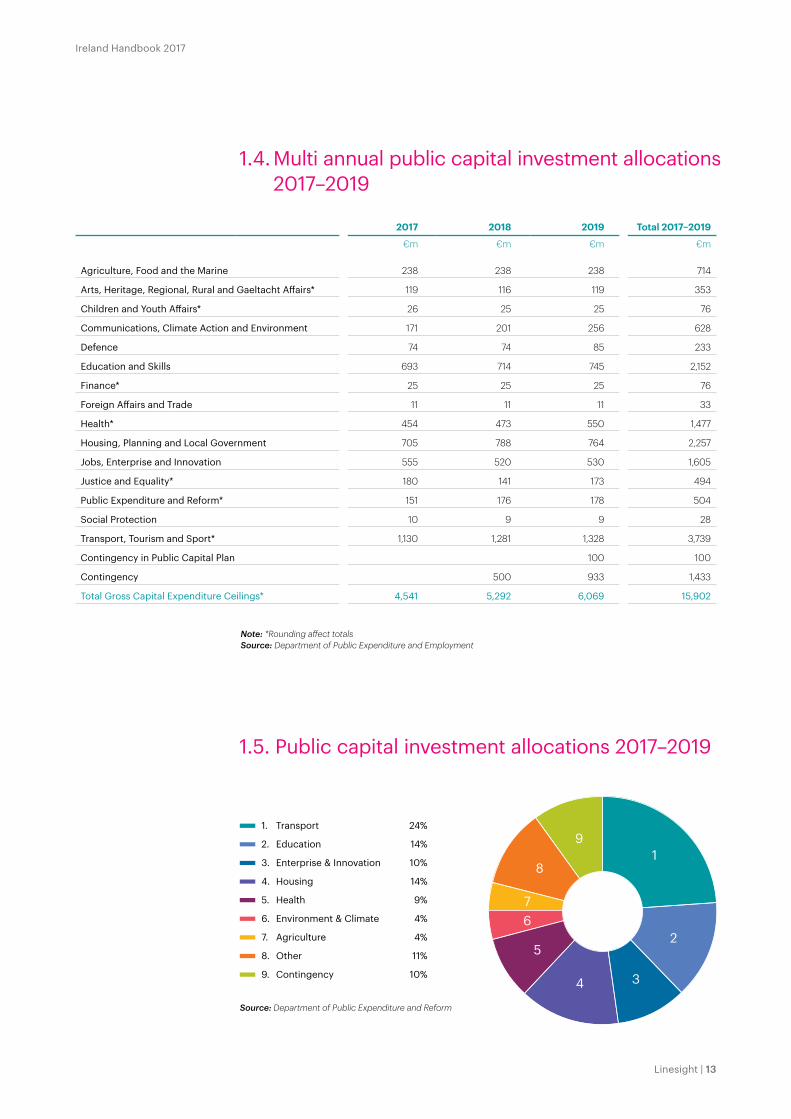
1.4. Multi annual public capital investment allocations 2017–2019
1.5. Public capital investment allocations 2017–2019
9
8
76
5
4 3
2
1
Source: Department of Public Expenditure and Reform
1. Transport 24%
2. Education 14%
3. Enterprise & Innovation 10%
4. Housing 14%
5. Health 9%
6. Environment & Climate 4%
7. Agriculture 4%
8. Other 11%
9. Contingency 10%
2017 2018 2019 Total 2017–2019
€m €m €m €m
Agriculture, Food and the Marine 238 238 238 714
Arts, Heritage, Regional, Rural and Gaeltacht Affairs* 119 116 119 353
Children and Youth Affairs* 26 25 25 76
Communications, Climate Action and Environment 171 201 256 628
Defence 74 74 85 233
Education and Skills 693 714 745 2,152
Finance* 25 25 25 76
Foreign Affairs and Trade 11 11 11 33
Health* 454 473 550 1,477
Housing, Planning and Local Government 705 788 764 2,257
Jobs, Enterprise and Innovation 555 520 530 1,605
Justice and Equality* 180 141 173 494
Public Expenditure and Reform* 151 176 178 504
Social Protection 10 9 9 28
Transport, Tourism and Sport* 1,130 1,281 1,328 3,739
Contingency in Public Capital Plan 100 100
Contingency 500 933 1,433
Total Gross Capital Expenditure Ceilings* 4,541 5,292 6,069 15,902
Note: *Rounding affect totalsSource: Department of Public Expenditure and Employment
Knowledge Center 2017
14 | Linesight
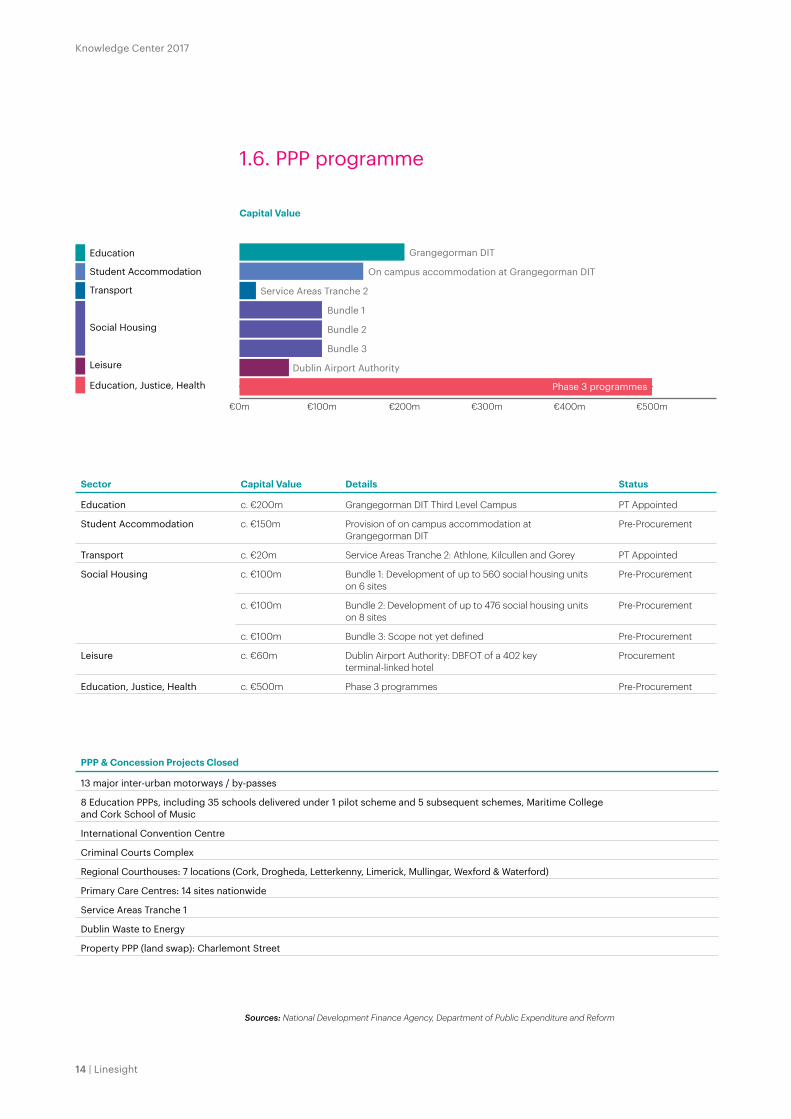
1.6. PPP programme
Sector Capital Value Details Status
Education c. €200m Grangegorman DIT Third Level Campus PT Appointed
Student Accommodation c. €150m Provision of on campus accommodation at Grangegorman DIT
Pre-Procurement
Transport c. €20m Service Areas Tranche 2: Athlone, Kilcullen and Gorey PT Appointed
Social Housing c. €100m Bundle 1: Development of up to 560 social housing units on 6 sites
Pre-Procurement
c. €100m Bundle 2: Development of up to 476 social housing units on 8 sites
Pre-Procurement
c. €100m Bundle 3: Scope not yet defined Pre-Procurement
Leisure c. €60m Dublin Airport Authority: DBFOT of a 402 key terminal-linked hotel
Procurement
Education, Justice, Health c. €500m Phase 3 programmes Pre-Procurement
Capital Value
€0m €100m €200m €300m €400m €500m
Phase 3 programmes
Student Accommodation
Transport
Education
Social Housing
Leisure
Education, Justice, Health
Grangegorman DIT
On campus accommodation at Grangegorman DIT
Service Areas Tranche 2
Bundle 1
Bundle 2
Dublin Airport Authority
Bundle 3
PPP & Concession Projects Closed
13 major inter-urban motorways / by-passes
8 Education PPPs, including 35 schools delivered under 1 pilot scheme and 5 subsequent schemes, Maritime College and Cork School of Music
International Convention Centre
Criminal Courts Complex
Regional Courthouses: 7 locations (Cork, Drogheda, Letterkenny, Limerick, Mullingar, Wexford & Waterford)
Primary Care Centres: 14 sites nationwide
Service Areas Tranche 1
Dublin Waste to Energy
Property PPP (land swap): Charlemont Street
Sources: National Development Finance Agency, Department of Public Expenditure and Reform
Ireland Handbook 2017
Linesight | 15Baggot Plaza, Dublin 4
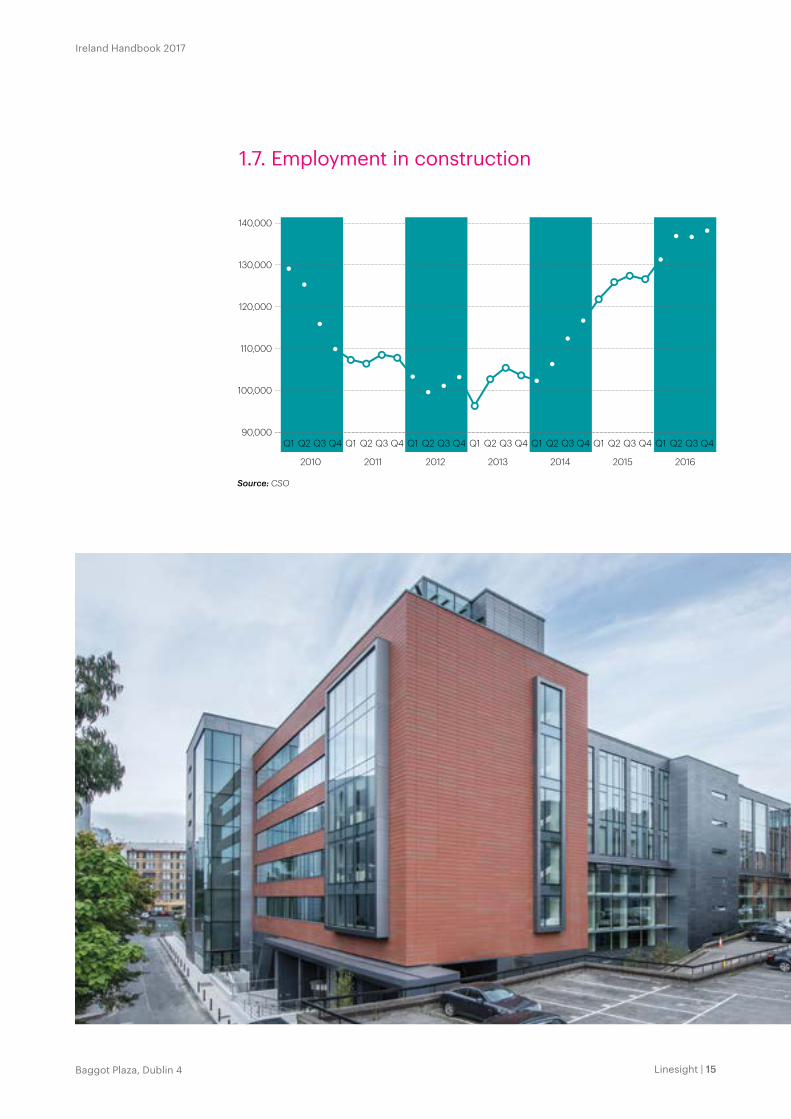
1.7. Employment in construction
90,000
100,000
110,000
120,000
130,000
140,000
Q4Q3Q2Q1Q4Q3Q2Q1Q4Q3Q2Q1Q4Q3Q2Q1Q4Q3Q2Q1Q4Q3Q2Q1Q4Q3Q2Q1
Source: CSO
2016201520142013201220112010

Knowledge Center 2017
16 | Linesight
Knowledge Center 2017
Our vision is to be recognised as having the best people, delivering the best outcomes, for the world’s best clients.
To achieve our vision we have identified four strategic pillars. These pillars will build on the good reputation and strong relationships at the heart of our success to date.
New services will be introduced and existing services strengthened to enhance our attractiveness and value to our clients.
Areas already in train are:
— Schedule Management
— Risk Management
— Audit Services
— Procurement Services
People are our greatest asset. We will continue to grow the skills and expertise within our team while actively seeking to attract the best new talent. We will also continue to build and support a coherent and dynamic culture that offers opportunities for professional development across all markets.
We will foster deeper and more valuable relationships by offering more clients the benefits of enhanced term contracts across their building programs. We will expand our Partnering Division to support this ambition.
We will establish a single brand that represents our enhanced business offer. Our brand will be supported by an integrated marketing strategy and a new brand name and identity which will be applied across all markets to sustain, grow and attract the best talent and clients.
Enhanced services
Grow andattract talent
Foster strategic partnerships
Market as one brand
16 | Linesight

Ireland Handbook 2017
Linesight | 17
Strategy | Management | Consultancy
17City Quay, Dublin 2
Ireland Handbook 2017
Linesight | 17

Knowledge Center 2017
18 | Linesight
2. Linesight average Irish construction costs 2017
The average construction costs table is generated using Linesight’s Cost Database and sets out typical building construction costs. Our database is the largest construction cost database in Ireland.
Average Costs Cost Range M&E
Commercial Offices
Suburban Naturally Ventilated
Shell & Core €1,370 €1,800 per sq.m. 10-15%
Developer Standard €1,500 €1,950 per sq.m. 15-20%
Extra for Air Conditioning €195 €390 per sq.m. -
City Centre Air Conditioned
Shell & Core €1,800 €2,600 per sq.m. 15-20%
Developer Standard €2,000 €2,850 per sq.m. 20-25%
Office Fit-Out
95% Open Plan, No Catering €520 €780 per sq.m. 20-30%
75% Open Plan, Limited Catering €720 €980 per sq.m. 20-30%
60% Open Plan, Full Catering €980 €1,500 per sq.m. 25-35%
Corporate HQ €1,560 €1,950 per sq.m. 25-35%
Open Plan Work Station €1,170 €3,300 each -
High Tech Industrial
Shell & Core €980 €1,560 per sq.m. 20-25%
Developer Standard €850 €1,560 per sq.m. 25-45%
Residential
Estate House (Approx. 100m2) €1,170 €1,500 per sq.m. 10-20%
Developer Standard Apartments €1,600 €2,200 per sq.m. 10-20%
Individual House Rebuilding Costs (see chart - House Rebuilding Costs per sq.m.)
Shopping Centres
Anchor Unit €780 €980 per sq.m. 10-15%
Unit Shops €980 €1,500 per sq.m. 10-15%
Mall €1,760 €3,100 per sq.m. 20-25%
Retail Fit-Out €1,370 €1,950 per sq.m. 25-30%
Site Development Business Parks
Roads & Primary Services €182,000 €580,000 per hectare
Warehouses
Without Offices €650 €850 per sq.m. 8-12%
With 10% Offices €780 €1,240 per sq.m. 10-15%
Ireland Handbook 2017
Linesight | 19
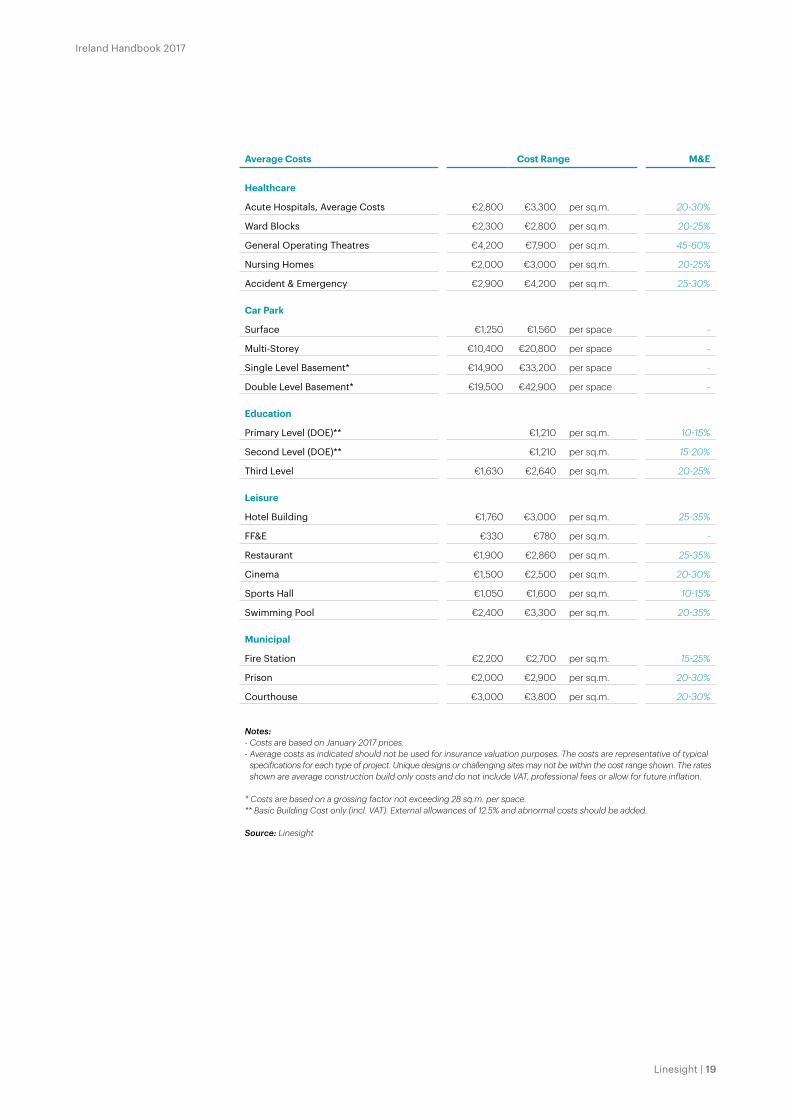
Average Costs Cost Range M&E
Healthcare
Acute Hospitals, Average Costs €2,800 €3,300 per sq.m. 20-30%
Ward Blocks €2,300 €2,800 per sq.m. 20-25%
General Operating Theatres €4,200 €7,900 per sq.m. 45-60%
Nursing Homes €2,000 €3,000 per sq.m. 20-25%
Accident & Emergency €2,900 €4,200 per sq.m. 25-30%
Car Park
Surface €1,250 €1,560 per space -
Multi-Storey €10,400 €20,800 per space -
Single Level Basement* €14,900 €33,200 per space -
Double Level Basement* €19,500 €42,900 per space -
Education
Primary Level (DOE)** €1,210 per sq.m. 10-15%
Second Level (DOE)** €1,210 per sq.m. 15-20%
Third Level €1,630 €2,640 per sq.m. 20-25%
Leisure
Hotel Building €1,760 €3,000 per sq.m. 25-35%
FF&E €330 €780 per sq.m. -
Restaurant €1,900 €2,860 per sq.m. 25-35%
Cinema €1,500 €2,500 per sq.m. 20-30%
Sports Hall €1,050 €1,600 per sq.m. 10-15%
Swimming Pool €2,400 €3,300 per sq.m. 20-35%
Municipal
Fire Station €2,200 €2,700 per sq.m. 15-25%
Prison €2,000 €2,900 per sq.m. 20-30%
Courthouse €3,000 €3,800 per sq.m. 20-30%
Notes:- Costs are based on January 2017 prices.- Average costs as indicated should not be used for insurance valuation purposes. The costs are representative of typical
specifications for each type of project. Unique designs or challenging sites may not be within the cost range shown. The rates shown are average construction build only costs and do not include VAT, professional fees or allow for future inflation.
* Costs are based on a grossing factor not exceeding 28 sq.m. per space.** Basic Building Cost only (incl. VAT). External allowances of 12.5% and abnormal costs should be added.
Source: Linesight

Knowledge Center 2017
20 | Linesight The Reflector, Dublin 2
Knowledge Center 2017
20 | Linesight

Ireland Handbook 2017
Linesight | 21
What we doOur services are tailored for your project, delivering maximum efficiency from inception to completion. We specialise in eight key areas to provide faster project delivery, greater cost efficiency, and maximum value for money.
Program Management
Project Management Project Controls Cost Management
ProcurementConsultancyHealth and SafetySupply Chain Management
Ireland Handbook 2017
Linesight | 21

Knowledge Center 2017
22 | Linesight
3.1. Linesight tender and cost indices 2007–2017
3. Indices
As the Irish construction industry continues to recover, tender prices are rising steadily and the gap between these and the input costs of labour and materials continues to close. Linesight’s research shows that, on average, tender prices rose by approximately 7 percent during 2016 while construction input costs rose on average by just under 2 percent.
During 2017 we expect to see input costs increase by slightly more at 2.3 percent, reflecting pressure to increase wage rates and also increased costs of some materials. We predict that tender prices will increase at a faster pace of 7.5 percent on average, due to the shortage of resources throughout both the main contractor and sub-contractor pools. These shortages are now being experienced in the traditional steelfixing, masonry and wet trades as well as the more specialist mechanical and electrical trades.
The percentages above are average increases across Ireland. However we are seeing significantly greater increases in the Dublin area than in provincial locations. For 2017 we are predicting that increases in Dublin could be 9 percent, or even higher for complex city centre projects. This contrasts with predicted increases of 6 percent outside of the Greater Dublin Area.
The increase in tender prices, which we expect to continue, emphasises the importance of providing for future construction inflation in feasibility studies and cost plans. It is also becoming more important to conduct detailed pre-qualification / due diligence when preparing tender lists for new projects and to consider the most appropriate procurement strategy for each project.
115
125
135
145
155
165
175
2017(f)2016(f)201520142013201220112010200920082007
Source: Linesight
Average Tender Price Construction Input Cost

Ireland Handbook 2017
Linesight | 23
3.2. SCSI tender price index 2006–2016
3.3. SCSI construction cost index 2006–2016
100
105
110
115
120
125
130
135
140
145
150
155
2h 1h2h 1h 2h 1h 2h1h 2h 1h 2h 1h2h1h2h1h2h1h2h1h2h1h
Source: Society of Chartered Surveyors Ireland
20162015201420132012201120102009200820072006
220
230
240
250
260
270
280
290
300
310
320
2016*2015201420132012201120102009200820072006
* Average to year end SeptemberSource: Society of Chartered Surveyors Ireland
Knowledge Center 2017
24 | Linesight
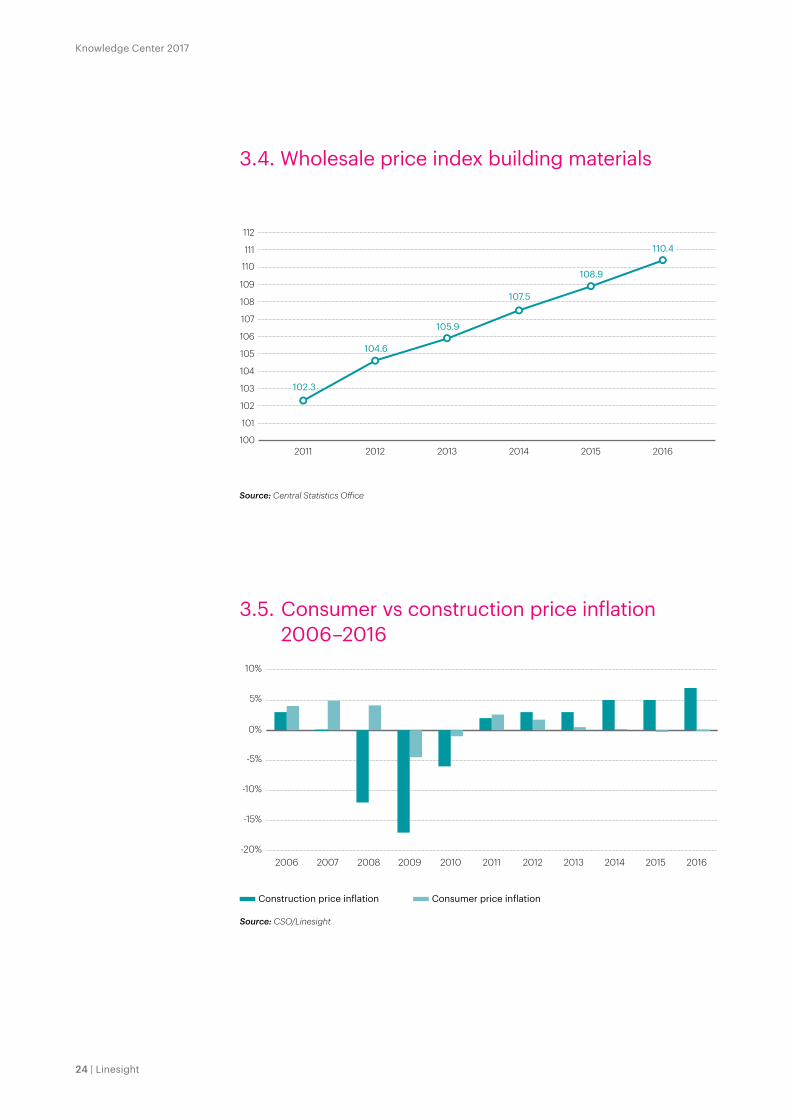
3.4. Wholesale price index building materials
3.5. Consumer vs construction price inflation 2006–2016
Source: CSO/Linesight
Construction price inflation Consumer price inflation
-20%
-15%
-10%
-5%
0%
5%
10%
20162015201420132012201120102009200820072006
Source: Central Statistics O�ice
100
101
102
103
104
105
106
107
108
109
110
111
112
201620152014201320122011
104.6
105.9
107.5
108.9
110.4
102.3
Ireland Handbook 2017
Linesight | 25
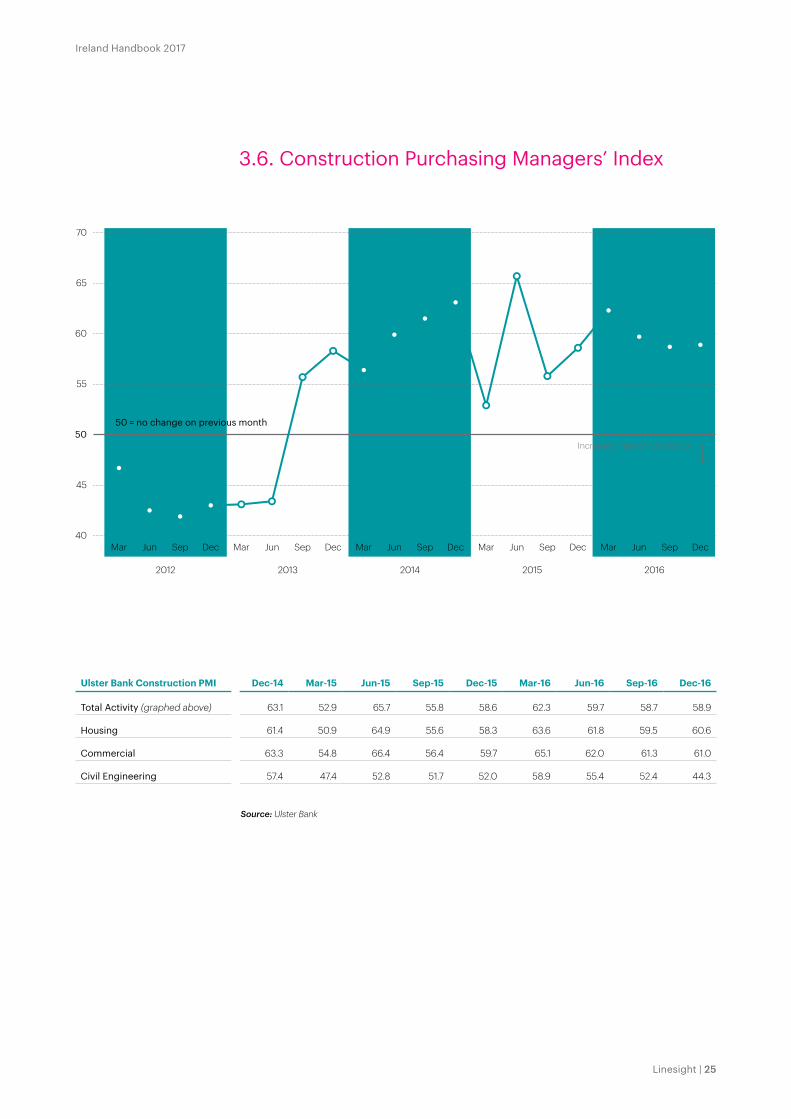
3.6. Construction Purchasing Managers’ Index
50 = no change on previous month Increasing rate of growth
Increasing rate of contraction
40
45
50
55
60
65
70
DecSepJunMarDecSepJunMarDecSepJunMarDecSepJunMarDecSepJunMar
2012 2013 2014 2015 2016
Ulster Bank Construction PMI Dec-14 Mar-15 Jun-15 Sep-15 Dec-15 Mar-16 Jun-16 Sep-16 Dec-16
Total Activity (graphed above) 63.1 52.9 65.7 55.8 58.6 62.3 59.7 58.7 58.9
Housing 61.4 50.9 64.9 55.6 58.3 63.6 61.8 59.5 60.6
Commercial 63.3 54.8 66.4 56.4 59.7 65.1 62.0 61.3 61.0
Civil Engineering 57.4 47.4 52.8 51.7 52.0 58.9 55.4 52.4 44.3
Source: Ulster Bank
Knowledge Center 2017
26 | Linesight
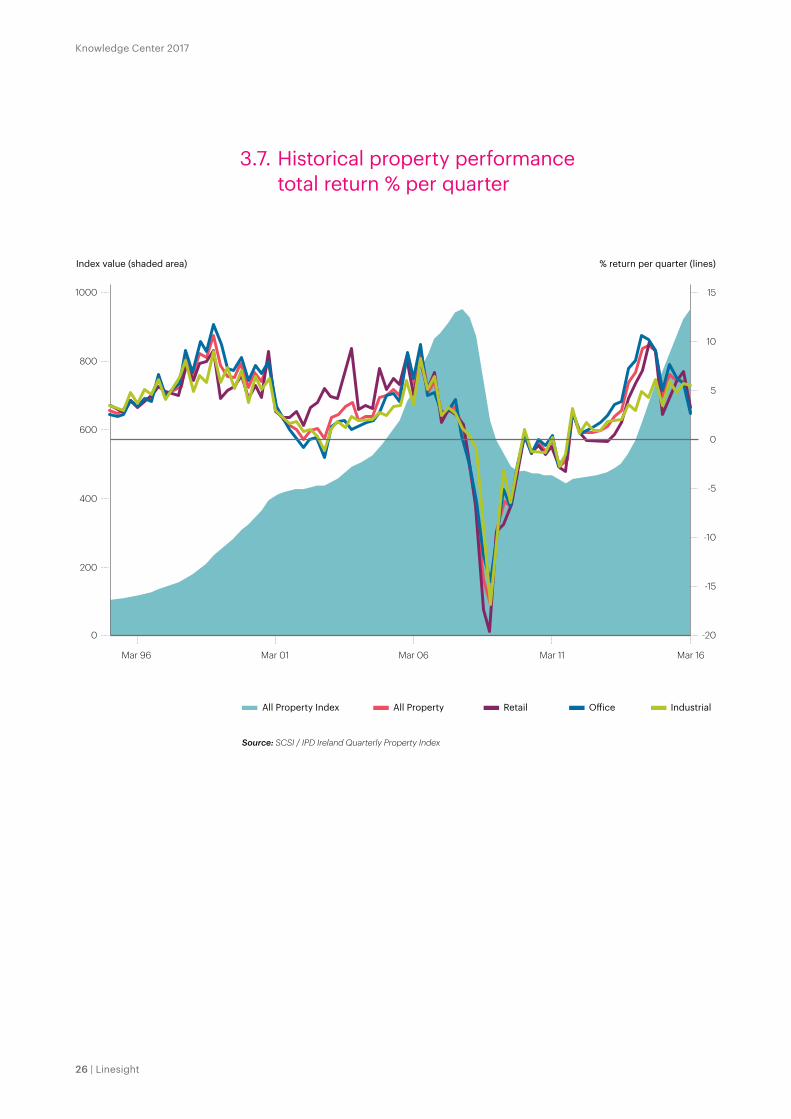
3.7. Historical property performance total return % per quarter
All Property Retail IndustrialO�iceAll Property Index
Source: SCSI / IPD Ireland Quarterly Property Index
200
0
400
600
Index value (shaded area) % return per quarter (lines)
Mar 96 Mar 01 Mar 06 Mar 11 Mar 16
800
1000 15
10
5
0
-5
-10
-15
-20

Ireland Handbook 2017
Linesight | 27
Ireland Handbook 2017
Linesight | 27The New Children’s Hospital, Dublin 8
Knowledge Center 2017
28 | Linesight
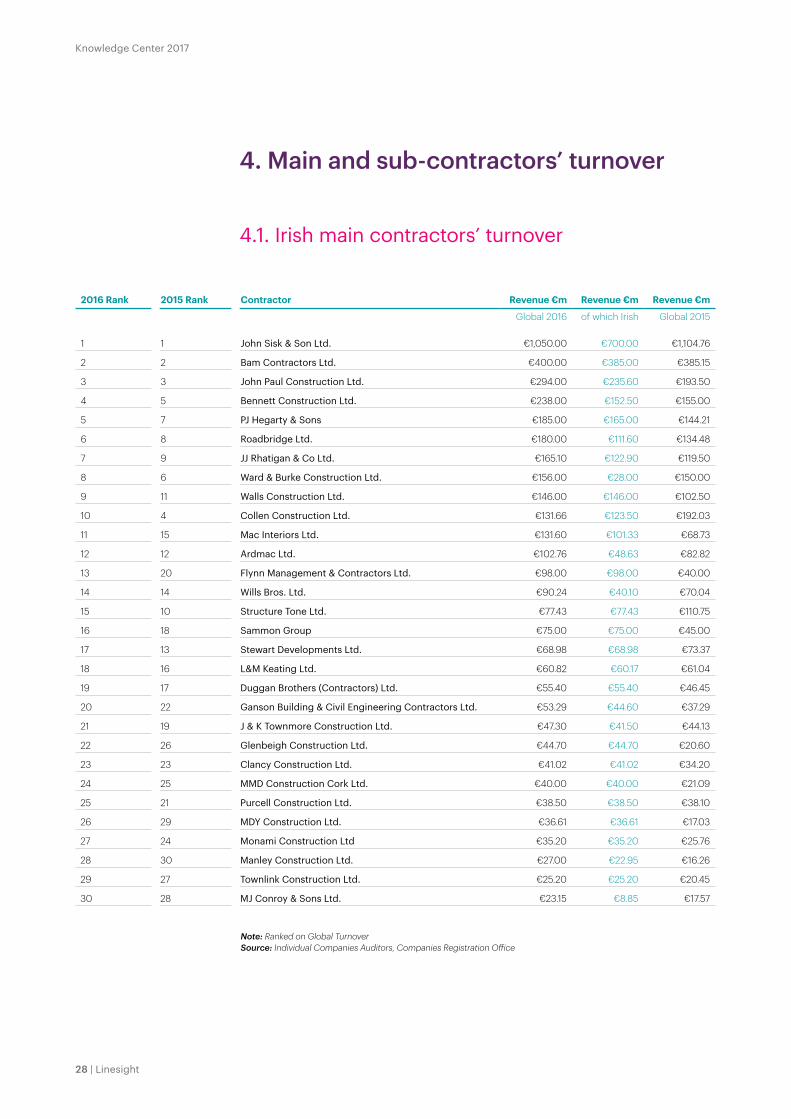
4.1. Irish main contractors’ turnover
4. Main and sub-contractors’ turnover
2016 Rank 2015 Rank Contractor Revenue €m Revenue €m Revenue €m
Global 2016 of which Irish Global 2015
1 1 John Sisk & Son Ltd. €1,050.00 €700.00 €1,104.76
2 2 Bam Contractors Ltd. €400.00 €385.00 €385.15
3 3 John Paul Construction Ltd. €294.00 €235.60 €193.50
4 5 Bennett Construction Ltd. €238.00 €152.50 €155.00
5 7 PJ Hegarty & Sons €185.00 €165.00 €144.21
6 8 Roadbridge Ltd. €180.00 €111.60 €134.48
7 9 JJ Rhatigan & Co Ltd. €165.10 €122.90 €119.50
8 6 Ward & Burke Construction Ltd. €156.00 €28.00 €150.00
9 11 Walls Construction Ltd. €146.00 €146.00 €102.50
10 4 Collen Construction Ltd. €131.66 €123.50 €192.03
11 15 Mac Interiors Ltd. €131.60 €101.33 €68.73
12 12 Ardmac Ltd. €102.76 €48.63 €82.82
13 20 Flynn Management & Contractors Ltd. €98.00 €98.00 €40.00
14 14 Wills Bros. Ltd. €90.24 €40.10 €70.04
15 10 Structure Tone Ltd. €77.43 €77.43 €110.75
16 18 Sammon Group €75.00 €75.00 €45.00
17 13 Stewart Developments Ltd. €68.98 €68.98 €73.37
18 16 L&M Keating Ltd. €60.82 €60.17 €61.04
19 17 Duggan Brothers (Contractors) Ltd. €55.40 €55.40 €46.45
20 22 Ganson Building & Civil Engineering Contractors Ltd. €53.29 €44.60 €37.29
21 19 J & K Townmore Construction Ltd. €47.30 €41.50 €44.13
22 26 Glenbeigh Construction Ltd. €44.70 €44.70 €20.60
23 23 Clancy Construction Ltd. €41.02 €41.02 €34.20
24 25 MMD Construction Cork Ltd. €40.00 €40.00 €21.09
25 21 Purcell Construction Ltd. €38.50 €38.50 €38.10
26 29 MDY Construction Ltd. €36.61 €36.61 €17.03
27 24 Monami Construction Ltd €35.20 €35.20 €25.76
28 30 Manley Construction Ltd. €27.00 €22.95 €16.26
29 27 Townlink Construction Ltd. €25.20 €25.20 €20.45
30 28 MJ Conroy & Sons Ltd. €23.15 €8.85 €17.57
Note: Ranked on Global TurnoverSource: Individual Companies Auditors, Companies Registration Office
Ireland Handbook 2017
Linesight | 29Ornua, Co Cork
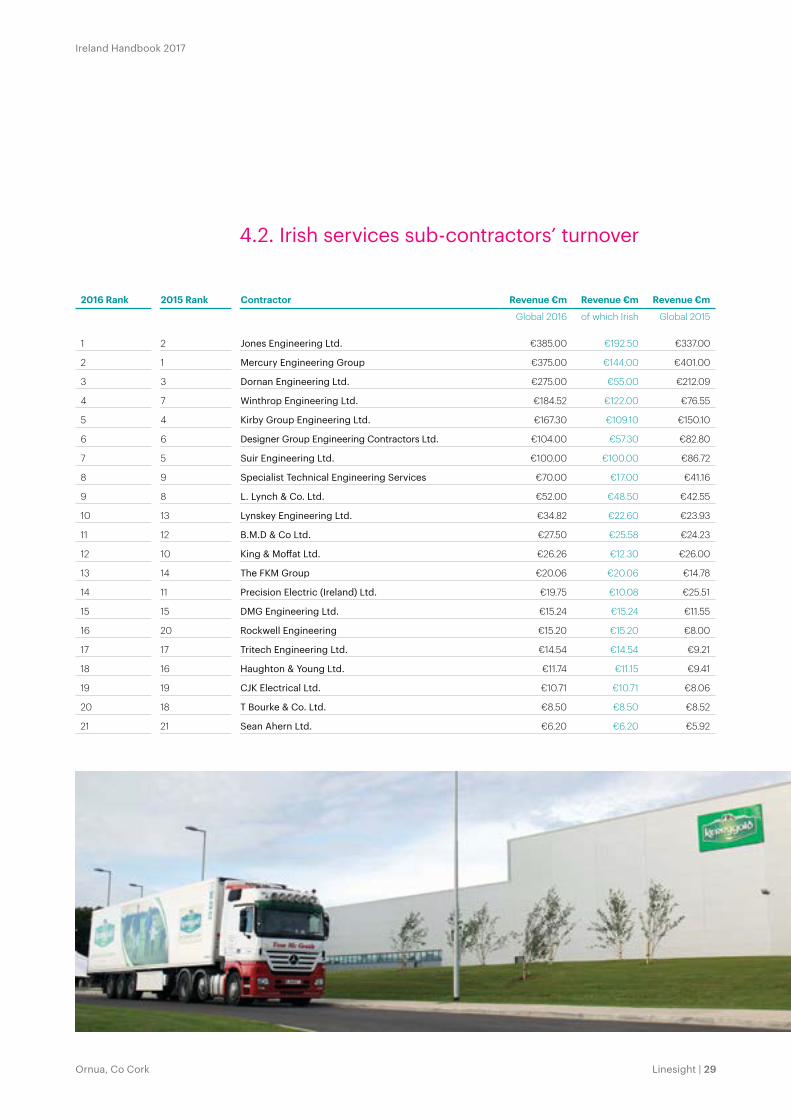
4.2. Irish services sub-contractors’ turnover
2016 Rank 2015 Rank Contractor Revenue €m Revenue €m Revenue €m
Global 2016 of which Irish Global 2015
1 2 Jones Engineering Ltd. €385.00 €192.50 €337.00
2 1 Mercury Engineering Group €375.00 €144.00 €401.00
3 3 Dornan Engineering Ltd. €275.00 €55.00 €212.09
4 7 Winthrop Engineering Ltd. €184.52 €122.00 €76.55
5 4 Kirby Group Engineering Ltd. €167.30 €109.10 €150.10
6 6 Designer Group Engineering Contractors Ltd. €104.00 €57.30 €82.80
7 5 Suir Engineering Ltd. €100.00 €100.00 €86.72
8 9 Specialist Technical Engineering Services €70.00 €17.00 €41.16
9 8 L. Lynch & Co. Ltd. €52.00 €48.50 €42.55
10 13 Lynskey Engineering Ltd. €34.82 €22.60 €23.93
11 12 B.M.D & Co Ltd. €27.50 €25.58 €24.23
12 10 King & Moffat Ltd. €26.26 €12.30 €26.00
13 14 The FKM Group €20.06 €20.06 €14.78
14 11 Precision Electric (Ireland) Ltd. €19.75 €10.08 €25.51
15 15 DMG Engineering Ltd. €15.24 €15.24 €11.55
16 20 Rockwell Engineering €15.20 €15.20 €8.00
17 17 Tritech Engineering Ltd. €14.54 €14.54 €9.21
18 16 Haughton & Young Ltd. €11.74 €11.15 €9.41
19 19 CJK Electrical Ltd. €10.71 €10.71 €8.06
20 18 T Bourke & Co. Ltd. €8.50 €8.50 €8.52
21 21 Sean Ahern Ltd. €6.20 €6.20 €5.92

Knowledge Center 2017
30 | Linesight
Craftsman General Operative
Grade A Grade B Grade C Grade D
1st October 2005 €16.85 €16.34 €15.33 €14.83 €13.48
1st April 2006 (3%) €17.36 €16.84 €15.80 €15.28 €13.89
1st October 2006 (2%) €17.71 €17.18 €16.12 €15.58 €14.17
1st July 2007 (2.5%) €18.15 €17.61 €16.52 €15.97 €14.52
1st January 2008 (2.5%) €18.60 €18.04 €16.93 €16.37 €14.88
4th February 2011 (-7.5%) €17.21 €16.69 €15.66 €15.14 €13.77
5.1. Basic hourly wage rates
5. Wage rates and charges
Note: During 2013 Registered Employment Agreements were declared unconstitutional therefore the above rates are no longer legally binding.
Source: Registered Agreement for the Construction Industry
€13
€14
€15
€16
€17
€18
€19
Grade DGrade CGrade BGrade ACraftsman
Feb11
Jan08
Jul07
Oct06
Apr06
Oct05
General Operative:

Ireland Handbook 2017
Linesight | 31
5.2. Basic hourly wage rates – mechanical
5.3. Basic hourly wage rates – electrical
1st October 2005 €16.85
1st April 2006 €17.36
1st October 2006 €17.71
1st July 2007 €18.15
1st January 2008 €18.60
4th February 2011 €21.42
1st July 2016 €21.93
1st January 2017 €22.48
1st October 2017 €23.02
1st March 2018 €23.60
1st April 2004 €18.98
1st April 2005 €19.72
1st April 2006 €20.39
1st April 2007 €21.49
1st July 2016 €22.01
1st January 2017 €22.56
€16
€17
€18
€19
€20
€21
€22
€23
€24
Mar18
Oct17
Jan17
Jul16
Feb11
Jan08
Jul07
Oct06
Apr06
Oct05
Mechanical
Electrical
€16
€17
€18
€19
€20
€21
€22
€23
€24
Jan17
Jul16
Apr07
Apr06
Apr05
Apr04
Note: Current Electrical Agreement expires 30th April 2017Source: MEBSCA/ECA
Source: MEBSCA/ECA
Knowledge Center 2017
32 | Linesight
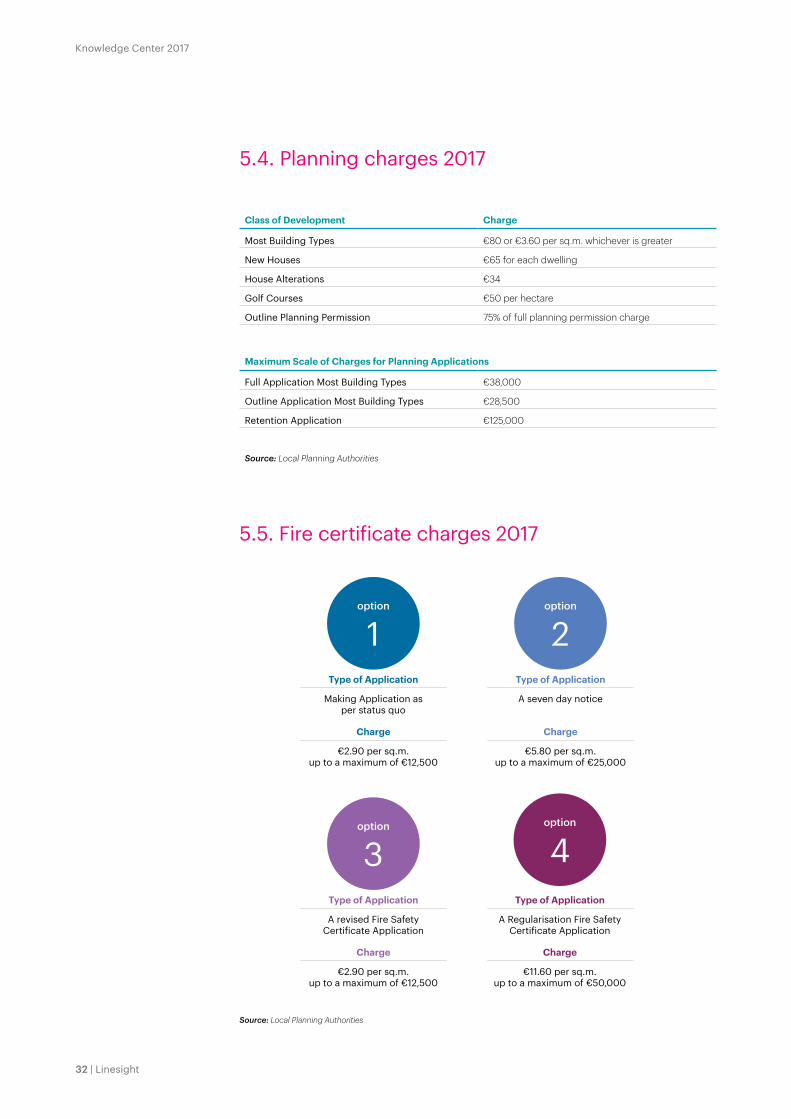
Class of Development Charge
Most Building Types €80 or €3.60 per sq.m. whichever is greater
New Houses €65 for each dwelling
House Alterations €34
Golf Courses €50 per hectare
Outline Planning Permission 75% of full planning permission charge
Maximum Scale of Charges for Planning Applications
Full Application Most Building Types €38,000
Outline Application Most Building Types €28,500
Retention Application €125,000
Source: Local Planning Authorities
5.4. Planning charges 2017
5.5. Fire certificate charges 2017
Type of Application Type of Application
Type of Application Type of Application
Charge Charge
Charge Charge
Making Application as per status quo
A seven day notice
A revised Fire Safety Certificate Application
A Regularisation Fire Safety Certificate Application
€2.90 per sq.m. up to a maximum of €12,500
€5.80 per sq.m. up to a maximum of €25,000
€2.90 per sq.m. up to a maximum of €12,500
€11.60 per sq.m. up to a maximum of €50,000
option
1option
2
option
3option
4
Source: Local Planning Authorities

Ireland Handbook 2017
Linesight | 33
Ireland Handbook 2017
21 Charlemont, Dublin 2 Linesight | 33
Ireland Handbook 2017
Knowledge Center 2017
34 | Linesight
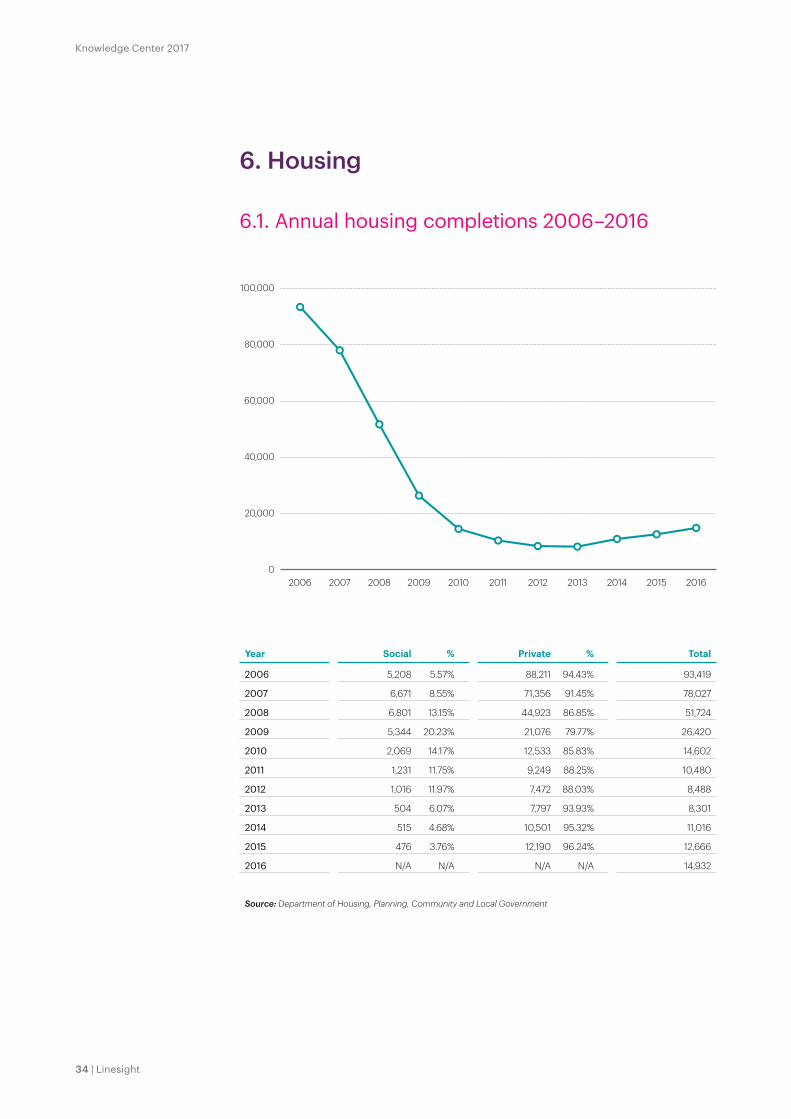
6.1. Annual housing completions 2006–2016
0
20,000
40,000
60,000
80,000
100,000
20162015201420132012201120102009200820072006
6. Housing
Year Social % Private % Total
2006 5,208 5.57% 88,211 94.43% 93,419
2007 6,671 8.55% 71,356 91.45% 78,027
2008 6,801 13.15% 44,923 86.85% 51,724
2009 5,344 20.23% 21,076 79.77% 26,420
2010 2,069 14.17% 12,533 85.83% 14,602
2011 1,231 11.75% 9,249 88.25% 10,480
2012 1,016 11.97% 7,472 88.03% 8,488
2013 504 6.07% 7,797 93.93% 8,301
2014 515 4.68% 10,501 95.32% 11,016
2015 476 3.76% 12,190 96.24% 12,666
2016 N/A N/A N/A N/A 14,932
Source: Department of Housing, Planning, Community and Local Government
Ireland Handbook 2017
Linesight | 35
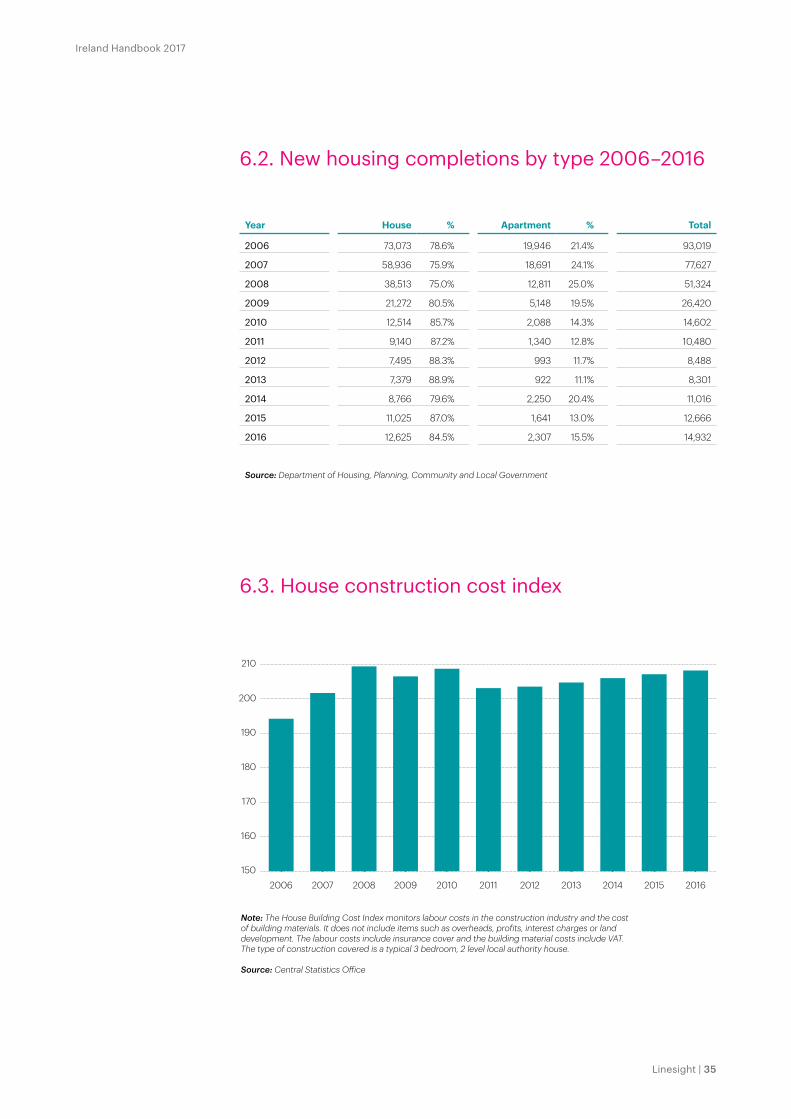
6.3. House construction cost index
150
160
170
180
190
200
210
20162015201420132012201120102009200820072006
Note: The House Building Cost Index monitors labour costs in the construction industry and the cost of building materials. It does not include items such as overheads, profits, interest charges or land development. The labour costs include insurance cover and the building material costs include VAT. The type of construction covered is a typical 3 bedroom, 2 level local authority house.
Source: Central Statistics O�ice
6.2. New housing completions by type 2006–2016
Year House % Apartment % Total
2006 73,073 78.6% 19,946 21.4% 93,019
2007 58,936 75.9% 18,691 24.1% 77,627
2008 38,513 75.0% 12,811 25.0% 51,324
2009 21,272 80.5% 5,148 19.5% 26,420
2010 12,514 85.7% 2,088 14.3% 14,602
2011 9,140 87.2% 1,340 12.8% 10,480
2012 7,495 88.3% 993 11.7% 8,488
2013 7,379 88.9% 922 11.1% 8,301
2014 8,766 79.6% 2,250 20.4% 11,016
2015 11,025 87.0% 1,641 13.0% 12,666
2016 12,625 84.5% 2,307 15.5% 14,932
Source: Department of Housing, Planning, Community and Local Government

Knowledge Center 2017
36 | Linesight
House type
No. ofbedrooms
Typical size
Rebuilding cost
Dublinarea
Corkarea
Galwayarea
Waterfordarea
Limerickarea
North Westarea
North East area
Terraced 2 70 sq.m. (753 sq.ft.)
€1,918 sq.m. €178 sq.ft.
€1,558 sq.m. €145 sq.ft.
€1,499 sq.m. €139 sq.ft.
€1,478 sq.m. €137 sq.ft.
€1,520 sq.m. €141 sq.ft.
€1,305 sq.m. €121 sq.ft.
€1,539 sq.m. €143 sq.ft.
3 95 sq.m. (1,023 sq.ft.)
€1,834 sq.m. €170 sq.ft.
€1,477 sq.m. €137 sq.ft.
€1,436 sq.m. €133 sq.ft.
€1,397 sq.m. €130 sq.ft.
€1,438 sq.m. €134 sq.ft.
€1,231 sq.m. €114 sq.ft.
€1,454 sq.m. €135 sq.ft.
Semi-detached
3 95 sq.m. (1,023 sq.ft.)
€1,901 sq.m. €177 sq.ft.
€1,495 sq.m. €139 sq.ft.
€1,471 sq.m. €137 sq.ft.
€1,419 sq.m. €132 sq.ft.
€1,455 sq.m. €135 sq.ft.
€1,242 sq.m. €115 sq.ft.
€1,536 sq.m. €143 sq.ft.
4 118 sq.m. (1,270 sq.ft.)
€1,864 sq.m. €173 sq.ft.
€1,481 sq.m. €138 sq.ft.
€1,398 sq.m. €130 sq.ft.
€1,395 sq.m. €130 sq.ft.
€1,401 sq.m. €130 sq.ft.
€1,227 sq.m. €114 sq.ft.
€1,414 sq.m. €131 sq.ft.
Detached 4 118 sq.m. (1,270 sq.ft.)
€1,868 sq.m. €174 sq.ft.
€1,524 sq.m. €142 sq.ft.
€1,447 sq.m. €134 sq.ft.
€1,438 sq.m. €134 sq.ft.
€1,474 sq.m. €137 sq.ft.
€1,238 sq.m. €115 sq.ft.
€1,483 sq.m. €138 sq.ft.
Detached Bungalow
4 146 sq.m. (1,572 sq.ft.)
€1,796 sq.m. €167 sq.ft.
€1,486 sq.m. €138 sq.ft.
€1,392 sq.m. €129 sq.ft.
€1,345 sq.m. €125 sq.ft.
€1,468 sq.m. €136 sq.ft.
€1,195 sq.m. €111 sq.ft.
€1,440 sq.m.€134 sq.ft.
Garage: Total rebuilding costs range from €14,443 for a single attached garage to €25,983 for a double attached garage.This table is a guideline based on a typical speculatively built, estate-type house in the Dublin, Cork, Galway, Waterford, Limerick, North West and North East regions. These figures are June 2016 figures. See important notes below.
Source: Society of Chartered Surveyors Ireland
1. The figures shown in the table are a MINIMUM base cost guide for your house insurance.
2. The figures assume a basic quality specification with normal foundations, timber frames or brick/block walls, concrete tiled roof, concrete ground floor and timber first floor, softwood flush doors and hardwood double glazed windows, painted plaster to walls, plastered ceilings, standard electrics and central heating. The sum insured should be increased to allow for better than average kitchen fittings, built-in wardrobes, finishes and any other items not normally included in an estate-type house.
3. House contents such as carpets, curtains, furniture, etc., are not covered by the figures.
4. No allowance has been made for the cost of outbuildings or patios. The figures do, however, allow for a concrete path around the house, for driveway repairs and regrassing and fencing.
5. The figures allow for demolition costs, professional fees incurred in reinstatement and VAT at 13.5% on building costs and 23% on professional fees.
6. The amounts included for professional fees have been calculated to cover the following services: Building Surveyor/Architect: prepare working drawings and specification, and administer the building contract. Chartered Quantity Surveyor: invite and examine tenders, process payments and agree final account. Engineer: advice on structural issues. Fees associated with the certification of the house under the Building Control (Amendment) Regulations 2014.
7. The costs are based on building rates in June 2016.
6.4. SCSI house rebuilding costs 2016

Ireland Handbook 2017
Linesight | 37Maynooth University Student Housing Linesight | 37
Ireland Handbook 2017

Knowledge Center 2017
38 | Linesight
Our values, our peopleOur values reflect what we believe in and how we behave when engaging with clients and partners, and the society in which we live

Ireland Handbook 2017
Linesight | 39
Over the years we have developed a way of working that ensures quality and consistency in how we operate. Our five core values inform what we do and how we do it:
ResourcefulnessWe work around the world, in diverse sectors and for clients with distinct ambitions. This requires us to act effectively and creatively in new and complicated situations. We rely on our individual and collective abilities to resolve any challenges we may face.
Long-term viewWe believe in working sustainably, and so we build enduring relationships with our clients and partners. We work together in a way that is respectful and considerate of each other and the wider society in which we live.
PartnershipWe are focused on our clients’ goals and work closely with them to achieve the best possible results. We believe in collaboration. When we share our experiences and combine our expertise, we can achieve great things.
ProgressWe believe in always moving things forward and finding better ways of working. We’re not just focused on what we do but also on what we can achieve. We are driven by success – for our clients, our partners and each other.
IntegrityWe are fair, open and ethical in everything we do. We challenge things we believe to be wrong and are open to being challenged by others. We take pride in the quality, accuracy and independence of our work.
Linesight | 39

Knowledge Center 2017
40 | Linesight
Knowledge Center 2017
The National Maternity Hospital, St Vincent’s University Hospital Campus, Dublin 4

Ireland Handbook 2017
Linesight | 41
Global Insights
Further insights available at linesight.com/knowledge

Knowledge Center 2017
42 | Linesight
by Kevin Kinsella, Director and Michael Riordan, Director United Kingdom
Brexit – What’s next?Following the landmark Brexit referendum, we are facing a period of uncertainty for the construction industry which is likely to have significant impacts.
Knowledge Center 2017
42 | Linesight

Ireland Handbook 2017
Linesight | 43
Brexit dominated international media in 2016, following the surprising result of June’s referendum. While an economic nosedive was predicted, and the pound took a severe blow from which it is still recovering, the reality has not yet been as earth-shattering as anticipated. However, with the pivotal negotiation process just getting underway, the uncertainty and difficult decisions are only beginning.
The likely outcomeAs a clearer picture of the deal being sought by the UK emerges, it is widely accepted that with the complexities involved, the likelihood of an agreement being reached by summer 2019 is slim.
The British Prime Minister has been vocal about the need for a ‘unique’ solution, but 20 of the 27 member states, representing 65 percent of the EU population, would have to vote in favour of this. The UK will leave the single market as it leaves the EU, meaning an exit from the Customs Union and an end to the free movement of goods, services, people and capital. It will seek bespoke and comprehensive customs union and free trade agreements, giving the greatest possible access. Whether or not this is achievable remains to be seen, but the UK is standing over its stance that “no deal for Britain is better than a bad deal”.
The outcome of the Brexit negotiations will pose considerable implications for Ireland, in particular. Maintaining the common travel area between north and south is one of the UK’s core 12 objectives, but some form of a physical border is inevitable, with checking of goods and documentation as vehicles travel across. It is hoped that this will be a customs rather than a security border, and will be as “frictionless” as possible.
Furthermore, the UK and Ireland have historically been allies within the EU, with closely aligned interests, but Brexit marks the loss of this ally and more powerful negotiator. A softer Brexit would have been preferable and involved less risk for Ireland. Irish businesses face a period of uncertainty, with a heavy reliance on the UK market – 37 percent of Irish exports go to the UK, valued at €7.5 billion, and potential tariffs, as well as logistical complexities (customs checks, bureaucracy etc.), could have devastating impacts. Business interest groups continue to raise questions about future trading relationships, business supply chains and access to the market, with Danny McCoy of IBEC asserting that “Ireland is uniquely exposed to the risks given our deep economic ties with the UK.”
The anticipated impact on constructionConstruction is expected to be one of the high impact sectors, with the movement of people, in particular, presenting a formidable challenge to the industry. In light of the prevalent skills shortage, and the implications of the end of the free movement of goods on imports and exports, there is considerable concern within the industry.
The currency volatility continues, with the pound having lost significant value against both the euro and the US dollar. Sterling is regularly dipping below €1.17, and has dropped roughly 15 percent against the dollar since referendum day. Its decline in the wake of Brexit is driving price pressures higher, which is reflected in like-for-like increases on imported construction materials. The large external envelope contractors and manufacturing sites that supply the UK are mainly based in continental Europe, so these increases are being reflected in recent tender costs.
Although a report by the Confederation of British Industry indicated that orders in the three months up until February grew at the highest rate in two years, the number of manufacturers who expect to have to change their prices over the coming months rose to its highest in nearly six years. However, it is expected that there will be a lag in higher prices translating to Consumer Price Index (CPI) inflation and that firms will be forced to absorb a proportion of the increased costs, due to heightened competition. The outlook from commentators is mixed, with some believing the devaluing has reached its worst, while others report that the worst is yet to come.
The impact of Brexit on the Irish construction industry is difficult to gauge, given the level of uncertainty about the outcome. Fluctuations in currency have the potential to impact on the competitiveness of companies trading with the UK, in particular those who export materials. The reaction of the industry in the UK will have a knock-on effect on companies who are active in, or targeting the UK market. On the other side, an increasing number of financial firms based in the UK, and London in particular, are proactively seeking space in Dublin to relocate a percentage of their staff, in order to continue to benefit from trading within the EU. This will help to drive both the fit-out and office construction market over the coming few years.
The pound’s decline is driving price pressures higher, and being reflected in like-for-like increases on imported construction materials
Knowledge Center 2017
44 | Linesight
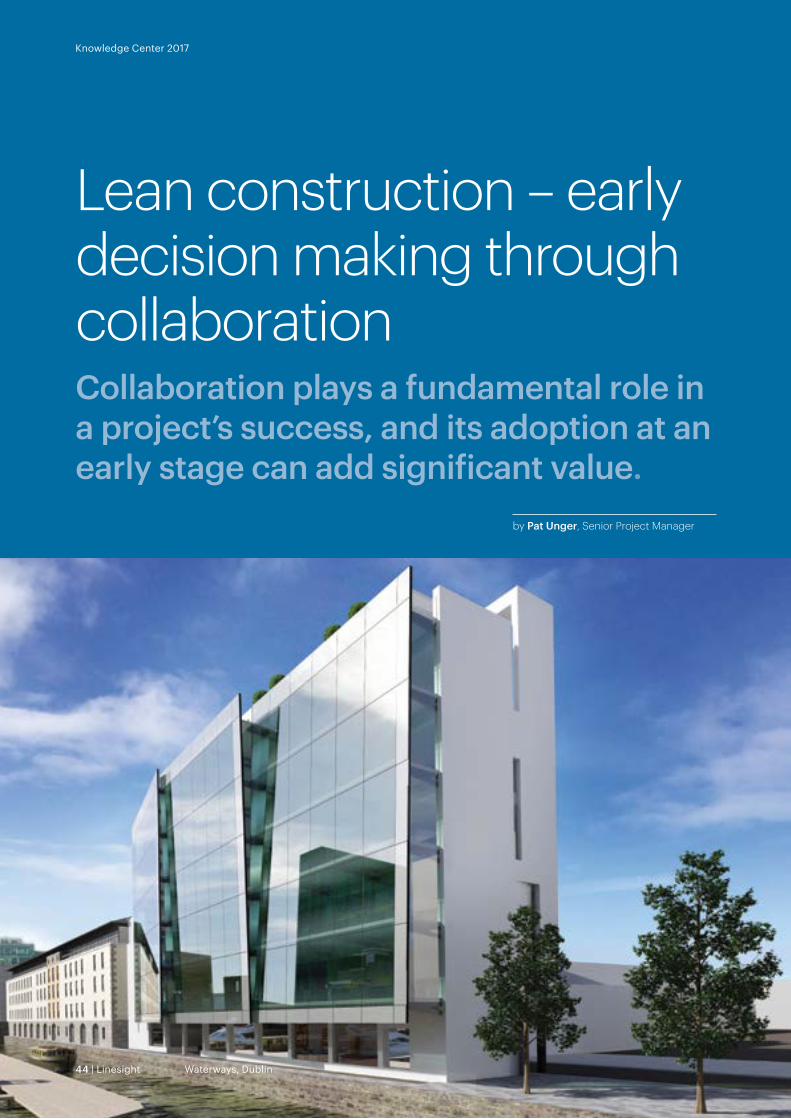
by Pat Unger, Senior Project Manager
Lean construction – early decision making through collaborationCollaboration plays a fundamental role in a project’s success, and its adoption at an early stage can add significant value.
Knowledge Center 2017
Waterways, Dublin44 | Linesight

Ireland Handbook 2017
Linesight | 45
Prefabrication and modularisation are not new concepts – in fact both have been part of the construction industry for many years, but their use has grown extensively in recent years and both are now considered to be within the “toolbox” of lean construction. Prefabrication can be defined as the process of assembling building systems to a nearly-complete state off-site, to later deliver to the project site for installation. Modularisation involves constructing a finished project off-site, and then delivering it to the construction site to assemble with other modules to create the final product. The use of these types of lean construction tools, and the level of complexity involved, will vary depending on the project type.
The core benefits of utilising modules and components which are produced in an off-site facility, and then transferred into a construction project, are that it can reduce not only individual durations, but also the overall construction programme. In addition, it has the potential to reduce overall costs for the project. While one could argue that there are increased costs involved with these off-site processes for the contractor (for example the leasing of suitable premises, insurances, management of the process and transport), it also streamlines their processes, and reduces their resources and material on-site, effectively eliminating waste – the cornerstone of lean construction. With reduced labour on-site, less coordination is required; it will drive increased cost and programme certainty while delivering higher quality installations.
The decision to implement prefabrication or modularisation on a project often occurs at the post-contractor appointment stage. However, this decision often serves better at an earlier stage, at the commencement of the design phase whereby opportunities for these tools can be sought and considered. By having contractors involved in pre-construction activities, they can add value as to where the use of prefabrication and/or modularisation is appropriate when considering the constructability of a particular project. This early decision-making allows for critical design to be progressed, taking advantage of off-site prefabrication during enabling works.
Ultimately, the optimal solution is collaboration – utilising contractor knowledge and pre-construction services at an early stage, and benefitting from their early involvement. Collaboration, when implemented, can play a critical role in the success of a project.
This collaborative relationship can be achieved through strategic partnering and/or an integrated project team, which would be between the client’s team, the design team, the contractor and the supply chain. The supply chain could very well include specialists who, with their knowledge, can provide critical advice on how best to take advantage of prefabrication techniques and processes – for example the prefabrication of headwalls in patient rooms in hospitals. The involvement of the integrated design team at an early stage facilitates active participation in developing the design and constructability of the project (giving early consideration to the use of prefabrication and modularisation). Furthermore, it also allows for comprehensive consideration of a range of elements; the cost of constructing and maintaining the facility, health and safety implications, sustainability, design quality, speed of delivery and the operational efficiency of the completed facility.
In summary, both prefabrication and modularisation are intrinsically linked with lean construction, and offer considerable benefits for a range of projects of various types and scales. Taking time early in the project to carefully consider these options, and incorporating one or both into design and design programmes will improve the predictability in delivering projects on time, within budget and to a higher standard. If the project team is determined to engage in a collaborative relationship from the outset of the project, then this in itself will hopefully lead early decision making on utilising lean construction tools such as using prefabrication and modularisation.
Ultimately, the optimal solution is collaboration – utilising contractor knowledge and pre-construction services at an early stage, and benefitting from their early involvement
Knowledge Center 2017
46 | Linesight
The project scheduleToday, there are numerous software tools available to manage schedules, which are relatively easy to operate and allow for the creation of well-presented and aesthetically pleasing schedules. Yet here lies the problem, despite appearing credible, schedules can misrepresent the true structure and intricacies of a project, and be underpinned by no sound logic.
Project Managers are often not aware of the technical deficiencies that can render the schedule data flawed. The layers of complexity of a schedule can be underestimated and the risk of operating schedule software without sufficient scheduling knowledge, experience and quality control can be erroneously overlooked.
The schedule is a dynamic document and it is inevitable that it will change and evolve from an agreed baseline across the course of a project. Constant variations in the schedule, as it is progressed, single-handedly provide a challenge for a Scheduler to maintain schedule integrity. Couple this with formal change incorporation and the Scheduler has a major challenge to maintain the quality of the deliverable.
Experienced Schedulers will recognise the need for a schedule governed by standards and best practices which enforce quality, providing assurance that scheduling information can be relied upon. On any project, it is imperative that the expectations regarding schedule quality are communicated from the outset, ensuring that quality is established when the first baseline is set, and schedule integrity validated and maintained thereafter.
The Linesight approachLinesight do not just review a schedule for the forecast finish dates and major milestones. In addition to ensuring that a schedule accurately represents project scope and delivery strategy, our approach questions schedule construction, credibility and conformance to recognised best practices.
A process referred to in Linesight as a ‘Schedule Health Check’ (SHC), is the method by which schedule integrity is measured, predominantly involving the use of statistical data and analysis.
Our Global Planning Team undertakes SHCs on all of our projects, and these form the foundation of all Linesight scheduling processes that follow.
The importance of project schedule integrity The Linesight approach to schedule quality assurance ensures that Project Managers are confident that the data and information is of sufficient quality to make effective business decisions.
by Anthony Canipa, Senior Planner
Knowledge Center 2017

Ireland Handbook 2017
Linesight | 47
The justification is simple – a schedule of sound quality underpins every other aspect of schedule analysis including:
• Delivery performance analysis
• Critical path analysis
• Earned value analysis
• Schedule quantitative risk analysis
• Time-delay impact analysis
Without confirmation of schedule integrity, all schedule outputs can be easily discredited, deemed invalid and result in a loss of schedule confidence, which can be impossible to recover from.
The Schedule Health Check (SHC)The Linesight SHC is a documented procedure that all of our Schedulers follow globally, maintaining quality and consistency in our practices, irrespective of project or location.
The SHC is based around the ‘DCMA 14-point assessment’, an approach which was developed by the United States Department of Defense and evaluates schedule conformance to a prescriptive list of criteria, all of which measure norms and thresholds.
A few examples of areas analysed by the assessment include:
• Activity relationships and logic
• Constraints and float levels
• Abnormal durations
• Software and calendar setting
• Resource allocation
Linesight procedures enforce a level of schedule interaction that requires our team to have truly investigated the dynamics of a schedule. Utilisation of multi-user software applications allows our Global Planning team to provide consultation worldwide, ensuring we have business unit expertise to support any project. In addition, Linesight processes recognise industry best practices which are endorsed by professional bodies worldwide including the Chartered Institute of Building (CIOB), AACE International, the Association for Project Management (APM) and the Project Management Body of Knowledge (PMBOK).
The futureBe under no illusions – a better schedule will not single-handedly deliver project success. Nonetheless, avoidable errors within schedules are likely to hinder decision-making and the delivery of project objectives.
In 2011, a study of 35 Capex projects1, (US$15 million- US$30 billion) identified a positive correlation, with 60 percent confidence, that schedule quality drives project execution, corroborating the importance of the scheduling practice.
In support of our clients, we continue to drive and support scheduling practices through improved methodologies, education and reforms that administer greater schedule quality control.
Our aim is to ensure that Linesight Schedulers can provide schedule information of a validated quality, which can assist clients in making the best business decision possible at a given point in time.
Schedule Quality IndexTM
Fini
sh C
ompl
ianc
e In
dexTM
Figure 1 – Correlation Between Schedule Quality IndexTM & Finish ComplianceTM Index
0%
0%
10%
10% 20% 30% 40% 50% 60% 70% 80%
20%
30%
40%
50%
60%
70%
80%
90%
100%
R2=0.603
1. Patterson, D. & Choi, J.O. (2011) ‘Does Better Scheduling Drive Execution Success?’
Excessive Durations
Target: <5%Score: 22%
Target: <5%Score: 8.3%
Open-Ends
Target: >90%Score: 82%
F-S Relationships
Target: <5%Score: 1.3%
Constraints
Target: <5%Score: 10%
Negative Float
Target: >90%Score: 95%
Resource Load
Excessive Durations
Target: <5%Score: 22%
Target: <5%Score: 8.3%
Open-Ends
Target: >90%Score: 82%
F-S Relationships
Target: <5%Score: 1.3%
Constraints
Target: <5%Score: 10%
Negative Float
Target: >90%Score: 95%
Resource Load

Knowledge Center 2017
48 | Linesight
Trends in Safety ManagementConstruction is a business where change is the business. Recent trends and changes are set to significantly affect the industry.
by Niall Harrington, Managing Director, Safety Management
We live in a changing world, or so the saying goes. Nowhere is that more true than the construction industry. Construction is a business where change is the business. The impact of change, and failing to manage this, affects construction like no other. A single accident can destroy a business – not just in human terms, which is tragic, but in the cold commercial reality in which every business and employer operates. Fines, adverse publicity and court prosecutions, both for the company and the individual manager involved, can be devastating and very difficult to recover from.
It is a truism to state that good Safety Management is simply good management. What is less well understood is the inevitability of accidents as a result of poor safety planning. Safety incidents will occur, if not on the current project, then potentially on the next. It is vital to keep on top of health and safety trends, and how they will affect you. Some of the recent and forthcoming changes include the following:
Safety legislation and personal liabilityIn recent years, the industry has seen an increasing trend of court prosecutions moving to include the personal liability of directors and senior managers.
Not everyone is aware of these requirements, nor of the language used to describe these duties, but they should be. The fundamental rule in the corporate world is that if you possess a legal duty to do something, then you need to be aware of this duty and able to demonstrate that you have discharged it. Most of us have very specific duties – possibly more than we are aware, for example, as employer, employee, designer, contractor, client, landlord etc.
Knowledge Center 2017
Ireland Handbook 2017
Linesight | 49
Technology The landscape of how we manage safety is also in flux. Building Information Modelling (BIM) is only one aspect that is having both a direct and an indirect effect on Safety Management. When properly used, BIM can significantly improve the way that safety can be managed during both design and construction, through mapping out the layout and sequencing by which the works can be constructed. ‘Buildability’ from a design perspective not only makes commercial sense in reducing waste, but is a specific legal responsibility of everyone regarded as a ‘Designer’ under construction safety legislation. Building in safe access for future inspections and maintenance is another key benefit.
BIM can also improve safety by charting and communicating information on buried services for future excavation works. In other areas, companies are using virtual technology to deliver safety training and offline inductions, and to demonstrate competency requirements for specialist workers, thereby reducing resources and time spent on-site.
Behavioural safetyContractors can, and do, expend huge resources on Safety Management, building a safety culture and communicating the ‘safety message’. The enormity of this challenge should not be underestimated, particularly when you might be dealing with hundreds of employees, each with their own particular mind-set. How does a senior manager communicate with the operative of a subcontractor or even a ‘sub subcontractor’ effectively? One-to-one micromanagement is neither feasible nor desirable.
Behavioural safety training programmes of some description are now commonplace across many projects. Not all are effective, and most are in addition to existing safety training, as well as being supplemented by additional safety enhancements. Trends in safety posters, for example, have focused very much on the emotional aspects of a serious accident, by concentrating on the impact on loved ones following a workplace fatality. Ultimately, the means by which the message is communicated must also evolve. There is far too much emphasis on PowerPoint, for example, and workers are increasingly switching off from the latest ‘Toolbox Talk’ or ‘Safety Training Module’. More effective means of
communication are increasingly needed. Alternative methods can include role playing, as well as analysis and images from other serious accidents.
Modular constructionModular construction or prefabrication off-site is not new, but is becoming increasingly popular on large construction projects. The advantages are obvious; off-site construction can reduce risk on-site and reduce the timescales involved. There can be significant challenges however. Often the risks are merely transferred from the main construction site to other work areas – possibly areas where safety is not as well-managed and legal responsibilities can be blurred. While ‘control’ of a work area can define responsibility for Safety Management, such works may well form part of an overall ‘project’ as defined by construction safety legislation. Legislation in Ireland, for example, includes a specific duty of care to non-construction personnel including members of the public, visitors etc.
Occupational health While legislation, procedures and policies have concentrated on physical safety, occupational health- related issues have assumed much greater importance. Often described as ‘accidents in slow motion’ due to prolonged exposure over time, they are arguably more difficult to identify and therefore manage. Health-related injuries can range from exposure and inhalation of silica dust, to musculoskeletal injuries and occupational stress. As with every other works-related activity, they must be identified, assessed, managed and controlled. Accurate risk assessment is more important here than in the case of many other risks, not least in regard to the range and nature of the activities involved. Communication, training and consultation are vital elements in effective risk assessment, as is the knowledge and awareness of the risks involved.
The industry has seen an increasing trend of court prosecutions moving to include the personal liability of directors and senior managers

Knowledge Center 2017
50 | Linesight
EU public procurement rulesThe key changes and their implications.
by Terence Woulfe-Flanagan
Luas Cross City, Dublin
Knowledge Center 2017
50 | Linesight

Ireland Handbook 2017
Linesight | 51
The EU, in 2014, adopted three procurement directives; the Public Sector and Utilities were replacements and a new directive specifically for Concessions. The aim was to make public procurement less bureaucratic, have better access for SMEs, increase the emphasis on social, sustainable and environmental considerations, embrace new technology and have explicit rules for principles established by significant case law. EU States had until the 18th April 2016 to bring the new rules into national law. Ireland published its regulations for Public Sector and Utilities on the 5th May 2016, but these were applicable from the 18th April. It has yet to publish regulations for Concessions; however the mandatory provisions of the directive apply from the 18th April 2016 by “Direct Effect”.
The new rules, with the exception of the rules on modifications to tenders or contracts, do not apply to existing procurements (defined by the advertisement being published, or bidders being contacted for offers, before 18th April 2016).
The significant changes include:
Market consultation
Pre-tender market consultation is clarified with emphasis on better procurement outcomes whilst maintaining equal treatment of bidders.
Opportunities for SMEs
Encouraging SME participation in public procurement by capping the minimum turnover requirement to twice the contract value and encouraging splitting contracts into lots with a requirement to “Do or Explain” the decision.
Electronic procurement
Procurement communication, with some exceptions, must be electronic with procurement documents available by Internet access on a 24-hour basis.
Different rules for authorities that are not part of central government
Non-central government agencies have added flexibility in the rules relating to their procurements.
No distinction between Part A and Part B services
The distinction between Part A (fully regulated) and Part B (partially regulated) services has been removed.
“Light touch” procurement
There is a new “Light touch” regime that applies to health, social and specified other services some of which were formerly Part B services. These generally have to exceed a new threshold of €750,000 before being subject to rules which are less onerous than the full EU procurement rules.
More grounds for exclusion of applicants and bidders with self-cleaning provisions
There are additional grounds for mandatory and discretionary exclusion. Most grounds for exclusion are now subject to expiry times. Persistent poor contract performance, resulting in serious sanctions, may now trigger an exclusion. A new provision however, affords applicants/bidders an opportunity to self-cleanse in relation to some grounds for exclusion and, if they do so successfully, they may not be excluded for that particular reason. The purchaser may also run checks during the procurement process to see if bidders are in a position that should result in their exclusion. Again self-cleansing provisions apply.
Conflicts of interest
There is greater emphasis on addressing conflicts of interest.
Dublin Airport Air Traffic Control Tower

Knowledge Center 2017
52 | Linesight
• Procurement routes
There are new award procedures for Innovation Partnerships and revised rules for Competitive Dialogue and Competitive Procedure with Negotiation, whose rules are now more flexible with greater scope for their use. Interestingly in the Competitive Procedure with Negotiation, the final tender round may not be subject to negotiation. There is also now an Accelerated Open procedure as well as the existing Accelerated Restricted procedure for urgent procurement.
• Timescales
Shorter minimum timescales for tenders and expressing an interest in tendering.
• Availability of procurement documents
Full suppliers’ access to procurement documentation is required from the date the Contract Notice is published or the sending of an invitation to confirm interest. This significantly changes existing practice for all but the Open procedure.
What does this really mean? The UK Crown Commercial Service suggests that the term “procurement documents” changes at different
stages of the procurement process. It also suggests more of the documents, falling within the wide definition of procurement documents, should be generated and therefore supplied but that at the very early stages of the procurement, fewer of the documents, if any, would be included. This appears to support the purpose behind this regulation that potential bidders should have sufficient information to decide if they wish to participate in the procurement.
• Selection and award
Self-declaration to confirm satisfying the procurement’s qualification requirements, including using the new European Single Procurement Document. Generally only the bidder being considered for award of contract will be required to submit documentary evidence as proof. Purchasers may, however, require such evidence from all applicants who have been short-listed to tender in a two-stage competition.
All contract awards must be based on “most economically advantageous tender”, using a cost-effectiveness approach, for example life-cycle costing, and may include best price-quality ratio. Ireland has not implemented
The UCD Club, Dublin 4
Knowledge Center 2017

Ireland Handbook 2017
Linesight | 53
the option to prohibit the use of price-only or cost-only as an award criterion. There is also greater emphasis on
using environmental and social considerations such as the employment of job-seekers etc. The award stage may now address the qualification and experience of key personnel where such quality could have a significant impact on the level of performance of the contract.
There is a duty to investigate tenders suspected of being abnormally low, but no duty to exclude an abnormally low tender unless it is found that such pricing is due to breaches of environmental, social or labour law.
• Rules arising from case law
Rules permitting contract modifications to tenders and contracts have been codified. Safe Harbours, within which change is permissible, have been created for purchasers, some of which require publication of a standard OJEU notice.
Rules exempting from the regulations contracts between public authorities and joint procurements by public authorities (Teckal and Hamburg case exemptions) have been codified.
• Framework agreements
There is now a provision for a “hybrid” call off process providing for both direct award and mini-tender competitions in multi-supplier frameworks.
• Records and reporting
There are considerably more onerous, and effectively real-time, record keeping and reporting requirements. The justification for decisions taken at all procurement stages must be included.
There are clear benefits in the new regime for both purchasers and suppliers. For purchasers there are wider choices of approach and greater scope to use negotiation and the helpful codification of case law. And there are added benefits for public purchasers who are not part of central government. For suppliers, the level of bureaucracy is reduced and there should be better access to procurement opportunities for SMEs.
For suppliers, the level of bureaucracy is reduced and there should be better access to procurement opportunities for SMEs
Knowledge Center 2017
54 | Linesight
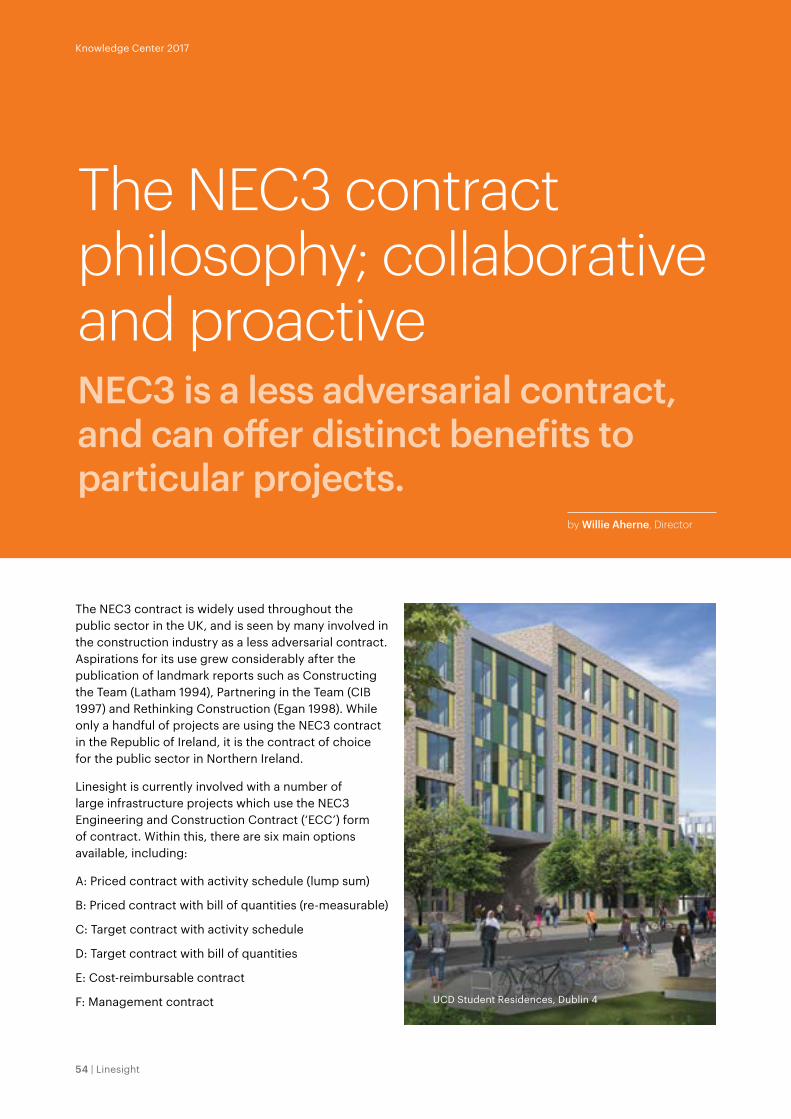
The NEC3 contract philosophy; collaborative and proactiveNEC3 is a less adversarial contract, and can offer distinct benefits to particular projects.
The NEC3 contract is widely used throughout the public sector in the UK, and is seen by many involved in the construction industry as a less adversarial contract. Aspirations for its use grew considerably after the publication of landmark reports such as Constructing the Team (Latham 1994), Partnering in the Team (CIB 1997) and Rethinking Construction (Egan 1998). While only a handful of projects are using the NEC3 contract in the Republic of Ireland, it is the contract of choice for the public sector in Northern Ireland.
Linesight is currently involved with a number of large infrastructure projects which use the NEC3 Engineering and Construction Contract (‘ECC’) form of contract. Within this, there are six main options available, including:
A: Priced contract with activity schedule (lump sum)
B: Priced contract with bill of quantities (re-measurable)
C: Target contract with activity schedule
D: Target contract with bill of quantities
E: Cost-reimbursable contract
F: Management contract
by Willie Aherne, Director
Knowledge Center 2017
UCD Student Residences, Dublin 4
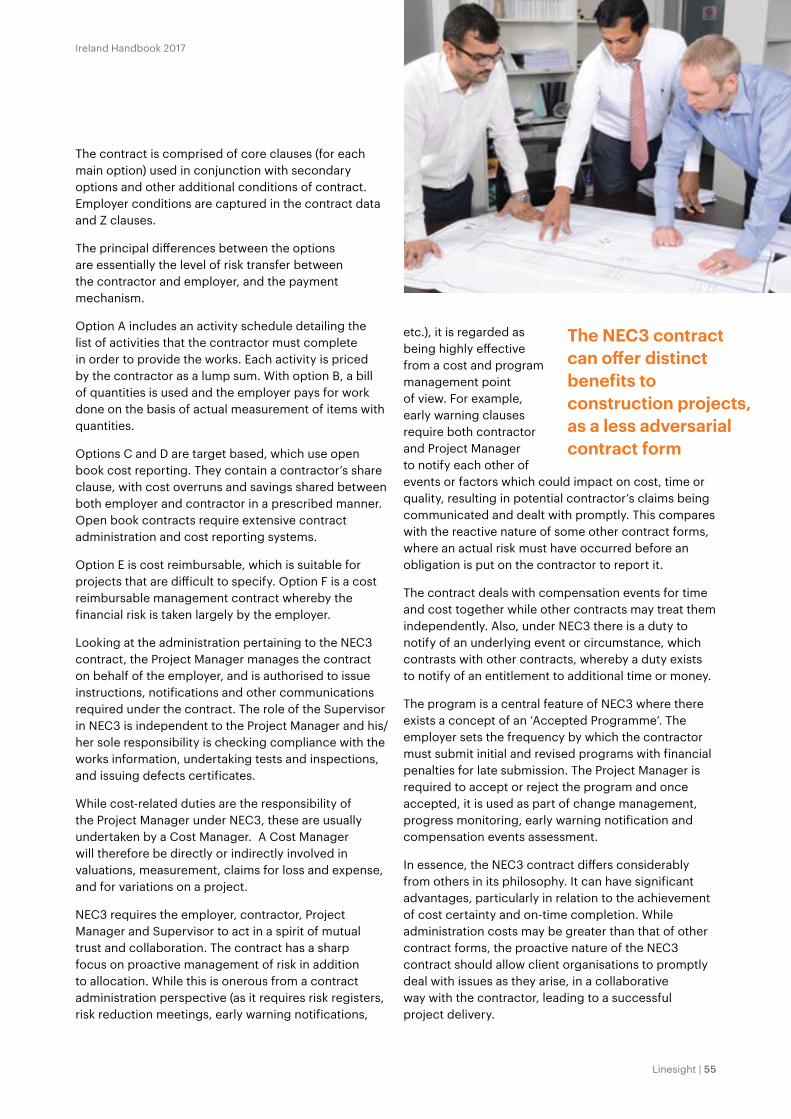
Ireland Handbook 2017
Linesight | 55
The contract is comprised of core clauses (for each main option) used in conjunction with secondary options and other additional conditions of contract. Employer conditions are captured in the contract data and Z clauses.
The principal differences between the options are essentially the level of risk transfer between the contractor and employer, and the payment mechanism.
Option A includes an activity schedule detailing the list of activities that the contractor must complete in order to provide the works. Each activity is priced by the contractor as a lump sum. With option B, a bill of quantities is used and the employer pays for work done on the basis of actual measurement of items with quantities.
Options C and D are target based, which use open book cost reporting. They contain a contractor’s share clause, with cost overruns and savings shared between both employer and contractor in a prescribed manner. Open book contracts require extensive contract administration and cost reporting systems.
Option E is cost reimbursable, which is suitable for projects that are difficult to specify. Option F is a cost reimbursable management contract whereby the financial risk is taken largely by the employer.
Looking at the administration pertaining to the NEC3 contract, the Project Manager manages the contract on behalf of the employer, and is authorised to issue instructions, notifications and other communications required under the contract. The role of the Supervisor in NEC3 is independent to the Project Manager and his/her sole responsibility is checking compliance with the works information, undertaking tests and inspections, and issuing defects certificates.
While cost-related duties are the responsibility of the Project Manager under NEC3, these are usually undertaken by a Cost Manager. A Cost Manager will therefore be directly or indirectly involved in valuations, measurement, claims for loss and expense, and for variations on a project.
NEC3 requires the employer, contractor, Project Manager and Supervisor to act in a spirit of mutual trust and collaboration. The contract has a sharp focus on proactive management of risk in addition to allocation. While this is onerous from a contract administration perspective (as it requires risk registers, risk reduction meetings, early warning notifications,
etc.), it is regarded as being highly effective from a cost and program management point of view. For example, early warning clauses require both contractor and Project Manager to notify each other of events or factors which could impact on cost, time or quality, resulting in potential contractor’s claims being communicated and dealt with promptly. This compares with the reactive nature of some other contract forms, where an actual risk must have occurred before an obligation is put on the contractor to report it.
The contract deals with compensation events for time and cost together while other contracts may treat them independently. Also, under NEC3 there is a duty to notify of an underlying event or circumstance, which contrasts with other contracts, whereby a duty exists to notify of an entitlement to additional time or money.
The program is a central feature of NEC3 where there exists a concept of an ‘Accepted Programme’. The employer sets the frequency by which the contractor must submit initial and revised programs with financial penalties for late submission. The Project Manager is required to accept or reject the program and once accepted, it is used as part of change management, progress monitoring, early warning notification and compensation events assessment.
In essence, the NEC3 contract differs considerably from others in its philosophy. It can have significant advantages, particularly in relation to the achievement of cost certainty and on-time completion. While administration costs may be greater than that of other contract forms, the proactive nature of the NEC3 contract should allow client organisations to promptly deal with issues as they arise, in a collaborative way with the contractor, leading to a successful project delivery.
The NEC3 contract can offer distinct benefits to construction projects, as a less adversarial contract form
Knowledge Center 2017
56 | Linesight
Bigger, faster, cheaperAs data traffic and the demand for data storage continue to grow exponentially, the hyperscaling trend is throwing up unique requirements and challenges.
With data traffic growing at 28 percent per annum, and data storage requirements at 40 percent1, it is not surprising that the big cloud operators have been building everything bigger, and wanting it ever-faster. In 2016, this appetite led not just to big capex spends, but also to a major shift towards the lease space market.
Amazon, Microsoft, Google and IBM comprise over 50 percent of the cloud, and the first three between them invested US$26 billion in 20152, largely in new hyperscale data centers – campuses with 100MW+ potential installed capacity.
This trend is set to continue as the demand increases which have been forecast, materialise, and the number of global hyperscale data centers is predicted to rise from 300 at present to around 485 by 2020.
So, seemingly all rosy in the garden for the industry, but fluctuations at this scale of growth lead to big headaches. It takes a site-based workforce of around 1,000 people to build one of these projects, and its duration will span anything from two to ten years, depending on how the phases are timed.
That can mean mobilisation and demobilisation several times on one campus – not easy where skill shortages are already appearing as the economic tide rises around the world. Workforces are quick to move to other locations and other sectors, dissipating hard-won experience in doing so.
For the owner / operator, the unpredictability leads to volatility in demand forecasted, and makes short-term investment planning very difficult. More than one of the big operators has scaled back capex plans this year, awaiting a little bit of a catch-up.
Traditionally, lease space has been the flex play in the cloud operators’ game plan, offering shorter time-to-market (TTM), which is attractive in this fluctuating demand scenario. By developing sites to a pre-prepared stage as a grey box awaiting fit-out, or at least as a stoned and compacted site with utilities connected, the lease players have long been adept at rapid installation and power-up.
It also offers off-balance sheet options, sometimes attractive to investors. Fewer internal resources are tied up in its acquisition (no internal engineering team required), and simpler, frills-free specifications can deliver genuinely lower infrastructure build costs.
by Neil Vaughan, Director and John Butler, Managing Director Asia Pacific
Knowledge Center 2017

Ireland Handbook 2017
Linesight | 57
However, the large take-up of lease space has attracted new players and stretched the resource base, questioning whether shorter TTMs will actually materialise. Whilst in theory the delivery risk has been transferred, no amount of liquidated damages will bring a delayed schedule back on course, and if milestones are missed the leasee carries the can.
Modularisation is back (if it ever went away) as a trend for 2017, the idea being to sequentially build out these hyperscale data centers in sensible, repeatable lumps, benefiting from procurement and design savings, whilst spreading the delivery timing. As everything has gotten bigger, the data center in a container has been outgrown, but containerised and modularised switchgear, generators and UPS equipment have become very interesting.
Lean construction strategies dovetail nicely with this off-site fabrication approach, so more of that will be seen, as well as a bigger role for the integrator of these different equipment elements.
All of this demand for more data ultimately leads to demand for more power, and several locations are feeling the pinch. Sites with direct access to 400kV power circuits, the super grids of the host countries, are the smart places to be; even the 220kV circuits in urban settings are no longer offering the security of supply at the required capacity that would have been perfectly acceptable five years ago.
Despite the push for bigger and faster, cost remains a significant factor, as each of the big players eye up their competitors’ cost base. It is notoriously difficult to compare like with like, but whether the capex cost per MW is $10 million or $7 million, it will never be low enough. However, data centers are like a box of chocolates – the fancier they are, the more they will cost.
1. Cisco Global Cloud Index 2. MarketRealist.com
Despite the push for bigger and faster, cost remains a significant factor, as each of the big players eye up their competitors’ cost base
Global Switch, Sydney

Knowledge Center 2017
58 | Linesight
by Joe Cusick, Projects Director
Life Sciences – a constantly evolving market‘Big Pharma’ is evolving towards a more integrated approach in its real estate strategy, and the Project Controls team is playing a fundamental role in this.
In recent years, our Life Sciences clients have been focused on streamlining their operating model and looking for efficiencies in every part of their business. This mantra of increasing efficiencies to maximise returns has also influenced the way in which ‘Big Pharma’ executes its real estate strategy. More and more we are seeing these clients move away from a fully outsourced model and traditional project execution strategies. In recent times, our Pharma clients have explored lean construction and Integrated Project Delivery (IPD) methods, while bringing more of the pre-construction expertise back in-house.
These innovative construction delivery models impact the role of consultants as well as contractors, meaning that we all need to be as agile as our clients. Lean construction looks to minimise waste and increase efficiencies in the construction process, with the stated intent of maximising value to the client and increasing speed to market – both key concerns in the highly competitive Life Sciences sector.
The role of Project Controls in this collaborative environmentWith these new project delivery methods, clients are engaging with contractors at an earlier stage – relying on them to carry the load of pre-construction activities and drive through design development with the Design team. However, this collaborative environment still has a place for the Project Controls team. As the pre-construction process becomes more involved and intense, the need for the client to have an expert advisor in place to monitor the process and to challenge / validate project costs, schedule and risks as the design evolves increases. Having the Project Controls consultant there as a challenging partner enhances the pre-construction process; providing constructive advice concurrently with design development and maintaining a focus on the outturn impacts of the design decisions being made.
Equally, the post-contract role is evolving away from the traditional cost and schedule “confrontation”.
Knowledge Center 2017
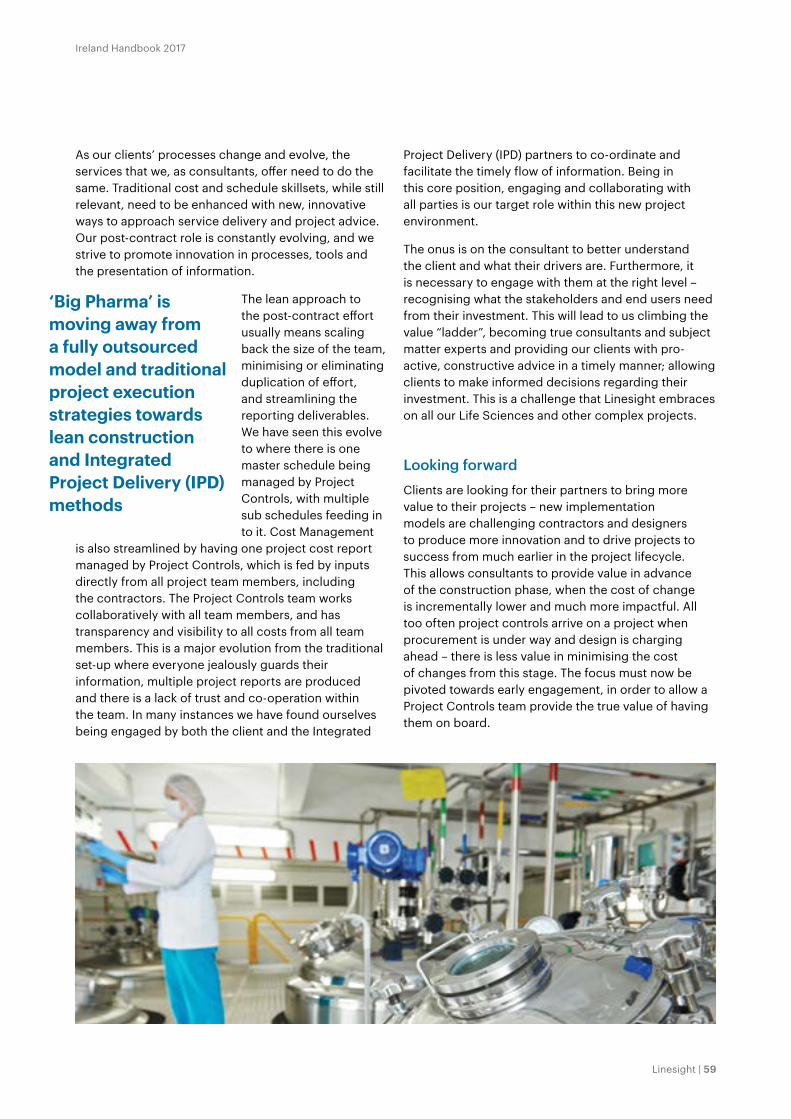
Ireland Handbook 2017
Linesight | 59
As our clients’ processes change and evolve, the services that we, as consultants, offer need to do the same. Traditional cost and schedule skillsets, while still relevant, need to be enhanced with new, innovative ways to approach service delivery and project advice. Our post-contract role is constantly evolving, and we strive to promote innovation in processes, tools and the presentation of information.
The lean approach to the post-contract effort usually means scaling back the size of the team, minimising or eliminating duplication of effort, and streamlining the reporting deliverables. We have seen this evolve to where there is one master schedule being managed by Project Controls, with multiple sub schedules feeding in to it. Cost Management
is also streamlined by having one project cost report managed by Project Controls, which is fed by inputs directly from all project team members, including the contractors. The Project Controls team works collaboratively with all team members, and has transparency and visibility to all costs from all team members. This is a major evolution from the traditional set-up where everyone jealously guards their information, multiple project reports are produced and there is a lack of trust and co-operation within the team. In many instances we have found ourselves being engaged by both the client and the Integrated
Project Delivery (IPD) partners to co-ordinate and facilitate the timely flow of information. Being in this core position, engaging and collaborating with all parties is our target role within this new project environment.
The onus is on the consultant to better understand the client and what their drivers are. Furthermore, it is necessary to engage with them at the right level – recognising what the stakeholders and end users need from their investment. This will lead to us climbing the value “ladder”, becoming true consultants and subject matter experts and providing our clients with pro-active, constructive advice in a timely manner; allowing clients to make informed decisions regarding their investment. This is a challenge that Linesight embraces on all our Life Sciences and other complex projects.
Looking forwardClients are looking for their partners to bring more value to their projects – new implementation models are challenging contractors and designers to produce more innovation and to drive projects to success from much earlier in the project lifecycle. This allows consultants to provide value in advance of the construction phase, when the cost of change is incrementally lower and much more impactful. All too often project controls arrive on a project when procurement is under way and design is charging ahead – there is less value in minimising the cost of changes from this stage. The focus must now be pivoted towards early engagement, in order to allow a Project Controls team provide the true value of having them on board.
‘Big Pharma’ is moving away from a fully outsourced model and traditional project execution strategies towards lean construction and Integrated Project Delivery (IPD) methods

Knowledge Center 2017
60 | Linesight
Working with you on the ground – wherever you are.
ProjectsOffices
With staff located across Europe, the Middle East, Asia Pacific and North America, our reach is truly global. We have delivered projects in over 40 countries and are always exploring new areas of opportunity. We offer first-class consultancy on major projects across 12 specialist sectors, and we have developed a broad portfolio of innovative projects in every region.
Commercial Development
Commercial Fit-Out
Data Centers
Life Sciences
Education
Food and Beverage
Healthcare
High-Tech Industrial
Hospitality
Residential
Retail
Transportation and Infrastructure
Knowledge Center 2017
60 | Linesight

Ireland Handbook 2017
Linesight | 61
Our offices
Ireland
DublinHoban House Haddington Road, Dublin 4T: +353 1 661 4711
CorkHanover House South Main Street, CorkT: +353 21 4906 101
LimerickLinesight House 6 Hartstonge Street LimerickT: +353 61 493 515
Europe
London33 Cavendish Square London W1G 0PWT: +44 203 875 1770
ManchesterPall Mall Court 61-67 King Street Manchester, M2 4PDT: +44 161 618 1811
Paris9/11 Allée de l’Arche Paris La Défense, 92671 ParisT: +33 1 70 92 37 91
Dusseldorf4th Floor Konigsallee 92A 40212 DusseldorfT: +49 211 5403 9615
The Hague 11th Floor Koingin Julianaplein 10 2595 AA, The Hague T: +317 08 918 467
Tel Aviv12 Abba Hillel Ramat-Gan, 5250606T: +972 3 754 1289
Middle East
BahrainBuilding No. 1468 P.O. Box 10963, Manama T: +973 17 746 892
Dubai 6th Floor1 Lake Plaza Tower, P.O. Box 11497, DubaiT: +971 4 432 3831
RiyadhOffice 503, Olaya Street, Riyadh 11517 T: +966 11 460 4006
Asia Pacific
Singapore150 Cecil Street#05-01Singapore 069543T: +65 6801 4540
Shanghai22nd Floor, Office Tower 3, Raffles City Shanghai 200051 T: +86 21 6043 3695
SydneyLevel 2210 George StreetSydney NSW 2000T: +61 2 8278 9500
North America
New York286 Madison AvenueSuite 602NY 10017T: +1 646 802 9900
San Francisco 388 Market StreetSan FranciscoCA 94111T: +1 415 234 1248
Ireland Handbook 2017
Linesight | 61

Knowledge Center 2017
62 | Linesight
Working with usOur people are the key to our success, and we continually seek out passionate, motivated individuals to join our team.
You will work on some of the world’s most innovative builds, choosing projects that speak to your ambition and drive.
With our ever-growing regional presence, our teams have the opportunity to apply their expertise in new and exciting locations all over the world.
Linesight’s dynamic work pace is balanced by a collaborative environment, where everyone is given the support they need to develop both professionally and personally.
“There is a sense that the employees are playing a part in the future of the company. Senior management also are open to opinions and ideas from staff and encourage input and participation in strategic planning for the firm.”
John O’Sullivan Senior Project Manager
Knowledge Center 2017
62 | Linesight

Ireland Handbook 2017
Linesight | 63
“I’m on the Linesight Scholarship Program studying for a BSc in Cost Management and Construction Economics at DIT Bolton Street. A five year part-time course, I work four days a week and spend the fifth day in college. It’s a great opportunity for me and the practical skills and experience I learn in work will give me an enormous advantage when I qualify.”
Michael Mellows Trainee Cost Manager
Ireland Handbook 2017
Linesight | 63

Knowledge Center 2017
64 | Linesight10 Molesworth Street, Dublin 2

Ireland Handbook 2017
Linesight | 65
Acknowledgements
A special thanks to all those involved in this
year’s publication.
Editorial Team
Derry Scully, Naomi Carroll, Orla Creedon and
Claire O’Broin.
Contributors
Willie Aherne, John Butler, Anthony Canipa,
Joe Cusick, Niall Harrington, Kim Hegarty,
Kevin Kinsella, Michael Riordan, Pat Unger,
Neil Vaughan and Terence Woulfe-Flanagan.

Knowledge Center 2017
66 | Linesight
linesight.com