irc-2015, cape town, south africa
TRANSCRIPT

IRC-2015, Cape Town, South Africa

What do /can the IEA studies mean for developing countries education systems and educational research?
Sarah Howie (PhD)
6th IEA International Research Conference Keynote Address: 26 June 2015

Dedications
Constantinos Papanastasiou Tjeerd Plomp

Acknowledgements
IEA colleagues CEA team
Karen, Nangamso and Thembi

Overview
• Emergence of IEA studies within a global context • Developing countries’ participation in IEA studies • Some key findings and significance for Africa • Impact and meaning for South Africa?

EMERGENCE OF IEA STUDIES WITHIN A GLOBAL CONTEXT

Global context: post WWII Rebuilding
Europe Marshall
Plan
Iron Curtain
Conflict in Asia


Establishment of IEA
• Founded in 1958 • An independent, international
cooperative of national research institutions and governmental research agencies.
• Mission: to conduct comparative research studies in education
• To date, conducted more than 30 international comparative research studies.

Establishment of IEA Original intention • World as laboratory
(Keeves, 2011)
• Learn from other countries • Exponential growth in
1990s – Increase in membership – Expansion of methods and
types of studies – Organisational capacity and
structure (Ambach, 2008)
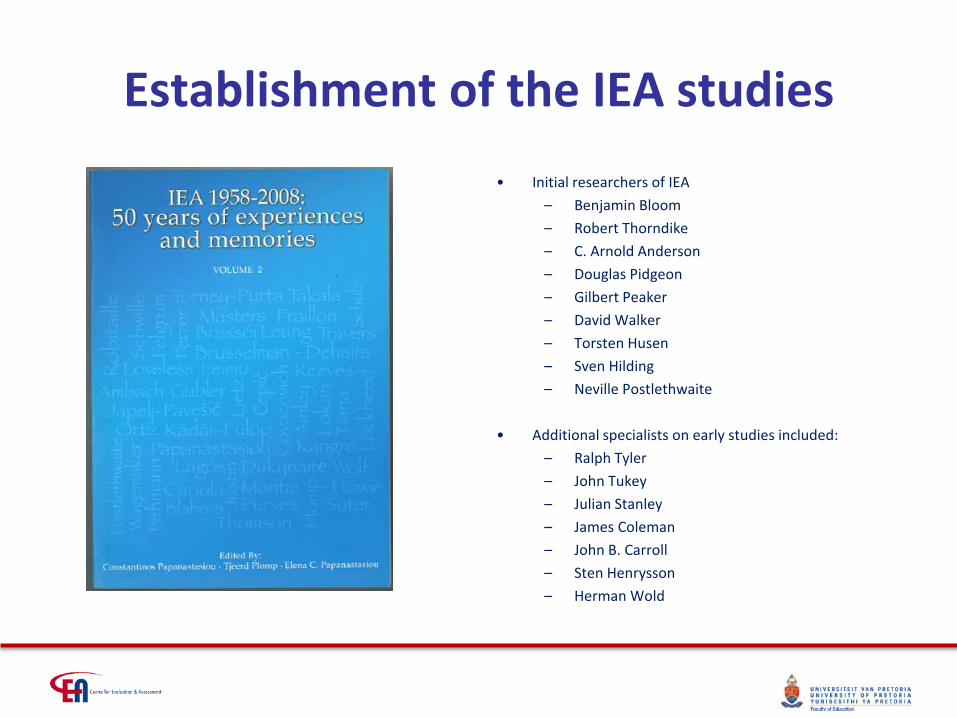
Establishment of the IEA studies • Initial researchers of IEA
– Benjamin Bloom – Robert Thorndike – C. Arnold Anderson – Douglas Pidgeon – Gilbert Peaker – David Walker – Torsten Husen – Sven Hilding – Neville Postlethwaite
• Additional specialists on early studies included:
– Ralph Tyler – John Tukey – Julian Stanley – James Coleman – John B. Carroll – Sten Henrysson – Herman Wold

Early Studies Year and Study Focus Countries
1960 Pilot study
Educational achievement of 13-year-olds in twelve countries – report by Foshay, Thorndike et al (1962), Unesco Institute for Education Hamburg
12 countries
1964 Cross National Study of Mathematics
Mathematics 13 year-olds (report in 1967)
12 countries
1970-71 Six-subject Study
Science, Reading, Literature, French, English, Civics (14-year olds)
19 Countries (science) 8 countries (French)
Volunteerism and commitment
The motivation of the participants can be illustrated with the following anecdote about Robert Thorndike: On one occasion Thorndike, who taught his classes on a Wednesday in New York, left the Eltham meeting on Tuesday evening, taught in New York on the Wednesday and flew back to London on Wednesday night – all paid for out of his own pocket.
(Plomp 2013, quoting Postlethwaite, 2009)
Raison D’etre of IEA studies
‘If custom and law define what is educationally allowable within a nation, the educational systems beyond one’s national boundaries suggest what is educationally possible. The field of comparative education exists to examine these possibilities’.
Foshay, Thorndike, Hotyat, Pidgeon & Walker, 1962

Purposes of International Comparative Studies
Purposes
Mirror
Bench-marking
Monitoring
Understan-ding
differences
Cross national research
Enlighten-ment
Integration
Develop-ment of research capacity
Howie and Plomp, 2006

Challenges for IEA studies
• Traditionally expertise lay in Western countries, especially in early studies.
• Further capacity had to be developed regionally amongst poorer nations within developing contexts to increase participation.
• More equal balance of the power relations was needed between individual countries participating between developed and developing countries.
• The emergence of the OECD studies was in response to the perceived needs of industrialised countries for information about educational indicators representing the economic perspective.
• Increased number of studies seemingly addressing similar areas within relatively short time periods.
• Maintaining the balance between the researchers’ voice and that of the ministeries/policymakers.

Contribution of IEA studies to research, education and systems internationally
• Competence • Cooperation • Computers • Other • Considerable influence on education policy and
practice – Relationships out of school variables-achievement – Gender differences
Richard Wolf, in Papanastastiou, Plomp, Panastasiou 2011, p.276-280

Contribution of IEA studies to research, education and systems internationally
Reflections on IEA contributions • African countries, • Australia, • Chile, • 18 developing countries (Elley) • East Asia • Germany • Hungary • Iran • Latvia, Lithuania, Slovak republic,
Slovenia • USA

Contribution of IEA studies to research, education and systems internationally
Reflections on contributions • 18 developing countries (Elley, 2005)
– Most new countries, number of Eastern Bloc – Research capacity development, curricula, national assessments, and
in-service training
• Hungary (Brassoi & Kadar-Fulop, 2011)
– Curriculum and textbook reforms 1980s and 1990s, but little direct impact until 2000s,
– Objective testing and establishment of national assessments major impact of IEA
• Iran (Ali Reza Kiamanesh, 2005)
– TIMSS 1999 was first reliable and valid data at the national or regional level to monitor education quality in Iran.
– Kiamanesh’s secondary analysis study filled gap in the research in this area in Iran
• Latvia, Lithuania, Slovakia, Slovenia (Pelgrum et al, 2011) – 1990s, divorce from Soviet Union, Czech Republic and Yugoslavia – Impact on educational policies and curriculum reform (use of
external evaluation), educational research.

DEVELOPING COUNTRIES’ PARTICIPATION IN IEA STUDIES

UNESCO and Education for All
Access
Equity
Education for All
Quality
The UNESCO conference in Jomtien defined the Education for All concept and its goals based on 3 tenets

Dakar framework for Action 2000
1. Expansion of early childhood
care and education
2. Achievement of universal primary
education
3. Development of learning
opportunities for youth and adults
4. Spread of literacy
5. Gender parity and gender equality in education
6. Improvements in education
quality
❍ 164 governments adopted a Framework for Action
❍ 6 Education for All goals

Goal 6: How much are children learning?
Improving all aspects of the quality of education and ensuring excellence of all so that recognised and measurable learning outcomes are achieved by all, especially in literacy, numeracy and essential life skills Global Monitoring Report, 2008

Current global context for education
• Population growth and urbanisation • Health – HIV/AIDS, Tuberculosis and
malaria • Economic growth and rising inequality • Conflict and fragile states • Rise of the knowledge economy and lessening need for manual labour.

CONDITIONS IN DEVELOPING COUNTRIES


Very poor schools

Poorly resourced schools

Well resourced schools

Enhancing ways of measuring across contexts
Key questions • How do we ensure that our measures
are valid and reliable given the diversity of environments, cultures, economies and policies?
• How do we deal with diversity? • How do we ask children, teachers,
principals and parents questions that they can equally understand irrespective of their situation and backgrounds?
Howie, 2010
Cross National Validity High Medium Low
Cross-national
Written source
Principal behaviour “serious” Teacher
education.
Regional Parental education
Teacher education
Principal behaviour “serious”
National SES Type of community
Principal behaviour “serious”
Howie & Plomp, 2001

Developing countries and international indicators of education
Primary completion rate Developing countries
World Bank Development Indicators, 2015

SOME KEY FINDINGS AND IMPLICATIONS FOR AFRICA
Footprints across Africa

Africa: Cradle of Humankind
African Nobel laureates South African Noble Laureates
0
1
2
3
4
5
Chemistry Literature Medicine Peace Physics
http://www.cp-africa.com/2012/05/27/list-of-african-nobel-prize-winners/
Courtesy of Tony Daniels
http://www.sahistory.org.za/article/africa-timeline

Growth of IEA studies in Africa
Pre 1990s Post 1990s

Participation in Trends in Mathematics and Science Study 1995- 2003
Pp18-19

Trends in Mathematics and Science Study (TIMSS) 2011
• 2 North Africa • 1 West Africa • 2 Southern Africa

African countries achievement in maths in TIMSS 2003 and 2011
Overall results, developing economies and top achieving country for maths 2011
Overall results African countries and top achieving country for maths 2003
264 276
366 387 406 410
605
0
100
200
300
400
500
600
700
SouthAfrica
Ghana Botswana Morocco Egypt Tunisia Singapore
613
505 479
425
0
100
200
300
400
500
600
700
Kore
a Gr
8Hu
ngar
yKa
zakh
stan
Ukr
aine
Arm
enia
Rom
ania
Turk
eyLe
bano
nM
alay
siaGe
orgi
aTh
aila
ndM
aced
onia
Tuni
sia Iran
Jord
anPa
lest
inia
n N
AIn
done
siaSy
rian
Arab
Rep
Mor
occo
Gr8
Om
anGh
ana
Bots
wan
a Gr
9So
uth
Afric
a G
r9Ho
ndur
as G
r 9
Lowest upper-middle income
Top upper-middle income
Highest African country

Why no African countries – ICCS 2009?

Why only 1 African country in SITES M1-M3?

Progress in International reading literacy Study (PIRLS) 2011
Background on PIRLS • Reading comprehension. • The grade that represents four years
of schooling, the mean age at the time of testing was at least 9.5 years (typically Grade 4).
• Measurement of changes since 2001 – 1991, 2001, 2006, 2011, 2016.
• PIRLS and TIMSS both conducted in 2011, opportunity to assess the same fourth grade students in reading, mathematics, and science.
African map of participants

PIRLS 2011: Achievement in reading selected countries
Top achieving and developing economies performance in PIRLS 2011
571 539
488
419
0
100
200
300
400
500
600
Mea
n sc
ale
scor
e
Highest LM income
African Countries performance in PIRLS 2011
419 421 424
310
0
50
100
150
200
250
300
350
400
450
Botswana Gr6 South Africa Gr5 EA Morocco Gr6 Morocco Gr4
mean score
Grade 6 and Benchmark
Highest UM income

Comparative performance on High Benchmarks TIMSS & PIRLS 2011
Singapore Grade 4
Botswana Grade 6
Morocco Grade 6

Comparative performance on Low Benchmarks TIMSS & PIRLS 2011
Singapore Grade 4
Botswana Grade 6
Morocco Grade 6

IMPACT AND MEANING FOR SOUTH AFRICA?

Some facts about education in South Africa
2000 2013/ 2014
Net enrolment rate primary
89 99.4
Electricity 54.9 86
Water 71.2 97
Sanitation 90.8 98
• 12 655 436 learners • 25 741 schools • 2013 National Budget
for Education R1.06 trillion (20%)
• 6.3% GDP • Schooling: R232.5
Billion
DBE, 2014
77% have very basic facilities and meet basic safety norms.

South Africa’s participation in IEA studies
Progress in International
Reading Literacy Study
(PIRLS)
Second International Technology in
Education Study (SITES)
Trends in Mathematics and
Science Study
(TIMSS)
2006 M1 (1999) 1995
2011 M2 1999
2016 2006 2003
2011
2015

Second International Technology in Education Study (SITES 2006) Key findings
• SITES 2006 – 9,000 schools – over 35,000 mathematics
and science teachers – 22 countries/education
systems in 2006.
• South Africa and 14 other countries participated in earlier studies (M1 and M2)
• Only 38% of South African schools had access to computers compared to most schools in other countries.
• Other countries had invested heavily in the technology, but not made changes to teaching methods and infrastructure.
• Most systems did not require their teachers to be trained in how to use ICT in their teaching.

Status of ICT in Education in 2006
Access to computers 1998-2006 Availability of Technology in 2006
0102030405060708090
100
schools usingICT for
instructionalpurposes
1998
schools withcomputersfor grade 8students in
2006
internet1998
Internet2006
0
10
20
30
40
50
60
70
80
90
100
Equi
pmen
t
Tuto
rial e
quip
men
t
Gen
eral
sof
twar
e
Mul
timed
ia p
rodu
ctio
n
Dat
a lo
ggin
g
Sim
ulat
ion
Com
mun
icat
ion
soft
war
e
Dig
ital r
esou
rces
Mob
ile d
evic
es
smar
tboa
rd
LMS
Mai
l tea
cher
acc
ount
s
Mai
l stu
dent
acc
ount
s

Pedagogical use of ICT in learning
Students’ characteristics
Community characteristics
Policy alignment
Intellectual resources
Distributed policies
Outcome-oriented policies,
programmes and evaluations
Vision and leadership
Infrastructure
Technical support
ICT infrastructure
Content development
Pedagogical and curricular change
Education Software and content
ICT infrastructure
Teacher training
Knowledge,
Attitudes and skills
Distributed policies
Vision in
schools
Policy implementation
Private-public partnership
Cooperation and support
Factors related to pedagogical use of ICT in learning (Adapted from Kennisnet, 2008 and Kozma, 2008) in Howie, 2010.
Reconceptualising ICT in Education policy and practice

TIMSS 2011 – key findings Maths
South African TIMSS Grade 9 mean scores 2011 and selected countries
352 397 398
609
440
0
100
200
300
400
500
600
700
SouthAfrica Gr9
BotswanaGr9
HondurasGr9
ChineseTaipei Gr8
MalaysiaGr8
Benchmarks for South African TIMSS Grade 9 mean scores 2011 and selected countries
49
76
50
79
4
35
0% 20% 40% 60% 80% 100%
South Africa Gr9
Botswana
Honduras
Chinese Taipei
Malaysia
advanced high intermediate low Did not reach
90% of Gr 8 in 2003

Progress In International Reading Literacy Study (PIRLS)
• 2006 – Grade 4 (11 languages) – Grade 5 (11 languages)
• 2011 – Grade 4 (pre-PIRLS 11
languages) – Grade 5 (English and
Afrikaans) • 2016
– Grade 4 PIRLS Literacy (11 languages)
– Grade 5 (English, Afrikaans, isiZulu)

South African PIRLS 2011 performance
South African Grade 5 (Eng/Afr) PIRLS compared to selected countries Grade 4 learners
South African Grade 4 learners reaching prePIRLS benchmarks
571
448 421 419
310
0
100
200
300
400
500
600
mean score
29
12
10
31
38
29
57
36
34
24
53
47
6
15
19
0.2
0.8
0.1
0.1
0.25
0% 20% 40% 60% 80% 100%
South Africa
Afrikaans
English
isiNdebele
isiXhosa
isiZulu
Sepedi
Sesotho
Setswana
siSwati
Tshivenda
Xitsonga
Advanced Did not reach low benchmark

Scandalisation; Glorification, Indifference (Steiner-Khamsi, 2014); Justification

Impact and meaning for South Africa?
National assessment report Attempt to learn from PIRLS 2011

Reflections on PIRLS & TIMSS studies in South Africa
PIRLS • Political imperative to test all 11
languages. • The very poor results in PIRLS 2006
were lower than have been predicted. • National outcry and in Parliament
questions were raised about this poor performance.
• prePIRLS 2011 serves as an important new baseline for Grade 4 for PIRLS 2016.
• PIRLS 2016: – PIRLS Literacy Grade 4, 11 languages; – PIRLS Grade 5 English, Afrikaans and
isiZulu
TIMSS • Initially introduction of the international
and regional studies was (and still is) controversial in South Africa.
• TIMSS 1995 results produced outrage re very low performance of the South African learners.
• The business community and public were shocked (Howie, 2001).
• TIMSS 1995 and subsequent international and regional studies revealed the damage of past political policies, and difficulties of implementing effective change in teaching and learning .
• TIMSS 2003 and 2011 have been used in government policy documents and funding motivations.
Achievement results dominated discourse for both studies

IEA foot print
• Mirror – TIMSS 1995 – PIRLS 2006
• Monitoring – TIMSS 1999 and 2003 – PIRLS 2011
• Enlightenment – TIMSS 1995 and PIRLS
2006 • Capacity development
– 20 years
Source: National Assembly, Internal Question Paper 9/5/2008 in Howie, 2011:

Significant findings from IEA studies in South Africa
• Evidence of systemic failure in education despite almost universal access • Non-achievement of benchmarks and learners 2 to 4 years behind • Classroom conditions slow to improve but improvement e.g: Class size • Curriculum revision over past 20 years • Enlightenment of broader interest groups • Predictors of achievement, e.g.: Language effects and Poverty evident • Reading in African languages a problem – but few teachers graduating with
African home language (13%, but 83% of learners are African) • IEA studies have had an effect:
– E.g. TIMSS and Instructional days – gazette – PIRLS 2006 and List of initiatives in reading – PIRLS findings and outcomes are contributing to Language of learning discussions – Revealed national status of ICT in education in South Africa – Curriculum development and teacher training.

Difference in priorities in developing contexts
Ensure safe and secure environment for school
staff and learners

Reflections upon IEA involvement on the African continent and in developing contexts
• What are the challenges? • Possible contributions?

Reflections upon IEA involvement on the African continent and in developing contexts
How can IEA make its studies more attractive/relevant for
developing countries without compromising the relevance for the developed countries?
Phases of development and use of indicators
Conceptualisation of indicator (theory). relevant expertise,
temporality, linking to data
Production of indicator – presentation,
packaging & dissemination
Indicator as source of knowledge –
develop/test scientific hypotheses
Assessment – relational/causal effects
of indicators
Evaluation of effectiveness of
indicators. Adapted from Merry, Davis and Kingsbury, 2015
IRCs

Meaning for South Africa
“Education is the most powerful weapon which you can use to change the world.”
“As long as many of our people still live in utter poverty,
as long as children still live under plastic covers, as long as many of our people are still without jobs, no South African should rest and wallow in the joy of freedom.”
Nelson Mandela

Meaning for South Africa
• If we fail to provide relevant and effective education to our poorest and young citizens of our country we doom them to an almost unbreakable cycle of poverty where only the very brightest will escape.
• International comparative education studies use the world as an educational laboratory to broaden national perspectives; to raise expectations about what might actually be possible and to assist us in deciding what is relevant and effective education.

Final word
“…hopes that the educative function of IEA will continue to guide the process of basing
educational policies on a foundation of evidence and not on whims or simple beliefs that have no
evidential base”.
Richard Wolf, 2011, p.285

Key References Some key references used: • IEA (2015) - website: http://www.iea.nl/ • Foshay, A.W., Thorndike, R.L., Hotyat, F., Pigeon, D.A. & Walker, D.A. (1962). Educational
Achievements of Thirteen-Year-Olds in Twelve Countries. Hamburg: Unesco Institute for Education. • Howie, S.J. (2010). ICT-supported pedagogical policies and practices in South Africa and Chile:
emerging economies and realities. Journal for Computer Assisted Learning . 26, 507–522 • Howie, S., & Plomp, T. (2005). International comparative studies of education and large scale
change. In N. Bascia, A. Cummings, A. Datnow, K. Leithwood, & D. Livingstone (Eds.), International Handbook of Educational Policy. Dordrecht, Netherlands: Kluwer Press.
• Keeves, J.P. (2011). From the Beginning in 1958 to 1990. In C. Papanastasiou, T. Plomp & E. Papanastasiou, E. IEA 195802088: 50 Years of Experiences and memories. Nicosia (Cyprus): Cultural Centre of the Kykkos Monastry, pp.1- 20.
• Keeves, J.P. (2013). Personal Contact with IEA through Teachers College, Columbia University. Personal communication.
• Postlethwaite, T. Neville (2009). Memories of IEA achievement surveys. In The process of research in education : a festschrift in honour of John P Keeves AM
• Plomp, T. (2013). Founding and development of the IEA & Reflection on contributions of Teachers College Faculty. 2013. New York, USA

Thank you for your attention