iran economic monitor - world...
TRANSCRIPT

Iran Economic Monitor OIL-DRIVEN RECOVERY
Spring 2017
Global Practice for Macroeconomics & Fiscal Management
Middle East and North Africa Region
Special Focus on:
Iran’s Pension System: The Need for Reform; and
Towards Water Security in Iran: Challenges and Opportunities
Pub
lic D
iscl
osur
e A
utho
rized
Pub
lic D
iscl
osur
e A
utho
rized
Pub
lic D
iscl
osur
e A
utho
rized
Pub
lic D
iscl
osur
e A
utho
rized


Iran Economic MonitorOIL-DRIVEN RECOVERY
Spring 2017

Cover photo: Lake Urmia, courtesy of Mojtaba Esmaeilzad

iii
TABLE OF CONTENTS
Preface . . . . . . . . . . . . . . . . . . . . . . . . . . . . . . . . . . . . . . . . . . . . . . . . . . . . . . . . . . . . vOverview . . . . . . . . . . . . . . . . . . . . . . . . . . . . . . . . . . . . . . . . . . . . . . . . . . . . . . . . . . .vii
Chapter 1 Recent Economic and Policy Developments . . . . . . . . . . . . . . . . . . . . . . . . . . . . . 1Output and Demand . . . . . . . . . . . . . . . . . . . . . . . . . . . . . . . . . . . . . . . . . . . . . . . . . . . . . . . . . . . . . . . . . . . . . . . . . . . .1
Jobs and Labor Market . . . . . . . . . . . . . . . . . . . . . . . . . . . . . . . . . . . . . . . . . . . . . . . . . . . . . . . . . . . . . . . . . . . . . . . . . .4
Public Finances . . . . . . . . . . . . . . . . . . . . . . . . . . . . . . . . . . . . . . . . . . . . . . . . . . . . . . . . . . . . . . . . . . . . . . . . . . . . . . . .6
Monetary Policy and the Financial Sector . . . . . . . . . . . . . . . . . . . . . . . . . . . . . . . . . . . . . . . . . . . . . . . . . . . . . . . . . .8
External Position . . . . . . . . . . . . . . . . . . . . . . . . . . . . . . . . . . . . . . . . . . . . . . . . . . . . . . . . . . . . . . . . . . . . . . . . . . . . . .11
Chapter 2 Outlook and Risks . . . . . . . . . . . . . . . . . . . . . . . . . . . . . . . . . . . . . . . . . . . . . .13
Special Focus 1 Iran’s Pension System: The Need for Reform . . . . . . . . . . . . . . . . . . . . . . 19Introduction . . . . . . . . . . . . . . . . . . . . . . . . . . . . . . . . . . . . . . . . . . . . . . . . . . . . . . . . . . . . . . . . . . . . . . . . . . . . . . . . . .19
Pension System in Iran – Overview . . . . . . . . . . . . . . . . . . . . . . . . . . . . . . . . . . . . . . . . . . . . . . . . . . . . . . . . . . . . . . .20
Main Challenges . . . . . . . . . . . . . . . . . . . . . . . . . . . . . . . . . . . . . . . . . . . . . . . . . . . . . . . . . . . . . . . . . . . . . . . . . . . . . .22
Policy Considerations . . . . . . . . . . . . . . . . . . . . . . . . . . . . . . . . . . . . . . . . . . . . . . . . . . . . . . . . . . . . . . . . . . . . . . . . . .26
Annex 1 . Pensions Glossary . . . . . . . . . . . . . . . . . . . . . . . . . . . . . . . . . . . . . . . . . . . . . . . . . . . . . . . . . . . . . . . . . . . .32
Special Focus 2 Towards Water Security in Iran: Challenges and Opportunities . . . . . . . . . . 35Iran’s Long Tradition in Water Resource Management . . . . . . . . . . . . . . . . . . . . . . . . . . . . . . . . . . . . . . . . . . . . . .35
Symptoms of Extreme Water Scarcity . . . . . . . . . . . . . . . . . . . . . . . . . . . . . . . . . . . . . . . . . . . . . . . . . . . . . . . . . . . . .36
Drivers of a Potential Water Crisis . . . . . . . . . . . . . . . . . . . . . . . . . . . . . . . . . . . . . . . . . . . . . . . . . . . . . . . . . . . . . . . .38
Looking Forward . . . . . . . . . . . . . . . . . . . . . . . . . . . . . . . . . . . . . . . . . . . . . . . . . . . . . . . . . . . . . . . . . . . . . . . . . . . . . .40
List of FiguresFigure 1: Real GDP Level and Growth Rate . . . . . . . . . . . . . . . . . . . . . . . . . . . . . . . . . . . . . . . . . . . . . . . . .1
Figure 2: Oil Production, Exports and Prices . . . . . . . . . . . . . . . . . . . . . . . . . . . . . . . . . . . . . . . . . . . . . . . . .2
Figure 3: Contribution of Expenditure Components to Growth (%) . . . . . . . . . . . . . . . . . . . . . . . . . . . . . .2
Figure 4: Potential GDP and the Output Gap . . . . . . . . . . . . . . . . . . . . . . . . . . . . . . . . . . . . . . . . . . . . . . . .3
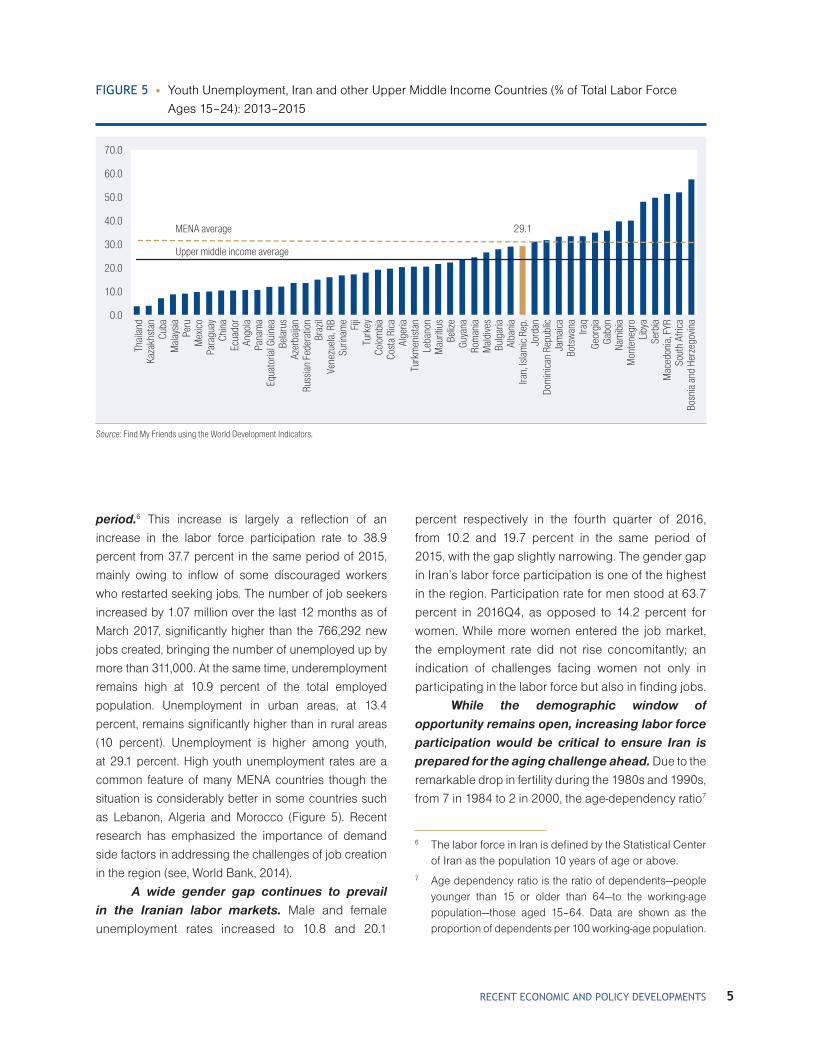
Figure 5: Youth Unemployment, Iran and other Upper Middle Income Countries
(% of Total Labor Force Ages 15–24): 2013–2015 . . . . . . . . . . . . . . . . . . . . . . . . . . . . . . . . . . . .5

iv IRAN ECONOMIC MONITOR: OIL-DRIVEN RECOVERY
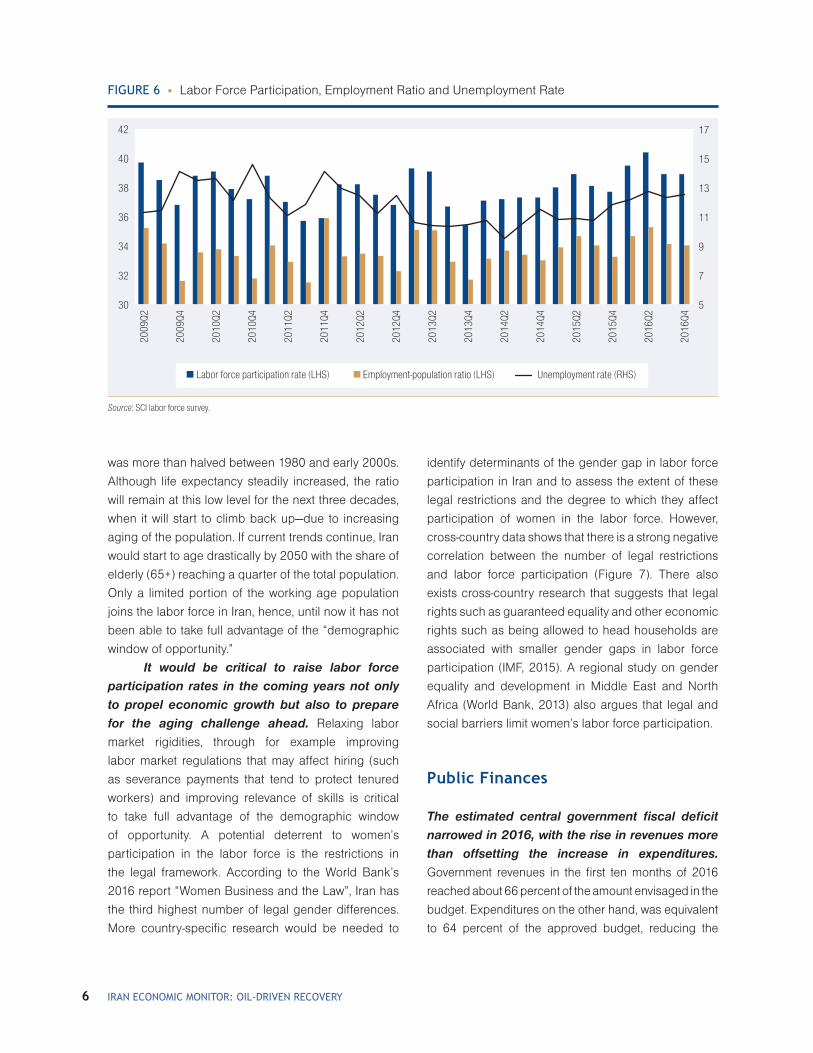
Figure 6: Labor Force Participation, Employment Ratio and Unemployment Rate . . . . . . . . . . . . . . . . .6
Figure 7: Gender-Based Legal Restrictions and Female Labor Force Participation (%) . . . . . . . . . . . .7
Figure 8: Central Government Budget Components (% of GDP) . . . . . . . . . . . . . . . . . . . . . . . . . . . . . . . .7
Figure 9: Oil Dependence . . . . . . . . . . . . . . . . . . . . . . . . . . . . . . . . . . . . . . . . . . . . . . . . . . . . . . . . . . . . . . . .8
Figure 10: CPI, Goods and Services Inflation . . . . . . . . . . . . . . . . . . . . . . . . . . . . . . . . . . . . . . . . . . . . . . . . .9
Figure 11: Official and Market Exchange Rates ($) . . . . . . . . . . . . . . . . . . . . . . . . . . . . . . . . . . . . . . . . . . .10
Figure 12: The Current Account Surplus Rebounded in 2016 . . . . . . . . . . . . . . . . . . . . . . . . . . . . . . . . . .10
Figure 13: The Lifting of Sanctions Has Quickly Affected Iran’s Exports Destinations . . . . . . . . . . . . . .11
Figure 1 .1: Growth Rate of GDP Per Person Employed (constant 2011 PPP Dollars), 2005–15 . . . . . .14
Figure 1 .2: Female Labor Force Participation (% of Female Population Aged 15–64), 2005–15 . . . . .14
Figure 1 .3: Simulations of Real GDP Per Capita Under Benchmark and Take-Off Scenarios . . . . . . . .15
Figure 14: Pension Spending vs Population Over 65 (as % of Total Population) . . . . . . . . . . . . . . . . . . .23
Figure 15: Accrual Rate: International Comparisons . . . . . . . . . . . . . . . . . . . . . . . . . . . . . . . . . . . . . . . . . .23
Figure 16: Labor Force Participation Rate (% Pop 15+), 2014 . . . . . . . . . . . . . . . . . . . . . . . . . . . . . . . . . .24
Figure 17: Pensions Coverage vs Income Per Capita . . . . . . . . . . . . . . . . . . . . . . . . . . . . . . . . . . . . . . . . .25
Figure 18: Projected Population Aged 65+/15–64 . . . . . . . . . . . . . . . . . . . . . . . . . . . . . . . . . . . . . . . . . . .25
Figure 19: Share of GDP Produced and Population Living in Areas Where Water
Withdrawals are Approaching or Have Surpassed Sustainable Resource Use . . . . . . . . . .36
Figure 20: GDP Produced in Areas Where Water Withdrawals are 40% or
More of Surface Water Resources Availability, by Country and Economy,
Middle East and North Africa, 2010 . . . . . . . . . . . . . . . . . . . . . . . . . . . . . . . . . . . . . . . . . . . . . . .37
Figure 21: Reduction in the Area of Lake Urmia (88% in the Last Three Decades)
Over the Past Three Decades as a Result of Intensive Upstream Abstraction . . . . . . . . . . .37
Figure 22: Total Water Productivity, Selected Middle Eastern and North African Countries
and Economies, 2010 . . . . . . . . . . . . . . . . . . . . . . . . . . . . . . . . . . . . . . . . . . . . . . . . . . . . . . . . . .39
Figure 23: Combined Water and Wastewater Bill Per Cubic Meter, Selected Cities in the World . . . . .40
List of TablesTable 1: Islamic Republic of Iran: Selected Macroeconomic Indicators (2013–16) . . . . . . . . . . . . . . . .4
Table 1 .1: Assumptions for Long Term Growth Simulations, Values for 2030 . . . . . . . . . . . . . . . . . . . . .15
Table 2: Pension Schemes in Iran: Active Members, and Retirees, 2014 . . . . . . . . . . . . . . . . . . . . . . .21
Table 3: Pension Schemes SSO and CSRF Design Features in Iran . . . . . . . . . . . . . . . . . . . . . . . . . . .21
Table 4: Current Policy Parameters and, Desirable Policy Parameters Based on
first Principles and Best Practice, Slow and Fast Reforms . . . . . . . . . . . . . . . . . . . . . . .28
List of BoxesBox 1: Iran’s Long-Term Growth Prospects . . . . . . . . . . . . . . . . . . . . . . . . . . . . . . . . . . . . . . . . . . . . . . .14
v
PREFACE
The Iran Economic Monitor provides an update on key
economic developments and policies over the past six
months . It examines these economic developments
and policies in a longer-term and global context, and
assesses their implications for the outlook for the
country . Its coverage has ranged from the macro-
economy to financial markets to indicators of human
welfare and development . It is intended for a wide
audience, including policy makers, business leaders,
financial market participants, and the community of
analysts and professionals engaged in Iran .
The Iran Economic Monitor is a product of the
World Bank’s Global Practice for Macroeconomics &
Fiscal Management team . This third issue was prepared
by Kamer Karakurum-Ozdemir (Senior Economist, Task
Team Leader), Majid Kazemi (Economist) and Fayavar
Hayati (Economist), under the general guidance of Eric
Le Borgne (Acting Global Practice Manager) and Saroj
Kumar Jha (Country Director) . The Special Focus on
pensions was prepared by Montserrat Pallares-Miralles
(Senior Social Protection Specialist) with inputs from
Robert Palacios (Pension Team Leader) and under
the guidance of Hana Brixi (Practice Manager), and
the one on water was prepared by Claudia Sadoff
(Lead Economist), Edoardo Borgomeo (Consultant)
and Irene Rehberger Bescos (Analyst) under the
guidance of Steven Schonberger (Practice Manager) .
Janet Minatelli (Senior Country Officer) provided
helpful comments . Muna Abeid Salim (Senior Program
Assistant) print-produced the report . The team is
grateful to the Government of Iran for its contributions
to this publication .
The findings, interpretations, and conclusions
expressed in this Monitor are those of World Bank
staff and do not necessarily reflect the views of the
Executive Board of the World Bank or the governments
they represent .
To be included on the email distribution list
of the Iran Economic Monitor series and related
publications, please contact Nada Abou Rizk
(nabourizk@worldbank .org) . For questions and
comments on the content of this publication, please
contact Kamer Karakurum-Ozdemir (kozdemir@
worldbank .org) or Majid Kazemi (mkazemi@
worldbank .org) . Questions from the media can be
addressed to Mona Ziade (mziade@worldbank .org) .
This publication can be also found on the following
website http://www .worldbank .org/en/country/iran .


vii
OVERVIEW
I ran’s economy recorded an impressive recovery in 2016 in line with the favorable expectations after the removal of the nuclear
related sanctions. Following a contraction of close
to 2 percent in 2015, GDP grew by an estimated 6 .4
percent in 2016, the fastest since 2010 .1 While there
are some recent signs of a spillover into the non-oil
sectors of the economy, this growth performance was
driven primarily by the bounce back in oil production
and particularly in oil exports, despite lower oil prices .
Iran’s ability to increase production despite the cuts
agreed to by the rest of the OPEC members helped
production near its pre-sanctions levels . The surge
in exports led to a sharp improvement in the current
account surplus, to 6 .5 percent of GDP in 2016, as
growth in imports remained stagnant . As oil revenues
gained pace, the budget performance also improved,
and the deficit shrank to 1 .5 percent of GDP in
2016 from 1 .9 percent a year ago . Notwithstanding
the achievement of single digit inflation in 2016,
inflationary pressures have resurfaced towards the
end of the year, as liquidity rose, the Iranian Rial
continued to depreciate and economic activity
picked up . Against this background, the Central Bank
postponed the unification of the official and market
exchange rates to the end of 2017 .
In the medium-term, growth rates are expected to retreat to slightly above 4 percent, in the absence of structural reforms and a major change in the pace of reintegration in trade
and investment. As Iranian banks face barriers in
establishing correspondent banking relationship with
large international banks, foreign direct investment
inflows to Iran and trade relationships with the rest of
the world are restrained . Still, recent developments
suggest non-oil sector and investments are likely
to play a bigger role in the next few years, bringing
growth to an average of 4 .1 percent in 2017–19 . This
positive growth outlook hinges on the assumption
that some of the agreements between Iran and major
foreign companies in the oil and gas and other key
sectors, including manufacturing, will materialize .
This would create renewed confidence, validating the
very positive expectations generated in the immediate
aftermath of JCPOA implementation in January 2016
and leading to gradually improving medium to long
term growth dynamics as potential output starts to
rise as well .
There are significant downside risks to this moderate outlook. The major risk in the near
future is the political uncertainty around the full
implementation of JCPOA . This is likely to continue
influencing consumer/investor confidence and may
lead to a further weakening in private consumption
1 The years in this note refer to Iranian calendar year, which runs from March 21 to March 20 of the following Gregorian year . For example, 2016Q1 in this text refers to the first quarter of the Iranian calendar year 1395 (April-June) .
viii IRAN ECONOMIC MONITOR: OIL-DRIVEN RECOVERY
and investment . Under this scenario, GDP growth
would remain below 3 percent . Furthermore, lower
than projected oil prices could put pressure on
government revenues and undermine growth .
Going forward, implementing the domestic reform agenda is likely to bring the highest growth dividend in the medium to long term, even if the external conditions remain the same . The challenge faced by the recently re-
elected President Rouhani and his government
will be to prioritize the reforms outlined in the 6th
five-year development plan and steadily implement
them . This would involve tackling the structural
reform agenda that will boost non-oil sector growth,
through creating a level-playing field for existing and
new firms, improving the business environment and
the efficiency of labor markets . In the long-term,
the primary determinant of Iran’s growth prospects
is likely to be how effective it utilizes its resources
beyond oil and gas . Growth simulations for Iran’s
long-term growth prospects conducted for this report
suggest there is great potential to be exploited in
moving towards the technology frontier and better
utilizing Iran’s abundant educated labor force .

1
RECENT ECONOMIC AND POLICY DEVELOPMENTS
Output and Demand
In line with the positive expectations in the aftermath of the implementation of the JCPOA, output growth in 2016 underwent a strong rebound. The real GDP level in 2016 is expected to
return to its historical peak of 2011 after remaining
below this value in the previous five years (Figure 1) .
Initial data for the first three quarters of 2016 suggest
that the growth rate has continually increased in
each quarter, on the back of the oil sector while
the expected benefits have so far not appeared as
strongly in the other sectors . Consequently, overall
growth in 2016 is estimated to have reached 6 .4
percent, following a 1 .8 percent contraction in 2015 .
The major pillar of non-oil growth initially envisioned
after the JCPOA implementation was a strong inflow of
foreign investment into the Iranian economy . However,
a surge in FDI did not materialize due initially to high
transaction costs for foreign businesses of fully
1
FIGURE 1 • Real GDP Level and Growth Rate
Real
GDP
(200
4 pr
ices
) – b
illio
n ria
l
Real
GDP
gro
wth
(%)
Real GDP (2004 prices) – billion rial Real GDP growth (%)
0
0
5
–10
–5
10
15
500,000
1,000,000
1,500,000
2,000,000
2,500,000
3,000,000
2000
2002
2004
2006
2008
2010
2012
2014
2016
2018
Source: Government data and World Bank staff calculations.

2 IRAN ECONOMIC MONITOR: OIL-DRIVEN RECOVERY
complying with the remaining US sanctions and later
complicated by increased uncertainty about possible
new sanctions on Iran .
Despite challenges, oil output and exports continued to recover, returning to pre-sanctions peak and spearheading overall growth. Oil output
has already increased to around 4 mbpd . This means
that compared to the output in the first quarter of 2016,
Iran has been able to increase production by 700
thousand bpd in only nine months . Oil exports equally
received a boost, reaching 2 .1 mbpd in the second
quarter of 2016, up from 1 .5 in the same quarter of the
previous year . The quick recovery of oil production was
achieved as a result of a combination of both political
and technical planning by the Ministry of Oil even before
the implementation of JCPOA . On the political front, the
Ministry managed to successfully negotiate with OPEC an
increase in Iran’s production quota, regaining its market
share by bringing its output to pre-sanctions levels and
secure its traditional position at the organization . This
coincides with the rest of the OPEC members agreeing
to an output cut to counteract the falling global oil
prices . On the technical front, Iran managed to recover
production levels in the existing fields to pre-sanctions
levels, following an abrupt drop in extraction due to
sanctions . As a result, the decomposition of estimated
annual growth in 2016 suggests that oil-driven exports
contribution to growth of 7 .7 percent dominates the –1 .7
and 1 percent contributions of investment and private
consumption (Figure 3) .
The output gap has recently been closing. The recent spur in economic growth is estimated to
have contributed to the narrowing down of the output
gap from –6 .6 percent in 2014 to –2 .3 percent in 2015
(Figure 4) . This is in line with the increase in credit
FIGURE 2 • Oil Production, Exports and Prices .
mbp
d
USD
per b
arre
l
Oil exports (LHS)Oil output (LHS) Oil price (RHS)
0 0
120
100
80
60
40
20
3.5
4.0
2.5
3.0
1.5
2.0
0.5
1.0
2010
Q1
2010
Q2
2010
Q3
2010
Q4
2011
Q1
2011
Q2
2011
Q3
2011
Q4
2012
Q1
2012
Q2
2012
Q3
2012
Q4
2013
Q1
2013
Q2
2013
Q3
2013
Q4
2014
Q1
2014
Q2
2014
Q3
2014
Q4
2015
Q1
2015
Q2
2015
Q3
2015
Q4
2016
Q1
2016
Q2
Source: CBI and World Bank.
FIGURE 3 • Contribution of Expenditure
Components to Growth (%)
15
10
5
0
–5
–10
–152000 2003 2006 2009 2012 2015 2018
Gov. cons. Exports GFCF InventoriesPrivate cons. Imports GDPStatistical disc.
Source: Iranian authorities.

3RECENT ECONOMIC AND POLICY DEVELOPMENTS
expansion and the increase in liquidity, which would
support the expected recovery in private consumption
and gross capital formation shown in Figure 3 .
Investment levels continue to remain weak—a drag on future growth. Gross capital
formation figures report an 8 .9 percent contraction in
the first three quarters of 2016 .2 This trend has been
the most important ongoing legacy of the nuclear
sanctions in which investment performance has
continued to remain bleak with a trough of 19 percent
contraction in 2012 . Out of the two subcomponents
of gross fixed capital formation, machinery investment
growth reached 5 .3 percent in the first three quarters—
driven by a 10 .1 percent increase in the third quarter .
However, investment in construction shrank by 14 .4
percent during this period . Although the contribution of
oil to growth is expected to diminish, as Iran reaches its
OPEC quota, the outlook for growth contribution of gas
is promising . Despite the importance of investment-led
growth, the disinvestment trend in the economy is even
present in the domestic component of investment . This
trend reflects the weaknesses in the general business
climate and outlook for the economy, in addition to
the external factors . Addressing the domestic reform
agenda would allow for a more resilient economy
while increasing the prospects of foreign investment .
More recently, the non-oil sector growth has started to show moderate signs of recovery. The Central Bank data for the first nine months of 2016
indicate that non-oil output has grown by 1 .9 percent
which is a considerable improvement compared to –3 .9
percent non-oil growth in the same period in 2015 . The
figures show that quarterly non-oil GDP has improved
consistently, reaching 4 .6 percent in the third quarter .
The engine of non-oil growth in this quarter seems to
be services and agriculture that grew by 5 .6 percent
and 5 percent respectively . At the same time, growth
in the output index for large manufacturing firms in the
first nine months of 2016 is reported to be 6 .8 percent
year over year which is a substantial improvement
in comparison to the 3 .5 percent contraction in the
similar period of the previous year . This improvement
was led by growth in chemicals and the automotive
sectors that experienced growth rates of 7 .7 and 35 .6
percent . These two sectors combined accounted for
around 43 percent of the weighted overall index that
could also benefit job creation in this period .
2 Data based on 2011 constant prices, since the 3rd quarter figures for 2016 were recently released by CBI after a change in the base year from 2004 to 2011 .
FIGURE 4 • Potential GDP and the Output GapRe
al G
DP (2
004
pric
es) –
billi
on ri
als
Output Gap, % (RHS) Potential GDP (LHS) Actual GDP (LHS)
800,000
1,000,000
1,200,000
1,400,000
1,600,000
1,800,000
2,000,000
2,200,000
2,400,000
–8
–6
–4
–2
0
2
4
6
8
10
14
12
1990
1991
1992
1993
1994
1995
1996
1997
1998
1999
2000
2001
2002
2003
2004
2005
2006
2007
2008
2009
2010
2011
2012
2013
2014
2015
2016
2017
2018
2019
Source: Government data and World Bank staff calculations.

4 IRAN ECONOMIC MONITOR: OIL-DRIVEN RECOVERY
A number of new agreements have been signed between Iran and international partners but renewed uncertainty regarding full implementation of the JCPOA has hindered project initiation. According to the Iranian Foreign
Minister, more than 84 political delegations and
numerous economic missions have visited Iran in
2016 while in the same period Iranian delegations
visited 57 countries .3 These comprised of a number
of high-level visits including one in January by the
French foreign minister along with a 60 member team
consisting of officials and businessmen, where a
number of agreements were signed and the Minister
reaffirmed France’s commitment to JCPOA’s full
implementation .4 Since January 2016, the total value
of the agreements signed between Iran and potential
investors is estimated to have reached between $8
to 12 billion .5 However, even the higher estimates
fall short of the authorities’ targets for the medium-
term . According to the recently approved 6th five-year
development plan, annual FDI inflow is projected to
increase to a high of $15 billion in addition to $20
billion joint ventures with domestic firms . Furthermore,
progress beyond initial agreements and MOUs has
stalled as foreign investors have been cautious or
often hesitant to start projects in an environment of
heightened uncertainty regarding sanctions on Iran .
Jobs and Labor Market
The unemployment rate has continued a rising trend and reached 12.5 percent in the last quarter of 2016 despite strong economic growth in this
3 Interview with journalists, reported by ILNA, available at: https://goo .gl/t0eL3N .
4 http://www .al-monitor .com/pulse/originals/2017/01/iran-french-foreign-minister-ayrault-trump-nuclear-deal .html .
5 h t tp : //donya -e -eq tesad .com/news/1093236 , https://financialtr ibune .com/ar ticles/domestic-economy/57154/iran-approves-118b-of-fdi -post-sanctions and https://www .ft .com/content/f342b558– 0a37–11e7-ac5a-903b21361b43 .
TABLE 1 • Islamic Republic of Iran: Selected Macroeconomic Indicators (2013–16)
2013 2014 2015E 2016F*
Real GDP growth, at factor cost (2004=100) –1.8 3.0 –1.8 6.4
Agriculture 4.8 3.8 3.9 4.6
Industry** –4.7 4.9 4.2 8.1
Services –0.6 1.7 –6.3 5.4
Real GDP growth, at market prices (2004=100) –1.9 4.3 –1.8 6.4
Private Consumption –9.3 3.1 0.8 2.0
Government Consumption 1.6 2.7 –8.3 1.7
Gross Fixed Capital Investment –6.9 3.5 –9.8 –7.3
Exports, Goods and Services 0.0 12.0 7.1 35.0
Imports, Goods and Services –18.7 –5.7 –5.2 6.4
Prices
Inflation (Consumer Price Index) 34.7 15.6 11.9 9.0
Current Account Balance (% of GDP) 6.3 3.8 2.7 6.5
Fiscal Balance (% of GDP) –0.9 –1.2 –1.9 –1.6
Sources: Government data and World Bank staff calculations.* Iranian calendar years, running from March 21st to March 20th of the following year.**Industry includes the oil and gas sector.
5RECENT ECONOMIC AND POLICY DEVELOPMENTS
period.6 This increase is largely a reflection of an
increase in the labor force participation rate to 38 .9
percent from 37 .7 percent in the same period of 2015,
mainly owing to inflow of some discouraged workers
who restarted seeking jobs . The number of job seekers
increased by 1 .07 million over the last 12 months as of
March 2017, significantly higher than the 766,292 new
jobs created, bringing the number of unemployed up by
more than 311,000 . At the same time, underemployment
remains high at 10 .9 percent of the total employed
population . Unemployment in urban areas, at 13 .4
percent, remains significantly higher than in rural areas
(10 percent) . Unemployment is higher among youth,
at 29 .1 percent . High youth unemployment rates are a
common feature of many MENA countries though the
situation is considerably better in some countries such
as Lebanon, Algeria and Morocco (Figure 5) . Recent
research has emphasized the importance of demand
side factors in addressing the challenges of job creation
in the region (see, World Bank, 2014) .
A wide gender gap continues to prevail in the Iranian labor markets. Male and female
unemployment rates increased to 10 .8 and 20 .1
percent respectively in the fourth quarter of 2016,
from 10 .2 and 19 .7 percent in the same period of
2015, with the gap slightly narrowing . The gender gap
in Iran’s labor force participation is one of the highest
in the region . Participation rate for men stood at 63 .7
percent in 2016Q4, as opposed to 14 .2 percent for
women . While more women entered the job market,
the employment rate did not rise concomitantly; an
indication of challenges facing women not only in
participating in the labor force but also in finding jobs .
While the demographic window of opportunity remains open, increasing labor force participation would be critical to ensure Iran is prepared for the aging challenge ahead. Due to the
remarkable drop in fertility during the 1980s and 1990s,
from 7 in 1984 to 2 in 2000, the age-dependency ratio7
FIGURE 5 • Youth Unemployment, Iran and other Upper Middle Income Countries (% of Total Labor Force
Ages 15–24): 2013–2015
29.1MENA average
Upper middle income average
0.0
20.0
10.0
30.0
40.0
50.0
60.0
70.0 Th
aila
nd
Kaza
khst
an
Cuba
M
alay
sia
Peru
M
exic
o Pa
ragu
ay
Chin
a Ec
uado
r An
gola
Pa
nam
a Eq
uato
rial G
uine
a Be
laru
s Az
erba
ijan
Russ
ian
Fede
ratio
n Br
azil
Vene
zuel
a, R
B Su
rinam
e
Turk
ey
Colo
mbi
a Fiji
Cost
a Ri
ca
Alge
ria
Turk
men
ista
n Le
bano
n M
aurit
ius
Beliz
e Gu
yana
Ro
man
ia
Mal
dive
s Bu
lgar
ia
Alba
nia
Iran,
Isla
mic
Rep
. Jo
rdan
Do
min
ican
Rep
ublic
Ja
mai
ca
Bots
wan
a Ira
q Ge
orgi
a Ga
bon
Nam
ibia
M
onte
negr
o Li
bya
Serb
ia
Mac
edon
ia, F
YR
Sout
h Af
rica
Bosn
ia a
nd H
erze
govin
a
Source: Find My Friends using the World Development Indicators.
6 The labor force in Iran is defined by the Statistical Center of Iran as the population 10 years of age or above .
7 Age dependency ratio is the ratio of dependents—people younger than 15 or older than 64—to the working-age population—those aged 15–64 . Data are shown as the proportion of dependents per 100 working-age population .
6 IRAN ECONOMIC MONITOR: OIL-DRIVEN RECOVERY
was more than halved between 1980 and early 2000s .
Although life expectancy steadily increased, the ratio
will remain at this low level for the next three decades,
when it will start to climb back up—due to increasing
aging of the population . If current trends continue, Iran
would start to age drastically by 2050 with the share of
elderly (65+) reaching a quarter of the total population .
Only a limited portion of the working age population
joins the labor force in Iran, hence, until now it has not
been able to take full advantage of the “demographic
window of opportunity .”
It would be critical to raise labor force participation rates in the coming years not only to propel economic growth but also to prepare for the aging challenge ahead. Relaxing labor
market rigidities, through for example improving
labor market regulations that may affect hiring (such
as severance payments that tend to protect tenured
workers) and improving relevance of skills is critical
to take full advantage of the demographic window
of opportunity . A potential deterrent to women’s
participation in the labor force is the restrictions in
the legal framework . According to the World Bank’s
2016 report “Women Business and the Law”, Iran has
the third highest number of legal gender differences .
More country-specific research would be needed to
identify determinants of the gender gap in labor force
participation in Iran and to assess the extent of these
legal restrictions and the degree to which they affect
participation of women in the labor force . However,
cross-country data shows that there is a strong negative
correlation between the number of legal restrictions
and labor force participation (Figure 7) . There also
exists cross-country research that suggests that legal
rights such as guaranteed equality and other economic
rights such as being allowed to head households are
associated with smaller gender gaps in labor force
participation (IMF, 2015) . A regional study on gender
equality and development in Middle East and North
Africa (World Bank, 2013) also argues that legal and
social barriers limit women’s labor force participation .
Public Finances
The estimated central government fiscal deficit narrowed in 2016, with the rise in revenues more than offsetting the increase in expenditures. Government revenues in the first ten months of 2016
reached about 66 percent of the amount envisaged in the
budget . Expenditures on the other hand, was equivalent
to 64 percent of the approved budget, reducing the
FIGURE 6 • Labor Force Participation, Employment Ratio and Unemployment Rate
Labor force participation rate (LHS) Employment-population ratio (LHS) Unemployment rate (RHS)
30 5
17
15
13
11
9
7
40
42
36
38
32
34
2009
Q2
2009
Q4
2010
Q2
2010
Q4
2011
Q2
2011
Q4
2012
Q2
2012
Q4
2013
Q2
2013
Q4
2014
Q2
2014
Q4
2015
Q2
2015
Q4
2016
Q2
2016
Q4
Source: SCI labor force survey.

7RECENT ECONOMIC AND POLICY DEVELOPMENTS
fiscal gap for the period to around a half of the budget
proposed value . In line with this budget performance,
the fiscal deficit for the full year is estimated at 1 .6
percent of GDP, down from a deficit of 1 .9 percent of
GDP in 2015 (Figure 8) . In 2016, it is estimated that total
government revenues increased to 16 .1 percent of GDP
in 2016, up from 15 .6 percent of GDP in 2015, in line
with the continued rise in other revenues which includes
contribution from oil income . Oil revenues slightly
increased by 0 .2 percentage points to 6 .0 percent
of GDP, mainly as a result of an increase in oil export
volumes despite the drop in oil prices to an average of
$43 per barrel in 2016, down from $51 in the previous
year . Direct taxes slightly reduced from 3 .7 percent of
GDP in 2015 to 3 .6 percent of GDP in 2016, with weaker
economic activity in non-oil sectors . Similarly, indirect
taxes fell slightly from 3 .2 percent of GDP in 2015 to 3
percent of GDP, though VAT rates were kept constant
at 9 percent . On the expenditure side, government
expenditure is estimated to have also increased
incrementally to 17 .7 percent of GDP compared to 17 .5
percent in 2015 . The marginal increase in expenditure
was a result of increase in capital expenditure, from 2 .4
to 2 .6 percent of GDP in 2016 which signals the greater
emphasis by the government on the lagging investment
performance of the country .
The budget’s dependence on oil income has recently moderated, but still remains high. The
role of oil in government finances has been driven by
recent political developments . The share of oil in terms
of both government revenues and GDP started falling
with the implementation of sanctions from 2011, leading
the government to take measures towards resilience
against external shocks . Since 2013 elections, the
government of Iran has also aimed to stabilize and
gradually reduce the role of oil in the budget, with the
help of increased VAT rates . Despite the increase in
the share of oil sector in GDP in 2016 following the
JCPOA, the share of oil revenues is estimated to further
decline to 32 percent, before recovering in 2017 . This
represents a significant diversification of government
revenues, as oil accounted for more than 50 percent of
total revenues in 2010–11 .
In March, the Iranian Parliament approved the 2017 budget. The main assumptions of the $100
billion 2017 budget are that the economy will grow at 7 .7
percent, inflation will be around 7 .6 percent, oil exports
will accrue at an average price of $55 per barrel in 2017
and around 35 percent of government revenues will
consist of oil revenues . On the structural side, the new
budget law improves public financial management by
mandating the transfer of all government accounts
from the banking sector to the Central Bank of Iran
(CBI) . Crucially, the legislation includes not only the
central government funds but also all State Owned
Enterprises (SOEs) and other public entities that
receive governmental budgetary allocations . This will
allow real time control to the CBI and the Supreme
FIGURE 8 • Central Government Budget Components (% of GDP)
–2.0–1.8–1.6–1.4–1.2–1.0–0.8–0.6–0.4–0.20.0
–25
–20
–15
–10
–5
0
5
10
15
20
Expenditure on Goods and ServicesOther Revenues Tax Revenues Other expenditure
Fiscal deficit (RHS)
2010 2011 2012 2013 2014 2015 2016
Source: SCI labor force survey.
FIGURE 7 • Gender-Based Legal Restrictions and Female Labor Force Participation (%)
100908070605040302010
00
Labo
r for
ce p
artic
ipat
ion
rate
, fem
ale
(% o
f fem
ale
popu
latio
n ag
es 1
5+)
Legal gender differences
5 10 15 20 25
Iran
y = –1.2906x + 59.536
30 35
Source: World Bank (2015) Women, Business and the Law. and World Development Indicators.

8 IRAN ECONOMIC MONITOR: OIL-DRIVEN RECOVERY
Audit Court on transactions to or from these accounts
and minimize financial mismanagement . This measure
along with the ongoing securitization of government
arrears through provision of Islamic treasury bills to
the banking system are all positive steps in improving
not only the government fiscal accountability but also
the overall health of the banking system . Continued
securitization of government arrears would require
efforts to develop the government debt market, while it
would be important to factor into the budget the impact
on the interest bill of the issuance of additional new
debt (of 3,500 trillion rials) and coordinate this process
with monetary policy (IMF Article IV, February 2017) .
Monetary Policy and the Financial Sector
The Iranian economy experienced its first year of single digit headline inflation in a quarter of a century, though upward pressure on prices have resurfaced. Monthly CPI inflation was
successfully kept at under 10 percent for 13 months
between December 2015 and January 2017 . However,
inflationary trends picked up since November 2016
and the headline rate moved into double digits (10 .6
percent) in February 2017, on the back of oil income
entering the economy . The main contributor to the
surge in inflation in February 2017 came from prices
of goods, which rose by 9 .6 percent, with food and
beverages price index increasing by 12 .8 percent . This
is in line with the inflationary trend observed since July
2016 as global non-oil commodity prices witnessed
an accelerating inflationary trend . Between July
2016-February 2017, the main drivers of this rising trend
were food prices and housing prices . The declining
trend in core inflation (excluding fuel, electricity and
food and beverages) halted in August 2016 and the
rate stabilized at around 9 percent during this period .
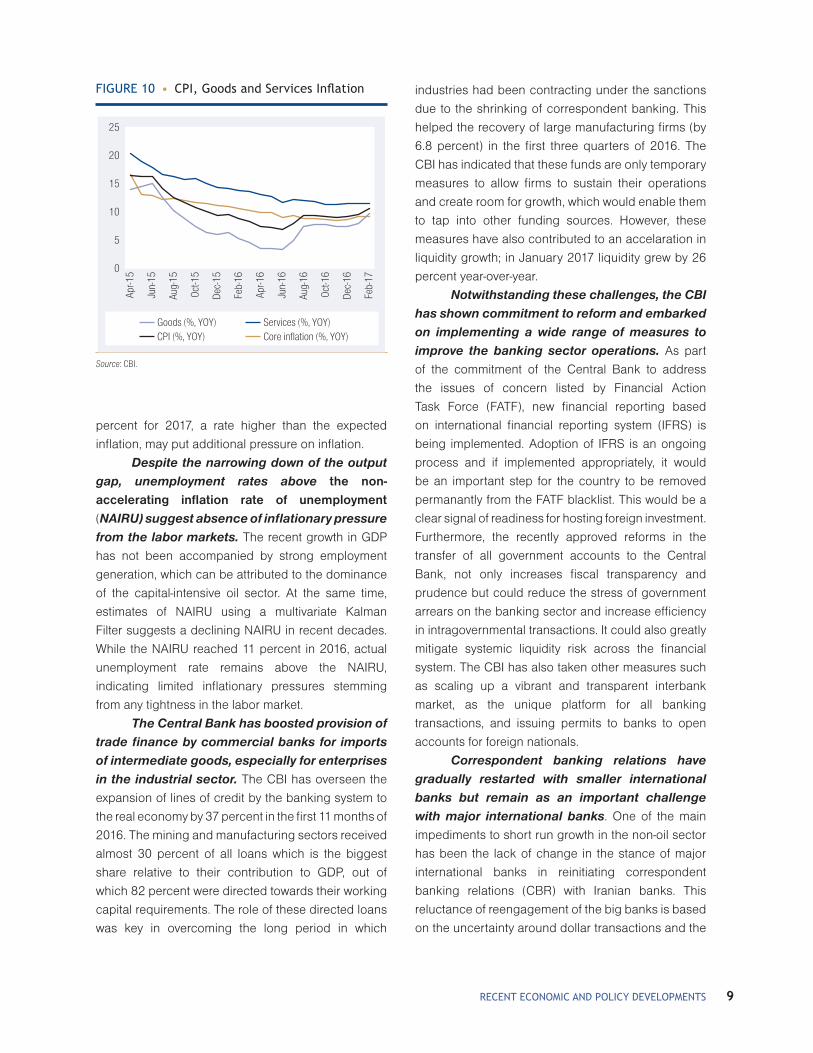
The downward trend in the services inflation also came to an end in October 2016, hinting the building up of inflationary pressures in the non-tradable sectors as well. In February 2017, services
price index increased by 11 .5 percent compared to
the same period of the previous year, continuing a
persistent inflation rate of around 11 percent since
October 2016 and down from 20 percent in April
2015 . As of February 2017, the biggest contributors to
inflation in services came from health and education
components, with annual price increases of 17 .1 and
11 .2 percent respectively . As shown in Figure 10, the
decline in service prices had joined the sharp decline
in food prices in bringing down the headline inflation
during the past two years until mid-2016 .
The increase in consumer prices can also be attributed to the surge in producer prices to around 6.8 percent in December 2016, more than twice the rate in the same month of the previous year . While agriculture prices increased
by 4 .9 percent, services PPI increased by 7 .6 percent
and manufactured goods PPI was 7 .1 percent higher
in December 2017 than a year before . The rise in
manufacturing prices can mainly be attributed to
a sharp rise in prices of basic metals, the sector’s
third biggest component, by around 12 .5 percent .
Furthermore, prices in the automobile sector grew
marginally by 0 .2 percent year-over-year which was
largely a result of commitments by the Competition
Council to limit price increases of newly manufactured
motor vehicles by the two main producers Iran Khodro
and Saipa .8 The increase in minimum wage by 14 .5
FIGURE 9 • Oil Dependence
Oil revenue % of government revenues (RHS)
10
0
20
30
40
50
60
0
5
10
15
20
25
30
2010 2011 2012 2013 2014 2015 2016
Oil sector % of GDP (LHS)
Source: Government data and World Bank staff calculations.
8 For instance, prices were promised to stay the same between November 2016 and May 2017 . See: http://www .car .ir/news/Iran-Company/increase-car-prices .
9RECENT ECONOMIC AND POLICY DEVELOPMENTS
percent for 2017, a rate higher than the expected
inflation, may put additional pressure on inflation .
Despite the narrowing down of the output gap, unemployment rates above the non-
accelerating inflation rate of unemployment
(NAIRU) suggest absence of inflationary pressure from the labor markets. The recent growth in GDP
has not been accompanied by strong employment
generation, which can be attributed to the dominance
of the capital-intensive oil sector . At the same time,
estimates of NAIRU using a multivariate Kalman
Filter suggests a declining NAIRU in recent decades .
While the NAIRU reached 11 percent in 2016, actual
unemployment rate remains above the NAIRU,
indicating limited inflationary pressures stemming
from any tightness in the labor market .
The Central Bank has boosted provision of trade finance by commercial banks for imports of intermediate goods, especially for enterprises in the industrial sector. The CBI has overseen the
expansion of lines of credit by the banking system to
the real economy by 37 percent in the first 11 months of
2016 . The mining and manufacturing sectors received
almost 30 percent of all loans which is the biggest
share relative to their contribution to GDP, out of
which 82 percent were directed towards their working
capital requirements . The role of these directed loans
was key in overcoming the long period in which
industries had been contracting under the sanctions
due to the shrinking of correspondent banking . This
helped the recovery of large manufacturing firms (by
6 .8 percent) in the first three quarters of 2016 . The
CBI has indicated that these funds are only temporary
measures to allow firms to sustain their operations
and create room for growth, which would enable them
to tap into other funding sources . However, these
measures have also contributed to an accelaration in
liquidity growth; in January 2017 liquidity grew by 26
percent year-over-year .
Notwithstanding these challenges, the CBI has shown commitment to reform and embarked on implementing a wide range of measures to improve the banking sector operations. As part
of the commitment of the Central Bank to address
the issues of concern listed by Financial Action
Task Force (FATF), new financial reporting based
on international financial reporting system (IFRS) is
being implemented . Adoption of IFRS is an ongoing
process and if implemented appropriately, it would
be an important step for the country to be removed
permanantly from the FATF blacklist . This would be a
clear signal of readiness for hosting foreign investment .
Furthermore, the recently approved reforms in the
transfer of all government accounts to the Central
Bank, not only increases fiscal transparency and
prudence but could reduce the stress of government
arrears on the banking sector and increase efficiency
in intragovernmental transactions . It could also greatly
mitigate systemic liquidity risk across the financial
system . The CBI has also taken other measures such
as scaling up a vibrant and transparent interbank
market, as the unique platform for all banking
transactions, and issuing permits to banks to open
accounts for foreign nationals .
Correspondent banking relations have gradually restarted with smaller international banks but remain as an important challenge with major international banks . One of the main
impediments to short run growth in the non-oil sector
has been the lack of change in the stance of major
international banks in reinitiating correspondent
banking relations (CBR) with Iranian banks . This
reluctance of reengagement of the big banks is based
on the uncertainty around dollar transactions and the
FIGURE 10 • CPI, Goods and Services Inflation
Goods (%, YOY)
0
5
10
15
20
25Ap
r-15
Jun-
15
Aug-
15
Oct-1
5
Dec-
15
Apr-1
6
Jun-
16
Aug-
16
Oct-1
6
Dec-
16
Feb-
17
Feb-
16
CPI (%, YOY)Services (%, YOY)Core inflation (%, YOY)
Source: CBI.

10 IRAN ECONOMIC MONITOR: OIL-DRIVEN RECOVERY
so-called U-turn transactions9 especially since some
of these banks were hit with hefty fines prior to JCPOA
implementation .
The unification of the official and market exchange rates has been postponed by a year to the end of 2017. The gap between the two rates
fell from a recent peak of 192 percent in June 2013
to 15 percent on average in the first three quarters of
2016/17, accompanied with a much lower volatility in
both rates (Figure 11) . However, the exchange rate
premium has increased slightly in the third quarter
of the year due to the seasonal increase in demand
and expectations for a sharp depreciation after the US
elections, driving the market exchange rate to above
the 40,000 rial mark for a few days . At the time, the CBI
was quick to react and brought the rates back down .
The government also allowed the banks to clear funds
at the market exchange rate in order to reduce pressure
on the foreign currency reserves . Subsequently, in mid-
March the official and parallel rates stood at around
32,400 and 37,000 rials respectively . However, the
full unification of the rates was postponed by a year,
under pressure from the recent increase in inflation
to avoid the potential pass-through from a further
depreciation of the rial . Reestablishment of a well-
functioning correspondent banking relationship would
also support the unification of the rates .
The Tehran Stock Exchange (TSE) index has experienced a slight downturn due to
9 The U-turn dollar denominated transactions were transactions of Iranian funds that were previously allowed to be cleared through US financial institutions on the condition that the recipient and issuer of the transaction were non-Iranian banks that are not in the US or under US jurisdiction . However, the exemption allowing such transactions was revoked in 2008 .
FIGURE 11 • �Official�and Market Exchange Rates ($)
Official rate
Apr-1
3
Jul-1
3
Oct-1
3
Apr-1
4
Jul-1
4
Oct-1
4
Jan-
14
Apr-1
5
Jul-1
5
Oct-1
5
Jan-
15
Apr-1
6
Jul-1
6
Oct-1
6
Jan-
16Parallel market rate
5,000
10,000
15,000
20,000
25,000
30,000
35,000
40,000
45,000
Source: CBI.
FIGURE 12 • The Current Account Surplus Rebounded in 2016
USD,
Bill
ions
% o
f GDP
Current account balance (RHS) Imports (LHS) Exports (LHS)
0 –2
0
12
10
8
6
4
2
140
160
100
120
60
80
20
40
2000 2002 2004 2006 2008 2010 2012 2014 2016
Source: World Bank.

11RECENT ECONOMIC AND POLICY DEVELOPMENTS
external factors influencing the future of JCPOA.
After the stock exchange index reached a historical
peak of 81,537 in April 2016, there was a correction
through June 2016 . The volatility in the index has
declined after this sharp swing and as expectations
for attracting investment and the longevity of the
JCPOA were partially revised . The overall index
has hovered around the 77,000 mark since August
2016, with mid-March levels 6 percent below the
December level peak . At the same time, the top 50
or 30 index displays a more negative performance of
big companies which were more likely to benefit from
improvement of international trade and finance .
External Position
Iran’s external position strengthened in 2016 following the six-year low in the current account surplus in 2015. The surplus is estimated to have
rebounded from 2 .7 percent of GDP in 2015 to 6 .5
percent of GDP in 2016, with higher oil production,
lifting of sanctions and improved oil prices
(Figure 12) . According to government sources, oil
exports increased by one-third, up to 2 .1 mbpd in the
second quarter of 2016, compared to 1 .5 mbpd in
the same quarter of the previous year . Net exports,
as a share of GDP, more than doubled from 2 .4 to 6 .1
percent of GDP in 2016, as exports recovered while
imports remained close to the 2015 level .
The pick-up in exports was driven by exports to advanced economies, particularly to Europe and Korea. Exports to Europe are almost
10 times higher at 2 billion dollars in the second
quarter of 2016 compared to one year prior when the
sanctions were still in force (Figure 13) . The largest
increases occurred in France which went from only $6
million to $658 million between March and September
in 2016 . Korea and France were both oil importers
from Iran prior to the sanctions and are amongst the
most active countries since lifting of the sanctions in
seeking out FDI opportunities on top of the already
active trade agreements relating to the automotive
sector . China and India remain Iran’s most important
export destinations . Exports to China did see a small
fall of 4 percent between second quarter of 2016
compared to a year ago, while exports to India soared
by 57 percent over the year .
FDI and portfolio investment remained low in 2015 at 0.2 percent of GDP but is estimated to have more than doubled in 2016. FDI and portfolio
equity is estimated at only $0 .8 billion in 2015, but
have quickly ramped up in 2016 to $2 .0 billion .10
The lifting of sanctions has drawn investor interest to
the hydrocarbon sector along with automobile and
telecom sectors . As Iran’s reintegration with the global
financial system speeds up, even larger increases in
FDI are expected .
Foreign reserves were estimated at $134.3 billion at the end of 2016, which was equivalent to 21 months of imports. The high
import coverage reflects Iran’s continued difficulties
to access international payment systems and low level
of imports . Since the implementation of JCPOA, Iran
has increasingly sought to conduct trade transactions,
particularly for oil, in euros to avoid the challenges it
faces with holding US dollars .
10 Based on 2016 IMF Article IV Staff Report .
FIGURE 13 • The Lifting of Sanctions Has Quickly Affected Iran’s Exports Destinations
Germany
France
Japan
KoreaEuropean
UnionIndia
China
AdvancedEmerg
Developing0 4,0002,000 6,000 8,000 10,000
2015Q2 2016Q2
Iran’s exports of goods (Quarter, USD million)
Source: IMF DOTS.


13
OUTLOOK AND RISKS
Iran’s medium-term growth prospects are expected to moderate to around 4 percent in the baseline scenario. While the 2016 economic
performance was stronger than initially envisaged on
the back of a stronger bounce-back in the oil sector,
medium-term growth outlook is somewhat weaker .
Continued uncertainties regarding Iran’s reintegration
with the global banking system and global economy
constrain both foreign and domestic investment and
keep a cap on growth . As the growth dividend from oil
weakens, growth is expected to moderate to 4 percent
in 2017 with the help of a recovery in gross fixed capital
investment, following two years of contraction (Annex
1) . Iranian economy is expected to grow by 4 .1 and
4 .2 percent in 2018 and 2019, respectively, lower than
projected in the Fall 2016 issue of the Iran Economic
Monitor (IEM) . This positive growth outlook still hinges
on the assumption that some of the agreements
between Iran and major foreign companies in the oil
and gas and other key sectors, including manufacturing,
will materialize . This would create renewed confidence,
validating the very positive expectations generated in
the immediate aftermath of JCPOA implementation
in January 2016 and leading to gradually improving
medium to long term growth dynamics as potential
output starts to rise as well . In the long-term, the primary
determinant of Iran’s growth prospects would be how
effective it utilizes its resources beyond oil and gas .
Box 1 provides growth simulations for Iran’s long-term
growth prospects with a focus on key policy areas such
as productivity and labor force participation .
Sustaining the downward trend in inflation may prove challenging. Following a substantial
decline in CPI inflation in the last two years, inflationary
pressures started to build up through food and housing
prices and the closing output gap . Under the baseline
scenario, inflation is projected to be slightly below 11
percent in 2017 and ease marginally to 10 .2 percent
and 9 .6 percent in 2018 and 2019, respectively . As
a result, continued tight fiscal and monetary policies
would be crucial to keep inflation under control .
Similarly, the sharp recovery in the current account surplus in 2016 is unlikely to be sustained beyond 2017. The current account
surplus is estimated to have surged to 6 .5 percent
of GDP in 2016 from 2 .7 percent in 2015 . While still
considerably smaller than the pre-sanctions peak
of 10 percent of GDP in 2011, this level is expected
to ease to 5 .5 percent in 2018 and further to 4 .6
percent in 2019 . This would be driven by the expected
slowdown in oil exports and stagnant non-oil exports,
combined with a pick-up in imports .
Improved public finances and structural fiscal reforms would help maintain macroeco-nomic and fiscal stability. While fiscal balances in
the last few years suffered from low oil revenues, in the
medium term spending pressures would dominate,
given the expected rise in interest payments from
securitization of government arears and the continued
pressures from the pension system . Improved tax
collection and prudent management of spending
would help achieve a budget surplus in 2018–19 .
There are significant downside risks to this baseline scenario. The major risk in the
near future is the political uncertainty around the
full implementation of JCPOA and the possibility of
new sanctions . This is likely to continue influencing
consumer/investor confidence and may lead to
2

14 IRAN ECONOMIC MONITOR: OIL-DRIVEN RECOVERY
a further weakening in private consumption and
investment . Under this scenario, GDP growth
would remain below 3 percent . Furthermore, lower
than projected oil prices would put pressure on
government revenues and undermine growth . Going
forward, the main challenge still facing the economy is
channeling the ‘oil proceeds’ towards benefitting the
broader population . In order to optimize the returns
BOX 1 • Iran’s Long-term Growth Prospects
Iran’s growth prospects would increasingly rely on its effective use of resources beyond the oil sector. As the oil production capacity reaches pre-sanctions levels, further sizeable growth dividends are unlikely to be driven by the oil sector. Instead, the country would need to rely more on its other abundant resource, its educated labor force and focus on bringing its productivity levels up.
Iran does not compare favorably with its peers in terms of productivity and the use of its labor force. Preliminary analyses for long-term growth simulations benchmarked Iran against a set of comparators in terms of its efficiency of production. The group of benchmark countries are those that are oil exporters, upper middle-income and with a population of over 20 million. As shown in Figure 1.1, the growth rate of Iran’s GDP per worker fell short of the upper middle-income countries’ average in 2005–15. The more striking difference between Iran and its set of comparators is in the level of female labor force participation. At only 17.8 percent, Iran is among the countries, along with a few of its MENA peers, with the lowest female labor force participation rates (Figure 1.2).
FIGURE 1 .1 • Growth Rate of GDP Per Person Employed (constant 2011 PPP Dollars), 2005–15
–1
6
7
4
5
2
3
0
1
Algeria Mexico Iraq Venezuela, RB
Upper middle income average
Iran,Islamic Rep.
Colombia Malaysia RussianFederation
Angola
1.9
Source: Find My Friends using WDI.
(continued on next page)
FIGURE 1 .2 • Female Labor Force Participation (% of Female Population Aged 15–64), 2005–15
0
70
80
50
60
30
40
10
20
Algeria MexicoIraq Venezuela, RB
Upper middle income average
Iran,Islamic Rep.
ColombiaMalaysia RussianFederation
Angola
17.8
Source: Find My Friends using WDI.

15OUTLOOk AND RISkS
Simulations of Iran’s long-term growth path show the abundant potential from moving closer to the frontier. To assess the impact of changes in three key parameters on Iran’s per capita GDP by 2030, three scenarios are constructed. The three parameters used are: investment to GDP ratio, total factor productivity growth and female labor force participation. The scenarios include a status quo (baseline), benchmarking to comparators and a take-off scenario. The three variables that are exogenously shocked are selected as those most likely to be affected by reforms in Iran. The status quo scenario assumes all the parameters remain at the same levels as their 2005–14 average (Table 1.1). The benchmark scenario is based on the average outcomes of Iran’s selected comparators (Algeria, Angola, Colombia, Iraq, Malaysia, Morocco, Russia, and Venezuela). Take-off scenario assumes very strong improvements on Iran’s present condition. Investment rate is assumed to increase from 26 percent to 35 percent of GDP (top 10th percentile in the world), female labor force participation improves from 17 percent to 57 percent and TFP growth of 1.1 percent, highest levels among the comparator set. Finally, two combined scenarios assume all the benchmark assumptions occur simultaneously and all take-off scenarios occur simultaneously.
Combined scenarios are illustrative of the potential for Iran’s economy to move to a superior growth path (Figure 1.3). Under the assumption that Iran’s female labor force participation rate increases to 47 percent and the rate of increase in its TFP increases to 0.9 percent, both averages of its set of comparators for this exercise, the real GDP per capita will be close to two thousand dollars higher than in the baseline in 15 years time. More strikingly if the three parameters used for this simulation reach the highest levels observed in the set of comparators), Iran’s real per capita GDP is more than 40 percent higher than its baseline level by 2030.
FIGURE 1 .3 • Simulations of Real GDP Per Capita Under Benchmark and Take-Off Scenarios
5,000
14,000
15,000
12,000
13,000
10,000
11,000
US$,
201
0
8,000
7,000
6,000
9,000
2014 2015 2016 2017 2018 2019
Baseline Benchmark Take off
2020 2021 2022 2023 2024 2025 2026 2027 2028 2029 2030
Source: WB staff calculations using Long-term growth simulation model.
BOX 1 • Iran’s Long-term Growth Prospects (continued)
TABLE 1 .1 • Assumptions for Long Term Growth Simulations, Values for 2030
Status Quo Benchmark Take-off
Investment Rate (share of GDP) 26.0% 26.0% 35.0%
Female Labor Force Participation Rate 17.7% 46.9% 57.0%
Total Factor Productivity growth rate 0.3% 0.9% 1.1%
from these oil proceeds, an effective sovereign wealth
management architecture would need to ensure fiscal
sustainability and address development challenges .
Moreover, tackling the structural reform agenda that
would boost non-oil sector growth remains a key
priority . These reforms would need to be supported by
connecting Iranian banking sector with the rest of the
world and through improved trade linkages facilitating
the much needed job creation especially for the
country’s young and highly educated population .

16 IRAN ECONOMIC MONITOR: OIL-DRIVEN RECOVERY
Annex 1
IRAN: SELECTED ECONOMIC INDICATORS (2014–2019)*
2014 Act. 2015 Est. 2016 Proj. 2017 Proj. 2018 Proj. 2019 Proj.
Real sector (annual percentage change, unless otherwise specified)
Real GDP at factor cost 3.0 –1.8 6.4 4.0 4.1 4.2
Total oil production (million barrels/day) 3.1 3.2 3.7 4.2 4.3 4.4
Crude oil, average price (US$) 96.2 50.8 43.0 55.0 60.0 61.5
Money and prices (annual percentage change, unless otherwise specified)
CPI Average Inflation (p.a) 15.6 11.9 9.0 11.5 10.9 10.6
Investment & saving (percent of GDP, unless otherwise specified)
Gross Capital Formation 26.2 24.6 23.2 24.0 25.2 26.5
Gross National Savings 30.0 27.3 29.7 30.5 30.8 31.1
Government finance (percent of GDP, unless otherwise specified)
Total revenues 14.6 15.6 16.3 17.5 18.2 18.8
Tax Revenues 6.4 6.9 6.7 6.6 6.4 6.1
Direct Taxes 3.3 3.7 3.6 3.6 3.5 3.3
Indirect Taxes 3.2 3.1 3.0 3.0 2.9 2.8
Total expenditures 15.8 17.5 17.7 18.1 17.9 17.6
Current 13.0 15.1 15.0 14.9 14.8 14.6
Net lending/borrowing (overall balance) –1.2 –1.9 –1.5 –0.6 0.2 1.2
External sector (percent of GDP, unless otherwise specified)
Current Account 3.8 2.7 6.5 6.5 5.5 4.6
Net Exports 3.5 2.4 6.1 6.0 5.1 4.2
Export of Goods and Services 23.1 19.7 25.0 26.9 27.5 27.9
Import of Goods and Services 19.6 17.3 18.4 20.0 21.5 22.9
Total International Reserves (Billion US$) 126.2 128.4 134.3 147.2 166.1
as Months of Imports (number of months) 18.5 22.9 21.1 21.2 22.2
Total Gross External Debt Stock (US$ bln) 5.5 4.5 8.3 10.1 8.5 3.3
Total Gross External Debt Stock (% of GDP) 1.3 1.1 2.0 2.4 2.1 0.8
Memorandum Items:
Nominal GDP (Billion IRR**) 11,033,666 11,502,510 13,119,439 14,996,331 16,826,804 18,955,294
Sources: Government Data and World Bank Staff Calculation.* Fiscal year ends March 20. For example, 2015 corresponds to the fiscal year of 2015/2016.** IRR: Iranian Rial
17OUTLOOk AND RISkS
References
IMF . 2015 . Fair Play: More Equal Rules Boost Female
Labor Force Participation, IMF Staff Discussion
Note, Washington, DC .
IMF . 2017 . Islamic Republic of Iran 2016 Article IV
Consultation—Press release; Staff Report; and
Statement by the Executive Director for the Islamic
Republic of Iran, IMF Country Report No . 17/62 .
World Bank . 2013 . Opening Doors: Gender Equality
and Development in the Middle East and North
Africa, Washington DC: World Bank .
World Bank . 2015 . Jobs and Privileges: Unleashing
the Employment Potential of the Middle
East and North Africa, MENA Development
Report,Washington, DC: World Bank .
World Bank . 2015 . Women, Business and the Law
2016: Getting to Equal . Washington, DC: World
Bank . doi:10 .1596/978–1-4648–0677–3 . License:
Creative Commons Attribution CC BY 3 .0 IGO .


19
SPECIAL FOCUS 1 IRAN’S PENSION SYSTEM: THE NEED FOR REFORM
Introduction
This special focus chapter provides an overview
of the Iranian pension system, its main challenges,
and preliminary guidance towards a series of
policy interventions with the objective to improve its
coverage, equity and fairness, incentives, economic
and administrative efficiency, as well as its financial
sustainability .
The chapter is organized in three parts . Section
2 presents some background of pensions in Iran
against general fundamental principles of pension
systems based on international best practices, as well
as a general overview of the Iranian pension system,
including institutional structure, and parametric
features . Section 3 presents the main challenges
faced by the current pension system in Iran . Section
4 presents some policy considerations, and general
discussion on the way forward, by drawing on some
fundamental principles and international experiences .
The pension system in Iran is highly
fragmented, composed of 18 contributory pension
schemes . Based on the latest information, 76 percent
of the employed population is registered with one of
these schemes . The two largest ones are SSO (Social
Security Organization, which covers private sector
employees), and CSRF (Civil Servants Retirement
Fund) . Together both schemes cover around 90
percent of all contributors . While SSO covers 83
percent, CSRF covers only 7 .1 percent . With respect to
beneficiaries, CSRF is already covering more than 28
percent of all beneficiaries . The Armed Forces Pension
Organization, and the Rural Pension Organization are
the other two relatively sizeable schemes, covering
6 percent and 3 .3 percent of the total number of
insured, respectively . Around 50 percent of the elderly
population in Iran today is not receiving a pension
from any of the contributory schemes and has to rely
on other sources of protection, from family, social
assistance, or others .
The pension system in Iran is currently facing
various challenges . In addition to the ones on coverage,
important challenges remain on administrative aspects;
particularly the need to improve the management of
reserves . Current investment policies are complex, and
not necessarily in the best interest of plan members .
Appropriate investment regulations are not in place .
The pension system in Iran is also currently facing
economic inefficiencies due to fragmentation (which
11 This chapter was prepared by Montserrat Pallares-Miralles, with inputs from Robert Palacios .
11

20 IRAN ECONOMIC MONITOR: OIL-DRIVEN RECOVERY
represents an obstacle to labor market mobility) .
The system has also various features that lead to
increasing inequities .12 Also, in spite of the generosity
of the system by design, in practice adequacy seems
to be another challenge . Pension benefits received
by 77 percent of the pensioners from SSO and by 35
percent of those from the CSRF, are below the poverty
line . Finally, the pension system in Iran is also under
significant fiscal stress . Revenues from contributions
do not cover pension expenditures . Investment returns
are very low, and reserves are depleting . Deficits of
all schemes together represented 425 .3 trillion rials in
2014 (around 4 percent of GDP) .
The challenges and opportunities of the
pension system in Iran are indeed considerable .
This chapter presents only a very general overview .
All challenges and opportunities would need to be
tackled with very careful and in-depth quantitative
analysis and policy discussions . Reforming pension
models or building new ones that will work for
individuals and governments alike is an incredible
challenge . Most governments worldwide are currently
reforming or in need of reforming their pension
systems, and international experience shows clearly
that there are no easy solutions for pension reform . A
simple model for pension reform cannot be uniformly
applied to all countries . However, what is quite clear,
and further described in the last part of this chapter, is
the fact that a multi-pillar or multi-dimensional pension
system is required, in order to meet and balance the
multiple and sometimes conflicting objectives of a
pension system . Basically, no single pillar or tier can
bear all the weight of delivering adequate income
with broad coverage in a sustainable, efficient and
secure manner . There is no example of a country
globally that manages to achieve high levels in each
of these outcomes with only one pillar . In addition to
parametric reforms, consideration for other pillars
(social pensions), as well as the integration of pension
schemes, is also recommended .
Pension System in Iran – Overview
The pension system in Iran is composed of 18
pension schemes . The two biggest ones are Civil
Servants Retirement Organization and Social Security
Organization (which covers private sector employees) .
Among other sizeable schemes are the following:
Folad Co . Pension Organization,13 Bank’s Pension
Organization, Oil Industry Pension Organization,
Armed Forces Pension Organization and Rural
Pension Organization . SSO includes voluntary
enrollment for the self-employed (which represents
44 percent of all insured) . All the schemes in Iran are
designed as contributory, PAYG (Pay-As-You-Go)14
and DB (Defined Benefit),15 and are facing the usual
challenges of system demographics . The support
ratio—number of contributors divided by the number
of beneficiaries—is falling significantly in many of
these schemes . As indicated in Table 2, except for the
insurance fund (scheme) for farmers, villagers and
tribes and the lawyers support fund (scheme), which
are new and recently established funds, the rest of
the schemes are already showing unfavorable system
demographics . In the case of SSO, the support ratio
is still relatively favorable but decreasing rapidly (less
contributors for more beneficiaries) .
Table 3 presents the main design characteristics
of the two biggest schemes, SSO, and CSRF .
Contribution rates in the private sector (SSO) are lower
than in the public one (CSRF) . Eligibility conditions
for retirement are diverse, and generous . Retirement
ages basically range between no minimum (females
with 20 contribution years in the CSRF, and males
and females with 35 contribution years in SSO) and
65 years (males and females in CSRF) .
The statutory retirement age in SSO is 60 for
men and 55 for women (with 10 years of contributions) .
The scheme does not provide formal early retirement,
however it has implemented generous exceptions to
the statutory rule . In the following cases retirement
12 Various design features lead to some members to contribute the same as others but take out disproportionally more from the system .
13 This fund is not accepting new entrants .14 Financing mechanism where current contributors pay
for current beneficiaries (see annex glossary) .15 Pension is calculated according to a formula (see annex
glossary) .

21SPECIAL FOCUS 1 IRAN’S PENSION SYSTEM: THE NEED FOR REFORM
TABLE 2 • Pension Schemes in Iran: Active Members, and Retirees, 2014
Organization/Fund Number of active members Number of retirees Support Ratio
Social Security Organization 13,344,498 2,179,572 6.1
Civil Servants Retirement Organization 1,135,000 1,244,000 0.9
Insurance Fund for Farmers, Villagers and Tribes 660,000 22,697 29.1
Armed Forces Social Security Organization 580,000 650,000 0.9
Oil Industry Staff Fund 96,700 — —
Steel’s Staff Support Fund 11,552 74,564 0.2
Ports and Marine Organization Staff Fund 1,304 2,088 0.6
Banks Fund 164,000 103,000 1.6
Lawyers Support Fund 30,000 780 38.5
Ayandesaz Fund 10,920 4,172 2.6
Other Exclusive Funds ( 8 Funds) 63,060 56,510 1.1
TOTAL FUNDS 16,097,034 4,405,995 3.65
Source: MoCLSW, Ministry of Cooperation, Labor and Social Welfare.
TABLE 3 • Pension Schemes SSO and CSRF Design Features in Iran
DESIGN CHARACTERISTICS SSO (national scheme) CSRF (civil servants)
SOCIAL SECURITY CON TRIBUTIONS
Total contribution rate of employer and employee (as % of covered wage) 18% (7% employees, 11% employers) 22.5% (9% employees, 13.5% employers)
ELIGIBILITY CONDITIONS
Different Eligibility Conditions (years):
1. Statutory Retirement Age 60/55 (men/women) 65 (60 at employer’s request)
with required length of service of 10 30
2. Any age with 35 years of experience Yes No
3. 20 consequent years or 25 years of experience for arduous and hazardous job
Yes No
4. 50 years old male with 25 years of experience—with employer’s permission
No Yes
5. Female with 20 years of experience—with employer’s permission No Yes
PENSION BENEFIT CALCULATION
Benefit formula for old-age pensions:
Basic Replacement Rate 33.3% 99.9%
Incremental Replacement Rate 3.3% 3.3%
Maximum Replacement Rate 116% 100%
Number of Last Years for Wage Base Calculation 2 2
Post-Pension Indexation Discretionary Discretionary
Source: MoCLSW, Ministry of Cooperation, Labor and Social Welfare & WB pensions database.

22 IRAN ECONOMIC MONITOR: OIL-DRIVEN RECOVERY
ages can be lower: i) individuals with at least 35 years
of contributions can retire at any age; ii) individuals
working in hazardous jobs who have worked at least
20 consequent years or 25 years as a whole, even
discontinued, can also retire at any age without
penalties .
In the case of CSRF, at various points in time,
the scheme provided additional incentives for early
retirement as a mechanism to reduce the size of the civil
service . In 1988 and 1992, the SSO also implemented
two generous early retirement programs . Over the
years, there has been a fast increase in the number
of beneficiaries, attributed in part to the government’s
efforts to control wage expenditures by reducing the
size of the civil service . Hence, the statutory rules
have quite often been overruled .
Today in CSRF men can retire at age 50 if they
have contributed for at least 25 years (and with the
employer’s permission) . Female employees who have
contributed continuously for 20 years can apply for
retirement at any age (with the employer’s permission),
however, the minimum pension in this case does not
apply .
Both benefit formulas (in SSO, and CSRF)
use the average of the last two years as the base for
pension calculation . In the SSO, with an accrual rate
of 3 .3 percent per year and only the last two years
used to compute the base salary for the pension,
statutory replacement rates for full-career workers
are equal to 116 percent, while for those who have
only contributed for 10 years (the minimum length of
service) the replacement rate is 33 .3 percent .
In the case of CSRF, the basic replacement rate
(for an individual who has contributed the minimum
length of service of 30 years) is 99 .9 percent . It is also
important to note that in CSRF both contributions
and pensions are actually computed on a base of 75
percent of total income, hence effective replacement
rates for full career workers is 75 percent when
considering the entire remuneration (or 100 percent
when considering only the pensionable income) .
As explained in part 3 below (main challenges),
the current design features of the pension system
are creating inequities and distortions in the labor
supply . In particular, the benefit formulas and
eligibility conditions in SSO provide incentives for
under-declaration, evasion, and early retirement .
In practice, adjustments of pensions in-payment
(indexation) are subject to discretion by government
officials . Hence, beneficiaries are at risk of their
purchase power being eroded due to inflation .
Main Challenges
Financial sustainability and affordability16
The pension system in Iran is currently facing the
usual challenges of system demographics, with the
support ratio considerably decreasing, in addition to
the challenges of very generous17 parameters . The
system is also plagued by low returns to investments .18
As a result, the schemes’ deficits have been rapidly
increasing . A main concern of the Iranian policy
makers at this point is the financial sustainability
since the current system heavily relies on the general
budget, especially in the case of the Civil Service and
Armed Forces schemes . Government contributions
to the civil service and military pension schemes
represented 2 .8 percent of the public budget in
2005 rose to 14 percent in 2014 and is expected
to increase to 28 percent in the next 7 years . Total
deficits reached 425 .3 trillion rials in 2014 (around 4
percent of GDP) .
Figure 14 illustrates the high correlation that
exists worldwide between pension spending and
the percentage of population over 65 . Iran is well
above the predicted line, it has higher spending when
comparing with other countries in the world with
similar percentage of elderly population . This fact is
due to various reasons, including pensions generosity
16 While the concept of affordability looks only at the costs of pension benefits, the concept of sustainability compares the retirement benefits with the contributions paid to earn the pension rights . Most contribution rates of the current pension schemes in Iran cannot sustain the promised pensions .
17 See next paragraphs and Figure 15 .18 No specific data on investment returns was made
available at the moment of writing this chapter, however it was mentioned that the current investment policies are complex, and with low returns .

23SPECIAL FOCUS 1 IRAN’S PENSION SYSTEM: THE NEED FOR REFORM
of most of the schemes (particularly civil servants and
other special schemes) as well as the widespread
early retirement programs and also survivorship
pensions .
Benefit promises of the current pension
schemes in Iran are not in line with the contribution
rates and the retirement ages . While parametric
alignment to the overall sustainability objective is
neither simple nor univocal, potential reforms to
improve the alignment between contributions and
pensions19 include increased retirement ages (to
respond to the increase in life expectancy), and revision
of benefit formula and eligibility conditions (particularly
considering the highly generous provisions for early
retirement) . Basically, pension schemes in Iran have
a fundamental misalignment between the contribution
rate and benefits paid at various retirement ages .
A key parameter of the benefits of such
schemes is the accrual rate, which is the proportion of
earnings paid in pension for each year of contributions .
Multiplying the number of years of contributions by
the accrual rate gives the gross replacement rate
(benefit paid), a standard and important indicator
in the analysis of these types of retirement-income
provisions . Figures 15 illustrates how generous
pension accrual rate is in Iran when compared with
European and other OECD member countries . In
Iran, the difference between what many individuals
contribute into the schemes and how much they
take out from such schemes is huge, leading to the
challenge of the current unsustainability .
19 Ideally, and as much as possible, the present value of all contributions of an individual should be equal to the present value of the pension payments to the same individual . High internal rate of returns make the system unsustainable .
FIGURE 14 • Pension Spending vs Population Over 65 (as % of Total Population)
16
14
12
10
8
6
4
2Pens
ion
spen
ding
(% G
DP)
Population over 65 (% Total population)
00 105 15 20 25
y = 0.5992x–1.032R² = 0.7116
Italy
Hungary
Australia
Dominican Republic
Lebanon
Yemen IndiaMexico
Djibouti China
Tunisia
AlgeriaMorocco
IRAN
Egypt
IraqPalestineKuwait
Jordan
Source: WB pensions database.
FIGURE 15 • Accrual Rate: International Comparisons
0 0.5 1.0 1.5 2.0 2.5 3.0 3.5
IRANTurkey
ItalyPoland
SwedenSwitzerland
FinlandPortugal
FranceCzech Republic
AustriaCanada
BelgiumGermany
NetherlandsUSA
JapanMexico
United KingdomIreland
Source: WB pensions database.
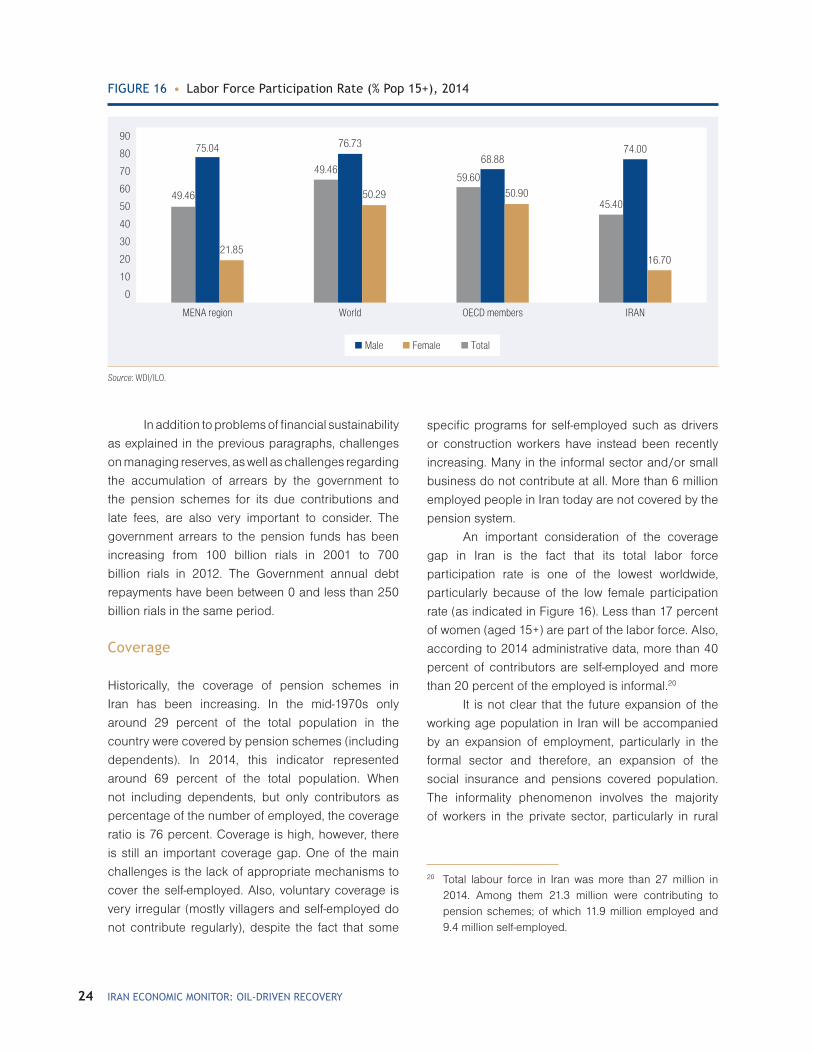
24 IRAN ECONOMIC MONITOR: OIL-DRIVEN RECOVERY
In addition to problems of financial sustainability
as explained in the previous paragraphs, challenges
on managing reserves, as well as challenges regarding
the accumulation of arrears by the government to
the pension schemes for its due contributions and
late fees, are also very important to consider . The
government arrears to the pension funds has been
increasing from 100 billion rials in 2001 to 700
billion rials in 2012 . The Government annual debt
repayments have been between 0 and less than 250
billion rials in the same period .
Coverage
Historically, the coverage of pension schemes in
Iran has been increasing . In the mid-1970s only
around 29 percent of the total population in the
country were covered by pension schemes (including
dependents) . In 2014, this indicator represented
around 69 percent of the total population . When
not including dependents, but only contributors as
percentage of the number of employed, the coverage
ratio is 76 percent . Coverage is high, however, there
is still an important coverage gap . One of the main
challenges is the lack of appropriate mechanisms to
cover the self-employed . Also, voluntary coverage is
very irregular (mostly villagers and self-employed do
not contribute regularly), despite the fact that some
specific programs for self-employed such as drivers
or construction workers have instead been recently
increasing . Many in the informal sector and/or small
business do not contribute at all . More than 6 million
employed people in Iran today are not covered by the
pension system .
An important consideration of the coverage
gap in Iran is the fact that its total labor force
participation rate is one of the lowest worldwide,
particularly because of the low female participation
rate (as indicated in Figure 16) . Less than 17 percent
of women (aged 15+) are part of the labor force . Also,
according to 2014 administrative data, more than 40
percent of contributors are self-employed and more
than 20 percent of the employed is informal .20
It is not clear that the future expansion of the
working age population in Iran will be accompanied
by an expansion of employment, particularly in the
formal sector and therefore, an expansion of the
social insurance and pensions covered population .
The informality phenomenon involves the majority
of workers in the private sector, particularly in rural
FIGURE 16 • Labor Force Participation Rate (% Pop 15+), 2014
0
30
20
10
80
90
60
70
40
50
MENA region
75.04
49.46
21.85
76.73
49.46
50.29
68.88
59.60
50.90
74.00
45.40
16.70
World OECD members IRAN
Male Female Total
Source: WDI/ILO.
20 Total labour force in Iran was more than 27 million in 2014 . Among them 21 .3 million were contributing to pension schemes; of which 11 .9 million employed and 9 .4 million self-employed .
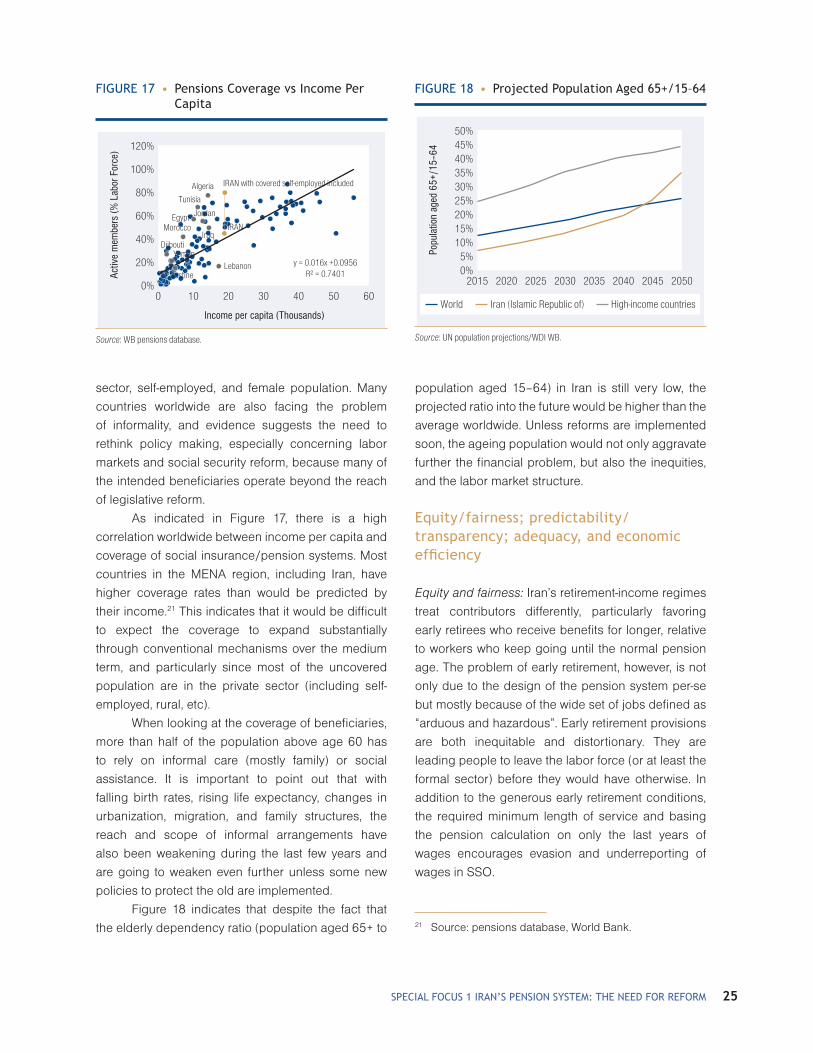
25SPECIAL FOCUS 1 IRAN’S PENSION SYSTEM: THE NEED FOR REFORM
sector, self-employed, and female population . Many
countries worldwide are also facing the problem
of informality, and evidence suggests the need to
rethink policy making, especially concerning labor
markets and social security reform, because many of
the intended beneficiaries operate beyond the reach
of legislative reform .
As indicated in Figure 17, there is a high
correlation worldwide between income per capita and
coverage of social insurance/pension systems . Most
countries in the MENA region, including Iran, have
higher coverage rates than would be predicted by
their income .21 This indicates that it would be difficult
to expect the coverage to expand substantially
through conventional mechanisms over the medium
term, and particularly since most of the uncovered
population are in the private sector (including self-
employed, rural, etc) .
When looking at the coverage of beneficiaries,
more than half of the population above age 60 has
to rely on informal care (mostly family) or social
assistance . It is important to point out that with
falling birth rates, rising life expectancy, changes in
urbanization, migration, and family structures, the
reach and scope of informal arrangements have
also been weakening during the last few years and
are going to weaken even further unless some new
policies to protect the old are implemented .
Figure 18 indicates that despite the fact that
the elderly dependency ratio (population aged 65+ to
population aged 15–64) in Iran is still very low, the
projected ratio into the future would be higher than the
average worldwide . Unless reforms are implemented
soon, the ageing population would not only aggravate
further the financial problem, but also the inequities,
and the labor market structure .
Equity/fairness; predictability/transparency; adequacy, and economic efficiency
Equity and fairness: Iran’s retirement-income regimes
treat contributors differently, particularly favoring
early retirees who receive benefits for longer, relative
to workers who keep going until the normal pension
age . The problem of early retirement, however, is not
only due to the design of the pension system per-se
but mostly because of the wide set of jobs defined as
“arduous and hazardous” . Early retirement provisions
are both inequitable and distortionary . They are
leading people to leave the labor force (or at least the
formal sector) before they would have otherwise . In
addition to the generous early retirement conditions,
the required minimum length of service and basing
the pension calculation on only the last years of
wages encourages evasion and underreporting of
wages in SSO .
21 Source: pensions database, World Bank .
FIGURE 17 • Pensions Coverage vs Income Per Capita
120%
100%
80%
60%
40%
20%
Activ
e m
embe
rs (%
Lab
or F
orce
)
Income per capita (Thousands)
0%0 2010 30 40 50 60
Algeria IRAN with covered self-employed included
IRAN
PalestineLebanon
Morocco
DjiboutiYemen
Egypt Jordan
Iraq
y = 0.016x +0.0956R² = 0.7401
Tunisia
Source: WB pensions database.
FIGURE 18 • Projected Population Aged 65+/15–64
50%45%40%35%30%
Popu
latio
n ag
ed 6
5+/1
5–64
25%20%15%10%
5%0%
2015 20252020 2030 2035 2040 2045 2050
World Iran (Islamic Republic of) High-income countries
Source: UN population projections/WDI WB.

26 IRAN ECONOMIC MONITOR: OIL-DRIVEN RECOVERY
Iran’s practice of basing pensions on a limited
sub-set of years (the best or final years in the career),
used to be a common practice internationally, but this
is no longer the case . In Iran the pensions law in this
respect has been slightly amended, and pensions
are supposed to be based on the last five years,
however this measure has not yet been enforced .
Some countries have already moved from the final
five years, fifteen, or even twenty to lifetime average .
This convergence towards lifetime-average salary
for pension calculation is a best practice, explained
because of the following: the contribution base for
pensions is the lifetime salary, because payments
are made each year . When the base for calculating
pensions differs from this—with a limited set of best or
final years—and benefits can be unfair, open to abuse
and have perverse incentives on economic behavior .
For example, basing pensions on a limited number
of best or final years tends to be regressive, because
the people with final or best years substantially above
their career-average earnings tend to be those that
earn the most .
Considering lifetime-average salary for pension
calculation is particularly relevant for Iran, given its
relatively large informal sector, and self-employment .
Final-salary measures give a large incentive to
under-report earnings in earlier years and artificially
boost pay in the years which are used to calculate
benefits . Empirical evidence from many middle-
income countries confirms that such gaming of the
pension system is widespread . Such behavior is most
acute among self-employed workers, where verifying
incomes is extremely difficult .
Predictability and transparency: Another policy
issue of pensions in Iran is the fact that there is
currently no automatic mechanism of indexing
pensions in-payment . Adjustments are subject to
the discretion of Government officials . This is not
good practice as this can lead to erosion of the living
standards of retirees by inflation . Price-indexation of
pensions in-payment is the most common policy .
Indexing pensions in-payment to prices guarantees
the purchasing power of pensions during retirement .
It makes retirement incomes predictable and
transparent .
Adequacy: Also, in spite of the generosity of the system
by design, in practice adequacy seems to be another
challenge . Pension benefits received by 77 percent of
the pensioners from SSO, and by 35 percent of those
from the CSRF, are below the poverty line .22
Economic efficiency: Another challenge of the
current system is fragmentation . Particularly the
difference between public and private sectors is also
an important policy issue because it impedes the
mobility of the labor force within and across sectors,
increases administrative costs, and generates an
unequal treatment of different categories of workers .
An increasing number of countries worldwide are
merging its different pension schemes .
Policy Considerations
Looking forward, policymakers in Iran would need to
create awareness among the population regarding
the problems facing the pension system while
generating commitment to reform . This requires
framing discussions within a long-term horizon to
make explicit the tradeoffs between the potential
social and economic costs of today’s policies with the
future benefits .
When creating a road map towards pension
system reform, it is recommended that policy
makers in Iran consider the following three points,
and ask themselves about the principles based on
international best practices:
1 . Parametric reforms that mitigate inequities,
distortions and financing pressures
2 . Consideration of alternatives for redistribution,
such as social pensions
3 . Consolidation of multiple schemes (merging
the current fragmented system)
In addition to these three points directly related
to pension design, other aspects related to labor force
22 Schemes are generous by design, however, given the fact that so many people retire early (with very few years of contribution) many individual pensions are actually low .
27SPECIAL FOCUS 1 IRAN’S PENSION SYSTEM: THE NEED FOR REFORM
structure, rules and definitions would also need to
be considered when creating the road map towards
a pension system reform . Labor force aspects to be
considered would include, among others, female
labor force participation, and particularly modifying
the process of defining arduous and hazardous jobs .
Until recently many type of ordinary jobs have been
defined as “arduous and hazardous” for political
reasons, in order to allow people to retire early . These
easy early provisions have considerably increased
the gap between life expectancy and the effective
average retirement age .23
I. Parametric reforms that mitigate inequities, distortions and financing pressures
As mentioned in the previous section, several of
the current practices of the pension system in Iran
have put the system on an unsustainable trajectory .
In general, people contribute only for short periods
of time but get benefits for long periods . Current
policies also damage and distort the way the labor
market works, it creates inequities, as well as adverse
incentives .
Early retirement opportunities create adverse
incentives for the labor-market . Such early retirement
measures seem reinforced and institutionalized .
There are two areas where damaging norms seem to
have been established:
• It becomes the norm to contribute for a short
period;
• It becomes the norm to retire at the earliest
possible opportunity (in the civil service
scheme a man can retire at 50 with only 25
years of service if employer decides, and a
woman can retire at any age with only 20 years
of service, if the employer decides) .
It is important to assess and analyze the
current system with regards to such damaging norms .
It is also crucially important that policy makers subject
the current scheme—and any proposals for reform—to
detailed actuarial modeling and analysis to properly
set the individual parameters of the reformed scheme .
The financial modelling will set out a range of pension
possibilities, emphasizing the trade-offs between the
benefit accrual rate, pension age, and contribution
rates . Table 4 present a few examples of current vs
desirable policy measures . Policy makers would also
need to decide on the pace of reform, from slowest
to fastest type of reforms (with their pros- and cons-) .
In order to gain support from the public and
minimize resistance for pension reform, it would be
very important to emphasize other challenges beyond
the financial sustainability/affordability ones and
communicate them appropriately and effectively to
the public . During the pension reform process, policy
makers in Iran might want to also consider important
lessons learnt on communication aspects from other
countries worldwide, and particularly from the OECD .
There are relevant good but also bad practices in
this respect, and various surveys, and lessons learnt
to improve pension information and communication .
The goal would be to create awareness among
the public, and particularly among all relevant
stakeholders (social partners, and others) during
the reform process, about the challenges facing the
pension system and the options for reform .
II. Consideration for redistribution: social pensions and other potential mechanisms
When talking about redistribution it is actually
important to distinguish between redistribution toward
the core elderly poor, who are usually (but not always)
outside the contributory system, and redistribution
within the contributory scheme, ideally from high-
income workers to low-income workers .
Redistribution toward the elderly poor involves
social assistance programs (and/or non-contributory
social pensions when recipients are only elderly
population), in-kind or in-cash transfers, that should
be financed directly from the central budget . The
elderly poor, and those individuals likely to become
poor during old age, face liquidity constraints and
short-term risks that outweigh the risk of longevity .
Noncontributory schemes need to be in place to
23 In 1988 life expectancy at birth was 60, and effective average retirement age 55, while in 2005 life expectancy increased to 70, but on the other hand the effective average retirement age decreased to 48 .

28 IRAN ECONOMIC MONITOR: OIL-DRIVEN RECOVERY
protect these individuals . These programs need
to be implemented in a way that does not create
negative incentives for working and for joining the
contributory system .
Many countries also pursue another form of
redistribution, from high- to low-income workers within
the contributory system (usually a DB-PAYG scheme,
like the ones in Iran) . The costs of this redistribution
mechanism, however, can outweigh the benefits .
Whether redistribution from high- to low income
workers in the contributory system is desirable or
not is a matter of social preferences . If it is, however,
policy makers ought to consider the less-distorting
redistribution mechanism . Achieving the redistribution
through the pension system involves taxing labor
and thus distorting labor markets . An alternative
is to finance the transfers (e .g ., guarantees on
minimum pensions) directly from the central budget .
In the case of a DB-PAYG system, transfers can be
regressive, meaning that low income individuals
receive lower rates of return than high-income
individuals; furthermore, future generations usually
receive lower rates of return than current generations .
In the case of SSO and the CSRF, for instance, a
given individual’s rate of return from the DB-PAYG
system is determined by two main factors: the average
growth rate of the real wage; and life expectancy .
Individuals whose wages grow faster and who live
longer, thus receiving pensions for longer periods of
time, have higher rates of return . These individuals
are often educated and healthy workers, more likely
to belong to middle- and high-income households . In
principle, the system could be designed instead so
that low-income individuals receive higher rates of
TABLE 4 • Current Policy Parameters and, Desirable Policy Parameters Based on First Principles and Best Practice, Slow and Fast Reforms
Feature of the pension system Current policy
Desirable policy (from first principles and best practice) Slowest reform Fastest reform
Accrual rate structure Linear: 3.3% Linear: 2% 2% for future accruals 2% for all retirees, even those who have accrued rights (at the previous 3.3%)
Qualifying period for pension
10 years in private
30 years in public
Longer period (depending on other parameters)
Earnings measure last two years for private sector and last month for the public sector
Lifetime average Lifetime average salary used to calculate benefits only for new entrants.
All existing workers remain on current rules
All accrual from the reform point on lifetime average salary, meaning pension in two parts (final salary and average salary) for existing workers
Benefit adjustment: ‘indexation’
Discretionary Inflation-adjustment Inflation-adjustment for new retirees
Inflation-adjustment for new and existing retirees
Normal pension age 60/55 in most schemes Increase to reflect longer life expectancy
Start to increase in line with life expectancy
Increase in pension age to 65 (and then link to life expectancy)
Early pension age Various conditions Gradual increase to reflect longer life expectancy
Curtail 50–55 retirement window over a 10-year period; increase 55 early pension age with life expectancy
Gradual abolition of early retirement so that early age catches up with the normal age
Benefit adjustments for early retirement
Zero Actuarially neutral Phased increase 2–3–4–5–6% over a five-year period
Immediate use of 6% for all new retirees
Contribution rate 18% in private sector, and 22.5% in public sector
Labor-market policy should avoid further increases
29SPECIAL FOCUS 1 IRAN’S PENSION SYSTEM: THE NEED FOR REFORM
return than high-income individuals (for instance by
introducing minimum pensions), but progressivity
is not an inherent feature of the DB-PAYG system .
Another characteristic of the DB-PAYG system is
that the sustainable rate of return that the system
can pay decreases over time . The implication is that
new generations receive lower rates of return than
old generations . Thus, there is an implicit transfer
of resources from the young to the old . Even if the
system is designed with some degree of progressivity
within generations, high income members of the “old”
generation can still receive implicit transfers from low-
income members of the ‘‘young” generation .
In recent years, a large number of countries
worldwide have introduced cash transfers for the
elderly population . These programs—sometimes
referred to as social pensions—come in a wide
variety of shapes and sizes . The appropriate role of
these programs within the overall pension and social
protection system is an increasingly important policy
question that Iran could consider in their policy
discussions for pension system reform . While the
current contributory pension system is increasingly
receiving transfers from the Government, such
transfers are only benefitting those who are covered .
On the other hand, social pensions could benefit
either everybody (above a certain age) or, if well
designed, those who need it the most .
There are at least four scenarios that could
characterize the situation facing a policymaker
considering the role of social pensions (scenarios 2,
and 3 might be the most relevant for Iran, but other
scenarios might also have relevant lessons learnt):
• Scenario 1: the first case of social pensions is
one in which there is a well-established social
pension scheme that is seen as a major element
of the overall social protection system . This is
the case in a handful of countries ranging from
New Zealand to South Africa . Unlike Iran, both
of these countries made a choice early in their
history to rely on social pensions rather than
mandated contributory pensions . While this
path dependence does not preclude a shift
towards savings or insurance, it does reduce
the need for such a mandate . The challenge for
the policymaker in this context is to deal with the
tradeoff between sustainability and adequacy
as the population ages . In New Zealand for
instance, there has been an increase on
voluntary retirement savings to reduce the
burden of the increasing spending on social
pensions, and maintain or increase adequacy .
• Scenario 2: The second case is the one
of some higher income countries, where
social pensions are meant to supplement
a contributory pension scheme with high
coverage . It is designed to address gaps at the
margin—those individuals that have accrued
insufficient pensions due to short periods in
employment . In contrast to New Zealand’s
universal coverage for example, only 1 percent
of the elderly in the United States receive a
social pension .
• Scenario 3: The third case and most common
scenario is observed in the growing number of
developing countries opting for social pensions
due to frustration with stagnant coverage in
contributory schemes . This is the case in much
of Latin America and increasingly in Africa
and Asia where between 10 and 70 percent
of the labor force (and even smaller share of
the working age population) contribute to a
pension scheme .
• Scenario 4: Finally, a new group of countries
in the Europe and Central Asia (ECA) region
may be heading towards a greater role for
social pensions . In these countries, the shift
to a market economy means that for the
first time in decades, cohorts will soon be
reaching old age with little or no contributory
pension income . Moreover, their pay-as-you-
go financing models are collapsing in the face
of the dual challenge of aging and informality .
As a result, most pensioners receive the
minimum pension while large deficits must
be covered by the budget . When Georgia,
for instance, faced this situation in 2008, it
decided to give up the fiction of a contribution-
based pension system and became the first
country to convert a social insurance program
to a social pension .

30 IRAN ECONOMIC MONITOR: OIL-DRIVEN RECOVERY
The appropriate advice on the role of social
pensions must take into account these varied starting
points . In the case of Iran, when deciding whether
to introduce a social pension program, the following
questions should be asked:
• What are the tradeoffs? Given limited fiscal
space, will other social protection programs
receive less funding if budget is allocated to
social pensions?
• Are poverty rates higher among the elderly
population than other groups?
• To what extent do other safety net programs
already address the problem of poverty among
the elderly, especially if there is evidence that
the poor elderly co-reside?
• Could the social pension lead people to save
less for old age including fewer contributions
to mandated schemes?
• Could social pensions lead to higher
informality?
• What is the counterfactual for the overall
pension system? For example, would a social
pension allow Iran to have a smaller contributory
scheme and therefore, lower payroll taxes?
Another important suggestion on the topic
of redistribution would be to conduct appropriate
surveys to estimate the coverage gap and its causes .
The objective of this activity would be to identify
the specifics of the population groups that are not
covered by the system, including their geographic
and socioeconomic characteristics . At the end,
only on the basis of this information it is possible to
define specific activities to expand contributory and
noncontributory schemes .
It would also be a key activity to conduct a
review of the current social assistance programs for the
elderly-including estimates of costs, benefits provided,
number of beneficiaries, and their socioeconomic
characteristics . The review would assess management,
targeting, and monitoring mechanisms and would
present recommendations in terms of the need to
expand, eliminate, and or design additional programs .
The review would be recommended to include detailed
estimates of financing needs . This could also include
conducting a viability study for the implementation of
social pensions in Iran .
III. Consolidation of multiple schemes: towards integration of the pension system
Finally, another important policy consideration on
pension reform in Iran should be the integration of
current schemes . Around twenty countries worldwide
are currently in the process of considering the
integration of separate schemes . Particularly regarding
separate schemes for civil servants, and private sector
employees . These countries can be found in all
regions, and include such countries as Mexico, Cape
Verde, Djibouti, Bahrain, and Brazil . Others such as
Morocco are planning to merge separated schemes
for civil servants and employees of SOEs (state owned
enterprises) .
Given the growing fiscal burden of many civil
service pension schemes and the degree to which
they discourage labor mobility, compelling arguments
exist for having a single national scheme for both
the public and private sectors . Moreover, there is
no compelling public policy rationale for mandating
different levels of consumption smoothing over an
individual’s life cycle or for establishing different
retirement ages for public and private sector workers .
Consequently, a number of countries have introduced
reforms to integrate their civil service and national
pension schemes . Arguments for eliminating separate
pension schemes include:
• Dualism discourages labor mobility and
exacerbates unjustified differentials in
compensation between the public and private
sectors, and
• Dualism adds administrative costs because it
typically results in the duplication of services
already performed by the administrators of
national pension schemes .
If not complete integration, at a minimum,
it would be important for policy makers to create
mechanisms that provide easy portability of benefit
entitlements across the various schemes in Iran so
that workers are not penalized when moving between
31SPECIAL FOCUS 1 IRAN’S PENSION SYSTEM: THE NEED FOR REFORM
different sectors, particularly between the public and
private sectors .
Portability can be provided by establishing
procedures to value the accrued rights of workers who
elect to move between the public and private sectors
for instance, and to recognize and respect those
rights in their new pension scheme . Conceptually, the
process would involve the computation of the present
value of rights earned in one scheme as a result of
qualifying contributory service and then giving credit
for this service in the other scheme .
However, full integration is more often
recommended than portability of rights . Many countries
that have integrated pension schemes (particularly for
public and private sectors) have generally chosen to
exclude all current workers from the reform (leaving
them covered by the rules of the legacy pension
scheme), other countries have included all current
workers in the reform (sometimes with provisions to
partially or fully recognize their accrued rights), and a
few countries have given current workers a choice of
being included or excluded .
To conclude this chapter, international
experience shows clearly that there are no easy
solutions for public pension reform . A simple model
for pension reform should not be uniformly applied
to all countries . However, there are the mentioned
principles, based on international best practices that
can provide useful guidance to policy makers in Iran
as they struggle with crafting solutions which are
appropriate in light of the country’s culture, political
system, economy, and labor force structure . Together,
these principles should be carefully considered . The
fiscal, financial, welfare and behavioral implications
of potential reform options should also be carefully
considered, and quantified .

32 IRAN ECONOMIC MONITOR: OIL-DRIVEN RECOVERY
Annex 1. Pensions Glossary
This glossary provides practical definitions for key
terms used in the diagnostic assessment of pension
systems . It is based on the work of both the World
Bank and the OECD .
Accrual rate. The rate at which pension entitlement
is built up relative to earnings per year of service
in a defined-benefit scheme . For example,
one percent of the reference salary per year of
applicable service .
Accrued pension (benefit). The value of the pension
to a member at any point prior to or at retirement .
Active member. A pension plan member who is
making contributions (and/or on behalf of
whom contributions are being made) and is
accumulating assets or rights to a future pension .
Actuarial assumptions. Various estimates that an
actuary makes in formulating an actuarial
valuation . May include assumptions related to
changes in longevity, wage, inflation, returns on
assets, etc .
Annuity. A specified income stream payable at stated
intervals for a fixed or a contingent period, often for
the recipient’s life, in consideration of a stipulated
premium paid either in prior installment payments
or in a single payment . Within the category,
there are period certain annuities (payable for a
specified period that is fixed in advance of the
start of the annuity) and life annuities (annuities
which are contingent upon the survival of one or
more lives) . Within life annuities, there is a further
distinction between single life annuities, joint
life annuities, last survivor annuities and various
combinations of types of annuities .
Annuity factor. The net present value of a stream of
pension or annuity benefits .
Beneficiary. An individual who is entitled to a benefit
(including plan members and dependents) .
Benefit. Payment made to a pension fund member
(or dependents) after satisfaction of qualifying
conditions .
Commutation. A payout option given to a pension
plan member to replace future payments by an
immediate lump sum .
Commutation factors. Mathematical factors used to
determine the amount a pension needs to be
reduced in order to provide an associated lump
sum benefit .
Contribution base. The reference salary used to
calculate the contribution .
Contributory pension plan (scheme). A pension plan
where the employer or the members have to pay
into the scheme to receive pension benefits .
Contribution ceiling. A limit on the amount of earnings
subject to contributions .
Commutation. Exchange of part of the annuity
component of a pension for an immediate lump
sum payment generally calculated using actuarial
methods .
Defined benefit plan (scheme). A pension plan with
a guarantee by the sponsor, insurer or pension
agency that a benefit based on a prescribed
formula will be paid .
Defined contribution plan (scheme). A pension plan
in which the periodic contribution is prescribed
and the benefit depends on the contribution plus
a return . Such a return may be the investment
return on the individual’s accumulated schemes,
a declared rate of interest or a rate tied to a
defined index .
Demographic transition. Historical process of a major
change in the demographic structure of the
population of a country due to changing mortality
and fertility rates or immigration/emigration
patterns . Can include a transition for any reason,
for example the transition as fertility and mortality
rates decline, resulting in an increasing ratio of
older to younger persons .
Dependent. An individual who is financially dependent
on a member of a pension plan . Dependent is
often a legally defined term, typically including
spouse, children and other relatives which may
or may not be financially dependent on a plan
member .
Disability benefit. A benefit payable to a plan member
who meets the qualifying conditions, typically
which are certification of an inability to work for
medical reasons .
Discretionary increase. An increase in a pension
benefit not specified by the pension scheme rules .

33SPECIAL FOCUS 1 IRAN’S PENSION SYSTEM: THE NEED FOR REFORM
Early leaver. A person who leaves an occupational
pension scheme without receiving an immediate
benefit though is entitled to a benefit at a future
date .
Early retirement. Retirement before reaching the
pensionable age for receipt of full benefits often
with eligibility for an immediate pension, on a
reduced or unreduced basis .
Final salary scheme. A type of defined benefit formula
that uses the final salary at retirement to calculate
the pension benefit
Gratuity. A term used in some jurisdictions to mean
a benefit payable based on meeting some
qualifying conditions . Examples include old-age
and survivorship benefits for members who have
not satisfied vesting requirements in contributory
schemes .
Implicit pension debt (net). The value of outstanding
pension liabilities after subtracting pension
reserves .
Indexation (benefit indexation). Increases in benefits
by reference to an index (typically prices, wages
or some combination of both) .
Old-age dependency ratio. The ratio of older persons
to working-age individuals . For example, the
number of persons over 60 divided by the number
of persons aged 15–59 .
Pay-as-you-go. In its strictest sense, a method of
financing whereby current outlays on pension
benefits are paid out of current revenues from an
earmarked tax, often a payroll tax .
Pay-as-you-go assets. The present value of future
contributions minus pension rights accruing to
these contributions .
Pension coverage rate (active phase). The number
of workers actively contributing to a publicly
mandated contributory or retirement scheme
during a particular period, divided by the
estimated potential number of workers that could
or are mandated to contribute, e .g ., the labor force
or the working-age population . The same term
can be applied to coverage under occupational
plans as well .
Pension coverage rate (beneficiary phase). The
number of beneficiaries in receipt of old age
pension beneficiaries divided by the estimated
potential number of individuals above the eligibility
age .
Pension liabilities. Balance of the obligations of a
pension scheme accrued to current workers and
retirees at a point in time based on past service
and contributions .
Pension lump sum. A cash withdrawal from a pension
plan generally with all or part of the benefits paid
out in one payment .
Pension spending. Total spending on pension
benefits at the national level . Usually defined as
spending on old-age retirement, survivor, death,
and invalidity-disability benefits including both
contribution based and non-contributory pension
schemes .
Pensionable earnings. The portion of remuneration
on which pension benefits and contributions are
calculated .
Portability. The ability to transfer accrued pension
rights between pension plans .
Public sector pension scheme. An occupational
pension scheme for employees of a central or local
Government, statutory and other semi-state bodies .
Reference wage or earnings measure. The fund
member’s earnings that are used to calculate the
pension benefit in a defined benefit plan . This is
typically the earnings of the last few years prior to
retirement .
Replacement rate. The value of a pension as a
proportion of a worker’s wage during a base
period, such as the last year or two before
retirement or the entire lifetime average wage .
Can be used to describe this relationship for an
individual or the scheme membership .
Support ratio. The number of workers required to
support each pension beneficiary .
Survivorship benefit. Benefit provided to select
surviving beneficiaries associated with a member
who passes away during his or her working life or
retirement .
System dependency ratio. The ratio of persons
receiving pensions from a certain pension scheme
divided by the number of workers contributing to
the same scheme in the same period .
System maturation. The process by which a pension
system moves from being immature, with young

workers contributing to the system, but with few
benefits being paid out since the initial elderly
have not contributed and thus are not eligible for
benefits, to being mature, with the proportion of
elderly receiving pensions relatively equivalent to
their proportion of the population .
Target replacement rate. The targeted level of wage
replacement at retirement for an average wage
worker .
Valorization of earnings. A method of revaluing past
earnings during the reference period for benefit
determination under a defined-benefit scheme .
Reference earnings are adjusted using a factor
such as average covered wage growth in order
to compensate for changes in earnings over the
reference period .
Vesting period. The minimum amount of time required
to qualify for full and irrevocable ownership of
pension benefits .
Vested rights. Full and irrevocable pension rights .
35
SPECIAL FOCUS 2 TOWARDS WATER SECURITY IN IRAN: CHALLENGES AND OPPORTUNITIES
I n the world’s most water stressed25 region, Iran
stands out as one of the most water-vulnerable
countries. In absolute terms, Iran has more people
and more economic production located in areas with
high water withdrawals to availability ratios than any
country in the Middle East and North Africa. Over
90% of Iran’s population and GDP is located in areas
where water withdrawals are approaching or have
surpassed sustainable utilization and therefore where
actions are needed to ensure that water availability
and competition do not become a constraint to
future well-being and growth. Despite this situation,
water productivity in Iran is low. The great majority
of water use is in agriculture, and economic returns
on agricultural water in Iran are among the lowest in
the region. Urban water prices in Iran are among the
lowest in the world—failing to signal the value of water
and the need for water conservation, undermining the
strength and sustainability of water service providers,
and forcing the government to pay large subsidies for
service coverage, operations and maintenance costs.
As water becomes ever scarcer, the environment tends
to suffer most. Iran’s iconic lakes and wetlands are a
bellwether of this growing scarcity as each year they
are further diminished. Water crises, if left unmanaged,
can have significant economic as well as socio-
political costs. Despite Iran’s long and successful
history of managing water resources, old challenges
are becoming more urgent and new challenges are
arising. Addressing water challenges in Iran would
require building on ongoing policy reforms as well as
on national as well as sub-national analyses to develop
and prioritize context-specific interventions.
Iran’s Long Tradition in Water Resource Management
Iran has a strong tradition of water resource management, and has been historically successful in managing the resource under a
24 This note was prepared by Claudia Sadoff, Edoardo Borgomeo and Irene Rehberger Bescos based on secondary data analysis . Figures on exposure to water stress were provided by the World Resources Institute .
25 Water stress arises when water withdrawals for human, agricultural, and industrial uses are relatively high compared to the level of renewable water resources—that is, a high water-withdrawal-to-availability ratio .
24

36 IRAN ECONOMIC MONITOR: OIL-DRIVEN RECOVERY
highly variable and arid climate. More than 2500
years ago Persians developed qanats, a unique
groundwater management system used in desert
regions to abstract water from mother wells and
transfer it long distances to irrigate fields or supply
towns (Hassan, 2010) . Technical innovations were not
limited to qanats . Persians built aqueducts centuries
before the Romans, and developed canals, dams,
flood control and water transfer infrastructures before
most other nations . They also had a robust water
governance system with strong regulation, monitoring
and market mechanisms (Madani, 2014 & Madani, et al .
2016) . However, current symptoms of extreme scarcity
coupled with increasing demand, unsustainable water
use, and low water productivity among other factors, are
exacerbating Iran’s water challenges . The government
has recognized the need to address these issues and
has positioned water as a priority sector in the 6th Five
Year Development Plan (2016–2021) .
Symptoms of Extreme Water Scarcity
Iran’s exposure to water stress is much higher than world averages. Over 90% of Iran’s population and
GDP is located in areas where water withdrawals are
approaching or have surpassed sustainable utilization and
therefore where actions are needed to ensure that water
availability does not become a constraint to future well-
being and growth . In absolute terms, Iran has the highest
levels of economic production located in areas with high
water withdrawal to availability ratios in the Middle East
and North Africa . These estimates are based on spatial
analysis which only compares data on location of GDP
production with data on water withdrawals and surface
water availability . This only provides an assessment of
exposure to water stress, without quantifying the direct
impact of water stress on economic activities and people .
More work is needed to evaluate the impact of water
availability, variability, and quality on economic and social
processes throughout Iran .
The environmental symptoms of Iran’s water crisis range from drying lakes, rivers and wetlands to land subsidence and water contamination. In the west of the country, Lake
Urmia—the largest lake in the Middle East and one of
the world’s largest hypersaline lakes—has shrunk by
about 88% its size in the 1970s as a result of frequent
droughts and upstream water use, diversion, and
storage (Fathian et al ., 2014) . In the East, Lake Hamun
is also shrinking (Madani & Hipel, 2011) . In the center of
the country, the Zayandeh-Rud River dries up in the dry
season, putting pressure on aquatic ecosystems and
the Gavkhouni Wetland (Gohari et al,, 2014) . This trend
is replicated in several other water bodies throughout
the country, like the Parishan and the Shadegan lakes
and wetlands, despite the commitment to protect
them under the Ramsar Convention of 1971 .26 Land
26 The Convention on Wetlands of International Importance, called the Ramsar Convention, is the intergovernmental treaty that provides the framework for the conservation and wise use of wetlands and their resources .
FIGURE 19 • Share of GDP Produced and Population Living in Areas Where Water Withdrawals are Approaching or Have Surpassed Sustainable Resource Use
Iran
Share of population living in areas where waterwithdrawals are 40% or more of surface water availability
Share of GDP generated in areas where waterwithdrawals are 40% or more of surface water availability
World
94%
36%
94%
22%
Source: Estimates for Iran estimated by the World Bank. World averages were taken from Veolia Water and IFPRI 2011.Note: High or very high water stress imply that water withdrawals are 40 percent or more of surface water resources availability.

37SPECIAL FOCUS 2 TOWARDS WATER SECURITY IN IRAN: CHALLENGES AND OPPORTUNITIES
subsidence and sinkholes affecting large swaths of
the country are other symptoms of unsustainable
groundwater withdrawals . All these factors also lead
to frequent water shortages for agricultural, industrial,
and domestic users (Madani, 2014) .
Climate extremes still pose significant threats to populations and the economy. Iran’s
agricultural industry is extremely sensitive to hydro-
climatic extremes, especially drought . Estimates
suggest that even small deviations of 1 mm below
the historical rainfall average can cause around $90
million in economic losses (Madani et al ., 2016) .
Despite food security being one of the country’s
priorities, during drought periods large amounts
FIGURE 20 • GDP Produced in Areas Where Water Withdrawals are 40% or More of Surface Water Resources Availability, by Country and Economy, Middle East and North Africa, 2010
GDP generated in ares where water withdrawals are 40% or more of surface water availability ($ billion PPP 2010 USD)
JordanYemen
Iraq
Saudi Arabia
Algeria
SyriaTunisia
Morocco
Libya
Iran
IsraelKuwait
Oman
UAE
Lebanon
Qatar
0 100 200 300 400 500 600 700 800
More than 750 bn$ worth of GDP are generated in areas where water withdrawals are approaching or have surpassed sustainable resource use
Source: World Bank.Note: These numbers are estimated using spatial analysis comparing location of GDP with water withdrawals to freshwater availability ratio. GDP is measured in terms of purchasing power parity (PPP) and is in constant 2010 U.S. dollars.
FIGURE 21 • Reduction in the Area of Lake Urmia (88% in the Last Three Decades) Over the Past Three Decades as a Result of Intensive Upstream Abstraction
1972 1989 2006 2014
Source: Agha Kouchak et al., (2015).

38 IRAN ECONOMIC MONITOR: OIL-DRIVEN RECOVERY
of food needs to be imported . For instance, during
the 1999–2001 drought, Iran imported close to 80%
of its domestic wheat supply, becoming one of the
world largest wheat importers at the time (Faramarzi,
2009) . Unmanaged impacts of droughts can also
compromise livelihoods in rural areas, leading to rural-
urban migration and ensuing social development
issues in urban centres (Sadoff et al ., 2017) . At the
other end of the hydrological spectrum, Iran is also
very vulnerable to floods . On average, floods have
killed more than 130 people per year while affecting
about 11 million people in the last two decades of the
twentieth century (Madani et al ., 2016) . The annual
estimated economic impact of floods due to property
damage alone is about 0 .5% of GDP (World Bank,
2017) . This does not include the indirect economic
damage inflicted by floods such as supply chain
interruptions . High spatial variability of climatic
conditions also means that water-related challenges
vary across the country, adding a layer of complexity
to water resources planning and management .
Drivers of a Potential Water Crisis
In the last fifty years the population of Iran has increased fourfold, adding pressure over the water resources. The population of Iran has increased
from below 10 million at the start of the nineteenth
century to 79 million people in 2015 (Seyf, 2009; World
Bank, 2015) . Similarly, urban population has increased
from 7 .3 million to 58 million over the same time period .
Nowadays, 73 .5% of Iran’s population lives in urban
areas (World Bank, 2015) . Eight Iranian cities have
a population greater than 1 million people (Madani,
2014) . This translates into an increasing demand for
potable water and water for food .
Unsustainable water use is one of the key drivers of a potential water crisis. Over 25%
of water use in Iran is unsustainable . This means
that 25% of the total water that is withdrawn from
aquifers, rivers and lakes exceeds the amount
that can be replenished by the hydrological cycle .
Iran is currently among the countries with highest
groundwater depletion rates in the world (Döll et
al ., 2014) . It is estimated that groundwater supplies
55% of the total water demand (Madani et al ., 2016) .
This situation is leading to groundwater depletion
and irreversible damage to aquatic ecosystems and
surface water bodies—for instance, the desiccation
of Lake Urmia . Aggressive groundwater withdrawals
have also resulted in groundwater table declines, land
subsidence and water quality degradation .
Despite this impending water crisis, total water productivity in Iran is among the lowest in the region. Total water productivity is defined as
the economic output (GDP) per unit volume (m3) of
water withdrawn . The great majority of water use is
in agriculture, and economic returns on agricultural
water in Iran are extremely low relative to others
in the region . Increasing total water productivity is
challenging and requires carefully designed policies
including water conservation, switches to crop
that consume less water, and reallocation to more
economically productive sectors . Actual decisions on
improving water productivity would have to be based
on basin-scale water accounting and considerations
of the social, economic, and environmental value
of water, and associated distributional impacts on
communities and households within the basin .
In an effort to diversify the economy and improve national food security, the government has supported the agricultural sector through water and energy subsidies. Although this policy
was deemed necessary during the Iran-Iraq war,
the agricultural sector consumes 92 .8% of the total
water use, while providing only 23% of the jobs,
and contributing 13% to Iran’s GDP (Madani, 2014) .
Low irrigation efficiency (less than 32%) partly due
to water and energy subsidies, cropping patterns
respondent to traditional farming rather than to water
availability, and guaranteed crop purchase prices
make the agricultural sector one of the biggest
contributors to Iran’s water crisis . Large subsidies for
energy consumption in the agricultural sector make
deep groundwater pumping and relocation of wells
economically possible, contributing to large scale
groundwater depletion . Although some measures,
such as raising energy prices and expanding
the groundwater monitoring network to control
abstractions have been established, agriculture
water use trends remain unchanged (Madani, 2014) .

39SPECIAL FOCUS 2 TOWARDS WATER SECURITY IN IRAN: CHALLENGES AND OPPORTUNITIES
Iran also has some of the lowest municipal water tariffs in the Middle East region and in the world. Water bills in Tehran are ten times lower than
in Abu Dhabi and twenty times lower than in London .
Failure to properly price water services promotes
excessive water use and undermines the financial
sustainability of the water sector . Cost recovery is
essential to ensure long-term sustainability of water
services and appropriate levels of investment in the
operation and maintenance of water distribution
systems, not just in infrastructure but also in training of
staff . Lack of financial sustainability of water services
can also severely undermine utilities’ capacity to treat
wastewater, leading to deteriorating water quality and
degradation of freshwater ecosystems .
Although most Iranians have access to water supply and sanitation, quality of access and levels of service vary within the country. Over ninety six percent of Iranians have access
to improved drinking water sources, and ninety
percent have access to improved sanitation, which
is in line with other countries in the region (WHO/
UNICEF, 2015) . However, non-point pollution
sources, mainly from the agricultural sector, lead
to high levels of nitrate that deteriorates tap water
quality . Moreover, lack of treatment and appropriate
sewerage networks mean that freshwater quality is
low (Madani, 2014) .
Institutional fragmentation undermines efforts to coordinate and innovate. The lack of
a robust legal framework, weak enforcement, and
inadequate institutional coordination all inhibit efforts
towards integrated water resources management
and slow the adoption of recent innovations such
as wastewater treatment and reuse technologies
that could help the country meet its increasing water
demands . Weak water governance, for instance in the
form of poorly defined and enforced property rights
over land and water, makes it difficult to regulate water
use . In the case of agricultural water management,
fragmented and financially constrained institutions
make it more challenging to improve the productivity
of the irrigated agriculture sector .
The water sector’s operations are highly constrained by government policy. Maintaining low
regulated water rates for social purposes has adverse
FIGURE 22 • Total Water Productivity, Selected Middle Eastern and North African Countries and Economies, 2010
Total water productivity (US$/m3)
Iraq
Saudi ArabiaAlgeriaTunisia
MoroccoLibya
Iran
IsraelKuwait
OmanUAE
LebanonJordan
0 20 40 60 80 100 120 140 160
MENA data Average productivity in high income countries Average productivity in middle income countries
Iran is one of the least water productive in the Middle East and North Africa
Source: Data estimated as the ratio of constant 2010 $ GDP (from World Bank GDP estimates) over cubic meter of total water withdrawals (from FAO AQUASTAT).Note: Water withdrawals also include water withdrawn from nonconventional supply sources such as desalination and wastewater reuse. Given the different economic structure of each country, these indicators should be used carefully, taking into account a country’s sectorial activities and natural resource endowments.

40 IRAN ECONOMIC MONITOR: OIL-DRIVEN RECOVERY
impacts on the financial performance of urban water
and wastewater companies . Indirect subsidies in the
form of capital investment and of periodic government
write-offs of unpaid accounts receivable further
distort management decisions and lead water service
providers further away from self-sufficiency .
In Iran’s large and growing urban centers over half of the population is not connected to sewerage systems, and only 25 percent of Iran’s wastewater is treated. More than 70% of Iran’s
population is urban and the increased migration
to urban centers means that this number is set
to increase . This poses significant challenges for
water and wastewater distribution systems . Despite
recent improvements, less than half of Iran’s urban
population is connected to a municipal wastewater
collection system, and not all of the water that is
collected is then treated . This means that increasing
volumes of wastewater are being generated and
75% of this wastewater is being returned untreated
into the environment . This creates health hazards for
people and ecosystems, and also wastes a significant
potential water resource that could be treated,
recycled and reused for urban landscapes, industry
or groundwater recharge .
Iran’s geographical position, at the crossroads of a number of shared, freshwater
bodies, gives it a critical role in regional water security and broader ecosystem sustainability. Iran shares eleven major aquifers and eight major river
basins with neighboring countries, all of whom face
water resource management challenges . Cooperative
management of these transboundary water resources
would therefore be essential, as recognized in the
General Decrees on the Environment . Current efforts
to develop win-win approaches amongst neighboring
countries would need to be strengthened, including
mechanisms for information sharing, resource monitoring
and management of water quality and quantity .
Looking Forward
Iran’s long tradition of water management and the recent General Decrees on the Environment provide a platform to address Iran’s current and future water challenges. The General
Decrees’ focus on monitoring water pollution and
climatic changes, paired with management of
ongoing climatic variability provides a clear line of
sight to promote source protection and adaptation
to environmental change . The strong emphasis on
protecting groundwater quantity and quality is also
a clear indication of the importance of this resource
FIGURE 23 • Combined Water and Wastewater Bill per Cubic Meter, Selected Cities in the World
Combined water and wastewater bill per m3 (2016 USD)
Tehran
Doha
Rabat
Distrito Federal (Mexico city)
Kuwait city
Barcelona
London
Tel Aviv
Dubai
Abu Dhabi
Muscat
0 0.5 1.0 1.5 2.0 2.5 3.0 3.5 4.0
Iran has some of the lowest municipal water tariffs in the world
Source: Global Water Intelligence Global Water Tariff Survey 2016.

41SPECIAL FOCUS 2 TOWARDS WATER SECURITY IN IRAN: CHALLENGES AND OPPORTUNITIES
Incentives can be targeted to local development
needs and situations to ensure that policies are
tailored to specific realities, as demonstrated by recent
government policies to support rice production in the
Northern provinces of Gilan and Mazandaran or to
promote conjunctive use of surface and groundwater
resources to halt groundwater depletion .
Enhancing transboundary and inter-provincial coordination, cooperation, and exchange. Given the very large share of Iran’s
waters that are transboundary, more coordinated
management of these resources would be important—
particularly as climate change makes water availability
less predictable . Similarly, inter provincial coordination
is also key to achieve robust and sound integrated
water resource management within the country .
Establishing effective water balances and models which integrate socio-economic considerations at the basin and municipal levels to manage trade-offs and enhance investment efficiency. As a country with both overall, but
also highly variable water stress, facing increasing
challenges from economic and population growth
and the impacts of climate change, important trade-
offs would need to be made in terms of inter-sectoral
priorities and allocations . These decisions have major
implications for the sectors concerned, as well as the
development of policies which align incentives and
major investments in infrastructure such as inter-basin
transfer facilities, desalination and water recycling .
The implications and partial irreversibility of these
measures highlights the need to support water sector
decision making for major basins as well as for cities,
with integrated water resource and socio-economic
assessments and modeling .
Improving the collection, processing and reporting of water-related information to guide water policies and investments. Information
provides the foundation for sound decision-making
for water planning and management . This information
is gathered from multiple sources including long-term
continuous observations of hydrological variables, local
knowledge, and commissioned studies . Information is
27 Estimated using the International Food Policy Research Institute IMPACT model (World Bank, 2017) .
for the country’s long-term development and well-
being . The promotion of environmental diplomacy
in the Decree provides an encouraging sign of
Iran’s willingness to manage its transboundary water
resources in a cooperative way . A range of actions that
could contribute to mitigate Iran’s water challenges
are briefly discussed in the following paragraphs .
More work needs to be carried out to prioritize these
actions and tailor them to Iran’s highly heterogeneous
water reality .
Modernizing irrigation systems to reduce losses could lead to an estimated $3 billion welfare gains annually without increasing the total irrigated area. If all the available water
allocated to agriculture in Iran could be stored and
delivered efficiently to irrigated agriculture, agricultural
production would increase and variability in production
of some commodities would decrease . Under this
scenario, total irrigated area is fixed and groundwater
withdrawals are limited to control depletion . What
changes is the water storage and delivery capacity
of the irrigation systems . This could lead to an
estimated $3 billion welfare gains annually .27 These
gains come from standard measures of producer’s
surplus (improved water services and availability) and
consumers’ surplus (reduced food prices) . In addition,
half the gains would be in the form of spillover effects
to the nonagricultural sectors . Recent investments
in storage infrastructure in the Ilam and Khuzestan
provinces have shown the benefits of improved
infrastructure on irrigation system performance .
Strengthening incentives and continuing subsidy reforms can significantly curb unsustainable water use by consumers. Iran’s 2010
energy subsidy reform shows that removing subsidies
is possible and that well-designed policies can shape
consumers’ behavior . This and other experiences show
that effective pricing and subsidies removal policies
share common features such as well-designed tariff
structures which balance cost recovery and economic
efficiency needs with equity and affordability . Well-
designed pricing and subsidy removal policies also
include accurate targeting of price changes, for instance
by targeting higher consumption users, and public
campaigns explaining the reason for pricing changes
and the availability of compensatory mechanisms .

42 IRAN ECONOMIC MONITOR: OIL-DRIVEN RECOVERY
a shared asset that underpins any credible reform or
infrastructure project in the water sector . Information
systems are also a crucial element to forecast and
respond in time to water-related disasters, such as
floods and droughts . For information to be of relevance
to decision-making, it needs to be embedded within
appropriate institutions responsible for the collection,
organization, and processing of information .
References
AghaKouchak, A, et al . (2015) Aral Sea syndrome
desiccates Lake Urmia: Call for Action . Journal of
Great Lakes Research 41 (1), 307–311 .
Döll, P, Mueller Schmied, H, Schuh, C, Portmann, F T,
& Eicker, A, (2014) Global-scale assessment of
groundwater depletion and related groundwater
abstractions: Combining hydrological modeling
with information from well observations and
GRACE satellites . Water Resources Research,
50(7), 5698–5720
Faramarzi, M, Abbaspour, K C, Schulin, R, & Yang, H,
(2009) Modelling blue and green water resources
availability in Iran . Hydrological Processes, 23(3),
486 .
Fathian, F, Morid S & Kahya E, (2014) Identification
of trends in hydrological and climatic variables in
Urmia Lake basin, Iran . Theor Appl Climatol:1–22
doi:10 .1007/s00704–014–1120–4 .
Hassan, F A, (2010) Water History for our times .
UNESCO International Hydrological Programme .
Madani, K . (2014) Water Management in Iran:
what is causing the looming crisis? Journal of
Environmental Studies and Sciences (4), 315–328 .
Madani, K, AghaKouchak, A & A, Mirchi (2016) Iran’s
Socioeconomic Drought: Challenges of a Water-
Bankrupt Nation, Iranian Studies, 49:6, 997–1016 .
Sadoff, C W, E, Borgomeo & D, de Waal (2017)
Turbulent Waters: Pursuing Water Security in
Fragile Contexts . Washington DC: World Bank .
Seyf, A, (2009) Population and agricultural
development in Iran, 1800–1906 . Middle Eastern
Studies, 45(3), 447–460 .
Veolia Water and IFPRI (International Food Policy
Research Institute) (2011) Sustaining Growth via
Water Productivity: 2030/2050 Scenarios . http://
growingblue .com/wp-content/uploads/2011/05/
IFPRI_VEOLIA_STUDY_2011 .pdf .
WHO/UNICEF Joint Monitoring Programme for
Water Supply and Sanitation (2015) Progress on
sanitation and drinking water – 2015 update and
MDG assessment . WHO, Geneva .
World Bank (2017) Beyond Scarcity: Water Security
in the Middle East and North Africa . World Bank:
Washington D .C .


1818 H Street, NWWashington, DC 20433