ir-4 laboratory guidance documentir4.rutgers.edu/other/advisories/ir-4 laboratory guidance_final...
TRANSCRIPT


Version 1.1 02/2014 Page 2 of 11
IR-4 Laboratory Guidance Document
Introduction This Guidance Document has been developed to provide consistency and to facilitate communication among the IR-4 Laboratory Research Directors (LRDs), Regional Directors (RDs, management), Quality Assurance (QA), and the IR-4 Study Directors (SDs) and will serve as a resource for all facets of IR-4. It indicates how IR-4 operates, by designating responsibilities and providing guidelines for implementation of procedures, to assure that all studies conducted by IR-4 meet EPA GLP regulations. Once this document is approved by the IR-4 PMC, it becomes an official policy document for the conduct of studies in the IR-4 laboratories. The main areas of attention in this document include personnel responsibilities in relation to IR-4 residue work, definitions and a significant section regarding lab operations with emphasis on sample handling and storage; sample processing; analytical method validation; sample analysis and extract storage; storage stability studies; communication with the study director; and the Analytical Summary Report. This document will provide guidance for contract labs and will be used as a training tool with regard to IR-4 analytical work. Please note: paragraphs formatted with italics are taken directly from the “Operational Handbook of IR-4” Version 7.0
Original Committee members: Daniel Kunkel, IR-4 Headquarters, Associate Director (Chair) Debbie Carpenter, IR-4 Headquarters Tom Hendricks, USDA-ARS, Tifton, GA Matt Hengel, Western Regional Laboratory Coordinator, University of California Wayne Jiang, North Central Regional Laboratory Coordinator, Michigan State University Christopher Lam, North Eastern Regional Laboratory Coordinator, Cornell Jim McFarland, Western Region QA Coordinator, University of California Marion Miller, Western Region Director, University of California Jau Yoh, Southern Regional Laboratory Coordinator, University of Florida Review Conducted by Analytical Chemists Advisory Committee (AC-AC): Debbie Carpenter, IR-4 Headquarters Tom Hendricks, USDA-ARS, Tifton, GA Matt Hengel, Western Regional Laboratory Coordinator, University of California Todd Wixson, USDA-ARS, Yakima, WA Sue Erhardt, North Central Regional Laboratory Coordinator, Michigan State University Wlodzimierz (Wlodek) Borejsza-Wysocki, Southern Regional Laboratory Coordinator, University of Florida Sherita Normington, Western Region QA Officer, University of California David Soderlund, North Eastern Region Director, Cornell

Version 1.1 02/2014 Page 3 of 11
Table of Contents Introduction ..................................................................................................................................... 2 Responsibilities ................................................................................................................................ 4
IR-4 Headquarters (HQ) Staff ............................................................................................................... 4 Regional Research Programs ............................................................................................................... 4 ARS Programs Research Personnel ...................................................................................................... 4
Definitions ....................................................................................................................................... 4 GLP Definitions ........................................................................................................................... 4
Archives ................................................................................................................................................. 4 Protocol ................................................................................................................................................. 4 Quality Assurance Unit ......................................................................................................................... 5 Sponsor ................................................................................................................................................. 5 Study ...................................................................................................................................................... 5 Study Director ....................................................................................................................................... 5 Testing Facility ..................................................................................................................................... 5
IR-4 Definitions ........................................................................................................................... 5 Laboratory Research Director .............................................................................................................. 5 Quality Assurance Coordinator and Officers ........................................................................................ 5 Regional Laboratory Coordinator ........................................................................................................ 6
References ....................................................................................................................................... 6 Lab Operations ................................................................................................................................ 6
Standard Operating Procedures ................................................................................................... 6 Standards and Solutions ............................................................................................................... 6
Obtaining Standards ................................................................................................................ 6 Characterization of Substances ............................................................................................... 6 Reagents and Solutions ........................................................................................................... 7
Sample Receipt, Processing and Storage ..................................................................................... 7 Sample Receipt ........................................................................................................................ 7 Sample Processing: ................................................................................................................. 8 Storage: ................................................................................................................................... 8
Working Method, Validation and Modifications: ....................................................................... 8 Other considerations ................................................................................................................ 8 Extraction ................................................................................................................................ 8 Clean-up steps ......................................................................................................................... 9 Detector ................................................................................................................................... 9 Working method approval and validation data ....................................................................... 9
Sample Analysis and Extracts ..................................................................................................... 9 Sample Analysis ...................................................................................................................... 9 Extracts .................................................................................................................................. 10
Storage Stability ........................................................................................................................ 10 Communication of Results with SD .......................................................................................... 10
Response Needed to Proceed: ............................................................................................... 10 Routine Results: .................................................................................................................... 10
ASR ................................................................................................................................................ 11 Training .......................................................................................................................................... 11 Contract/Company Labs ................................................................................................................ 11 Guideline Document review: ......................................................................................................... 11 Explanation of Attachments: .......................................................................................................... 11 Attachment 1: Sample processing Document. Attachment 2: Sample Analytical Summary Report Attachment 3: Checklist for Review of Analytical Summary Reports

Version 1.1 02/2014 Page 4 of 11
Responsibilities IR-4 Headquarters (HQ) Staff coordinate the program among the regions and USDA-ARS, and provide functions including:
1) GLP oversight including Study Director and Quality Assurance. 2) Prepare research protocols. 3) Review, analyze, and archive raw data. 4) Prepare, review, and submit petitions to establish and maintain tolerances. 5) Interact with EPA and cooperating registrants. 6) Maintain a database to track projects. 7) Oversee Manufacturer and Contract Laboratories
The HQ office is administered by an Executive Director (Management Representative). Regional Research Programs. Each Regional Program is administered by a Regional Director who has overall responsibility for GLP compliance at the regional level. The Regional Director has Regional Laboratory, Field and QA Coordinators who work with state scientists within their region and provide them with research support.
1) Regional Laboratory Coordinator (RLC): Oversees and coordinates regional laboratories and their satellite laboratories, and some contract laboratories, conduct analyses to determine test substance residues on crop samples.
2) Regional QA Coordinator: Monitors the field and laboratory operations in each region to assure that they are meeting GLP requirements.
ARS Programs Research Personnel The ARS Program is administered by an ARS National IR-4 Director who has overall responsibility for GLP compliance at the ARS Facilities. The ARS National IR-4 Director supports USDA-ARS residue laboratories and scientists (Laboratory Research Directors) that conduct analyses and determine test substance residues on crop samples. QA for these facilities is provided by other IR-4 QA and contract QA.
Definitions
GLP Definitions Archives: All raw data developed by the IR-4 program will be archived as required under 40 CFR 160.190. Archivists will be designated by the Executive Director for IR-4 HQ and an index of archived laboratory data from the RLCs will be sent periodically to the HQ Archivist. Protocol: The regulations require an approved written protocol for each study. The SD is responsible for the development of the protocol, which is prepared in accordance with the information as outlined under 40 CFR 160.120. Protocols will contain both the field and laboratory phases of each study and detail the proposed sites for the research. The regulations require that the protocol be approved by the SD and sponsor by signing and dating. The Project Management Committee (PMC, sponsor) delegates approval of the protocols to the Executive Director or his/her designee.
Version 1.1 02/2014 Page 5 of 11
Quality Assurance Unit: The QA unit will conduct facility inspections at all IR-4 test locations and conduct critical phase inspections of each study at intervals adequate to ensure study integrity. All QA audits from facility and critical phase inspections will be provided to the appropriate SD and Management (IR-4 Executive Director) for review, appropriate response and corrective action, and signature. Those reports that require action may be forwarded to the Regional Directors as necessary. The HQ QA Manager will maintain a copy of the Master Schedule for all IR-4 studies. Sponsor: The sponsor is the person who initiates and provides financial or other support for a study. The IR-4 Project Management Committee acts as sponsor for IR-4 studies and has designated the Executive Director as sponsor for the purposes of GLP. The Executive Director may delegate individuals to act as Sponsor Representative to sign the protocol, etc. Study: An experiment conducted at the IR-4 Research Facilities (or contract facilities) to determine the magnitude of the residue (test substance) in or on a given commodity to provide the sponsor with residue chemistry data to support a pesticide tolerance. Study Director: The SD represents the single point of study control, and is responsible for the overall conduct of the study. The accountability provided by a single SD (who plans, oversees, and controls the interpretation, analysis, documentation, and reporting of the results) is one of the most important aspects of the GLP standards. For IR-4 studies, the SD oversees the research of FRD and LRDs who are responsible for carrying out the field and analytical duties. The RLCs, RFCs, and ARS National IR-4 Director assist the SDs in meeting their responsibilities. Testing Facility: IR-4 HQ serves as the testing facility for the purposes of GLP. The Executive Director will represent testing facility management, and the SDs and QAU will report to the Executive Director.
IR-4 Definitions Laboratory Research Director: A person with sufficient training and experience to be able to conduct the laboratory analysis and appoint adequate personnel to assure this function will be carried out for all studies. The LRD will report all deviations from the protocol or the SOPs to the SD. Quality Assurance Coordinator (QAC) and Officers (QAO): These persons, designated by the Regional Director or Executive Director, report the findings of their audits to the SD, to the Executive Director (Testing Facility Management) and to other research associated personnel. The QAC/QAO will monitor studies, including facilities, equipment, personnel, methods, practices, records and controls, for compliance with GLP. The QAU reviews the final report to assure that it accurately reflects the raw data of the study and prepares and signs a Quality Assurance Statement noting dates the inspections and findings were reported to the SD and SD Management.

Version 1.1 02/2014 Page 6 of 11
Regional Laboratory Coordinator: This person assigns laboratory-testing sites within his/her region for residue analyses conducted by the regional laboratory, its satellites, and private contract laboratories.
References Good science is key to successfully completing the analytical portion of any study. However, it is just as important for SDs and LRDs to be aware of the impact of the following references. These references provide a framework for all IR-4 study related work. Operational Handbook of IR-4 (current version). Good Laboratory Practice Standards, 40 CRF Part 160, August 17, 1989. Food and Feed Crops of the United States, Markle et al. 1998. OPPTS 860 Residue Chemistry Test Guidelines including:
OPPTS 860.1000, Background OPPTS 860.1340, Residue Analytical Method OPPTS 860.1380, Storage Stability Data OPPTS 860.1500, Crop Field Trials OPPTS 860.1520, Processed Food/Feed
Lab Operations Standard Operating Procedures: The development of a comprehensive set of SOPs that address the development, monitoring, and reporting of data from specific study phases conducted at the research test site is the responsibility of each Laboratory Research Director at that site. RLCs and the ARS National IR-4 Director and/or ARS Facility Research Leader, or designee provide guidance for and approval of SOPs. This guidance document will take precedence over SOPs and they may therefore need modification after this document is put in place.
Standards and Solutions Obtaining Standards: IR-4s current policy is that all reference standards must be characterized under GLP preferably before the analysis begins, but definitely before the study is completed (signed by the study director). Due in part to the large number of registrants IR-4 works with, obtaining GLP standards can be difficult. It is recommended that the LRD initiate discussions with the cooperating registrant. If standards cannot be acquired in sufficient time frame, then the LRD is directed to contact the SD or Registrations Manager at IR-4 HQ to seek assistance in obtaining standards. Purity value given on the Certificate of Analysis should be used for all calculations of the standard concentration. In the case where a non-GLP standard is required to complete the analytical phase of the project, IR-4 management, in concert with the SD, will be contacted for approval. Characterization of Substances: Analytical Reference Standards; Documentation of the characterization of the standards used in the analytical trial should be obtained by the Laboratory Research Director and a copy sent to the SD along with the Analytical Summary Report of the trial.

Version 1.1 02/2014 Page 7 of 11
Reagents and Solutions: The GLP standards require all reagents and solutions in the laboratory area to be labeled to indicate identity, titer or concentration, storage requirements, and expiration date. This requirement can be difficult to accomplish when there is a mix of IR-4 and non-IR-4 personnel utilizing the laboratory and sharing the chemicals or when the chemical is stable and has a long shelf life. The following is to be used as a guide for meeting the labeling requirement:
1) Identity can be the common name(s), CAS number or chemical name of the reagent or reagents in solution or mixture.
2) If the labeling of the original container provides the identity, concentration, storage requirements (if any) and expiration date or shelf life, no additional information is needed. If the labeling does not contain this information, than a supplemental label containing the missing information should be permanently attached to the container where it does not obscure other critical information.
3) All mixtures of chemicals prepared by laboratory personnel for use in IR-4 trials should have labels with the information as shown in 2 above.
4) Expiration dates for stable chemicals should be determined by the Laboratory Research Director following methods outlined in their SOPs.
5) Adequate precautions should be taken to avoid contamination of reagents and solutions so that purity of their content is preserved.
Sample Receipt, Processing and Storage Maintaining a representative sample and maintaining sample integrity are the important considerations to keep in mind during sample receipt storage, processing, and extraction/analysis (see Appendix 1.). Sample Receipt: Samples are generally received from either ACDS, Fed Ex or other carriers. For receipt of samples from an overnight air express carrier such as FedEx, it is critical that the lab know a shipment is in transit. If the shipment is not received as expected, laboratory personnel will follow-up to track the shipment. When samples are received, laboratory personnel check the condition of the samples; verify receipt of the correct samples by checking sample identification and matrices against the shipping papers. Unique laboratory numbers are assigned and recorded with cross reference to field samples IDs. Shipping forms (8B) received with the samples may be used to record the cross reference or custom forms may be used. At a minimum, custom forms must contain the same information required on the FDB forms, and must show that protocol conditions have been met (for example, acknowledging that forms 8B and 8C were shipped with the samples). The SD, RFC, and FRD are notified when samples are received, and any problems with the shipment are to be brought to their attention.

Version 1.1 02/2014 Page 8 of 11
Sample Processing: For information regarding sample preparation, size and providing homogeneous representative samples see Attachment 1. Great care is taken in the field to collect samples from all areas of the plot, so that the sample is representative of the whole field. When processing the samples, the total sample must be processed, and thoroughly mixed. If this is not possible, guidance from the Study Director and/or Registration Manager must be sought. Sample integrity is generally maintained by processing samples with dry ice. The study analytical data must document how representative samples were prepared.
Storage: Storage of samples is in accordance with the protocol requirements and SOP’s. To prepare for the loss of power or a freezer failure, consideration should be given to the availability of backup freezers and dry ice, generators (power backup) and spare parts. Temperature monitors, alarms, and established lines of notification are methods for providing the LRD with information on the temperature of the storage areas. For a longer term power outage, samples may need to be transported to another location to maintain sample integrity. These samples represent a significant investment and their integrity should be safeguarded accordingly. Working Method, Validation and Modifications: IR-4 methods are provided initially by the cooperating registrant (reference method). Given the number of commodities IR-4 works with, it is likely that each method will require some modification to work effectively. It should be noted that once these methods are modified for other commodities, these methods become the enforcement method for EPA. Significant changes to the initial working method may trigger an independent laboratory validation (ILV, OPPTS 860.1340), and thus are not encouraged unless needed to develop an adequate method for the specific matrix. The LRD should discuss “significant changes” with the SD and/or gatekeeper prior to making the change. Other considerations: Approval for significant changes to the reference method must be requested from the SD, HQ gatekeeper and registrant. Depending on the number of proposed changes and familiarity with the method, the laboratory should keep in mind that such changes will need to be dealt with well in advance of analysis, so that when the samples are received analysis may proceed without delay. Extraction: In most cases the extraction solvent and procedures must remain the same as the reference method. Sample weights and extraction volumes must stay proportional to the original method. However, in some cases, the ratio of extraction solvent to sample weight can be increased to improve extraction efficiency (e.g. extracting high Kow pesticides from high fat/oil content crops). Exchange of equipment can be made only when the equipment is basically carrying out the same function as noted in the method (for example tissuemizer and polytron). Other substitutions (from tissuemizer to shaker tray) should be discussed with the registrant providing the reference method and in consultation with the SD (and the gatekeeper1 at HQ).
1 The role of the Gatekeeper (Debbie Carpenter, Dan Kunkel or Bill Barney) is to provide greater consistency from IR-4 HQ by utilizing personnel with greater chemistry experience.

Version 1.1 02/2014 Page 9 of 11
Clean-up steps: EPA has noted that as long as the extraction procedures are the same, clean-up steps maybe added or removed. It should also be noted that removing an excessive number of steps may result in excessive wear and tear on the column and instrument. The impacts of removing clean-up steps from the method, such as matrix enhancement effects, must be evaluated as chromatography must be clean and sharp. Modifications should be discussed with the SD, “IR-4 Gatekeeper2” as well as the registrant so they can share their experiences. Chemist should also consider cost and time relating to removal of cited clean-up steps. Detector: Using LC-MS/MS has generally become the norm and essentially all of the IR-4 laboratories have at least one instrument. It is likely that any new equipment purchases will be directed toward using this technology. Therefore, replacing the detectors noted in the reference method with LC-MS/MS should have minimal effect on the method while providing better quantitation and confirmation. Working method approval and validation data: Current minimum protocol requirements indicate that the LRD will send the SD the working method and recovery data from the method validation. If the recovery data are within 70 to 120% (reported as nearest whole number) then weathered sample analysis may proceed. However, it is expected that the SD take an active role in this process and acknowledge that the method and data are acceptable. If the recovery data are not within the 70 to 120% range, the SD must acknowledge that he/she is aware the data are out of range and if the data are acceptable. If the validation recoveries are within the 70 – 120% range it is at the discretion of the LRD to request SD approval prior to analysis of the field (weathered) samples in order to note SD responsibility. If study director approval is needed or requested, the study director should make every effort to respond within 2 working days. Recognizing that study directors have other responsibilities, including traveling, the lab will need to provide time for the study director to respond in these situations. For urgent needs, or situations where the SD is not able to respond within 2 working days, approval to proceed may be sought from the Gatekeeper2. However, the SD must provide approval when he/she becomes available.
Sample Analysis and Extracts Sample Analysis: As noted in the protocol, each analytical set will have at least one concurrent recovery sample. Typically the fortification levels will reflect the expected residues in the treated samples. In the case where no residues are expected, fortifications should be at the lowest level of method validation (LLMV). IR-4 laboratories agree that double injections for each weathered sample should be used. If there is a study with a large number of samples, the LRD may consider doing single injections: however, it should be noted that double injections provide a number of benefits such as instrument stability and detection of “bad injections” in real time, allowing the chemist to respond to situations more quickly and efficiently. LRDs will have the appropriate SOPs in place to define pass or fail criteria for poorly reproducing injections. 2 The role of the Gatekeeper (Debbie Carpenter, Dan Kunkel or Bill Barney) is to provide greater consistency from IR-4 HQ by utilizing personnel with greater chemistry experience.

Version 1.1 02/2014 Page 10 of 11
Laboratory personnel should be mindful when unusual results are obtained and notify the SD immediately. (Lab personnel may want to re-extract and re-analyze samples to confirm prior to notification of SD). Examples of unusual situations are samples that have no residues compared to other weathered (field samples) samples from treated plots, or decline samples where no residues are detected, samples from untreated control plots with residues or if residues from samples taken from the same treated plot have measurable residues and the values for each sample vary by a factor of 5X or more. Extracts: “Registrants are advised to routinely include the storage of extracts, unless their standard laboratory practice is to analyze extracts on the same day as they are obtained “(860.1380). Always run samples with concurrent recoveries to demonstrate extract stability. Storage Stability: IR-4 does not carry out guideline storage stability studies as outlined in 860.1380. Our purpose is to show the samples are stable under the storage conditions used. Currently, storage stability, with analysis of one time point is carried out for most studies. For many compounds, the registrant may have adequate storage stability data available. IR-4 is working with EPA and the manufacturer to determine this. IR-4 will transition to fewer storage stability, where possible. However, analysis at two time points is often included for compounds new to IR-4. The first time point will be when the method is validated (3 samples) and another after an appropriate storage period (another 3 samples). A minimum of nine samples will be spiked at 10x LLMV. If the samples cover 90% of the storage time (from sample date to extraction date), this is sufficient, as per the protocol. In some cases the SD may be able to waive the storage stability analysis. Documentation of the waiver by the SD is required. Communication of Results with SD:
Response Needed to Proceed:
There may be instances where the lab needs to communicate study related activities to the study director, and a response is needed to proceed. One example includes out of range recoveries. If the recovery data are not within the 70 to 120% range, the SD must acknowledge that he/she is aware the data are out of range, accepts the recoveries, and that the analysis may proceed. If study director approval is needed or requested, the study director should make every effort to respond within 2 working days. Recognizing that study directors have other responsibilities including traveling, the lab will need to provide time for the study director to respond in these situations. For urgent needs, or situations where the SD is not able to respond within 2 working days, approval to proceed may be sought from the gatekeepers, Debbie Carpenter, Dan Kunkel or Bill Barney. However, the SD must provide approval when he/she becomes available. Routine Results: The LRD (or designate) will provide routine updates to the SD (e.g. residue analysis spreadsheet, residue result summaries) on a regular basis, along with background information and assessment of the data. The lab will decide the frequency of updates, based on their own operations. At a minimum, it is expected that the residue results will be shared with the study director as soon as possible, once all samples for the study have been analyzed. Acknowledgment of their receipt from the study director is expected.

Version 1.1 02/2014 Page 11 of 11
Analytical Summary Report: a sample ASR is provided in Attachment 2.
Training. This document will be used as a training tool for new Laboratory Coordinators, IR-4 chemists, QA officers and Study Directors. Contract/Company Labs. This document may also be used as a tool to provide guidance for contract and company laboratories used by IR-4 for residue analysis. Guideline Document review: Target review is for every three years. Please note that significant material has been taken from the “Operational Handbook of IR-4” and updates to that document will affect this document as well. Explanation of Attachments: Attachment 1: Guidelines for the Preparation of Raw Agricultural Commodity Samples
For Residue Analysis This instructional guideline has been prepared to aid in insuring uniformity and consistency among IR-4 analytical facilities when preparing raw agricultural commodities (RAC) for Magnitude of the Residue determinations. The attachment provides information regarding sample preparation, size and providing homogeneous representative samples. Great care is taken in the field to collect samples from all areas of the plot, so that the sample is representative of the whole field and this guideline will help to insure that samples remain representative when processed in the IR-4 laboratories.
Attachment 2: Sample Analytical Summary Report.
This example report is provided to illustrate a typical IR-4 Analytical Summary Report and the critical elements that must be in a report. The tables etc have been updated to help aid final report preparation. Recently, EPA has begun to request that metabolite residues be expressed as parent equivalents, please refer to the protocol for specific reporting requirements. Note that residues from weathered samples are to be reported using a minimum of 2 significant figures. Also, it is imperative that all of the pages of the ASR be readable. For electronic copies of this example please go to IR-4 Laboratory Guidance Document
Attachment 3: Checklist for Review of Analytical Summary Reports
This checklist (version 1.1, 2/5/2013) is being provided as reference informaiton to assist in the internal quality evaluation of analytical data. The checklist can be used to identify and insure that appropriate information is included in the final reports submitted to EPA. The checklist identifies items which must be brought to the study director’s attention in order for the study director to carry out his/her responsibilities under GLP.

Attachment 1
Sample Processing Document

LABORATORY SAMPLE PROCESSING GUIDANCE DOCUMENT (v.4, 12/01/08) Page 1 of 14
GUIDELINES FOR THE PREPARATION OF RAW AGRICULTURAL COMMODITY SAMPLES FOR RESIDUE ANALYSIS
PURPOSE:
This instructional guideline has been prepared to aid in insuring uniformity and consistency among IR-4 analytical facilities when preparing raw agricultural commodities (RAC) for Magnitude of the Residue determinations.
This guideline contains general directions for: obtaining in a safe manner homogeneous RAC sub-samples with minimum risk of residue cross-contamination (“General Procedures” section A) processing guidelines for specific crop groupings with specific instructions on inspecting and what portion of the RAC is to be prepared for residue determination (“Guidelines for Determining Portion of RAC to be Analyzed" section B) uniform sample preparation and comminuting procedures (i.e., pulverizing/ reduce to powder) for whole and sub-sampled RACs ("Guidelines for Sample Preparation” section C)
Definitions of Terms Used in this Guideline: Raw Agricultural CommodityFresh fruits, whether or not they have been washed and colored or otherwise treated in their unpeeled natural form; vegetables in their raw or natural state, whether or not they have been stripped of their outer leaves, waxed, prepared into fresh green salads, etc.; grains, nuts, eggs, raw milk, meats, and similar agricultural produce. It does not include foods that have been processed, fabricated, or manufactured by cooking, freezing, dehydrating, or milling (40 CFR 180)
SampleThe amount of individual agricultural commodity units (e.g. specific number of fruits or tubers, a set weight of grain, etc.) randomly selected from a plot which may be composited for pesticide analysis (OPPTS 860.1500)
PROCEDURE:
A. General Guidelines Persons given responsibility for processing agricultural crops (Processor) will be fully trained in properly processing agricultural commodities and also in the safe use of processing equipment and cryogenic materials. Proper ventilation is mandatory when working with cryogenic materials such as liquid nitrogen and carbon dioxide. It is the responsibility of the Processor to immediately notify her/his immediate supervisor and/or the Laboratory Research Director or if unsafe working conditions exist.

LABORATORY SAMPLE PROCESSING GUIDANCE DOCUMENT (v.4, 12/01/08) Page 2 of 14
Processing equipment often operate at high revolutions to pulverize/powder the RAC. This equipment can be hazardous and should be routinely checked for proper operation before processing agricultural commodities.
The sample should not be brushed, stripped, trimmed, or washed except to the extent that these are commercial practices before shipment or to the extent allowable (see 40 CFR 180) or the Pesticide Assessment Manual (PAM). Details for cleaning or trimming specific crop types are outlined under "Guidelines for Determining Portion of RAC to be Analyzed" section B and Appendix 1. In each case, the protocol and Study Director will be consulted to clarify any potential problems prior to sample processing.
The total sample should be processed whenever feasible. If the sample size is too large to process, a representative sub-sample of each component part should be taken (e.g., 1/4 of each cantaloupe from the original residue sample bag for maceration). Sub-sampling of the component parts will be done in a manner to represent the residue distribution to be found on all surfaces of the whole vegetative part. Details for specific crop types are outlined under "Guidelines for Sample Preparation” section C. If sub-sampling must occur, due to large sample size or unit size, the Study Director will be consulted prior to sample processing.
The order in which samples are processed should be chosen to minimize the potential for residue cross-contamination. For each trial location, untreated samples should always be processed first. Treated samples with the lowest application rate and the longest pre-harvest interval (PHI) should follow. Samples with the highest application rate and the shortest PHI should be processed last. In addition, crop fractions should also be considered (e.g. nut meat fractions should be processed before hull fractions).
If cryogenic materials are required, the pulverized sample can quickly liquefy and separate at room temperature soon after processing. All attempts should be made to immediately transfer the sample to a properly labeled sampling bag and place in frozen storage.
Processing equipment should be thoroughly washed and rinsed with distilled water and acetone or methanol before attempting to process the next sample irrespective if the next sample is a replicate from the same treatment location or a replicated control sample.
B. Guidelines for Determining Portion of RAC to be Analyzed 40 CFR 180 specifies that the sample taken should be of the whole raw agricultural commodity (RAC) as it moves through interstate commerce. In certain cases, the portion to be analyzed for a residue tolerance may not represent the whole RAC. Instructions on what portion of the RAC should be analyzed are provided for nine individual food commodities (e.g., bananas) and crop group commodities (e.g., root vegetables) in this regulatory guideline. To fill this void, the FDA has provided additional guidance for RACs that fall under a more complete crop groupings list (see 40 CFR 180.34 (f)). The portion of the sample to be analyzed as described under PAM Volume 1 takes into

LABORATORY SAMPLE PROCESSING GUIDANCE DOCUMENT (v.4, 12/01/08) Page 3 of 14
account practical considerations of sample preparation. Appendix 1 on page 4 (Table 102-a: Portion of Raw Agricultural Commodity to be Analyzed for Pesticide Residues)provides a compilation of EPA regulations and FDA directions to be followed for RAC preparation. If sample processing procedures for a particular RAC are not specified underthe above crop grouping guidelines, or in the protocol, additional guidance from the Laboratory Research Director and IR-4 Study Director approval will be sought before preparing samples for residue determination.
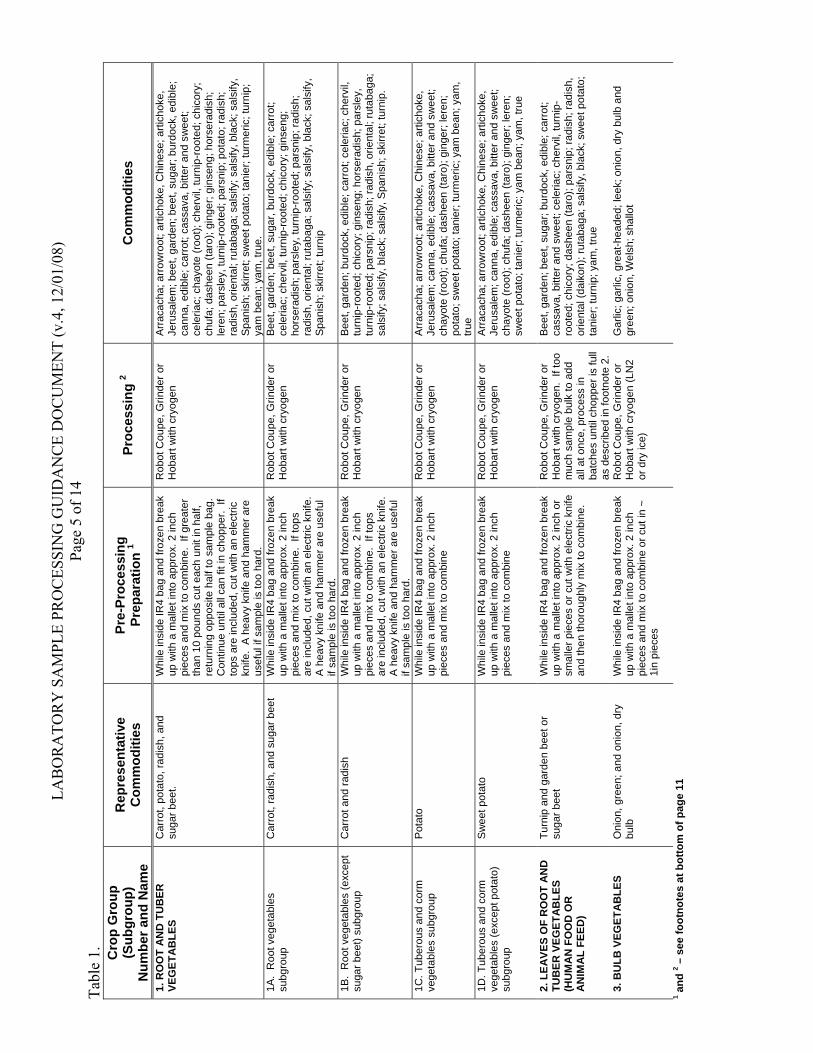
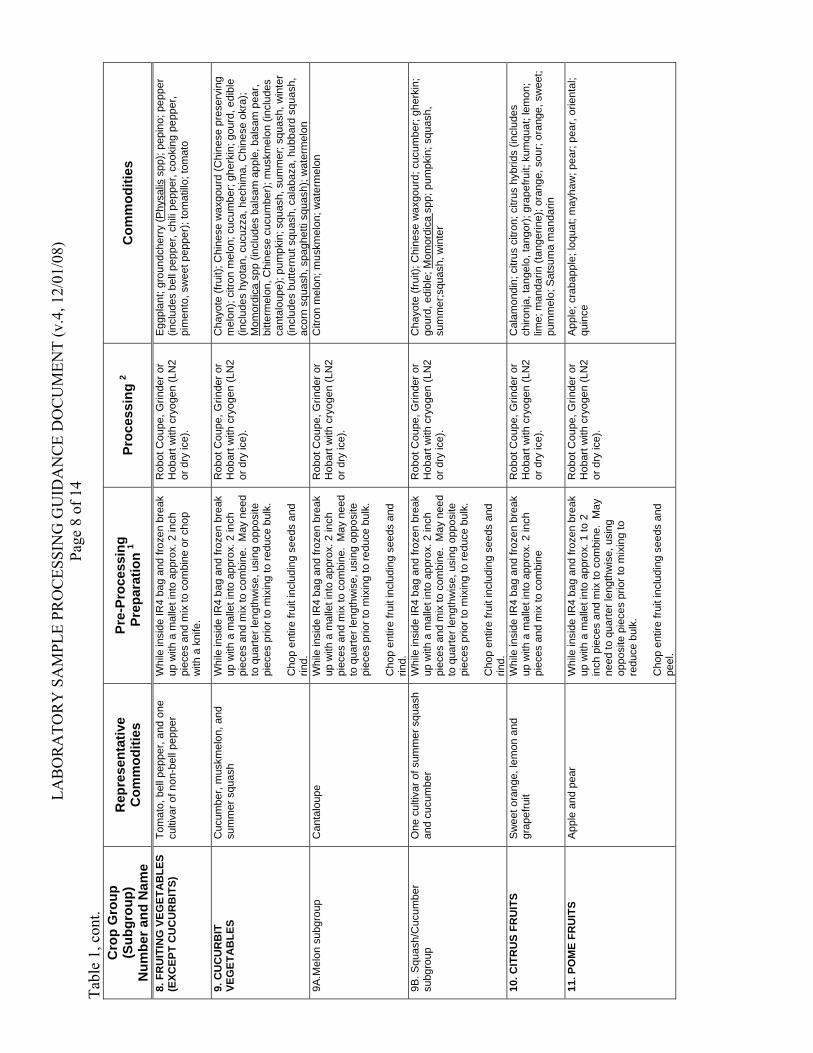
C. Guidelines for Sample Preparation The relatively small 2.5 to 100 gram laboratory sample taken from the whole RAC must represent the entire treated or control sample. Often these samples are bulky or can be comprised of a few large units or many smaller items. Whenever feasible, the total RAC sample should be pulverized and a homogeneous 2.5 to 100 gram sample taken to assure uniformity. Processing the entire sample may not always be feasible. Guidelines are provided below to aid in preparing representative residue determination samples from bulky, large unit and many small item RAC samples. In addition to the guidelines below, Table 1 offers examples of current processing practices of several commodities by IR-4/ARS facilities.
Bulky Samples: For more bulky samples [i.e., Alfalfa (green and dry), Barley, Field Corn (silage, stover), Sweet Corn (forage, husks), Clover Grass, Mint (hay), Oats (forage, fodder, or straw), Rice (plants), Rye, Sorghum (plants), Soybean (plants), Sugar Cane (green and/or dry) Tobacco (green, cured), and Wheat (forage, fodder, or straw)], acquiring the relatively small laboratory sample usually consists of two steps. First, the crop is chopped into smaller size fractions using either a chopping knife or scissors or through use of a large capacity chopper/mixer/grinder such as a spinning bowl or vertical chopper (ie: Hobart HCM-450, 84142, 84145, 84146, VCM-25, or equivalent). The chopped sample is then frozen to a brittle consistency using either liquid nitrogen (LN2)or dry ice. This frozen material is then processed to a fine consistency using a sample grinder (ie: Hobart 4822 or equivalent). Alternatively the samples may be first broken or chopped or into smaller size fractions as described above and then thoroughly processed with a cryogen (LN2 or dry ice) in a spinning bowl chopper/mixer, spinning blade food processor (ie: Robot-Coupe. RSI-6V or 10B) or other food grinder/chopper
Sub-sampling: Typically, sub-sampling of bulky or heavy units is performed in the field as directed by the Protocol. However, when there are physical limitations for the laboratory processing of the whole sample due to mass or sample size, sub-sampling of the component parts must be done in a manner that assures the residue distribution is representative of the whole vegetative part. Laboratory sub-sampling should only be performed by GLP trained staff and in consultation with the Study Director and or Registration Manager. If absolutely necessary, this practice must be limited to special circumstances and be conducted by properly trained staff that understands the importance of maintaining a fully representative sub-sample and the risks of possible residue/cross contamination and/or deterioration of the crop matrix. Some examples of representative sub-sampling in the laboratory include:
LABORATORY SAMPLE PROCESSING GUIDANCE DOCUMENT (v.4, 12/01/08) Page 4 of 14
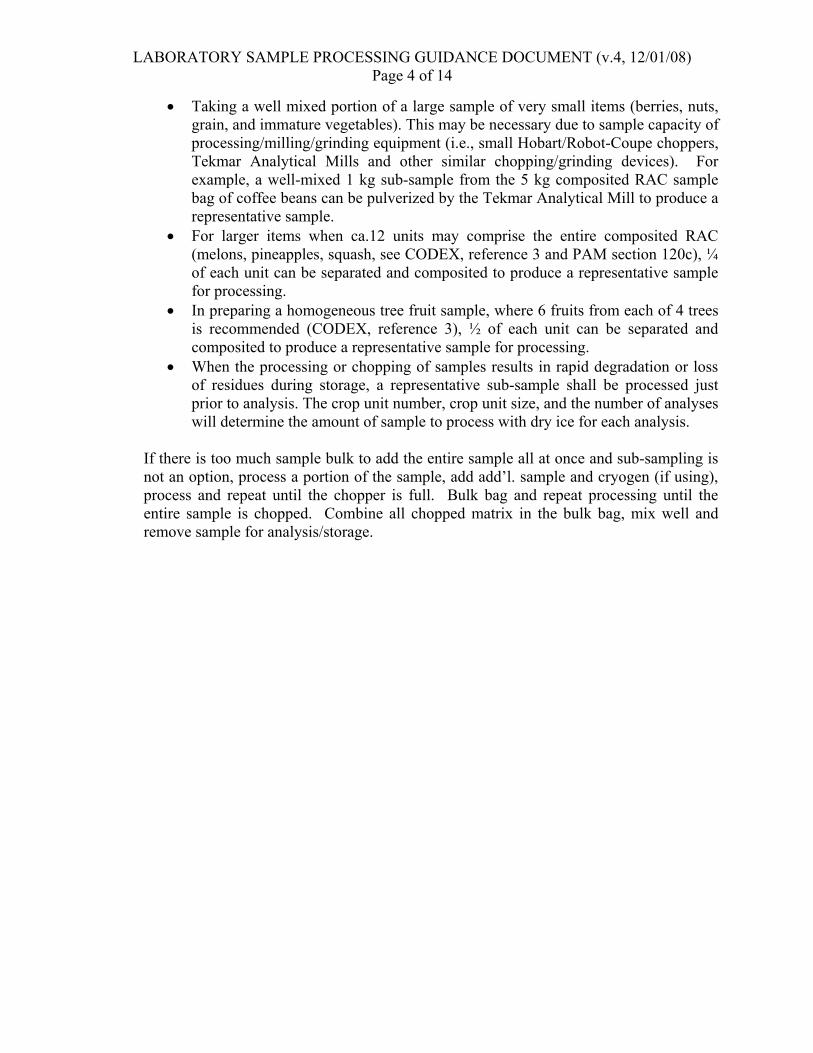
Taking a well mixed portion of a large sample of very small items (berries, nuts, grain, and immature vegetables). This may be necessary due to sample capacity of processing/milling/grinding equipment (i.e., small Hobart/Robot-Coupe choppers, Tekmar Analytical Mills and other similar chopping/grinding devices). For example, a well-mixed 1 kg sub-sample from the 5 kg composited RAC sample bag of coffee beans can be pulverized by the Tekmar Analytical Mill to produce a representative sample. For larger items when ca.12 units may comprise the entire composited RAC (melons, pineapples, squash, see CODEX, reference 3 and PAM section 120c), ¼ of each unit can be separated and composited to produce a representative sample for processing. In preparing a homogeneous tree fruit sample, where 6 fruits from each of 4 trees is recommended (CODEX, reference 3), ½ of each unit can be separated and composited to produce a representative sample for processing. When the processing or chopping of samples results in rapid degradation or loss of residues during storage, a representative sub-sample shall be processed just prior to analysis. The crop unit number, crop unit size, and the number of analyses will determine the amount of sample to process with dry ice for each analysis.
If there is too much sample bulk to add the entire sample all at once and sub-sampling is not an option, process a portion of the sample, add add’l. sample and cryogen (if using), process and repeat until the chopper is full. Bulk bag and repeat processing until the entire sample is chopped. Combine all chopped matrix in the bulk bag, mix well and remove sample for analysis/storage.
LAB
OR
ATO
RY
SA
MPL
E PR
OC
ESSI
NG
GU
IDA
NC
E D
OC
UM
ENT
(v.4
, 12/
01/0
8)
Page
5 o
f 14
Tabl
e 1. C
rop
Gro
up
(Sub
grou
p)
Num
ber a
nd N
ame
Rep
rese
ntat
ive
Com
mod
ities
Pr
e-Pr
oces
sing
Pr
epar
atio
n 1
Proc
essi
ng 2
Com
mod
ities
1. R
OO
T A
ND
TU
BER
VE
GET
AB
LES
Car
rot,
pot
ato,
ra
dish
, and
su
gar
beet
. W
hile
insi
de IR
4 ba
g an
d fr
ozen
bre
ak
up w
ith a
mal
let i
nto
appr
ox.
2 in
ch
piec
es a
nd m
ix to
com
bine
. If
grea
ter
than
10
poun
ds c
ut e
ach
unit
in h
alf,
re
turn
ing
opp
osite
hal
f to
sam
ple
bag.
C
ontin
ue u
ntil
all c
an fi
t in
chop
per.
If
tops
are
incl
uded
, cut
with
an
elec
tric
kn
ife.
A h
eavy
kni
fe a
nd h
amm
er a
re
usef
ul if
sam
ple
is to
o ha
rd.
Rob
ot C
oupe
, G
rind
er o
r H
obar
t w
ith c
ryo
gen
Arr
acac
ha; a
rro
wro
ot; a
rtic
hoke
, Chi
nese
; art
icho
ke,
Jeru
sale
m; b
eet,
gard
en; b
eet,
suga
r; b
urdo
ck, e
dibl
e;
cann
a, e
dibl
e; c
arro
t; ca
ssav
a, b
itter
and
sw
eet;
cele
riac;
cha
yote
(ro
ot);
che
rvil,
turn
ip-r
oote
d; c
hico
ry;
chuf
a; d
ashe
en (
taro
); g
inge
r; g
inse
ng; h
orse
radi
sh;
lere
n; p
arsl
ey,
tu
rnip
-roo
ted;
pa
rsni
p; p
otat
o; r
adis
h;
radi
sh, o
rient
al; r
utab
aga;
sal
sify
; sa
lsify
, bla
ck; s
alsi
fy,
Spa
nish
; ski
rret
; sw
eet p
otat
o; ta
nie
r; tu
rmer
ic; t
urn
ip;
yam
bea
n; y
am, t
rue.
1A
. R
oot v
eget
abl
es
subg
roup
C
arro
t, r
adis
h, a
nd s
ugar
bee
t
Whi
le in
side
IR4
bag
and
froz
en b
reak
up
with
a m
alle
t int
o ap
pro
x. 2
inch
pi
eces
and
mix
to c
ombi
ne.
If to
ps
are
incl
uded
, cut
with
an
elec
tric
kni
fe.
A h
eavy
kni
fe a
nd
ham
mer
are
use
ful
if sa
mpl
e is
too
har
d.
Rob
ot C
oupe
, G
rind
er o
r H
obar
t w
ith c
ryo
gen
Bee
t, ga
rde
n; b
eet
, sug
ar, b
urd
ock,
edi
ble;
car
rot;
cele
riac;
che
rvil,
turn
ip-r
oot
ed; c
hico
ry; g
inse
ng;
hors
erad
ish;
par
sley
, tu
rnip
-roo
ted;
par
snip
; rad
ish
; ra
dish
, orie
ntal
; rut
abag
a; s
alsi
fy;
sals
ify, b
lack
; sal
sify
, S
pani
sh; s
kirr
et; t
urni
p
1B.
Roo
t veg
eta
bles
(ex
cept
su
gar
beet
) su
bg
roup
C
arro
t an
d ra
dish
W
hile
insi
de IR
4 ba
g an
d fr
ozen
bre
ak
up w
ith a
mal
let i
nto
appr
ox.
2 in
ch
piec
es a
nd m
ix to
com
bine
. If
top
s ar
e in
clud
ed, c
ut w
ith a
n el
ectr
ic k
nife
. A
hea
vy k
nife
an
d ha
mm
er a
re u
sefu
l if
sam
ple
is t
oo h
ard.
Rob
ot C
oupe
, G
rind
er o
r H
obar
t w
ith c
ryo
gen
Bee
t, ga
rde
n; b
urd
ock,
edi
ble;
car
rot;
cele
riac;
che
rvil,
tu
rnip
-ro
oted
; chi
cory
; gin
seng
; ho
rser
adis
h; p
arsl
ey,
tu
rnip
-ro
oted
; pa
rsni
p; r
adis
h; r
adis
h, o
rient
al; r
uta
baga
; sa
lsify
; sal
sify
, bla
ck; s
alsi
fy, S
pani
sh; s
kirr
et; t
urni
p.
1C. T
ube
rous
an
d co
rm
vege
tabl
es s
ubgr
oup
Pot
ato
W
hile
insi
de IR
4 ba
g an
d fr
ozen
bre
ak
up w
ith a
mal
let i
nto
appr
ox.
2 in
ch
piec
es a
nd m
ix to
com
bine
Rob
ot C
oupe
, G
rind
er o
r H
obar
t w
ith c
ryo
gen
Arr
acac
ha; a
rro
wro
ot; a
rtic
hoke
, Chi
nese
; art
icho
ke,
Jeru
sale
m; c
anna
, edi
ble;
cas
sava
, bitt
er a
nd s
we
et;
cha
yote
(ro
ot);
chu
fa; d
ashe
en (
taro
); g
inge
r; le
ren;
po
tato
; sw
eet p
otat
o; ta
nier
; tu
rme
ric; y
am b
ean;
ya
m,
true
1D. T
ube
rous
an
d co
rm
vege
tabl
es (
exce
pt p
otat
o)
subg
roup
Sw
eet
pot
ato
W
hile
insi
de IR
4 ba
g an
d fr
ozen
bre
ak
up w
ith a
mal
let i
nto
appr
ox.
2 in
ch
piec
es a
nd m
ix to
com
bine
Rob
ot C
oupe
, G
rind
er o
r H
obar
t w
ith c
ryo
gen
Arr
acac
ha; a
rro
wro
ot; a
rtic
hoke
, Chi
nese
; art
icho
ke,
Jeru
sale
m; c
anna
, edi
ble;
cas
sava
, bitt
er a
nd s
we
et;
cha
yote
(ro
ot);
chu
fa; d
ashe
en (
taro
); g
inge
r; le
ren;
sw
eet p
otat
o; ta
nie
r; tu
rmer
ic;
yam
bea
n; y
am, t
rue
2. L
EAVE
S O
F R
OO
T A
ND
TU
BER
VEG
ETA
BLE
S (H
UM
AN
FO
OD
OR
A
NIM
AL
FEED
)
Tur
nip
and
gard
en
beet
or
suga
r be
et
Whi
le in
side
IR4
bag
and
froz
en b
reak
up
with
a m
alle
t int
o ap
pro
x. 2
inch
or
smal
ler
piec
es o
r cu
t with
ele
ctric
kni
fe
and
then
tho
roug
hly
mix
to c
ombi
ne.
Rob
ot C
oupe
, G
rind
er o
r H
obar
t w
ith c
ryo
gen.
If t
oo
muc
h sa
mpl
e bu
lk to
add
al
l at o
nce,
pro
cess
in
batc
hes
until
cho
pper
is fu
ll as
des
crib
ed in
foot
note
2.
Bee
t, ga
rde
n; b
eet
, sug
ar; b
urd
ock,
edi
ble;
car
rot;
cass
ava,
bitt
er a
nd s
we
et; c
eler
iac;
che
rvil,
turn
ip-
root
ed; c
hico
ry;
das
heen
(ta
ro);
pa
rsni
p; r
adis
h; r
adis
h,
orie
ntal
(da
ikon
); r
utab
aga;
sal
sify
, bla
ck; s
wee
t po
tato
; ta
nier
; tur
nip;
ya
m, t
rue
3. B
ULB
VEG
ETA
BLE
S
Oni
on, g
reen
; an
d on
ion,
dry
bu
lbW
hile
insi
de IR
4 ba
g an
d fr
ozen
bre
ak
up w
ith a
mal
let i
nto
appr
ox.
2 in
ch
piec
es a
nd m
ix to
com
bine
or
cut
in ~
1i
n pi
eces
Rob
ot C
oupe
, G
rind
er o
r H
obar
t w
ith c
ryo
gen
(LN
2
or d
ry ic
e)
Gar
lic; g
arlic
, gre
at-h
eade
d; l
eek;
oni
on, d
ry b
ulb
and
gr
een;
oni
on, W
els
h; s
hallo
t
1 and
2 – s
ee fo
otno
tes
at b
otto
m o
f pag
e 11

LAB
OR
ATO
RY
SA
MPL
E PR
OC
ESSI
NG
GU
IDA
NC
E D
OC
UM
ENT
(v.4
, 12/
01/0
8)
Page
6 o
f 14
Tabl
e 1,
con
t.C
rop
Gro
up
(Sub
grou
p)
Num
ber a
nd N
ame
Rep
rese
ntat
ive
Com
mod
ities
Pr
e-Pr
oces
sing
Pr
epar
atio
n 1
Proc
essi
ng 2
Com
mod
ities
4. L
EAFY
VEG
ETA
BLE
S (E
XCEP
T B
RA
SSIC
AVE
GET
AB
LES)
Cel
ery,
hea
d le
ttuc
e, le
af
lett
uce,
and
spi
nach
Whi
le in
side
IR4
bag
and
froz
en b
reak
up
with
a m
alle
t int
o ap
pro
x. 2
inch
or
smal
ler
piec
es o
r cu
t with
ele
ctric
kni
fe
and
then
tho
roug
hly
mix
to c
ombi
ne.
Rob
ot C
oupe
, G
rind
er o
r H
obar
t w
ith c
ryo
gen
(LN
2
or d
ry ic
e).
If to
o m
uch
sam
ple
bulk
to a
dd a
ll at
on
ce, p
roce
ss in
bat
ches
un
til c
hopp
er is
full
as
desc
ribed
in fo
otno
te 2
.
Am
aran
th (
Chi
nese
spi
nach
); a
rug
ula
(roq
uett
e);
card
oon;
cel
ery;
cel
ery,
Chi
nese
; ce
ltuce
; che
rvil;
ch
rysa
nthe
mum
, ed
ible
-leav
ed; c
hrys
anth
emum
, ga
rland
; cor
n sa
lad;
cre
ss, g
arde
n; c
ress
, upl
and;
da
ndel
ion;
doc
k (s
orre
l); e
ndiv
e (e
scar
ole)
; fen
nel,
Flo
renc
e; le
ttuce
, he
ad a
nd le
af; o
rach
; par
sle
y;
purs
lane
, gar
den
; pur
slan
e, w
inte
r; r
adic
chio
(re
d ch
icor
y); r
huba
rb; s
pina
ch; s
pina
ch, N
ew
Zea
land
; sp
inac
h, v
ine;
Sw
iss
char
d
4A. L
eafy
gre
ens
subg
roup
H
ead
lettu
ce a
nd le
af le
ttuce
, an
d sp
inac
hW
hile
insi
de IR
4 ba
g an
d fr
ozen
bre
ak
up w
ith a
mal
let i
nto
appr
ox.
2 in
ch o
r sm
alle
r pi
eces
or
cut w
ith e
lect
ric k
nife
an
d th
en th
oro
ughl
y m
ix to
com
bine
.
Rob
ot C
oupe
, G
rind
er o
r H
obar
t w
ith c
ryo
gen
(LN
2
or d
ry ic
e).
Am
aran
th; a
rugu
la; c
herv
il; c
hrys
ant
hem
um, e
dibl
e-
leav
ed; c
hrys
anth
emum
, gar
land
; co
rn s
alad
; cre
ss,
gard
en; c
ress
, upl
and;
dan
delio
n; d
ock;
end
ive;
lettu
ce;
orac
h; p
arsl
ey;
pur
slan
e, g
arde
n; p
ursl
ane,
win
ter;
ra
dicc
hio;
spi
nach
; spi
nach
, Ne
w Z
eala
nd; s
pina
ch,
vine
4B. L
eaf p
etio
les
subg
roup
C
eler
y
Whi
le in
side
IR4
bag
and
froz
en b
reak
up
with
a m
alle
t int
o ap
pro
x. 2
inch
pi
eces
and
mix
to c
ombi
ne
Rob
ot C
oupe
, G
rind
er o
r H
obar
t w
ith c
ryo
gen
(LN
2
or d
ry ic
e).
Car
doon
; ce
lery
; ce
lery
, Chi
nese
; ce
ltuce
; fen
nel,
Flo
renc
e; r
hub
arb;
Sw
iss
char
d
5. B
RA
SSIC
A (C
OLE
) LE
AFY
VEG
ETA
BLE
S
Bro
ccol
i or
caul
iflow
er;
cabb
age;
and
mus
tard
gre
ens
. W
hile
insi
de IR
4 ba
g an
d fr
ozen
bre
ak
up w
ith a
mal
let i
nto
appr
ox.
2 in
ch o
r sm
alle
r pi
eces
or
cut w
ith e
lect
ric k
nife
an
d th
en th
oro
ughl
y m
ix to
com
bine
. M
ay
nee
d to
qua
rter
leng
thw
ise,
usi
ng
oppo
site
pie
ces
prio
r to
mix
ing
to
redu
ce b
ulk.
Rob
ot C
oupe
, G
rind
er o
r H
obar
t w
ith c
ryo
gen
(LN
2
or d
ry ic
e).
If to
o m
uch
sam
ple
bulk
to a
dd a
ll at
on
ce, p
roce
ss in
bat
ches
un
til c
hopp
er is
full
as
desc
ribed
in fo
otno
te 2
.
Bro
ccol
i; br
occo
li, C
hine
se (
gai l
on);
bro
ccol
i raa
b (r
apin
i); B
russ
els
spro
uts;
cab
bag
e; c
abba
ge, C
hin
ese
(bok
cho
y);
cabb
age,
Chi
nese
(na
pa);
cab
bage
, C
hine
se m
usta
rd(g
ai c
hoy)
; cau
liflo
wer
; cav
alo
bro
ccol
o;
colla
rds;
kal
e; k
ohlra
bi; m
izun
a; m
usta
rd g
ree
ns;
mus
tard
spi
nach
; rap
e gr
eens
5A.H
ead
& S
tem
Bra
ssic
a su
bgro
up
Bro
ccol
i or
caul
iflow
er a
nd
cabb
age
Whi
le in
side
IR4
bag
and
froz
en b
reak
up
with
a m
alle
t int
o ap
pro
x. 2
inch
pi
eces
and
mix
to c
ombi
ne.
Ma
y ne
ed
to q
uart
er
leng
thw
ise,
usi
ng o
ppo
site
pi
eces
prio
r to
mix
ing
to r
edu
ce b
ulk
.
Rob
ot C
oupe
, G
rind
er o
r H
obar
t w
ith c
ryo
gen
(LN
2
or d
ry ic
e).
Bro
ccol
i; br
occo
li, C
hine
se; b
russ
els
spro
uts;
cab
bage
; ca
bbag
e, C
hine
se (
napa
); c
abba
ge,
Chi
nese
mus
tard
; ca
ulifl
ower
; cav
alo
broc
colo
; koh
lrabi
5B.L
eafy
Bra
ssic
a gr
eens
su
bgro
up
Mus
tard
gre
ens
W
hile
insi
de IR
4 ba
g an
d fr
ozen
bre
ak
up w
ith a
mal
let i
nto
appr
ox.
2 in
ch
piec
es a
nd m
ix to
com
bine
or
cut
with
an
ele
ctric
kni
fe.
Rob
ot C
oupe
, G
rind
er o
r H
obar
t w
ith c
ryo
gen
(LN
2
or d
ry ic
e).
Bro
ccol
i raa
b; c
abba
ge, C
hine
se (
bok
cho
y); c
olla
rds;
ka
le; m
izun
a; m
usta
rd g
reen
s; m
ust
ard
spin
ach;
ra
pe
gree
ns

LAB
OR
ATO
RY
SA
MPL
E PR
OC
ESSI
NG
GU
IDA
NC
E D
OC
UM
ENT
(v.4
, 12/
01/0
8)
Page
7 o
f 14
Tabl
e 1,
con
t.C
rop
Gro
up
(Sub
grou
p)
Num
ber a
nd N
ame
Rep
rese
ntat
ive
Com
mod
ities
Pr
e-Pr
oces
sing
Pr
epar
atio
n 1
Proc
essi
ng 2
Com
mod
ities
6. L
EGU
ME
VEG
ETA
BLE
S (S
UC
CU
LEN
T O
R D
RIE
D)
Bea
n (
Pha
seol
us)
,(su
ccul
ent
& d
ried)
,pea
(P
isum
)(s
uccu
lent
& d
ried)
and
so
ybea
n
Pre
-pro
cess
ing
not r
equi
red.
R
obot
Cou
pe,
Gri
nder
or
Hob
art
with
cry
oge
n (L
N2
or
dry
ice)
For
drie
d pe
as/b
eans
-
grin
der
type
pro
cess
or,
coffe
e gr
inde
r o
r R
obot
C
oupe
Bea
n (L
upin
us)
(incl
udes
gra
in lu
pin,
sw
eet l
upin
, w
hite
lu
pin,
and
whi
te s
wee
t lup
in);
bea
n (P
hase
olus
)(in
clud
es fi
eld
bean
, kid
ney
bean
, lim
a be
an, n
avy
bean
, pi
nto
bean
, ru
nner
bea
n, s
nap
bean
, tep
ary
bea
n, w
ax
bean
); b
ean
(V
igna
) (in
clud
es a
dzuk
i bea
n, a
spar
agu
s be
an, b
lack
eye
d pe
a, c
atja
ng, C
hine
se lo
ngbe
an,
cow
pea,
cro
wde
r pe
a, m
oth
bea
n, m
ung
bean
, ric
e be
an, s
outh
ern
pea
, urd
be
an,
yard
long
bea
n);
bro
ad
bean
(fa
va);
chi
ckpe
a (g
arb
anzo
); g
uar;
jack
bean
; la
blab
bea
n; le
ntil;
pea
(P
isum
) (in
clud
es d
war
f pe
a,
edib
le-p
odde
d p
ea, E
nglis
h pe
a, fi
eld
pea,
gar
den
pea
, gr
een
pea
, sno
wpe
a, s
ugar
sna
p pe
a); p
igeo
n pe
a;
soyb
ean;
so
ybea
n (im
mat
ure
see
d); s
wor
d b
ean
6A
.Edi
ble-
podd
ed
legu
me
vege
tabl
es s
ubgr
oup
An
y on
e su
ccul
ent c
ultiv
ar o
f ed
ible
-pod
ded
bea
n (P
hase
olus
) an
d an
y on
e
succ
ulen
t cul
tivar
of e
dibl
e-po
dded
pea
(P
isum
)
Pre
-pro
cess
ing
not r
equi
red
R
obot
Cou
pe,
Gri
nder
or
Hob
art
with
cry
oge
n (L
N2
or
dry
ice)
.
For
drie
d pe
as/b
eans
-
grin
der
type
pro
cess
or,
coffe
e gr
inde
r o
r R
obot
C
oupe
Bea
n (P
hase
olus
) (in
clud
es r
unne
r be
an, s
nap
bea
n,
wa
x be
an);
bea
n (V
igna
) (in
clud
es a
spar
agus
bea
n,
Chi
nese
long
bea
n, m
oth
bean
, ya
rdlo
ng b
ean
);
jack
bean
; pea
(P
isum
) (in
clud
es d
wa
rf p
ea,
edib
le-
podd
ed p
ea, s
now
pea
, sug
ar s
nap
pea)
; pig
eon
pea
; so
ybea
n (im
mat
ure
see
d); s
wo
rd b
ean
6B.S
uccu
lent
she
lled
pea
and
bean
sub
gro
up
An
y su
ccul
ent
shel
led
culti
var
of b
ean
(Ph
aseo
lus)
and
ga
rden
pe
a (P
isum
)
Pre
-pro
cess
ing
not r
equi
red
R
obot
Cou
pe,
Gri
nder
or
Hob
art
with
cry
oge
n (L
N2
or
dry
ice)
Bea
n (P
hase
olus
) (in
clud
es li
ma
bean
, gre
en;
bro
ad
bean
, suc
cule
nt);
bea
n (V
igna
) (in
clud
es b
lack
eyed
pea
, co
wpe
a, s
outh
ern
pea)
; pe
a (P
isum
) (in
clud
es E
nglis
h pe
a, g
ard
en p
ea,
gree
n pe
a); p
ige
on p
ea
6C.D
ried
shel
led
pea
and
bean
(e
xcep
t so
ybea
n)
subg
roup
An
y on
e d
ried
culti
var
of b
ean
(Pha
seol
us)
and
any
one
drie
d cu
ltiva
r of
pea
(P
isum
)
Pre
-pro
cess
ing
not r
equi
red
G
rinde
r ty
pe
pro
cess
or,
coffe
e gr
inde
r o
r R
obot
C
oupe
with
cry
oge
n (L
N2
or
dry
ice)
Drie
d cu
ltiva
rs o
f bea
n (L
upi
nus)
; be
an (
Pha
seol
us)
(incl
udes
fiel
d be
an, k
idne
y be
an,
lima
bean
(dr
y),
navy
be
an, p
into
bea
n, t
epar
y be
an);
bea
n (V
igna
) (in
clud
es
adzu
ki b
ean,
bla
ckey
ed p
ea, c
atja
ng, c
ow
pea,
cro
wd
er
pea,
mot
h be
an,
mun
g be
an,
rice
bean
, sou
ther
n p
ea,
urd
bean
); b
road
bea
n (d
ry);
chi
ckpe
a; g
uar;
labl
ab
bean
; len
til; p
ea (
Pis
um)
(incl
udes
fiel
d pe
a); p
igeo
n
pea
7. F
OLI
AG
E O
F LE
GU
ME
VEG
ETA
BLE
S
An
y cu
ltiva
r of
be
an
(Pha
seol
us),
fiel
d pe
a (P
isum
)an
d so
ybea
n
Whi
le in
side
IR4
bag
and
froz
en b
reak
up
with
a m
alle
t int
o ap
pro
x. 2
inch
or
smal
ler
piec
es o
r cu
t with
ele
ctric
kni
fe
and
then
tho
roug
hly
mix
to c
ombi
ne.
Rob
ot C
oupe
, G
rind
er o
r H
obar
t w
ith c
ryo
gen
(LN
2
or d
ry ic
e)
Pla
nt p
arts
of a
ny
legu
me
vege
tabl
e in
clud
ed in
the
legu
me
vege
tabl
es th
at w
ill b
e us
ed a
s an
imal
feed
.
7A.F
olia
ge o
f leg
ume
vege
tabl
es (
exce
pt
soyb
eans
) su
bgro
up
An
y cu
ltiva
r of
be
an
(Pha
seol
us)
and
field
pea
(P
isum
)
Whi
le in
side
IR4
bag
and
froz
en b
reak
up
with
a m
alle
t int
o ap
pro
x. 2
inch
or
smal
ler
piec
es o
r cu
t with
ele
ctric
kni
fe
and
then
tho
roug
hly
mix
to c
ombi
ne.
Rob
ot C
oupe
, G
rind
er o
r H
obar
t w
ith c
ryo
gen
(LN
2
or d
ry ic
e)
Pla
nt p
arts
of a
ny
legu
me
vege
tabl
e (e
xcep
t so
ybea
ns)
incl
uded
in th
e le
gum
e ve
geta
bles
gro
up th
at w
ill b
e us
ed a
s an
imal
feed
.
LAB
OR
ATO
RY
SA
MPL
E PR
OC
ESSI
NG
GU
IDA
NC
E D
OC
UM
ENT
(v.4
, 12/
01/0
8)
Page
8 o
f 14
Tabl
e 1,
con
t.C
rop
Gro
up
(Sub
grou
p)
Num
ber a
nd N
ame
Rep
rese
ntat
ive
Com
mod
ities
Pr
e-Pr
oces
sing
Pr
epar
atio
n 1
Proc
essi
ng 2
Com
mod
ities
8. F
RU
ITIN
G V
EGET
AB
LES
(EXC
EPT
CU
CU
RB
ITS)
T
omat
o, b
ell p
eppe
r, a
nd o
ne
culti
var
of n
on-b
ell
pepp
er
Whi
le in
side
IR4
bag
and
froz
en b
reak
up
with
a m
alle
t int
o ap
pro
x. 2
inch
pi
eces
and
mix
to c
ombi
ne o
r ch
op
with
a k
nife
.
Rob
ot C
oupe
, G
rind
er o
r H
obar
t w
ith c
ryo
gen
(LN
2
or d
ry ic
e).
Egg
plan
t; g
roun
dch
erry
(P
hys
alis
spp
); p
epin
o; p
epp
er
(incl
udes
bel
l pep
per,
chi
li pe
pper
, coo
king
pep
per,
pi
men
to, s
wee
t pep
per)
; to
mat
illo;
tom
ato
9. C
UC
UR
BIT
VE
GET
AB
LES
C
ucum
ber,
mus
kmel
on, a
nd
sum
mer
squ
ash
W
hile
insi
de IR
4 ba
g an
d fr
ozen
bre
ak
up w
ith a
mal
let i
nto
appr
ox.
2 in
ch
piec
es a
nd m
ix to
com
bine
. M
ay
need
to
qua
rte
r le
ngth
wis
e, u
sing
opp
osi
te
piec
es p
rior
to m
ixin
g to
re
duce
bu
lk.
Cho
p en
tire
frui
t inc
ludi
ng s
eeds
and
rin
d.
Rob
ot C
oupe
, G
rind
er o
r H
obar
t w
ith c
ryo
gen
(LN
2
or d
ry ic
e).
Cha
yote
(fr
uit)
; Chi
nese
wa
xgou
rd (
Chi
nese
pre
serv
ing
mel
on);
citr
on m
elon
; cuc
umbe
r; g
herk
in; g
ourd
, e
dibl
e (in
clud
es h
yota
n, c
ucuz
za,
hech
ima,
Chi
nese
okr
a);
Mom
ordi
casp
p (in
clud
es b
alsa
m a
pple
, bal
sam
pea
r,
bitte
rmel
on, C
hin
ese
cucu
mbe
r);
mus
kmel
on (
incl
udes
ca
ntal
oupe
); p
um
pkin
; squ
ash,
sum
mer
; squ
ash,
win
ter
(incl
udes
but
tern
ut s
quas
h, c
alab
aza,
hub
bard
sq
uash
, ac
orn
squa
sh,
spag
hetti
squ
ash)
; w
ater
mel
on
9A.M
elon
sub
gro
up
Can
talo
upe
Whi
le in
side
IR4
bag
and
froz
en b
reak
up
with
a m
alle
t int
o ap
pro
x. 2
inch
pi
eces
and
mix
to c
ombi
ne.
Ma
y ne
ed
to q
uart
er
leng
thw
ise,
usi
ng o
ppo
site
pi
eces
prio
r to
mix
ing
to r
edu
ce b
ulk
.
Cho
p en
tire
frui
t inc
ludi
ng s
eeds
and
rin
d.
Rob
ot C
oupe
, G
rind
er o
r H
obar
t w
ith c
ryo
gen
(LN
2
or d
ry ic
e).
Citr
on m
elon
; mu
skm
elon
; wat
erm
elon
9B. S
quas
h/C
ucum
ber
subg
roup
One
cul
tivar
of s
umm
er s
quas
h an
d cu
cum
ber
W
hile
insi
de IR
4 ba
g an
d fr
ozen
bre
ak
up w
ith a
mal
let i
nto
appr
ox.
2 in
ch
piec
es a
nd m
ix to
com
bine
. M
ay
need
to
qua
rte
r le
ngth
wis
e, u
sing
opp
osi
te
piec
es p
rior
to m
ixin
g to
re
duce
bu
lk.
Cho
p en
tire
frui
t inc
ludi
ng s
eeds
and
rin
d.
Rob
ot C
oupe
, G
rind
er o
r H
obar
t w
ith c
ryo
gen
(LN
2
or d
ry ic
e).
Cha
yote
(fr
uit)
; Chi
nese
wa
xgou
rd; c
ucum
ber;
ghe
rkin
; go
urd,
edi
ble;
Mom
ordi
ca s
pp; p
um
pkin
; squ
ash,
su
mm
er;s
quas
h, w
inte
r
10. C
ITR
US
FRU
ITS
S
we
et o
ran
ge, l
em
on a
nd
grap
efru
it
Whi
le in
side
IR4
bag
and
froz
en b
reak
up
with
a m
alle
t int
o ap
pro
x. 2
inch
pi
eces
and
mix
to c
ombi
ne
Rob
ot C
oupe
, G
rind
er o
r H
obar
t w
ith c
ryo
gen
(LN
2
or d
ry ic
e).
Cal
amon
din;
citr
us c
itron
; ci
trus
hyb
rids
(incl
udes
ch
ironj
a, ta
ngel
o, ta
ngor
); g
rap
efru
it; k
umqu
at; l
emon
; lim
e; m
anda
rin (
tang
erin
e);
oran
ge,
sou
r; o
rang
e, s
wee
t; pu
mm
elo;
Sat
sum
a m
anda
rin
11. P
OM
E FR
UIT
S A
pple
and
pea
r W
hile
insi
de IR
4 ba
g an
d fr
ozen
bre
ak
up w
ith a
mal
let i
nto
appr
ox.
1 t
o 2
inch
pie
ces
and
mix
to c
ombi
ne.
Ma
y ne
ed to
qua
rter
leng
thw
ise,
usi
ng
oppo
site
pie
ces
prio
r to
mix
ing
to
redu
ce b
ulk.
Cho
p en
tire
frui
t inc
ludi
ng s
eeds
and
pe
el.
Rob
ot C
oupe
, G
rind
er o
r H
obar
t w
ith c
ryo
gen
(LN
2
or d
ry ic
e).
App
le; c
raba
pple
; loq
uat;
ma
yha
w; p
ear;
pea
r, o
rient
al;
quin
ce

LAB
OR
ATO
RY
SA
MPL
E PR
OC
ESSI
NG
GU
IDA
NC
E D
OC
UM
ENT
(v.4
, 12/
01/0
8)
Page
9 o
f 14
Tabl
e 1,
con
t.C
rop
Gro
up
(Sub
grou
p)
Num
ber a
nd N
ame
Rep
rese
ntat
ive
Com
mod
ities
Pr
e-Pr
oces
sing
Pr
epar
atio
n 1
Proc
essi
ng 2
Com
mod
ities
12. S
TON
E FR
UIT
SS
we
et o
r ta
rt c
herr
y, p
each
, an
d pl
um o
r fr
esh
prun
e
Pre
-pro
cess
ing
not r
equi
red.
Ma
y ne
ed to
be
pitte
d o
r cu
t int
o sm
alle
r pi
eces
.
Rob
ot C
oupe
, G
rind
er o
r H
obar
t w
ith c
ryo
gen
(LN
2
or d
ry ic
e)
Apr
icot
; che
rry,
sw
eet
; che
rry,
tart
; nec
tarin
e; p
each
; pl
um; p
lum
, Chi
ckas
aw; p
lum
, Da
mso
n; p
lum
, Ja
pane
se; p
lum
cot;
prun
e (f
resh
)
13. B
ERR
IES
A
ny
one
blac
kbe
rry
or a
ny
one
rasp
berr
y; a
nd b
lueb
erry
P
re-p
roce
ssin
g ty
pica
lly n
ot r
equi
red.
If
larg
er th
an
1 to
2 in
cut
into
sm
alle
r pi
eces
.
Rob
ot C
oupe
, G
rind
er o
r H
obar
t w
ith c
ryo
gen
(LN
2
or d
ry ic
e).
A c
offe
e gr
inde
r ca
n be
us
ed fo
r sm
all s
ampl
e si
zes.
Bla
ckbe
rry
(incl
udin
g bi
ngle
berr
y, b
oys
enbe
rry;
de
wbe
rry;
low
berr
y, m
ari
onbe
rry,
ola
llieb
erry
, yo
ungb
erry
); b
lueb
erry
; cur
rant
; eld
erbe
rry;
go
oseb
erry
; hu
ckle
berr
y; lo
ganb
erry
; ras
pber
ry, b
lack
and
red
13A
.Can
ebe
rry
(bla
ckbe
rry
and
rasp
berr
y) s
ubgr
oup
A
ny
one
blac
kbe
rry
or a
ny
one
rasp
berr
y
Pre
-pro
cess
ing
not r
equi
red
R
obot
Cou
pe,
Gri
nder
or
Hob
art
with
cry
oge
n (L
N2
or
dry
ice)
.
Bla
ckbe
rry;
loga
nber
ry; r
ed a
nd b
lack
ras
pber
ry;
culti
vars
and
/or
hybr
ids
of th
ese
13B
. Bus
hber
ry s
ubgr
oup
B
lueb
erry
, hig
hbus
h
Pre
-pro
cess
ing
not r
equi
red
R
obot
Cou
pe,
Gri
nder
or
Hob
art
with
cry
oge
n (L
N2
or
dry
ice)
.
Blu
eber
ry, h
ighb
ush
and
low
bush
; cur
rant
; eld
erb
err
y;
goos
eber
ry; h
uckl
eber
ry
14.T
REE
NU
TS
Alm
ond
and
peca
n
Pre
-pro
cess
ing
typi
cally
not
req
uire
d.
Nut
mea
t ma
y ne
ed to
be
sepa
rate
d.
Rob
ot C
oupe
, G
rind
er o
r H
obar
t w
ith c
ryo
gen
(LN
2
or d
ry ic
e).
A c
offe
e gr
inde
r ca
n be
us
ed fo
r sm
all s
ampl
e si
zes.
Alm
ond;
bee
ch n
ut; B
razi
l nut
; but
tern
ut; c
ashe
w;
ches
tnut
; chi
nqua
pin;
filb
ert (
haze
lnut
); h
icko
ry n
ut;
mac
adam
ia n
ut;
peca
n; w
alnu
t, b
lack
and
Eng
lish
15. C
EREA
L G
RA
INS
C
orn
(sw
eet a
nd f
ield
), r
ice,
so
rghu
m, a
nd w
hea
t P
re-p
roce
ssin
g no
t req
uire
d
Wile
y m
ill, c
offe
e gr
inde
r o
r R
obot
Cou
pe o
r w
ith
cryo
gen
(LN
2 or
dry
ice)
.
Bar
ley;
buc
kwhe
at; c
orn;
mill
et, p
earl;
mill
et, p
roso
; oat
s;
popc
orn;
ric
e; r
ye; s
orgh
um (
milo
); te
osin
te; t
ritic
ale;
w
hea
t; w
ild r
ice
16.F
OR
AG
E, F
OD
DER
AN
D
STR
AW
OF
CER
EAL
GR
AIN
S
Cor
n, w
heat
, and
an
y ot
her
ce
real
gra
in c
rop
P
re-p
roce
ssin
g ty
pica
lly n
ot r
equi
red.
U
se a
n el
ectr
ic k
nife
if n
eede
d.
Rob
ot C
oupe
, G
rind
er o
r sm
alle
r H
obar
t w
ith
cryo
gen
(LN
2 or
dry
ice)
For
age,
fodd
er,
and
str
aw
of a
ll co
mm
oditi
es in
clud
ed in
th
e ce
real
gra
ins
grou
p
17.G
RA
SS F
OR
AG
E,
FOD
DER
, AN
D H
AY
GR
OU
P
Ber
mud
a g
rass
; blu
egra
ss; a
nd
brom
egra
ss o
r fe
scue
P
re-p
roce
ssin
g ty
pica
lly n
ot r
equi
red.
U
se a
n el
ectr
ic k
nife
if n
eede
d.
Rob
ot C
oupe
, G
rind
er o
r H
obar
t w
ith c
ryo
gen
(LN
2
or d
ry ic
e).
If to
o m
uch
sam
ple
bulk
to a
dd a
ll at
on
ce, p
roce
ss in
bat
ches
un
til c
hopp
er is
full
as
desc
ribed
in fo
otno
te 2
.
An
y gr
ass,
Gra
min
eae
fam
ily (
eith
er g
ree
n or
cur
ed)
exce
pt s
ugar
can
e an
d th
ose
incl
uded
in th
e ce
real
gr
ains
gro
up, t
ha
t will
be
fed
to o
r gr
azed
by
lives
tock
, al
l pas
ture
and
ran
ge g
rass
es a
nd
gras
ses
gro
wn
for
hay
or
sila
ge

LAB
OR
ATO
RY
SA
MPL
E PR
OC
ESSI
NG
GU
IDA
NC
E D
OC
UM
ENT
(v.4
, 12/
01/0
8)
Page
10
of 1
4 Ta
ble
1, c
ont.
Cro
p G
roup
(S
ubgr
oup)
N
umbe
r and
Nam
e R
epre
sent
ativ
e C
omm
oditi
es
Pre-
Proc
essi
ng
Prep
arat
ion
1Pr
oces
sing
2C
omm
oditi
es
18.N
ON
GR
ASS
AN
IMA
L FE
EDS
(FO
RA
GE,
FO
DD
ER, S
TRA
W A
ND
H
AY)
Alfa
lfa a
nd c
love
r (T
rifol
ium
)W
hile
insi
de IR
4 ba
g an
d fr
ozen
bre
ak
up w
ith a
mal
let i
nto
appr
ox.
2 in
ch
piec
es a
nd m
ix to
com
bine
Rob
ot C
oupe
, G
rind
er o
r H
obar
t w
ith c
ryo
gen
(LN
2
or d
ry ic
e).
Alfa
lfa; b
ean,
vel
vet;
clov
er (
Trif
oliu
m, M
elilo
tus)
; kud
zu;
lesp
edez
a; lu
pin;
sai
nfoi
n; tr
efoi
l; ve
tch;
vet
ch, c
row
n;
vetc
h, m
ilk
19.H
ERB
S A
ND
SPI
CES
B
asil
(fre
sh &
drie
d); b
lack
pe
pper
; chi
ve; h
op
cone
s; a
nd
cele
ry s
eed
or d
ill s
eed
Pre
-pro
cess
ing
typi
cally
not
req
uire
d.
Use
an
elec
tric
kni
fe if
nee
ded.
R
obot
Cou
pe,
Gri
nder
or
Hob
art
with
cry
oge
n (L
N2
or
dry
ice)
. F
or h
ops
keep
dry
ice
to a
m
inim
um a
nd d
o no
t lea
ve
hops
in c
hopp
er t
oo lo
ng.
Alls
pice
; ang
elic
a; a
nise
; ani
se, s
tar;
ann
atto
(se
ed)
; ba
lm; b
asil;
bor
age;
bur
net;
cam
om
ile; c
aper
bud
s;
cara
wa
y; c
ara
wa
y, b
lack
; car
dam
om; c
assi
a ba
rk;
cass
ia b
uds;
cat
nip;
cel
ery
seed
; ch
ervi
l (dr
ied)
; ch
ive;
ch
ive,
Chi
nese
; cin
nam
on; c
lary
; clo
ve b
uds;
cor
aind
er
leaf
(ci
lant
ro o
r C
hine
se p
arsl
ey)
; co
riand
er s
eed
(cila
ntro
); c
ostm
ary;
cul
antr
o (
leaf
); c
ulan
tro
(see
d);
cum
in; c
urry
(le
af);
dill
(di
llwee
d);
dill
(see
d); f
enne
l (c
omm
on);
fen
nel,
Flo
renc
e (s
eed
); fe
nug
reek
; gra
ins
of
para
dise
, hop
co
nes;
hor
ehou
nd;
hys
sop;
juni
per
ber
ry;
lave
nder
; lem
ong
rass
; lov
age
(leaf
); lo
vage
(se
ed);
m
ace;
mar
igol
d, m
arjo
ram
; mus
tard
(se
ed);
nas
turt
ium
; nu
tmeg
; par
sle
y (d
ried)
; pe
nnyr
oya
l; pe
pper
, bla
ck;
pepp
er,
whi
te; p
opp
y (s
eed)
; ros
emar
y; r
ue; s
affr
on;
sa
ge; s
avor
y, s
um
mer
and
win
ter;
sw
eet
bay;
tan
sy;
tarr
ago
n; th
yme;
van
illa;
win
terg
reen
; w
ood
ruff;
w
orm
woo
d
19A
.Her
b su
bgro
up
Bas
il (f
resh
& d
ried)
and
chi
ve
Pre
-pro
cess
ing
typi
cally
not
req
uire
d.
Use
an
elec
tric
kni
fe if
nee
ded.
R
obot
Cou
pe,
Gri
nder
or
Hob
art
with
cry
oge
n (L
N2
or
dry
ice)
. A
cof
fee
grin
der
can
be
used
for
smal
l sam
ple
size
s.
Ang
elic
a; b
alm
; bas
il; b
orag
e; b
urne
t; c
amom
ile; c
atni
p;
cher
vil (
drie
d); c
hive
; chi
ve, C
hine
se; c
lary
; co
riand
er
(leaf
); c
ostm
ary;
cul
antr
o (le
af);
cur
ry (
leaf
); d
illw
eed;
ho
reho
und;
hys
sop;
lave
nder
; lem
ongr
ass;
lova
ge (
leaf
);
mar
igol
d; m
arjo
ram
; nas
turt
ium
; pa
rsle
y (d
ried)
; pe
nnyr
oya
l; ro
sem
ary;
rue
; sag
e; s
avor
y, s
umm
er a
nd
win
ter;
sw
eet b
ay;
tans
y; ta
rrag
on;
thym
e; w
inte
rgre
en;
wo
odru
ff; a
nd w
orm
woo
d
19B
.Spi
ce s
ubgr
oup
Bla
ck p
eppe
r; a
nd
cele
ry s
eed
or d
ill s
eed
Pre
-pro
cess
ing
not r
equi
red
W
iley
mill
, cof
fee
grin
der
or
Rob
ot C
oupe
or
with
cr
yoge
n (L
N2
or d
ry ic
e).
Alls
pice
; ani
se (
seed
); a
nise
, sta
r; a
nnat
to (
seed
); c
aper
(b
uds)
; car
aw
ay;
car
aw
ay,
bla
ck; c
arda
mom
; cas
sia
(bar
k); c
assi
a (b
uds)
;cel
ery
(see
d);
cin
nam
on; c
love
(b
uds)
; cor
iand
er
(see
d); c
ulan
tro
(see
d); c
umin
; dill
(s
eed)
; fen
nel
, com
mon
; fen
nel,
Flo
renc
e (s
eed
);
fenu
gree
k; g
rain
s of
par
adis
e; ju
nipe
r (b
erry
); lo
vage
(s
eed)
; mac
e; m
usta
rd (
seed
); n
utm
eg; p
eppe
r, b
lack
; pe
pper
, w
hite
; po
ppy
(see
d); s
affr
on; a
nd v
anill
a
TRO
PIC
AL
FRU
IT C
RO
PSG
rap
efru
itgr
apef
ruit,
pun
imel
o, a
nd th
eir
citr
us h
ybrid
s (in
clud
ing
Uni
q(U
gli)
frui
t)
Whi
le in
side
IR4
bag
and
froz
en b
reak
up
with
a m
alle
t int
o ap
pro
x. 2
inch
pi
eces
and
mix
to c
ombi
ne
Rob
ot C
oupe
, G
rind
er o
r H
obar
t w
ith c
ryo
gen
(LN
2
or d
ry ic
e).
Cor
resp
ond
s to
Cod
ex C
itrus
Fru
its D
efin
ition
s

LAB
OR
ATO
RY
SA
MPL
E PR
OC
ESSI
NG
GU
IDA
NC
E D
OC
UM
ENT
(v.4
, 12/
01/0
8)
Page
11
of 1
4 Ta
ble
1, c
ont.
Cro
p G
roup
(S
ubgr
oup)
N
umbe
r and
Nam
e R
epre
sent
ativ
e C
omm
oditi
es
Pre-
Proc
essi
ng
Prep
arat
ion
1Pr
oces
sing
2C
omm
oditi
es
Sug
ar A
pple
su
gar
appl
e, c
herim
oya
, at
emo
ya, c
usta
rd a
pple
ilam
a,
sour
sop,
biri
ba
Whi
le in
side
IR4
bag
and
froz
en b
reak
up
with
a m
alle
t int
o ap
pro
x. 2
inch
pi
eces
and
mix
to c
ombi
ne
Rob
ot C
oupe
, G
rind
er o
r H
obar
t w
ith c
ryo
gen
(LN
2
or d
ry ic
e).
All
crop
s in
the
Ann
onac
eae;
sim
ilar
gros
s m
orp
holo
gy;
in
edib
le p
eel
Lyc
hee
ly
chee
, lon
gan,
Spa
nish
lim
e,
ram
buta
n, p
ulas
an
Whi
le in
side
IR4
bag
and
froz
en b
reak
up
with
a m
alle
t int
o ap
pro
x. 2
inch
pi
eces
and
mix
to c
ombi
ne
Rob
ot C
oupe
, G
rind
er o
r H
obar
t w
ith c
ryo
gen
(LN
2
or d
ry ic
e).
All
crop
s in
the
Sap
inda
ceae
; ine
dib
le p
eel
Pap
aya
pa
paya
, st
ar a
pple
, bla
ck
sapo
te, m
ango
, sap
odill
a,
cani
stel
, mam
ey s
apot
e
Whi
le in
side
IR4
bag
and
froz
en b
reak
up
with
a m
alle
t int
o ap
pro
x. 2
inch
pi
eces
and
mix
to c
ombi
ne
Rob
ot C
oupe
, G
rind
er o
r H
obar
t w
ith c
ryo
gen
(LN
2
or d
ry ic
e).
Mak
e su
re s
eeds
are
ch
oppe
d.
All
crop
s ha
ve in
edib
le p
eel;
corr
esp
onds
to C
ode
x cl
assi
ficat
ion
Avo
cado
avoc
ado,
pap
aya
, sta
r ap
ple,
bl
ack
sapo
te, m
ango
, sa
podi
lla,
cani
stel
, m
ame
y sa
pote
Whi
le in
side
IR4
bag
and
froz
en b
reak
up
with
a m
alle
t int
o ap
pro
x. 2
inch
pi
eces
and
mix
to c
ombi
ne
Rob
ot C
oupe
, G
rind
er o
r H
obar
t w
ith c
ryo
gen
(LN
2
or d
ry ic
e).
All
crop
s ha
ve in
edib
le p
eel;
corr
esp
onds
to C
ode
x cl
assi
ficat
ion
Gua
va
guav
a, fe
ijoa,
jabo
ticab
a, w
ax
jam
bu, s
tarf
ruit,
pas
sion
frui
t, ac
erol
a
Whi
le in
side
IR4
bag
and
froz
en b
reak
up
with
a m
alle
t int
o ap
pro
x. 2
inch
pi
eces
and
mix
to c
ombi
ne
Rob
ot C
oupe
, G
rind
er o
r H
obar
t w
ith c
ryo
gen
(LN
2
or d
ry ic
e).
Prim
arily
edi
ble
pee
l; no
te/p
eel r
are
ly c
onta
min
ates
P
assi
flora
spp
. du
ring
juic
ing
Citr
us F
ruits
ad
d W
hite
sap
ote
(Cas
imiro
a),
and
othe
r cu
ltiva
rs a
nd/o
r h
ybrid
s of
thes
e
Whi
le in
side
IR4
bag
and
froz
en b
reak
up
with
a m
alle
t int
o ap
pro
x. 2
inch
pi
eces
and
mix
to c
ombi
ne
Rob
ot C
oupe
, G
rind
er o
r H
obar
t w
ith c
ryo
gen
(LN
2
or d
ry ic
e).
Whi
te s
apot
e is
in th
e R
utac
eae
(citr
us)
1.
Typ
ical
pre
-pro
cess
ing
tool
s in
clud
e, b
ut a
re n
ot li
mite
d to
: m
alle
t, ha
mm
er,
hatc
het,
cle
aver
, he
avy
knife
, gi
nzu
type
kni
fe,
scis
sors
, el
ectr
ic k
nife
, an
d pa
per
cutte
r.
Ca
utio
n m
ust
be t
aken
w
hen
atte
mpt
ing
to
brea
k sa
mpl
es w
ith m
alle
ts w
hile
in t
he I
R-4
bag
s.
The
sam
ple
bag
ma
y br
eak
. A
sec
onda
ry b
ag m
ay
be u
sed
to c
onta
in t
he p
iece
s.
Be
awar
e th
at t
here
ma
y b
e a
poss
ibili
ty o
f sa
mpl
e co
ntam
inat
ion
with
sliv
ers
of t
he b
ag/p
last
ic li
ning
. A
ltern
ativ
ely,
bre
ak-u
p of
diff
icul
t fr
ozen
item
s us
ing
a he
avy
blad
ed k
nife
, cl
eave
r or
hea
vy h
am
mer
/ m
alle
ts (
2.5
-4l
b) m
ay
be d
one
on a
cho
ppin
g bo
ard
lined
with
but
cher
pap
er w
ith t
he e
dges
fol
ded
up t
o co
ntai
n sa
mpl
e pi
eces
. C
are
mus
t be
exe
rcis
ed w
hen
usi
ng m
etal
kni
ves,
cho
pper
s or
ha
mm
ers
that
pie
ces
do n
ot c
ause
per
sona
l inj
ury
in th
e ev
ent o
f bre
akag
e.
2.
Use
of
serr
ated
S-b
lade
s w
ill im
prov
e ch
oppi
ng e
ffic
ienc
y of
Rob
ot C
oupe
Sys
tem
s w
hen
pro
cess
ing
fibro
us a
nd
hard
sam
ple
mat
rice
s in
clud
ing
gree
n co
ffee
bean
, ro
aste
d co
ffee
bea
ns,
and
lych
ee w
hole
fru
it (w
ith s
eed
).
Use
of
the
Pu
lse
or H
igh
spee
d (~
3600
rpm
) o
ptio
n fo
r va
riabl
e s
peed
mod
els
is r
ecom
men
ded
for
the
se d
iffic
ult
froz
en m
atric
es.
A c
offe
e gr
inde
r is
us
eful
for
dry
see
ded
sam
ples
. I
f th
ere
is t
oo m
uch
sam
ple
bulk
to
add
the
entir
e sa
mpl
e al
l at
once
and
sub
-sam
plin
g is
not
an
opt
ion,
pro
cess
a p
ort
ion
of t
he
sam
ple
, ad
d ad
d’l.
sam
ple
an
d cr
yoge
n (if
usi
ng),
pro
cess
and
rep
eat
until
cho
pper
is
full.
B
ulk
bag
and
repe
at p
roce
ssin
g un
til e
ntire
sam
ple
is c
hopp
ed.
C
ombi
ne a
ll ch
oppe
d m
atrix
in
bul
k ba
g, m
ix w
ell
and
re
mov
e sa
mpl
e fo
r an
alys
is/s
tora
ge.
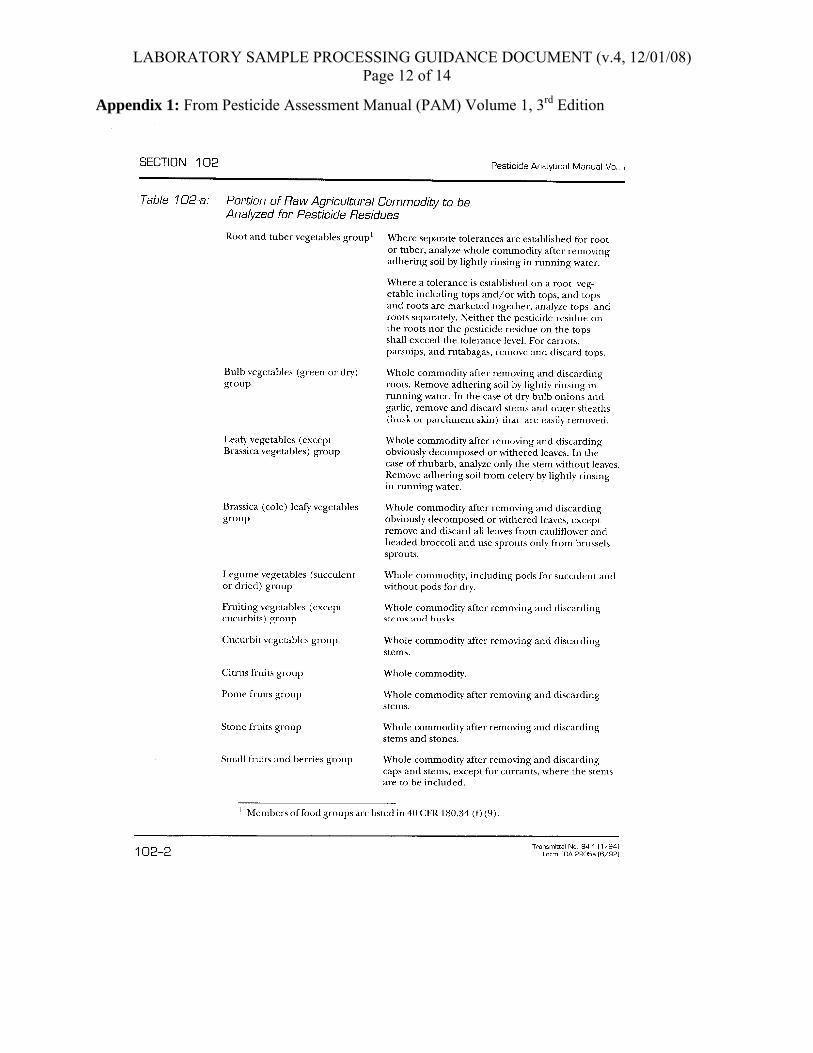
LABORATORY SAMPLE PROCESSING GUIDANCE DOCUMENT (v.4, 12/01/08) Page 12 of 14
Appendix 1: From Pesticide Assessment Manual (PAM) Volume 1, 3rd Edition
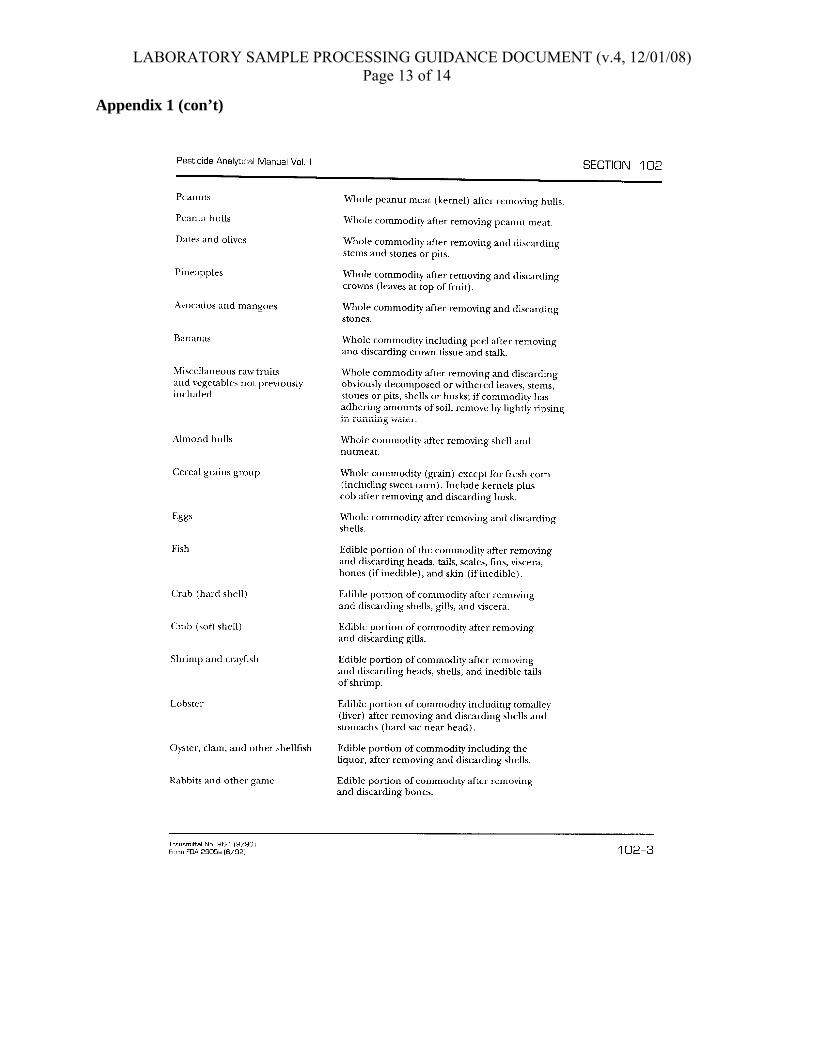
LABORATORY SAMPLE PROCESSING GUIDANCE DOCUMENT (v.4, 12/01/08) Page 13 of 14
Appendix 1 (con’t)
LABORATORY SAMPLE PROCESSING GUIDANCE DOCUMENT (v.4, 12/01/08) Page 14 of 14
References Cited:
1. 40 CFR 180.1 —Tolerances And Exemptions From Tolerances For Pesticide Chemicals In Food. Subpart A(j) —Definitions and Interpretative Regulations
2. Codex ‘‘Guidelines on Minimum Sample Sizes for Agricultural Commodities from Supervised Field Trials for Residue Analysis’’, ALINORM 87/24A (1987)
3. Codex Alimentarius Volume 2 Pesticides Residues In Food Section 2 Codex Classification Of Foods And Animal Feedstuffs. FAO, Rome 1993
4. Pesticide Assessment Manual (PAM) Volume 1, 3rd Edition, Section 102 and Section 203.
5. Residue Chemistry Test Guidelines OPPTS 860.1500 Crop Field Trials
Attachment 2
Sample Analytical Summary Report

ANALYTICAL SUMMARY REPORT Flonicamid: Magnitude of the Residue on Mint
____________________________________________________________________
PR# 09358
Authors Susan Erhardt, Eina Abouzied and Lester Geissel
Laboratory Research Director
Susan Erhardt
Testing Facility IR-4 North Central Region Laboratory
Michigan State University 3815 Technology Boulevard, Suite 1031B
Lansing, MI 48910-8396
Laboratory Study Identification Number 09358.11-MIR05
Study Director
Kenneth S. Samoil
Sponsor IR-4 Project Headquarters
500 College Road East, Suite 201W Princeton, New Jersey 08540
Field Study Identification Number(s)
09358.11-WI17 09358.11-WI18 09358.11-WA*18
09358.11-ID12 09358.11-WA17
Study Timetable Study Initiation Date: 26-Jan-2011
Experimental Termination Date: 8-Aug-2012
Report Date
19-Sep-2012
Page 1 of 136

GLP COMPLIANCE STATEMENT
PR#: 09358 Lab ID#: 09358.11-MIR05 The study reported herein for the residues of Flonicamid and its metabolites, TFNA-AM, TFNG and TFNA on Mint was conducted and reported in compliance with the Good Laboratory Practices (GLP) Regulations Title 40, Part 160 of the Code of Federal Regulations of the United States of America.
Signature/Date Signature/Date Susan Erhardt Laboratory Research Director
Eina Abouzied Analyst
IR-4 North Central Region Laboratory Michigan State University 3900 Collins Road, Suite 1031B Lansing, MI 48910-8396 Tel. No.: (517) 336-4653
IR-4 North Central Region Laboratory Michigan State University 3900 Collins Road, Suite 1031B Lansing, MI 48910-8396 Tel. No.: (517) 336-4648
Signature/Date Lester Geissel Analyst
IR-4 North Central Region Laboratory Michigan State University 3900 Collins Road, Suite 1031B Lansing, MI 48910-8396 Tel. No.: (517) 336-4655
IR-4 North Central Region Laboratory, Michigan State University Analytical Summary Report PR# 09538
Page 2

QUALITY ASSURANCE STATEMENT
IR-4 North Central Region Laboratory, Michigan State University Analytical Summary Report PR# 09538
Page 3
LABORATORY PERSONNEL
Name Designation
Robert Hollingworth Susan Erhardt
IR-4 North Central Region Director Laboratory Research Director
Robert T. Kon Sample Control Officer, Archivist (Retired 7 May
2012) Eina Abouzied
Principal analyst
Lester D. Geissel Mathew J. Witmer Royal G. Fader
Analyst Student aide (sample grinding, glassware cleaning) Laboratory aide (sample grinding, glassware cleaning)
IR-4 North Central Region Laboratory, Michigan State University Analytical Summary Report PR# 09538
Page 4

TABLE OF CONTENTS Page GLP COMPLIANCE STATEMENT ............................................................................................... 2
QUALITY ASSURANCE STATEMENT ....................................................................................... 3
LABORATORY PERSONNEL ....................................................................................................... 4
TABLE OF CONTENTS .................................................................................................................. 5
ARCHIVES....................................................................................................................................... 7
I. Objective/Introduction .................................................................................................... 8
II. Sample Inventory and History ........................................................................................ 8
Table I. Sample Inventory................................................................................................................. 9
III. Preparation of Storage Stability Samples ....................................................................... 9
Table II. Preparation of Storage Stability Samples for Mint Tops (Leaves & Steams) and Mint Oil.............................................................................................................................. 10
IV. Preparation of Standards ............................................................................................... 10
Table III. Reference Standard Information ..................................................................................... 10
Primary Stock Solutions: ................................................................................................................ 11
Table IV. Primary Stock Solutions ................................................................................................ 11
Fortification Standard Solutions: .................................................................................................... 11
Table V. Preparation of Fortification Solutions ............................................................................. 12
HPLC Calibration Solutions ........................................................................................................... 12
Table VI. Preparation of Calibration Solutions ............................................................................. 13
Storage Conditions of Standards:.................................................................................................... 14
V. Analytical Procedure ..................................................................................................... 14
Method ....................................................................................................................................... 14
Modifications to Cited Method ................................................................................................... 14
VI. Quantitation................................................................................................................... 15
VII. Results and Discussion ................................................................................................. 16
Table VII. Summary of Flonicamid Spike Recoveries (MV, CR, SSCR) for Mint Tops (Leaves & Stems) ................................................................................................. 19
Table VIII. Summary of TFNA-AM Spike Recoveries (MV, CR, SSCR) for Mint Tops (Leaves & Stems) ................................................................................................. 20
Table IX. Summary of TFNG Spike Recoveries (MV, CR, SSCR) for Mint Tops (Leaves & Stems) .............................................................................................................. 21
Table X. Summary of TFNA Spike Recoveries (MV, CR, SSCR) for Mint Tops (Leaves & Stems) .............................................................................................................. 22
IR-4 North Central Region Laboratory, Michigan State University Analytical Summary Report PR# 09538
Page 5

Table XI. Summary of Flonicamid Spike Recoveries (MV, CR, SSCR) for Mint Oil ........ 23
Table XII. Summary of TFNA-AM Spike Recoveries (MV, CR, SSCR) for Mint Oil ........ 24
Table XIII. Summary of TFNG8 Spike Recoveries (MV, CR, SSCR) for Mint Oil.............. 25
Table XIV. Summary of TFNA Spike Recoveries (MV, CR, SSCR) for Mint Oil ................ 26
Table XV. Storage Stability (SS) of Flonicamid and its Metabolites on Mint Tops (Leaves & Stems) .................................................................................................................. 27
Table XVI. Storage Stability (SS) of Flonicamid and its Metabolites on Mint Oil ................ 28
Table XVII. Summary of Residue Data for Mint Tops (Leaves & Stems) and Mint Oil Samples for Flonicamid (IKI-220) and Metabolites TFNA-AM, TFNG and TFNA ................................................................................................................... 29
Attachment A: Index to Representative Chromatograms ........................................................ 30-53
Attachment B: Calculation Worksheets, Standard Curves and LOD/LOQ Calculations . 54-125
Attachment C: Certificates of Analysis .......................................................................... 126-131
Attachment D: Working Outline 9.166 v1 ..................................................................... 132-136
IR-4 North Central Region Laboratory, Michigan State University Analytical Summary Report PR# 09538
Page 6

ARCHIVES (Location of Raw Data)
Original raw data, a certified copy of the signed protocol, amendments, correspondence, a true copy of the analytical summary report and relevant facility related information for the study titled: “Flonicamid: Magnitude of the Residue on Mint PR# 09358” have been placed in the archives of the testing facility. The original of this Analytical Summary Report (ASR) has been forwarded to the sponsor. Portions of the field samples will be retained at the testing facility in freezer at less than -20 °C for at least 12 months after submission of this Analytical Summary Report (ASR). The long term storage stability samples will be stored for at least 5 years at < -20 °C. The Study Director (SD) will be consulted before the field samples or storage stability samples are discarded.
Laboratory Research Director (LRD) and Laboratory Archivist
Susan Erhardt
Testing Facility:
IR-4 North Central Region Laboratory Michigan State University 3815 Technology Boulevard, Suite 1031B Lansing, MI 48910-8396
IR-4 North Central Region Laboratory, Michigan State University Analytical Summary Report PR# 09538
Page 7

IR-4 NATIONAL PESTICIDE CLEARANCE RESEARCH PROGRAM ANALYTICAL SUMMARY REPORT PR# 09358:
Flonicamid/Mint
I. Objective/Introduction
At the request of IR-4 Headquarters, the North Central Region Leader Laboratory at Michigan State University (MSU) has assayed Mint for residues of Flonicamid (EPA Reg. No. 71512-10-279, CAS# 158062-67-0) to provide data to support the establishment of a pesticide tolerance on mint tops (leaves & Stems) and mint oil matrices. The working method used for this study was an adaptation of two FMC Corporation Reports. Tops: based on the reference method “Analytical Methodology for IKI-220 (F1785) and its Major Metabolites in/on Peach, Potato Tuber, and Wheat Straw”, was written by Audrey W. Chen, Ph. D., Report Number P-3561M, FMC Corporation, Agricultural Products Group, Princeton, NJ on August 28, 2002. For mint oil the method was based on “ Magnitude of the Residues of IKI-220 on Cotton-USA in 2001”, was written by Karen D.Dow, Report Number P-3567, FMC Corporation, Agricultural Products Group, Princeton, NJ, 08543, USA on December 18, 2002. The working method (Working Outline WO 9.166 v.1) diverges from the reference methods as shown in Section V and Attachment D of this report. The study followed IR-4 National Pesticide Clearance Laboratory Phase Protocol PR# 09358 as amended. The validated method sensitivity (Lowest Level of Method Validation, LLMV) was 0.02 µg/gm of Flonicamid (IKI-220), its metabolites TFNA-AM, TFNG and TFNA on mint tops (leaves & stems) and mint oil matrices. II. Sample Inventory and History
Receiving: Upon arrival at the laboratory, samples were inspected and checked against the enclosed shipping forms. Unique laboratory sample numbers: Unique laboratory sample numbers were assigned as listed in Table I. Sample Inventory. Grinding: Samples were stored frozen once received from the field. The raw agricultural commodity (RAC) samples (mint tops) were ground using a Robot Coupe RSI 10 B with dry ice. Untreated control samples were chopped first followed by treated samples. The entire sample was chopped and homogenized. Chopped samples were stored in labeled glass jars and placed in a freezer. The mint oil samples received no further processing and were analyzed as received. Storage condition: All field samples were stored frozen (generally <-20 °C) until analyzed.
IR-4 North Central Region Laboratory, Michigan State University Analytical Summary Report PR# 09538
Page 8
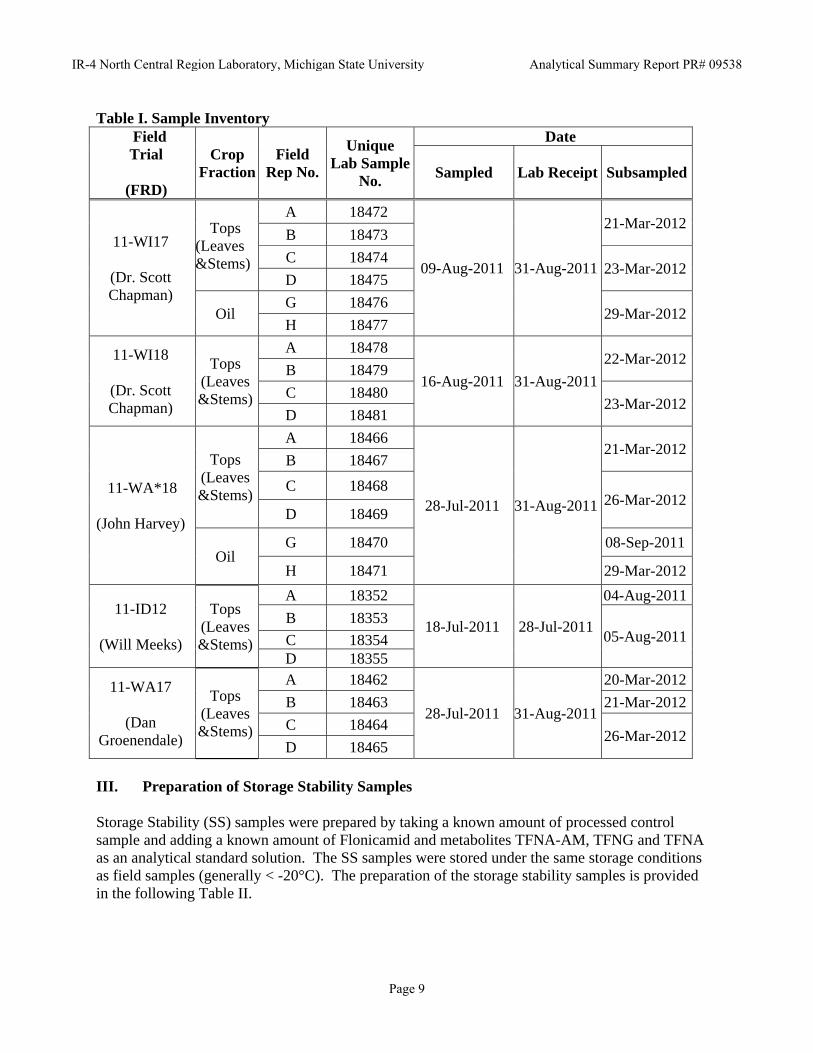
Table I. Sample Inventory Field Trial
(FRD)
Crop Fraction
Field Rep No.
Unique Lab Sample
No.
Date
Sampled Lab Receipt Subsampled
11-WI17
(Dr. Scott Chapman)
Tops (Leaves&Stems)
A 18472
09-Aug-2011 31-Aug-2011
21-Mar-2012B 18473
C 18474 23-Mar-2012
D 18475
Oil G 18476
29-Mar-2012H 18477
11-WI18
(Dr. Scott Chapman)
Tops (Leaves&Stems)
A 18478
16-Aug-2011 31-Aug-2011
22-Mar-2012B 18479
C 18480 23-Mar-2012
D 18481
11-WA*18
(John Harvey)
Tops (Leaves&Stems)
A 18466
28-Jul-2011 31-Aug-2011
21-Mar-2012B 18467
C 18468 26-Mar-2012
D 18469
Oil G 18470 08-Sep-2011
H 18471 29-Mar-2012
11-ID12
(Will Meeks)
Tops (Leaves&Stems)
A 18352
18-Jul-2011 28-Jul-2011
04-Aug-2011
B 18353 05-Aug-2011C 18354
D 18355
11-WA17
(Dan Groenendale)
Tops (Leaves&Stems)
A 18462
28-Jul-2011 31-Aug-2011
20-Mar-2012
B 18463 21-Mar-2012
C 18464 26-Mar-2012
D 18465 III. Preparation of Storage Stability Samples
Storage Stability (SS) samples were prepared by taking a known amount of processed control sample and adding a known amount of Flonicamid and metabolites TFNA-AM, TFNG and TFNA as an analytical standard solution. The SS samples were stored under the same storage conditions as field samples (generally < -20°C). The preparation of the storage stability samples is provided in the following Table II.
IR-4 North Central Region Laboratory, Michigan State University Analytical Summary Report PR# 09538
Page 9

Table II. Preparation of Storage Stability Samples for Mint Tops (Leaves & Steams) and Mint Oil
Field Trial
Field Rep No.
Crop Part
No. Pre-
pared
Sample Size (g)
Standard Used Fortification Date
Prepared Std # Conc.
(µg/mL)
Vol added (mL)
Amount(µg)
Level (ppm)
11-ID12 A
Tops (leaves
& Stems)
9 5.00 F307G-2~1.00 each
1.0 ~1.0 each
~0.2 10-Aug-11
11-WA*18
G Oil 9 5.00 F307G-2~1.00 each
1.0 ~1.0 each
~0.2 08-Sep-11
IV. Preparation of Standards
Reference standards were received from ISK Biosciences Corporation. Specific purity and additional information regarding the reference standards are shown in Table III. These were prepared as a stock standard solution from the pure reference material Flonicamid (IKI-220) and metabolites (TFNA-AM, TFNG, and TFNA). Two separate lines of working standard solutions were diluted from the stock solution to produce “One Stock Two Lines”. One line was for spiking or fortification, marked as “F” and the other used as calibration solutions for the quantification of the residues, marked as “A”. Table III. Reference Standard Information
Analyte: Flonicamid (IKI-220)
TFNA-AM TFNG TFNA
ARS #: (Assigned by IR-4) 307 308 309 310
CAS no.: 158062-67-0
158062-71-6
158062-21-6 --- 158063-66-2
Source: Midwest Research Institute (MRI)
Harlan Laboratories
Midwest Research
Institute (MRI) Lot #: 9803 0006 0006-1 0006
Purity:
99.9± 0.1%
99.87%
99.7% (recertified)
92.4% 100.00%
Receipt Date: Mar 17, 2010 Mar 17, 2010 Mar 17, 2010 Mar 17, 2010 Expiration
Date: May 15, 2014
Jan 06, 2011
Jan 03, 2016 (recertified)
Dec 2013
Jan 05, 2011
Jan 03, 2016 (recertified)
Storage: IR-4 Freezer No. 2 (Typically <-10°C)
IR-4 North Central Region Laboratory, Michigan State University Analytical Summary Report PR# 09538
Page 10
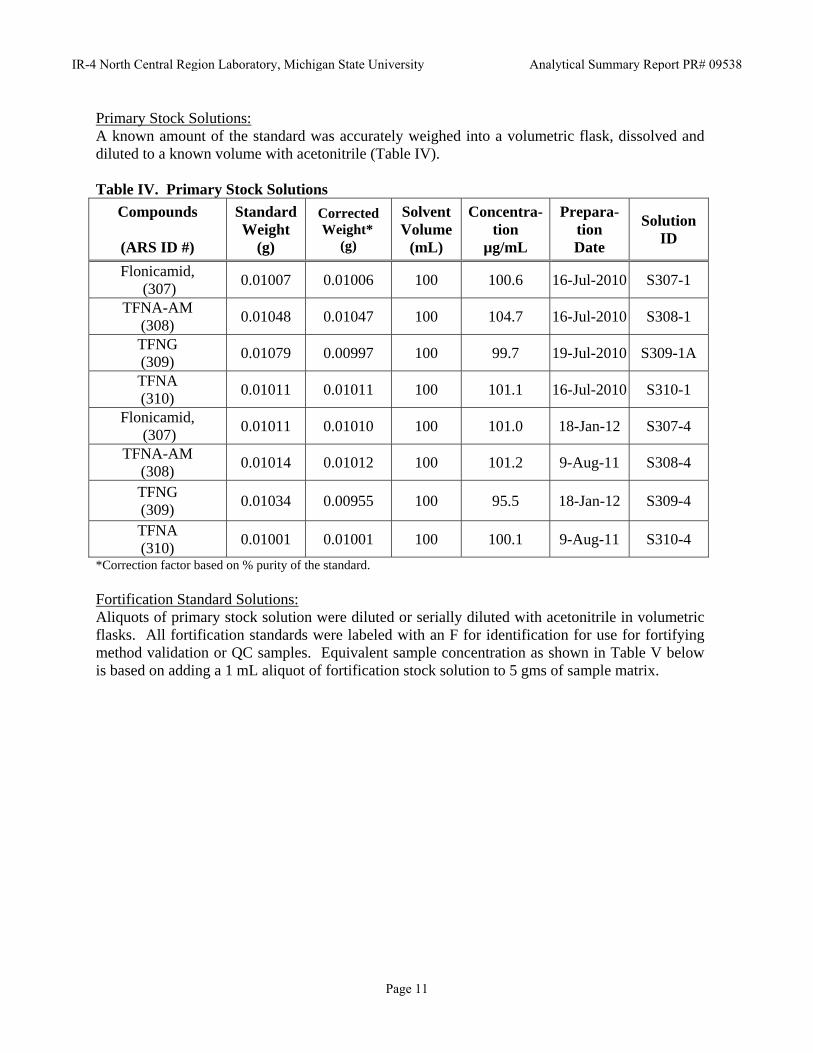
Primary Stock Solutions: A known amount of the standard was accurately weighed into a volumetric flask, dissolved and diluted to a known volume with acetonitrile (Table IV). Table IV. Primary Stock Solutions
Compounds
(ARS ID #)
Standard Weight
(g)
Corrected Weight*
(g)
Solvent Volume
(mL)
Concentra-tion
µg/mL
Prepara-tion Date
Solution ID
Flonicamid, (307)
0.01007 0.01006 100 100.6 16-Jul-2010 S307-1
TFNA-AM (308)
0.01048 0.01047 100 104.7 16-Jul-2010 S308-1
TFNG (309)
0.01079 0.00997 100 99.7 19-Jul-2010 S309-1A
TFNA (310)
0.01011 0.01011 100 101.1 16-Jul-2010 S310-1
Flonicamid, (307)
0.01011 0.01010 100 101.0 18-Jan-12 S307-4
TFNA-AM (308)
0.01014 0.01012 100 101.2 9-Aug-11 S308-4
TFNG (309)
0.01034 0.00955 100 95.5 18-Jan-12 S309-4
TFNA (310)
0.01001 0.01001 100 100.1 9-Aug-11 S310-4
*Correction factor based on % purity of the standard. Fortification Standard Solutions: Aliquots of primary stock solution were diluted or serially diluted with acetonitrile in volumetric flasks. All fortification standards were labeled with an F for identification for use for fortifying method validation or QC samples. Equivalent sample concentration as shown in Table V below is based on adding a 1 mL aliquot of fortification stock solution to 5 gms of sample matrix.
IR-4 North Central Region Laboratory, Michigan State University Analytical Summary Report PR# 09538
Page 11

Table V. Preparation of Fortification Solutions Source Solution Fortification Standards
Solution ID
Concen-tration
(µg/mL)
Aliquot Volume
(mL)
Final Volume
Concen-tration
(µg/mL)
Equivalent* Sample Concen-tration (ppm)
Solution ID
Preparation Date
S307-1 S308-1
S309-1A S310-1
100.6 104.7 99.7 101.1
1 each 100
1.006 1.047 0.997 1.011
- F307G-
1 19-Jul-10
S307-4 S308-4 S309-4 S310-4
101.0 101.2 95.5 100.1
5 each 100
5.050 5.060 4.775 5.005
- F307G-
4 19-Jan-12
F307G-4
5.050 5.060 4.775 5.005
10 100
0.5050 0.5060 0.4775 0.5005
- F307G-
7 25-Apr-12
F307G-7
0.5050 0.5060 0.4775 0.5005
10 50
0.1010 0.1012 0.0955 0.1001
0.02 F307G-
8 25-Apr-12
S307-4 S308-4 S309-4 S310-4
101.0 101.2 95.5 100.1
5 each 50
10.10 10.12 9.55 10.01
2.0 F307G-
9 18-May-12
F307G-9
10.10 10.12 9.55 10.01
10 100
1.010 1.012 0.955 1.001
0.2 F307G-
10 18-May-12
*assumes 1mL fortification solution to 5 g sample matrix. HPLC Calibration Solutions The working solution was prepared by pipetting an accurate amount of the stock solution into an appropriate volumetric flask and then diluting to the mark with acetonitrile. Subsequent working standards were prepared by pipetting a known amount of a working solutions and diluting with 50% acetonitrile in (HPLC) water. These working solutions, marked as “A”, were for calibration use only (Table VI).
IR-4 North Central Region Laboratory, Michigan State University Analytical Summary Report PR# 09538
Page 12

Table VI. Preparation of Calibration Solutions Source Solution Calibration Standards
Solution ID
Concen-tration
(µg/mL)
Aliquot Vol-ume (mL)
Final Vol-ume (mL)
Concen-tration
(µg/mL) Solution ID
Preparation Date
Flonicamid (S307-4)
TFNA-AM (S308-4)
TFNG (S309-4) TFNA (S310-4)
101.0
101.2
95.50 100.1
1 each 100
1.010
1.012
0.9550 1.001
A307G-11 Jan-19-12
A307G-11
1.010 1.012 0.9550 1.001
1 10
0.1010 0.1012 0.0955 0.1001
A307G-20 May-22-12
A307G-11
1.010 1.012 0.9550 1.001
1 100
0.01010 0.01012 0.00955 0.01001
A307G-21 May-22-12
A307G-20
0.1010 0.1012 0.0955 0.1001
2.5 50
0.00505 0.00506 0.004775 0.005005
A307G-22 May-22-12
A307G-21
0.01010 0.01012 0.00955 0.01001
10 50
0.002020 0.002024 0.001910 0.002002
A307G-23 May-22-12
A307G-21
0.01010 0.01012 0.00955 0.01001
5 50
0.001010 0.001012 0.000955 0.001001
A307G-24 May-22-12
A307G-21
0.01010 0.01012 0.00955 0.01001
2.5 50
0.0005050 0.0005060 0.0004775 0.0005005
A307G-25 May-22-12
A307G-21
0.01010 0.01012 0.00955 0.01001
1 50
0.0002020 0.0002024 0.0001910 0.0002002
A307G-26 May-22-12
A307G-21
0.01010 0.01012 0.00955 0.01001
0.5 50
0.0001010 0.0001012 0.00009550.0001001
A307G-27 May-22-12
IR-4 North Central Region Laboratory, Michigan State University Analytical Summary Report PR# 09538
Page 13

Storage Conditions of Standards: When not in use, standards and standard solutions were stored in lab freezer units #2 and #7. During the period of this study, the average daily temperature was generally <-10 °C. V. Analytical Procedure
For mint tops, five (5.0) g of sample was extracted using an extraction solvent (acetonitrile: water, 50:50, v/v). The sample was shaken, decanted into a flat bottom boiling flask. For mint oil, 2.5 g of sample was partitioned twice against hexane and the extraction solvent (acetonitrile:water, 50:50, v/v). The extraction solvent from the mint oil was combined in a flat bottom boiling flask. For both tops and oil the extraction solvent was evaporated to its aqueous remainder, filtered, acidified and made up to 50 mL. A portion of the extract (5 out of 50 mL) was taken through the rest of procedure that includes partitioning with ethyl acetate, evaporation of the ethyl acetate to dryness using N-EVAP Evaporator. The residues were dissolved in actonitrile:water, 50:50, v/v and then analyzed by HPLC/MS/MS. Method
This working outline is an adaptation of two reference methods. The referenced methods used for development of the working method were “Analytical Methodology for IKI-220 (F1785) and its Major Metabolites in/on Peach, Potato Tuber, and Wheat Straw”, was written by Audrey W. Chen on August 28, 2002, Princeton NJ, 08543, USA and “Magnitude of the Residues of IKI-220 on Cotton- USA in 2001” P-3567, Karen Dow, RMC Corporation, 2002. Points where the working methods (Working Outline WO 9.166, V.1) diverge from the reference methods are noted in WO 9.166 V.1 (Attachment D) and below. Modifications to Cited Method
A rotovap was used to concentrate the samples with the water bath, 45 °C) instead of a TurboVap (step 8) due available equipment in the lab. To facilitate this, the extract was decanted into 250 mL flat bottom boiling flask instead of TurboVap vessel as in steps 5 and 7. Also, 0.6 mL of concentrated HCI was used instead of 0.5 mL to improve recoveries. A smaller size of Whatman No. 1 filter was used, 7 cm instead of 11 cm (Step 13) to accommodate existing laboratory equipment. In step 14, 5 mL of sample extract was used instead of 2 mL to increase the final concentration of residues in the extract due to differences in sensitivity between instrumentation. Because of the increased amount of sample extract, three partitions (4 mL, 4 mL and 2 mL) of ethyl acetate instead of two partitions with 2 mL ethyl acetate were conducted in order to increase efficiency of extraction. The temperature of the water bath was reduced in Step 16 from 45 °C to 25 °C to increase % recoveries.
IR-4 North Central Region Laboratory, Michigan State University Analytical Summary Report PR# 09538
Page 14

The sample final volume was prepared in 50% acetonitrile instead of 30% acetonitrile due to optimization of the chromatography for the existing system. For the UPLC mobile phase, 0.3% acetic acid in HPLC water and acetonitrile was used instead of 0.2% acetic acid in acetonitrile, 0.2% acetic acid and methanol in the original method. This original separation required the use of three channels. The LC pump in use only has two channels. Calibration standards were prepared in 50% acetonitrile for compatibility with the optimized chromatography system. VI. Quantitation
Calculations for residues used the peak area data collected from the instrument. Steps of calculating residues and spike recovery percentages are given in this section. A linear standard calibration curve is used:
b m xy (Eq. 1)
where y is peak area, x is residue concentration, m is slope and b is y-intercept. The residue concentration (x) can be calculated after Eq. 1 is rearranged to Eq. 2.
m
b
yx
(Eq. 2)
Spike recovery can be calculated by Eq. 3:
100
(%)recovery Spike
s
x (Eq. 3)
where x is determined residue concentration and s is spike concentration.
An example of calculating residue and spike recovery is given as follows.
Field trial ID: 11-WA*18 Crop fraction: Mint Tops (Leaves&Stems) Analysis for: Flonicamid ASR page No.: 91 Lab sample ID number: 18467A-QC-2.0-1 Extraction date: 26-Jul-2012 Analysis date: 30-Jul-2012 Analysis results:
Peak area of sample y = 3026 Calibration coefficient r2 = 0.9960 Slope m = 1780961 Intercept b = -128.36
Thus, concentration (x’) in final extract is,
IR-4 North Central Region Laboratory, Michigan State University Analytical Summary Report PR# 09538
Page 15
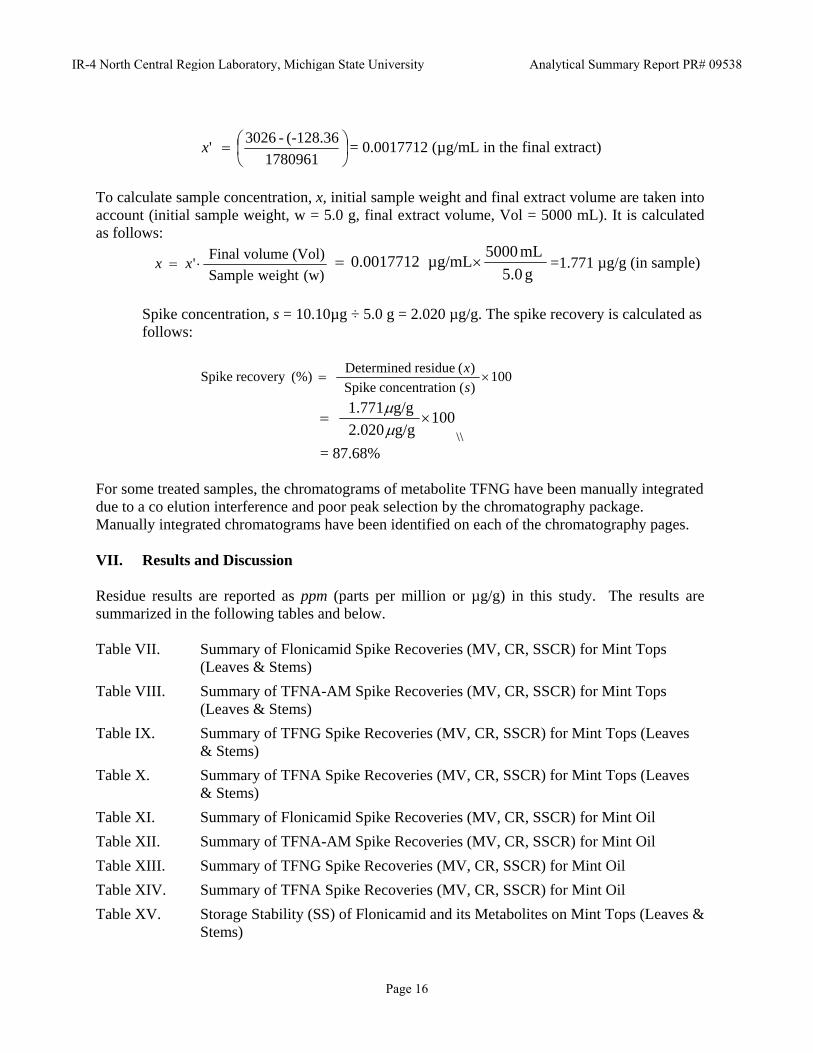
1780961
(-128.36-3026 'x = 0.0017712 (µg/mL in the final extract)
To calculate sample concentration, x, initial sample weight and final extract volume are taken into account (initial sample weight, w = 5.0 g, final extract volume, Vol = 5000 mL). It is calculated as follows:
(w) weight Sample
(Vol) volumeFinal ' xx
g 5.0
mL 5000 µg/mL 0.0017712 =1.771 µg/g (in sample)
Spike concentration, s = 10.10µg ÷ 5.0 g = 2.020 µg/g. The spike recovery is calculated as follows:
100 )(ion concentrat Spike
)( residue Determined (%)recovery Spike
s
x
100 g/g 2.020
g/g 1.771
\\
= 87.68%
For some treated samples, the chromatograms of metabolite TFNG have been manually integrated due to a co elution interference and poor peak selection by the chromatography package. Manually integrated chromatograms have been identified on each of the chromatography pages.
VII. Results and Discussion
Residue results are reported as ppm (parts per million or µg/g) in this study. The results are summarized in the following tables and below. Table VII. Summary of Flonicamid Spike Recoveries (MV, CR, SSCR) for Mint Tops
(Leaves & Stems)
Table VIII. Summary of TFNA-AM Spike Recoveries (MV, CR, SSCR) for Mint Tops (Leaves & Stems)
Table IX. Summary of TFNG Spike Recoveries (MV, CR, SSCR) for Mint Tops (Leaves & Stems)
Table X. Summary of TFNA Spike Recoveries (MV, CR, SSCR) for Mint Tops (Leaves & Stems)
Table XI. Summary of Flonicamid Spike Recoveries (MV, CR, SSCR) for Mint Oil
Table XII. Summary of TFNA-AM Spike Recoveries (MV, CR, SSCR) for Mint Oil
Table XIII. Summary of TFNG Spike Recoveries (MV, CR, SSCR) for Mint Oil
Table XIV. Summary of TFNA Spike Recoveries (MV, CR, SSCR) for Mint Oil
Table XV. Storage Stability (SS) of Flonicamid and its Metabolites on Mint Tops (Leaves & Stems)
IR-4 North Central Region Laboratory, Michigan State University Analytical Summary Report PR# 09538
Page 16

Table XVI. Storage Stability (SS) of Flonicamid and its Metabolites on Mint Oil
Table XVII. Summary of Residue Data for Mint Tops (Leaves & Stems) and Mint Oil Samples for Flonicamid (IKI-220) and Metabolites TFNA-AM, TFNG and TFNA
Detailed calculations and related calibration data as well as LOQ and LOD calculations are given in Attachment B. The working method was validated at three concentrations, 0.02, 0.2 and 2.0 µg/g or ppm for Flonicamid and its metabolites TFNA-AM, TFNA, and TFNG on Mint Tops (Leaves & Stems). Recoveries are shown in Tables VII, through X for each compound on mint tops. Average recoveries for the parent Flonicamid on mint tops ranged from a minimum of 67 ± 6 % at 0.02 ppm to a maximum of 80 ± 7% at 2.0 ppm (Table VII). Average recoveries for TFNA-AM ranged from 75 ± 5% at 0.02 ppm to 86 ± 4% at 0.2 ppm (Table VIII). For TFNG average recoveries ranged from 91 ± 5% at 2 ppm to a maximum of 111 ± 3% at 0.2 ppm (Table IX). Finally, recoveries for TFNA ranged from 98± 6% at 2 ppm to a maximum of 105 ± 3 at 0.2 ppm (Table X). Calculated LODs for Flonicamid, and its metabolites TFNA-AM, TFNG and TFNA were 0.004, 0.003, 0.002 and 0.004 µg/g respectively. While calculated LOQs for Flonicamid, and its metabolites TFNA-AM, TFNG and TFNA were 0.013, 0.010, 0.006 and 0.013µg/g, respectively. Calculations were based on the recoeveries at the LLMV using a one-tailed‘t’ statistic as described in The Handbook of Environmental Analysis, 4th Edition, by Roy-Keith Smith, Genium Publishing Corporation, 1999. These calculated values support the lowest level of quantification used as a part of this study as they are less than the LLMV of 0.02 ppm. The calculation spreadsheets used for generating calculated LOD and LOQs are shown in Attachment B. The working method also was validated on mint oil at 0.02, 0.2 and 2.0 µg/gm. Recoveries are shown in Tables XI through XIV. Average recoveries for Flonicamid ranged from 87 ± 4 at 2 ppm to 96 ±7 at 0.02 ppm (Table XI). Average recoveries for TFNA-AM ranged from 87 ± 6% at 0.2 ppm to 96 ± 8 at 0.02 ppm (Table XII). For TFNG, average recoveries ranged from 88 ± 7% at 0.02 ppm to a maximum of 94 at both 0.2 and 2 ppm (Table XIII). Finally, recoveries for TFNA ranged from 89± 6% at 2 ppm to a maximum of 93 ± 4 at 0.2 ppm (Table XIV). Calculated LODs for Flonicamid, and its metabolites TFNA-AM, TFNG and TFNA on mint oil were 0.005, 0.006, 0.004 and 0.004 µg/g respectively. While calculated LOQs for Flonicamid, and its metabolites TFNA-AM, TFNG and TFNA were 0.014, 0.017, 0.013 and 0.012µg/g, respectively. Calculations were based on the LLMV using a one-tailed‘t’ statistic as described in The Handbook of Environmental Analysis, 4th Edition, by Roy-Keith Smith, Genium Publishing Corporation, 1999. These calculated values support the lowest level of quantification used as a part of this study as they are less than the LLMV of 0.02 ppm. The calculation spreadsheets used for generating calculated LOD and LOQs are shown in Attachment B. Mint tops and mint oil storage stability samples were spiked with Flonicamid, and its metabolites TFNA-AM, TFNA and TFNG at 0.20 ppm for each compound. For mint tops, samples were stored for 372 days prior to analysis. Recoveries were 85 ± 3, 79 ± 4, 81 ± 2, and 73 ± 7 for Flonicamid, TFNA-AM, TFNG and TFNA, respectively. These results demonstrate that Flonicamid and its metabolites are stable under the storage conditions used for the treated samples (Table XV).
IR-4 North Central Region Laboratory, Michigan State University Analytical Summary Report PR# 09538
Page 17

For mint oil storage stability, samples were stored 368 days prior to analysis. Samples were prepared using 5 g of mint oil rather than the 2.5 g used in the working method. The concurrent recovery used in the storage stability test was prepared with 5 g of oil to compensate for the difference. In addition, volumes were adjusted relative to the increased sample size throughout the methodology on the entire set of storage stability mint oil samples. Recoveries were 44 ± 2, 50 ± 4, 44 ± 2, and 45 ± 73for Flonicamid, TFNA-AM, TFNG and TFNA, respectively. While it appears that the low recoveries were due to an inaccurate spiking was the samples, there is no data from the storage stability preparation that would support this hypothesis. Concurrent recoveries for both sets were within 70 to 120% as designated by protocol. The untreated control samples of both the mint tops and oil had no detectable residues of Flonicamid, or its metabolites TFNA-AM, TFNG and TFNA at greater than the LLMV (i.e., < 0.02 ppm) (Table XVII). On mint tops, residues of Flonicamid varied on treated samples from a minimum of 0.500 ppm on replicate C of trial 11-WI17 to a maximum of 2.41 ppm on replicate D from field trial 11-ID12. Residues for TFNA-AM on mint tops ranged from 0.0723 ppm on replicate C from trial 11-WI17 to a maximum of 0.254 ppm on replicate D from trial 11-WA17. For TFNG, residues ranged from 0.219 ppm replicate D from trial 11-WI17to a maximum of 0.461 ppm for sample D from trial 11-WA17. Residues of TFNA ranged from 0.107 ppm replicate C from trial 11-WI17on treated samples from to a maximum of 0.235 ppm on replicate D of trial 11-WA17. Results from the mint oil analyses show that residues of Flonicamid and its metabolites TFNA-AM, TFNG and TFNA were less than the LLMV of 0.02ppm.
IR-4 North Central Region Laboratory, Michigan State University Analytical Summary Report PR# 09538
Page 18
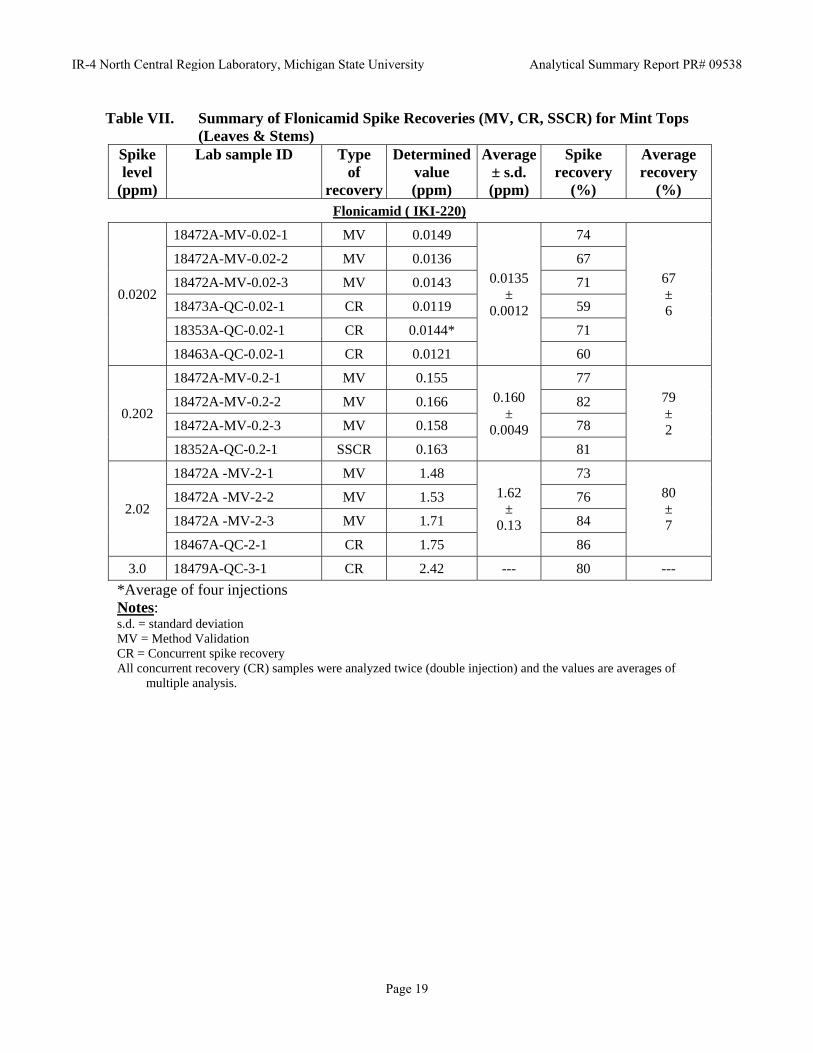
Table VII. Summary of Flonicamid Spike Recoveries (MV, CR, SSCR) for Mint Tops (Leaves & Stems)
Spike level
(ppm)
Lab sample ID Type of
recovery
Determined value (ppm)
Average± s.d. (ppm)
Spike recovery
(%)
Average recovery
(%) Flonicamid ( IKI-220)
0.0202
18472A-MV-0.02-1 MV 0.0149
0.0135 ±
0.0012
74
67 ± 6
18472A-MV-0.02-2 MV 0.0136 67
18472A-MV-0.02-3 MV 0.0143 71
18473A-QC-0.02-1 CR 0.0119 59
18353A-QC-0.02-1 CR 0.0144* 71
18463A-QC-0.02-1 CR 0.0121 60
0.202
18472A-MV-0.2-1 MV 0.155 0.160
± 0.0049
77 79 ± 2
18472A-MV-0.2-2 MV 0.166 82
18472A-MV-0.2-3 MV 0.158 78
18352A-QC-0.2-1 SSCR 0.163 81
2.02
18472A -MV-2-1 MV 1.48 1.62
± 0.13
73 80 ± 7
18472A -MV-2-2 MV 1.53 76
18472A -MV-2-3 MV 1.71 84
18467A-QC-2-1 CR 1.75 86
3.0 18479A-QC-3-1 CR 2.42 --- 80 ---
*Average of four injections Notes: s.d. = standard deviation MV = Method Validation CR = Concurrent spike recovery All concurrent recovery (CR) samples were analyzed twice (double injection) and the values are averages of
multiple analysis.
IR-4 North Central Region Laboratory, Michigan State University Analytical Summary Report PR# 09538
Page 19

Table VIII. Summary of TFNA-AM Spike Recoveries (MV, CR, SSCR) for Mint Tops (Leaves & Stems)
Spike level
(ppm)
Lab sample ID Type of
recovery
Determined value (ppm)
Average± s.d. (ppm)
Spike recovery
(%)
Average recovery
(%)
TFNA-AM
0.02024
18472A-MV-0.02-1 MV 0.0149
0.0151 ±
0.0092
74
75 ± 5
18472A-MV-0.02-2 MV 0.0145 72
18472A-MV-0.02-3 MV 0.0141 70
18473A-QC-0.02-1 CR 0.0146 72
18353A-QC-0.02-1 CR 0.0163* 81
18463A-QC-0.02-1 CR 0.0162 80
0.2024
18472A-MV-0.2-1 MV 0.182 0.173
± 0.0075
90 86 ± 4
18472A-MV-0.2-2 MV 0.172 85
18472A-MV-0.2-3 MV 0.175 86
18352A-QC-0.2-1 SSCR 0.164 81
2.024
18472A -MV-2-1 MV 1.49 1.66
± 0.12
73 82 ± 7
18472A -MV-2-2 MV 1.69 83
18472A -MV-2-3 MV 1.77 87
18467A-QC-2-1 CR 1.71 84
3.0 18479A-QC-3-1 CR 2.44 --- 80 ---
*average of 4 injections Notes: s.d. = standard deviation MV = Method Validation CR = Concurrent spike recovery All concurrent recovery (CR) samples were analyzed twice (double injection) and the values are averages of
multiple analysis.
IR-4 North Central Region Laboratory, Michigan State University Analytical Summary Report PR# 09538
Page 20
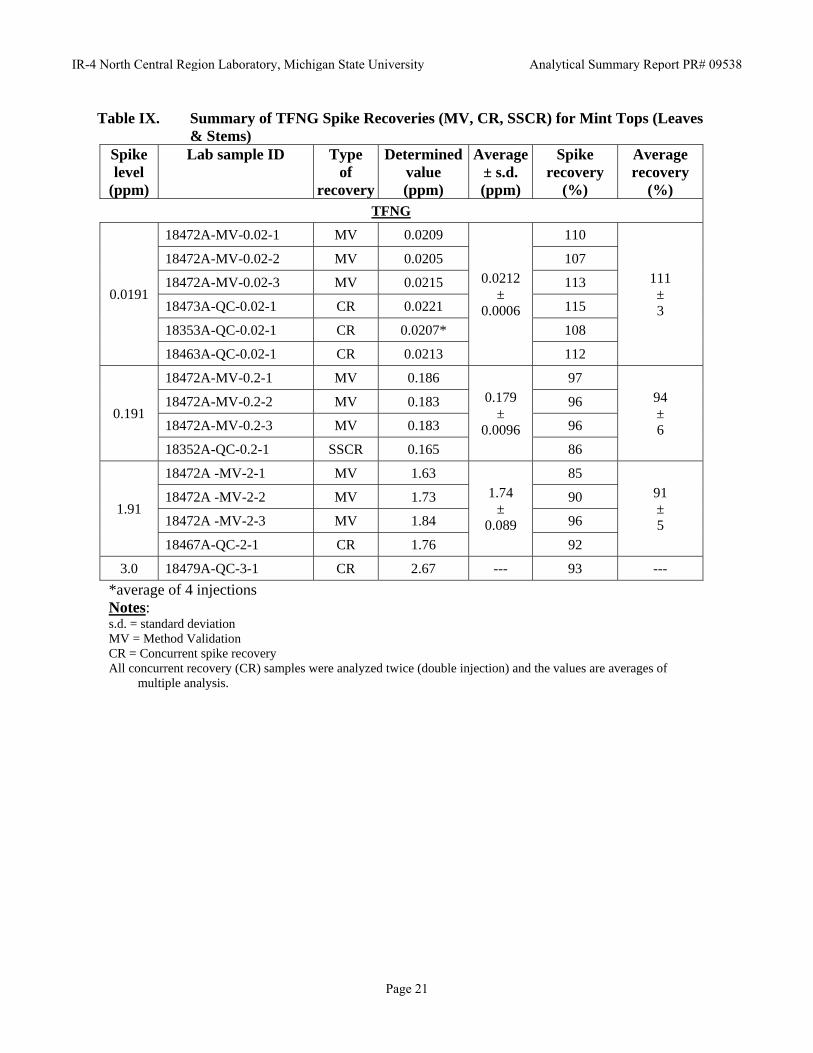
Table IX. Summary of TFNG Spike Recoveries (MV, CR, SSCR) for Mint Tops (Leaves & Stems)
Spike level
(ppm)
Lab sample ID Type of
recovery
Determined value (ppm)
Average± s.d. (ppm)
Spike recovery
(%)
Average recovery
(%) TFNG
0.0191
18472A-MV-0.02-1 MV 0.0209
0.0212 ±
0.0006
110
111 ± 3
18472A-MV-0.02-2 MV 0.0205 107
18472A-MV-0.02-3 MV 0.0215 113
18473A-QC-0.02-1 CR 0.0221 115
18353A-QC-0.02-1 CR 0.0207* 108
18463A-QC-0.02-1 CR 0.0213 112
0.191
18472A-MV-0.2-1 MV 0.186 0.179
± 0.0096
97 94 ± 6
18472A-MV-0.2-2 MV 0.183 96
18472A-MV-0.2-3 MV 0.183 96
18352A-QC-0.2-1 SSCR 0.165 86
1.91
18472A -MV-2-1 MV 1.63 1.74
± 0.089
85 91 ± 5
18472A -MV-2-2 MV 1.73 90
18472A -MV-2-3 MV 1.84 96
18467A-QC-2-1 CR 1.76 92
3.0 18479A-QC-3-1 CR 2.67 --- 93 ---
*average of 4 injections Notes: s.d. = standard deviation MV = Method Validation CR = Concurrent spike recovery All concurrent recovery (CR) samples were analyzed twice (double injection) and the values are averages of
multiple analysis.
IR-4 North Central Region Laboratory, Michigan State University Analytical Summary Report PR# 09538
Page 21
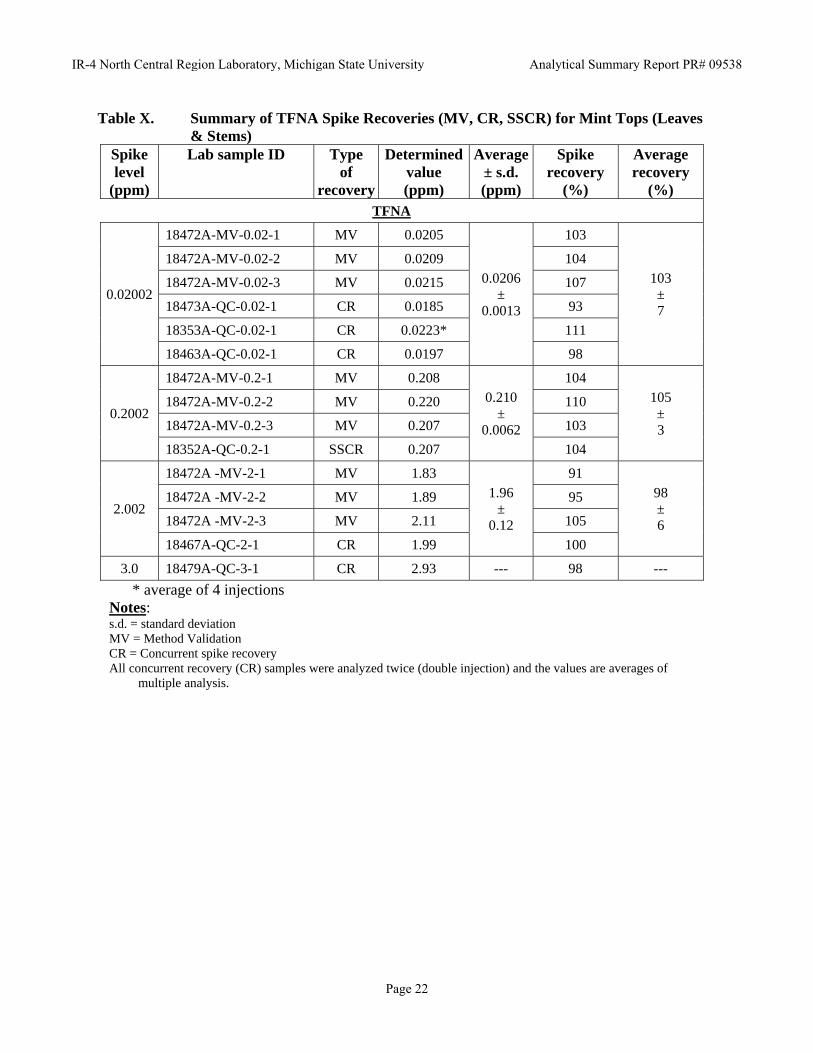
Table X. Summary of TFNA Spike Recoveries (MV, CR, SSCR) for Mint Tops (Leaves & Stems)
Spike level
(ppm)
Lab sample ID Type of
recovery
Determined value (ppm)
Average± s.d. (ppm)
Spike recovery
(%)
Average recovery
(%) TFNA
0.02002
18472A-MV-0.02-1 MV 0.0205
0.0206 ±
0.0013
103
103 ± 7
18472A-MV-0.02-2 MV 0.0209 104
18472A-MV-0.02-3 MV 0.0215 107
18473A-QC-0.02-1 CR 0.0185 93
18353A-QC-0.02-1 CR 0.0223* 111
18463A-QC-0.02-1 CR 0.0197 98
0.2002
18472A-MV-0.2-1 MV 0.208 0.210
± 0.0062
104 105 ± 3
18472A-MV-0.2-2 MV 0.220 110
18472A-MV-0.2-3 MV 0.207 103
18352A-QC-0.2-1 SSCR 0.207 104
2.002
18472A -MV-2-1 MV 1.83 1.96
± 0.12
91 98 ± 6
18472A -MV-2-2 MV 1.89 95
18472A -MV-2-3 MV 2.11 105
18467A-QC-2-1 CR 1.99 100
3.0 18479A-QC-3-1 CR 2.93 --- 98 ---
* average of 4 injections Notes: s.d. = standard deviation MV = Method Validation CR = Concurrent spike recovery All concurrent recovery (CR) samples were analyzed twice (double injection) and the values are averages of
multiple analysis.
IR-4 North Central Region Laboratory, Michigan State University Analytical Summary Report PR# 09538
Page 22

Table XI. Summary of Flonicamid Spike Recoveries (MV, CR, SSCR) for Mint Oil
Spike level
(ppm)
Lab sample ID Type of
recovery
Determined value (ppm)
Average± s.d. (ppm)
Spike recovery
(%)
Average recovery
(%) Flonicamid ( IKI-220)
0.0202
18476A-MV-0.02-1 MV 0.0208
0.0194 ±
0.0014
103
96 ± 7
18476A-MV-0.02-2 MV 0.0176 87
18476A-MV-0.02-3 MV 0.0205 102
18476A-QC-0.02-1 CR 0.0179 89
18470A-QC-0.02-1 CR 0.0198 98
18470A-QC-0.02-2 CR 0.0199 98
0.202
18476A-MV-0.2-1 MV 0.189
0.188 ±
0.0083
93
93 ± 4
18476A-MV-0.2-2 MV 0.178 88
18476A-MV-0.2-3 MV 0.199 98
18476A-QC-0.2-1 CR 0.181 89
18470A-QC-0.2-1 SSCR 0.192 95
2.02
18476A-MV-2-1 MV 1.83 1.75 ±
0.074
91 87 ± 4
18476A-MV-2-2 MV 1.75 87
18476A-MV-2-3 MV 1.68 83
Notes: s.d. = standard deviation MV = Method Validation CR = Concurrent spike recovery All concurrent recovery (CR) samples were analyzed twice (double injection) and the values are averages of
multiple analysis.
IR-4 North Central Region Laboratory, Michigan State University Analytical Summary Report PR# 09538
Page 23

Table XII. Summary of TFNA-AM Spike Recoveries (MV, CR, SSCR) for Mint Oil
Spike level
(ppm)
Lab sample ID Type of
recovery
Determined value (ppm)
Average± s.d. (ppm)
Spike recovery
(%)
Average recovery
(%) TFNA-AM
0.02024
18476A-MV-0.02-1 MV 0.0188
0.0194 ±
0.0016
93
96 ± 8
18476A-MV-0.02-2 MV 0.0197 97
18476A-MV-0.02-3 MV 0.0206 102
18476A-QC-0.02-1 CR 0.0165 81
18470A-QC-0.02-1 CR 0.0210 104
18470A-QC-0.02-2 CR 0.0202 100
0.2024
18476A-MV-0.2-1 MV 0.191
0.176 ±
0.013
94
87 ± 6
18476A-MV-0.2-2 MV 0.179 88
18476A-MV-0.2-3 MV 0.186 92
18476A-QC-0.2-1 CR 0.163 80
18470A-QC-0.2-1 SSCR 0.164 81
2.024
18476A-MV-2-1 MV 1.78 1.78 ±
0.052
88 88 ± 3
18476A-MV-2-2 MV 1.83 91
18476A-MV-2-3 MV 1.73 85 Notes: s.d. = standard deviation MV = Method Validation CR = Concurrent spike recovery All concurrent recovery (CR) samples were analyzed twice (double injection) and the values are averages of
multiple analysis.
IR-4 North Central Region Laboratory, Michigan State University Analytical Summary Report PR# 09538
Page 24

Table XIII. Summary of TFNG Spike Recoveries (MV, CR, SSCR) for Mint Oil
Spike level
(ppm)
Lab sample ID Type of
recovery
Determined value (ppm)
Average± s.d. (ppm)
Spike recovery
(%)
Average recovery
(%) TFNG
0.0191
18476A-MV-0.02-1 MV 0.0178
0.0169 ±
0.0013
93
88 ± 7
18476A-MV-0.02-2 MV 0.0167 87
18476A-MV-0.02-3 MV 0.0178 93
18476A-QC-0.02-1 CR 0.0151 79
18470A-QC-0.02-1 CR 0.0157 82
18470A-QC-0.02-2 CR 0.0181 95
0.191
18476A-MV-0.2-1 MV 0.181
0.179 ±
0.0094
95
94 ± 6
18476A-MV-0.2-2 MV 0.184 96
18476A-MV-0.2-3 MV 0.191 100
18476A-QC-0.2-1 CR 0.170 89
18470A-QC-0.2-1 SSCR 0.169 89
1.91
18476A-MV-2-1 MV 1.83 1.80 ±
0.041
96 94 ± 2
18476A-MV-2-2 MV 1.83 96
18476A-MV-2-3 MV 1.76 92 Notes: s.d. = standard deviation MV = Method Validation CR = Concurrent spike recovery All concurrent recovery (CR) samples were analyzed twice (double injection) and the values are averages of
multiple analysis.
IR-4 North Central Region Laboratory, Michigan State University Analytical Summary Report PR# 09538
Page 25

Table XIV. Summary of TFNA Spike Recoveries (MV, CR, SSCR) for Mint Oil
Spike level
(ppm)
Lab sample ID Type of
recovery
Determined value (ppm)
Average± s.d. (ppm)
Spike recovery
(%)
Average recovery
(%) TFNA
0.02002
18476A-MV-0.02-1 MV 0.0177
0.0183 ±
0.0011
88
91 ± 6
18476A-MV-0.02-2 MV 0.0181 90
18476A-MV-0.02-3 MV 0.0185 93
18476A-QC-0.02-1 CR 0.0173 86
18470A-QC-0.02-1 CR 0.0177 89
18470A-QC-0.02-2 CR 0.0205 102
0.2002
18476A-MV-0.2-1 MV 0.182
0.186 ±
0.0086
91
93 ± 4
18476A-MV-0.2-2 MV 0.180 90
18476A-MV-0.2-3 MV 0.189 95
18476A-QC-0.2-1 CR 0.180 90
18470A-QC-0.2-1 SSCR 0.200 100
2.002
18476A-MV-2-1 MV 1.91 1.78 ±
0.12
95 89 ± 6
18476A-MV-2-2 MV 1.73 86
18476A-MV-2-3 MV 1.70 85
Notes: s.d. = standard deviation MV = Method Validation CR = Concurrent spike recovery All concurrent recovery (CR) samples were analyzed twice (double injection) and the values are averages of
multiple analysis.
IR-4 North Central Region Laboratory, Michigan State University Analytical Summary Report PR# 09538
Page 26
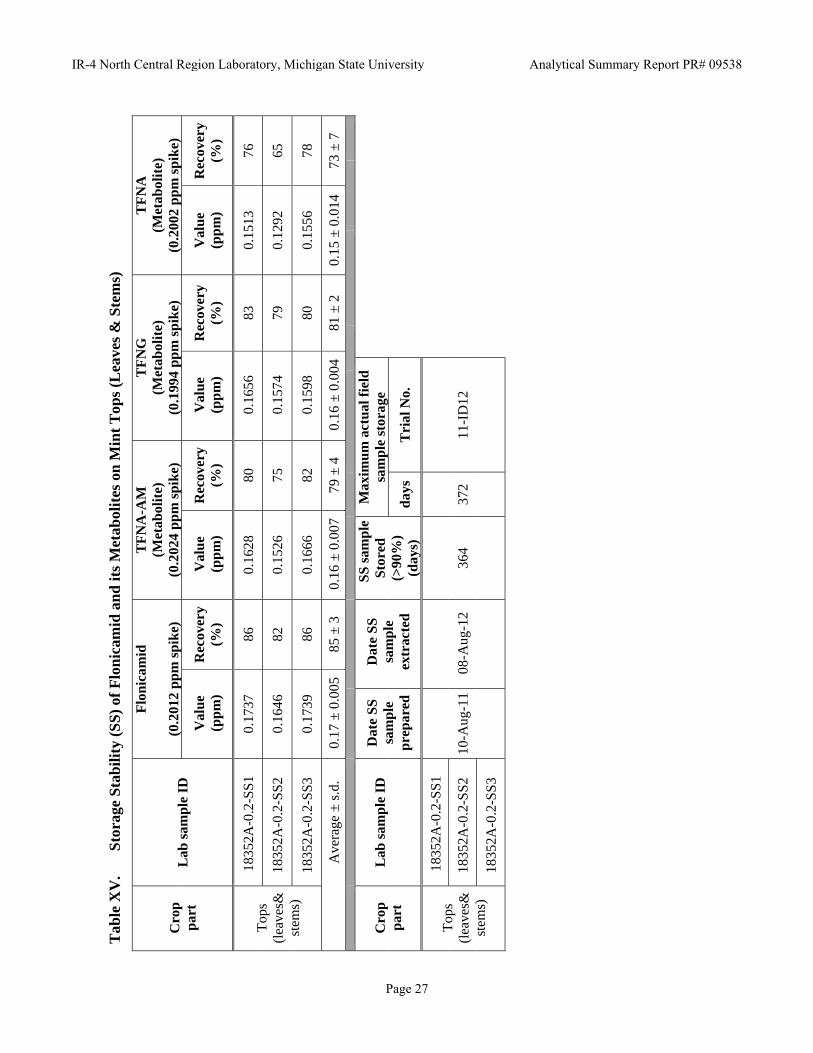
Tab
le X
V.
Sto
rage
Sta
bil
ity
(SS
) of
Flo
nic
amid
an
d it
s M
etab
olit
es o
n M
int
Top
s (L
eave
s &
Ste
ms)
Cro
p
par
t L
ab s
amp
le I
D
Flo
nic
amid
(0.2
012
pp
m s
pik
e)
TF
NA
-AM
(M
etab
olit
e)
(0.2
024
pp
m s
pik
e)
TF
NG
(M
etab
olit
e)
(0.1
994
pp
m s
pik
e)
TF
NA
(M
etab
olit
e)
(0.2
002
pp
m s
pik
e)
Val
ue
(pp
m)
Rec
over
y(%
) V
alu
e (p
pm
) R
ecov
ery
(%)
Val
ue
(pp
m)
Rec
over
y (%
) V
alu
e (p
pm
) R
ecov
ery
(%)
Top
s (l
eave
s&
stem
s)
1835
2A-0
.2-S
S1
0.17
37
86
0.16
28
80
0.16
56
83
0.15
13
76
1835
2A-0
.2-S
S2
0.16
46
82
0.15
26
75
0.15
74
79
0.12
92
65
1835
2A-0
.2-S
S3
0.17
39
86
0.16
66
82
0.15
98
80
0.15
56
78
A
vera
ge ±
s.d
. 0.
17 ±
0.0
05
85 ±
3
0.16
± 0
.007
79
± 4
0.
16 ±
0.0
04
81 ±
2
0.15
± 0
.014
73
± 7
Cro
p
par
t L
ab s
amp
le I
D
Dat
e S
S
sam
ple
p
rep
ared
Dat
e S
S
sam
ple
ex
trac
ted
SS
sam
ple
Sto
red
(>
90%
) (d
ays)
Max
imu
m a
ctu
al f
ield
sa
mp
le s
tora
ge
day
s T
rial
No.
Top
s (l
eave
s&
stem
s)
1835
2A-0
.2-S
S1
1835
2A-0
.2-S
S2
10-A
ug-1
108
-Aug
-12
364
372
11-I
D12
1835
2A-0
.2-S
S3
IR-4 North Central Region Laboratory, Michigan State University Analytical Summary Report PR# 09538
Page 27

Tab
le X
VI.
Sto
rage
Sta
bil
ity
(SS
) of
Flo
nic
amid
an
d it
s M
etab
olit
es o
n M
int
Oil
Cro
p
par
t L
ab s
amp
le I
D
Flo
nic
amid
(0.2
012
pp
m s
pik
e)
TF
NA
-AM
(M
etab
olit
e)
(0.2
024
pp
m s
pik
e)
TF
NG
(M
etab
olit
e)
(0.1
994
pp
m s
pik
e)
TF
NA
(M
etab
olit
e)
(0.2
002
pp
m s
pik
e)
Val
ue
(pp
m)
Rec
over
y(%
) V
alu
e (p
pm
) R
ecov
ery
(%)
Val
ue
(pp
m)
Rec
over
y (%
) V
alu
e (p
pm
) R
ecov
ery
(%)
Min
t Oil
1847
0A-0
.2-S
S1
0.09
26
46
0.10
77
53
0.08
40
42
0.08
45
42
1847
0A-0
.2-S
S2
0.08
70
43
0.09
23
46
0.08
99
45
0.09
74
49
1847
0A-0
.2-S
S3
0.08
74
43
0.10
68
53
0.09
03
45
0.08
94
45
A
vera
ge ±
s.d
. 0.
089
± 0.
003
44 ±
2
0.10
± 0
.009
50
± 4
0.
088
± 0.
004
44 ±
2
0.09
± 0
.007
45
± 3
Cro
p
par
t L
ab s
amp
le I
D
Dat
e S
S
sam
ple
p
rep
ared
Dat
e S
S
sam
ple
ex
trac
ted
SS
sam
ple
Sto
red
(>
90%
) (d
ays)
Max
imu
m a
ctu
al f
ield
sa
mp
le s
tora
ge
day
s T
rial
No.
Min
t oil
1847
0A-0
.2-S
S1
1847
0A-0
.2-S
S2
8-S
ep-1
1 07
-Aug
-12
334
368
11-W
A*1
8
1847
0A-0
.2-S
S3
IR-4 North Central Region Laboratory, Michigan State University Analytical Summary Report PR# 09538
Page 28
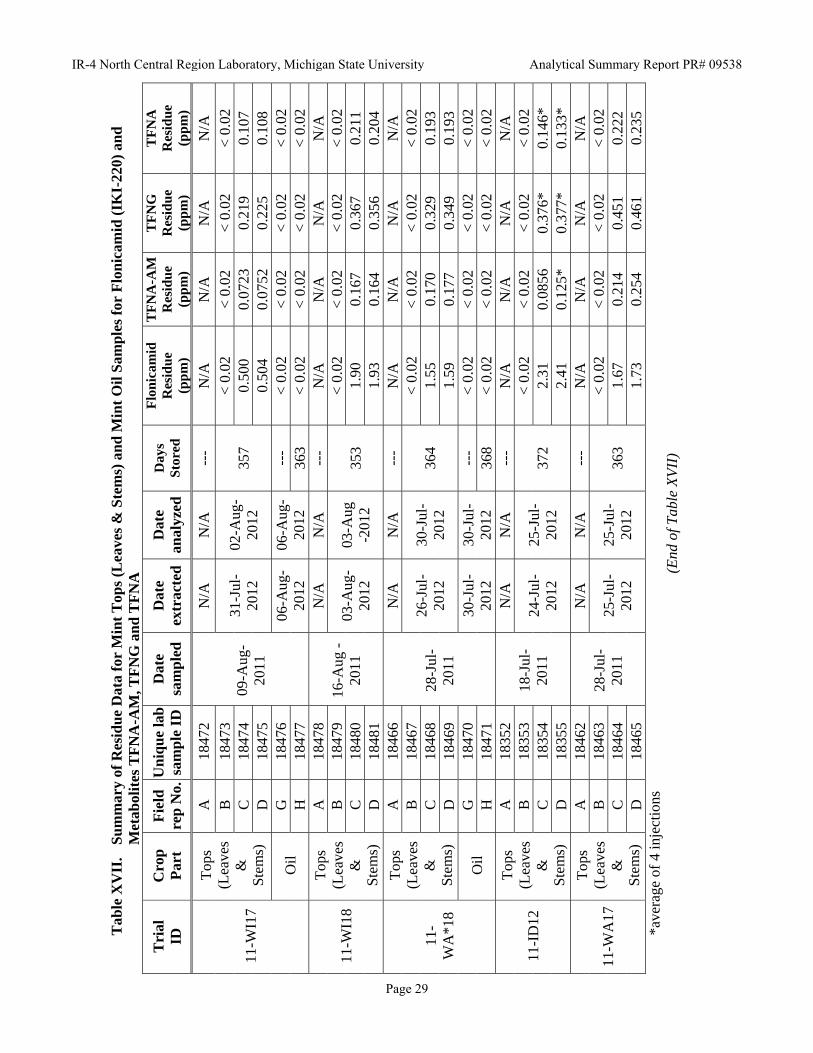
Tab
le X
VII
. S
um
mar
y of
Res
idu
e D
ata
for
Min
t T
ops
(Lea
ves
& S
tem
s) a
nd
Min
t O
il S
ampl
es f
or F
lon
icam
id (
IKI-
220)
an
d
Met
abol
ites
TF
NA
-AM
, TF
NG
an
d T
FN
A
Tri
al
ID
Cro
p
Par
t F
ield
re
p N
o. U
niq
ue
lab
sa
mp
le I
DD
ate
sam
ple
d D
ate
extr
acte
dD
ate
anal
yzed
Day
s S
tore
d
Flo
nic
amid
R
esid
ue
(pp
m)
TF
NA
-AM
Res
idu
e (p
pm
)
TF
NG
R
esid
ue
(pp
m)
TF
NA
R
esid
ue
(pp
m)
11-W
I17
Top
s (L
eave
s &
S
tem
s)
A
1847
2
09-A
ug-
2011
N/A
N
/A
---
N/A
N
/A
N/A
N
/A
B
1847
3 31
-Jul
-20
12
02-A
ug-
2012
35
7 <
0.0
2 <
0.0
2 <
0.0
2 <
0.0
2 C
18
474
0.50
0 0.
0723
0.
219
0.10
7 D
18
475
0.50
4 0.
0752
0.
225
0.10
8
Oil
G
18
476
06-A
ug-
2012
06
-Aug
-20
12
---
< 0
.02
< 0
.02
< 0
.02
< 0
.02
H
1847
7 36
3 <
0.0
2 <
0.0
2 <
0.0
2 <
0.0
2
11-W
I18
Top
s (L
eave
s &
S
tem
s)
A
1847
8 16
-Aug
-20
11
N/A
N
/A
---
N/A
N
/A
N/A
N
/A
B
1847
9 03
-Aug
-20
12
03-A
ug
-201
2 35
3 <
0.0
2 <
0.0
2 <
0.0
2 <
0.0
2 C
18
480
1.90
0.
167
0.36
7 0.
211
D
1848
1 1.
93
0.16
4 0.
356
0.20
4
11-
WA
*18
Top
s (L
eave
s&
S
tem
s)
A
1846
6
28-J
ul-
2011
N/A
N
/A
---
N/A
N
/A
N/A
N
/A
B
1846
7 26
-Jul
-20
12
30-J
ul-
2012
36
4 <
0.0
2 <
0.0
2 <
0.0
2 <
0.0
2 C
18
468
1.55
0.
170
0.32
9 0.
193
D
1846
9 1.
59
0.17
7 0.
349
0.19
3
Oil
G
18
470
30-J
ul-
2012
30
-Jul
-20
12
---
< 0
.02
< 0
.02
< 0
.02
< 0
.02
H
1847
1 36
8 <
0.0
2 <
0.0
2 <
0.0
2 <
0.0
2
11-I
D12
Top
s (L
eave
s&
S
tem
s)
A
1835
2 18
-Jul
-20
11
N/A
N
/A
---
N/A
N
/A
N/A
N
/A
B
1835
3 24
-Jul
-20
12
25-J
ul-
2012
37
2 <
0.0
2 <
0.0
2 <
0.0
2 <
0.0
2 C
18
354
2.31
0.
0856
0.
376*
0.
146*
D
18
355
2.41
0.
125*
0.
377*
0.
133*
11-W
A17
Top
s (L
eave
s&
S
tem
s)
A
1846
2 28
-Jul
-20
11
N/A
N
/A
---
N/A
N
/A
N/A
N
/A
B
1846
3 25
-Jul
-20
12
25-J
ul-
2012
36
3 <
0.0
2 <
0.0
2 <
0.0
2 <
0.0
2 C
18
464
1.67
0.
214
0.45
1 0.
222
D
1846
5 1.
73
0.25
4 0.
461
0.23
5 *a
vera
ge o
f 4
inje
ctio
ns
(End
of T
able
XV
II)
IR-4 North Central Region Laboratory, Michigan State University Analytical Summary Report PR# 09538
Page 29
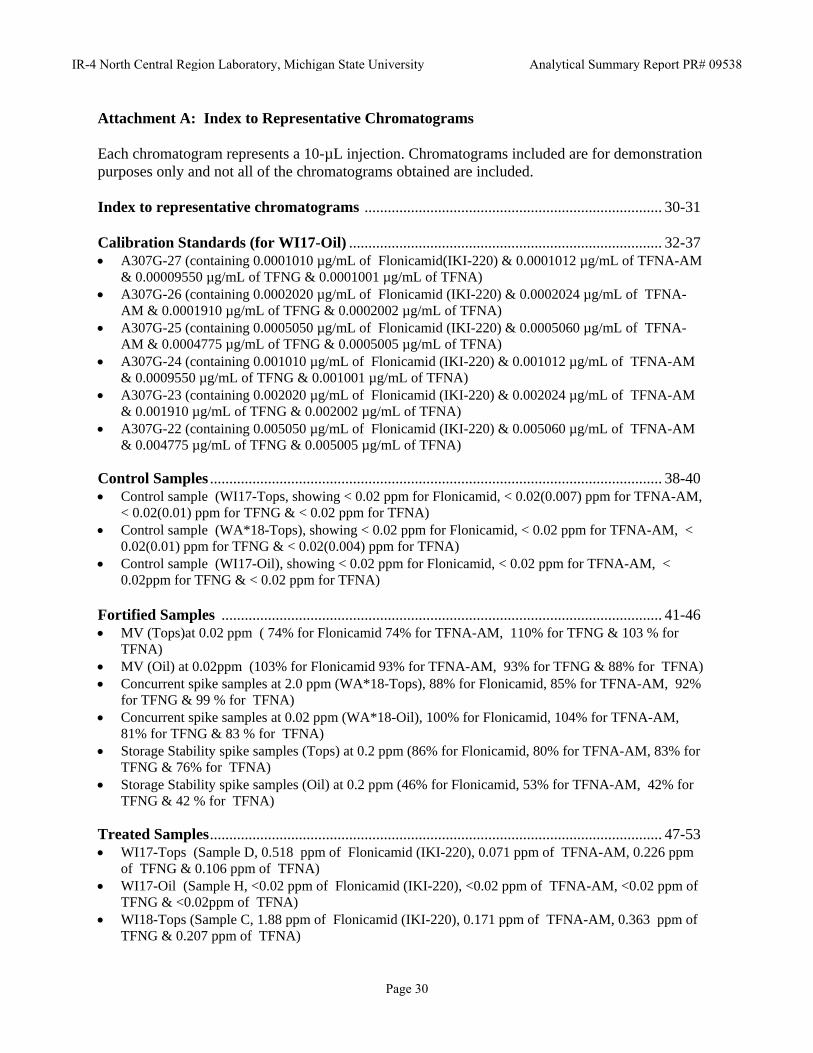
Attachment A: Index to Representative Chromatograms Each chromatogram represents a 10-µL injection. Chromatograms included are for demonstration purposes only and not all of the chromatograms obtained are included. Index to representative chromatograms ............................................................................. 30-31
Calibration Standards (for WI17-Oil) ................................................................................. 32-37 A307G-27 (containing 0.0001010 µg/mL of Flonicamid(IKI-220) & 0.0001012 µg/mL of TFNA-AM
& 0.00009550 µg/mL of TFNG & 0.0001001 µg/mL of TFNA) A307G-26 (containing 0.0002020 µg/mL of Flonicamid (IKI-220) & 0.0002024 µg/mL of TFNA-
AM & 0.0001910 µg/mL of TFNG & 0.0002002 µg/mL of TFNA) A307G-25 (containing 0.0005050 µg/mL of Flonicamid (IKI-220) & 0.0005060 µg/mL of TFNA-
AM & 0.0004775 µg/mL of TFNG & 0.0005005 µg/mL of TFNA) A307G-24 (containing 0.001010 µg/mL of Flonicamid (IKI-220) & 0.001012 µg/mL of TFNA-AM
& 0.0009550 µg/mL of TFNG & 0.001001 µg/mL of TFNA) A307G-23 (containing 0.002020 µg/mL of Flonicamid (IKI-220) & 0.002024 µg/mL of TFNA-AM
& 0.001910 µg/mL of TFNG & 0.002002 µg/mL of TFNA) A307G-22 (containing 0.005050 µg/mL of Flonicamid (IKI-220) & 0.005060 µg/mL of TFNA-AM
& 0.004775 µg/mL of TFNG & 0.005005 µg/mL of TFNA) Control Samples ..................................................................................................................... 38-40 Control sample (WI17-Tops, showing < 0.02 ppm for Flonicamid, < 0.02(0.007) ppm for TFNA-AM,
< 0.02(0.01) ppm for TFNG & < 0.02 ppm for TFNA) Control sample (WA*18-Tops), showing < 0.02 ppm for Flonicamid, < 0.02 ppm for TFNA-AM, <
0.02(0.01) ppm for TFNG & < 0.02(0.004) ppm for TFNA) Control sample (WI17-Oil), showing < 0.02 ppm for Flonicamid, < 0.02 ppm for TFNA-AM, <
0.02ppm for TFNG & < 0.02 ppm for TFNA)
Fortified Samples .................................................................................................................. 41-46 MV (Tops)at 0.02 ppm ( 74% for Flonicamid 74% for TFNA-AM, 110% for TFNG & 103 % for
TFNA) MV (Oil) at 0.02ppm (103% for Flonicamid 93% for TFNA-AM, 93% for TFNG & 88% for TFNA) Concurrent spike samples at 2.0 ppm (WA*18-Tops), 88% for Flonicamid, 85% for TFNA-AM, 92%
for TFNG & 99 % for TFNA) Concurrent spike samples at 0.02 ppm (WA*18-Oil), 100% for Flonicamid, 104% for TFNA-AM,
81% for TFNG & 83 % for TFNA) Storage Stability spike samples (Tops) at 0.2 ppm (86% for Flonicamid, 80% for TFNA-AM, 83% for
TFNG & 76% for TFNA) Storage Stability spike samples (Oil) at 0.2 ppm (46% for Flonicamid, 53% for TFNA-AM, 42% for
TFNG & 42 % for TFNA)
Treated Samples ..................................................................................................................... 47-53 WI17-Tops (Sample D, 0.518 ppm of Flonicamid (IKI-220), 0.071 ppm of TFNA-AM, 0.226 ppm
of TFNG & 0.106 ppm of TFNA) WI17-Oil (Sample H, <0.02 ppm of Flonicamid (IKI-220), <0.02 ppm of TFNA-AM, <0.02 ppm of
TFNG & <0.02ppm of TFNA) WI18-Tops (Sample C, 1.88 ppm of Flonicamid (IKI-220), 0.171 ppm of TFNA-AM, 0.363 ppm of
TFNG & 0.207 ppm of TFNA)
IR-4 North Central Region Laboratory, Michigan State University Analytical Summary Report PR# 09538
Page 30

WA*18-Tops (Sample D, 1.52 ppm of Flonicamid (IKI-220), 0.156 ppm of TFNA-AM, 316 ppm of TFNG & 0.168 ppm of TFNA)
WA*18-Oil (Sample H, <0.02 ppm of Flonicamid (IKI-220), <0.02 ppm of TFNA-AM, <0.02(0.004) ppm of TFNG & <0.02ppm of TFNA)
ID12-Tops (Sample D, 2.45ppm of Flonicamid (IKI-220), 0.150 ppm of TFNA-AM, 0.404 ppm of TFNG & 0.139ppm of TFNA)
WA17-Tops (Sample C, 1.70 ppm of Flonicamid (IKI-220), 0.233ppm of TFNA-AM, 0.468 ppm of TFNG & 0.227 ppm of TFNA)
IR-4 North Central Region Laboratory, Michigan State University Analytical Summary Report PR# 09538
Page 31

IR-4 North Central Region Laboratory, Michigan State University Analytical Summary Report PR# 09358
Page 32Attachment A: Representative Chromatograms

IR-4 North Central Region Laboratory, Michigan State University Analytical Summary Report PR# 09358
Page 33Attachment A: Representative Chromatograms

IR-4 North Central Region Laboratory, Michigan State University Analytical Summary Report PR# 09358
Page 34Attachment A: Representative Chromatograms

IR-4 North Central Region Laboratory, Michigan State University Analytical Summary Report PR# 09358
Page 35Attachment A: Representative Chromatograms

IR-4 North Central Region Laboratory, Michigan State University Analytical Summary Report PR# 09358
Page 36Attachment A: Representative Chromatograms

IR-4 North Central Region Laboratory, Michigan State University Analytical Summary Report PR# 09358
Page 37Attachment A: Representative Chromatograms

IR-4 North Central Region Laboratory, Michigan State University Analytical Summary Report PR# 09358
Page 38Attachment A: Representative Chromatograms
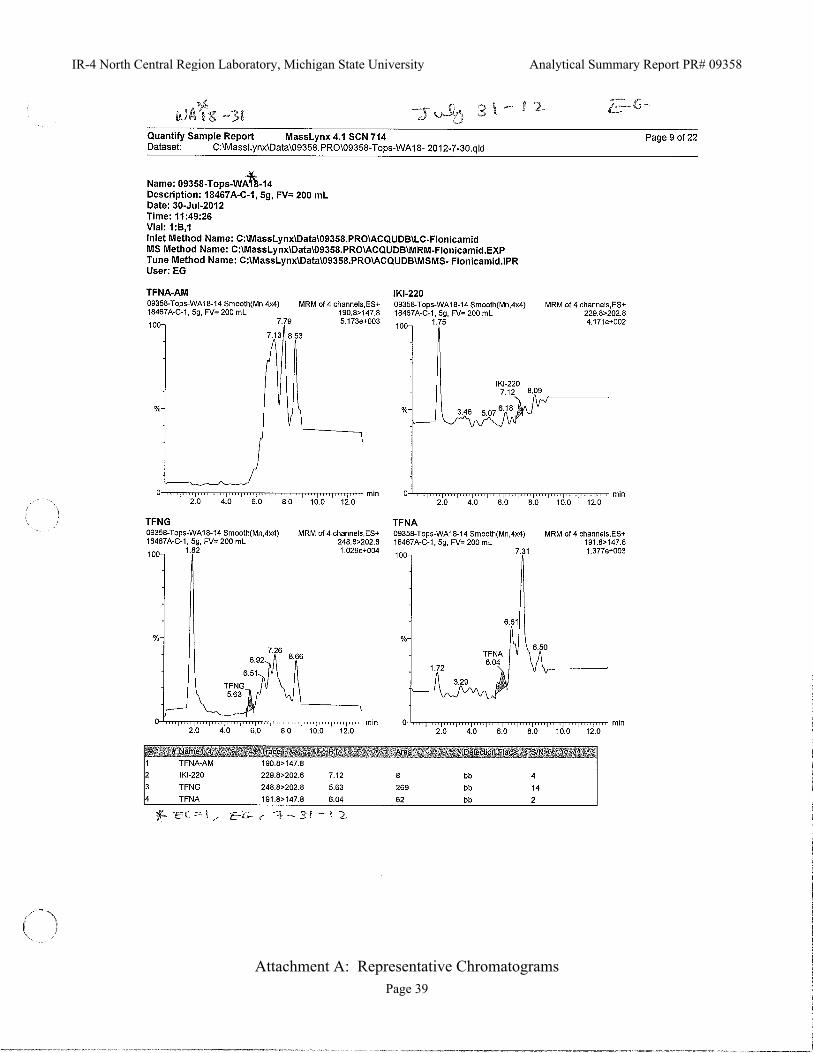
IR-4 North Central Region Laboratory, Michigan State University Analytical Summary Report PR# 09358
Page 39Attachment A: Representative Chromatograms

IR-4 North Central Region Laboratory, Michigan State University Analytical Summary Report PR# 09358
Page 40Attachment A: Representative Chromatograms

IR-4 North Central Region Laboratory, Michigan State University Analytical Summary Report PR# 09358
Page 41Attachment A: Representative Chromatograms

IR-4 North Central Region Laboratory, Michigan State University Analytical Summary Report PR# 09358
Page 42Attachment A: Representative Chromatograms
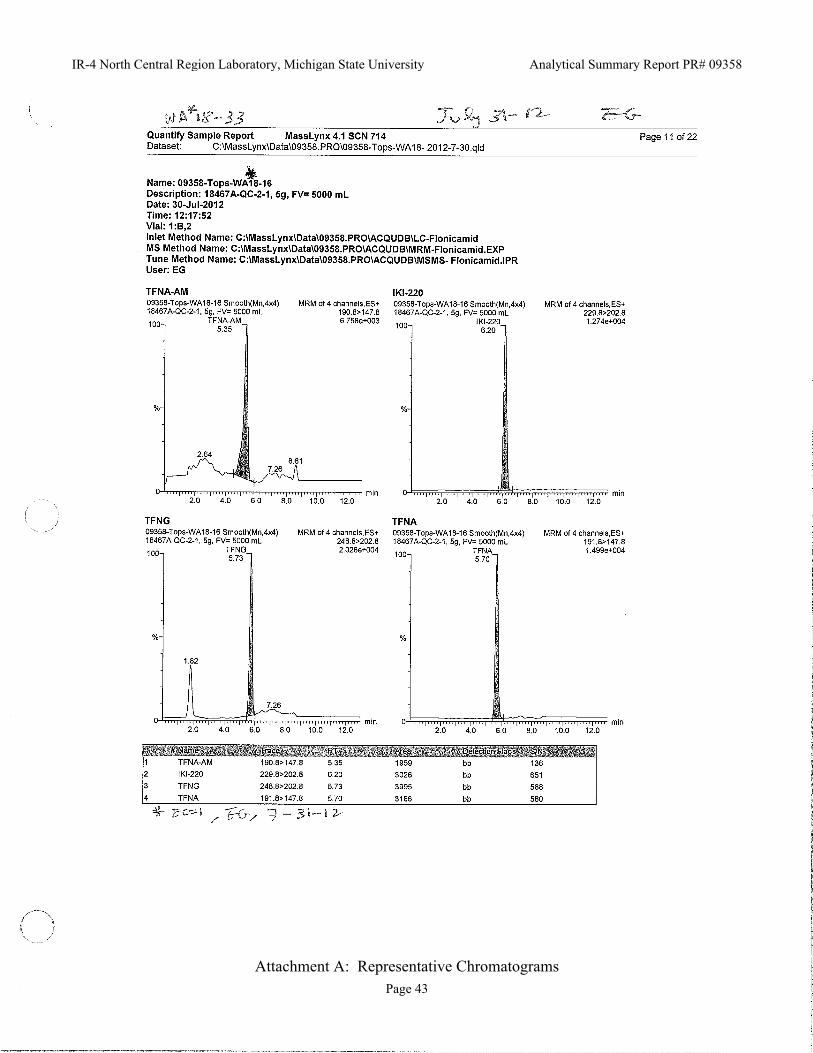
IR-4 North Central Region Laboratory, Michigan State University Analytical Summary Report PR# 09358
Page 43Attachment A: Representative Chromatograms
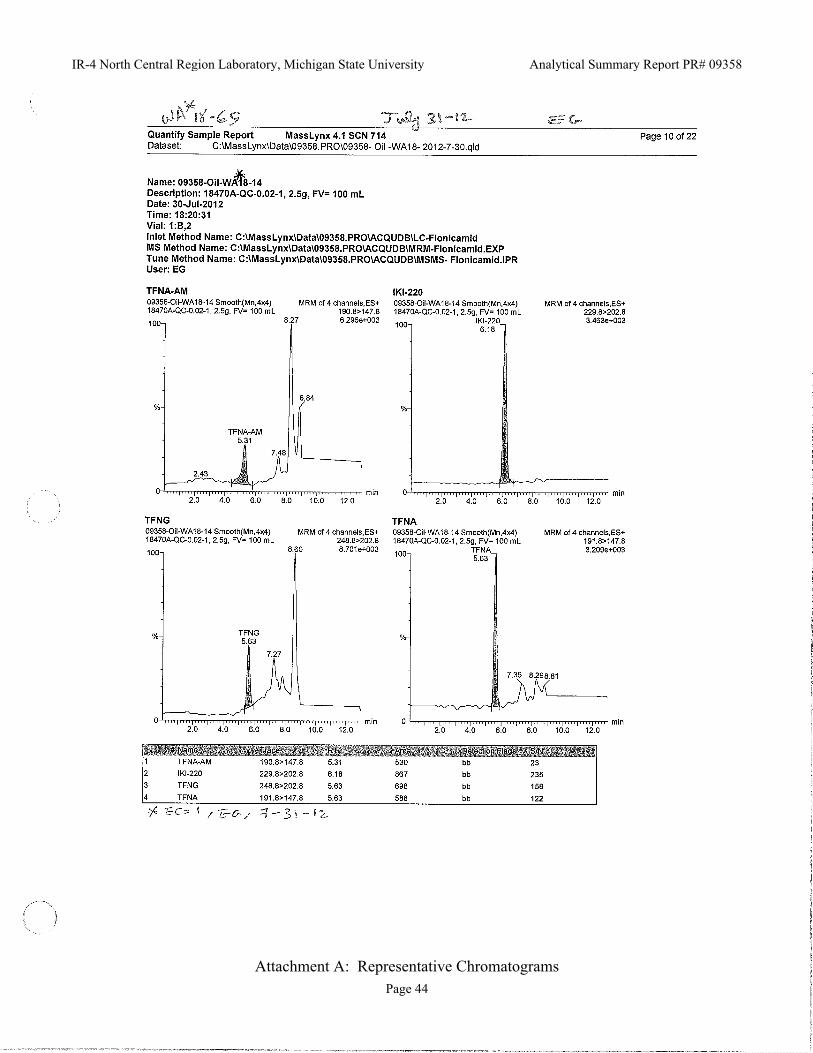
IR-4 North Central Region Laboratory, Michigan State University Analytical Summary Report PR# 09358
Page 44Attachment A: Representative Chromatograms

IR-4 North Central Region Laboratory, Michigan State University Analytical Summary Report PR# 09358
Page 45Attachment A: Representative Chromatograms
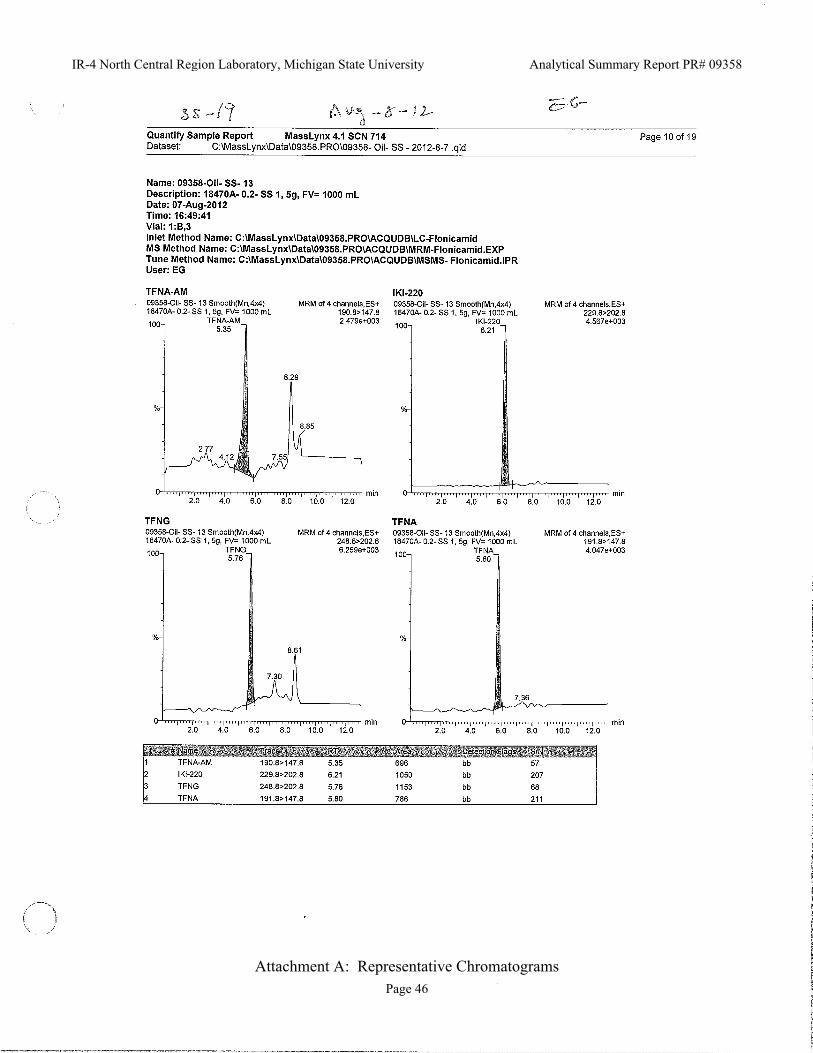
IR-4 North Central Region Laboratory, Michigan State University Analytical Summary Report PR# 09358
Page 46Attachment A: Representative Chromatograms

IR-4 North Central Region Laboratory, Michigan State University Analytical Summary Report PR# 09358
Page 47Attachment A: Representative Chromatograms

IR-4 North Central Region Laboratory, Michigan State University Analytical Summary Report PR# 09358
Page 48Attachment A: Representative Chromatograms

IR-4 North Central Region Laboratory, Michigan State University Analytical Summary Report PR# 09358
Page 49Attachment A: Representative Chromatograms

IR-4 North Central Region Laboratory, Michigan State University Analytical Summary Report PR# 09358
Page 50Attachment A: Representative Chromatograms
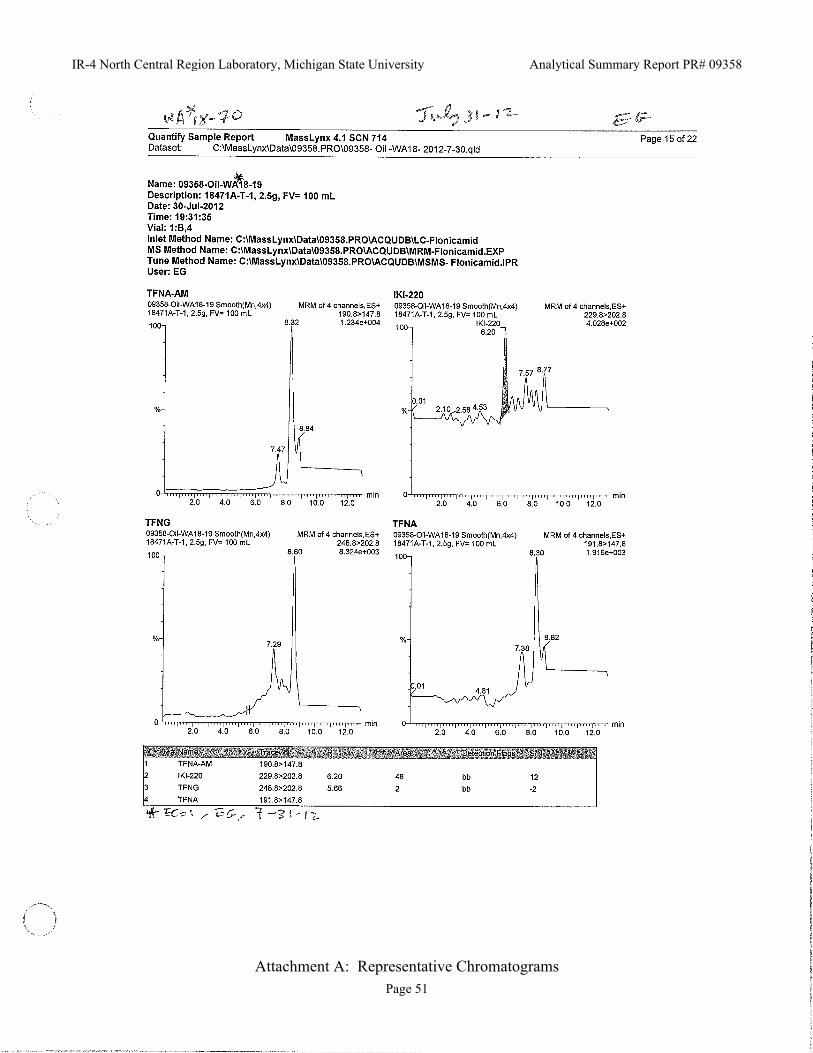
IR-4 North Central Region Laboratory, Michigan State University Analytical Summary Report PR# 09358
Page 51Attachment A: Representative Chromatograms
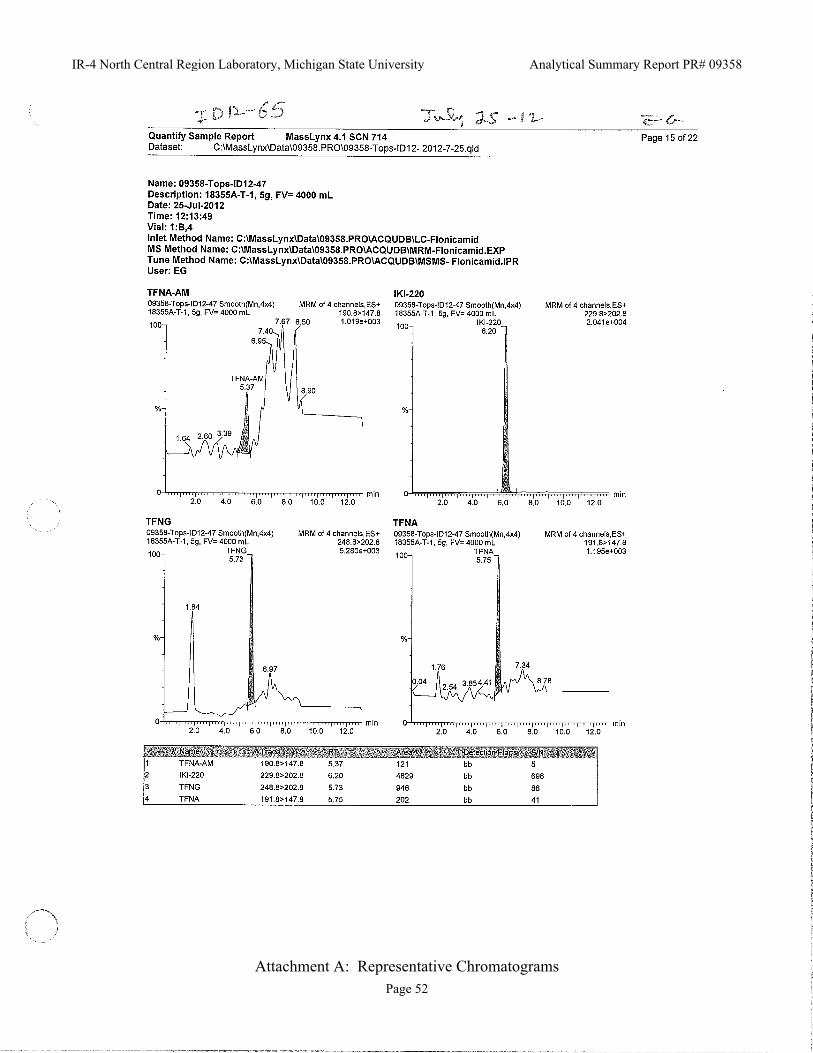
IR-4 North Central Region Laboratory, Michigan State University Analytical Summary Report PR# 09358
Page 52Attachment A: Representative Chromatograms

IR-4 North Central Region Laboratory, Michigan State University Analytical Summary Report PR# 09358
Page 53Attachment A: Representative Chromatograms

PR
OJE
CT
IN
FO
RM
AT
ION
PR
Num
ber:
09
358
Lab
orat
ory
ID:
0935
8.11
-MIR
05C
hem
ical
: Fl
onic
amid
Fiel
d ID
No.
for
MV
: 09
358.
11-W
I17
Ana
lysi
s fo
r:
TFN
A-A
MFi
eld
Res
earc
h D
irec
tor:
D
r. S
cott
Cha
pman
Com
mod
ity:
Min
tA
naly
st(s
):
Ein
a A
bouz
ied&
Les
ter
Gei
ssel
Cro
p pa
rt:
Min
t Oil
Inst
rum
ent:
UP
LC
/MS
/MS
CA
LIB
RA
TIO
N D
AT
AD
ate
of c
alib
ratio
n an
alys
is:
11-J
ul-1
2R
TS
DB
Pea
k--
----
--P
age
ID (
or n
ame)
Con
c.(µ
g/m
L)
Are
a
MV
-09A
A30
7G-2
70.
0001
012
250
Typ
e:
Lin
ear
regr
essi
onM
V-1
0A
307G
-26
0.00
0202
437
5E
quat
ion:
y
= m
x+
bM
V-1
1A
307G
-25
0.00
0506
096
4S
lope
, m =
1949
410
MV
-12
A30
7G-2
40.
0010
1217
15In
terc
ept,
b =
-113
.36
MV
-13
A30
7G-2
30.
0020
240
3232
R² =
0.99
26M
V-1
4A
307G
-22
0.00
5060
9663
LO
Q (
µg/
g) =
0.02
MV
-21
A30
7G-2
20.
0050
6010
258
MV
-22
A30
7G-2
30.
0020
240
3434
MV
-23A
A30
7G-2
40.
0010
1216
50M
V-2
4A
307G
-25
0.00
0506
011
26M
V-2
5A
307G
-26
0.00
0202
440
3M
V-2
6A
307G
-27
0.00
0101
229
1
AN
AL
YT
ICA
L D
AT
AE
xtra
ctio
n da
te:
11-J
ul-1
2A
naly
sis
date
:11
-Jul
-12
RT
SD
BS
ampl
eS
ampl
eS
pike
Sam
ple
Spi
keP
eak
Fina
lR
esid
ueS
pike
CA
LC
UL
AT
ION
PA
GE
Cal
ibra
tion
stan
dard
----
----
----
----
y =
194
9409
.879
5x -
113.
3608
R² =
0.9
926
0
2000
4000
6000
8000
1000
0
1200
0 0.00
00.
001
0.00
20.
003
0.00
40.
005
0.00
6
Peak area
Sta
nd
ard
Con
c. (
µg/
mL
)
Pag
eID
Typ
eA
dded
Wei
ght
Con
c.A
rea
Vol
ume
Foun
dR
ecov
ery
No.
*1(µ
g)(g
)(µ
g/g)
*2(c
ount
s)(m
L)
(µg/
g)*3
(%)*
4M
V-1
618
476A
-C-1
CN
A2.
50N
A0
100
< 0
.02
NA
MV
-17
1847
6A-M
V-0
.02-
1F
0.05
062.
500.
0202
480
110
00.
0187
692
.70
MV
-18
1847
6A-M
V-0
.02-
2F
0.05
062.
500.
0202
484
610
00.
0196
997
.26
MV
-19
1847
6A-M
V-0
.02-
3F
0.05
062.
500.
0202
489
210
00.
0206
310
1.92
NO
TE
S*1
: C=
Con
trol
, F=
Fort
ifie
d, T
=T
reat
ed*2
: Spi
ke a
mou
nt =
(S
pike
add
ed)
÷ (S
ampl
e w
eigh
t)*3
: Res
idue
am
ount
= [
(Are
a -
b) ÷
m]
x (F
inal
vol
/Sam
ple
wt)
*4. R
ecov
ery
(%)
=(R
esid
ue f
ound
) ÷
(spi
ke c
onc)
* 1
00"N
A"
stan
ds f
or "
Not
app
licab
le"
Attachment B: Calculation Worksheets, Standard Curves and LOD/LOQ Calculations
IR-4 North Central Region Laboratory, Michigan State University Analytical Summary Report PR# 09358
Page 54

PR
OJE
CT
IN
FO
RM
AT
ION
R N
umbe
r:
0935
8L
abor
ator
y ID
: 09
358.
11-M
IR05
Che
mic
al:
Flon
icam
i dF
ield
ID
No.
for
MV
: 09
358.
11-W
I17
naly
sis
for:
F
loni
cam
id (
IKI-
220)
Fie
ld R
esea
rch
Dir
ecto
r:
Dr.
Sco
tt C
hapm
anC
omm
odit
y:
Min
tA
naly
st(s
):
Ein
a A
bouz
ied&
Les
ter
Gei
ssel
Cro
p pa
rt:
Min
t Oil
Inst
rum
ent:
U
PL
C/M
S/M
SC
AL
IBR
AT
ION
DA
TA
Dat
e of
cal
ibra
tion
ana
lysi
s:
11-J
ul-1
2R
TSD
BP
eak
----
----
Pag
eID
(or
nam
e)C
onc.
(µg/
mL
)A
rea
MV
-09
A30
7G-2
70.
0001
010
213
Typ
e:
Lin
ear
regr
essi
onM
V-1
0A
307G
-26
0.00
0202
040
7E
quat
ion:
y
= m
x+
bM
V-1
1A
307G
-25
0.00
0505
012
70S
lope
, m =
2479
371
MV
-12
A30
7G-2
40.
0010
1023
37In
terc
ept,
b =
-16.
44M
V-1
3A
307G
-23
0.00
2020
049
15R
² =0.
9811
MV
-14
A30
7G-2
20.
0050
5011
055
LO
Q (
µg/
g) =
0.02
MV
-21
A30
7G-2
20.
0050
5013
926
MV
-22
A30
7G-2
30.
0020
200
5157
MV
-23
A30
7G-2
40.
0010
1025
44M
V-2
4A
307G
-25
0.00
0505
013
71M
V-2
5A
307G
-26
0.00
0202
041
7M
V-2
6A
307G
-27
0.00
0101
026
4
AN
AL
YT
ICA
L D
AT
AE
xtra
ctio
n da
te:
11-J
ul-1
2A
naly
sis
date
:11
-Jul
-12
RT
SDB
Sam
ple
Sam
ple
Spik
eSa
mpl
eSp
ike
Pea
kFi
nal
Res
idue
Spi
keP
age
IDT
ype
Add
edW
eigh
tC
onc.
Are
aV
olum
eF
ound
Rec
over
y
CA
LC
UL
AT
ION
PA
GE
Cal
ibra
tion
stan
dard
----
----
----
----
y =
247
9370
.723
6x -
16.4
412
R² =
0.9
811
0
2000
4000
6000
8000
1000
0
1200
0
1400
0
1600
0 0.00
00.
001
0.00
20.
003
0.00
40.
005
0.00
6
Peak area
Sta
nd
ard
Con
c. (
µg/
mL
)
Pag
eID
Typ
eA
dded
Wei
ght
Con
c.A
rea
Vol
ume
Fou
ndR
ecov
ery
No.
*1(µ
g)(g
)(µ
g/g)
*2(c
ount
s)(m
L)
(µg/
g)*3
(%)*
4
MV
-16
1847
6A-C
-1C
NA
2.50
NA
810
00.
0003
94N
A
MV
-17
1847
6A-M
V-0
.02-
1F
0.05
052.
500.
0202
012
7510
00.
0208
310
3.14
MV
-18
1847
6A-M
V-0
.02-
2F
0.05
052.
500.
0202
010
7210
00.
0175
686
.93
MV
-19
1847
6A-M
V-0
.02-
3F
0.05
052.
500.
0202
012
5610
00.
0205
310
1.63
NO
TE
S*1
: C=
Con
trol
, F=
Fort
ifie
d, T
=T
reat
ed*2
: Spi
ke a
mou
nt =
(Sp
ike
adde
d) ÷
(Sa
mpl
e w
eigh
t)*3
: Res
idue
am
ount
= [
(Are
a -
b) ÷
m]
x (F
inal
vol
/Sam
ple
wt)
*4. R
ecov
ery
(%)
=(R
esid
ue f
ound
) ÷
(spi
ke c
onc)
* 1
00"N
A"
stan
ds f
or "
Not
app
licab
le"
Attachment B: Calculation Worksheets, Standard Curves and LOD/LOQ Calculations
IR-4 North Central Region Laboratory, Michigan State University Analytical Summary Report PR# 09358
Page 55

PR
OJE
CT
IN
FO
RM
AT
ION
PR
Num
ber:
09
358
Lab
orat
ory
ID:
0935
8.11
-MIR
05C
hem
ical
: Fl
onic
amid
Fiel
d ID
No.
for
MV
: 09
358.
11-W
I17
Ana
lysi
s fo
r:
TFN
GFi
eld
Res
earc
h D
irec
tor:
D
r. S
cott
Cha
pman
Com
mod
ity:
M
int
Ana
lyst
(s):
E
ina
Abo
uzie
d&L
este
r G
eiss
elC
rop
part
: M
int O
ilIn
stru
men
t:
UP
LC
/MS/
MS
CA
LIB
RA
TIO
N D
AT
AD
ate
of c
alib
rati
on a
naly
sis:
11
-Jul
-12
RT
SD
BP
eak
----
----
Pag
eID
(or
nam
e)C
onc.
(µg/
mL
)A
rea
MV
-09
A30
7G-2
70.
0000
9550
317
Typ
e:
Lin
ear
regr
essi
onM
V-1
0A
307G
-26
0.00
0191
052
8E
quat
ion:
y
= m
x+
bM
V-1
1A
307G
-25
0.00
0477
515
54Sl
ope,
m =
3522
993
MV
-12
A30
7G-2
40.
0009
5500
2676
Inte
rcep
t, b
=-1
70.7
9M
V-1
3A
307G
-23
0.00
1910
065
72R
² =0.
9919
MV
-14
A30
7G-2
20.
0047
7515
500
LO
Q (
µg/
g) =
0.02
MV
-21
A30
7G-2
20.
0047
7517
835
MV
-22
A30
7G-2
30.
0019
100
6818
MV
-23
A30
7G-2
40.
0009
5500
2897
MV
-24
A30
7G-2
50.
0004
775
1586
MV
-25
A30
7G-2
60.
0001
910
568
MV
-26
A30
7G-2
70.
0000
9550
314
AN
AL
YT
ICA
L D
AT
AE
xtra
ctio
n da
te:
11-J
ul-1
2A
naly
sis
date
:11
-Jul
-12
RT
SD
BSa
mpl
eSa
mpl
eS
pike
Sam
ple
Spi
keP
eak
Fina
lR
esid
ueS
pike
CA
LC
UL
AT
ION
PA
GE
Cal
ibra
tion
sta
ndar
d--
----
----
----
--
y =
352
2993
.303
5x -
170.
7893
R² =
0.9
919
0
2000
4000
6000
8000
1000
0
1200
0
1400
0
1600
0
1800
0
2000
0 0.00
00.
001
0.00
20.
003
0.00
40.
005
0.00
6
Peak area
Stan
dard
Con
c. (
µg/
mL
)R
TS
DB
Sam
ple
Sam
ple
Spi
keSa
mpl
eS
pike
Pea
kFi
nal
Res
idue
Spi
keP
age
IDT
ype
Add
edW
eigh
tC
onc.
Are
aV
olum
eFo
und
Rec
over
yN
o.*1
(µg)
(g)
(µg/
g)*2
(cou
nts)
(mL
)(µ
g/g)
*3(%
)*4
MV
-16
1847
6A-C
-1C
NA
2.50
NA
2310
00.
0022
0N
A
MV
-17
1847
6A-M
V-0
.02-
1F
0.04
775
2.50
0.01
9100
1395
100
0.01
778
93.0
8
MV
-18
1847
6A-M
V-0
.02-
2F
0.04
775
2.50
0.01
9100
1298
100
0.01
668
87.3
1
MV
-19
1847
6A-M
V-0
.02-
3F
0.04
775
2.50
0.01
9100
1398
100
0.01
781
93.2
6
NO
TE
S*1
: C=
Con
trol
, F=
Fort
ifie
d, T
=T
reat
ed*2
: Spi
ke a
mou
nt =
(Sp
ike
adde
d) ÷
(Sa
mpl
e w
eigh
t)*3
: Res
idue
am
ount
= [
(Are
a -
b) ÷
m]
x (F
inal
vol
/Sam
ple
wt)
*4. R
ecov
ery
(%)
=(R
esid
ue f
ound
) ÷
(spi
ke c
onc)
* 1
00"N
A"
stan
ds f
or "
Not
app
lica
ble"
Attachment B: Calculation Worksheets, Standard Curves and LOD/LOQ Calculations
IR-4 North Central Region Laboratory, Michigan State University Analytical Summary Report PR# 09358
Page 56

PR
OJE
CT
IN
FO
RM
AT
ION
PR
Num
ber:
09
358
Lab
orat
ory
ID:
0935
8.11
-MIR
05C
hem
ical
: Fl
onic
amid
Fiel
d ID
No.
for
MV
: 09
358.
11-W
I17
Ana
lysi
s fo
r:
TFN
AFi
eld
Res
earc
h D
irec
tor:
D
r. S
cott
Cha
pman
Com
mod
ity:
Min
tA
naly
st(s
):
Ein
a A
bouz
ied&
Les
ter
Gei
ssel
Cro
p pa
rt:
Min
t Oil
Inst
rum
ent:
UP
LC
/MS
/MS
CA
LIB
RA
TIO
N D
AT
AD
ate
of c
alib
ratio
n an
alys
is:
11-J
ul-1
2R
TS
DB
Pea
k--
----
--P
age
ID (
or n
ame)
Con
c.(µ
g/m
L)
Are
a
MV
-09
A30
7G-2
70.
0001
001
205
Typ
e:
Lin
ear
regr
essi
onM
V-1
0A
307G
-26
0.00
0200
240
2E
quat
ion:
y
= m
x+
bM
V-1
1A
307G
-25
0.00
0500
511
72S
lope
, m =
2550
536
MV
-12
A30
7G-2
40.
0010
0121
97In
terc
ept,
b =
-61.
36M
V-1
3A
307G
-23
0.00
2002
050
41R
² =0.
9909
MV
-14
A30
7G-2
20.
0050
0511
723
LO
Q (
µg/
g) =
0.02
MV
-21
A30
7G-2
20.
0050
0513
592
MV
-22
A30
7G-2
30.
0020
020
5490
MV
-23
A30
7G-2
40.
0010
0123
32M
V-2
4A
307G
-25
0.00
0500
513
38M
V-2
5A
307G
-26
0.00
0200
244
6M
V-2
6A
307G
-27
0.00
0100
126
0
AN
AL
YT
ICA
L D
AT
AE
xtra
ctio
n da
te:
11-J
ul-1
2A
naly
sis
date
:11
-Jul
-12
RT
SD
BS
ampl
eS
ampl
eS
pike
Sam
ple
Spi
keP
eak
Fina
lR
esid
ueS
pike
PID
TA
ddd
Wi
htC
AV
lF
dR
CA
LC
UL
AT
ION
PA
GE
Cal
ibra
tion
stan
dard
----
----
----
----
y =
255
0535
.895
7x -
61.3
601
R² =
0.9
909
0
2000
4000
6000
8000
1000
0
1200
0
1400
0 0.00
00.
001
0.00
20.
003
0.00
40.
005
0.00
6
Peak area
Sta
nd
ard
Con
c. (
µg/
mL
)
Pag
eID
Typ
eA
dded
Wei
ght
Con
c.A
rea
Vol
ume
Foun
dR
ecov
ery
No.
*1(µ
g)(g
)(µ
g/g)
*2(c
ount
s)(m
L)
(µg/
g)*3
(%)*
4
MV
-16
1847
6A-C
-1C
NA
2.50
NA
010
0<
0.0
2N
A
MV
-17
1847
6A-M
V-0
.02-
1F
0.05
012.
500.
0200
210
6810
00.
0177
188
.47
MV
-18
1847
6A-M
V-0
.02-
2F
0.05
012.
500.
0200
210
9110
00.
0180
790
.27
MV
-19
1847
6A-M
V-0
.02-
3F
0.05
012.
500.
0200
211
2110
00.
0185
492
.62
NO
TE
S*1
: C=
Con
trol
, F=
Fort
ifie
d, T
=T
reat
ed*2
: Spi
ke a
mou
nt =
(S
pike
add
ed)
÷ (S
ampl
e w
eigh
t)*3
: Res
idue
am
ount
= [
(Are
a -
b) ÷
m]
x (F
inal
vol
/Sam
ple
wt)
*4. R
ecov
ery
(%)
=(R
esid
ue f
ound
) ÷
(spi
ke c
onc)
* 1
00"N
A"
stan
ds f
or "
Not
app
licab
le"
Attachment B: Calculation Worksheets, Standard Curves and LOD/LOQ Calculations
IR-4 North Central Region Laboratory, Michigan State University Analytical Summary Report PR# 09358
Page 57

PR
OJE
CT
IN
FO
RM
AT
ION
PR
Num
ber:
09
358
Lab
orat
ory
ID:
0935
8.11
-MIR
05C
hem
ical
: Fl
onic
amid
Fiel
d ID
No.
for
MV
: 09
358.
11-W
I17
Ana
lysi
s fo
r:
TFN
A-A
MFi
eld
Res
earc
h D
irec
tor:
D
r. S
cott
Cha
pman
Com
mod
ity:
Min
tA
naly
st(s
):
Ein
a A
bouz
ied&
Les
ter
Gei
ssel
Cro
p pa
rt:
Min
t Oil
Inst
rum
ent:
UP
LC
/MS
/MS
CA
LIB
RA
TIO
N D
AT
AD
ate
of c
alib
ratio
n an
alys
is:
12-J
ul-1
2R
TS
DB
Pea
k--
----
--P
age
ID (
or n
ame)
Con
c.(µ
g/m
L)
Are
a
MV
-35
A30
7G-2
70.
0001
012
190
Typ
e:
Lin
ear
regr
essi
onM
V-3
6A
307G
-26
0.00
0202
435
0E
quat
ion:
y
= m
x+
bM
V-3
7A
307G
-25
0.00
0506
096
1S
lope
, m =
1929
216
MV
-38
A30
7G-2
40.
0010
1217
98In
terc
ept,
b =
-124
.14
MV
-39A
A30
7G-2
30.
0020
240
3356
R² =
0.99
01M
V-4
0A
307G
-22
0.00
5060
9144
LO
Q (
µg/
g) =
0.02
MV
-47
A30
7G-2
20.
0050
6010
449
MV
-48
A30
7G-2
30.
0020
240
3371
MV
-49
A30
7G-2
40.
0010
1217
90M
V-5
0A
307G
-25
0.00
0506
090
6M
V-5
1A
307G
-26
0.00
0202
443
4M
V-5
2A
307G
-27
0.00
0101
212
3
AN
AL
YT
ICA
L D
AT
AE
xtra
ctio
n da
te:
12-J
ul-1
2A
naly
sis
date
:12
-Jul
-12
RT
SD
BS
ampl
eS
ampl
eS
pike
Sam
ple
Spi
keP
eak
Fina
lR
esid
ueS
pike
CA
LC
UL
AT
ION
PA
GE
Cal
ibra
tion
stan
dard
----
----
----
----
y =
192
9216
.212
7x -
124.
1380
R² =
0.9
901
0
1000
2000
3000
4000
5000
6000
7000
8000
9000
1000
0
1100
0 0.00
00.
001
0.00
20.
003
0.00
40.
005
0.00
6
Peak area
Sta
nd
ard
Con
c. (
µg/
mL
)
Pag
eID
Typ
eA
dded
Wei
ght
Con
c.A
rea
Vol
ume
Foun
dR
ecov
ery
No.
*1(µ
g)(g
)(µ
g/g)
*2(c
ount
s)(m
L)
(µg/
g)*3
(%)*
4M
V-4
218
476A
-C-2
CN
A2.
50N
A45
100
0.00
351
NA
MV
-43
1847
6A-M
V-0
.2-1
F0.
5060
2.50
0.20
2417
1850
00.
1910
94.3
5
MV
-44
1847
6A-M
V-0
.2-2
F0.
5060
2.50
0.20
2415
9850
00.
1785
88.2
1
MV
-45
1847
6A-M
V-0
.2-3
F0.
5060
2.50
0.20
2416
7450
00.
1864
92.1
0
NO
TE
S*1
: C=
Con
trol
, F=
Fort
ifie
d, T
=T
reat
ed*2
: Spi
ke a
mou
nt =
(S
pike
add
ed)
÷ (S
ampl
e w
eigh
t)*3
: Res
idue
am
ount
= [
(Are
a -
b) ÷
m]
x (F
inal
vol
/Sam
ple
wt)
*4. R
ecov
ery
(%)
=(R
esid
ue f
ound
) ÷
(spi
ke c
onc)
* 1
00"N
A"
stan
ds f
or "
Not
app
licab
le"
Attachment B: Calculation Worksheets, Standard Curves and LOD/LOQ Calculations
IR-4 North Central Region Laboratory, Michigan State University Analytical Summary Report PR# 09358
Page 58

PR
OJE
CT
IN
FO
RM
AT
ION
R N
umbe
r:
0935
8L
abor
ator
y ID
: 09
358.
11-M
IR05
Che
mic
al:
Flo
nica
mid
Fie
ld I
D N
o. f
or M
V:
0935
8.11
-WI1
7na
lysi
s fo
r:
Flo
nica
mid
(IK
I-22
0)F
ield
Res
earc
h D
irec
tor:
D
r. S
cott
Cha
pman
omm
odit
y:
Min
tA
naly
st(s
):
Ein
a A
bouz
ied&
Les
ter
Gei
ssel
Cro
p pa
rt:
Min
t Oil
Inst
rum
ent:
U
PL
C/M
S/M
SC
AL
IBR
AT
ION
DA
TA
Dat
e of
cal
ibra
tion
ana
lysi
s:
12-J
ul-1
2R
TS
DB
Pea
k--
----
--P
age
ID (
or n
ame)
Con
c.(µ
g/m
L)
Are
a
MV
-35
A30
7G-2
70.
0001
010
237
Typ
e:
Lin
ear
regr
essi
onM
V-3
6A
307G
-26
0.00
0202
044
4E
quat
ion:
y
= m
x+
bM
V-3
7A
307G
-25
0.00
0505
012
88S
lope
, m =
2477
720
MV
-38
A30
7G-2
40.
0010
1021
91In
terc
ept,
b =
-22.
25M
V-3
9A
307G
-23
0.00
2020
050
05R
² =0.
9906
MV
-40
A30
7G-2
20.
0050
5011
524
LO
Q (
µg/
g) =
0.02
MV
-47
A30
7G-2
20.
0050
5013
499
MV
-48
A30
7G-2
30.
0020
200
4905
MV
-49
A30
7G-2
40.
0010
1025
72M
V-5
0A
307G
-25
0.00
0505
013
48M
V-5
1A
307G
-26
0.00
0202
054
9M
V-5
2A
307G
-27
0.00
0101
021
5
AN
AL
YT
ICA
L D
AT
AE
xtra
ctio
n da
te:
12-J
ul-1
2A
naly
sis
date
:12
-Jul
-12
RT
SD
BS
ampl
eS
ampl
eS
pike
Sam
ple
Spi
keP
eak
Fin
alR
esid
ueS
pike
Pag
eID
Typ
eA
dded
Wei
ght
Con
c.A
rea
Vol
ume
Fou
ndR
ecov
ery
CA
LC
UL
AT
ION
PA
GE
Cal
ibra
tion
sta
ndar
d--
----
----
----
--
y =
247
7719
.926
1x -
22.2
458
R² =
0.9
906
0
2000
4000
6000
8000
1000
0
1200
0
1400
0 0.00
00.
001
0.00
20.
003
0.00
40.
005
0.00
6
Peak area
Sta
ndar
d C
onc.
(µ
g/m
L)
No.
*1(µ
g)(g
)(µ
g/g)
*2(c
ount
s)(m
L)
(µg/
g)*3
(%)*
4
MV
-42
1847
6A-C
-2C
NA
2.50
NA
010
0<
0.0
2N
A
MV
-43
1847
6A-M
V-0
.2-1
F0.
5050
2.50
0.20
2023
1650
00.
1887
93.4
4
MV
-44
1847
6A-M
V-0
.2-2
F0.
5050
2.50
0.20
2021
8850
00.
1784
88.3
2
MV
-45
1847
6A-M
V-0
.2-3
F0.
5050
2.50
0.20
2024
4050
00.
1988
98.3
9
NO
TE
S*1
: C=
Con
trol
, F=
Fort
ifie
d, T
=T
reat
ed*2
: Spi
ke a
mou
nt =
(S
pike
add
ed)
÷ (S
ampl
e w
eigh
t)*3
: Res
idue
am
ount
= [
(Are
a -
b) ÷
m]
x (F
inal
vol
/Sam
ple
wt)
*4. R
ecov
ery
(%)
=(R
esid
ue f
ound
) ÷
(spi
ke c
onc)
* 1
00"N
A"
stan
ds f
or "
Not
app
licab
le"
Attachment B: Calculation Worksheets, Standard Curves and LOD/LOQ Calculations
IR-4 North Central Region Laboratory, Michigan State University Analytical Summary Report PR# 09358
Page 59

PR
OJE
CT
IN
FO
RM
AT
ION
PR
Num
ber:
09
358
Lab
orat
ory
ID:
0935
8.11
-MIR
05C
hem
ical
: Fl
onic
amid
Fiel
d ID
No.
for
MV
: 09
358.
11-W
A*1
8A
naly
sis
for:
T
FNG
Fiel
d R
esea
rch
Dir
ecto
r:
0935
8.11
-WI1
8C
omm
odity
: M
int
Ana
lyst
(s):
D
r. S
cott
Cha
pman
Cro
p pa
rt:
Min
t Oil
Inst
rum
ent:
UP
LC
/MS
/MS
CA
LIB
RA
TIO
N D
AT
AD
ate
of c
alib
ratio
n an
alys
is:
12-J
ul-1
2R
TS
DB
Pea
k--
----
--P
age
ID (
or n
ame)
Con
c.(µ
g/m
LA
rea
MV
-35
A30
7G-2
70.
0000
9550
250
Typ
e:
Lin
ear
regr
essi
onM
V-3
6A
307G
-26
0.00
0191
050
6E
quat
ion:
y
= m
x+
bM
V-3
7A
307G
-25
0.00
0477
513
92S
lope
, m =
3461
206
MV
-38
A30
7G-2
40.
0009
5500
2725
Inte
rcep
t, b
=-1
74.6
6M
V-3
9A
307G
-23
0.00
1910
064
05R
² =0.
9932
MV
-40
A30
7G-2
20.
0047
7515
305
LO
Q (
µg/
g) =
0.02
MV
-47
A30
7G-2
20.
0047
7517
477
MV
-48
A30
7G-2
30.
0019
100
6484
MV
-49
A30
7G-2
40.
0009
5500
3040
MV
-50
A30
7G-2
50.
0004
775
1623
MV
-51
A30
7G-2
60.
0001
910
623
MV
-52
A30
7G-2
70.
0000
9550
250
AN
AL
YT
ICA
L D
AT
AE
xtra
ctio
n da
te:
12-J
ul-1
2A
naly
sis
date
:12
-Jul
-12
RT
SD
BS
ampl
eS
ampl
eS
pike
Sam
ple
Spi
keP
eak
Fina
lR
esid
ueS
pike
PID
TA
ddd
Wi
htC
AV
lF
dR
CA
LC
UL
AT
ION
PA
GE
Cal
ibra
tion
stan
dard
----
----
----
----
y =
346
1205
.573
1x -
174.
6619
R² =
0.9
932
0
2000
4000
6000
8000
1000
0
1200
0
1400
0
1600
0
1800
0 0.00
00.
001
0.00
20.
003
0.00
40.
005
0.00
6
Peak area
Sta
nd
ard
Con
c. (
µg/
mL
)
Pag
eID
Typ
eA
dded
Wei
ght
Con
c.A
rea
Vol
ume
Foun
dR
ecov
ery
No.
*1(µ
g)(g
)(µ
g/g)
*2(c
ount
s)(m
L)
(µg/
g)*3
(%)*
4M
V-4
218
476A
-C-2
CN
A2.
50N
A0
100
< 0
.02
NA
MV
-43
1847
6A-M
V-0
.2-1
F0.
4775
02.
500.
1910
2961
500
0.18
1294
.86
MV
-44
1847
6A-M
V-0
.2-2
F0.
4775
02.
500.
1910
3014
500
0.18
4396
.47
MV
-45
1847
6A-M
V-0
.2-3
F0.
4775
02.
500.
1910
3135
500
0.19
1210
0.13
NO
TE
S*1
: C=
Con
trol
, F=
Fort
ifie
d, T
=T
reat
ed*2
: Spi
ke a
mou
nt =
(S
pike
add
ed)
÷ (S
ampl
e w
eigh
t)*3
: Res
idue
am
ount
= [
(Are
a -
b) ÷
m]
x (F
inal
vol
/Sam
ple
wt)
*4. R
ecov
ery
(%)
=(R
esid
ue f
ound
) ÷
(spi
ke c
onc)
* 1
00"N
A"
stan
ds f
or "
Not
app
licab
le"
Attachment B: Calculation Worksheets, Standard Curves and LOD/LOQ Calculations
IR-4 North Central Region Laboratory, Michigan State University Analytical Summary Report PR# 09358
Page 60

PR
OJE
CT
IN
FO
RM
AT
ION
PR
Num
ber:
09
358
Lab
orat
ory
ID:
0935
8.11
-MIR
05C
hem
ical
: Fl
onic
amid
Fiel
d ID
No.
for
MV
: 09
358.
11-W
I17
Ana
lysi
s fo
r:
TFN
AFi
eld
Res
earc
h D
irec
tor:
D
r. S
cott
Cha
pman
Com
mod
ity:
Min
tA
naly
st(s
):
Ein
a A
bouz
ied&
Les
ter
Gei
ssel
Cro
p pa
rt:
Min
t Oil
Inst
rum
ent:
UP
LC
/MS
/MS
CA
LIB
RA
TIO
N D
AT
AD
ate
of c
alib
ratio
n an
alys
is:
12-J
ul-1
2R
TS
DB
Pea
k--
----
--P
age
ID (
or n
ame)
Con
c.(µ
g/m
L)
Are
a
MV
-35
A30
7G-2
70.
0001
001
224
Typ
e:
Lin
ear
regr
essi
onM
V-3
6A
307G
-26
0.00
0200
243
2E
quat
ion:
y
= m
x+
bM
V-3
7A
307G
-25
0.00
0500
511
99S
lope
, m =
2524
783
MV
-38
A30
7G-2
40.
0010
0122
04In
terc
ept,
b =
-24.
47M
V-3
9A
307G
-23
0.00
2002
051
80R
² =0.
9902
MV
-40
A30
7G-2
20.
0050
0511
562
LO
Q (
µg/
g) =
0.02
MV
-47
A30
7G-2
20.
0050
0513
579
MV
-48
A30
7G-2
30.
0020
020
5219
MV
-49
A30
7G-2
40.
0010
0125
48M
V-5
0A
307G
-25
0.00
0500
512
62M
V-5
1A
307G
-26
0.00
0200
252
1M
V-5
2A
307G
-27
0.00
0100
125
7
AN
AL
YT
ICA
L D
AT
AE
xtra
ctio
n da
te:
12-J
ul-1
2A
naly
sis
date
:12
-Jul
-12
RT
SD
BS
ampl
eS
ampl
eS
pike
Sam
ple
Spi
keP
eak
Fina
lR
esid
ueS
pike
PID
TA
ddd
Wi
htC
AV
lF
dR
CA
LC
UL
AT
ION
PA
GE
Cal
ibra
tion
stan
dard
----
----
----
----
y =
252
4782
.614
9x -
24.4
675
R² =
0.9
902
0
2000
4000
6000
8000
1000
0
1200
0
1400
0 0.00
00.
001
0.00
20.
003
0.00
40.
005
0.00
6
Peak area
Sta
nd
ard
Con
c. (
µg/
mL
)
Pag
eID
Typ
eA
dded
Wei
ght
Con
c.A
rea
Vol
ume
Foun
dR
ecov
ery
No.
*1(µ
g)(g
)(µ
g/g)
*2(c
ount
s)(m
L)
(µg/
g)*3
(%)*
4
MV
-42
1847
6A-C
-2C
NA
2.50
NA
010
0<
0.0
2N
A
MV
-43
1847
6A-M
V-0
.2-1
F0.
5005
2.50
0.20
0222
6750
00.
1815
90.6
7
MV
-44
1847
6A-M
V-0
.2-2
F0.
5005
2.50
0.20
0222
4750
00.
1799
89.8
8
MV
-45
1847
6A-M
V-0
.2-3
F0.
5005
2.50
0.20
0223
6750
00.
1894
94.6
3
NO
TE
S*1
: C=
Con
trol
, F=
Fort
ifie
d, T
=T
reat
ed*2
: Spi
ke a
mou
nt =
(S
pike
add
ed)
÷ (S
ampl
e w
eigh
t)*3
: Res
idue
am
ount
= [
(Are
a -
b) ÷
m]
x (F
inal
vol
/Sam
ple
wt)
*4. R
ecov
ery
(%)
=(R
esid
ue f
ound
) ÷
(spi
ke c
onc)
* 1
00"N
A"
stan
ds f
or "
Not
app
licab
le"
Attachment B: Calculation Worksheets, Standard Curves and LOD/LOQ Calculations
IR-4 North Central Region Laboratory, Michigan State University Analytical Summary Report PR# 09358
Page 61

PR
OJE
CT
IN
FO
RM
AT
ION
PR
Num
ber:
09
358
Lab
orat
ory
ID:
0935
8.11
-MIR
05C
hem
ical
: Fl
onic
amid
Fiel
d ID
No.
for
MV
: 09
358.
11-W
I17
Ana
lysi
s fo
r:
TFN
A-A
MFi
eld
Res
earc
h D
irec
tor:
D
r. S
cott
Cha
pman
Com
mod
ity:
Min
tA
naly
st(s
):
Ein
a A
bouz
ied&
Les
ter
Gei
ssel
Cro
p pa
rt:
Min
t Oil
Inst
rum
ent:
UP
LC
/MS
/MS
CA
LIB
RA
TIO
N D
AT
AD
ate
of c
alib
ratio
n an
alys
is:
19-J
ul-1
2R
TS
DB
Pea
k--
----
--P
age
ID (
or n
ame)
Con
c.(µ
g/m
L)
Are
a
MV
-61
A30
7G-2
70.
0001
012
91T
ype:
L
inea
r re
gres
sion
MV
-62
A30
7G-2
60.
0002
024
214
Equ
atio
n:
y=
mx
+ b
MV
-63
A30
7G-2
50.
0005
060
743
Slo
pe, m
=16
9245
2M
V-6
4A
307G
-24
0.00
1012
1496
Inte
rcep
t, b
=-1
67.3
8M
V-6
5A
307G
-23
0.00
2024
024
96R
² =0.
9912
MV
-66
A30
7G-2
20.
0050
6086
39L
OQ
(µ
g/g)
=0.
02M
V-7
3A
307G
-22
0.00
5060
8562
MV
-74
A30
7G-2
30.
0020
240
2902
MV
-75
A30
7G-2
40.
0010
1216
09M
V-7
6A
307G
-25
0.00
0506
085
1M
V-7
7AA
307G
-26
0.00
0202
439
2M
V-7
8A
307G
-27
0.00
0101
214
1
AN
AL
YT
ICA
L D
AT
AE
xtra
ctio
n da
te:
16-J
ul-1
2A
naly
sis
date
:19
-Jul
-12
RT
SD
BS
ampl
eS
ampl
eS
pike
Sam
ple
Spi
keP
eak
Fina
lR
esid
ueS
pike
CA
LC
UL
AT
ION
PA
GE
Cal
ibra
tion
stan
dard
----
----
----
----
y =
169
2452
.168
5x -
167.
3837
R² =
0.9
912
0
1000
2000
3000
4000
5000
6000
7000
8000
9000
0.00
00.
001
0.00
20.
003
0.00
40.
005
0.00
6
Peak area
Sta
nd
ard
Con
c. (
µg/
mL
)
Pag
eID
Typ
eA
dded
Wei
ght
Con
c.A
rea
Vol
ume
Foun
dR
ecov
ery
No.
*1(µ
g)(g
)(µ
g/g)
*2(c
ount
s)(m
L)
(µg/
g)*3
(%)*
4M
V-6
818
476A
-C-3
CN
A2.
50N
A0
100
< 0
.02
NA
MV
-69
1847
6A-M
V-2
-1F
5.06
02.
502.
024
2851
2500
1.78
388
.11
MV
-70
1847
6A-M
V-2
-2F
5.06
02.
502.
024
2933
2500
1.83
290
.51
MV
-71
1847
6A-M
V-2
-3F
5.06
02.
502.
024
2757
2500
1.72
885
.37
NO
TE
S*1
: C=
Con
trol
, F=
Fort
ifie
d, T
=T
reat
ed*2
: Spi
ke a
mou
nt =
(S
pike
add
ed)
÷ (S
ampl
e w
eigh
t)*3
: Res
idue
am
ount
= [
(Are
a -
b) ÷
m]
x (F
inal
vol
/Sam
ple
wt)
*4. R
ecov
ery
(%)
=(R
esid
ue f
ound
) ÷
(spi
ke c
onc)
* 1
00"N
A"
stan
ds f
or "
Not
app
licab
le"
Attachment B: Calculation Worksheets, Standard Curves and LOD/LOQ Calculations
IR-4 North Central Region Laboratory, Michigan State University Analytical Summary Report PR# 09358
Page 62

PR
OJE
CT
IN
FO
RM
AT
ION
R N
umbe
r:
0935
8L
abor
ator
y ID
: 09
358.
11-M
IR05
Che
mic
al:
Flon
icam
idFi
eld
ID N
o. f
or M
V:
0935
8.11
-WI1
7na
lysi
s fo
r:
Flon
icam
id (
IKI-
220)
Fiel
d R
esea
rch
Dir
ecto
r:
Dr.
Sco
tt C
hapm
anom
mod
ity:
M
int
Ana
lyst
(s):
E
ina
Abo
uzie
d&L
este
r G
eiss
el
Cro
p pa
rt:
Min
t Oil
Inst
rum
ent:
U
PL
C/M
S/M
SC
AL
IBR
AT
ION
DA
TA
Dat
e of
cal
ibra
tion
ana
lysi
s:
19-J
ul-1
2R
TS
DB
Pea
k--
----
--Pa
geID
(or
nam
e)C
onc.
(µg/
mL
)A
rea
MV
-61
A30
7G-2
70.
0001
010
181
Typ
e:
Lin
ear
regr
essi
onM
V-6
2A
307G
-26
0.00
0202
032
1E
quat
ion:
y
= m
x+
bM
V-6
3A
307G
-25
0.00
0505
090
1S
lope
, m =
2247
570
MV
-64
A30
7G-2
40.
0010
1020
83In
terc
ept,
b =
-112
.32
MV
-65
A30
7G-2
30.
0020
200
4120
R²
=0.
9991
MV
-66
A30
7G-2
20.
0050
5011
322
LO
Q (
µg/
g) =
0.02
MV
-73
A30
7G-2
20.
0050
5011
253
MV
-74
A30
7G-2
30.
0020
200
4495
MV
-75
A30
7G-2
40.
0010
1022
16M
V-7
6A
307G
-25
0.00
0505
010
92M
V-7
7A
307G
-26
0.00
0202
043
1M
V-7
8A
307G
-27
0.00
0101
019
0
AN
AL
YT
ICA
L D
AT
AE
xtra
ctio
n da
te:
16-J
ul-1
2A
naly
sis
date
:19
-Jul
-12
RT
SD
BS
ampl
eS
ampl
eS
pike
Sam
ple
Spi
keP
eak
Fina
lR
esid
ueS
pike
CA
LC
UL
AT
ION
PA
GE
Cal
ibra
tion
sta
ndar
d--
----
----
----
--
y =
224
7570
.291
7x -
112.
3175
R² =
0.9
991
0
2000
4000
6000
8000
1000
0
1200
0 0.00
00.
001
0.00
20.
003
0.00
40.
005
0.00
6
Peak area
Sta
nd
ard
Con
c. (
µg/
mL
)
RT
SD
BS
ampl
eS
ampl
eS
pike
Sam
ple
Spi
keP
eak
Fina
lR
esid
ueS
pike
Pag
eID
Typ
eA
dded
Wei
ght
Con
c.A
rea
Vol
ume
Foun
dR
ecov
ery
No.
*1(µ
g)(g
)(µ
g/g)
*2(c
ount
s)(m
L)
(µg/
g)*3
(%)*
4
MV
-68
1847
6A-C
-3C
NA
2.50
NA
2910
00.
0025
2N
A
MV
-69
1847
6A-M
V-2
-1F
5.05
02.
502.
020
3998
2500
1.82
990
.53
MV
-70
1847
6A-M
V-2
-2F
5.05
02.
502.
020
3827
2500
1.75
386
.77
MV
-71
1847
6A-M
V-2
-3F
5.05
02.
502.
020
3666
2500
1.68
183
.22
NO
TE
S*1
: C=
Con
trol
, F=
For
tifi
ed, T
=T
reat
ed*2
: Spi
ke a
mou
nt =
(S
pike
add
ed)
÷ (
Sam
ple
wei
ght)
*3: R
esid
ue a
mou
nt =
[(A
rea
- b)
÷ m
] x
(Fin
al v
ol/S
ampl
e w
t)*4
. Rec
over
y (%
) =
(Res
idue
fou
nd)
÷ (
spik
e co
nc)
* 10
0"N
A"
stan
ds f
or "
Not
app
lica
ble"
Attachment B: Calculation Worksheets, Standard Curves and LOD/LOQ Calculations
IR-4 North Central Region Laboratory, Michigan State University Analytical Summary Report PR# 09358
Page 63

PR
OJE
CT
IN
FO
RM
AT
ION
PR
Num
ber:
09
358
Lab
orat
ory
ID:
0935
8.11
-MIR
05C
hem
ical
: F
loni
cam
idF
ield
ID
No.
for
MV
: 09
358.
11-W
I17
Ana
lysi
s fo
r:
TF
NG
Fie
ld R
esea
rch
Dir
ecto
r:
Dr.
Sco
tt C
hapm
anC
omm
odit
y:
Min
tA
naly
st(s
):
Ein
a A
bouz
ied&
Les
ter
Gei
ssel
Cro
p pa
rt:
Min
t Oil
Inst
rum
ent:
U
PL
C/M
S/M
S
CA
LIB
RA
TIO
N D
AT
AD
ate
of c
alib
rati
on a
naly
sis:
19
-Jul
-12
RT
SD
BP
eak
----
----
Pag
eID
(or
nam
e)C
onc.
(µg/
mL
Are
a
MV
-61
A30
7G-2
70.
0000
9550
244
Typ
e:
Lin
ear
regr
essi
onM
V-6
2A
307G
-26
0.00
0191
035
9E
quat
ion:
y
= m
x+
bM
V-6
3A
307G
-25
0.00
0477
511
71S
lope
, m =
3026
275
MV
-64
A30
7G-2
40.
0009
5500
2442
nter
cept
, b =
-194
.05
MV
-65
A30
7G-2
30.
0019
100
5277
R² =
0.99
89M
V-6
6A
307G
-22
0.00
4775
1419
5L
OQ
(µ
g/g)
=0.
02M
V-7
3A
307G
-22
0.00
4775
1447
9M
V-7
4A
307G
-23
0.00
1910
056
18M
V-7
5A
307G
-24
0.00
0955
0025
87M
V-7
6A
307G
-25
0.00
0477
514
83M
V-7
7A
307G
-26
0.00
0191
043
9M
V-7
8A
307G
-27
0.00
0095
5024
3
AN
AL
YT
ICA
L D
AT
AE
xtra
ctio
n da
te:
16-J
ul-1
2A
naly
sis
date
:19
-Jul
-12
CA
LC
UL
AT
ION
PA
GE
Cal
ibra
tion
sta
ndar
d--
----
----
----
--
y =
302
6275
.337
7x -
194.
0530
R² =
0.9
989
0
2000
4000
6000
8000
1000
0
1200
0
1400
0
1600
0 0.00
00.
002
0.00
40.
006
Peak area
Sta
nd
ard
Con
c. (
µg/
mL
)y
RT
SD
BS
ampl
eS
ampl
eS
pike
Sam
ple
Spi
keP
eak
Fin
alR
esid
ueS
pike
Pag
eID
Typ
eA
dded
Wei
ght
Con
c.A
rea
Vol
ume
Fou
ndR
ecov
ery
No.
*1(µ
g)(g
)(µ
g/g)
*2(c
ount
s)(m
L)
(µg/
g)*3
(%)*
4M
V-6
818
476A
-C-3
CN
A2.
50N
A75
100
0.00
356
NA
MV
-69
1847
6A-M
V-2
-1F
4.77
52.
501.
910
5339
2500
1.82
895
.72
MV
-70
1847
6A-M
V-2
-2F
4.77
52.
501.
910
5335
2500
1.82
795
.66
MV
-71
1847
6A-M
V-2
-3F
4.77
52.
501.
910
5122
2500
1.75
791
.97
NO
TE
S*1
: C=
Con
trol
, F=
For
tifie
d, T
=T
reat
ed*2
: Spi
ke a
mou
nt =
(S
pike
add
ed)
÷ (S
ampl
e w
eigh
t)*3
: Res
idue
am
ount
= [
(Are
a -
b) ÷
m]
x (F
inal
vol
/Sam
ple
wt)
*4. R
ecov
ery
(%)
=(R
esid
ue f
ound
) ÷
(spi
ke c
onc)
* 1
00"N
A"
stan
ds f
or "
Not
app
licab
le"
Attachment B: Calculation Worksheets, Standard Curves and LOD/LOQ Calculations
IR-4 North Central Region Laboratory, Michigan State University Analytical Summary Report PR# 09358
Page 64
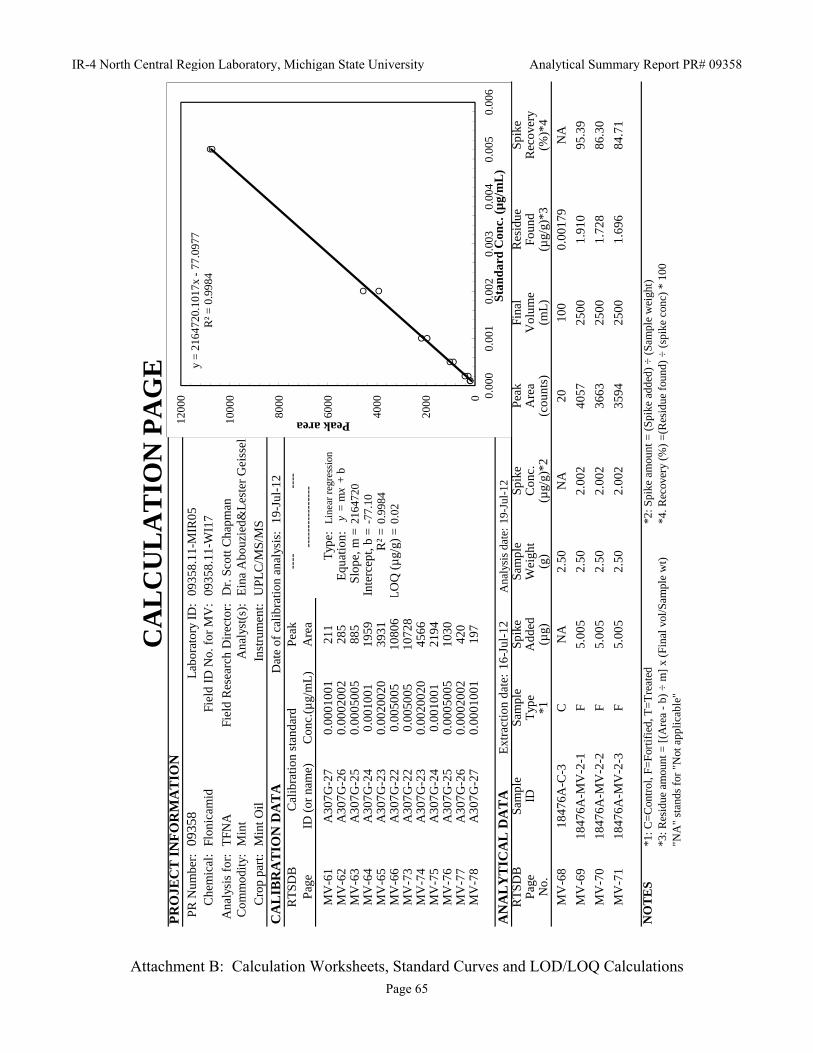
PR
OJE
CT
IN
FO
RM
AT
ION
PR
Num
ber:
09
358
Lab
orat
ory
ID:
0935
8.11
-MIR
05C
hem
ical
: Fl
onic
amid
Fiel
d ID
No.
for
MV
: 09
358.
11-W
I17
Ana
lysi
s fo
r:
TFN
AFi
eld
Res
earc
h D
irec
tor:
D
r. S
cott
Cha
pman
Com
mod
ity:
M
int
Ana
lyst
(s):
E
ina
Abo
uzie
d&L
este
r G
eiss
elC
rop
part
: M
int O
ilIn
stru
men
t:
UP
LC
/MS
/MS
CA
LIB
RA
TIO
N D
AT
AD
ate
of c
alib
rati
on a
naly
sis:
19
-Jul
-12
RT
SD
BP
eak
----
----
Pag
eID
(or
nam
e)C
onc.
(µg/
mL
)A
rea
MV
-61
A30
7G-2
70.
0001
001
211
Typ
e:
Lin
ear
regr
essi
onM
V-6
2A
307G
-26
0.00
0200
228
5E
quat
ion:
y
= m
x+
bM
V-6
3A
307G
-25
0.00
0500
588
5S
lope
, m =
2164
720
MV
-64
A30
7G-2
40.
0010
0119
59In
terc
ept,
b =
-77.
10M
V-6
5A
307G
-23
0.00
2002
039
31R
² =
0.99
84M
V-6
6A
307G
-22
0.00
5005
1080
6L
OQ
(µ
g/g)
=0.
02M
V-7
3A
307G
-22
0.00
5005
1072
8M
V-7
4A
307G
-23
0.00
2002
045
66M
V-7
5A
307G
-24
0.00
1001
2194
MV
-76
A30
7G-2
50.
0005
005
1030
MV
-77
A30
7G-2
60.
0002
002
420
MV
-78
A30
7G-2
70.
0001
001
197
AN
AL
YT
ICA
L D
AT
AE
xtra
ctio
n da
te:
16-J
ul-1
2A
naly
sis
date
:19
-Jul
-12
RT
SD
BS
ampl
eS
ampl
eS
pike
Sam
ple
Spi
keP
eak
Fina
lR
esid
eS
pike
CA
LC
UL
AT
ION
PA
GE
Cal
ibra
tion
sta
ndar
d--
----
----
----
--
y =
216
4720
.101
7x -
77.0
977
R² =
0.9
984
0
2000
4000
6000
8000
1000
0
1200
0 0.00
00.
001
0.00
20.
003
0.00
40.
005
0.00
6
Peak area
Sta
nd
ard
Con
c. (
µg/
mL
)
RT
SD
BS
ampl
eS
ampl
eS
pike
Sam
ple
Spi
keP
eak
Fina
lR
esid
ueS
pike
Pag
eID
Typ
eA
dded
Wei
ght
Con
c.A
rea
Vol
ume
Foun
dR
ecov
ery
No.
*1(µ
g)(g
)(µ
g/g)
*2(c
ount
s)(m
L)
(µg/
g)*3
(%)*
4
MV
-68
1847
6A-C
-3C
NA
2.50
NA
2010
00.
0017
9N
A
MV
-69
1847
6A-M
V-2
-1F
5.00
52.
502.
002
4057
2500
1.91
095
.39
MV
-70
1847
6A-M
V-2
-2F
5.00
52.
502.
002
3663
2500
1.72
886
.30
MV
-71
1847
6A-M
V-2
-3F
5.00
52.
502.
002
3594
2500
1.69
684
.71
NO
TE
S*1
: C=
Con
trol
, F=
For
tifi
ed, T
=T
reat
ed*2
: Spi
ke a
mou
nt =
(S
pike
add
ed)
÷ (
Sam
ple
wei
ght)
*3: R
esid
ue a
mou
nt =
[(A
rea
- b)
÷ m
] x
(Fin
al v
ol/S
ampl
e w
t)*4
. Rec
over
y (%
) =
(Res
idue
fou
nd)
÷ (
spik
e co
nc)
* 10
0"N
A"
stan
ds f
or "
Not
app
lica
ble"
Attachment B: Calculation Worksheets, Standard Curves and LOD/LOQ Calculations
IR-4 North Central Region Laboratory, Michigan State University Analytical Summary Report PR# 09358
Page 65
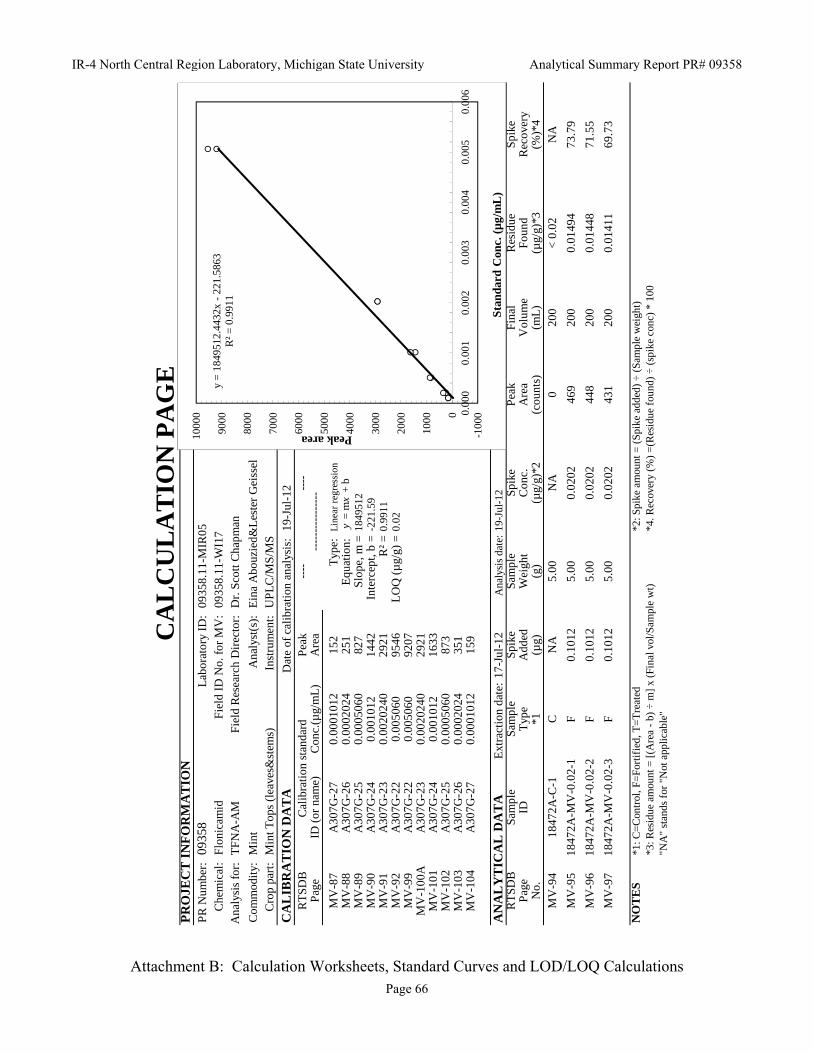
PR
OJE
CT
IN
FO
RM
AT
ION
PR
Num
ber:
09
358
Lab
orat
ory
ID:
0935
8.11
-MIR
05C
hem
ical
: F
loni
cam
idF
ield
ID
No.
for
MV
: 09
358.
11-W
I17
Ana
lysi
s fo
r:
TF
NA
-AM
Fie
ld R
esea
rch
Dir
ecto
r:
Dr.
Sco
tt C
hapm
an
Com
mod
ity:
M
int
Ana
lyst
(s):
E
ina
Abo
uzie
d&L
este
r G
eiss
elC
rop
part
: M
int T
ops
(lea
ves&
stem
s)In
stru
men
t:
UP
LC
/MS
/MS
CA
LIB
RA
TIO
N D
AT
AD
ate
of c
alib
rati
on a
naly
sis:
19
-Jul
-12
RT
SD
BP
eak
----
----
Pag
eID
(or
nam
e)C
onc.
(µg/
mL
)A
rea
MV
-87
A30
7G-2
70.
0001
012
152
Typ
e:
Lin
ear
regr
essi
onM
V-8
8A
307G
-26
0.00
0202
425
1E
quat
ion:
y
= m
x+
bM
V-8
9A
307G
-25
0.00
0506
082
7S
lope
, m =
1849
512
MV
-90
A30
7G-2
40.
0010
1214
42In
terc
ept,
b =
-221
.59
MV
-91
A30
7G-2
30.
0020
240
2921
R² =
0.99
11M
V-9
2A
307G
-22
0.00
5060
9546
LO
Q (
µg/
g) =
0.02
MV
-99
A30
7G-2
20.
0050
6092
07M
V-1
00A
A30
7G-2
30.
0020
240
2921
MV
-101
A30
7G-2
40.
0010
1216
33M
V-1
02A
307G
-25
0.00
0506
087
3M
V-1
03A
307G
-26
0.00
0202
435
1M
V-1
04A
307G
-27
0.00
0101
215
9
AN
AL
YT
ICA
L D
AT
AE
xtra
ctio
n da
te:
17-J
ul-1
2A
naly
sis
date
:19
-Jul
-12
RT
SD
BS
ampl
eS
ampl
eS
pike
Sam
ple
Spi
keP
eak
Fin
alR
esid
ueS
pike
Pag
eID
Typ
eA
dded
Wei
ght
Con
c.A
rea
Vol
ume
Fou
ndR
ecov
ery
CA
LC
UL
AT
ION
PA
GE
Cal
ibra
tion
sta
ndar
d--
----
----
----
--
y =
184
9512
.443
2x -
221.
5863
R² =
0.9
911
-100
00
1000
2000
3000
4000
5000
6000
7000
8000
9000
1000
0 0.00
00.
001
0.00
20.
003
0.00
40.
005
0.00
6
Peak area
Sta
ndar
d C
onc.
(µ
g/m
L)
gyp
gy
No.
*1(µ
g)(g
)(µ
g/g)
*2(c
ount
s)(m
L)
(µg/
g)*3
(%)*
4M
V-9
418
472A
-C-1
CN
A5.
00N
A0
200
< 0
.02
NA
MV
-95
1847
2A-M
V-0
.02-
1F
0.10
125.
000.
0202
469
200
0.01
494
73.7
9
MV
-96
1847
2A-M
V-0
.02-
2F
0.10
125.
000.
0202
448
200
0.01
448
71.5
5
MV
-97
1847
2A-M
V-0
.02-
3F
0.10
125.
000.
0202
431
200
0.01
411
69.7
3
NO
TE
S*1
: C=
Con
trol
, F=
Fort
ifie
d, T
=T
reat
ed*2
: Spi
ke a
mou
nt =
(S
pike
add
ed)
÷ (S
ampl
e w
eigh
t)*3
: Res
idue
am
ount
= [
(Are
a -
b) ÷
m]
x (F
inal
vol
/Sam
ple
wt)
*4. R
ecov
ery
(%)
=(R
esid
ue f
ound
) ÷
(spi
ke c
onc)
* 1
00"N
A"
stan
ds f
or "
Not
app
licab
le"
Attachment B: Calculation Worksheets, Standard Curves and LOD/LOQ Calculations
IR-4 North Central Region Laboratory, Michigan State University Analytical Summary Report PR# 09358
Page 66

PR
OJE
CT
IN
FO
RM
AT
ION
PR
Num
ber:
09
358
Lab
orat
ory
ID:
0935
8.11
-MIR
05C
hem
ical
: F
loni
cam
i dF
ield
ID
No.
for
MV
: 09
358.
11-W
I17
Ana
lysi
s fo
r:
Flo
nica
mid
(IK
I-22
0)F
ield
Res
earc
h D
irec
tor:
D
r. S
cott
Cha
pman
Com
mod
ity:
M
int
Ana
lyst
(s):
E
ina
Abo
uzie
d&L
este
r G
eiss
el
Cro
p pa
rt:
Min
t Top
s (l
eave
s&st
ems)
Inst
rum
ent:
U
PL
C/M
S/M
SC
AL
IBR
AT
ION
DA
TA
Dat
e of
cal
ibra
tion
ana
lysi
s:
19-J
ul-1
2R
TSD
BP
eak
----
----
Pag
eID
(or
nam
e)C
onc.
(µg/
mL
)A
rea
MV
-87
A30
7G-2
70.
0001
010
168
Typ
e:
Lin
ear
regr
essi
onM
V-8
8A
307G
-26
0.00
0202
040
3E
quat
ion:
y
= m
x+
bM
V-8
9A
307G
-25
0.00
0505
010
75S
lope
, m =
2150
298
MV
-90
A30
7G-2
40.
0010
1020
34In
terc
ept,
b =
-114
.81
MV
-91
A30
7G-2
30.
0020
200
4154
R²
=0.
9947
MV
-92
A30
7G-2
20.
0050
5011
402
LO
Q (
µg/
g) =
0.02
MV
-99
A30
7G-2
20.
0050
5010
292
MV
-100
A30
7G-2
30.
0020
200
3791
MV
-101
A30
7G-2
40.
0010
1019
69M
V-1
02A
307G
-25
0.00
0505
098
9M
V-1
03A
307G
-26
0.00
0202
041
2M
V-1
04A
307G
-27
0.00
0101
015
7
AN
AL
YT
ICA
L D
AT
AE
xtra
ctio
n da
te:
17-J
ul-1
2A
naly
sis
date
:19
-Jul
-12
RT
SD
BS
ampl
eS
ampl
eS
pike
Sam
ple
Spi
keP
eak
Fin
alR
esid
ueS
pike
Pag
eID
Typ
eA
dded
Wei
ght
Con
c.A
rea
Vol
ume
Fou
ndR
ecov
ery
No
*1(µ
g)(g
)(µ
g/g)
*2(c
ount
s)(m
L)
(µg/
g)*3
(%)*
4
CA
LC
UL
AT
ION
PA
GE
Cal
ibra
tion
sta
ndar
d--
----
----
----
--
y =
215
0297
.523
0x -
114.
8074
R² =
0.9
947
0
1000
2000
3000
4000
5000
6000
7000
8000
9000
1000
0
1100
0
1200
0 0.00
00.
001
0.00
20.
003
0.00
40.
005
0.00
6
Peak area
Sta
nd
ard
Con
c. (
µg/
mL
)
No.
1(µ
g)(g
)(µ
g/g)
2(c
ount
s)(m
L)
(µg/
g)3
(%)
4
MV
-94
1847
2A-C
-1C
NA
5.00
NA
9420
00.
0038
8N
A
MV
-95
1847
2A-M
V-0
.02-
1F
0.10
105.
000.
0202
684
200
0.01
486
73.5
6
MV
-96
1847
2A-M
V-0
.02-
2F
0.10
105.
000.
0202
615
200
0.01
358
67.2
1
MV
-97
1847
2A-M
V-0
.02-
3F
0.10
105.
000.
0202
655
200
0.01
432
70.8
9
NO
TE
S*1
: C=
Con
trol
, F=
Fort
ifie
d, T
=T
reat
ed*2
: Spi
ke a
mou
nt =
(S
pike
add
ed)
÷ (S
ampl
e w
eigh
t)*3
: Res
idue
am
ount
= [
(Are
a -
b) ÷
m]
x (F
inal
vol
/Sam
ple
wt)
*4. R
ecov
ery
(%)
=(R
esid
ue f
ound
) ÷
(spi
ke c
onc)
* 1
00"N
A"
stan
ds f
or "
Not
app
licab
le"
Attachment B: Calculation Worksheets, Standard Curves and LOD/LOQ Calculations
IR-4 North Central Region Laboratory, Michigan State University Analytical Summary Report PR# 09358
Page 67

PR
OJE
CT
IN
FO
RM
AT
ION
PR
Num
ber:
09
358
Lab
orat
ory
ID:
0935
8.11
-MIR
05C
hem
ical
: F
loni
cam
idF
ield
ID
No.
for
MV
: 09
358.
11-W
I17
Ana
lysi
s fo
r:
TF
NG
Fie
ld R
esea
rch
Dir
ecto
r:
Dr.
Sco
tt C
hapm
anC
omm
odit
y:
Min
tA
naly
st(s
):
Ein
a A
bouz
ied&
Les
ter
Gei
ssel
Cro
p pa
rt:
Min
t Top
s (l
eave
s&st
ems)
Inst
rum
ent:
U
PL
C/M
S/M
S
CA
LIB
RA
TIO
N D
AT
AD
ate
of c
alib
rati
on a
naly
sis:
19
-Jul
-12
RT
SD
BP
eak
----
----
Pag
eID
(or
nam
e)C
onc.
(µg/
mL
)A
rea
MV
-87
A30
7G-2
70.
0000
9550
235
Typ
e:
Lin
ear
regr
essi
onM
V-8
8A
307G
-26
0.00
0191
053
4E
quat
ion:
y
= m
x+
bM
V-8
9A
307G
-25
0.00
0477
511
62S
lope
, m =
3313
717
MV
-90
A30
7G-2
40.
0009
5500
2600
Inte
rcep
t, b
=-3
20.2
5M
V-9
1A
307G
-23
0.00
1910
057
00R
² =0.
9973
MV
-92
A30
7G-2
20.
0047
7515
707
LO
Q (
µg/
g) =
0.02
MV
-99
A30
7G-2
20.
0047
7515
739
MV
-100
A30
7G-2
30.
0019
100
5395
MV
-101
A30
7G-2
40.
0009
5500
2599
MV
-102
A30
7G-2
50.
0004
775
1346
MV
-103
A30
7G-2
60.
0001
910
514
MV
-104
AA
307G
-27
0.00
0095
5032
3
AN
AL
YT
ICA
L D
AT
AE
xtra
ctio
n da
te:
17-J
ul-1
2A
naly
sis
date
:19
-Jul
-12
RT
SD
BS
ampl
eS
ampl
eS
pike
Sam
ple
Spi
keP
eak
Fin
alR
esid
ueS
pike
Pag
eID
Typ
eA
dded
Wei
ght
Con
c.A
rea
Vol
ume
Fou
ndR
ecov
ery
CA
LC
UL
AT
ION
PA
GE
Cal
ibra
tion
sta
ndar
d--
----
----
----
--
y =
331
3716
.715
6x -
320.
2459
R² =
0.9
973
-200
00
2000
4000
6000
8000
1000
0
1200
0
1400
0
1600
0 0.00
00.
001
0.00
20.
003
0.00
40.
005
0.00
6
Peak area
Sta
ndar
d C
onc.
(µ
g/m
L)
No.
*1(µ
g)(g
)(µ
g/g)
*2(c
ount
s)(m
L)
(µg/
g)*3
(%)*
4M
V-9
418
472A
-C-1
CN
A5.
00N
A45
520
00.
0093
6N
A
MV
-95
1847
2A-M
V-0
.02-
1F
0.09
555.
000.
0191
1414
200
0.02
093
109.
60
MV
-96
1847
2A-M
V-0
.02-
2F
0.09
555.
000.
0191
1376
200
0.02
048
107.
20
MV
-97
1847
2A-M
V-0
.02-
3F
0.09
555.
000.
0191
1460
200
0.02
149
112.
51
NO
TE
S*1
: C=
Con
trol
, F=
Fort
ifie
d, T
=T
reat
ed*2
: Spi
ke a
mou
nt =
(S
pike
add
ed)
÷ (S
ampl
e w
eigh
t)*3
: Res
idue
am
ount
= [
(Are
a -
b) ÷
m]
x (F
inal
vol
/Sam
ple
wt)
*4. R
ecov
ery
(%)
=(R
esid
ue f
ound
) ÷
(spi
ke c
onc)
* 1
00"N
A"
stan
ds f
or "
Not
app
licab
le"
Attachment B: Calculation Worksheets, Standard Curves and LOD/LOQ Calculations
IR-4 North Central Region Laboratory, Michigan State University Analytical Summary Report PR# 09358
Page 68

PR
OJE
CT
IN
FO
RM
AT
ION
PR
Num
ber:
09
358
Lab
orat
ory
ID:
0935
8.11
-MIR
05C
hem
ical
: F
loni
cam
idF
ield
ID
No.
for
MV
: 09
358.
11-W
I17
Ana
lysi
s fo
r:
TF
NA
Fie
ld R
esea
rch
Dir
ecto
r:
Dr.
Sco
tt C
hapm
anC
omm
odity
: M
int
Ana
lyst
(s):
E
ina
Abo
uzie
d&L
este
r G
eiss
elC
rop
part
: M
int T
ops
(lea
ves&
stem
s)In
stru
men
t: U
PL
C/M
S/M
SC
AL
IBR
AT
ION
DA
TA
Dat
e of
cal
ibra
tion
anal
ysis
: 19
-Jul
-12
RT
SD
BP
eak
----
----
Pag
eID
(or
nam
e)C
onc.
(µg/
mL
)A
rea
MV
-87
A30
7G-2
70.
0001
001
183
Typ
e:
Lin
ear
regr
essi
onM
V-8
8A
307G
-26
0.00
0200
235
7E
quat
ion:
y
= m
x+
bM
V-8
9A
307G
-25
0.00
0500
510
12S
lope
, m =
2338
624
MV
-90
A30
7G-2
40.
0010
0120
50In
terc
ept,
b =
-151
.66
MV
-91
A30
7G-2
30.
0020
020
4320
R² =
0.99
87M
V-9
2A
307G
-22
0.00
5005
1178
7L
OQ
(µ
g/g)
=0.
02M
V-9
9A
307G
-22
0.00
5005
1152
9M
V-1
00A
307G
-23
0.00
2002
043
05M
V- 1
01A
307G
-24
0.00
1001
2057
MV
- 102
A30
7G-2
50.
0005
005
1092
MV
-103
A30
7G-2
60.
0002
002
455
MV
- 104
A30
7G-2
70.
0001
001
234
AN
AL
YT
ICA
L D
AT
AE
xtra
ctio
n da
te:
17-J
ul-1
2A
naly
sis
date
:19
-Jul
-12
RT
SD
BS
ampl
eS
ampl
eS
pike
Sam
ple
Spi
keP
eak
Fin
alR
esid
ueS
pike
Pag
eID
Typ
eA
dded
Wei
ght
Con
c.A
rea
Vol
ume
Fou
ndR
ecov
ery
No.
*1(µ
g)(g
)(µ
g/g)
*2(c
ount
s)(m
L)
(µg/
g)*3
(%)*
4
CA
LC
UL
AT
ION
PA
GE
Cal
ibra
tion
stan
dard
----
----
----
----
y =
233
8624
.388
3x -
151.
6624
R² =
0.9
987
0
2000
4000
6000
8000
1000
0
1200
0 0.00
00.
001
0.00
20.
003
0.00
40.
005
0.00
6
Peak area
Sta
ndar
d C
onc.
(µ
g/m
L)
MV
-94
1847
2A-C
-1C
NA
5.00
NA
5620
00.
0035
5N
A
MV
-95
1847
2A-M
V-0
.02-
1F
0.10
015.
000.
0200
210
4920
00.
0205
410
2.58
MV
-96
1847
2A-M
V-0
.02-
2F
0.10
015.
000.
0200
210
6820
00.
0208
610
4.20
MV
-97
1847
2A-M
V-0
.02-
3F
0.10
015.
000.
0200
211
0320
00.
0214
610
7.19
NO
TE
S*1
: C=
Con
trol
, F=
Fort
ifie
d, T
=T
reat
ed*2
: Spi
ke a
mou
nt =
(Sp
ike
adde
d) ÷
(Sa
mpl
e w
eigh
t)*3
: Res
idue
am
ount
= [
(Are
a -
b) ÷
m]
x (F
inal
vol
/Sam
ple
wt)
*4. R
ecov
ery
(%)
=(R
esid
ue f
ound
) ÷
(sp
ike
conc
) *
100
"NA
" st
ands
for
"N
ot a
pplic
able
"
Attachment B: Calculation Worksheets, Standard Curves and LOD/LOQ Calculations
IR-4 North Central Region Laboratory, Michigan State University Analytical Summary Report PR# 09358
Page 69

PR
OJE
CT
IN
FO
RM
AT
ION
PR
Num
ber:
09
358
Lab
orat
ory
ID:
0935
8.11
-MIR
05C
hem
ical
: F
loni
cam
idF
ield
ID
No.
for
MV
: 09
358.
11-W
I17
Ana
lysi
s fo
r:
TF
NA
-AM
Fie
ld R
esea
rch
Dir
ecto
r:
Dr.
Sco
tt C
hapm
an
Com
mod
ity:
M
int
Ana
lyst
(s):
E
ina
Abo
uzie
d&L
este
r G
eiss
elC
rop
part
: M
int T
ops
(lea
ves&
stem
s)In
stru
men
t:
UP
LC
/MS
/MS
CA
LIB
RA
TIO
N D
AT
AD
ate
of c
alib
rati
on a
naly
sis:
20
-Jul
-12
RT
SD
BP
eak
----
----
Pag
eID
(or
nam
e)C
onc.
(µg/
mL
)A
rea
MV
-118
A30
7G-2
70.
0001
012
152
Typ
e:
Lin
ear
regr
essi
onM
V-1
19A
307G
-26
0.00
0202
425
6E
quat
ion:
y
= m
x+
bM
V-1
20A
A30
7G-2
50.
0005
060
726
Slo
pe, m
=19
2281
1M
V-1
21A
307G
-24
0.00
1012
1411
Inte
rcep
t, b
=-2
68.0
9M
V-1
22A
307G
-23
0.00
2024
028
48R
² =0.
9871
MV
-126
A30
7G-2
70.
0001
012
102
LO
Q (
µg/
g) =
0.02
MV
-137
A30
7G-2
20.
0050
6095
53M
V-1
38A
307G
-23
0.00
2024
028
79M
V-1
39A
307G
-24
0.00
1012
1574
MV
-140
A30
7G-2
50.
0005
060
941
MV
-141
A30
7G-2
60.
0002
024
391
MV
-142
A30
7G-2
70.
0001
012
126
MV
-143
A30
7G-2
20.
0050
6099
98
AN
AL
YT
ICA
L D
AT
AE
xtra
ctio
n da
te:
18-J
ul-1
2A
naly
sis
date
:20
-Jul
-12
CA
LC
UL
AT
ION
PA
GE
Cal
ibra
tion
sta
ndar
d--
----
----
----
--
y =
192
2811
.147
4x -
268.
0894
R² =
0.9
871
-100
00
1000
2000
3000
4000
5000
6000
7000
8000
9000
1000
0
1100
0 0.00
00.
001
0.00
20.
003
0.00
40.
005
0.00
6
Peak area
Sta
ndar
d C
onc.
(µ
g/m
L)
yR
TS
DB
Sam
ple
Sam
ple
Spi
keS
ampl
eS
pike
Pea
kF
inal
Res
idue
Spi
keP
age
IDT
ype
Add
edW
eigh
tC
onc.
Are
aV
olum
eF
ound
Rec
over
yN
o.*1
(µg)
(g)
(µg/
g)*2
(cou
nts)
(mL
)(µ
g/g)
*3(%
)*4
MV
-127
1847
2A-C
-2C
NA
5.00
NA
020
0<
0.0
2N
A
MV
-128
1847
2A-M
V-0
.2-1
F1.
012
5.00
0.20
2414
8210
000.
1820
89.9
4
MV
-129
1847
2A-M
V-0
.2-2
F1.
012
5.00
0.20
2413
8110
000.
1715
84.7
5
MV
-130
1847
2A-M
V-0
.2-3
F1.
012
5.00
0.20
2414
1310
000.
1749
86.3
9
NO
TE
S*1
: C=
Con
trol
, F=
Fort
ifie
d, T
=T
reat
ed*2
: Spi
ke a
mou
nt =
(S
pike
add
ed)
÷ (S
ampl
e w
eigh
t)*3
: Res
idue
am
ount
= [
(Are
a -
b) ÷
m]
x (F
inal
vol
/Sam
ple
wt)
*4. R
ecov
ery
(%)
=(R
esid
ue f
ound
) ÷
(spi
ke c
onc)
* 1
00"N
A"
stan
ds f
or "
Not
app
licab
le"
Attachment B: Calculation Worksheets, Standard Curves and LOD/LOQ Calculations
IR-4 North Central Region Laboratory, Michigan State University Analytical Summary Report PR# 09358
Page 70

PR
OJE
CT
IN
FO
RM
AT
ION
PR
Num
ber:
09
358
Lab
orat
ory
ID:
0935
8.11
-MIR
05C
hem
ical
: F
loni
cam
i dF
ield
ID
No.
for
MV
: 09
358.
11-W
I17
Ana
lysi
s fo
r:
Flo
nica
mid
(IK
I-22
0)F
ield
Res
earc
h D
irec
tor:
D
r. S
cott
Cha
pman
Com
mod
ity:
M
int
Ana
lyst
(s):
E
ina
Abo
uzie
d&L
este
r G
eiss
el
Cro
p pa
rt:
Min
t Top
s (l
eave
s&st
ems)
Inst
rum
ent:
U
PL
C/M
S/M
SC
AL
IBR
AT
ION
DA
TA
Dat
e of
cal
ibra
tion
ana
lysi
s:
20-J
ul-1
2R
TSD
BP
eak
----
----
Pag
eID
(or
nam
e)C
onc.
(µg/
mL
)A
rea
MV
-118
A30
7G-2
70.
0001
010
149
Typ
e:
Lin
ear
regr
essi
onM
V-1
19A
307G
-26
0.00
0202
030
4E
quat
ion:
y
= m
x+
bM
V-1
20A
307G
-25
0.00
0505
085
8S
lope
, m =
2274
739
MV
-121
A30
7G-2
40.
0010
1018
69In
terc
ept,
b =
-216
.12
MV
-122
A30
7G-2
30.
0020
200
3717
R²
=0.
9901
MV
-126
A30
7G-2
70.
0001
010
204
LO
Q (
µg/
g) =
0.02
MV
-137
A30
7G-2
20.
0050
5010
752
MV
-138
A30
7G-2
30.
0020
200
4030
MV
-139
A30
7G-2
40.
0010
1020
54M
V-1
40A
307G
-25
0.00
0505
010
43M
V-1
41A
307G
-26
0.00
0202
041
1M
V-1
42A
307G
-27
0.00
0101
024
6M
V-1
43A
307G
-22
0.00
5050
1221
9
AN
AL
YT
ICA
L D
AT
AE
xtra
ctio
n da
te:
18-J
ul-1
2A
naly
sis
date
:20
-Jul
-12
RT
SDB
Sam
ple
Sam
ple
Spi
keS
ampl
eS
pike
Pea
kF
inal
Res
idue
Spi
ke
CA
LC
UL
AT
ION
PA
GE
Cal
ibra
tion
sta
ndar
d--
----
----
----
--
y =
227
4739
.124
8x -
216.
1163
R² =
0.9
901
0
1000
2000
3000
4000
5000
6000
7000
8000
9000
1000
0
1100
0
1200
0
1300
0 0.00
00.
001
0.00
20.
003
0.00
40.
005
0.00
6
Peak area
Sta
nd
ard
Con
c. (
µg/
mL
)
RT
SDB
Sam
ple
Sam
ple
Spi
keS
ampl
eS
pike
Pea
kF
inal
Res
idue
Spi
keP
age
IDT
ype
Add
edW
eigh
tC
onc.
Are
aV
olum
eF
ound
Rec
over
yN
o.*1
(µg)
(g)
(µg/
g)*2
(cou
nts)
(mL
)(µ
g/g)
*3(%
)*4
MV
-127
1847
2A-C
-2C
NA
5.00
NA
122
200
0.00
5946
NA
MV
-128
1847
2A-M
V-0
.2-1
F1.
010
5.00
0.20
2015
4410
000.
1548
76.6
1
MV
-129
1847
2A-M
V-0
.2-2
F1.
010
5.00
0.20
2016
6810
000.
1657
82.0
1
MV
-130
1847
2A-M
V-0
.2-3
F1.
010
5.00
0.20
2015
8110
000.
1580
78.2
2
NO
TE
S*1
: C=
Con
trol
, F=
Fort
ifie
d, T
=T
reat
ed*2
: Spi
ke a
mou
nt =
(S
pike
add
ed)
÷ (S
ampl
e w
eigh
t)*3
: Res
idue
am
ount
= [
(Are
a -
b) ÷
m]
x (F
inal
vol
/Sam
ple
wt)
*4. R
ecov
ery
(%)
=(R
esid
ue f
ound
) ÷
(spi
ke c
onc)
* 1
00"N
A"
stan
ds f
or "
Not
app
licab
le"
Attachment B: Calculation Worksheets, Standard Curves and LOD/LOQ Calculations
IR-4 North Central Region Laboratory, Michigan State University Analytical Summary Report PR# 09358
Page 71

PR
OJE
CT
IN
FO
RM
AT
ION
PR
Num
ber:
09
358
Lab
orat
ory
ID:
0935
8.11
-MIR
05C
hem
ical
: F
loni
cam
idF
ield
ID
No.
for
MV
: 09
358.
11-W
I17
Ana
lysi
s fo
r:
TF
NG
Fie
ld R
esea
rch
Dir
ecto
r:
Dr.
Sco
tt C
hapm
anC
omm
odit
y:
Min
tA
naly
st(s
):
Ein
a A
bouz
ied&
Les
ter
Gei
ssel
Cro
p pa
rt:
Min
t Top
s (l
eave
s&st
ems)
Inst
rum
ent:
U
PL
C/M
S/M
S
CA
LIB
RA
TIO
N D
AT
AD
ate
of c
alib
rati
on a
naly
sis:
20
-Jul
-12
RT
SD
BP
eak
----
----
Pag
eID
(or
nam
e)C
onc.
(µg/
mL
)A
rea
MV
-118
A30
7G-2
70.
0000
9550
188
Typ
e:
Lin
ear
regr
essi
onM
V-1
19A
307G
-26
0.00
0191
038
3E
quat
ion:
y
= m
x+
bM
V-1
20A
307G
-25
0.00
0477
510
06S
lope
, m =
3288
200
MV
-121
A30
7G-2
40.
0009
5500
2377
Inte
rcep
t, b
=-3
64.6
2M
V-1
22A
307G
-23
0.00
1910
050
29R
² =0.
9932
MV
-126
A30
7G-2
70.
0000
9550
264
LO
Q (
µg/
g) =
0.02
MV
-137
A30
7G-2
20.
0047
7515
015
MV
-138
A30
7G-2
30.
0019
100
5526
MV
-139
A30
7G-2
40.
0009
5500
2626
MV
-140
A30
7G-2
50.
0004
775
1356
MV
-141
A30
7G-2
60.
0001
910
526
MV
-142
A30
7G-2
70.
0000
9550
296
MV
-143
A30
7G-2
20.
0047
7516
250
AN
AL
YT
ICA
L D
AT
AE
xtra
ctio
n da
te:
18-J
ul-1
2A
naly
sis
date
:20
-Jul
-12
CA
LC
UL
AT
ION
PA
GE
Cal
ibra
tion
sta
ndar
d--
----
----
----
--
y =
328
8200
.348
9x -
364.
6227
R² =
0.9
932
-200
00
2000
4000
6000
8000
1000
0
1200
0
1400
0
1600
0
1800
0 0.00
00.
001
0.00
20.
003
0.00
40.
005
0.00
6
Peak area
Sta
ndar
d C
onc.
(µ
g/m
L)
RT
SD
BS
ampl
eS
ampl
eS
pike
Sam
ple
Spi
keP
eak
Fin
alR
esid
ueS
pike
Pag
eID
Typ
eA
dded
Wei
ght
Con
c.A
rea
Vol
ume
Fou
ndR
ecov
ery
No.
*1(µ
g)(g
)(µ
g/g)
*2(c
ount
s)(m
L)
(µg/
g)*3
(%)*
4M
V-1
2718
472A
-C-2
CN
A5.
00N
A45
120
00.
0099
2N
A
MV
-128
1847
2A-M
V-0
.2-1
F0.
9550
5.00
0.19
1026
8710
000.
1856
97.1
8
MV
-129
1847
2A-M
V-0
.2-2
F0.
9550
5.00
0.19
1026
4910
000.
1833
95.9
7
MV
-130
1847
2A-M
V-0
.2-3
F0.
9550
5.00
0.19
1026
4710
000.
1832
95.9
0
NO
TE
S*1
: C=
Con
trol
, F=
Fort
ifie
d, T
=T
reat
ed*2
: Spi
ke a
mou
nt =
(S
pike
add
ed)
÷ (S
ampl
e w
eigh
t)*3
: Res
idue
am
ount
= [
(Are
a -
b) ÷
m]
x (F
inal
vol
/Sam
ple
wt)
*4. R
ecov
ery
(%)
=(R
esid
ue f
ound
) ÷
(spi
ke c
onc)
* 1
00"N
A"
stan
ds f
or "
Not
app
licab
le"
Attachment B: Calculation Worksheets, Standard Curves and LOD/LOQ Calculations
IR-4 North Central Region Laboratory, Michigan State University Analytical Summary Report PR# 09358
Page 72

PR
OJE
CT
IN
FO
RM
AT
ION
PR
Num
ber:
09
358
Lab
orat
ory
ID:
0935
8.11
-MIR
05C
hem
ical
: F
loni
cam
idF
ield
ID
No.
for
MV
: 09
358.
11-W
I17
Ana
lysi
s fo
r:
TF
NA
Fie
ld R
esea
rch
Dir
ecto
r:
Dr.
Sco
tt C
hapm
anC
omm
odity
: M
int
Ana
lyst
(s):
E
ina
Abo
uzie
d&L
este
r G
eiss
elC
rop
part
: M
int T
ops
(lea
ves&
stem
s)In
stru
men
t: U
PL
C/M
S/M
SC
AL
IBR
AT
ION
DA
TA
Dat
e of
cal
ibra
tion
anal
ysis
: 20
-Jul
-12
RT
SD
BP
eak
----
----
Pag
eID
(or
nam
e)C
onc.
(µg/
mL
)A
rea
MV
-118
A30
7G-2
70.
0001
001
162
Typ
e:
Lin
ear
regr
essi
onM
V-1
19A
307G
-26
0.00
0200
230
8E
quat
ion:
y
= m
x+
bM
V-1
20A
307G
-25
0.00
0500
583
0S
lope
, m =
2434
984
MV
-121
A30
7G-2
40.
0010
0119
83In
terc
ept,
b =
-238
.18
MV
-122
A30
7G-2
30.
0020
020
4048
R² =
0.99
30M
V-1
26A
307G
-27
0.00
0100
121
3L
OQ
(µ
g/g)
=0.
02M
V-1
37A
307G
-22
0.00
5005
1150
8M
V-1
38A
307G
-23
0.00
2002
043
62M
V-1
39A
307G
-24
0.00
1001
2156
MV
-140
A30
7G-2
50.
0005
005
1070
MV
-141
A30
7G-2
60.
0002
002
398
MV
-142
A30
7G-2
70.
0001
001
235
MV
- 143
A30
7G-2
20.
0050
0512
773
AN
AL
YT
ICA
L D
AT
AE
xtra
ctio
n da
te:
18-J
ul-1
2A
naly
sis
date
:20
-Jul
-12
RT
SD
BS
ampl
eS
ampl
eS
pike
Sam
ple
Spi
keP
eak
Fin
alR
esid
ueS
pike
PID
TA
ddd
Wi
htC
AV
lF
dR
CA
LC
UL
AT
ION
PA
GE
Cal
ibra
tion
stan
dard
----
----
----
----
y =
243
4983
.691
5x -
238.
1777
R² =
0.9
930
0
1000
2000
3000
4000
5000
6000
7000
8000
9000
1000
0
1100
0
1200
0
1300
0 0.00
00.
001
0.00
20.
003
0.00
40.
005
0.00
6
Peak area
Sta
ndar
d C
onc.
(µ
g/m
L)
Pag
eID
Typ
eA
dded
Wei
ght
Con
c.A
rea
Vol
ume
Fou
ndR
ecov
ery
No.
*1(µ
g)(g
)(µ
g/g)
*2(c
ount
s)(m
L)
(µg/
g)*3
(%)*
4
MV
-127
1847
2A-C
-2C
NA
5.00
NA
100
200
0.00
556
NA
MV
-128
1847
2A-M
V-0
.2-1
F1.
001
5.00
0.20
0222
9210
000.
2078
103.
81
MV
-129
1847
2A-M
V-0
.2-2
F1.
001
5.00
0.20
0224
3810
000.
2198
109.
80
MV
-130
1847
2A-M
V-0
.2-3
F1.
001
5.00
0.20
0222
8210
000.
2070
103.
40
NO
TE
S*1
: C=
Con
trol
, F=
Fort
ifie
d, T
=T
reat
ed*2
: Spi
ke a
mou
nt =
(Sp
ike
adde
d) ÷
(Sa
mpl
e w
eigh
t)*3
: Res
idue
am
ount
= [
(Are
a -
b) ÷
m]
x (F
inal
vol
/Sam
ple
wt)
*4. R
ecov
ery
(%)
=(R
esid
ue f
ound
) ÷
(sp
ike
conc
) *
100
"NA
" st
ands
for
"N
ot a
pplic
able
"
Attachment B: Calculation Worksheets, Standard Curves and LOD/LOQ Calculations
IR-4 North Central Region Laboratory, Michigan State University Analytical Summary Report PR# 09358
Page 73

PR
OJE
CT
IN
FO
RM
AT
ION
PR
Num
ber:
09
358
Lab
orat
ory
ID:
0935
8.11
-MIR
05C
hem
ical
: F
loni
cam
idF
ield
ID
No.
for
MV
: 09
358.
11-W
I17
Ana
lysi
s fo
r:
TF
NA
-AM
Fie
ld R
esea
rch
Dir
ecto
r:
Dr.
Sco
tt C
hapm
an
Com
mod
ity:
M
int
Ana
lyst
(s):
E
ina
Abo
uzie
d&L
este
r G
eiss
elC
rop
part
: M
int T
ops
(lea
ves&
stem
s)In
stru
men
t:
UP
LC
/MS
/MS
CA
LIB
RA
TIO
N D
AT
AD
ate
of c
alib
rati
on a
naly
sis:
20
-Jul
-12
RT
SD
BP
eak
----
----
Pag
eID
(or
nam
e)C
onc.
(µg/
mL
)A
rea
MV
-118
A30
7G-2
70.
0001
012
152
Typ
e:
Lin
ear
regr
essi
onM
V-1
19A
307G
-26
0.00
0202
425
6E
quat
ion:
y
= m
x+
bM
V-1
20A
A30
7G-2
50.
0005
060
726
Slo
pe, m
=19
2281
1M
V-1
21A
307G
-24
0.00
1012
1411
Inte
rcep
t, b
=-2
68.0
9M
V-1
22A
307G
-23
0.00
2024
028
48R
² =0.
9871
MV
-126
A30
7G-2
70.
0001
012
102
LO
Q (
µg/
g) =
0.02
MV
-137
A30
7G-2
20.
0050
6095
53M
V-1
38A
307G
-23
0.00
2024
028
79M
V-1
39A
307G
-24
0.00
1012
1574
MV
-140
A30
7G-2
50.
0005
060
941
MV
-141
A30
7G-2
60.
0002
024
391
MV
-142
A30
7G-2
70.
0001
012
126
MV
-143
A30
7G-2
20.
0050
6099
98
AN
AL
YT
ICA
L D
AT
AE
xtra
ctio
n da
te:
19-J
ul-1
2A
naly
sis
date
:20
-Jul
-12
CA
LC
UL
AT
ION
PA
GE
Cal
ibra
tion
sta
ndar
d--
----
----
----
--
y =
192
2811
.147
4x -
268.
0894
R² =
0.9
871
-100
00
1000
2000
3000
4000
5000
6000
7000
8000
9000
1000
0
1100
0 0.00
00.
001
0.00
20.
003
0.00
40.
005
0.00
6
Peak area
Sta
ndar
d C
onc.
(µ
g/m
L)
yR
TS
DB
Sam
ple
Sam
ple
Spi
keS
ampl
eS
pike
Pea
kF
inal
Res
idue
Spi
keP
age
IDT
ype
Add
edW
eigh
tC
onc.
Are
aV
olum
eF
ound
Rec
over
yN
o.*1
(µg)
(g)
(µg/
g)*2
(cou
nts)
(mL
)(µ
g/g)
*3(%
)*4
MV
-132
1847
2A-C
-3C
NA
5.00
NA
020
0<
0.0
2N
A
MV
-133
1847
2A-M
V-2
-1F
10.1
25.
002.
024
2587
5000
1.48
573
.36
MV
-134
1847
2A-M
V-2
-2F
10.1
25.
002.
024
2975
5000
1.68
783
.33
MV
-135
1847
2A-M
V-2
-3F
10.1
25.
002.
024
3132
5000
1.76
887
.37
NO
TE
S*1
: C=
Con
trol
, F=
Fort
ifie
d, T
=T
reat
ed*2
: Spi
ke a
mou
nt =
(S
pike
add
ed)
÷ (S
ampl
e w
eigh
t)*3
: Res
idue
am
ount
= [
(Are
a -
b) ÷
m]
x (F
inal
vol
/Sam
ple
wt)
*4. R
ecov
ery
(%)
=(R
esid
ue f
ound
) ÷
(spi
ke c
onc)
* 1
00"N
A"
stan
ds f
or "
Not
app
licab
le"
Attachment B: Calculation Worksheets, Standard Curves and LOD/LOQ Calculations
IR-4 North Central Region Laboratory, Michigan State University Analytical Summary Report PR# 09358
Page 74

PR
OJE
CT
IN
FO
RM
AT
ION
PR
Num
ber:
09
358
Lab
orat
ory
ID:
0935
8.11
-MIR
05C
hem
ical
: F
loni
cam
i dF
ield
ID
No.
for
MD
: 09
358.
11-W
I17
Ana
lysi
s fo
r:
Flo
nica
mid
(IK
I-22
0)F
ield
Res
earc
h D
irec
tor:
D
r. S
cott
Cha
pman
Com
mod
ity:
M
int
Ana
lyst
(s):
E
ina
Abo
uzie
d&L
este
r G
eiss
el
Cro
p pa
rt:
Min
t Top
s (l
eave
s&st
ems)
Inst
rum
ent:
U
PL
C/M
S/M
SC
AL
IBR
AT
ION
DA
TA
Dat
e of
cal
ibra
tion
ana
lysi
s:
20-J
ul-1
2R
TSD
BP
eak
----
----
Pag
eID
(or
nam
e)C
onc.
(µg/
mL
)A
rea
MV
-118
A30
7G-2
70.
0001
010
149
Typ
e:
Lin
ear
regr
essi
onM
V-1
19A
307G
-26
0.00
0202
030
4E
quat
ion:
y
= m
x+
bM
V-1
20A
307G
-25
0.00
0505
085
8S
lope
, m =
2274
739
MV
-121
A30
7G-2
40.
0010
1018
69In
terc
ept,
b =
-216
.12
MV
-122
A30
7G-2
30.
0020
200
3717
R²
=0.
9901
MV
-126
A30
7G-2
70.
0001
010
204
LO
Q (
µg/
g) =
0.02
MV
-137
A30
7G-2
20.
0050
5010
752
MV
-138
A30
7G-2
30.
0020
200
4030
MV
- 139
A30
7G-2
40.
0010
1020
54M
V-1
40A
307G
-25
0.00
0505
010
43M
V-1
41A
307G
-26
0.00
0202
041
1M
V-1
42A
307G
-27
0.00
0101
024
6M
V-1
43A
307G
-22
0.00
5050
1221
9
AN
AL
YT
ICA
L D
AT
AE
xtra
ctio
n da
te:
19-J
ul-1
2A
naly
sis
date
:20
-Jul
-12
RT
SDB
Sam
ple
Sam
ple
Spi
keS
ampl
eS
pike
Pea
kF
inal
Res
idue
Spi
ke
CA
LC
UL
AT
ION
PA
GE
Cal
ibra
tion
sta
ndar
d--
----
----
----
--
y =
227
4739
.124
8x -
216.
1163
R² =
0.9
901
0
1000
2000
3000
4000
5000
6000
7000
8000
9000
1000
0
1100
0
1200
0
1300
0 0.00
00.
001
0.00
20.
003
0.00
40.
005
0.00
6
Peak area
Sta
nd
ard
Con
c. (
µg/
mL
)R
TSD
BS
ampl
eS
ampl
eS
pike
Sam
ple
Spi
keP
eak
Fin
alR
esid
ueS
pike
Pag
eID
Typ
eA
dded
Wei
ght
Con
c.A
rea
Vol
ume
Fou
ndR
ecov
ery
No.
*1(µ
g)(g
)(µ
g/g)
*2(c
ount
s)(m
L)
(µg/
g)*3
(%)*
4
MV
-132
1847
2A-C
-3C
NA
5.00
NA
7220
00.
0050
66N
A
MV
-133
1847
2A-M
V-2
-1F
10.1
05.
002.
020
3142
5000
1.47
673
.08
MV
-134
1847
2A-M
V-2
-2F
10.1
05.
002.
020
3267
5000
1.53
175
.80
MV
-135
1847
2A-M
V-2
-3F
10.1
05.
002.
020
3666
5000
1.70
784
.49
NO
TE
S*1
: C=
Con
trol
, F=
Fort
ifie
d, T
=T
reat
ed*2
: Spi
ke a
mou
nt =
(S
pike
add
ed)
÷ (S
ampl
e w
eigh
t)*3
: Res
idue
am
ount
= [
(Are
a -
b) ÷
m]
x (F
inal
vol
/Sam
ple
wt)
*4. R
ecov
ery
(%)
=(R
esid
ue f
ound
) ÷
(spi
ke c
onc)
* 1
00"N
A"
stan
ds f
or "
Not
app
licab
le"
Attachment B: Calculation Worksheets, Standard Curves and LOD/LOQ Calculations
IR-4 North Central Region Laboratory, Michigan State University Analytical Summary Report PR# 09358
Page 75

PR
OJE
CT
IN
FO
RM
AT
ION
PR
Num
ber:
09
358
Lab
orat
ory
ID:
0935
8.11
-MIR
05C
hem
ical
: F
loni
cam
idF
ield
ID
No.
for
MV
: 09
358.
11-W
I17
Ana
lysi
s fo
r:
TF
NG
Fie
ld R
esea
rch
Dir
ecto
r:
Dr.
Sco
tt C
hapm
anC
omm
odit
y:
Min
tA
naly
st(s
):
Ein
a A
bouz
ied&
Les
ter
Gei
ssel
Cro
p pa
rt:
Min
t Top
s (l
eave
s&st
ems)
Inst
rum
ent:
U
PL
C/M
S/M
S
CA
LIB
RA
TIO
N D
AT
AD
ate
of c
alib
rati
on a
naly
sis:
20
-Jul
-12
RT
SD
BP
eak
----
----
Pag
eID
(or
nam
e)C
onc.
(µg/
mL
)A
rea
MV
-118
A30
7G-2
70.
0000
9550
188
Typ
e:
Lin
ear
regr
essi
onM
V-1
19A
307G
-26
0.00
0191
038
3E
quat
ion:
y
= m
x+
bM
V-1
20A
307G
-25
0.00
0477
510
06S
lope
, m =
3288
200
MV
-121
A30
7G-2
40.
0009
5500
2377
Inte
rcep
t, b
=-3
64.6
2M
V-1
22A
307G
-23
0.00
1910
050
29R
² =0.
9932
MV
-126
A30
7G-2
70.
0000
9550
264
LO
Q (
µg/
g) =
0.02
MV
-137
A30
7G-2
20.
0047
7515
015
MV
-138
A30
7G-2
30.
0019
100
5526
MV
-139
A30
7G-2
40.
0009
5500
2626
MV
-140
A30
7G-2
50.
0004
775
1356
MV
-141
A30
7G-2
60.
0001
910
526
MV
-142
A30
7G-2
70.
0000
9550
296
MV
-143
A30
7G-2
20.
0047
7516
250
AN
AL
YT
ICA
L D
AT
AE
xtra
ctio
n da
te:
19-J
ul-1
2A
naly
sis
date
:20
-Jul
-12
CA
LC
UL
AT
ION
PA
GE
Cal
ibra
tion
sta
ndar
d--
----
----
----
--
y =
328
8200
.348
9x -
364.
6227
R² =
0.9
932
-200
00
2000
4000
6000
8000
1000
0
1200
0
1400
0
1600
0
1800
0 0.00
00.
001
0.00
20.
003
0.00
40.
005
0.00
6
Peak area
Sta
ndar
d C
onc.
(µ
g/m
L)
RT
SD
BS
ampl
eS
ampl
eS
pike
Sam
ple
Spi
keP
eak
Fin
alR
esid
ueS
pike
Pag
eID
Typ
eA
dded
Wei
ght
Con
c.A
rea
Vol
ume
Fou
ndR
ecov
ery
No.
*1(µ
g)(g
)(µ
g/g)
*2(c
ount
s)(m
L)
(µg/
g)*3
(%)*
4M
V-1
3218
472A
-C-3
CN
A5.
00N
A46
520
00.
0100
9N
A
MV
-133
1847
2A-M
V-2
-1F
9.55
05.
001.
910
4985
5000
1.62
785
.18
MV
-134
A18
472A
-MV
-2-2
F9.
550
5.00
1.91
053
1550
001.
727
90.4
3
MV
-135
1847
2A-M
V-2
-3F
9.55
05.
001.
910
5693
5000
1.84
296
.45
NO
TE
S*1
: C=
Con
trol
, F=
Fort
ifie
d, T
=T
reat
ed*2
: Spi
ke a
mou
nt =
(S
pike
add
ed)
÷ (S
ampl
e w
eigh
t)*3
: Res
idue
am
ount
= [
(Are
a -
b) ÷
m]
x (F
inal
vol
/Sam
ple
wt)
*4. R
ecov
ery
(%)
=(R
esid
ue f
ound
) ÷
(spi
ke c
onc)
* 1
00"N
A"
stan
ds f
or "
Not
app
licab
le"
Attachment B: Calculation Worksheets, Standard Curves and LOD/LOQ Calculations
IR-4 North Central Region Laboratory, Michigan State University Analytical Summary Report PR# 09358
Page 76

PR
OJE
CT
IN
FO
RM
AT
ION
PR
Num
ber:
09
358
Lab
orat
ory
ID:
0935
8.11
-MIR
05C
hem
ical
: F
loni
cam
idF
ield
ID
No.
for
MV
: 09
358.
11-W
I17
Ana
lysi
s fo
r:
TF
NA
Fie
ld R
esea
rch
Dir
ecto
r:
Dr.
Sco
tt C
hapm
anC
omm
odity
: M
int
Ana
lyst
(s):
E
ina
Abo
uzie
d&L
este
r G
eiss
elC
rop
part
: M
int T
ops
(lea
ves&
stem
s)In
stru
men
t: U
PL
C/M
S/M
SC
AL
IBR
AT
ION
DA
TA
Dat
e of
cal
ibra
tion
anal
ysis
: 20
-Jul
-12
RT
SD
BP
eak
----
----
Pag
eID
(or
nam
e)C
onc.
(µg/
mL
)A
rea
MV
-118
A30
7G-2
70.
0001
001
162
Typ
e:
Lin
ear
regr
essi
onM
V-1
19A
307G
-26
0.00
0200
230
8E
quat
ion:
y
= m
x+
bM
V-1
20A
307G
-25
0.00
0500
583
0S
lope
, m =
2434
984
MV
-121
A30
7G-2
40.
0010
0119
83In
terc
ept,
b =
-238
.18
MV
-122
A30
7G-2
30.
0020
020
4048
R² =
0.99
30M
V-1
26A
307G
-27
0.00
0100
121
3L
OQ
(µ
g/g)
=0.
02M
V-1
37A
307G
-22
0.00
5005
1150
8M
V-1
38A
307G
-23
0.00
2002
043
62M
V-1
39A
307G
-24
0.00
1001
2156
MV
-140
A30
7G-2
50.
0005
005
1070
MV
-141
A30
7G-2
60.
0002
002
398
MV
-142
A30
7G-2
70.
0001
001
235
MV
- 143
A30
7G-2
20.
0050
0512
773
AN
AL
YT
ICA
L D
AT
AE
xtra
ctio
n da
te:
19-J
ul-1
2A
naly
sis
date
:20
-Jul
-12
RT
SD
BS
ampl
eS
ampl
eS
pike
Sam
ple
Spi
keP
eak
Fin
alR
esid
ueS
pike
PID
TA
ddd
Wi
htC
AV
lF
dR
CA
LC
UL
AT
ION
PA
GE
Cal
ibra
tion
stan
dard
----
----
----
----
y =
243
4983
.691
5x -
238.
1777
R² =
0.9
930
0
1000
2000
3000
4000
5000
6000
7000
8000
9000
1000
0
1100
0
1200
0
1300
0 0.00
00.
001
0.00
20.
003
0.00
40.
005
0.00
6
Peak area
Sta
nd
ard
Con
c. (
µg/
mL
)
Pag
eID
Typ
eA
dded
Wei
ght
Con
c.A
rea
Vol
ume
Fou
ndR
ecov
ery
No.
*1(µ
g)(g
)(µ
g/g)
*2(c
ount
s)(m
L)
(µg/
g)*3
(%)*
4
MV
-132
1847
2A-C
-3C
NA
5.00
NA
9920
00.
0055
4N
A
MV
-133
1847
2A-M
V-2
-1F
10.0
15.
002.
002
4219
5000
1.83
091
.43
MV
-134
1847
2A-M
V-2
-2F
10.0
15.
002.
002
4370
5000
1.89
294
.53
MV
-135
1847
2A-M
V-2
-3F
10.0
15.
002.
002
4892
5000
2.10
710
5.24
NO
TE
S*1
: C=
Con
trol
, F=
Fort
ifie
d, T
=T
reat
ed*2
: Spi
ke a
mou
nt =
(Sp
ike
adde
d) ÷
(Sa
mpl
e w
eigh
t)*3
: Res
idue
am
ount
= [
(Are
a -
b) ÷
m]
x (F
inal
vol
/Sam
ple
wt)
*4. R
ecov
ery
(%)
=(R
esid
ue f
ound
) ÷
(sp
ike
conc
) *
100
"NA
" st
ands
for
"N
ot a
pplic
able
"
Attachment B: Calculation Worksheets, Standard Curves and LOD/LOQ Calculations
IR-4 North Central Region Laboratory, Michigan State University Analytical Summary Report PR# 09358
Page 77

PR
OJE
CT
IN
FO
RM
AT
ION
PR
Num
ber:
09
358
Lab
orat
ory
ID:
0935
8.11
-MIR
05C
hem
ical
: F
loni
cam
idF
ield
ID
No.
: 09
358.
11-W
I17
Ana
lysi
s fo
r:
TF
NA
-AM
Fie
ld R
esea
rch
Dir
ecto
r:
Dr.
Sco
tt C
hapm
an
Com
mod
ity:
M
int
Ana
lyst
(s):
E
ina
Abo
uzie
d&L
este
r G
eiss
elC
rop
part
: M
int T
ops
(lea
ves&
stem
s)In
stru
men
t:
UP
LC
/MS
/MS
CA
LIB
RA
TIO
N D
AT
AD
ate
of c
alib
rati
on a
naly
sis:
02
-Aug
-12
RT
SD
BP
eak
----
----
Pag
eID
(or
nam
e)C
onc.
(µg/
mL
)A
rea
WI1
7-23
A30
7G-2
70.
0001
012
95T
ype:
L
inea
r re
gres
sion
WI1
7-24
A30
7G-2
60.
0002
024
248
Equ
atio
n:
y=
mx
+ b
WI1
7-25
A30
7G-2
50.
0005
060
605
Slo
pe, m
=14
6506
1W
I17-
26A
307G
-24
0.00
1012
1212
Inte
rcep
t, b
=-2
18.6
2W
I17-
27A
A30
7G-2
30.
0020
240
2049
R² =
0.98
72W
I17-
28A
307G
-22
0.00
5060
7468
LO
Q (
µg/
g) =
0.02
WI1
7-40
A30
7G-2
20.
0050
6073
87W
I17-
41A
307G
-23
0.00
2024
022
70W
I17-
42A
307G
-24
0.00
1012
1115
WI1
7-43
A30
7G-2
50.
0005
060
678
WI1
7-44
A30
7G-2
60.
0002
024
253
WI1
7-45
A30
7G-2
70.
0001
012
91
AN
AL
YT
ICA
L D
AT
AE
xtra
ctio
n da
te:
31-J
ul-1
2A
naly
sis
date
:02
-Aug
-12
RT
SD
BS
ampl
eS
ampl
eS
pike
Sam
ple
Spi
keP
eak
Fin
alR
esid
ueS
pike
Pag
eID
Typ
eA
dded
Wei
ght
Con
c.A
rea
Vol
ume
Fou
ndR
ecov
ery
CA
LC
UL
AT
ION
PA
GE
Cal
ibra
tion
sta
ndar
d--
----
----
----
--
y =
146
5061
.083
8x -
218.
6247
R² =
0.9
872
-100
00
1000
2000
3000
4000
5000
6000
7000
8000
0.00
00.
001
0.00
20.
003
0.00
40.
005
0.00
6
Peak area
Sta
ndar
d C
onc.
(µ
g/m
L)
gyp
gy
No.
*1(µ
g)(g
)(µ
g/g)
*2(c
ount
s)(m
L)
(µg/
g)*3
(%)*
4W
I17-
3018
473A
-C-1
CN
A5.
00N
A48
200
0.00
728
NA
WI1
7-31
1847
3A-C
-1C
NA
5.00
NA
6120
00.
0076
3N
A
WI1
7-32
1847
3A-Q
C-0
.02-
1F
0.10
125.
000.
0202
432
420
00.
0148
273
.20
WI1
7-33
1847
3A-Q
C-0
.02-
1F
0.10
125.
000.
0202
431
020
00.
0144
371
.31
WI1
7-34
1847
4A-T
-1T
5.00
295
1000
0.07
012
WI1
7-35
1847
4A-T
-1T
5.00
327
1000
0.07
448
WI1
7-36
1847
5A-T
-1T
5.00
361
1000
0.07
913
WI1
7-37
1847
5A-T
-1T
5.00
304
1000
0.07
135
NO
TE
S*1
: C=
Con
trol
, F=
Fort
ifie
d, T
=T
reat
ed*2
: Spi
ke a
mou
nt =
(S
pike
add
ed)
÷ (S
ampl
e w
eigh
t)*3
: Res
idue
am
ount
= [
(Are
a -
b) ÷
m]
x (F
inal
vol
/Sam
ple
wt)
*4. R
ecov
ery
(%)
=(R
esid
ue f
ound
) ÷
(spi
ke c
onc)
* 1
00"N
A"
stan
ds f
or "
Not
app
licab
le"
Attachment B: Calculation Worksheets, Standard Curves and LOD/LOQ Calculations
IR-4 North Central Region Laboratory, Michigan State University Analytical Summary Report PR# 09358
Page 78

PR
OJE
CT
IN
FO
RM
AT
ION
PR
Num
ber:
09
358
Lab
orat
ory
ID:
0935
8.11
-MIR
05C
hem
ical
: F
loni
cam
i dF
ield
ID
No.
: 09
358.
11-W
I17
Ana
lysi
s fo
r:
Flo
nica
mid
(IK
I-22
0)F
ield
Res
earc
h D
irec
tor:
D
r. S
cott
Cha
pman
Com
mod
ity:
M
int
Ana
lyst
(s):
E
ina
Abo
uzie
d&L
este
r G
eiss
el
Cro
p pa
rt:
Min
t Top
s (l
eave
s&st
ems)
Inst
rum
ent:
U
PL
C/M
S/M
SC
AL
IBR
AT
ION
DA
TA
Dat
e of
cal
ibra
tion
ana
lysi
s:
02-A
ug-1
2R
TSD
BP
eak
----
----
Pag
eID
(or
nam
e)C
onc.
(µg/
mL
)A
rea
WI1
7-23
A30
7G-2
70.
0001
010
219
Typ
e:
Lin
ear
regr
essi
onW
I17-
24A
307G
-26
0.00
0202
038
5E
quat
ion:
y
= m
x+
bW
I17-
25A
307G
-25
0.00
0505
010
28S
lope
, m =
2140
392
WI1
7-26
A30
7G-2
40.
0010
1021
21In
terc
ept,
b =
-19.
72W
I17-
27A
307G
-23
0.00
2020
041
10R
² =
0.99
90W
I17-
28A
307G
-22
0.00
5050
1103
3L
OQ
(µ
g/g)
=0.
02W
I17-
40A
307G
-22
0.00
5050
1059
0W
I17-
41A
307G
-23
0.00
2020
044
15W
I 17-
42A
307G
-24
0.00
1010
2078
WI1
7-43
A30
7G-2
50.
0005
050
1136
WI1
7-44
A30
7G-2
60.
0002
020
433
WI1
7-45
A30
7G-2
70.
0001
010
263
AN
AL
YT
ICA
L D
AT
AE
xtra
ctio
n da
te:
31-J
ul-1
2A
naly
sis
date
:02
-Aug
-12
RT
SD
BS
ampl
eS
ampl
eS
pike
Sam
ple
Spi
keP
eak
Fin
alR
esid
ueS
pike
Pag
eID
Typ
eA
dded
Wei
ght
Con
c.A
rea
Vol
ume
Fou
ndR
ecov
ery
No
*1(µ
g)(g
)(µ
g/g)
*2(c
ount
s)(m
L)
(µg/
g)*3
(%)*
4
CA
LC
UL
AT
ION
PA
GE
Cal
ibra
tion
sta
ndar
d--
----
----
----
--
y =
214
0391
.789
3x -
19.7
170
R² =
0.9
990
0
1000
2000
3000
4000
5000
6000
7000
8000
9000
1000
0
1100
0
1200
0 0.00
00.
001
0.00
20.
003
0.00
40.
005
0.00
6
Peak area
Sta
nd
ard
Con
c. (
µg/
mL
)
No.
1(µ
g)(g
)(µ
g/g)
2(c
ount
s)(m
L)
(µg/
g)3
(%)
4
WI1
7-30
1847
3A-C
-1C
NA
5.00
NA
3720
00.
0010
6N
A
WI1
7-31
1847
3A-C
-1C
NA
5.00
NA
620
00.
0004
81N
A
WI1
7-32
1847
3A-Q
C-0
.02-
1F
0.10
105.
000.
0202
061
320
00.
0118
258
.54
WI1
7-33
1847
3A-Q
C-0
.02-
1F
0.10
105.
000.
0202
062
120
00.
0119
759
.28
WI1
7-34
1847
4A-T
-1T
5.00
5146
1000
0.48
27
WI1
7-35
1847
4A-T
-1T
5.00
5522
1000
0.51
78
WI1
7-36
1847
5A-T
-1T
5.00
5235
1000
0.49
10
WI1
7-37
1847
5A-T
-1T
5.00
5520
1000
0.51
76
NO
TE
S*1
: C=
Con
trol
, F=
Fort
ifie
d, T
=T
reat
ed*2
: Spi
ke a
mou
nt =
(S
pike
add
ed)
÷ (S
ampl
e w
eigh
t)
*3: R
esid
ue a
mou
nt =
[(A
rea
- b)
÷ m
] x
(Fin
al v
ol/S
ampl
e w
t)*4
. Rec
over
y (%
) =
(Res
idue
fou
nd)
÷ (s
pike
con
c) *
100
"NA
" st
ands
for
"N
ot a
pplic
able
"
Attachment B: Calculation Worksheets, Standard Curves and LOD/LOQ Calculations
IR-4 North Central Region Laboratory, Michigan State University Analytical Summary Report PR# 09358
Page 79

PR
OJE
CT
IN
FO
RM
AT
ION
PR
Num
ber:
09
358
Lab
orat
ory
ID:
0935
8.11
-MIR
05C
hem
ical
: F
loni
cam
idF
ield
ID
No.
: 09
358.
11-W
I17
Ana
lysi
s fo
r:
TF
NG
Fie
ld R
esea
rch
Dir
ecto
r:
Dr.
Sco
tt C
hapm
anC
omm
odit
y:
Min
tA
naly
st(s
):
Ein
a A
bouz
ied&
Les
ter
Gei
ssel
Cro
p pa
rt:
Min
t Top
s (l
eave
s&st
ems)
Inst
rum
ent:
U
PL
C/M
S/M
S
CA
LIB
RA
TIO
N D
AT
AD
ate
of c
alib
rati
on a
naly
sis:
02
-Aug
-12
RT
SD
BP
eak
----
----
Pag
eID
(or
nam
e)C
onc.
(µg/
mL
)A
rea
WI1
7-23
A30
7G-2
70.
0000
9550
191
Typ
e:
Lin
ear
regr
essi
onW
I17-
24A
307G
-26
0.00
0191
046
8E
quat
ion:
y
= m
x+
bW
I17-
25A
307G
-25
0.00
0477
510
13S
lope
, m =
2783
246
WI1
7-26
AA
307G
-24
0.00
0955
0021
47In
terc
ept,
b =
-283
.73
WI1
7-27
A30
7G-2
30.
0019
100
4358
R² =
0.99
66W
I17-
28A
307G
-22
0.00
4775
1325
1L
OQ
(µ
g/g)
=0.
02W
I17-
40A
307G
-22
0.00
4775
1313
3W
I17-
41A
307G
-23
0.00
1910
049
58W
I17-
42A
307G
-24
0.00
0955
0021
05W
I17-
43A
307G
-25
0.00
0477
510
94W
I17-
44A
A30
7G-2
60.
0001
910
451
WI1
7-45
AA
307G
-27
0.00
0095
5020
7
AN
AL
YT
ICA
L D
AT
AE
xtra
ctio
n da
te:
31-J
ul-1
2A
naly
sis
date
:02
-Aug
-12
RT
SD
BS
ampl
eS
ampl
eS
pike
Sam
ple
Spi
keP
eak
Fin
alR
esid
ueS
pike
Pag
eID
Typ
eA
dded
Wei
ght
Con
c.A
rea
Vol
ume
Fou
ndR
ecov
ery
CA
LC
UL
AT
ION
PA
GE
Cal
ibra
tion
sta
ndar
d--
----
----
----
--
y =
278
3246
.274
0x -
283.
7336
R² =
0.9
966
-100
00
1000
2000
3000
4000
5000
6000
7000
8000
9000
1000
0
1100
0
1200
0
1300
0
1400
0 0.00
00.
001
0.00
20.
003
0.00
40.
005
0.00
6
Peak area
Sta
ndar
d C
onc.
(µ
g/m
L)
No.
*1(µ
g)(g
)(µ
g/g)
*2(c
ount
s)(m
L)
(µg/
g)*3
(%)*
4W
I17-
3018
473A
-C-1
CN
A5.
00N
A51
420
00.
0115
NA
WI1
7-31
1847
3A-C
-1C
NA
5.00
NA
474
200
0.01
09N
A
WI1
7-32
1847
3A-Q
C-0
.02-
1F
0.09
550
5.00
0.01
910
1243
200
0.02
194
114.
88
WI1
7-33
1847
3A-Q
C-0
.02-
1F
0.09
550
5.00
0.01
910
1259
200
0.02
217
116.
08
WI1
7-34
1847
4A-T
-1T
5.00
2745
1000
0.21
76
WI1
7-35
1847
4A-T
-1T
5.00
2793
1000
0.22
11
WI1
7-36
1847
5A-T
-1T
5.00
2842
1000
0.22
46
WI1
7-37
1847
5A-T
-1T
5.00
2857
1000
0.22
57
NO
TE
S*1
: C=
Con
trol
, F=
Fort
ifie
d, T
=T
reat
ed*2
: Spi
ke a
mou
nt =
(S
pike
add
ed)
÷ (S
ampl
e w
eigh
t)
*3: R
esid
ue a
mou
nt =
[(A
rea
- b)
÷ m
] x
(Fin
al v
ol/S
ampl
e w
t)*4
. Rec
over
y (%
) =
(Res
idue
fou
nd)
÷ (s
pike
con
c) *
100
"NA
" st
ands
for
"N
ot a
pplic
able
"
Attachment B: Calculation Worksheets, Standard Curves and LOD/LOQ Calculations
IR-4 North Central Region Laboratory, Michigan State University Analytical Summary Report PR# 09358
Page 80
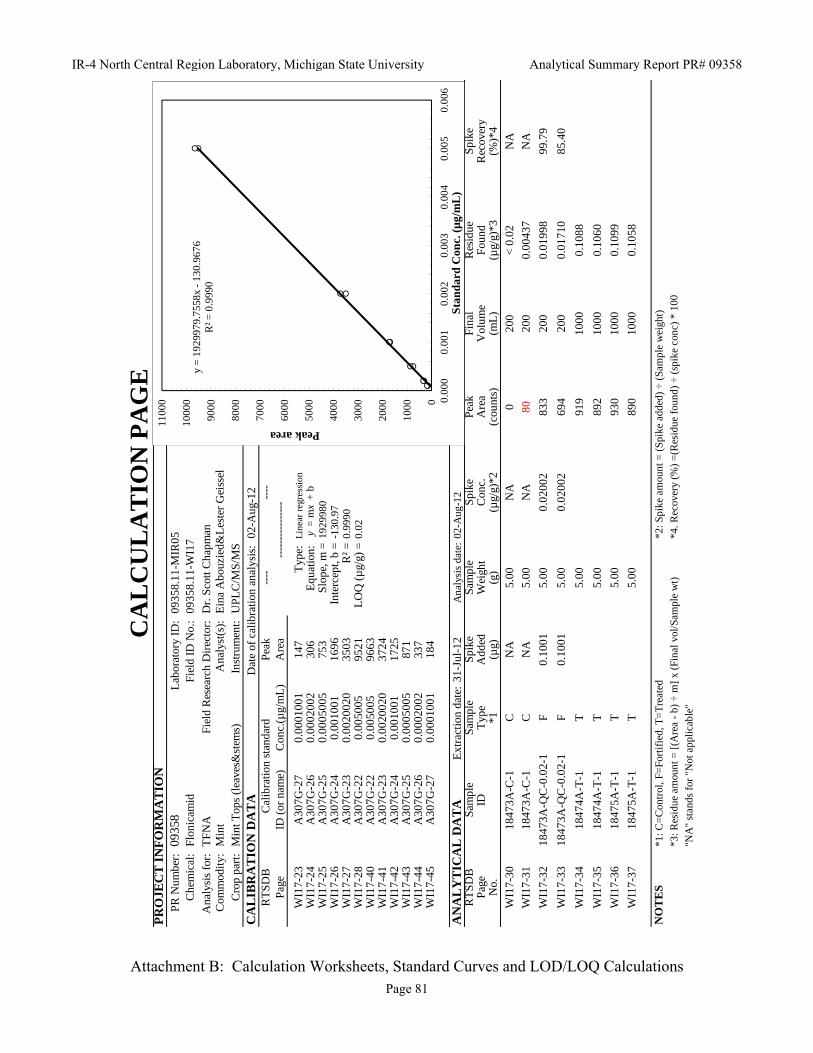
PR
OJE
CT
IN
FO
RM
AT
ION
PR
Num
ber:
09
358
Lab
orat
ory
ID:
0935
8.11
-MIR
05C
hem
ical
: F
loni
cam
idF
ield
ID
No.
: 09
358.
11-W
I17
Ana
lysi
s fo
r:
TF
NA
Fie
ld R
esea
rch
Dir
ecto
r:
Dr.
Sco
tt C
hapm
anC
omm
odity
: M
int
Ana
lyst
(s):
E
ina
Abo
uzie
d&L
este
r G
eiss
elC
rop
part
: M
int T
ops
(lea
ves&
stem
s)In
stru
men
t: U
PL
C/M
S/M
SC
AL
IBR
AT
ION
DA
TA
Dat
e of
cal
ibra
tion
anal
ysis
: 02
-Aug
-12
RT
SD
BP
eak
----
----
Pag
eID
(or
nam
e)C
onc.
(µg/
mL
)A
rea
WI1
7-23
A30
7G-2
70.
0001
001
147
Typ
e:
Lin
ear
regr
essi
onW
I17-
24A
307G
-26
0.00
0200
230
6E
quat
ion:
y
= m
x+
bW
I17-
25A
307G
-25
0.00
0500
575
3S
lope
, m =
1929
980
WI1
7-26
A30
7G-2
40.
0010
0116
96In
terc
ept,
b =
-130
.97
WI1
7-27
A30
7G-2
30.
0020
020
3503
R² =
0.99
90W
I17-
28A
307G
-22
0.00
5005
9521
LO
Q (
µg/
g) =
0.02
WI1
7-40
A30
7G-2
20.
0050
0596
63W
I17-
41A
307G
-23
0.00
2002
037
24W
I17-
42A
307G
-24
0.00
1001
1725
WI 1
7-43
A30
7G-2
50.
0005
005
871
WI1
7-44
A30
7G-2
60.
0002
002
337
WI 1
7-45
A30
7G-2
70.
0001
001
184
AN
AL
YT
ICA
L D
AT
AE
xtra
ctio
n da
te:
31-J
ul-1
2A
naly
sis
date
:02
-Aug
-12
RT
SD
BS
ampl
eS
ampl
eS
pike
Sam
ple
Spi
keP
eak
Fin
alR
esid
ueS
pike
Pag
eID
Typ
eA
dded
Wei
ght
Con
c.A
rea
Vol
ume
Fou
ndR
ecov
ery
No.
*1(µ
g)(g
)(µ
g/g)
*2(c
ount
s)(m
L)
(µg/
g)*3
(%)*
4
CA
LC
UL
AT
ION
PA
GE
Cal
ibra
tion
stan
dard
----
----
----
----
y =
192
9979
.755
8x -
130.
9676
R² =
0.9
990
0
1000
2000
3000
4000
5000
6000
7000
8000
9000
1000
0
1100
0 0.00
00.
001
0.00
20.
003
0.00
40.
005
0.00
6
Peak area
Sta
nd
ard
Con
c. (
µg/
mL
)
WI1
7-30
1847
3A-C
-1C
NA
5.00
NA
020
0<
0.0
2N
A
WI1
7-31
1847
3A-C
-1C
NA
5.00
NA
8020
00.
0043
7N
A
WI1
7-32
1847
3A-Q
C-0
.02-
1F
0.10
015.
000.
0200
283
320
00.
0199
899
.79
WI1
7-33
1847
3A-Q
C-0
.02-
1F
0.10
015.
000.
0200
269
420
00.
0171
085
.40
WI1
7-34
1847
4A-T
-1T
5.00
919
1000
0.10
88
WI1
7-35
1847
4A-T
-1T
5.00
892
1000
0.10
60
WI1
7-36
1847
5A-T
-1T
5.00
930
1000
0.10
99
WI1
7-37
1847
5A-T
-1T
5.00
890
1000
0.10
58
NO
TE
S*1
: C=
Con
trol
, F=
Fort
ifie
d, T
=T
reat
ed*2
: Spi
ke a
mou
nt =
(Sp
ike
adde
d) ÷
(Sa
mpl
e w
eigh
t)
*3: R
esid
ue a
mou
nt =
[(A
rea
- b)
÷ m
] x
(Fin
al v
ol/S
ampl
e w
t)*4
. Rec
over
y (%
) =
(Res
idue
fou
nd)
÷ (
spik
e co
nc)
* 10
0
"NA
" st
ands
for
"N
ot a
pplic
able
"
Attachment B: Calculation Worksheets, Standard Curves and LOD/LOQ Calculations
IR-4 North Central Region Laboratory, Michigan State University Analytical Summary Report PR# 09358
Page 81

PR
OJE
CT
IN
FO
RM
AT
ION
PR
Num
ber:
09
358
Lab
orat
ory
ID:
0935
8.11
-MIR
05C
hem
ical
: F
loni
cam
idF
ield
ID
No.
: 09
358.
11-W
I17
Ana
lysi
s fo
r:
TF
NA
-AM
Fie
ld R
esea
rch
Dir
ecto
r:
Dr.
Sco
tt C
hapm
an
Com
mod
ity:
M
int
Ana
lyst
(s):
E
ina
Abo
uzie
d&L
este
r G
eiss
elC
rop
part
: M
int O
ilIn
stru
men
t:
UP
LC
/MS
/MS
CA
LIB
RA
TIO
N D
AT
AD
ate
of c
alib
rati
on a
naly
sis:
06
-Aug
-12
RT
SD
BP
eak
----
----
Pag
eID
(or
nam
e)C
onc.
(µg/
mL
)A
rea
WI1
7-58
A30
7G-2
70.
0001
012
155
Typ
e:
Lin
ear
regr
essi
onW
I17-
59A
307G
-26
0.00
0202
428
8E
quat
ion:
y
= m
x+
bW
I17-
60A
307G
-25
0.00
0506
069
4S
lope
, m =
1463
949
WI1
7-61
A30
7G-2
40.
0010
1214
44In
terc
ept,
b =
-60.
56W
I17-
62A
307G
-23
0.00
2024
026
25R
² =0.
9946
WI1
7-63
A30
7G-2
20.
0050
6077
30L
OQ
(µ
g/g)
=0.
02W
I17-
74A
307G
-22
0.00
5060
7202
WI1
7-75
A30
7G-2
30.
0020
240
2539
WI1
7-76
AA
307G
-24
0.00
1012
1380
WI1
7-77
A30
7G-2
50.
0005
060
800
WI1
7-78
A30
7G-2
60.
0002
024
329
WI1
7-79
AA
307G
-27
0.00
0101
216
2
AN
AL
YT
ICA
L D
AT
AE
xtra
ctio
n da
te:
06-A
ug-1
2A
naly
sis
date
:06
-Aug
-12
RT
SD
BS
ampl
eS
ampl
eS
pike
Sam
ple
Spi
keP
eak
Fin
alR
esid
ueS
pike
Pag
eID
Typ
eA
dded
Wei
ght
Con
c.A
rea
Vol
ume
Fou
ndR
ecov
ery
CA
LC
UL
AT
ION
PA
GE
Cal
ibra
tion
sta
ndar
d--
----
----
----
--
y =
146
3949
.471
0x -
60.5
581
R² =
0.9
946
0
1000
2000
3000
4000
5000
6000
7000
8000
9000
0.00
00.
001
0.00
20.
003
0.00
40.
005
0.00
6
Peak area
Sta
ndar
d C
onc.
(µ
g/m
L)
gyp
gy
No.
*1(µ
g)(g
)(µ
g/g)
*2(c
ount
s)(m
L)
(µg/
g)*3
(%)*
4W
I17-
6518
476A
-C-1
CN
A2.
50N
A0
100
< 0
.02
NA
WI1
7-66
1847
6A-C
-1C
NA
2.50
NA
010
0<
0.0
2N
A
WI1
7-67
1847
6A-Q
C-0
.02-
1F
0.05
060
2.50
0.02
0253
110
00.
0161
679
.86
WI1
7-68
1847
6A-Q
C-0
.02-
1F
0.05
060
2.50
0.02
0255
510
00.
0168
283
.10
WI1
7-69
1847
6A-Q
C-0
.2-1
F0.
5060
2.50
0.20
2410
8150
00.
1560
77.0
5
WI1
7-70
1847
6A-Q
C-0
.2-1
F0.
5060
2.50
0.20
2411
8050
00.
1695
83.7
4
WI1
7-71
1847
7A-T
-1T
2.50
010
0<
0.0
2
WI1
7-72
1847
7A-T
-1T
2.50
010
0<
0.0
2
NO
TE
S*1
: C=
Con
trol
, F=
Fort
ifie
d, T
=T
reat
ed*2
: Spi
ke a
mou
nt =
(S
pike
add
ed)
÷ (S
ampl
e w
eigh
t)*3
: Res
idue
am
ount
= [
(Are
a -
b) ÷
m]
x (F
inal
vol
/Sam
ple
wt)
*4. R
ecov
ery
(%)
=(R
esid
ue f
ound
) ÷
(spi
ke c
onc)
* 1
00"N
A"
stan
ds f
or "
Not
app
licab
le"
Attachment B: Calculation Worksheets, Standard Curves and LOD/LOQ Calculations
IR-4 North Central Region Laboratory, Michigan State University Analytical Summary Report PR# 09358
Page 82

PR
OJE
CT
IN
FO
RM
AT
ION
PR
Num
ber:
09
358
Lab
orat
ory
ID:
0935
8.11
-MIR
05C
hem
ical
: F
loni
cam
i dF
ield
ID
No.
: 09
358.
11-W
I17
Ana
lysi
s fo
r:
Flo
nica
mid
(IK
I-22
0)F
ield
Res
earc
h D
irec
tor:
D
r. S
cott
Cha
pman
Com
mod
ity:
M
int
Ana
lyst
(s):
E
ina
Abo
uzie
d&L
este
r G
eiss
el
Cro
p pa
rt:
Min
t Oil
Inst
rum
ent:
U
PL
C/M
S/M
SC
AL
IBR
AT
ION
DA
TA
Dat
e of
cal
ibra
tion
ana
lysi
s:
06-A
ug-1
2R
TSD
BP
eak
----
----
Pag
eID
(or
nam
e)C
onc.
(µg/
mL
)A
rea
WI1
7-58
A30
7G-2
70.
0001
010
194
Typ
e:
Lin
ear
regr
essi
onW
I17-
59A
307G
-26
0.00
0202
041
1E
quat
ion:
y
= m
x+
bW
I17-
60A
307G
-25
0.00
0505
011
39S
lope
, m =
2245
192
WI1
7-61
A30
7G-2
40.
0010
1022
97In
terc
ept,
b =
-22.
71W
I17-
62A
307G
-23
0.00
2020
044
53R
² =
0.99
95W
I17-
63A
307G
-22
0.00
5050
1153
0L
OQ
(µ
g/g)
=0.
02W
I17-
74A
307G
-22
0.00
5050
1114
0W
I17-
75A
307G
-23
0.00
2020
044
64W
I17-
76A
307G
-24
0.00
1010
2202
WI1
7-77
A30
7G-2
50.
0005
050
1095
WI 1
7-78
A30
7G-2
60.
0002
020
466
WI1
7-79
A30
7G-2
70.
0001
010
247
AN
AL
YT
ICA
L D
AT
AE
xtra
ctio
n da
te:
06-A
ug-1
2A
naly
sis
date
:06
-Aug
-12
RT
SD
BS
ampl
eS
ampl
eS
pike
Sam
ple
Spi
keP
eak
Fin
alR
esid
ueS
pike
Pag
eID
Typ
eA
dded
Wei
ght
Con
c.A
rea
Vol
ume
Fou
ndR
ecov
ery
No
*1(µ
g)(g
)(µ
g/g)
*2(c
ount
s)(m
L)
(µg/
g)*3
(%)*
4
CA
LC
UL
AT
ION
PA
GE
Cal
ibra
tion
sta
ndar
d--
----
----
----
--
y =
224
5191
.815
1x -
22.7
108
R² =
0.9
995
0
1000
2000
3000
4000
5000
6000
7000
8000
9000
1000
0
1100
0
1200
0
1300
0 0.00
00.
001
0.00
20.
003
0.00
40.
005
0.00
6
Peak area
Sta
nd
ard
Con
c. (
µg/
mL
)
No.
1(µ
g)(g
)(µ
g/g)
2(c
ount
s)(m
L)
(µg/
g)3
(%)
4
WI1
7-65
1847
6A-C
-1C
NA
2.50
NA
810
00.
0005
47N
A
WI1
7-66
1847
6A-C
-1C
NA
2.50
NA
1010
00.
0005
83N
A
WI1
7-67
1847
6A-Q
C-0
.02-
1F
0.05
050
2.50
0.02
0296
610
00.
0176
87.2
0
WI1
7-68
1847
6A-Q
C-0
.02-
1F
0.05
050
2.50
0.02
0210
0310
00.
0183
90.4
6
WI1
7-69
1847
6A-Q
C-0
.2-1
F0.
5050
2.50
0.20
2020
1650
00.
1816
89.9
0
WI1
7-70
1847
6A-Q
C-0
.2-1
F0.
5050
2.50
0.20
2019
9550
00.
1797
88.9
8
WI1
7-71
1847
7A-T
-1T
2.50
2710
00.
0008
86
WI1
7-72
1847
7A-T
-1T
2.50
1610
00.
0006
90
NO
TE
S*1
: C=
Con
trol
, F=
Fort
ifie
d, T
=T
reat
ed*2
: Spi
ke a
mou
nt =
(S
pike
add
ed)
÷ (S
ampl
e w
eigh
t)
*3: R
esid
ue a
mou
nt =
[(A
rea
- b)
÷ m
] x
(Fin
al v
ol/S
ampl
e w
t)*4
. Rec
over
y (%
) =
(Res
idue
fou
nd)
÷ (s
pike
con
c) *
100
"NA
" st
ands
for
"N
ot a
pplic
able
"
Attachment B: Calculation Worksheets, Standard Curves and LOD/LOQ Calculations
IR-4 North Central Region Laboratory, Michigan State University Analytical Summary Report PR# 09358
Page 83

PR
OJE
CT
IN
FO
RM
AT
ION
PR
Num
ber:
09
358
Lab
orat
ory
ID:
0935
8.11
-MIR
05C
hem
ical
: F
loni
cam
idF
ield
ID
No.
: 09
358.
11-W
I17
Ana
lysi
s fo
r:
TF
NG
Fie
ld R
esea
rch
Dir
ecto
r:
Dr.
Sco
tt C
hapm
anC
omm
odit
y:
Min
tA
naly
st(s
):
Ein
a A
bouz
ied&
Les
ter
Gei
ssel
Cro
p pa
rt:
Min
t Oil
Inst
rum
ent:
U
PL
C/M
S/M
S
CA
LIB
RA
TIO
N D
AT
AD
ate
of c
alib
rati
on a
naly
sis:
06
-Aug
-12
RT
SD
BP
eak
----
----
Pag
eID
(or
nam
e)C
onc.
(µg/
mL
)A
rea
WI1
7-58
A30
7G-2
70.
0000
9550
198
Typ
e:
Lin
ear
regr
essi
onW
I17-
59A
307G
-26
0.00
0191
045
1E
quat
ion:
y
= m
x+
bW
I17-
60A
307G
-25
0.00
0477
512
53S
lope
, m =
2674
042
WI1
7-61
A30
7G-2
40.
0009
5500
2679
Inte
rcep
t, b
=-6
2.53
WI1
7-62
A30
7G-2
30.
0019
100
4746
R² =
0.99
91W
I17-
63A
307G
-22
0.00
4775
1286
5L
OQ
(µ
g/g)
=0.
02W
I17-
74A
307G
-22
0.00
4775
1262
1W
I17-
75A
307G
-23
0.00
1910
051
34W
I17-
76A
307G
-24
0.00
0955
0023
45W
I17-
77A
A30
7G-2
50.
0004
775
1172
WI1
7-78
A30
7G-2
60.
0001
910
448
WI1
7-79
A30
7G-2
70.
0000
9550
283
AN
AL
YT
ICA
L D
AT
AE
xtra
ctio
n da
te:
06-A
ug-1
2A
naly
sis
date
:06
-Aug
-12
RT
SD
BS
ampl
eS
ampl
eS
pike
Sam
ple
Spi
keP
eak
Fin
alR
esid
ueS
pike
Pag
eID
Typ
eA
dded
Wei
ght
Con
c.A
rea
Vol
ume
Fou
ndR
ecov
ery
CA
LC
UL
AT
ION
PA
GE
Cal
ibra
tion
sta
ndar
d--
----
----
----
--
y =
267
4042
.129
6x -
62.5
250
R² =
0.9
991
0
1000
2000
3000
4000
5000
6000
7000
8000
9000
1000
0
1100
0
1200
0
1300
0
1400
0 0.00
00.
001
0.00
20.
003
0.00
40.
005
0.00
6
Peak area
Sta
ndar
d C
onc.
(µ
g/m
L)
No.
*1(µ
g)(g
)(µ
g/g)
*2(c
ount
s)(m
L)
(µg/
g)*3
(%)*
4W
I17-
6518
476A
-C-1
CN
A2.
50N
A11
100
0.00
1100
NA
WI1
7-66
1847
6A-C
-1C
NA
2.50
NA
1310
00.
0011
30N
A
WI1
7-67
1847
6A-Q
C-0
.02-
1F
0.04
775
2.50
0.01
9194
610
00.
0151
78.9
9
WI1
7-68
1847
6A-Q
C-0
.02-
1F
0.04
775
2.50
0.01
9194
110
00.
0150
78.5
9
WI1
7-69
1847
6A-Q
C-0
.2-1
F0.
4775
2.50
0.19
1022
1650
00.
1704
89.2
2
WI1
7-70
1847
6A-Q
C-0
.2-1
F0.
4775
2.50
0.19
1022
1550
00.
1703
89.1
8
WI1
7-71
1847
7A-T
-1T
2.50
7010
00.
0019
82
WI1
7-72
1847
7A-T
-1T
2.50
7610
00.
0020
72
NO
TE
S*1
: C=
Con
trol
, F=
Fort
ifie
d, T
=T
reat
ed*2
: Spi
ke a
mou
nt =
(S
pike
add
ed)
÷ (S
ampl
e w
eigh
t)
*3: R
esid
ue a
mou
nt =
[(A
rea
- b)
÷ m
] x
(Fin
al v
ol/S
ampl
e w
t)*4
. Rec
over
y (%
) =
(Res
idue
fou
nd)
÷ (s
pike
con
c) *
100
"NA
" st
ands
for
"N
ot a
pplic
able
"
Attachment B: Calculation Worksheets, Standard Curves and LOD/LOQ Calculations
IR-4 North Central Region Laboratory, Michigan State University Analytical Summary Report PR# 09358
Page 84

PR
OJE
CT
IN
FO
RM
AT
ION
PR
Num
ber:
09
358
Lab
orat
ory
ID:
0935
8.11
-MIR
05C
hem
ical
: F
loni
cam
idF
ield
ID
No.
: 09
358.
11-W
I17
Ana
lysi
s fo
r:
TF
NA
Fie
ld R
esea
rch
Dir
ecto
r:
Dr.
Sco
tt C
hapm
anC
omm
odity
: M
int
Ana
lyst
(s):
E
ina
Abo
uzie
d&L
este
r G
eiss
elC
rop
part
: M
int O
ilIn
stru
men
t: U
PL
C/M
S/M
SC
AL
IBR
AT
ION
DA
TA
Dat
e of
cal
ibra
tion
anal
ysis
: 06
-Aug
-12
RT
SD
BP
eak
----
----
Pag
eID
(or
nam
e)C
onc.
(µg/
mL
)A
rea
WI1
7-58
A30
7G-2
70.
0001
001
218
Typ
e:
Lin
ear
regr
essi
onW
I17-
59A
307G
-26
0.00
0200
233
1E
quat
ion:
y
= m
x+
bW
I17-
60A
307G
-25
0.00
0500
591
5S
lope
, m =
2034
193
WI1
7-61
A30
7G-2
40.
0010
0119
50In
terc
ept,
b =
-97.
05W
I17-
62A
307G
-23
0.00
2002
037
91R
² =0.
9994
WI1
7-63
A30
7G-2
20.
0050
0510
191
LO
Q (
µg/
g) =
0.02
WI1
7-74
A30
7G-2
20.
0050
0510
079
WI1
7-75
A30
7G-2
30.
0020
020
3955
WI 1
7-76
A30
7G-2
40.
0010
0118
06W
I17-
77A
307G
-25
0.00
0500
591
0W
I17-
78A
307G
-26
0.00
0200
236
1W
I17-
79A
307G
-27
0.00
0100
116
6
AN
AL
YT
ICA
L D
AT
AE
xtra
ctio
n da
te:
06-A
ug-1
2A
naly
sis
date
:06
-Aug
-12
RT
SD
BS
ampl
eS
ampl
eS
pike
Sam
ple
Spi
keP
eak
Fin
alR
esid
ueS
pike
Pag
eID
Typ
eA
dded
Wei
ght
Con
c.A
rea
Vol
ume
Fou
ndR
ecov
ery
No.
*1(µ
g)(g
)(µ
g/g)
*2(c
ount
s)(m
L)
(µg/
g)*3
(%)*
4
CA
LC
UL
AT
ION
PA
GE
Cal
ibra
tion
stan
dard
----
----
----
----
y =
203
4193
.288
5x -
97.0
503
R² =
0.9
994
0
1000
2000
3000
4000
5000
6000
7000
8000
9000
1000
0
1100
0 0.00
00.
001
0.00
20.
003
0.00
40.
005
0.00
6
Peak area
Sta
nd
ard
Con
c. (
µg/
mL
)
WI1
7-65
1847
6A-C
-1C
NA
2.50
NA
010
0<
0.0
2N
A
WI1
7-66
1847
6A-C
-1C
NA
2.50
NA
010
0<
0.0
2N
A
WI1
7-67
1847
6A-Q
C-0
.02-
1F
0.05
010
2.50
0.02
004
798
100
0.01
760
87.8
2
WI1
7-68
1847
6A-Q
C-0
.02-
1F
0.05
010
2.50
0.02
004
763
100
0.01
691
84.3
9
WI1
7-69
1847
6A-Q
C-0
.2-1
F0.
5010
2.50
0.20
0418
0150
00.
1866
93.1
2
WI1
7-70
1847
6A-Q
C-0
.2-1
F0.
5010
2.50
0.20
0416
6950
00.
1736
86.6
4
WI1
7-71
1847
7A-T
-1T
2.50
2410
00.
0023
80
WI1
7-72
1847
7A-T
-1T
2.50
010
0<
0.0
2
NO
TE
S*1
: C=
Con
trol
, F=
Fort
ifie
d, T
=T
reat
ed*2
: Spi
ke a
mou
nt =
(Sp
ike
adde
d) ÷
(Sa
mpl
e w
eigh
t)
*3: R
esid
ue a
mou
nt =
[(A
rea
- b)
÷ m
] x
(Fin
al v
ol/S
ampl
e w
t)*4
. Rec
over
y (%
) =
(Res
idue
fou
nd)
÷ (
spik
e co
nc)
* 10
0
"NA
" st
ands
for
"N
ot a
pplic
able
"
Attachment B: Calculation Worksheets, Standard Curves and LOD/LOQ Calculations
IR-4 North Central Region Laboratory, Michigan State University Analytical Summary Report PR# 09358
Page 85

PR
OJE
CT
IN
FO
RM
AT
ION
PR
Num
ber:
09
358
Lab
orat
ory
ID:
0935
8.11
-MIR
05C
hem
ical
: F
loni
cam
idF
ield
ID
No.
: 09
358.
11-W
I18
Ana
lysi
s fo
r:
TF
NA
-AM
Fie
ld R
esea
rch
Dir
ecto
r:
Dr.
Sco
tt C
hapm
an
Com
mod
ity:
M
int
Ana
lyst
(s):
E
ina
Abo
uzie
d&L
este
r G
eiss
elC
rop
part
: M
int T
ops
(lea
ves&
stem
s)In
stru
men
t:
UP
LC
/MS
/MS
CA
LIB
RA
TIO
N D
AT
AD
ate
of c
alib
rati
on a
naly
sis:
03
-Aug
-12
RT
SD
BP
eak
----
----
Pag
eID
(or
nam
e)C
onc.
(µg/
mL
)A
rea
WI1
8-21
A30
7G-2
70.
0001
012
189
Typ
e:
Lin
ear
regr
essi
onW
I18-
22A
307G
-26
0.00
0202
430
2E
quat
ion:
y
= m
x+
bW
I18-
23A
307G
-25
0.00
0506
078
2S
lope
, m =
1569
605
WI1
8-24
A30
7G-2
40.
0010
1214
19In
terc
ept,
b =
-101
.13
WI1
8-25
A30
7G-2
30.
0020
240
2397
R² =
0.98
77W
I18-
26A
307G
-22
0.00
5060
8492
LO
Q (
µg/
g) =
0.02
WI1
8-38
A30
7G-2
20.
0050
6075
23W
I18-
39A
307G
-23
0.00
2024
029
26W
I18-
40A
307G
-24
0.00
1012
1394
WI1
8-41
A30
7G-2
50.
0005
060
771
WI1
8-42
A30
7G-2
60.
0002
024
350
WI1
8-43
A30
7G-2
70.
0001
012
198
AN
AL
YT
ICA
L D
AT
AE
xtra
ctio
n da
te:
03-A
ug-1
2A
naly
sis
date
:03
-Aug
-12
RT
SD
BS
ampl
eS
ampl
eS
pike
Sam
ple
Spi
keP
eak
Fin
alR
esid
ueS
pike
Pag
eID
Typ
eA
dded
Wei
ght
Con
c.A
rea
Vol
ume
Fou
ndR
ecov
ery
CA
LC
UL
AT
ION
PA
GE
Cal
ibra
tion
sta
ndar
d--
----
----
----
--
y =
156
9604
.758
2x -
101.
1287
R² =
0.9
877
0
1000
2000
3000
4000
5000
6000
7000
8000
9000
0.00
00.
001
0.00
20.
003
0.00
40.
005
0.00
6
Peak area
Sta
ndar
d C
onc.
(µ
g/m
L)
gyp
gy
No.
*1(µ
g)(g
)(µ
g/g)
*2(c
ount
s)(m
L)
(µg/
g)*3
(%)*
4W
I18-
2818
479A
-C-1
CN
A5.
00N
A0
200
< 0
.02
NA
WI1
8-29
1847
9A-C
-1C
NA
5.00
NA
020
0<
0.0
2N
A
WI1
8-30
1847
9A-Q
C-3
-1F
15.1
85.
003.
036
5640
3333
2.43
880
.31
WI1
8-31
1847
9A-Q
C-3
-1F
15.1
85.
003.
036
5665
3333
2.44
980
.66
WI1
8-32
1848
0A-T
-1T
5.00
537
2000
0.16
26
WI1
8-33
1848
0A-T
-1T
5.00
570
2000
0.17
10
WI1
8-34
1848
1A-T
-1T
5.00
554
2000
0.16
70
WI1
8-35
1848
1A-T
-1T
5.00
528
2000
0.16
03
NO
TE
S*1
: C=
Con
trol
, F=
Fort
ifie
d, T
=T
reat
ed*2
: Spi
ke a
mou
nt =
(S
pike
add
ed)
÷ (S
ampl
e w
eigh
t)*3
: Res
idue
am
ount
= [
(Are
a -
b) ÷
m]
x (F
inal
vol
/Sam
ple
wt)
*4. R
ecov
ery
(%)
=(R
esid
ue f
ound
) ÷
(spi
ke c
onc)
* 1
00"N
A"
stan
ds f
or "
Not
app
licab
le"
Attachment B: Calculation Worksheets, Standard Curves and LOD/LOQ Calculations
IR-4 North Central Region Laboratory, Michigan State University Analytical Summary Report PR# 09358
Page 86

PR
OJE
CT
IN
FO
RM
AT
ION
PR
Num
ber:
09
358
Lab
orat
ory
ID:
0935
8.11
-MIR
05C
hem
ical
: F
loni
cam
i dF
ield
ID
No.
: 09
358.
11-W
I18
Ana
lysi
s fo
r:
Flo
nica
mid
(IK
I-22
0)F
ield
Res
earc
h D
irec
tor:
D
r. S
cott
Cha
pman
Com
mod
ity:
M
int
Ana
lyst
(s):
E
ina
Abo
uzie
d&L
este
r G
eiss
el
Cro
p pa
rt:
Min
t Top
s (l
eave
s&st
ems)
Inst
rum
ent:
U
PL
C/M
S/M
SC
AL
IBR
AT
ION
DA
TA
Dat
e of
cal
ibra
tion
ana
lysi
s:
03-A
ug-1
2R
TSD
BP
eak
----
----
Pag
eID
(or
nam
e)C
onc.
(µg/
mL
)A
rea
WI1
8-21
A30
7G-2
70.
0001
010
199
Typ
e:
Lin
ear
regr
essi
onW
I18-
22A
307G
-26
0.00
0202
045
2E
quat
ion:
y
= m
x+
bW
I18-
23A
307G
-25
0.00
0505
010
93S
lope
, m =
2250
347
WI1
8-24
A30
7G-2
40.
0010
1022
38In
terc
ept,
b =
-26.
01W
I18-
25A
307G
-23
0.00
2020
044
34R
² =
0.99
94W
I18-
26A
307G
-22
0.00
5050
1157
5L
OQ
(µ
g/g)
=0.
02W
I18-
38A
307G
-22
0.00
5050
1113
7W
I 18-
39A
307G
-23
0.00
2020
045
39W
I18-
40A
307G
-24
0.00
1010
2179
WI1
8-41
A30
7G-2
50.
0005
050
1168
WI1
8-42
A30
7G-2
60.
0002
020
455
WI 1
8-43
A30
7G-2
70.
0001
010
221
AN
AL
YT
ICA
L D
AT
AE
xtra
ctio
n da
te:
03-A
ug-1
2A
naly
sis
date
:03
-Aug
-12
RT
SD
BS
ampl
eS
ampl
eS
pike
Sam
ple
Spi
keP
eak
Fin
alR
esid
ueS
pike
Pag
eID
Typ
eA
dded
Wei
ght
Con
c.A
rea
Vol
ume
Fou
ndR
ecov
ery
No
*1(µ
g)(g
)(µ
g/g)
*2(c
ount
s)(m
L)
(µg/
g)*3
(%)*
4
CA
LC
UL
AT
ION
PA
GE
Cal
ibra
tion
sta
ndar
d--
----
----
----
--
y =
225
0347
.236
7x -
26.0
144
R² =
0.9
994
0
1000
2000
3000
4000
5000
6000
7000
8000
9000
1000
0
1100
0
1200
0
1300
0 0.00
00.
001
0.00
20.
003
0.00
40.
005
0.00
6
Peak area
Sta
nd
ard
Con
c. (
µg/
mL
)
No.
1(µ
g)(g
)(µ
g/g)
2(c
ount
s)(m
L)
(µg/
g)3
(%)
4
WI1
8-28
1847
9A-C
-1C
NA
5.00
NA
020
0<
0.0
2N
A
WI1
8-29
1847
9A-C
-1C
NA
5.00
NA
6620
00.
0016
4N
A
WI1
8-30
1847
9A-Q
C-3
-1F
15.1
505.
003.
0300
8075
3333
2.40
079
.20
WI1
8-31
1847
9A-Q
C-3
-1F
15.1
505.
003.
0300
8222
3333
2.44
380
.63
WI1
8-32
1848
0A-T
-1T
5.00
1075
220
001.
916
WI1
8-33
1848
0A-T
-1T
5.00
1057
020
001.
883
WI1
8-34
1848
1A-T
-1T
5.00
1091
820
001.
945
WI1
8-35
1848
1A-T
-1T
5.00
1076
220
001.
918
NO
TE
S*1
: C=
Con
trol
, F=
Fort
ifie
d, T
=T
reat
ed*2
: Spi
ke a
mou
nt =
(S
pike
add
ed)
÷ (S
ampl
e w
eigh
t)
*3: R
esid
ue a
mou
nt =
[(A
rea
- b)
÷ m
] x
(Fin
al v
ol/S
ampl
e w
t)*4
. Rec
over
y (%
) =
(Res
idue
fou
nd)
÷ (s
pike
con
c) *
100
"NA
" st
ands
for
"N
ot a
pplic
able
"
Attachment B: Calculation Worksheets, Standard Curves and LOD/LOQ Calculations
IR-4 North Central Region Laboratory, Michigan State University Analytical Summary Report PR# 09358
Page 87

PR
OJE
CT
IN
FO
RM
AT
ION
PR
Num
ber:
09
358
Lab
orat
ory
ID:
0935
8.11
-MIR
05C
hem
ical
: F
loni
cam
idF
ield
ID
No.
: 09
358.
11-W
I18
Ana
lysi
s fo
r:
TF
NG
Fie
ld R
esea
rch
Dir
ecto
r:
Dr.
Sco
tt C
hapm
anC
omm
odit
y:
Min
tA
naly
st(s
):
Ein
a A
bouz
ied&
Les
ter
Gei
ssel
Cro
p pa
rt:
Min
t Top
s (l
eave
s&st
ems)
Inst
rum
ent:
U
PL
C/M
S/M
S
CA
LIB
RA
TIO
N D
AT
AD
ate
of c
alib
rati
on a
naly
sis:
03
-Aug
-12
RT
SD
BP
eak
----
----
Pag
eID
(or
nam
e)C
onc.
(µg/
mL
)A
rea
WI1
8-21
A30
7G-2
70.
0000
9550
210
Typ
e:
Lin
ear
regr
essi
onW
I18-
22A
307G
-26
0.00
0191
047
3E
quat
ion:
y
= m
x+
bW
I18-
23A
307G
-25
0.00
0477
511
43S
lope
, m =
2783
356
WI1
8-24
A30
7G-2
40.
0009
5500
2463
Inte
rcep
t, b
=-6
7.30
WI1
8-25
A30
7G-2
30.
0019
100
5338
R² =
0.99
81W
I18-
26A
307G
-22
0.00
4775
1358
7L
OQ
(µ
g/g)
=0.
02W
I18-
38A
307G
-22
0.00
4775
1284
9W
I18-
39A
307G
-23
0.00
1910
053
96W
I18-
40A
307G
-24
0.00
0955
0023
58W
I18-
41A
307G
-25
0.00
0477
511
72W
I18-
42A
307G
-26
0.00
0191
055
9W
I18-
43A
307G
-27
0.00
0095
5042
7
AN
AL
YT
ICA
L D
AT
AE
xtra
ctio
n da
te:
03-A
ug-1
2A
naly
sis
date
:03
-Aug
-12
RT
SD
BS
ampl
eS
ampl
eS
pike
Sam
ple
Spi
keP
eak
Fin
alR
esid
ueS
pike
Pag
eID
Typ
eA
dded
Wei
ght
Con
c.A
rea
Vol
ume
Fou
ndR
ecov
ery
CA
LC
UL
AT
ION
PA
GE
Cal
ibra
tion
sta
ndar
d--
----
----
----
--
y =
278
3355
.641
7x -
67.3
035
R² =
0.9
981
0
1000
2000
3000
4000
5000
6000
7000
8000
9000
1000
0
1100
0
1200
0
1300
0
1400
0
1500
0 0.00
00.
001
0.00
20.
003
0.00
40.
005
0.00
6
Peak area
Sta
ndar
d C
onc.
(µ
g/m
L)
No.
*1(µ
g)(g
)(µ
g/g)
*2(c
ount
s)(m
L)
(µg/
g)*3
(%)*
4W
I18-
2818
479A
-C-1
CN
A5.
00N
A34
220
00.
0058
8N
AW
I18-
2918
479A
-C-1
CN
A5.
00N
A30
420
00.
0053
4N
A
WI1
8-30
1847
9A-Q
C-3
-1F
14.3
250
5.00
2.86
5010
777
3333
2.59
790
.65
WI1
8-31
1847
9A-Q
C-3
-1F
14.3
250
5.00
2.86
5011
365
3333
2.73
895
.57
WI1
8-32
1848
0A-T
-1T
5.00
2505
2000
0.36
97
WI1
8-33
1848
0A-T
-1T
5.00
2461
2000
0.36
33
WI1
8-34
1848
1A-T
-1T
5.00
2451
2000
0.36
19
WI1
8-35
1848
1A-T
-1T
5.00
2369
2000
0.35
01
NO
TE
S*1
: C=
Con
trol
, F=
Fort
ifie
d, T
=T
reat
ed*2
: Spi
ke a
mou
nt =
(S
pike
add
ed)
÷ (S
ampl
e w
eigh
t)
*3: R
esid
ue a
mou
nt =
[(A
rea
- b)
÷ m
] x
(Fin
al v
ol/S
ampl
e w
t)*4
. Rec
over
y (%
) =
(Res
idue
fou
nd)
÷ (s
pike
con
c) *
100
"NA
" st
ands
for
"N
ot a
pplic
able
"
Attachment B: Calculation Worksheets, Standard Curves and LOD/LOQ Calculations
IR-4 North Central Region Laboratory, Michigan State University Analytical Summary Report PR# 09358
Page 88

PR
OJE
CT
IN
FO
RM
AT
ION
PR
Num
ber:
09
358
Lab
orat
ory
ID:
0935
8.11
-MIR
05C
hem
ical
: F
loni
cam
idF
ield
ID
No.
: 09
358.
11-W
I18
Ana
lysi
s fo
r:
TF
NA
Fie
ld R
esea
rch
Dir
ecto
r:
Dr.
Sco
tt C
hapm
anC
omm
odity
: M
int
Ana
lyst
(s):
E
ina
Abo
uzie
d&L
este
r G
eiss
elC
rop
part
: M
int T
ops
(lea
ves&
stem
s)In
stru
men
t: U
PL
C/M
S/M
SC
AL
IBR
AT
ION
DA
TA
Dat
e of
cal
ibra
tion
anal
ysis
: 03
-Aug
-12
RT
SD
BP
eak
----
----
Pag
eID
(or
nam
e)C
onc.
(µg/
mL
)A
rea
WI1
8-21
A30
7G-2
70.
0001
001
208
Typ
e:
Lin
ear
regr
essi
onW
I18-
22A
307G
-26
0.00
0200
238
2E
quat
ion:
y
= m
x+
bW
I18-
23A
307G
-25
0.00
0500
596
8S
lope
, m =
2109
781
WI1
8-24
A30
7G-2
40.
0010
0118
63In
terc
ept,
b =
-110
.86
WI1
8-25
A30
7G-2
30.
0020
020
4008
R² =
0.99
86W
I18-
26A
307G
-22
0.00
5005
1073
4L
OQ
(µ
g/g)
=0.
02W
I18-
38A
307G
-22
0.00
5005
1027
8W
I18-
39A
307G
-23
0.00
2002
040
71W
I18-
40A
307G
-24
0.00
1001
1780
WI1
8-41
A30
7G-2
50.
0005
005
996
WI1
8-42
A30
7G-2
60.
0002
002
342
WI1
8-43
A30
7G-2
70.
0001
001
209
AN
AL
YT
ICA
L D
AT
AE
xtra
ctio
n da
te:
03-A
ug-1
2A
naly
sis
date
:03
-Aug
-12
RT
SD
BS
ampl
eS
ampl
eS
pike
Sam
ple
Spi
keP
eak
Fin
alR
esid
ueS
pike
Pag
eID
Typ
eA
dded
Wei
ght
Con
c.A
rea
Vol
ume
Fou
ndR
ecov
ery
No.
*1(µ
g)(g
)(µ
g/g)
*2(c
ount
s)(m
L)
(µg/
g)*3
(%)*
4
CA
LC
UL
AT
ION
PA
GE
Cal
ibra
tion
stan
dard
----
----
----
----
y =
210
9780
.790
3x -
110.
8562
R² =
0.9
986
0
1000
2000
3000
4000
5000
6000
7000
8000
9000
1000
0
1100
0
1200
0 0.00
00.
001
0.00
20.
003
0.00
40.
005
0.00
6
Peak area
Sta
nd
ard
Con
c. (
µg/
mL
)
WI1
8-28
1847
9A-C
-1C
NA
5.00
NA
115
200
0.00
428
NA
WI1
8-29
1847
9A-C
-1C
NA
5.00
NA
110
200
0.00
419
NA
WI1
8-30
1847
9A-Q
C-3
-1F
15.0
155.
003.
003
9102
3333
2.91
0996
.93
WI1
8-31
1847
9A-Q
C-3
-1F
15.0
155.
003.
003
9246
3333
2.95
6498
.45
WI1
8-32
1848
0A-T
-1T
5.00
1026
2000
0.21
554
WI1
8-33
1848
0A-T
-1T
5.00
981
2000
0.20
701
WI1
8-34
1848
1A-T
-1T
5.00
1002
2000
0.21
099
WI1
8-35
1848
1A-T
-1T
5.00
929
2000
0.19
715
NO
TE
S*1
: C=
Con
trol
, F=
Fort
ifie
d, T
=T
reat
ed*2
: Spi
ke a
mou
nt =
(Sp
ike
adde
d) ÷
(Sa
mpl
e w
eigh
t)
*3: R
esid
ue a
mou
nt =
[(A
rea
- b)
÷ m
] x
(Fin
al v
ol/S
ampl
e w
t)*4
. Rec
over
y (%
) =
(Res
idue
fou
nd)
÷ (
spik
e co
nc)
* 10
0
"NA
" st
ands
for
"N
ot a
pplic
able
"
Attachment B: Calculation Worksheets, Standard Curves and LOD/LOQ Calculations
IR-4 North Central Region Laboratory, Michigan State University Analytical Summary Report PR# 09358
Page 89
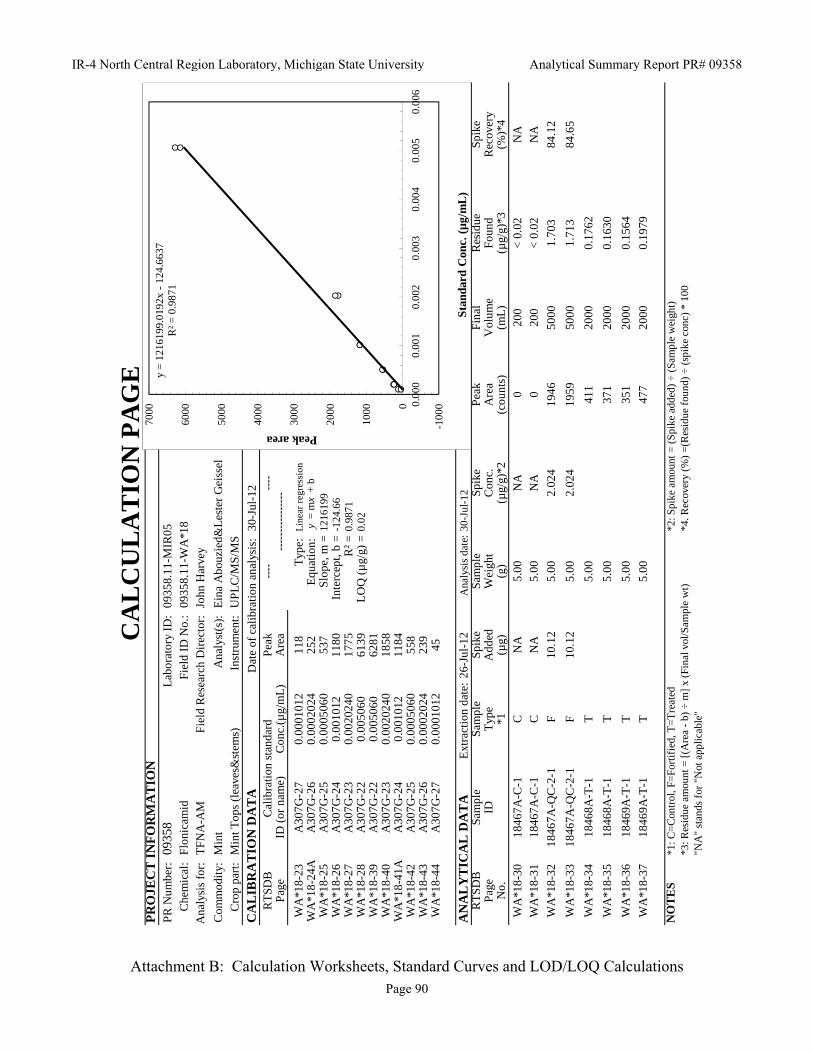
PR
OJE
CT
IN
FO
RM
AT
ION
PR
Num
ber:
09
358
Lab
orat
ory
ID:
0935
8.11
-MIR
05C
hem
ical
: F
loni
cam
idF
ield
ID
No.
: 09
358.
11-W
A*1
8A
naly
sis
for:
T
FN
A-A
MF
ield
Res
earc
h D
irec
tor:
Jo
hn H
arve
y
Com
mod
ity:
M
int
Ana
lyst
(s):
E
ina
Abo
uzie
d&L
este
r G
eiss
elC
rop
part
: M
int T
ops
(lea
ves&
stem
s)In
stru
men
t:
UP
LC
/MS
/MS
CA
LIB
RA
TIO
N D
AT
AD
ate
of c
alib
rati
on a
naly
sis:
30
-Jul
-12
RT
SD
BP
eak
----
----
Pag
eID
(or
nam
e)C
onc.
(µg/
mL
)A
rea
WA
*18-
23A
307G
-27
0.00
0101
211
8T
ype:
L
inea
r re
gres
sion
WA
*18-
24A
A30
7G-2
60.
0002
024
252
Equ
atio
n:
y=
mx
+ b
WA
*18-
25A
307G
-25
0.00
0506
053
7S
lope
, m =
1216
199
WA
*18-
26A
307G
-24
0.00
1012
1180
Inte
rcep
t, b
=-1
24.6
6W
A*1
8-27
A30
7G-2
30.
0020
240
1775
R² =
0.98
71W
A*1
8-28
A30
7G-2
20.
0050
6061
39L
OQ
(µ
g/g)
=0.
02W
A*1
8-39
A30
7G-2
20.
0050
6062
81W
A*1
8-40
A30
7G-2
30.
0020
240
1858
WA
*18-
41A
A30
7G-2
40.
0010
1211
84W
A*1
8-42
A30
7G-2
50.
0005
060
558
WA
*18-
43A
307G
-26
0.00
0202
423
9W
A*1
8-44
A30
7G-2
70.
0001
012
45
AN
AL
YT
ICA
L D
AT
AE
xtra
ctio
n da
te:
26-J
ul-1
2A
naly
sis
date
:30
-Jul
-12
RT
SD
BS
ampl
eS
ampl
eS
pike
Sam
ple
Spi
keP
eak
Fin
alR
esid
ueS
pike
Pag
eID
Typ
eA
dded
Wei
ght
Con
c.A
rea
Vol
ume
Fou
ndR
ecov
ery
CA
LC
UL
AT
ION
PA
GE
Cal
ibra
tion
sta
ndar
d--
----
----
----
--
y =
121
6199
.019
2x -
124.
6637
R² =
0.9
871
-100
00
1000
2000
3000
4000
5000
6000
7000
0.00
00.
001
0.00
20.
003
0.00
40.
005
0.00
6
Peak area
Sta
ndar
d C
onc.
(µ
g/m
L)
gyp
gy
No.
*1(µ
g)(g
)(µ
g/g)
*2(c
ount
s)(m
L)
(µg/
g)*3
(%)*
4W
A*1
8-30
1846
7A-C
-1C
NA
5.00
NA
020
0<
0.0
2N
AW
A*1
8-31
1846
7A-C
-1C
NA
5.00
NA
020
0<
0.0
2N
A
WA
*18-
3218
467A
-QC
-2-1
F10
.12
5.00
2.02
419
4650
001.
703
84.1
2
WA
*18-
3318
467A
-QC
-2-1
F10
.12
5.00
2.02
419
5950
001.
713
84.6
5
WA
*18-
3418
468A
-T-1
T5.
0041
120
000.
1762
WA
*18-
3518
468A
-T-1
T5.
0037
120
000.
1630
WA
*18-
3618
469A
-T-1
T5.
0035
120
000.
1564
WA
*18-
3718
469A
-T-1
T5.
0047
720
000.
1979
NO
TE
S*1
: C=
Con
trol
, F=
Fort
ifie
d, T
=T
reat
ed*2
: Spi
ke a
mou
nt =
(S
pike
add
ed)
÷ (S
ampl
e w
eigh
t)*3
: Res
idue
am
ount
= [
(Are
a -
b) ÷
m]
x (F
inal
vol
/Sam
ple
wt)
*4. R
ecov
ery
(%)
=(R
esid
ue f
ound
) ÷
(spi
ke c
onc)
* 1
00"N
A"
stan
ds f
or "
Not
app
licab
le"
Attachment B: Calculation Worksheets, Standard Curves and LOD/LOQ Calculations
IR-4 North Central Region Laboratory, Michigan State University Analytical Summary Report PR# 09358
Page 90
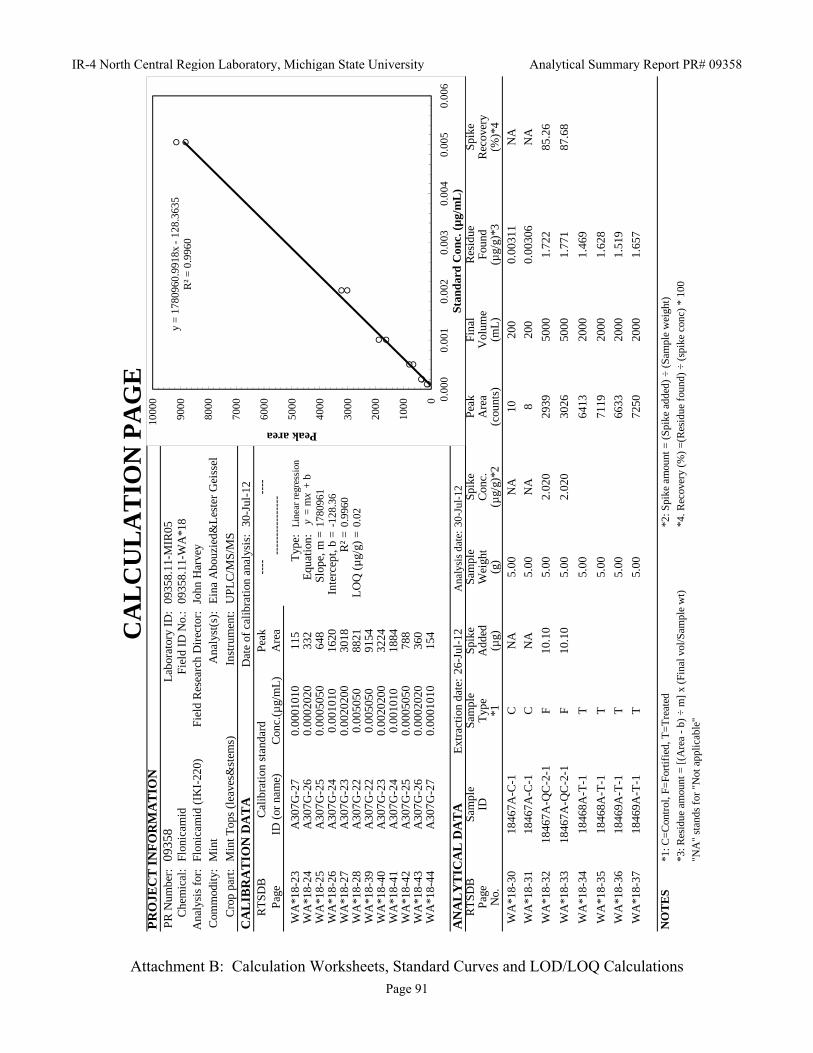
PR
OJE
CT
IN
FO
RM
AT
ION
PR
Num
ber:
09
358
Lab
orat
ory
ID:
0935
8.11
-MIR
05C
hem
ical
: F
loni
cam
i dF
ield
ID
No.
: 09
358.
11-W
A*1
8A
naly
sis
for:
F
loni
cam
id (
IKI-
220)
Fie
ld R
esea
rch
Dir
ecto
r:
John
Har
vey
Com
mod
ity:
M
int
Ana
lyst
(s):
E
ina
Abo
uzie
d&L
este
r G
eiss
el
Cro
p pa
rt:
Min
t Top
s (l
eave
s&st
ems)
Inst
rum
ent:
U
PL
C/M
S/M
SC
AL
IBR
AT
ION
DA
TA
Dat
e of
cal
ibra
tion
ana
lysi
s:
30-J
ul-1
2R
TSD
BP
eak
----
----
Pag
eID
(or
nam
e)C
onc.
(µg/
mL
)A
rea
WA
*18-
23A
307G
-27
0.00
0101
011
5T
ype:
L
inea
r re
gres
sion
WA
*18-
24A
307G
-26
0.00
0202
033
2E
quat
ion:
y
= m
x+
bW
A*1
8-25
A30
7G-2
50.
0005
050
648
Slo
pe, m
=17
8096
1W
A*1
8-26
A30
7G-2
40.
0010
1016
20In
terc
ept,
b =
-128
.36
WA
*18-
27A
307G
-23
0.00
2020
030
18R
² =
0.99
60W
A*1
8-28
A30
7G-2
20.
0050
5088
21L
OQ
(µ
g/g)
=0.
02W
A*1
8-39
A30
7G-2
20.
0050
5091
54W
A*1
8-40
A30
7G-2
30.
0020
200
3224
WA
*18-
41A
307G
-24
0.00
1010
1884
WA
*18-
42A
307G
-25
0.00
0505
078
8W
A*1
8-43
A30
7G-2
60.
0002
020
360
WA
*18-
44A
307G
-27
0.00
0101
015
4
AN
AL
YT
ICA
L D
AT
AE
xtra
ctio
n da
te:
26-J
ul-1
2A
naly
sis
date
:30
-Jul
-12
RT
SD
BS
ampl
eS
ampl
eS
pike
Sam
ple
Spi
keP
eak
Fin
alR
esid
ueS
pike
Pag
eID
Typ
eA
dded
Wei
ght
Con
c.A
rea
Vol
ume
Fou
ndR
ecov
ery
No
*1(µ
g)(g
)(µ
g/g)
*2(c
ount
s)(m
L)
(µg/
g)*3
(%)*
4
CA
LC
UL
AT
ION
PA
GE
Cal
ibra
tion
sta
ndar
d--
----
----
----
--
y =
178
0960
.991
8x -
128.
3635
R² =
0.9
960
0
1000
2000
3000
4000
5000
6000
7000
8000
9000
1000
0 0.00
00.
001
0.00
20.
003
0.00
40.
005
0.00
6
Peak area
Sta
nd
ard
Con
c. (
µg/
mL
)
No.
1(µ
g)(g
)(µ
g/g)
2(c
ount
s)(m
L)
(µg/
g)3
(%)
4
WA
*18-
3018
467A
-C-1
CN
A5.
00N
A10
200
0.00
311
NA
WA
*18-
3118
467A
-C-1
CN
A5.
00N
A8
200
0.00
306
NA
WA
*18-
3218
467A
-QC
-2-1
F10
.10
5.00
2.02
029
3950
001.
722
85.2
6
WA
*18-
3318
467A
-QC
-2-1
F10
.10
5.00
2.02
030
2650
001.
771
87.6
8
WA
*18-
3418
468A
-T-1
T5.
0064
1320
001.
469
WA
*18-
3518
468A
-T-1
T5.
0071
1920
001.
628
WA
*18-
3618
469A
-T-1
T5.
0066
3320
001.
519
WA
*18-
3718
469A
-T-1
T5.
0072
5020
001.
657
NO
TE
S*1
: C=
Con
trol
, F=
Fort
ifie
d, T
=T
reat
ed*2
: Spi
ke a
mou
nt =
(S
pike
add
ed)
÷ (S
ampl
e w
eigh
t)
*3: R
esid
ue a
mou
nt =
[(A
rea
- b)
÷ m
] x
(Fin
al v
ol/S
ampl
e w
t)*4
. Rec
over
y (%
) =
(Res
idue
fou
nd)
÷ (s
pike
con
c) *
100
"NA
" st
ands
for
"N
ot a
pplic
able
"
Attachment B: Calculation Worksheets, Standard Curves and LOD/LOQ Calculations
IR-4 North Central Region Laboratory, Michigan State University Analytical Summary Report PR# 09358
Page 91

PR
OJE
CT
IN
FO
RM
AT
ION
PR
Num
ber:
09
358
Lab
orat
ory
ID:
0935
8.11
-MIR
05C
hem
ical
: F
loni
cam
idF
ield
ID
No.
: 09
358.
11-W
A*1
8A
naly
sis
for:
T
FN
GF
ield
Res
earc
h D
irec
tor:
Jo
hn H
arve
yC
omm
odit
y:
Min
tA
naly
st(s
):
Ein
a A
bouz
ied&
Les
ter
Gei
ssel
Cro
p pa
rt:
Min
t Top
s (l
eave
s&st
ems)
Inst
rum
ent:
U
PL
C/M
S/M
S
CA
LIB
RA
TIO
N D
AT
AD
ate
of c
alib
rati
on a
naly
sis:
30
-Jul
-12
RT
SD
BP
eak
----
----
Pag
eID
(or
nam
e)C
onc.
(µg/
mL
)A
rea
WA
*18-
23A
307G
-27
0.00
0095
5021
6T
ype:
L
inea
r re
gres
sion
WA
*18-
24A
A30
7G-2
60.
0001
910
331
Equ
atio
n:
y=
mx
+ b
WA
*18-
25A
307G
-25
0.00
0477
581
2S
lope
, m =
2442
861
WA
*18-
26A
307G
-24
0.00
0955
0019
61In
terc
ept,
b =
-312
.30
WA
*18-
27A
307G
-23
0.00
1910
035
49R
² =0.
9914
WA
*18-
28A
307G
-22
0.00
4775
1183
0L
OQ
(µ
g/g)
=0.
02W
A*1
8-39
A30
7G-2
20.
0047
7511
453
WA
*18-
40A
307G
-23
0.00
1910
036
41W
A*1
8-41
A30
7G-2
40.
0009
5500
2108
WA
*18-
42A
307G
-25
0.00
0477
585
7W
A*1
8-43
A30
7G-2
60.
0001
910
375
WA
*18-
44A
307G
-27
0.00
0095
5017
9
AN
AL
YT
ICA
L D
AT
AE
xtra
ctio
n da
te:
26-J
ul-1
2A
naly
sis
date
:30
-Jul
-12
RT
SD
BS
ampl
eS
ampl
eS
pike
Sam
ple
Spi
keP
eak
Fin
alR
esid
ueS
pike
Pag
eID
Typ
eA
dded
Wei
ght
Con
c.A
rea
Vol
ume
Fou
ndR
ecov
ery
CA
LC
UL
AT
ION
PA
GE
Cal
ibra
tion
sta
ndar
d--
----
----
----
--
y =
244
2860
.898
3x -
312.
3005
R² =
0.9
914
-100
00
1000
2000
3000
4000
5000
6000
7000
8000
9000
1000
0
1100
0
1200
0
1300
0 0.00
00.
001
0.00
20.
003
0.00
40.
005
0.00
6
Peak area
Sta
ndar
d C
onc.
(µ
g/m
L)
No.
*1(µ
g)(g
)(µ
g/g)
*2(c
ount
s)(m
L)
(µg/
g)*3
(%)*
4W
A*1
8-30
1846
7A-C
-1C
NA
5.00
NA
326
200
0.01
05N
AW
A*1
8-31
1846
7A-C
-1C
NA
5.00
NA
269
200
0.00
95N
A
WA
*18-
3218
467A
-QC
-2-1
F9.
550
5.00
1.91
039
6450
001.
751
91.6
5
WA
*18-
3318
467A
-QC
-2-1
F9.
550
5.00
1.91
039
9550
001.
763
92.3
2
WA
*18-
3418
468A
-T-1
T5.
0016
7120
000.
3248
WA
*18-
3518
468A
-T-1
T5.
0017
2520
000.
3336
WA
*18-
3618
469A
-T-1
T5.
0016
1820
000.
3161
WA
*18-
3718
469A
-T-1
T5.
0020
2220
000.
3822
NO
TE
S*1
: C=
Con
trol
, F=
Fort
ifie
d, T
=T
reat
ed*2
: Spi
ke a
mou
nt =
(S
pike
add
ed)
÷ (S
ampl
e w
eigh
t)
*3: R
esid
ue a
mou
nt =
[(A
rea
- b)
÷ m
] x
(Fin
al v
ol/S
ampl
e w
t)*4
. Rec
over
y (%
) =
(Res
idue
fou
nd)
÷ (s
pike
con
c) *
100
"NA
" st
ands
for
"N
ot a
pplic
able
"
Attachment B: Calculation Worksheets, Standard Curves and LOD/LOQ Calculations
IR-4 North Central Region Laboratory, Michigan State University Analytical Summary Report PR# 09358
Page 92
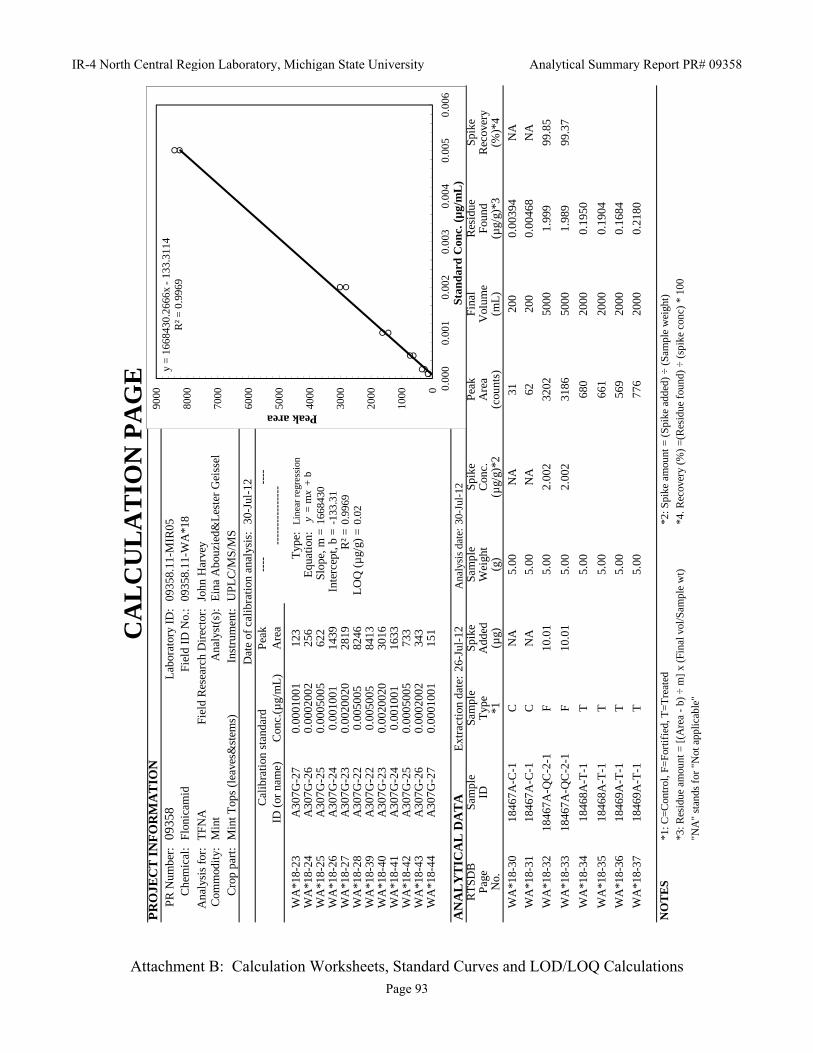
PR
OJE
CT
IN
FO
RM
AT
ION
PR
Num
ber:
09
358
Lab
orat
ory
ID:
0935
8.11
-MIR
05C
hem
ical
: F
loni
cam
idF
ield
ID
No.
: 09
358.
11-W
A*1
8
Ana
lysi
s fo
r:
TF
NA
Fie
ld R
esea
rch
Dir
ecto
r:
John
Har
vey
Com
mod
ity:
M
int
Ana
lyst
(s):
E
ina
Abo
uzie
d&L
este
r G
eiss
elC
rop
part
: M
int T
ops
(lea
ves&
stem
s)In
stru
men
t:
UP
LC
/MS
/MS
Dat
e of
cal
ibra
tion
ana
lysi
s:
30-J
ul-1
2P
eak
----
----
ID (
or n
ame)
Con
c.(µ
g/m
L)
Are
a
WA
*18-
23A
307G
-27
0.00
0100
112
3T
ype:
L
inea
r re
gres
sion
WA
*18-
24A
307G
-26
0.00
0200
225
6E
quat
ion:
y
= m
x+
bW
A*1
8-25
A30
7G-2
50.
0005
005
622
Slo
pe, m
=16
6843
0W
A*1
8-26
A30
7G-2
40.
0010
0114
39In
terc
ept,
b =
-133
.31
WA
*18-
27A
307G
-23
0.00
2002
028
19R
² =
0.99
69W
A*1
8-28
A30
7G-2
20.
0050
0582
46L
OQ
(µ
g/g)
=0.
02W
A*1
8-39
A30
7G-2
20.
0050
0584
13W
A*1
8-40
A30
7G-2
30.
0020
020
3016
WA
*18-
41A
307G
-24
0.00
1001
1633
WA
*18-
42A
307G
-25
0.00
0500
573
3W
A*1
8-43
A30
7G-2
60.
0002
002
343
WA
*18-
44A
307G
-27
0.00
0100
115
1
AN
AL
YT
ICA
L D
AT
AE
xtra
ctio
n da
te:
26-J
ul-1
2A
naly
sis
date
:30
-Jul
-12
RT
SD
BS
ampl
eS
ampl
eS
pike
Sam
ple
Spi
keP
eak
Fin
alR
esid
ueS
pike
Pag
eID
Typ
eA
dded
Wei
ght
Con
c.A
rea
Vol
ume
Fou
ndR
ecov
ery
No
*1(µ
g)(g
)(µ
g/g)
*2(c
ount
s)(m
L)
(µg/
g)*3
(%)*
4
CA
LC
UL
AT
ION
PA
GE
Cal
ibra
tion
sta
ndar
d--
----
----
----
--
y =
166
8430
.266
6x -
133.
3114
R² =
0.9
969
0
1000
2000
3000
4000
5000
6000
7000
8000
9000
0.00
00.
001
0.00
20.
003
0.00
40.
005
0.00
6
Peak area
Sta
nd
ard
Con
c. (
µg/
mL
)
No.
1(µ
g)(g
)(µ
g/g)
2(c
ount
s)(m
L)
(µg/
g)3
(%)
4
WA
*18-
3018
467A
-C-1
CN
A5.
00N
A31
200
0.00
394
NA
WA
*18-
3118
467A
-C-1
CN
A5.
00N
A62
200
0.00
468
NA
WA
*18-
3218
467A
-QC
-2-1
F10
.01
5.00
2.00
232
0250
001.
999
99.8
5
WA
*18-
3318
467A
-QC
-2-1
F10
.01
5.00
2.00
231
8650
001.
989
99.3
7
WA
*18-
3418
468A
-T-1
T5.
0068
020
000.
1950
WA
*18-
3518
468A
-T-1
T5.
0066
120
000.
1904
WA
*18-
3618
469A
-T-1
T5.
0056
920
000.
1684
WA
*18-
3718
469A
-T-1
T5.
0077
620
000.
2180
NO
TE
S*1
: C=
Con
trol
, F=
Fort
ifie
d, T
=T
reat
ed*2
: Spi
ke a
mou
nt =
(S
pike
add
ed)
÷ (S
ampl
e w
eigh
t)
*3: R
esid
ue a
mou
nt =
[(A
rea
- b)
÷ m
] x
(Fin
al v
ol/S
ampl
e w
t)*4
. Rec
over
y (%
) =
(Res
idue
fou
nd)
÷ (s
pike
con
c) *
100
"NA
" st
ands
for
"N
ot a
pplic
able
"
Attachment B: Calculation Worksheets, Standard Curves and LOD/LOQ Calculations
IR-4 North Central Region Laboratory, Michigan State University Analytical Summary Report PR# 09358
Page 93

PR
OJE
CT
IN
FO
RM
AT
ION
PR
Num
ber:
09
358
Lab
orat
ory
ID:
0935
8.11
-MIR
05C
hem
ical
: F
loni
cam
idF
ield
ID
No.
: 09
358.
11-W
A*1
8A
naly
sis
for:
T
FN
A-A
MF
ield
Res
earc
h D
irec
tor:
Jo
hn H
arve
y
Com
mod
ity:
M
int
Ana
lyst
(s):
E
ina
Abo
uzie
d&L
este
r G
eiss
elC
rop
part
: M
int O
ilIn
stru
men
t:
UP
LC
/MS
/MS
CA
LIB
RA
TIO
N D
AT
AD
ate
of c
alib
rati
on a
naly
sis:
30
-Jul
-12
RT
SD
BP
eak
----
----
Pag
eID
(or
nam
e)C
onc.
(µg/
mL
)A
rea
WA
*18-
56A
307G
-27
0.00
0101
214
0T
ype:
L
inea
r re
gres
sion
WA
*18-
57A
307G
-26
0.00
0202
424
4E
quat
ion:
y
= m
x+
bW
A*1
8-58
AA
307G
-25
0.00
0506
053
7S
lope
, m =
1181
069
WA
*18-
59A
A30
7G-2
40.
0010
1210
22In
terc
ept,
b =
-91.
60W
A*1
8-60
A30
7G-2
30.
0020
240
1863
R² =
0.98
76W
A*1
8-61
A30
7G-2
20.
0050
6059
00L
OQ
(µ
g/g)
=0.
02W
A*1
8-72
A30
7G-2
20.
0050
6062
03W
A*1
8-73
A30
7G-2
30.
0020
240
1800
WA
*18-
74A
307G
-24
0.00
1012
1270
WA
*18-
75A
307G
-25
0.00
0506
058
0W
A*1
8-76
A30
7G-2
60.
0002
024
273
WA
*18-
77A
307G
-27
0.00
0101
210
5
AN
AL
YT
ICA
L D
AT
AE
xtra
ctio
n da
te:
30-J
ul-1
2A
naly
sis
date
:30
-Jul
-12
RT
SD
BS
ampl
eS
ampl
eS
pike
Sam
ple
Spi
keP
eak
Fin
alR
esid
ueS
pike
Pag
eID
Typ
eA
dded
Wei
ght
Con
c.A
rea
Vol
ume
Fou
ndR
ecov
ery
CA
LC
UL
AT
ION
PA
GE
Cal
ibra
tion
sta
ndar
d--
----
----
----
--
y =
118
1068
.648
1x -
91.6
042
R² =
0.9
876
0
1000
2000
3000
4000
5000
6000
7000
0.00
00.
001
0.00
20.
003
0.00
40.
005
0.00
6
Peak area
Sta
ndar
d C
onc.
(µ
g/m
L)
gyp
gy
No.
*1(µ
g)(g
)(µ
g/g)
*2(c
ount
s)(m
L)
(µg/
g)*3
(%)*
4W
A*1
8-63
1847
0A-C
-2C
NA
2.50
NA
010
0<
0.0
2N
AW
A*1
8-64
1847
0A-C
-2C
NA
2.50
NA
010
0<
0.0
2N
A
WA
*18-
6518
470A
-QC
-0.0
2-1
F0.
0506
02.
500.
0202
453
010
00.
0210
510
4.01
WA
*18-
6618
470A
-QC
-0.0
2-1
F0.
0506
02.
500.
0202
452
510
00.
0208
810
3.18
WA
*18-
6718
470A
-QC
-0.0
2-2
F0.
0506
02.
500.
0202
448
310
00.
0194
696
.15
WA
*18-
6818
470A
-QC
-0.0
2-2
F0.
0506
02.
500.
0202
452
410
00.
0208
510
3.01
WA
*18-
6918
471A
-T-1
T2.
500
100
< 0
.02
WA
*18-
7018
471A
-T-1
T2.
500
100
< 0
.02
NO
TE
S*1
: C=
Con
trol
, F=
Fort
ifie
d, T
=T
reat
ed*2
: Spi
ke a
mou
nt =
(S
pike
add
ed)
÷ (S
ampl
e w
eigh
t)*3
: Res
idue
am
ount
= [
(Are
a -
b) ÷
m]
x (F
inal
vol
/Sam
ple
wt)
*4. R
ecov
ery
(%)
=(R
esid
ue f
ound
) ÷
(spi
ke c
onc)
* 1
00"N
A"
stan
ds f
or "
Not
app
licab
le"
Attachment B: Calculation Worksheets, Standard Curves and LOD/LOQ Calculations
IR-4 North Central Region Laboratory, Michigan State University Analytical Summary Report PR# 09358
Page 94

PR
OJE
CT
IN
FO
RM
AT
ION
PR
Num
ber:
09
358
Lab
orat
ory
ID:
0935
8.11
-MIR
05C
hem
ical
: F
loni
cam
i dF
ield
ID
No.
: 09
358.
11-W
A*1
8A
naly
sis
for:
F
loni
cam
id (
IKI-
220)
Fie
ld R
esea
rch
Dir
ecto
r:
John
Har
vey
Com
mod
ity:
M
int
Ana
lyst
(s):
E
ina
Abo
uzie
d&L
este
r G
eiss
el
Cro
p pa
rt:
Min
t Oil
Inst
rum
ent:
U
PL
C/M
S/M
SC
AL
IBR
AT
ION
DA
TA
Dat
e of
cal
ibra
tion
ana
lysi
s:
30-J
ul-1
2R
TSD
BP
eak
----
----
Pag
eID
(or
nam
e)C
onc.
(µg/
mL
)A
rea
WA
*18-
56A
307G
-27
0.00
0101
017
0T
ype:
L
inea
r re
gres
sion
WA
*18-
57A
307G
-26
0.00
0202
036
1E
quat
ion:
y
= m
x+
bW
A*1
8-58
A30
7G-2
50.
0005
050
897
Slo
pe, m
=18
4485
2W
A*1
8-59
A30
7G-2
40.
0010
1017
26In
terc
ept,
b =
-62.
84W
A*1
8-60
A30
7G-2
30.
0020
200
3409
R²
=0.
9984
WA
*18-
61A
307G
-22
0.00
5050
9202
LO
Q (
µg/
g) =
0.02
WA
*18-
72A
307G
-22
0.00
5050
9472
WA
*18-
73A
307G
-23
0.00
2020
034
53W
A*1
8-74
A30
7G-2
40.
0010
1019
04W
A*1
8-75
A30
7G-2
50.
0005
050
917
WA
*18-
76A
307G
-26
0.00
0202
036
9W
A*1
8-77
A30
7G-2
70.
0001
010
160
AN
AL
YT
ICA
L D
AT
AE
xtra
ctio
n da
te:
30-J
ul-1
2A
naly
sis
date
:30
-Jul
-12
RT
SD
BS
ampl
eS
ampl
eS
pike
Sam
ple
Spi
keP
eak
Fin
alR
esid
ueS
pike
Pag
eID
Typ
eA
dded
Wei
ght
Con
c.A
rea
Vol
ume
Fou
ndR
ecov
ery
No
*1(µ
g)(g
)(µ
g/g)
*2(c
ount
s)(m
L)
(µg/
g)*3
(%)*
4
CA
LC
UL
AT
ION
PA
GE
Cal
ibra
tion
sta
ndar
d--
----
----
----
--
y =
184
4851
.599
0x -
62.8
402
R² =
0.9
984
0
1000
2000
3000
4000
5000
6000
7000
8000
9000
1000
0 0.00
00.
001
0.00
20.
003
0.00
40.
005
0.00
6
Peak area
Sta
nd
ard
Con
c. (
µg/
mL
)
No.
1(µ
g)(g
)(µ
g/g)
2(c
ount
s)(m
L)
(µg/
g)3
(%)
4
WA
*18-
6318
470A
-C-2
CN
A2.
50N
A71
100
0.00
290
NA
WA
*18-
6418
470A
-C-2
CN
A2.
50N
A0
100
< 0
.02
NA
WA
*18-
6518
470A
-QC
-0.0
2-1
F0.
0505
02.
500.
0202
086
710
00.
0201
699
.81
WA
*18-
6618
470A
-QC
-0.0
2-1
F0.
0505
02.
500.
0202
083
810
00.
0195
396
.69
WA
*18-
6718
470A
-QC
-0.0
2-2
F0.
0505
02.
500.
0202
077
510
00.
0181
789
.93
WA
*18-
6818
470A
-QC
-0.0
2-2
F0.
0505
02.
500.
0202
093
310
00.
0215
910
6.89
WA
*18-
6918
471A
-T-1
T2.
5013
310
00.
0042
46
WA
*18-
7018
471A
-T-1
T2.
5048
100
0.00
2403
NO
TE
S*1
: C=
Con
trol
, F=
Fort
ifie
d, T
=T
reat
ed*2
: Spi
ke a
mou
nt =
(S
pike
add
ed)
÷ (S
ampl
e w
eigh
t)
*3: R
esid
ue a
mou
nt =
[(A
rea
- b)
÷ m
] x
(Fin
al v
ol/S
ampl
e w
t)*4
. Rec
over
y (%
) =
(Res
idue
fou
nd)
÷ (s
pike
con
c) *
100
"NA
" st
ands
for
"N
ot a
pplic
able
"
Attachment B: Calculation Worksheets, Standard Curves and LOD/LOQ Calculations
IR-4 North Central Region Laboratory, Michigan State University Analytical Summary Report PR# 09358
Page 95

PR
OJE
CT
IN
FO
RM
AT
ION
PR
Num
ber:
09
358
Lab
orat
ory
ID:
0935
8.11
-MIR
05C
hem
ical
: F
loni
cam
idF
ield
ID
No.
: 09
358.
11-W
A*1
8A
naly
sis
for:
T
FN
GF
ield
Res
earc
h D
irec
tor:
Jo
hn H
arve
yC
omm
odit
y:
Min
tA
naly
st(s
):
Ein
a A
bouz
ied&
Les
ter
Gei
ssel
Cro
p pa
rt:
Min
t Oil
Inst
rum
ent:
U
PL
C/M
S/M
S
CA
LIB
RA
TIO
N D
AT
AD
ate
of c
alib
rati
on a
naly
sis:
30
-Jul
-12
RT
SD
BP
eak
----
----
Pag
eID
(or
nam
e)C
onc.
(µg/
mL
)A
rea
WA
*18-
56A
307G
-27
0.00
0095
5018
9T
ype:
L
inea
r re
gres
sion
WA
*18-
57A
A30
7G-2
60.
0001
910
331
Equ
atio
n:
y=
mx
+ b
WA
*18-
58A
A30
7G-2
50.
0004
775
943
Slo
pe, m
=24
6598
8W
A*1
8-59
A30
7G-2
40.
0009
5500
1902
Inte
rcep
t, b
=-2
58.6
9W
A*1
8-60
A30
7G-2
30.
0019
100
4180
R² =
0.99
54W
A*1
8-61
A30
7G-2
20.
0047
7511
394
LO
Q (
µg/
g) =
0.02
WA
*18-
72A
307G
-22
0.00
4775
1201
4W
A*1
8-73
A30
7G-2
30.
0019
100
3880
WA
*18-
74A
307G
-24
0.00
0955
0020
23W
A*1
8-75
A30
7G-2
50.
0004
775
817
WA
*18-
76A
307G
-26
0.00
0191
043
9W
A*1
8-77
A30
7G-2
70.
0000
9550
232
AN
AL
YT
ICA
L D
AT
AE
xtra
ctio
n da
te:
30-J
ul-1
2A
naly
sis
date
:30
-Jul
-12
RT
SD
BS
ampl
eS
ampl
eS
pike
Sam
ple
Spi
keP
eak
Fin
alR
esid
ueS
pike
Pag
eID
Typ
eA
dded
Wei
ght
Con
c.A
rea
Vol
ume
Fou
ndR
ecov
ery
CA
LC
UL
AT
ION
PA
GE
Cal
ibra
tion
sta
ndar
d--
----
----
----
--
y =
246
5987
.650
5x -
258.
6934
R² =
0.9
954
-200
00
2000
4000
6000
8000
1000
0
1200
0
1400
0 0.00
00.
001
0.00
20.
003
0.00
40.
005
0.00
6
Peak area
Sta
ndar
d C
onc.
(µ
g/m
L)
No.
*1(µ
g)(g
)(µ
g/g)
*2(c
ount
s)(m
L)
(µg/
g)*3
(%)*
4W
A*1
8-63
1847
0A-C
-2C
NA
2.50
NA
2710
00.
0046
3N
AW
A*1
8-64
1847
0A-C
-2C
NA
2.50
NA
210
00.
0042
3N
A
WA
*18-
6518
470A
-QC
-0.0
2-1
F0.
0477
52.
500.
0191
069
810
00.
0155
281
.25
WA
*18-
6618
470A
-QC
-0.0
2-1
F0.
0477
52.
500.
0191
072
310
00.
0159
283
.37
WA
*18-
6718
470A
-QC
-0.0
2-2
F0.
0477
52.
500.
0191
086
010
00.
0181
595
.01
WA
*18-
6818
470A
-QC
-0.0
2-2
F0.
0477
52.
500.
0191
085
910
00.
0181
394
.92
WA
*18-
6918
471A
-T-1
T2.
507
100
0.00
431
WA
*18-
7018
471A
-T-1
T2.
502
100
0.00
423
NO
TE
S*1
: C=
Con
trol
, F=
Fort
ifie
d, T
=T
reat
ed*2
: Spi
ke a
mou
nt =
(S
pike
add
ed)
÷ (S
ampl
e w
eigh
t)
*3: R
esid
ue a
mou
nt =
[(A
rea
- b)
÷ m
] x
(Fin
al v
ol/S
ampl
e w
t)*4
. Rec
over
y (%
) =
(Res
idue
fou
nd)
÷ (s
pike
con
c) *
100
"NA
" st
ands
for
"N
ot a
pplic
able
"
Attachment B: Calculation Worksheets, Standard Curves and LOD/LOQ Calculations
IR-4 North Central Region Laboratory, Michigan State University Analytical Summary Report PR# 09358
Page 96

PR
OJE
CT
IN
FO
RM
AT
ION
PR
Num
ber:
09
358
Lab
orat
ory
ID:
0935
8.11
-MIR
05C
hem
ical
: F
loni
cam
idF
ield
ID
No.
: 09
358.
11-W
A*1
8
Ana
lysi
s fo
r:
TF
NA
Fie
ld R
esea
rch
Dir
ecto
r:
John
Har
vey
Com
mod
ity:
Min
tA
naly
st(s
):
Ein
a A
bouz
ied&
Les
ter
Gei
ssel
Cro
p pa
rt:
Min
t Oil
Inst
rum
ent:
UP
LC
/MS
/MS
Dat
e of
cal
ibra
tion
anal
ysis
: 30
-Jul
-12
Pea
k--
----
--ID
(or
nam
e)C
onc.
(µg/
mL
)A
rea
WA
*18-
56A
307G
-27
0.00
0100
113
5T
ype:
L
inea
r re
gres
sion
WA
*18-
57A
307G
-26
0.00
0200
227
3E
quat
ion:
y
= m
x+
bW
A*1
8-58
A30
7G-2
50.
0005
005
717
Slo
pe, m
=16
9924
5W
A*1
8-59
A30
7G-2
40.
0010
0115
02In
terc
ept,
b =
-121
.80
WA
*18-
60A
307G
-23
0.00
2002
031
33R
² =0.
9971
WA
*18-
61A
307G
-22
0.00
5005
8168
LO
Q (
µg/
g) =
0.02
WA
*18-
72A
307G
-22
0.00
5005
8758
WA
*18-
73A
307G
-23
0.00
2002
030
76W
A*1
8-74
A30
7G-2
40.
0010
0115
26W
A*1
8-75
A30
7G-2
50.
0005
005
704
WA
*18-
76A
307G
-26
0.00
0200
230
6W
A*1
8-77
A30
7G-2
70.
0001
001
177
AN
AL
YT
ICA
L D
AT
AE
xtra
ctio
n da
te:
30-J
ul-1
2A
naly
sis
date
:30
-Jul
-12
RT
SD
BS
ampl
eS
ampl
eS
pike
Sam
ple
Spi
keP
eak
Fin
alR
esid
ueS
pike
Pag
eID
Typ
eA
dded
Wei
ght
Con
c.A
rea
Vol
ume
Fou
ndR
ecov
ery
No.
*1(µ
g)(g
)(µ
g/g)
*2(c
ount
s)(m
L)
(µg/
g)*3
(%)*
4
CA
LC
UL
AT
ION
PA
GE
Cal
ibra
tion
stan
dard
----
----
----
----
y =
169
9244
.603
6x -
121.
8010
R² =
0.9
971
0
1000
2000
3000
4000
5000
6000
7000
8000
9000
1000
0 0.00
00.
001
0.00
20.
003
0.00
40.
005
0.00
6
Peak area
Sta
nd
ard
Con
c. (
µg/
mL
)
WA
*18-
6318
470A
-C-2
CN
A2.
50N
A0
100
< 0
.02
NA
WA
*18-
6418
470A
-C-2
CN
A2.
50N
A0
100
< 0
.02
NA
WA
*18-
6518
470A
-QC
-0.0
2-1
F0.
0500
52.
500.
0200
258
810
00.
0167
183
.46
WA
*18-
6618
470A
-QC
-0.0
2-1
F0.
0500
52.
500.
0200
267
610
00.
0187
893
.81
WA
*18-
6718
470A
-QC
-0.0
2-2
F0.
0500
52.
500.
0200
275
910
00.
0207
310
3.57
WA
*18-
6818
470A
-QC
-0.0
2-2
F0.
0500
52.
500.
0200
273
610
00.
0202
100.
86
WA
*18-
6918
471A
-T-1
T2.
500
100
< 0
.02
WA
*18-
7018
471A
-T-1
T2.
500
100
< 0
.02
NO
TE
S*1
: C=
Con
trol
, F=
Fort
ifie
d, T
=T
reat
ed*2
: Spi
ke a
mou
nt =
(Sp
ike
adde
d) ÷
(Sa
mpl
e w
eigh
t)
*3: R
esid
ue a
mou
nt =
[(A
rea
- b)
÷ m
] x
(Fin
al v
ol/S
ampl
e w
t)*4
. Rec
over
y (%
) =
(Res
idue
fou
nd)
÷ (
spik
e co
nc)
* 10
0
"NA
" st
ands
for
"N
ot a
pplic
able
"
Attachment B: Calculation Worksheets, Standard Curves and LOD/LOQ Calculations
IR-4 North Central Region Laboratory, Michigan State University Analytical Summary Report PR# 09358
Page 97
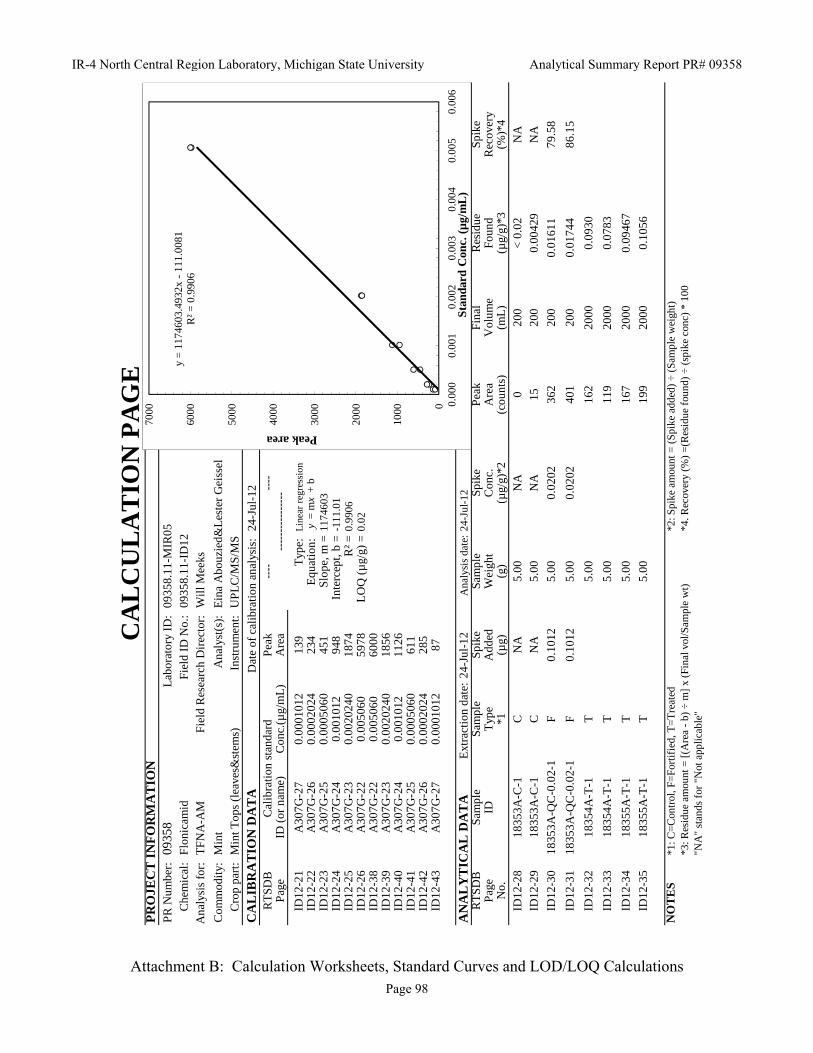
PR
OJE
CT
IN
FO
RM
AT
ION
PR
Num
ber:
09
358
Lab
orat
ory
ID:
0935
8.11
-MIR
05C
hem
ical
: F
loni
cam
idF
ield
ID
No.
: 09
358.
11-I
D12
Ana
lysi
s fo
r:
TF
NA
-AM
Fie
ld R
esea
rch
Dir
ecto
r:
Wil
l Mee
ks
Com
mod
ity:
M
int
Ana
lyst
(s):
E
ina
Abo
uzie
d&L
este
r G
eiss
elC
rop
part
: M
int T
ops
(lea
ves&
stem
s)In
stru
men
t:
UP
LC
/MS
/MS
CA
LIB
RA
TIO
N D
AT
AD
ate
of c
alib
rati
on a
naly
sis:
24
-Jul
-12
RT
SD
BP
eak
----
----
Pag
eID
(or
nam
e)C
onc.
(µg/
mL
)A
rea
ID12
-21
A30
7G-2
70.
0001
012
139
Typ
e:
Lin
ear
regr
essi
onID
12-2
2A
307G
-26
0.00
0202
423
4E
quat
ion:
y
= m
x+
bID
12-2
3A
307G
-25
0.00
0506
045
1S
lope
, m =
1174
603
ID12
-24
A30
7G-2
40.
0010
1294
8In
terc
ept,
b =
-111
.01
ID12
-25
A30
7G-2
30.
0020
240
1874
R² =
0.99
06ID
12-2
6A
307G
-22
0.00
5060
5978
LO
Q (
µg/
g) =
0.02
ID12
-38
A30
7G-2
20.
0050
6060
00ID
12-3
9A
307G
-23
0.00
2024
018
56ID
12-4
0A
307G
-24
0.00
1012
1126
ID12
-41
A30
7G-2
50.
0005
060
611
ID12
-42
A30
7G-2
60.
0002
024
285
ID12
-43
A30
7G-2
70.
0001
012
87
AN
AL
YT
ICA
L D
AT
AE
xtra
ctio
n da
te:
24-J
ul-1
2A
naly
sis
date
:24
-Jul
-12
RT
SD
BS
ampl
eS
ampl
eS
pike
Sam
ple
Spi
keP
eak
Fin
alR
esid
ueS
pike
Pag
eID
Typ
eA
dded
Wei
ght
Con
c.A
rea
Vol
ume
Fou
ndR
ecov
ery
CA
LC
UL
AT
ION
PA
GE
Cal
ibra
tion
sta
ndar
d--
----
----
----
--
y =
117
4603
.493
2x -
111.
0081
R² =
0.9
906
0
1000
2000
3000
4000
5000
6000
7000
0.00
00.
001
0.00
20.
003
0.00
40.
005
0.00
6
Peak area
Sta
ndar
d C
onc.
(µ
g/m
L)
gyp
gy
No.
*1(µ
g)(g
)(µ
g/g)
*2(c
ount
s)(m
L)
(µg/
g)*3
(%)*
4ID
12-2
818
353A
-C-1
CN
A5.
00N
A0
200
< 0
.02
NA
ID12
-29
1835
3A-C
-1C
NA
5.00
NA
1520
00.
0042
9N
A
ID12
-30
1835
3A-Q
C-0
.02-
1F
0.10
125.
000.
0202
362
200
0.01
611
79.5
8
ID12
-31
1835
3A-Q
C-0
.02-
1F
0.10
125.
000.
0202
401
200
0.01
744
86.1
5
ID12
-32
1835
4A-T
-1T
5.00
162
2000
0.09
30
ID12
-33
1835
4A-T
-1T
5.00
119
2000
0.07
83
ID12
-34
1835
5A-T
-1T
5.00
167
2000
0.09
467
ID12
-35
1835
5A-T
-1T
5.00
199
2000
0.10
56
NO
TE
S*1
: C=
Con
trol
, F=
Fort
ifie
d, T
=T
reat
ed*2
: Spi
ke a
mou
nt =
(S
pike
add
ed)
÷ (S
ampl
e w
eigh
t)*3
: Res
idue
am
ount
= [
(Are
a -
b) ÷
m]
x (F
inal
vol
/Sam
ple
wt)
*4. R
ecov
ery
(%)
=(R
esid
ue f
ound
) ÷
(spi
ke c
onc)
* 1
00"N
A"
stan
ds f
or "
Not
app
licab
le"
Attachment B: Calculation Worksheets, Standard Curves and LOD/LOQ Calculations
IR-4 North Central Region Laboratory, Michigan State University Analytical Summary Report PR# 09358
Page 98

PR
OJE
CT
IN
FO
RM
AT
ION
PR
Num
ber:
09
358
Lab
orat
ory
ID:
0935
8.11
-MIR
05C
hem
ical
: F
loni
cam
i dF
ield
ID
No.
: 09
358.
11-I
D12
Ana
lysi
s fo
r:
Flo
nica
mid
(IK
I-22
0)F
ield
Res
earc
h D
irec
tor:
W
ill M
eeks
Com
mod
ity:
M
int
Ana
lyst
(s):
E
ina
Abo
uzie
d&L
este
r G
eiss
el
Cro
p pa
rt:
Min
t Top
s (l
eave
s&st
ems)
Inst
rum
ent:
U
PL
C/M
S/M
SC
AL
IBR
AT
ION
DA
TA
Dat
e of
cal
ibra
tion
ana
lysi
s:
24-J
ul-1
2R
TSD
BP
eak
----
----
Pag
eID
(or
nam
e)C
onc.
(µg/
mL
)A
rea
ID12
-21
A30
7G-2
70.
0001
010
157
Typ
e:
Lin
ear
regr
essi
onID
12-2
2A
307G
-26
0.00
0202
025
6E
quat
ion:
y
= m
x+
bID
12-2
3A
307G
-25
0.00
0505
075
3S
lope
, m =
1677
010
ID12
-24
A30
7G-2
40.
0010
1014
86In
terc
ept,
b =
-39.
54ID
12-2
5A
307G
-23
0.00
2020
032
90R
² =
0.99
72ID
12-2
6A
307G
-22
0.00
5050
8114
LO
Q (
µg/
g) =
0.02
ID12
-38
A30
7G-2
20.
0050
5087
61ID
12-3
9A
307G
-23
0.00
2020
033
64ID
12-4
0A
307G
-24
0.00
1010
1819
ID12
-41
A30
7G-2
50.
0005
050
884
ID12
-42
A30
7G-2
60.
0002
020
285
ID12
-43
A30
7G-2
70.
0001
010
167
AN
AL
YT
ICA
L D
AT
AE
xtra
ctio
n da
te:
24-J
ul-1
2A
naly
sis
date
:24
-Jul
-12
RT
SD
BS
ampl
eS
ampl
eS
pike
Sam
ple
Spi
keP
eak
Fin
alR
esid
ueS
pike
Pag
eID
Typ
eA
dded
Wei
ght
Con
c.A
rea
Vol
ume
Fou
ndR
ecov
ery
No
*1(µ
g)(g
)(µ
g/g)
*2(c
ount
s)(m
L)
(µg/
g)*3
(%)*
4
CA
LC
UL
AT
ION
PA
GE
Cal
ibra
tion
sta
ndar
d--
----
----
----
--
y =
167
7010
.083
1x -
39.5
443
R² =
0.9
972
0
1000
2000
3000
4000
5000
6000
7000
8000
9000
1000
0 0.00
00.
001
0.00
20.
003
0.00
40.
005
0.00
6
Peak area
Sta
nd
ard
Con
c. (
µg/
mL
)
No.
1(µ
g)(g
)(µ
g/g)
2(c
ount
s)(m
L)
(µg/
g)3
(%)
4
ID12
-28
1835
3A-C
-1C
NA
5.00
NA
3620
00.
0018
0N
A
ID12
-29
1835
3A-C
-1C
NA
5.00
NA
7120
00.
0026
4N
A
ID12
-30
1835
3A-Q
C-0
.02-
1F
0.10
15.
000.
0202
547
200
0.01
399
69.2
6
ID12
-31
1835
3A-Q
C-0
.02-
1F
0.10
15.
000.
0202
540
200
0.01
382
68.4
3
ID12
-32
1835
4A-T
-1T
5.00
8638
2000
2.07
0
ID12
-33
1835
4A-T
-1T
5.00
9389
2000
2.24
8894
ID12
-34
1835
5A-T
-1T
5.00
8932
2000
2.13
9890
ID12
-35
1835
5A-T
-1T
5.00
9260
2000
2.21
8125
NO
TE
S*1
: C=
Con
trol
, F=
Fort
ifie
d, T
=T
reat
ed*2
: Spi
ke a
mou
nt =
(S
pike
add
ed)
÷ (S
ampl
e w
eigh
t)
*3: R
esid
ue a
mou
nt =
[(A
rea
- b)
÷ m
] x
(Fin
al v
ol/S
ampl
e w
t)*4
. Rec
over
y (%
) =
(Res
idue
fou
nd)
÷ (s
pike
con
c) *
100
"NA
" st
ands
for
"N
ot a
pplic
able
"
Attachment B: Calculation Worksheets, Standard Curves and LOD/LOQ Calculations
IR-4 North Central Region Laboratory, Michigan State University Analytical Summary Report PR# 09358
Page 99

PR
OJE
CT
IN
FO
RM
AT
ION
PR
Num
ber:
09
358
Lab
orat
ory
ID:
0935
8.11
-MIR
05C
hem
ical
: F
loni
cam
idF
ield
ID
No.
: 09
358.
11-I
D12
Ana
lysi
s fo
r:
TF
NG
Fie
ld R
esea
rch
Dir
ecto
r:
Wil
l Mee
ksC
omm
odit
y:
Min
tA
naly
st(s
):
Ein
a A
bouz
ied&
Les
ter
Gei
ssel
Cro
p pa
rt:
Min
t Top
s (l
eave
s&st
ems)
Inst
rum
ent:
U
PL
C/M
S/M
S
CA
LIB
RA
TIO
N D
AT
AD
ate
of c
alib
rati
on a
naly
sis:
24
-Jul
-12
RT
SD
BP
eak
----
----
Pag
eID
(or
nam
e)C
onc.
(µg/
mL
)A
rea
ID12
-21
A30
7G-2
70.
0000
9550
130
Typ
e:
Lin
ear
regr
essi
onID
12-2
2A
307G
-26
0.00
0191
018
7E
quat
ion:
y
= m
x+
bID
12-2
3A
307G
-25
0.00
0477
581
8S
lope
, m =
2277
092
ID12
-24
A30
7G-2
40.
0009
5500
1786
Inte
rcep
t, b
=-1
82.2
8ID
12-2
5A
307G
-23
0.00
1910
038
82R
² =0.
9983
ID12
-26
A30
7G-2
20.
0047
7510
535
LO
Q (
µg/
g) =
0.02
ID12
-38
A30
7G-2
20.
0047
7510
941
ID12
-39
A30
7G-2
30.
0019
100
4268
ID12
-40
A30
7G-2
40.
0009
5500
2111
ID12
-41A
A30
7G-2
50.
0004
775
900
ID12
-42
A30
7G-2
60.
0001
910
348
ID12
-43A
A30
7G-2
70.
0000
9550
180
AN
AL
YT
ICA
L D
AT
AE
xtra
ctio
n da
te:
24-J
ul-1
2A
naly
sis
date
:24
-Jul
-12
RT
SD
BS
amp l
eS
ampl
eS
pike
Sam
ple
Spi
keP
eak
Fin
alR
esid
ueS
pike
Pag
eID
Typ
eA
dded
Wei
ght
Con
c.A
rea
Vol
ume
Fou
ndR
ecov
ery
CA
LC
UL
AT
ION
PA
GE
Cal
ibra
tion
sta
ndar
d--
----
----
----
--
y =
227
7091
.581
9x -
182.
2796
R² =
0.9
983
0
1000
2000
3000
4000
5000
6000
7000
8000
9000
1000
0
1100
0
1200
0 0.00
00.
001
0.00
20.
003
0.00
40.
005
0.00
6
Peak area
Sta
ndar
d C
onc.
(µ
g/m
L)
No.
*1(µ
g)(g
)(µ
g/g)
*2(c
ount
s)(m
L)
(µg/
g)*3
(%)*
4ID
12-2
818
353A
-C-1
CN
A5.
00N
A28
020
00.
0081
2N
AID
12-2
918
353A
-C-1
CN
A5.
00N
A30
620
00.
0085
8N
A
ID12
-30
1835
3A-Q
C-0
.02-
1F
0.09
555.
000.
0191
1054
200
0.02
1711
3.70
ID12
-31
1835
3A-Q
C-0
.02-
1F
0.09
555.
000.
0191
1058
200
0.02
1811
4.07
ID12
-32
1835
4A-T
-1T
5.00
1851
2000
0.35
72
ID12
-33
1835
4A-T
-1T
5.00
1962
2000
0.37
67
ID12
-34
1835
5A-T
-1T
5.00
1823
2000
0.35
23
ID12
-35
1835
5A-T
-1T
5.00
1880
2000
0.36
23
NO
TE
S*1
: C=
Con
trol
, F=
Fort
ifie
d, T
=T
reat
ed*2
: Spi
ke a
mou
nt =
(S
pike
add
ed)
÷ (S
ampl
e w
eigh
t)
*3: R
esid
ue a
mou
nt =
[(A
rea
- b)
÷ m
] x
(Fin
al v
ol/S
ampl
e w
t)*4
. Rec
over
y (%
) =
(Res
idue
fou
nd)
÷ (s
pike
con
c) *
100
"NA
" st
ands
for
"N
ot a
pplic
able
"
Attachment B: Calculation Worksheets, Standard Curves and LOD/LOQ Calculations
IR-4 North Central Region Laboratory, Michigan State University Analytical Summary Report PR# 09358
Page 100

PR
OJE
CT
IN
FO
RM
AT
ION
PR
Num
ber:
09
358
Lab
orat
ory
ID:
0935
8.11
-MIR
05C
hem
ical
: F
loni
cam
idF
ield
ID
No.
: 09
358.
11-I
D12
Ana
lysi
s fo
r:
TF
NA
Fie
ld R
esea
rch
Dir
ecto
r:
Will
Mee
ksC
omm
odity
: M
int
Ana
lyst
(s):
E
ina
Abo
uzie
d&L
este
r G
eiss
elC
rop
part
: M
int T
ops
(lea
ves&
stem
s)In
stru
men
t: U
PL
C/M
S/M
SC
AL
IBR
AT
ION
DA
TA
Dat
e of
cal
ibra
tion
anal
ysis
: 24
-Jul
-12
RT
SD
BP
eak
----
----
Pag
eID
(or
nam
e)C
onc.
(µg/
mL
)A
rea
ID12
-21
A30
7G-2
70.
0001
001
154
Typ
e:
Lin
ear
regr
essi
onID
12-2
2A
307G
-26
0.00
0200
223
1E
quat
ion:
y
= m
x+
bID
12-2
3A
307G
-25
0.00
0500
570
3S
lope
, m =
1594
331
ID12
-24
A30
7G-2
40.
0010
0113
88In
terc
ept,
b =
-75.
36ID
12-2
5A
307G
-23
0.00
2002
030
31R
² =0.
9992
ID12
-26
A30
7G-2
20.
0050
0577
92L
OQ
(µ
g/g)
=0.
02ID
12-3
8A
307G
-22
0.00
5005
8050
ID12
-39
A30
7G-2
30.
0020
020
3186
ID12
-40
A30
7G-2
40.
0010
0115
14ID
12-4
1A
307G
-25
0.00
0500
571
5ID
12-4
2A
307G
-26
0.00
0200
228
2ID
12-4
3A
307G
-27
0.00
0100
113
8
AN
AL
YT
ICA
L D
AT
AE
xtra
ctio
n da
te:
24-J
ul-1
2A
naly
sis
date
:24
-Jul
-12
RT
SD
BS
ampl
eS
ampl
eS
pike
Sam
ple
Spi
keP
eak
Fin
alR
esid
ueS
pike
Pag
eID
Typ
eA
dded
Wei
ght
Con
c.A
rea
Vol
ume
Fou
ndR
ecov
ery
No.
*1(µ
g)(g
)(µ
g/g)
*2(c
ount
s)(m
L)
(µg/
g)*3
(%)*
4
CA
LC
UL
AT
ION
PA
GE
Cal
ibra
tion
stan
dard
----
----
----
----
y =
159
4331
.310
7x -
75.3
576
R² =
0.9
992
0
1000
2000
3000
4000
5000
6000
7000
8000
9000
0.00
00.
001
0.00
20.
003
0.00
40.
005
0.00
6
Peak area
Sta
nd
ard
Con
c. (
µg/
mL
)
ID12
-28
1835
3A-C
-1C
NA
5.00
NA
8420
00.
0040
0N
A
ID12
-29
1835
3A-C
-1C
NA
5.00
NA
9820
00.
0043
5N
A
ID12
-30
1835
3A-Q
C-0
.02-
1F
0.10
05.
000.
0200
284
720
00.
0231
411
5.59
ID12
-31
1835
3A-Q
C-0
.02-
1F
0.10
05.
000.
0200
280
820
00.
0221
611
0.70
ID12
-32
1835
4A-T
-1T
5.00
453
2000
0.13
26
ID12
-33
1835
4A-T
-1T
5.00
524
2000
0.15
04
ID12
-34
1835
5A-T
-1T
5.00
401
2000
0.11
95
ID12
-35
1835
5A-T
-1T
5.00
436
2000
0.12
83
NO
TE
S*1
: C=
Con
trol
, F=
Fort
ifie
d, T
=T
reat
ed*2
: Spi
ke a
mou
nt =
(Sp
ike
adde
d) ÷
(Sa
mpl
e w
eigh
t)
*3: R
esid
ue a
mou
nt =
[(A
rea
- b)
÷ m
] x
(Fin
al v
ol/S
ampl
e w
t)*4
. Rec
over
y (%
) =
(Res
idue
fou
nd)
÷ (
spik
e co
nc)
* 10
0
"NA
" st
ands
for
"N
ot a
pplic
able
"
Attachment B: Calculation Worksheets, Standard Curves and LOD/LOQ Calculations
IR-4 North Central Region Laboratory, Michigan State University Analytical Summary Report PR# 09358
Page 101

PR
OJE
CT
IN
FO
RM
AT
ION
PR
Num
ber:
09
358
Lab
orat
ory
ID:
0935
8.11
-MIR
05C
hem
ical
: F
loni
cam
idF
ield
ID
No.
: 09
358.
11-I
D12
Ana
lysi
s fo
r:
TF
NA
-AM
Fie
ld R
esea
rch
Dir
ecto
r:
Wil
l Mee
ks
Com
mod
ity:
M
int
Ana
lyst
(s):
E
ina
Abo
uzie
d&L
este
r G
eiss
elC
rop
part
: M
int T
ops
(lea
ves&
stem
s)In
stru
men
t:
UP
LC
/MS
/MS
CA
LIB
RA
TIO
N D
AT
AD
ate
of c
alib
rati
on a
naly
sis:
25
-Jul
-12
RT
SD
BP
eak
----
----
Pag
eID
(or
nam
e)C
onc.
(µg/
mL
)A
rea
ID12
-51
A30
7G-2
70.
0001
012
69T
ype:
L
inea
r re
gres
sion
ID12
-52
A30
7G-2
60.
0002
024
203
Equ
atio
n:
y=
mx
+ b
ID12
-53
A30
7G-2
50.
0005
060
548
Slo
pe, m
=11
3248
0ID
12-5
4A
307G
-24
0.00
1012
909
Inte
rcep
t, b
=-9
0.57
ID12
-55
A30
7G-2
30.
0020
240
1725
R² =
0.99
13ID
12-5
6A
307G
-22
0.00
5060
5863
LO
Q (
µg/
g) =
0.02
ID12
-67
A30
7G-2
20.
0050
6056
76ID
12-6
8A
307G
-23
0.00
2024
019
86ID
12-6
9A
307G
-24
0.00
1012
1150
ID12
-70A
A30
7G-2
50.
0005
060
593
ID12
-71
A30
7G-2
60.
0002
024
276
ID12
-72
A30
7G-2
70.
0001
012
86
AN
AL
YT
ICA
L D
AT
AE
xtra
ctio
n da
te:
24-J
ul-1
2A
naly
sis
date
:25
-Jul
-12
RT
SD
BS
ampl
eS
ampl
eS
pike
Sam
ple
Spi
keP
eak
Fin
alR
esid
ueS
pike
Pag
eID
Typ
eA
dded
Wei
ght
Con
c.A
rea
Vol
ume
Fou
ndR
ecov
ery
CA
LC
UL
AT
ION
PA
GE
Cal
ibra
tion
sta
ndar
d--
----
----
----
--
y =
113
2479
.619
8x -
90.5
684
R² =
0.9
913
0
1000
2000
3000
4000
5000
6000
7000
0.00
00.
001
0.00
20.
003
0.00
40.
005
0.00
6
Peak area
Sta
ndar
d C
onc.
(µ
g/m
L)
gyp
gy
No.
*1(µ
g)(g
)(µ
g/g)
*2(c
ount
s)(m
L)
(µg/
g)*3
(%)*
4ID
12-5
818
353A
-C-1
CN
A5.
00N
A0
200
< 0
.02
NA
ID12
-59
1835
3A-C
-1C
NA
5.00
NA
020
0<
0.0
2N
A
ID12
-60
1835
3A-Q
C-0
.02-
1F
0.10
15.
000.
0202
341
200
0.01
524
75.3
1
ID12
-61
1835
3A-Q
C-0
.02-
1F
0.10
15.
000.
0202
376
200
0.01
648
81.4
2
ID12
-62
1835
4A-T
-1T
5.00
040
00<
0.0
2
ID12
-63
1835
4A-T
-1T
5.00
5440
000.
1021
ID12
-64
1835
5A-T
-1T
5.00
6540
000.
1099
ID12
-65
1835
5A-T
-1T
5.00
121
4000
0.14
95
NO
TE
S*1
: C=
Con
trol
, F=
Fort
ifie
d, T
=T
reat
ed*2
: Spi
ke a
mou
nt =
(S
pike
add
ed)
÷ (S
ampl
e w
eigh
t)*3
: Res
idue
am
ount
= [
(Are
a -
b) ÷
m]
x (F
inal
vol
/Sam
ple
wt)
*4. R
ecov
ery
(%)
=(R
esid
ue f
ound
) ÷
(spi
ke c
onc)
* 1
00"N
A"
stan
ds f
or "
Not
app
licab
le"
Attachment B: Calculation Worksheets, Standard Curves and LOD/LOQ Calculations
IR-4 North Central Region Laboratory, Michigan State University Analytical Summary Report PR# 09358
Page 102

PR
OJE
CT
IN
FO
RM
AT
ION
PR
Num
ber:
09
358
Lab
orat
ory
ID:
0935
8.11
-MIR
05C
hem
ical
: F
loni
cam
i dF
ield
ID
No.
: 09
358.
11-I
D12
Ana
lysi
s fo
r:
Flo
nica
mid
(IK
I-22
0)F
ield
Res
earc
h D
irec
tor:
W
ill M
eeks
Com
mod
ity:
M
int
Ana
lyst
(s):
E
ina
Abo
uzie
d&L
este
r G
eiss
el
Cro
p pa
rt:
Min
t Top
s (l
eave
s&st
ems)
Inst
rum
ent:
U
PL
C/M
S/M
SC
AL
IBR
AT
ION
DA
TA
Dat
e of
cal
ibra
tion
ana
lysi
s:
25-J
ul-1
2R
TSD
BP
eak
----
----
Pag
eID
(or
nam
e)C
onc.
(µg/
mL
)A
rea
ID12
-51
A30
7G-2
70.
0001
010
129
Typ
e:
Lin
ear
regr
essi
onID
12-5
2A
307G
-26
0.00
0202
025
1E
quat
ion:
y
= m
x+
bID
12-5
3A
307G
-25
0.00
0505
073
6S
lope
, m =
1579
811
ID12
-54
A30
7G-2
40.
0010
1014
28In
terc
ept,
b =
-7.8
9ID
12-5
5A
307G
-23
0.00
2020
030
29R
² =
0.99
49ID
12-5
6A
307G
-22
0.00
5050
7596
LO
Q (
µg/
g) =
0.02
ID12
-67
A30
7G-2
20.
0050
5082
75ID
12-6
8A
307G
-23
0.00
2020
035
86ID
12-6
9A
307G
-24
0.00
1010
1610
ID12
-70
A30
7G-2
50.
0005
050
831
ID12
-71
A30
7G-2
60.
0002
020
337
ID12
-72
A30
7G-2
70.
0001
010
180
AN
AL
YT
ICA
L D
AT
AE
xtra
ctio
n da
te:
24-J
ul-1
2A
naly
sis
date
:25
-Jul
-12
RT
SD
BS
ampl
eS
ampl
eS
pike
Sam
ple
Spi
keP
eak
Fin
alR
esid
ueS
pike
Pag
eID
Typ
eA
dded
Wei
ght
Con
c.A
rea
Vol
ume
Fou
ndR
ecov
ery
No
*1(µ
g)(g
)(µ
g/g)
*2(c
ount
s)(m
L)
(µg/
g)*3
(%)*
4
CA
LC
UL
AT
ION
PA
GE
Cal
ibra
tion
sta
ndar
d--
----
----
----
--
y =
157
9811
.315
7x -
7.89
38R
² = 0
.994
9
0
1000
2000
3000
4000
5000
6000
7000
8000
9000
0.00
00.
001
0.00
20.
003
0.00
40.
005
0.00
6
Peak area
Sta
nd
ard
Con
c. (
µg/
mL
)
No.
1(µ
g)(g
)(µ
g/g)
2(c
ount
s)(m
L)
(µg/
g)3
(%)
4
ID12
-58
1835
3A-C
-1C
NA
5.00
NA
4020
00.
0012
13N
A
ID12
-59
1835
3A-C
-1C
NA
5.00
NA
1420
00.
0005
54N
A
ID12
-60
1835
3A-Q
C-0
.02-
1F
0.10
15.
000.
0202
612
200
0.01
5777
.70
ID12
-61
1835
3A-Q
C-0
.02-
1F
0.10
15.
000.
0202
550
200
0.01
4169
.93
ID12
-62
1835
4A-T
-1T
5.00
4426
4000
2.24
5
ID12
-63
1835
4A-T
-1T
5.00
4678
4000
2.37
3
ID12
-64
1835
5A-T
-1T
5.00
4678
4000
2.37
3
ID12
-65
1835
5A-T
-1T
5.00
4829
4000
2.44
9
NO
TE
S*1
: C=
Con
trol
, F=
Fort
ifie
d, T
=T
reat
ed*2
: Spi
ke a
mou
nt =
(S
pike
add
ed)
÷ (S
ampl
e w
eigh
t)
*3: R
esid
ue a
mou
nt =
[(A
rea
- b)
÷ m
] x
(Fin
al v
ol/S
ampl
e w
t)*4
. Rec
over
y (%
) =
(Res
idue
fou
nd)
÷ (s
pike
con
c) *
100
"NA
" st
ands
for
"N
ot a
pplic
able
"
Attachment B: Calculation Worksheets, Standard Curves and LOD/LOQ Calculations
IR-4 North Central Region Laboratory, Michigan State University Analytical Summary Report PR# 09358
Page 103
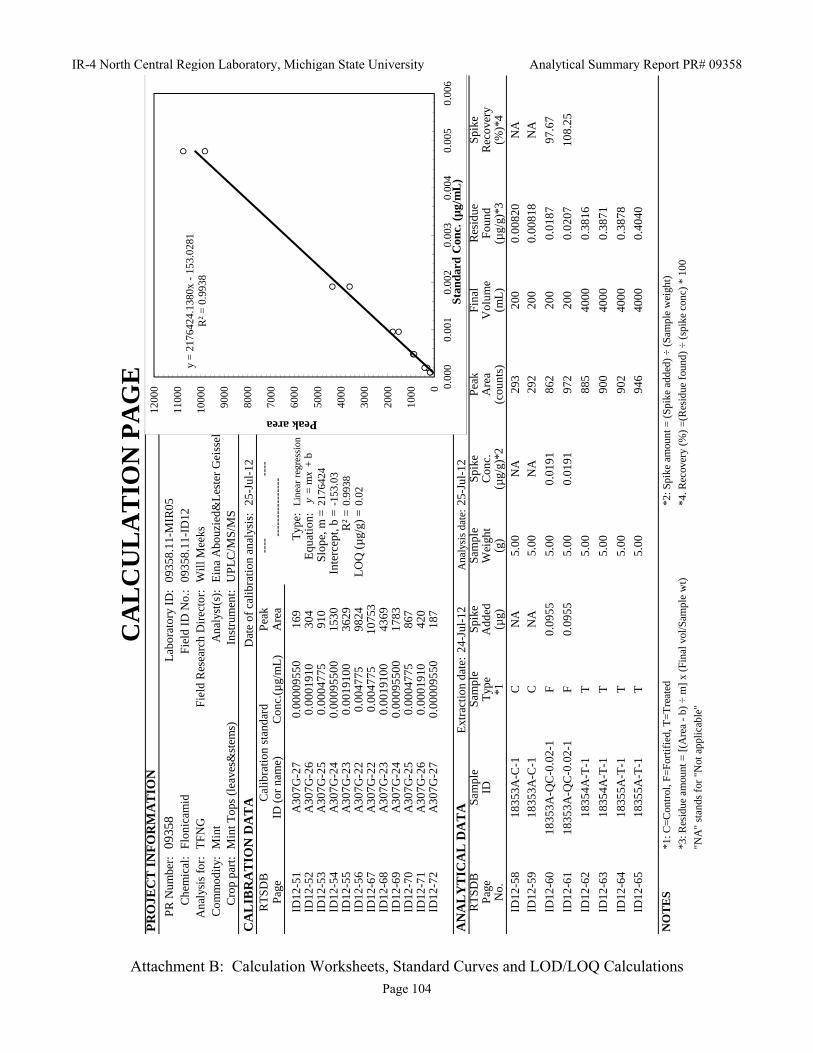
PR
OJE
CT
IN
FO
RM
AT
ION
PR
Num
ber:
09
358
Lab
orat
ory
ID:
0935
8.11
-MIR
05C
hem
ical
: F
loni
cam
idF
ield
ID
No.
: 09
358.
11-I
D12
Ana
lysi
s fo
r:
TF
NG
Fie
ld R
esea
rch
Dir
ecto
r:
Wil
l Mee
ksC
omm
odit
y:
Min
tA
naly
st(s
):
Ein
a A
bouz
ied&
Les
ter
Gei
ssel
Cro
p pa
rt:
Min
t Top
s (l
eave
s&st
ems)
Inst
rum
ent:
U
PL
C/M
S/M
S
CA
LIB
RA
TIO
N D
AT
AD
ate
of c
alib
rati
on a
naly
sis:
25
-Jul
-12
RT
SD
BP
eak
----
----
Pag
eID
(or
nam
e)C
onc.
(µg/
mL
)A
rea
ID12
-51
A30
7G-2
70.
0000
9550
169
Typ
e:
Lin
ear
regr
essi
onID
12-5
2A
307G
-26
0.00
0191
030
4E
quat
ion:
y
= m
x+
bID
12-5
3A
307G
-25
0.00
0477
591
0S
lope
, m =
2176
424
ID12
-54
A30
7G-2
40.
0009
5500
1530
Inte
rcep
t, b
=-1
53.0
3ID
12-5
5A
307G
-23
0.00
1910
036
29R
² =0.
9938
ID12
-56
A30
7G-2
20.
0047
7598
24L
OQ
(µ
g/g)
=0.
02ID
12-6
7A
307G
-22
0.00
4775
1075
3ID
12-6
8A
307G
-23
0.00
1910
043
69ID
12-6
9A
307G
-24
0.00
0955
0017
83ID
12-7
0A
307G
-25
0.00
0477
586
7ID
12-7
1A
307G
-26
0.00
0191
042
0ID
12-7
2A
307G
-27
0.00
0095
5018
7
AN
AL
YT
ICA
L D
AT
AE
xtra
ctio
n da
te:
24-J
ul-1
2A
naly
sis
date
:25
-Jul
-12
RT
SD
BS
amp l
eS
ampl
eS
pike
Sam
ple
Spi
keP
eak
Fin
alR
esid
ueS
pike
Pag
eID
Typ
eA
dded
Wei
ght
Con
c.A
rea
Vol
ume
Fou
ndR
ecov
ery
CA
LC
UL
AT
ION
PA
GE
Cal
ibra
tion
sta
ndar
d--
----
----
----
--
y =
217
6424
.138
0x -
153.
0281
R² =
0.9
938
0
1000
2000
3000
4000
5000
6000
7000
8000
9000
1000
0
1100
0
1200
0 0.00
00.
001
0.00
20.
003
0.00
40.
005
0.00
6
Peak area
Sta
ndar
d C
onc.
(µ
g/m
L)
No.
*1(µ
g)(g
)(µ
g/g)
*2(c
ount
s)(m
L)
(µg/
g)*3
(%)*
4ID
12-5
818
353A
-C-1
CN
A5.
00N
A29
320
00.
0082
0N
AID
12-5
918
353A
-C-1
CN
A5.
00N
A29
220
00.
0081
8N
A
ID12
-60
1835
3A-Q
C-0
.02-
1F
0.09
555.
000.
0191
862
200
0.01
8797
.67
ID12
-61
1835
3A-Q
C-0
.02-
1F
0.09
555.
000.
0191
972
200
0.02
0710
8.25
ID12
-62
1835
4A-T
-1T
5.00
885
4000
0.38
16
ID12
-63
1835
4A-T
-1T
5.00
900
4000
0.38
71
ID12
-64
1835
5A-T
-1T
5.00
902
4000
0.38
78
ID12
-65
1835
5A-T
-1T
5.00
946
4000
0.40
40
NO
TE
S*1
: C=
Con
trol
, F=
Fort
ifie
d, T
=T
reat
ed*2
: Spi
ke a
mou
nt =
(S
pike
add
ed)
÷ (S
ampl
e w
eigh
t)
*3: R
esid
ue a
mou
nt =
[(A
rea
- b)
÷ m
] x
(Fin
al v
ol/S
ampl
e w
t)*4
. Rec
over
y (%
) =
(Res
idue
fou
nd)
÷ (s
pike
con
c) *
100
"NA
" st
ands
for
"N
ot a
pplic
able
"
Attachment B: Calculation Worksheets, Standard Curves and LOD/LOQ Calculations
IR-4 North Central Region Laboratory, Michigan State University Analytical Summary Report PR# 09358
Page 104

PR
OJE
CT
IN
FO
RM
AT
ION
PR
Num
ber:
09
358
Lab
orat
ory
ID:
0935
8.11
-MIR
05C
hem
ical
: F
loni
cam
idF
ield
ID
No.
: 09
358.
11-I
D12
Ana
lysi
s fo
r:
TF
NA
Fie
ld R
esea
rch
Dir
ecto
r:
Will
Mee
ksC
omm
odity
: M
int
Ana
lyst
(s):
E
ina
Abo
uzie
d&L
este
r G
eiss
elC
rop
part
: M
int T
ops
(lea
ves&
stem
s)In
stru
men
t: U
PL
C/M
S/M
SC
AL
IBR
AT
ION
DA
TA
Dat
e of
cal
ibra
tion
anal
ysis
: 25
-Jul
-12
RT
SD
BP
eak
----
----
Pag
eID
(or
nam
e)C
onc.
(µg/
mL
)A
rea
ID12
-51
A30
7G-2
70.
0001
001
97T
ype:
L
inea
r re
gres
sion
ID12
-52
A30
7G-2
60.
0002
002
234
Equ
atio
n:
y=
mx
+ b
ID12
-53
A30
7G-2
50.
0005
005
603
Slo
pe, m
=15
6519
2ID
12-5
4A
307G
-24
0.00
1001
1284
Inte
rcep
t, b
=-6
9.74
ID12
-55
A30
7G-2
30.
0020
020
2993
R² =
0.99
69ID
12-5
6A
307G
-22
0.00
5005
7551
LO
Q (
µg/
g) =
0.02
ID12
-67
A30
7G-2
20.
0050
0579
18ID
12-6
8A
307G
-23
0.00
2002
034
10ID
12-6
9A
307G
-24
0.00
1001
1508
ID12
-70
A30
7G-2
50.
0005
005
690
ID12
-71
A30
7G-2
60.
0002
002
270
ID12
-72
A30
7G-2
70.
0001
001
180
AN
AL
YT
ICA
L D
AT
AE
xtra
ctio
n da
te:
24-J
ul-1
2A
naly
sis
date
:25
-Jul
-12
RT
SD
BS
ampl
eS
ampl
eS
pike
Sam
ple
Spi
keP
eak
Fin
alR
esid
ueS
pike
Pag
eID
Typ
eA
dded
Wei
ght
Con
c.A
rea
Vol
ume
Fou
ndR
ecov
ery
No.
*1(µ
g)(g
)(µ
g/g)
*2(c
ount
s)(m
L)
(µg/
g)*3
(%)*
4
CA
LC
UL
AT
ION
PA
GE
Cal
ibra
tion
stan
dard
----
----
----
----
y =
156
5192
.186
1x -
69.7
442
R² =
0.9
969
0
1000
2000
3000
4000
5000
6000
7000
8000
9000
0.00
00.
001
0.00
20.
003
0.00
40.
005
0.00
6
Peak area
Sta
nd
ard
Con
c. (
µg/
mL
)
ID12
-58
1835
3A-C
-1C
NA
5.00
NA
7920
00.
0038
0N
A
ID12
-59
1835
3A-C
-1C
NA
5.00
NA
124
200
0.00
495
NA
ID12
-60
1835
3A-Q
C-0
.02-
1F
0.10
05.
000.
0200
275
320
00.
0210
105.
03
ID12
-61
1835
3A-Q
C-0
.02-
1F
0.10
05.
000.
0200
282
020
00.
0227
113.
58
ID12
-62
1835
4A-T
-1T
5.00
189
4000
0.13
225
ID12
-63
1835
4A-T
-1T
5.00
259
4000
0.16
80
ID12
-64
1835
5A-T
-1T
5.00
216
4000
0.14
60
ID12
-65
1835
5A-T
-1T
5.00
202
4000
0.13
89
NO
TE
S*1
: C=
Con
trol
, F=
Fort
ifie
d, T
=T
reat
ed*2
: Spi
ke a
mou
nt =
(Sp
ike
adde
d) ÷
(Sa
mpl
e w
eigh
t)
*3: R
esid
ue a
mou
nt =
[(A
rea
- b)
÷ m
] x
(Fin
al v
ol/S
ampl
e w
t)*4
. Rec
over
y (%
) =
(Res
idue
fou
nd)
÷ (
spik
e co
nc)
* 10
0
"NA
" st
ands
for
"N
ot a
pplic
able
"
Attachment B: Calculation Worksheets, Standard Curves and LOD/LOQ Calculations
IR-4 North Central Region Laboratory, Michigan State University Analytical Summary Report PR# 09358
Page 105

PR
OJE
CT
IN
FO
RM
AT
ION
PR
Num
ber:
09
358
Lab
orat
ory
ID:
0935
8.11
-MIR
05C
hem
ical
: F
loni
cam
idF
ield
ID
No.
: 09
358.
11-W
A17
Ana
lysi
s fo
r:
TF
NA
-AM
Fie
ld R
esea
rch
Dir
ecto
r:
Dan
Gro
enen
dale
Com
mod
ity:
M
int
Ana
lyst
(s):
E
ina
Abo
uzie
d&L
este
r G
eiss
elC
rop
part
: M
int T
ops
(lea
ves&
stem
s)In
stru
men
t:
UP
LC
/MS
/MS
CA
LIB
RA
TIO
N D
AT
AD
ate
of c
alib
rati
on a
naly
sis:
25
-Jul
-12
RT
SD
BP
eak
----
----
Pag
eID
(or
nam
e)C
onc.
(µg/
mL
)A
rea
WA
17-2
1A
307G
-27
0.00
0101
264
Typ
e:
Lin
ear
regr
essi
onW
A17
-22
A30
7G-2
60.
0002
024
282
Equ
atio
n:
y=
mx
+ b
WA
17-2
3A
307G
-25
0.00
0506
061
7S
lope
, m =
1298
872
WA
17-2
4A
307G
-24
0.00
1012
1061
Inte
rcep
t, b
=-1
29.7
9W
A17
-25
A30
7G-2
30.
0020
240
2069
R² =
0.99
14W
A17
-26
A30
7G-2
20.
0050
6064
15L
OQ
(µ
g/g)
=0.
02W
A17
-37
A30
7G-2
20.
0050
6067
85W
A17
-38
A30
7G-2
30.
0020
240
2149
WA
17-3
9A
307G
-24
0.00
1012
1127
WA
17-4
0A
307G
-25
0.00
0506
062
3W
A17
-41
A30
7G-2
60.
0002
024
266
WA
17-4
2A
307G
-27
0.00
0101
211
9
AN
AL
YT
ICA
L D
AT
AE
xtra
ctio
n da
te:
25-J
ul-1
2A
naly
sis
date
:25
-Jul
-12
RT
SD
BS
ampl
eS
ampl
eS
pike
Sam
ple
Spi
keP
eak
Fin
alR
esid
ueS
pike
Pag
eID
Typ
eA
dded
Wei
ght
Con
c.A
rea
Vol
ume
Fou
ndR
ecov
ery
CA
LC
UL
AT
ION
PA
GE
Cal
ibra
tion
sta
ndar
d--
----
----
----
--
y =
129
8872
.139
2x -
129.
7893
R² =
0.9
914
0
1000
2000
3000
4000
5000
6000
7000
8000
0.00
00.
001
0.00
20.
003
0.00
40.
005
0.00
6
Peak area
Sta
ndar
d C
onc.
(µ
g/m
L)
gyp
gy
No.
*1(µ
g)(g
)(µ
g/g)
*2(c
ount
s)(m
L)
(µg/
g)*3
(%)*
4W
A17
-28
1846
3A-C
-1C
NA
5.00
NA
020
0<
0.0
2N
AW
A17
-29
1846
3A-C
-1C
NA
5.00
NA
020
0<
0.0
2N
A
WA
17-3
018
463A
-QC
-0.0
2-1
F0.
1012
5.00
0.02
0238
720
00.
0159
278
.63
WA
17-3
118
463A
-QC
-0.0
2-1
F0.
1012
5.00
0.02
0240
320
00.
0164
181
.07
WA
17-3
218
464A
-T-1
T5.
0018
840
000.
1957
32
WA
17-3
318
464A
-T-1
T5.
0024
840
000.
2326
9
WA
17-3
418
465A
-T-1
T5.
0027
840
000.
2511
7
WA
17-3
518
465A
-T-1
T5.
0028
740
000.
2567
1
NO
TE
S*1
: C=
Con
trol
, F=
Fort
ifie
d, T
=T
reat
ed*2
: Spi
ke a
mou
nt =
(S
pike
add
ed)
÷ (S
ampl
e w
eigh
t)*3
: Res
idue
am
ount
= [
(Are
a -
b) ÷
m]
x (F
inal
vol
/Sam
ple
wt)
*4. R
ecov
ery
(%)
=(R
esid
ue f
ound
) ÷
(spi
ke c
onc)
* 1
00"N
A"
stan
ds f
or "
Not
app
licab
le"
Attachment B: Calculation Worksheets, Standard Curves and LOD/LOQ Calculations
IR-4 North Central Region Laboratory, Michigan State University Analytical Summary Report PR# 09358
Page 106

PR
OJE
CT
IN
FO
RM
AT
ION
PR
Num
ber:
09
358
Lab
orat
ory
ID:
0935
8.11
-MIR
05C
hem
ical
: F
loni
cam
i dF
ield
ID
No.
: 09
358.
11-W
A17
Ana
lysi
s fo
r:
Flo
nica
mid
(IK
I-22
0)F
ield
Res
earc
h D
irec
tor:
D
an G
roen
enda
leC
omm
odit
y:
Min
tA
naly
st(s
):
Ein
a A
bouz
ied&
Les
ter
Gei
ssel
Cro
p pa
rt:
Min
t Top
s (l
eave
s&st
ems)
Inst
rum
ent:
U
PL
C/M
S/M
SC
AL
IBR
AT
ION
DA
TA
Dat
e of
cal
ibra
tion
ana
lysi
s:
25-J
ul-1
2R
TSD
BP
eak
----
----
Pag
eID
(or
nam
e)C
onc.
(µg/
mL
)A
rea
WA
17-2
1A
307G
-27
0.00
0101
014
1T
ype:
L
inea
r re
gres
sion
WA
17-2
2A
307G
-26
0.00
0202
031
7E
quat
ion:
y
= m
x+
bW
A17
-23
A30
7G-2
50.
0005
050
892
Slo
pe, m
=17
7655
7W
A17
-24
A30
7G-2
40.
0010
1017
60In
terc
ept,
b =
-62.
42W
A17
-25
A30
7G-2
30.
0020
200
3268
R²
=0.
9981
WA
17-2
6A
307G
-22
0.00
5050
9204
LO
Q (
µg/
g) =
0.02
WA
17-3
7A
307G
-22
0.00
5050
8710
WA
17-3
8A
307G
-23
0.00
2020
035
55W
A17
-39
A30
7G-2
40.
0010
1016
17W
A17
-40
A30
7G-2
50.
0005
050
883
WA
17-4
1A
307G
-26
0.00
0202
030
9W
A17
-42
A30
7G-2
70.
0001
010
175
AN
AL
YT
ICA
L D
AT
AE
xtra
ctio
n da
te:
25-J
ul-1
2A
naly
sis
date
:25
-Jul
-12
RT
SD
BS
ampl
eS
ampl
eS
pike
Sam
ple
Spi
keP
eak
Fin
alR
esid
ueS
pike
Pag
eID
Typ
eA
dded
Wei
ght
Con
c.A
rea
Vol
ume
Fou
ndR
ecov
ery
No
*1(µ
g)(g
)(µ
g/g)
*2(c
ount
s)(m
L)
(µg/
g)*3
(%)*
4
CA
LC
UL
AT
ION
PA
GE
Cal
ibra
tion
sta
ndar
d--
----
----
----
--
y =
177
6556
.967
7x -
62.4
231
R² =
0.9
981
0
1000
2000
3000
4000
5000
6000
7000
8000
9000
1000
0 0.00
00.
001
0.00
20.
003
0.00
40.
005
0.00
6
Peak area
Sta
nd
ard
Con
c. (
µg/
mL
)
No.
1(µ
g)(g
)(µ
g/g)
2(c
ount
s)(m
L)
(µg/
g)3
(%)
4
WA
17-2
818
463A
-C-1
CN
A5.
00N
A29
200
0.00
206
NA
WA
17-2
918
463A
-C-1
CN
A5.
00N
A37
200
0.00
224
NA
WA
17-3
018
463A
-QC
-0.0
2-1
F0.
1010
5.00
0.02
020
480
200
0.01
221
60.4
6
WA
17-3
118
463A
-QC
-0.0
2-1
F0.
1010
5.00
0.02
020
474
200
0.01
208
59.7
9
WA
17-3
218
464A
-T-1
T5.
0035
7840
001.
639
WA
17-3
318
464A
-T-1
T5.
0037
1640
001.
701
WA
17-3
418
465A
-T-1
T5.
0038
9140
001.
780
WA
17-3
518
465A
-T-1
T5.
0036
6640
001.
679
NO
TE
S*1
: C=
Con
trol
, F=
Fort
ifie
d, T
=T
reat
ed*2
: Spi
ke a
mou
nt =
(S
pike
add
ed)
÷ (S
ampl
e w
eigh
t)
*3: R
esid
ue a
mou
nt =
[(A
rea
- b)
÷ m
] x
(Fin
al v
ol/S
ampl
e w
t)*4
. Rec
over
y (%
) =
(Res
idue
fou
nd)
÷ (s
pike
con
c) *
100
"NA
" st
ands
for
"N
ot a
pplic
able
"
Attachment B: Calculation Worksheets, Standard Curves and LOD/LOQ Calculations
IR-4 North Central Region Laboratory, Michigan State University Analytical Summary Report PR# 09358
Page 107

PR
OJE
CT
IN
FO
RM
AT
ION
PR
Num
ber:
09
358
Lab
orat
ory
ID:
0935
8.11
-MIR
05C
hem
ical
: F
loni
cam
idF
ield
ID
No.
: 09
358.
11-W
A17
Ana
lysi
s fo
r:
TF
NG
Fie
ld R
esea
rch
Dir
ecto
r:
Dan
Gro
enen
dale
Com
mod
ity:
M
int
Ana
lyst
(s):
E
ina
Abo
uzie
d&L
este
r G
eiss
elC
rop
part
: M
int T
ops
(lea
ves&
stem
s)In
stru
men
t:
UP
LC
/MS
/MS
CA
LIB
RA
TIO
N D
AT
AD
ate
of c
alib
rati
on a
naly
sis:
25
-Jul
-12
RT
SD
BP
eak
----
----
Pag
eID
(or
nam
e)C
onc.
(µg/
mL
)A
rea
WA
17-2
1AA
307G
-27
0.00
0095
5021
4T
ype:
L
inea
r re
gres
sion
WA
17-2
2A
307G
-26
0.00
0191
032
9E
quat
ion:
y
= m
x+
bW
A17
-23
A30
7G-2
50.
0004
775
873
Slo
pe, m
=24
5824
1W
A17
-24
A30
7G-2
40.
0009
5500
2005
Inte
rcep
t, b
=-2
47.5
1W
A17
-25
A30
7G-2
30.
0019
100
3992
R² =
0.99
66W
A17
-26
A30
7G-2
20.
0047
7511
850
LO
Q (
µg/
g) =
0.02
WA
17-3
7A
307G
-22
0.00
4775
1149
0W
A17
-38
A30
7G-2
30.
0019
100
4103
WA
17-3
9A
307G
-24
0.00
0955
0018
97W
A17
-40A
A30
7G-2
50.
0004
775
986
WA
17-4
1AA
307G
-26
0.00
0191
040
0W
A17
-42
A30
7G-2
70.
0000
9550
209
AN
AL
YT
ICA
L D
AT
AE
xtra
ctio
n da
te:
25-J
ul-1
2A
naly
sis
date
:25
-Jul
-12
RT
SD
BS
ampl
eS
ampl
eS
pike
Sam
ple
Spi
keP
eak
Fin
alR
esid
ueS
pike
Pag
eID
Typ
eA
dded
Wei
ght
Con
c.A
rea
Vol
ume
Fou
ndR
ecov
ery
CA
LC
UL
AT
ION
PA
GE
Cal
ibra
tion
sta
ndar
d--
----
----
----
--
y =
245
8240
.604
9x -
247.
5090
R² =
0.9
966
-100
00
1000
2000
3000
4000
5000
6000
7000
8000
9000
1000
0
1100
0
1200
0
1300
0 0.00
00.
001
0.00
20.
003
0.00
40.
005
0.00
6
Peak area
Sta
ndar
d C
onc.
(µ
g/m
L)
No.
*1(µ
g)(g
)(µ
g/g)
*2(c
ount
s)(m
L)
(µg/
g)*3
(%)*
4W
A17
-28
1846
3A-C
-1C
NA
5.00
NA
459
200
0.01
15N
AW
A17
-29
1846
3A-C
-1C
NA
5.00
NA
437
200
0.01
114
NA
WA
17-3
018
463A
-QC
-0.0
2-1
F0.
0955
5.00
0.01
910
1108
200
0.02
206
115.
48
WA
17-3
118
463A
-QC
-0.0
2-1
F0.
0955
5.00
0.01
910
1017
200
0.02
058
107.
73
WA
17-3
218
464A
-T-1
T5.
0010
8540
000.
4336
WA
17-3
318
464A
-T-1
T5.
0011
9140
000.
4681
WA
17-3
418
465A
-T-1
T5.
0011
3740
000.
4506
WA
17-3
518
465A
-T-1
T5.
0012
0440
000.
4724
NO
TE
S*1
: C=
Con
trol
, F=
Fort
ifie
d, T
=T
reat
ed*2
: Spi
ke a
mou
nt =
(S
pike
add
ed)
÷ (S
ampl
e w
eigh
t)
*3: R
esid
ue a
mou
nt =
[(A
rea
- b)
÷ m
] x
(Fin
al v
ol/S
ampl
e w
t)*4
. Rec
over
y (%
) =
(Res
idue
fou
nd)
÷ (s
pike
con
c) *
100
"NA
" st
ands
for
"N
ot a
pplic
able
"
Attachment B: Calculation Worksheets, Standard Curves and LOD/LOQ Calculations
IR-4 North Central Region Laboratory, Michigan State University Analytical Summary Report PR# 09358
Page 108

PR
OJE
CT
IN
FO
RM
AT
ION
PR
Num
ber:
09
358
Lab
orat
ory
ID:
0935
8.11
-MIR
05C
hem
ical
: F
loni
cam
idF
ield
ID
No.
: 09
358.
11-W
A17
Ana
lysi
s fo
r:
TF
NA
Fie
ld R
esea
rch
Dir
ecto
r:
Dan
Gro
enen
dale
Com
mod
ity:
Min
tA
naly
st(s
):
Ein
a A
bouz
ied&
Les
ter
Gei
ssel
Cro
p pa
rt:
Min
t Top
s (l
eave
s&st
ems)
Inst
rum
ent:
UP
LC
/MS
/MS
CA
LIB
RA
TIO
N D
AT
AD
ate
of c
alib
ratio
n an
alys
is:
25-J
ul-1
2R
TS
DB
Pea
k--
----
--P
age
ID (
or n
ame)
Con
c.(µ
g/m
L)
Are
a
WA
17-2
1A
307G
-27
0.00
0100
116
9T
ype:
L
inea
r re
gres
sion
WA
17-2
2A
307G
-26
0.00
0200
226
6E
quat
ion:
y
= m
x+
bW
A17
-23
A30
7G-2
50.
0005
005
692
Slo
pe, m
=17
9056
4W
A17
-24
A30
7G-2
40.
0010
0115
32In
terc
ept,
b =
-120
.45
WA
17-2
5A
307G
-23
0.00
2002
031
74R
² =0.
9986
WA
17-2
6A
307G
-22
0.00
5005
8924
LO
Q (
µg/
g) =
0.02
WA
17-3
7A
307G
-22
0.00
5005
8899
WA
17-3
8A
307G
-23
0.00
2002
034
58W
A17
-39
A30
7G-2
40.
0010
0116
72W
A17
-40
A30
7G-2
50.
0005
005
840
WA
17-4
1A
307G
-26
0.00
0200
230
2W
A17
-42
A30
7G-2
70.
0001
001
172
AN
AL
YT
ICA
L D
AT
AE
xtra
ctio
n da
te:
25-J
ul-1
2A
naly
sis
date
:25
-Jul
-12
RT
SD
BS
ampl
eS
ampl
eS
pike
Sam
ple
Spi
keP
eak
Fin
alR
esid
ueS
pike
Pag
eID
Typ
eA
dded
Wei
ght
Con
c.A
rea
Vol
ume
Fou
ndR
ecov
ery
No.
*1(µ
g)(g
)(µ
g/g)
*2(c
ount
s)(m
L)
(µg/
g)*3
(%)*
4
CA
LC
UL
AT
ION
PA
GE
Cal
ibra
tion
stan
dard
----
----
----
----
y =
179
0563
.786
5x -
120.
4530
R² =
0.9
986
0
1000
2000
3000
4000
5000
6000
7000
8000
9000
1000
0 0.00
00.
001
0.00
20.
003
0.00
40.
005
0.00
6
Peak area
Sta
nd
ard
Con
c. (
µg/
mL
)
WA
17-2
818
463A
-C-1
CN
A5.
00N
A66
200
0.00
417
NA
WA
17-2
918
463A
-C-1
CN
A5.
00N
A57
200
0.00
396
NA
WA
17-3
018
463A
-QC
-0.0
2-1
F0.
1001
5.00
0.02
002
743
200
0.01
9396
.35
WA
17-3
118
463A
-QC
-0.0
2-1
F0.
1001
5.00
0.02
002
777
200
0.02
0010
0.14
WA
17-3
218
464A
-T-1
T5.
0036
440
000.
2164
WA
17-3
318
464A
-T-1
T5.
0038
840
000.
2272
WA
17-3
418
465A
-T-1
T5.
0043
940
000.
2500
WA
17-3
518
465A
-T-1
T5.
0037
240
000.
2200
NO
TE
S*1
: C=
Con
trol
, F=
Fort
ifie
d, T
=T
reat
ed*2
: Spi
ke a
mou
nt =
(Sp
ike
adde
d) ÷
(Sa
mpl
e w
eigh
t)
*3: R
esid
ue a
mou
nt =
[(A
rea
- b)
÷ m
] x
(Fin
al v
ol/S
ampl
e w
t)*4
. Rec
over
y (%
) =
(Res
idue
fou
nd)
÷ (
spik
e co
nc)
* 10
0
"NA
" st
ands
for
"N
ot a
pplic
able
"
Attachment B: Calculation Worksheets, Standard Curves and LOD/LOQ Calculations
IR-4 North Central Region Laboratory, Michigan State University Analytical Summary Report PR# 09358
Page 109

PR
OJE
CT
IN
FO
RM
AT
ION
PR
Num
ber:
09
358
Lab
orat
ory
ID:
0935
8.11
-MIR
05C
hem
ical
: F
loni
cam
idF
ield
ID
No.
for
SS
: 09
358.
11-W
A*1
8A
naly
sis
for:
T
FN
A-A
MF
ield
Res
earc
h D
irec
tor:
Jo
hn H
arve
y
Com
mod
ity:
M
int
Ana
lyst
(s):
E
ina
Abo
uzie
d&L
este
r G
eiss
elC
rop
part
: M
int O
ilIn
stru
men
t:
UP
LC
/MS
/MS
CA
LIB
RA
TIO
N D
AT
AD
ate
of c
alib
rati
on a
naly
sis:
07
-Aug
-12
RT
SD
BP
eak
----
----
Pag
eID
(or
nam
e)C
onc.
(µg/
mL
)A
rea
SS
-10
A30
7G-2
70.
0001
012
185
Typ
e:
Lin
ear
regr
essi
onS
S-1
1A
307G
-26
0.00
0202
435
2E
quat
ion:
y
= m
x+
bS
S-1
2A
307G
-25
0.00
0506
070
8S
lope
, m =
1579
849
SS
-13
A30
7G-2
40.
0010
1214
45In
terc
ept,
b =
-154
.75
SS
-14
A30
7G-2
30.
0020
240
2349
R² =
0.98
61S
S-1
5A
307G
-22
0.00
5060
8173
LO
Q (
µg/
g) =
0.02
SS
-23
A30
7G-2
20.
0050
6080
30S
S-2
4A
307G
-23
0.00
2024
023
65S
S-2
5A
307G
-24
0.00
1012
1353
SS
-26
A30
7G-2
50.
0005
060
781
SS
-27A
A30
7G-2
60.
0002
024
356
SS
-28
A30
7G-2
70.
0001
012
185
AN
AL
YT
ICA
L D
AT
AE
xtra
ctio
n da
te:
07-A
ug-1
2A
naly
sis
date
:07
-Aug
-12
RT
SD
BS
ampl
eS
ampl
eS
pike
Sam
ple
Spi
keP
eak
Fin
alR
esid
ueS
pike
Pa g
eID
Typ
eA
dded
Wei
ght
Con
c.A
rea
Vol
ume
Fou
ndR
ecov
ery
CA
LC
UL
AT
ION
PA
GE
Cal
ibra
tion
sta
ndar
d--
----
----
----
--
y =
157
9848
.828
2x -
154.
7503
R² =
0.9
861
0
1000
2000
3000
4000
5000
6000
7000
8000
9000
0.00
00.
001
0.00
20.
003
0.00
40.
005
0.00
6
Peak area
Sta
ndar
d C
onc.
(µ
g/m
L)
gyp
gy
No.
*1(µ
g)(g
)(µ
g/g)
*2(c
ount
s)(m
L)
(µg/
g)*3
(%)*
4S
S-1
718
470A
-C-3
CN
A5.
00N
A0
200
< 0
.02
NA
SS
-18
1847
0A-Q
C-0
.2-1
F1.
012
5.00
0.20
2411
3810
000.
1637
80.8
6
SS
-19
1847
0A-0
.2-S
S 1
F1.
012
5.00
0.20
2469
610
000.
1077
53.2
1
SS
-20
1847
0A-0
.2-S
S 2
F1.
012
5.00
0.20
2457
410
000.
0923
45.5
8
SS
-21
1847
0A-0
.2-S
S 3
F1.
012
5.00
0.20
2468
910
000.
1068
52.7
7
NO
TE
S*1
: C=
Con
trol
, F=
Fort
ifie
d, T
=T
reat
ed*2
: Spi
ke a
mou
nt =
(S
pike
add
ed)
÷ (S
ampl
e w
eigh
t)*3
: Res
idue
am
ount
= [
(Are
a -
b) ÷
m]
x (F
inal
vol
/Sam
ple
wt)
*4. R
ecov
ery
(%)
=(R
esid
ue f
ound
) ÷
(spi
ke c
onc)
* 1
00"N
A"
stan
ds f
or "
Not
app
licab
le"
Attachment B: Calculation Worksheets, Standard Curves and LOD/LOQ Calculations
IR-4 North Central Region Laboratory, Michigan State University Analytical Summary Report PR# 09358
Page 110

PR
OJE
CT
IN
FO
RM
AT
ION
PR
Num
ber:
09
358
Lab
orat
ory
ID:
0935
8.11
-MIR
05C
hem
ical
: F
loni
cam
i dF
ield
ID
No.
for
SS
: 09
358.
11-W
A*1
8A
naly
sis
for:
F
loni
cam
id (
IKI-
220)
Fie
ld R
esea
rch
Dir
ecto
r:
John
Har
vey
Com
mod
ity:
M
int
Ana
lyst
(s):
E
ina
Abo
uzie
d&L
este
r G
eiss
el
Cro
p pa
rt:
Min
t Oil
Inst
rum
ent:
U
PL
C/M
S/M
SC
AL
IBR
AT
ION
DA
TA
Dat
e of
cal
ibra
tion
ana
lysi
s:
07-A
ug-1
2R
TSD
BP
eak
----
----
Pag
eID
(or
nam
e)C
onc.
(µg/
mL
)A
rea
SS
-10
A30
7G-2
70.
0001
010
207
Typ
e:
Lin
ear
regr
essi
onS
S-1
1A
307G
-26
0.00
0202
049
1E
quat
ion:
y
= m
x+
bS
S-1
2A
307G
-25
0.00
0505
010
62S
lope
, m =
2202
124
SS
-13
A30
7G-2
40.
0010
1023
61In
terc
ept,
b =
29.9
2S
S-1
4A
307G
-23
0.00
2020
044
95R
² =
0.99
97S
S-1
5A
307G
-22
0.00
5050
1120
1L
OQ
(µ
g/g)
=0.
02S
S-2
3A
307G
-22
0.00
5050
1103
0S
S-2
4A
307G
-23
0.00
2020
045
79S
S-2
5A
307G
-24
0.00
1010
2333
SS
-26
A30
7G-2
50.
0005
050
1118
SS
-27
A30
7G-2
60.
0002
020
412
SS
-28
A30
7G-2
70.
0001
010
215
AN
AL
YT
ICA
L D
AT
AE
xtra
ctio
n da
te:
07-A
ug-1
2A
naly
sis
date
:07
-Aug
-12
RT
SD
BS
ampl
eS
ampl
eS
pike
Sam
ple
Spi
keP
eak
Fin
alR
esid
ueS
pike
Pag
eID
Typ
eA
dded
Wei
ght
Con
c.A
rea
Vol
ume
Fou
ndR
ecov
ery
No
*1(µ
g)(g
)(µ
g/g)
*2(c
ount
s)(m
L)
(µg/
g)*3
(%)*
4
CA
LC
UL
AT
ION
PA
GE
Cal
ibra
tion
sta
ndar
d--
----
----
----
--
y =
220
2124
.026
1x +
29.
9203
R² =
0.9
997
0
1000
2000
3000
4000
5000
6000
7000
8000
9000
1000
0
1100
0
1200
0 0.00
00.
001
0.00
20.
003
0.00
40.
005
0.00
6
Peak area
Sta
nd
ard
Con
c. (
µg/
mL
)
No.
1(µ
g)(g
)(µ
g/g)
2(c
ount
s)(m
L)
(µg/
g)3
(%)
4
SS
-17
1847
0A-C
-3C
NA
5.00
NA
820
0-0
.000
3981
66N
A
SS
-18
1847
0A-Q
C-0
.2-1
F1.
010
5.00
0.20
2021
3910
000.
1915
94.8
3
SS
-19
1847
0A-0
.2-S
S 1
F1.
006
5.00
0.20
1210
5010
000.
0926
46.0
5
SS
-20
1847
0A-0
.2-S
S 2
F1.
006
5.00
0.20
1298
810
000.
0870
43.2
5
SS
-21
1847
0A-0
.2-S
S 3
F1.
006
5.00
0.20
1299
210
000.
0874
43.4
3
NO
TE
S*1
: C=
Con
trol
, F=
Fort
ifie
d, T
=T
reat
ed*2
: Spi
ke a
mou
nt =
(S
pike
add
ed)
÷ (S
ampl
e w
eigh
t)
*3: R
esid
ue a
mou
nt =
[(A
rea
- b)
÷ m
] x
(Fin
al v
ol/S
ampl
e w
t)*4
. Rec
over
y (%
) =
(Res
idue
fou
nd)
÷ (s
pike
con
c) *
100
"NA
" st
ands
for
"N
ot a
pplic
able
"
Attachment B: Calculation Worksheets, Standard Curves and LOD/LOQ Calculations
IR-4 North Central Region Laboratory, Michigan State University Analytical Summary Report PR# 09358
Page 111
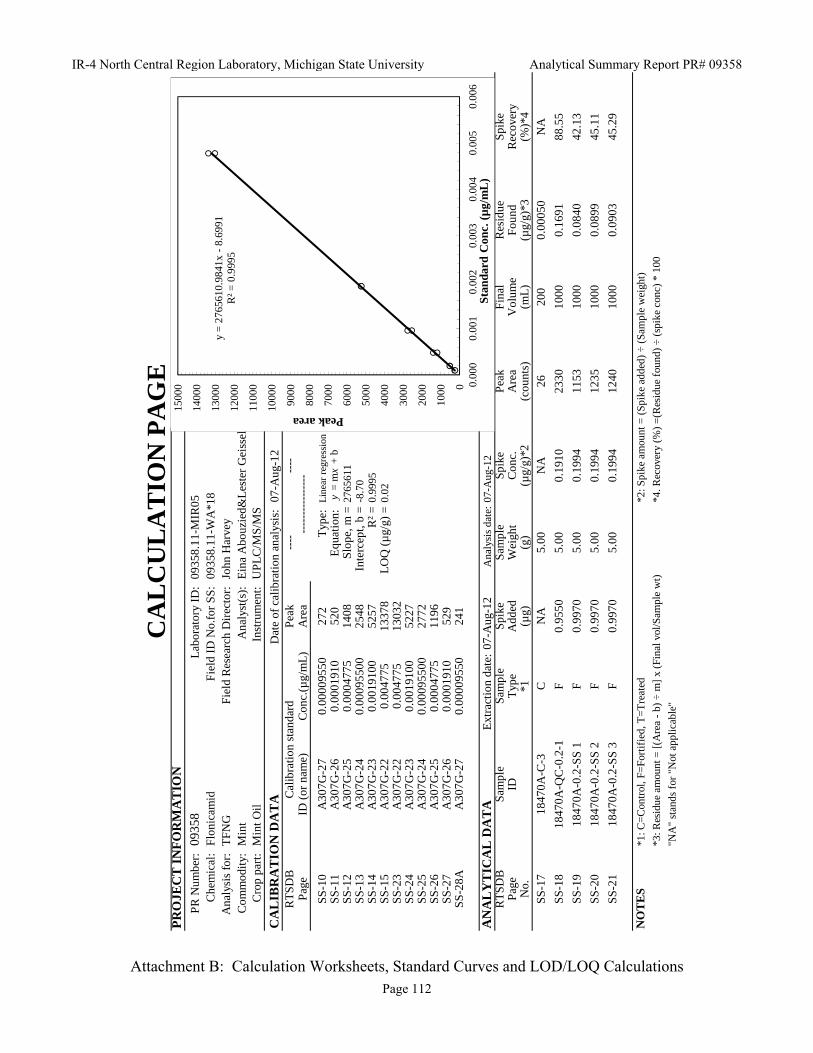
PR
OJE
CT
IN
FO
RM
AT
ION
PR
Num
ber:
09
358
Lab
orat
ory
ID:
0935
8.11
-MIR
05C
hem
ical
: F
loni
cam
idF
ield
ID
No.
for
SS
: 09
358.
11-W
A*1
8A
naly
sis
for:
T
FN
GF
ield
Res
earc
h D
irec
tor:
Jo
hn H
arve
yC
omm
odit
y:
Min
tA
naly
st(s
):
Ein
a A
bouz
ied&
Les
ter
Gei
ssel
Cro
p pa
rt:
Min
t Oil
Inst
rum
ent:
U
PL
C/M
S/M
S
CA
LIB
RA
TIO
N D
AT
AD
ate
of c
alib
rati
on a
naly
sis:
07
-Aug
-12
RT
SD
BP
eak
----
----
Pag
eID
(or
nam
e)C
onc.
(µg/
mL
)A
rea
SS
-10
A30
7G-2
70.
0000
9550
272
Typ
e:
Lin
ear
regr
essi
onS
S-1
1A
307G
-26
0.00
0191
052
0E
quat
ion:
y
= m
x+
bS
S-1
2A
307G
-25
0.00
0477
514
08S
lope
, m =
2765
611
SS
-13
A30
7G-2
40.
0009
5500
2548
Inte
rcep
t, b
=-8
.70
SS
-14
A30
7G-2
30.
0019
100
5257
R² =
0.99
95S
S-1
5A
307G
-22
0.00
4775
1337
8L
OQ
(µ
g/g)
=0.
02S
S-2
3A
307G
-22
0.00
4775
1303
2S
S-2
4A
307G
-23
0.00
1910
052
27S
S-2
5A
307G
-24
0.00
0955
0027
72S
S-2
6A
307G
-25
0.00
0477
511
96S
S-2
7A
307G
-26
0.00
0191
052
9S
S-2
8AA
307G
-27
0.00
0095
5024
1
AN
AL
YT
ICA
L D
AT
AE
xtra
ctio
n da
te:
07-A
ug-1
2A
naly
sis
date
:07
-Aug
-12
RT
SD
BS
ampl
eS
ampl
eS
pike
Sam
ple
Spi
keP
eak
Fin
alR
esid
ueS
pike
Pag
eID
Typ
eA
dded
Wei
ght
Con
c.A
rea
Vol
ume
Fou
ndR
ecov
ery
CA
LC
UL
AT
ION
PA
GE
Cal
ibra
tion
sta
ndar
d--
----
----
----
--
y =
276
5610
.984
1x -
8.69
91R
² = 0
.999
5
0
1000
2000
3000
4000
5000
6000
7000
8000
9000
1000
0
1100
0
1200
0
1300
0
1400
0
1500
0 0.00
00.
001
0.00
20.
003
0.00
40.
005
0.00
6
Peak area
Sta
ndar
d C
onc.
(µ
g/m
L)
No.
*1(µ
g)(g
)(µ
g/g)
*2(c
ount
s)(m
L)
(µg/
g)*3
(%)*
4S
S-1
718
470A
-C-3
CN
A5.
00N
A26
200
0.00
050
NA
SS
-18
1847
0A-Q
C-0
.2-1
F0.
9550
5.00
0.19
1023
3010
000.
1691
88.5
5
SS
-19
1847
0A-0
.2-S
S 1
F0.
9970
5.00
0.19
9411
5310
000.
0840
42.1
3
SS
-20
1847
0A-0
.2-S
S 2
F0.
9970
5.00
0.19
9412
3510
000.
0899
45.1
1
SS
-21
1847
0A-0
.2-S
S 3
F0.
9970
5.00
0.19
9412
4010
000.
0903
45.2
9
NO
TE
S*1
: C=
Con
trol
, F=
Fort
ifie
d, T
=T
reat
ed*2
: Spi
ke a
mou
nt =
(S
pike
add
ed)
÷ (S
ampl
e w
eigh
t)
*3: R
esid
ue a
mou
nt =
[(A
rea
- b)
÷ m
] x
(Fin
al v
ol/S
ampl
e w
t)*4
. Rec
over
y (%
) =
(Res
idue
fou
nd)
÷ (s
pike
con
c) *
100
"NA
" st
ands
for
"N
ot a
pplic
able
"
Attachment B: Calculation Worksheets, Standard Curves and LOD/LOQ Calculations
IR-4 North Central Region Laboratory, Michigan State University Analytical Summary Report PR# 09358
Page 112

PR
OJE
CT
IN
FO
RM
AT
ION
PR
Num
ber:
09
358
Lab
orat
ory
ID:
0935
8.11
-MIR
05C
hem
ical
: F
loni
cam
idF
ield
ID
No.
for
SS
: 09
358.
11-W
A*1
8
Ana
lysi
s fo
r:
TF
NA
Fie
ld R
esea
rch
Dir
ecto
r:
John
Har
vey
Com
mod
ity:
Min
tA
naly
st(s
):
Ein
a A
bouz
ied&
Les
ter
Gei
ssel
Cro
p pa
rt:
Min
t Oil
Inst
rum
ent:
UP
LC
/MS
/MS
CA
LIB
RA
TIO
N D
AT
AD
ate
of c
alib
ratio
n an
alys
is:
07-A
ug-1
2R
TS
DB
Pea
k--
----
--P
age
ID (
or n
ame)
Con
c.(µ
g/m
L)
Are
a
SS
-10
A30
7G-2
70.
0001
001
209
Typ
e:
Lin
ear
regr
essi
onS
S-1
1A
307G
-26
0.00
0200
238
4E
quat
ion:
y
= m
x+
bS
S-1
2A
307G
-25
0.00
0500
593
5S
lope
, m =
2049
562
SS
-13
A30
7G-2
40.
0010
0119
61In
terc
ept,
b =
-79.
70S
S-1
4A
307G
-23
0.00
2002
038
32R
² =0.
9990
SS
-15
A30
7G-2
20.
0050
0510
410
LO
Q (
µg/
g) =
0.02
SS
-23
A30
7G-2
20.
0050
0510
098
SS
-24
A30
7G-2
30.
0020
020
3848
SS
-25
A30
7G-2
40.
0010
0119
36S
S-2
6A
307G
-25
0.00
0500
592
4S
S-2
7A
307G
-26
0.00
0200
239
3S
S-2
8A
307G
-27
0.00
0100
122
2
AN
AL
YT
ICA
L D
AT
AE
xtra
ctio
n da
te:
07-A
ug-1
2A
naly
sis
date
:07
-Aug
-12
RT
SD
BS
ampl
eS
ampl
eS
pike
Sam
ple
Spi
keP
eak
Fin
alR
esid
ueS
pike
Pag
eID
Typ
eA
dded
Wei
ght
Con
c.A
rea
Vol
ume
Fou
ndR
ecov
ery
No.
*1(µ
g)(g
)(µ
g/g)
*2(c
ount
s)(m
L)
(µg/
g)*3
(%)*
4
CA
LC
UL
AT
ION
PA
GE
Cal
ibra
tion
stan
dard
----
----
----
----
y =
204
9562
.166
5x -
79.6
972
R² =
0.9
990
0
1000
2000
3000
4000
5000
6000
7000
8000
9000
1000
0
1100
0 0.00
00.
001
0.00
20.
003
0.00
40.
005
0.00
6
Peak area
Sta
nd
ard
Con
c. (
µg/
mL
)
SS
-17
1847
0A-C
-3C
NA
5.00
NA
200
< 0
.02
NA
SS
-18
1847
0A-Q
C-0
.2-1
F1.
001
5.00
0.20
0219
6810
000.
1998
99.8
1
SS
-19
1847
0A-0
.2-S
S 1
F1.
001
5.00
0.20
0278
610
000.
0845
42.2
0
SS
-20
1847
0A-0
.2-S
S 2
F1.
001
5.00
0.20
0291
810
000.
0974
48.6
3
SS
-21
1847
0A-0
.2-S
S 3
F1.
001
5.00
0.20
0283
610
000.
0894
44.6
3
NO
TE
S*1
: C=
Con
trol
, F=
Fort
ifie
d, T
=T
reat
ed*2
: Spi
ke a
mou
nt =
(Sp
ike
adde
d) ÷
(Sa
mpl
e w
eigh
t)
*3: R
esid
ue a
mou
nt =
[(A
rea
- b)
÷ m
] x
(Fin
al v
ol/S
ampl
e w
t)*4
. Rec
over
y (%
) =
(Res
idue
fou
nd)
÷ (
spik
e co
nc)
* 10
0
"NA
" st
ands
for
"N
ot a
pplic
able
"
Attachment B: Calculation Worksheets, Standard Curves and LOD/LOQ Calculations
IR-4 North Central Region Laboratory, Michigan State University Analytical Summary Report PR# 09358
Page 113

PR
OJE
CT
IN
FO
RM
AT
ION
PR
Num
ber:
09
358
Lab
orat
ory
ID:
0935
8.11
-MIR
05C
hem
ical
: F
loni
cam
idF
ield
ID
No.
for
SS
: 09
358.
11-I
D12
Ana
lysi
s fo
r:
TF
NA
-AM
Fie
ld R
esea
rch
Dir
ecto
r:
Wil
l Mee
ks
Com
mod
ity:
M
int
Ana
lyst
(s):
E
ina
Abo
uzie
d&L
este
r G
eiss
elC
rop
part
: M
int T
ops
(lea
ves&
stem
s)In
stru
men
t:
UP
LC
/MS
/MS
CA
LIB
RA
TIO
N D
AT
AD
ate
of c
alib
rati
on a
naly
sis:
08
-Aug
-12
RT
SD
BP
eak
----
----
Pag
eID
(or
nam
e)C
onc.
(µg/
mL
)A
rea
SS
-39
A30
7G-2
70.
0001
012
276
Typ
e:
Lin
ear
regr
essi
onS
S-4
0A
307G
-26
0.00
0202
434
3E
quat
ion:
y
= m
x+
bS
S-4
1A
307G
-25
0.00
0506
080
4S
lope
, m =
1398
198
SS
-42
A30
7G-2
40.
0010
1215
37In
terc
ept,
b =
30.2
0S
S-4
3A
307G
-23
0.00
2024
024
81R
² =0.
9953
SS
-44
A30
7G-2
20.
0050
6074
09L
OQ
(µ
g/g)
=0.
02S
S-5
2A
307G
-22
0.00
5060
7017
SS
-53
A30
7G-2
30.
0020
240
2650
SS
-54
A30
7G-2
40.
0010
1213
68S
S-5
5A
307G
-25
0.00
0506
076
9S
S-5
6A
307G
-26
0.00
0202
438
2S
S-5
7A
307G
-27
0.00
0101
223
0
AN
AL
YT
ICA
L D
AT
AE
xtra
ctio
n da
te:
08-A
ug-1
2A
naly
sis
date
:08
-Aug
-12
RT
SD
BS
ampl
eS
ampl
eS
pike
Sam
ple
Spi
keP
eak
Fin
alR
esid
ueS
pike
Pa g
eID
Typ
eA
dded
Wei
ght
Con
c.A
rea
Vol
ume
Fou
ndR
ecov
ery
CA
LC
UL
AT
ION
PA
GE
Cal
ibra
tion
sta
ndar
d--
----
----
----
--
y =
139
8197
.672
4x +
30.
2018
R² =
0.9
953
0
1000
2000
3000
4000
5000
6000
7000
8000
0.00
00.
001
0.00
20.
003
0.00
40.
005
0.00
6
Peak area
Sta
ndar
d C
onc.
(µ
g/m
L)
gyp
gy
No.
*1(µ
g)(g
)(µ
g/g)
*2(c
ount
s)(m
L)
(µg/
g)*3
(%)*
4S
S-4
618
352A
-C-1
CN
A5.
00N
A0
200
< 0
.02
NA
SS
-47
1835
2A-Q
C-0
.2-1
F1.
012
5.00
0.20
2411
7710
000.
1640
81.0
5
SS
-48
1835
2A-0
.2-S
S 1
F1.
012
5.00
0.20
2411
6810
000.
1628
80.4
1
SS
-49
1835
2A-0
.2-S
S 2
F1.
012
5.00
0.20
2410
9710
000.
1526
75.3
9
SS
-50
1835
2A-0
.2-S
S 3
F1.
012
5.00
0.20
2411
9510
000.
1666
82.3
2
NO
TE
S*1
: C=
Con
trol
, F=
Fort
ifie
d, T
=T
reat
ed*2
: Spi
ke a
mou
nt =
(S
pike
add
ed)
÷ (S
ampl
e w
eigh
t)*3
: Res
idue
am
ount
= [
(Are
a -
b) ÷
m]
x (F
inal
vol
/Sam
ple
wt)
*4. R
ecov
ery
(%)
=(R
esid
ue f
ound
) ÷
(spi
ke c
onc)
* 1
00"N
A"
stan
ds f
or "
Not
app
licab
le"
Attachment B: Calculation Worksheets, Standard Curves and LOD/LOQ Calculations
IR-4 North Central Region Laboratory, Michigan State University Analytical Summary Report PR# 09358
Page 114

PR
OJE
CT
IN
FO
RM
AT
ION
PR
Num
ber:
09
358
Lab
orat
ory
ID:
0935
8.11
-MIR
05C
hem
ical
: F
loni
cam
i dF
ield
ID
No.
for
SS
: 09
358.
11-I
D12
Ana
lysi
s fo
r:
Flo
nica
mid
(IK
I-22
0)F
ield
Res
earc
h D
irec
tor:
W
ill M
eeks
Com
mod
ity:
M
int
Ana
lyst
(s):
E
ina
Abo
uzie
d&L
este
r G
eiss
el
Cro
p pa
rt:
Min
t Top
s (l
eave
s&st
ems)
Inst
rum
ent:
U
PL
C/M
S/M
SC
AL
IBR
AT
ION
DA
TA
Dat
e of
cal
ibra
tion
ana
lysi
s:
08-A
ug-1
2R
TSD
BP
eak
----
----
Pag
eID
(or
nam
e)C
onc.
(µg/
mL
)A
rea
SS
-39
A30
7G-2
70.
0001
010
224
Typ
e:
Lin
ear
regr
essi
onS
S-4
0A
307G
-26
0.00
0202
043
9E
quat
ion:
y
= m
x+
bS
S-4
1A
307G
-25
0.00
0505
011
01S
lope
, m =
2277
273
SS
-42
A30
7G-2
40.
0010
1022
85In
terc
ept,
b =
-81.
82S
S-4
3A
307G
-23
0.00
2020
043
10R
² =
0.99
82S
S-4
4A
307G
-22
0.00
5050
1181
8L
OQ
(µ
g/g)
=0.
02S
S-5
2A
307G
-22
0.00
5050
1117
9S
S-5
3A
307G
-23
0.00
2020
042
95S
S-5
4A
307G
-24
0.00
1010
2181
SS
-55
A30
7G-2
50.
0005
050
1025
SS
-56
A30
7G-2
60.
0002
020
444
SS
-57
A30
7G-2
70.
0001
010
198
AN
AL
YT
ICA
L D
AT
AE
xtra
ctio
n da
te:
08-A
ug-1
2A
naly
sis
date
:08
-Aug
-12
RT
SD
BS
ampl
eS
ampl
eS
pike
Sam
ple
Spi
keP
eak
Fin
alR
esid
ueS
pike
Pag
eID
Typ
eA
dded
Wei
ght
Con
c.A
rea
Vol
ume
Fou
ndR
ecov
ery
No
*1(µ
g)(g
)(µ
g/g)
*2(c
ount
s)(m
L)
(µg/
g)*3
(%)*
4
CA
LC
UL
AT
ION
PA
GE
Cal
ibra
tion
sta
ndar
d--
----
----
----
--
y =
227
7273
.262
0x -
81.8
175
R² =
0.9
982
0
1000
2000
3000
4000
5000
6000
7000
8000
9000
1000
0
1100
0
1200
0
1300
0 0.00
00.
001
0.00
20.
003
0.00
40.
005
0.00
6
Peak area
Sta
nd
ard
Con
c. (
µg/
mL
)
No.
1(µ
g)(g
)(µ
g/g)
2(c
ount
s)(m
L)
(µg/
g)3
(%)
4
SS
-46
1835
2A-C
-1C
NA
5.00
NA
3320
00.
0020
2N
A
SS
-47
1835
2A-Q
C-0
.2-1
F1.
010
5.00
0.20
2017
7310
000.
1629
80.6
4
SS
-48
1835
2A-0
.2-S
S 1
F1.
006
5.00
0.20
1218
9610
000.
1737
86.3
3
SS
-49
1835
2A-0
.2-S
S 2
F1.
006
5.00
0.20
1217
9210
000.
1646
81.7
9
SS
-50
1835
2A-0
.2-S
S 3
F1.
006
5.00
0.20
1218
9810
000.
1739
86.4
2
NO
TE
S*1
: C=
Con
trol
, F=
Fort
ifie
d, T
=T
reat
ed*2
: Spi
ke a
mou
nt =
(S
pike
add
ed)
÷ (S
ampl
e w
eigh
t)
*3: R
esid
ue a
mou
nt =
[(A
rea
- b)
÷ m
] x
(Fin
al v
ol/S
ampl
e w
t)*4
. Rec
over
y (%
) =
(Res
idue
fou
nd)
÷ (s
pike
con
c) *
100
"NA
" st
ands
for
"N
ot a
pplic
able
"
Attachment B: Calculation Worksheets, Standard Curves and LOD/LOQ Calculations
IR-4 North Central Region Laboratory, Michigan State University Analytical Summary Report PR# 09358
Page 115

PR
OJE
CT
IN
FO
RM
AT
ION
PR
Num
ber:
09
358
Lab
orat
ory
ID:
0935
8.11
-MIR
05C
hem
ical
: F
loni
cam
idF
ield
ID
No.
for
SS
: 09
358.
11-I
D12
Ana
lysi
s fo
r:
TF
NG
Fie
ld R
esea
rch
Dir
ecto
r:
Wil
l Mee
ksC
omm
odit
y:
Min
tA
naly
st(s
):
Ein
a A
bouz
ied&
Les
ter
Gei
ssel
Cro
p pa
rt:
Min
t Top
s (l
eave
s&st
ems)
Inst
rum
ent:
U
PL
C/M
S/M
S
CA
LIB
RA
TIO
N D
AT
AD
ate
of c
alib
rati
on a
naly
sis:
08
-Aug
-12
RT
SD
BP
eak
----
----
Pag
eID
(or
nam
e)C
onc.
(µg/
mL
)A
rea
SS
-39
A30
7G-2
70.
0000
9550
411
Typ
e:
Lin
ear
regr
essi
onS
S-4
0A
307G
-26
0.00
0191
047
0E
quat
ion:
y
= m
x+
bS
S-4
1A
307G
-25
0.00
0477
511
16S
lope
, m =
2733
661
SS
-42
A30
7G-2
40.
0009
5500
2830
Inte
rcep
t, b
=17
.97
SS
-43
A30
7G-2
30.
0019
100
5152
R² =
0.99
86S
S-4
4A
307G
-22
0.00
4775
1333
5L
OQ
(µ
g/g)
=0.
02S
S-5
2A
307G
-22
0.00
4775
1280
9S
S-5
3A
307G
-23
0.00
1910
052
93S
S-5
4A
307G
-24
0.00
0955
0024
90S
S-5
5A
307G
-25
0.00
0477
515
63S
S-5
6A
307G
-26
0.00
0191
047
4S
S-5
7A
307G
-27
0.00
0095
5022
0
AN
AL
YT
ICA
L D
AT
AE
xtra
ctio
n da
te:
08-A
ug-1
2A
naly
sis
date
:08
-Aug
-12
RT
SD
BS
ampl
eS
ampl
eS
pike
Sam
ple
Spi
keP
eak
Fin
alR
esid
ueS
pike
Pag
eID
Typ
eA
dded
Wei
ght
Con
c.A
rea
Vol
ume
Fou
ndR
ecov
ery
CA
LC
UL
AT
ION
PA
GE
Cal
ibra
tion
sta
ndar
d--
----
----
----
--
y =
273
3660
.566
8x +
17.
9694
R² =
0.9
986
0
1000
2000
3000
4000
5000
6000
7000
8000
9000
1000
0
1100
0
1200
0
1300
0
1400
0
1500
0 0.00
00.
001
0.00
20.
003
0.00
40.
005
0.00
6
Peak area
Sta
ndar
d C
onc.
(µ
g/m
L)
No.
*1(µ
g)(g
)(µ
g/g)
*2(c
ount
s)(m
L)
(µg/
g)*3
(%)*
4S
S-4
618
352A
-C-1
CN
A5.
00N
A41
520
00.
0058
1N
A
SS
-47
1835
2A-Q
C-0
.2-1
F0.
9550
5.00
0.19
1022
7410
000.
1651
86.4
2
SS
-48
1835
2A-0
.2-S
S 1
F0.
9970
5.00
0.19
9422
8210
000.
1656
83.0
7
SS
-49
1835
2A-0
.2-S
S 2
F0.
9970
5.00
0.19
9421
6910
000.
1574
78.9
2
SS
-50
1835
2A-0
.2-S
S 3
F0.
9970
5.00
0.19
9422
0210
000.
1598
80.1
3
NO
TE
S*1
: C=
Con
trol
, F=
Fort
ifie
d, T
=T
reat
ed*2
: Spi
ke a
mou
nt =
(S
pike
add
ed)
÷ (S
ampl
e w
eigh
t)
*3: R
esid
ue a
mou
nt =
[(A
rea
- b)
÷ m
] x
(Fin
al v
ol/S
ampl
e w
t)*4
. Rec
over
y (%
) =
(Res
idue
fou
nd)
÷ (s
pike
con
c) *
100
"NA
" st
ands
for
"N
ot a
pplic
able
"
Attachment B: Calculation Worksheets, Standard Curves and LOD/LOQ Calculations
IR-4 North Central Region Laboratory, Michigan State University Analytical Summary Report PR# 09358
Page 116

PR
OJE
CT
IN
FO
RM
AT
ION
PR
Num
ber:
09
358
Lab
orat
ory
ID:
0935
8.11
-MIR
05C
hem
ical
: F
loni
cam
idF
ield
ID
No.
for
SS
: 09
358.
11-I
D12
Ana
lysi
s fo
r:
TF
NA
Fie
ld R
esea
rch
Dir
ecto
r:
Will
Mee
ksC
omm
odity
: M
int
Ana
lyst
(s):
E
ina
Abo
uzie
d&L
este
r G
eiss
elC
rop
part
: M
int T
ops
(lea
ves&
stem
s)In
stru
men
t: U
PL
C/M
S/M
SC
AL
IBR
AT
ION
DA
TA
Dat
e of
cal
ibra
tion
anal
ysis
: 08
-Aug
-12
RT
SD
BP
eak
----
----
Pag
eID
(or
nam
e)C
onc.
(µg/
mL
)A
rea
SS
-39
A30
7G-2
70.
0001
001
251
Typ
e:
Lin
ear
regr
essi
onS
S-4
0A
307G
-26
0.00
0200
244
9E
quat
ion:
y
= m
x+
bS
S-4
1A
307G
-25
0.00
0500
510
04S
lope
, m =
2059
737
SS
-42
A30
7G-2
40.
0010
0120
70In
terc
ept,
b =
-23.
14S
S-4
3A
307G
-23
0.00
2002
040
56R
² =0.
9982
SS
-44
A30
7G-2
20.
0050
0510
653
LO
Q (
µg/
g) =
0.02
SS
-52
A30
7G-2
20.
0050
0599
87S
S-5
3A
307G
-23
0.00
2002
039
93S
S-5
4A
307G
-24
0.00
1001
1964
SS
-55
A30
7G-2
50.
0005
005
962
SS
-56
A30
7G-2
60.
0002
002
457
SS
-57
A30
7G-2
70.
0001
001
164
AN
AL
YT
ICA
L D
AT
AE
xtra
ctio
n da
te:
08-A
ug-1
2A
naly
sis
date
:08
-Aug
-12
RT
SD
BS
ampl
eS
ampl
eS
pike
Sam
ple
Spi
keP
eak
Fin
alR
esid
ueS
pike
Pag
eID
Typ
eA
dded
Wei
ght
Con
c.A
rea
Vol
ume
Fou
ndR
ecov
ery
No.
*1(µ
g)(g
)(µ
g/g)
*2(c
ount
s)(m
L)
(µg/
g)*3
(%)*
4
CA
LC
UL
AT
ION
PA
GE
Cal
ibra
tion
stan
dard
----
----
----
----
y =
205
9736
.928
5x -
23.1
351
R² =
0.9
982
0
1000
2000
3000
4000
5000
6000
7000
8000
9000
1000
0
1100
0
1200
0 0.00
00.
001
0.00
20.
003
0.00
40.
005
0.00
6
Peak area
Sta
nd
ard
Con
c. (
µg/
mL
)
SS
-46
1835
2A-C
-1C
NA
5.00
NA
3120
00.
0010
5N
A
SS
-47
1835
2A-Q
C-0
.2-1
F1.
001
5.00
0.20
0221
1110
000.
2072
103.
51
SS
-48
1835
2A-0
.2-S
S 1
F1.
001
5.00
0.20
0215
3510
000.
1513
75.5
7
SS
-49
1835
2A-0
.2-S
S 2
F1.
001
5.00
0.20
0213
0710
000.
1292
64.5
1
SS
-50
1835
2A-0
.2-S
S 3
F1.
001
5.00
0.20
0215
7910
000.
1556
77.7
1
NO
TE
S*1
: C=
Con
trol
, F=
Fort
ifie
d, T
=T
reat
ed*2
: Spi
ke a
mou
nt =
(Sp
ike
adde
d) ÷
(Sa
mpl
e w
eigh
t)
*3: R
esid
ue a
mou
nt =
[(A
rea
- b)
÷ m
] x
(Fin
al v
ol/S
ampl
e w
t)*4
. Rec
over
y (%
) =
(Res
idue
fou
nd)
÷ (
spik
e co
nc)
* 10
0
"NA
" st
ands
for
"N
ot a
pplic
able
"
Attachment B: Calculation Worksheets, Standard Curves and LOD/LOQ Calculations
IR-4 North Central Region Laboratory, Michigan State University Analytical Summary Report PR# 09358
Page 117

An
alys
isO
bse
rved
Per
cen
tN
um
ber
of
On
e-T
aile
dD
ate
Am
oun
tR
ecov
ery
Ob
serv
atio
ns
't' s
tati
stic
19-J
ul-1
20.
0149
473
.94
1∞
19-J
ul-1
20.
0144
871
.69
231
.821
IR-4
LO
D /
LO
Q C
alcu
lato
r19
-Jul
-12
0.01
411
69.8
73
6.96
502
-Aug
-12
0.01
462
72.4
04
4.54
1 2
4 an
d 25
Jul
*0.
0163
280
.78
53.
747
25-J
ul-1
20.
0161
680
.01
63.
365
73.
143
82.
998
Ana
lyst
:9
2.89
6D
ate
Pri
nted
:10
2.82
111
2.76
412
2.71
8S
pike
Am
ount
:0.
0202
0pp
m13
2.68
1N
umbe
r of
Obs
erva
tion
s:6
142.
650
Ave
rage
Am
ount
Obs
erve
d:0.
0151
1pp
m15
2.62
4S
tand
ard
Dev
iati
on:
0.00
0918
ppm
162.
602
Ave
rage
Rec
over
y:74
.78
± 4
.5 %
172.
583
One
-Tai
led
't' s
tati
stic
: 3.
365
for
n =
618
2.56
7L
imit
of
Det
ecti
on (
LO
D):
0.00
3090
ppm
192.
552
Lim
it o
f Q
uant
itat
ion
(LO
Q):
0.00
927
ppm
202.
539
212.
528
222.
518
232.
508
242.
500
*sam
e se
t inj
ecte
d on
two
diff
eren
t day
s
LO
D =
(S
tand
ard
Dev
iati
on)
x (O
ne-T
aile
d t-
Sta
tist
ic)
LO
Q =
(3)
x (
LO
D)
Bas
ed o
n th
e m
etho
d de
scri
bed
in H
andb
ook
of E
nvir
onm
enta
l Ana
lysi
s, F
ourt
h E
diti
on, G
eniu
m P
ubli
shin
g C
orpo
rati
on, 1
999
by R
oy-K
eith
Sm
ith
Min
t Top
s (l
eave
s&st
ems)
0935
8.11
-MIR
05E
ina
Abo
uzie
d&L
este
r G
eiss
el
Cal
cula
tion
s
For
mu
las
Min
t
IR-4
LO
D /
LO
Q C
alcu
lato
r
Pro
ject
In
form
atio
n
0935
8F
loni
cam
idT
FN
A-A
M
Attachment B: Calculation Worksheets, Standard Curves and LOD/LOQ Calculations
IR-4 North Central Region Laboratory, Michigan State University Analytical Summary Report PR# 09358
Page 118

An
alys
isO
bse
rved
Per
cen
tN
um
ber
of
On
e-T
aile
dD
ate
Am
oun
tR
ecov
ery
Ob
serv
atio
ns
't' s
tati
stic
19-J
ul-1
20.
0148
673
.56
1∞
19-J
ul-1
20.
0135
867
.21
231
.821
IR-4
LO
D /
LO
Q C
alcu
lato
r19
-Jul
-12
0.01
432
70.8
93
6.96
502
-Aug
-12
0.01
190
58.9
14
4.54
124
- an
d 25
-Jul
-12*
0.01
441
71.3
35
3.74
725
-Jul
-12
0.01
215
60.1
36
3.36
57
3.14
38
2.99
8A
naly
st:
92.
896
Dat
e P
rint
ed:
102.
821
112.
764
122.
718
Spi
ke A
mou
nt:
0.02
020
ppm
132.
681
Num
ber
of O
bser
vati
ons:
614
2.65
0A
vera
ge A
mou
nt O
bser
ved:
0.01
353
ppm
152.
624
Sta
ndar
d D
evia
tion
:0.
0012
44pp
m16
2.60
2A
vera
ge R
ecov
ery:
67.0
0 ±
6.2
%17
2.58
3O
ne-T
aile
d 't'
sta
tist
ic:
3.36
5 f
or n
= 6
182.
567
Lim
it o
f D
etec
tion
(L
OD
):0.
0041
87pp
m19
2.55
2L
imit
of
Qua
ntit
atio
n (L
OQ
):0.
0125
6pp
m20
2.53
921
2.52
822
2.51
823
2.50
824
2.50
0
*sam
e se
t inj
ecte
d on
two
diff
eren
t day
sB
ased
on
the
met
hod
desc
ribe
d in
Han
dboo
k of
Env
iron
men
tal A
naly
sis,
Fou
rth
Edi
tion
, Gen
ium
Pub
lish
ing
Cor
pora
tion
, 199
9 by
Roy
-Kei
th S
mit
h
Min
t
IR-4
LO
D /
LO
Q C
alcu
lato
r
Pro
ject
In
form
atio
n
0935
8F
loni
cam
idF
loni
cam
id(I
KI-
220)
LO
D =
(S
tand
ard
Dev
iati
on)
x (O
ne-T
aile
d t-
Sta
tist
ic)
LO
Q =
(3)
x (
LO
D)
Min
t Top
s (l
eave
s&st
ems)
0935
8.11
-MIR
05E
ina
Abo
uzie
d&L
este
r G
eiss
el
Cal
cula
tion
s
For
mu
las
Attachment B: Calculation Worksheets, Standard Curves and LOD/LOQ Calculations
IR-4 North Central Region Laboratory, Michigan State University Analytical Summary Report PR# 09358
Page 119

An
alys
isO
bse
rved
Per
cen
tN
um
ber
of
On
e-T
aile
dD
ate
Am
oun
tR
ecov
ery
Ob
serv
atio
ns
't' s
tati
stic
19-J
ul-1
20.
0209
310
9.60
1∞
19-J
ul-1
20.
0204
810
7.20
231
.821
IR-4
LO
D /
LO
Q C
alcu
lato
r19
-Jul
-12
0.02
149
112.
513
6.96
502
-Aug
-12
0.02
206
115.
484
4.54
124
and
25
Jul-
12*
0.02
071
108.
435
3.74
725
-Jul
-12
0.02
132
111.
606
3.36
57
3.14
38
2.99
8A
naly
st:
92.
896
Dat
e P
rint
ed:
102.
821
112.
764
122.
718
Spi
ke A
mou
nt:
0.01
910
ppm
132.
681
Num
ber
of O
bser
vati
ons:
614
2.65
0A
vera
ge A
mou
nt O
bser
ved:
0.02
116
ppm
152.
624
Sta
ndar
d D
evia
tion
:0.
0005
76pp
m16
2.60
2A
vera
ge R
ecov
ery:
110.
81 ±
3 %
172.
583
One
-Tai
led
't' s
tati
stic
: 3.
365
for
n =
618
2.56
7L
imit
of
Det
ecti
on (
LO
D):
0.00
1938
ppm
192.
552
Lim
it o
f Q
uant
itat
ion
(LO
Q):
0.00
581
ppm
202.
539
212.
528
222.
518
232.
508
242.
500
*sam
e se
t inj
ecte
d on
two
diff
eren
t day
s
Min
t
IR-4
LO
D /
LO
Q C
alcu
lato
r
Pro
ject
In
form
atio
n
0935
8F
loni
cam
idT
FN
G
LO
D =
(S
tand
ard
Dev
iati
on)
x (O
ne-T
aile
d t-
Sta
tist
ic)
LO
Q =
(3)
x (
LO
D)
Bas
ed o
n th
e m
etho
d de
scri
bed
in H
andb
ook
of E
nvir
onm
enta
l Ana
lysi
s, F
ourt
h E
diti
on, G
eniu
m P
ubli
shin
g C
orpo
rati
on, 1
999
by R
oy-K
eith
Sm
ith
Min
t Top
s (l
eave
s&st
ems)
0935
8.11
-MIR
05E
ina
Abo
uzie
d&L
este
r G
eiss
el
Cal
cula
tion
s
For
mu
las
Attachment B: Calculation Worksheets, Standard Curves and LOD/LOQ Calculations
IR-4 North Central Region Laboratory, Michigan State University Analytical Summary Report PR# 09358
Page 120
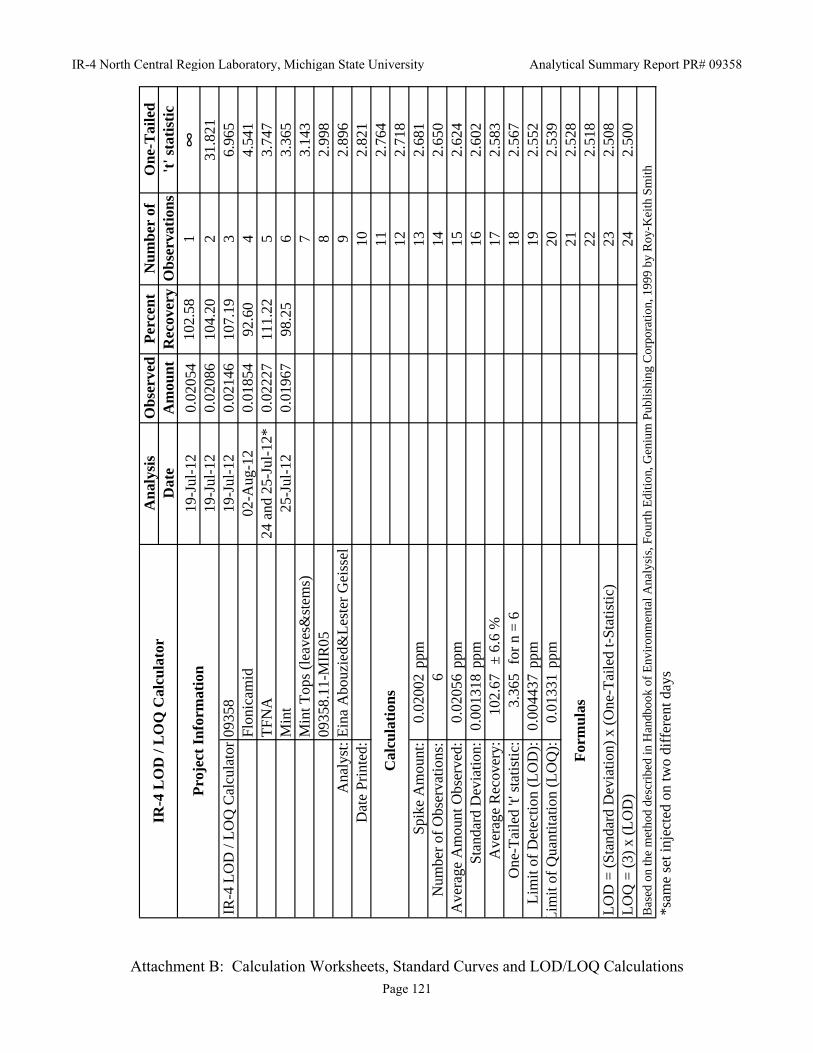
An
alys
isO
bse
rved
Per
cen
tN
um
ber
of
On
e-T
aile
dD
ate
Am
oun
tR
ecov
ery
Ob
serv
atio
ns
't' s
tati
stic
19-J
ul-1
20.
0205
410
2.58
1∞
19-J
ul-1
20.
0208
610
4.20
231
.821
IR-4
LO
D /
LO
Q C
alcu
lato
r19
-Jul
-12
0.02
146
107.
193
6.96
502
-Aug
-12
0.01
854
92.6
04
4.54
124
and
25-
Jul-
12*
0.02
227
111.
225
3.74
725
-Jul
-12
0.01
967
98.2
56
3.36
57
3.14
38
2.99
8A
naly
st:
92.
896
Dat
e P
rint
ed:
102.
821
112.
764
122.
718
Spi
ke A
mou
nt:
0.02
002
ppm
132.
681
Num
ber
of O
bser
vati
ons:
614
2.65
0A
vera
ge A
mou
nt O
bser
ved:
0.02
056
ppm
152.
624
Sta
ndar
d D
evia
tion
:0.
0013
18pp
m16
2.60
2A
vera
ge R
ecov
ery:
102.
67 ±
6.6
%17
2.58
3O
ne-T
aile
d 't'
sta
tist
ic:
3.36
5 f
or n
= 6
182.
567
Lim
it o
f D
etec
tion
(L
OD
):0.
0044
37pp
m19
2.55
2L
imit
of
Qua
ntit
atio
n (L
OQ
):0.
0133
1pp
m20
2.53
921
2.52
822
2.51
823
2.50
824
2.50
0
*sam
e se
t inj
ecte
d on
two
diff
eren
t day
s
Min
t
IR-4
LO
D /
LO
Q C
alcu
lato
r
Pro
ject
In
form
atio
n
0935
8F
loni
cam
idT
FN
A
LO
D =
(S
tand
ard
Dev
iati
on)
x (O
ne-T
aile
d t-
Sta
tist
ic)
LO
Q =
(3)
x (
LO
D)
Bas
ed o
n th
e m
etho
d de
scri
bed
in H
andb
ook
of E
nvir
onm
enta
l Ana
lysi
s, F
ourt
h E
diti
on, G
eniu
m P
ubli
shin
g C
orpo
rati
on, 1
999
by R
oy-K
eith
Sm
ith
Min
t Top
s (l
eave
s&st
ems)
0935
8.11
-MIR
05E
ina
Abo
uzie
d&L
este
r G
eiss
el
Cal
cula
tion
s
For
mu
las
Attachment B: Calculation Worksheets, Standard Curves and LOD/LOQ Calculations
IR-4 North Central Region Laboratory, Michigan State University Analytical Summary Report PR# 09358
Page 121

An
alys
isO
bse
rved
Per
cen
tN
um
ber
of
On
e-T
aile
dD
ate
Am
oun
tR
ecov
ery
Ob
serv
atio
ns
't' s
tati
stic
11-J
ul-1
20.
0187
692
.70
1∞
11-J
ul-1
20.
0196
997
.26
231
.821
IR-4
LO
D /
LO
Q C
alcu
lato
r11
-Jul
-12
0.02
063
101.
923
6.96
506
-Aug
-12
0.01
649
81.4
84
4.54
130
-Jul
-12
0.02
097
103.
595
3.74
730
-Jul
-12
0.02
015
99.5
86
3.36
57
3.14
38
2.99
8A
naly
st:
92.
896
Dat
e P
rint
ed:
102.
821
112.
764
122.
718
Spi
ke A
mou
nt:
0.02
020
ppm
132.
681
Num
ber
of O
bser
vati
ons:
614
2.65
0A
vera
ge A
mou
nt O
bser
ved:
0.01
945
ppm
152.
624
Sta
ndar
d D
evia
tion
:0.
0016
42pp
m16
2.60
2A
vera
ge R
ecov
ery:
96.0
9 ±
8.1
%17
2.58
3O
ne-T
aile
d 't'
sta
tist
ic:
3.36
5 f
or n
= 6
182.
567
Lim
it o
f D
etec
tion
(L
OD
):0.
0055
24pp
m19
2.55
2L
imit
of
Qua
ntit
atio
n (L
OQ
):0.
0165
7pp
m20
2.53
921
2.52
822
2.51
823
2.50
824
2.50
0
Min
t
IR-4
LO
D /
LO
Q C
alcu
lato
r
Pro
ject
In
form
atio
n
0935
8F
loni
cam
idT
FN
A-A
M
LO
D =
(S
tand
ard
Dev
iati
on)
x (O
ne-T
aile
d t-
Sta
tist
ic)
LO
Q =
(3)
x (
LO
D)
Bas
ed o
n th
e m
etho
d de
scri
bed
in H
andb
ook
of E
nvir
onm
enta
l Ana
lysi
s, F
ourt
h E
diti
on, G
eniu
m P
ubli
shin
g C
orpo
rati
on, 1
999
by R
oy-K
eith
Sm
ith
Min
t Oil
0935
8.11
-MIR
05E
ina
Abo
uzie
d&L
este
r G
eiss
e
Cal
cula
tion
s
For
mu
las
Attachment B: Calculation Worksheets, Standard Curves and LOD/LOQ Calculations
IR-4 North Central Region Laboratory, Michigan State University Analytical Summary Report PR# 09358
Page 122

An
alys
isO
bse
rved
Per
cen
tN
um
ber
of
On
e-T
aile
dD
ate
Am
oun
tR
ecov
ery
Ob
serv
atio
ns
't' s
tati
stic
11-J
ul-1
20.
0208
310
3.14
1∞
11-J
ul-1
20.
0175
686
.93
231
.821
IR-4
LO
D /
LO
Q C
alcu
lato
r11
-Jul
-12
0.02
053
101.
633
6.96
506
-Aug
-12
0.01
794
88.8
34
4.54
130
-Jul
-12
0.01
985
98.2
55
3.74
730
-Jul
-12
0.01
988
98.4
16
3.36
57
3.14
38
2.99
8A
naly
st:
92.
896
Dat
e P
rint
ed:
102.
821
112.
764
122.
718
Spi
ke A
mou
nt:
0.02
020
ppm
132.
681
Num
ber
of O
bser
vati
ons:
614
2.65
0A
vera
ge A
mou
nt O
bser
ved:
0.01
943
ppm
152.
624
Sta
ndar
d D
evia
tion
:0.
0013
61pp
m16
2.60
2A
vera
ge R
ecov
ery:
96.2
0 ±
6.7
%17
2.58
3O
ne-T
aile
d 't'
sta
tist
ic:
3.36
5 f
or n
= 6
182.
567
Lim
it o
f D
etec
tion
(L
OD
):0.
0045
79pp
m19
2.55
2L
imit
of
Qua
ntit
atio
n (L
OQ
):0.
0137
4pp
m20
2.53
921
2.52
822
2.51
823
2.50
824
2.50
0
Min
t
IR-4
LO
D /
LO
Q C
alcu
lato
r
Pro
ject
In
form
atio
n
0935
8F
loni
cam
idF
loni
cam
id(I
KI-
220)
LO
D =
(S
tand
ard
Dev
iati
on)
x (O
ne-T
aile
d t-
Sta
tist
ic)
LO
Q =
(3)
x (
LO
D)
Bas
ed o
n th
e m
etho
d de
scri
bed
in H
andb
ook
of E
nvir
onm
enta
l Ana
lysi
s, F
ourt
h E
diti
on, G
eniu
m P
ubli
shin
g C
orpo
rati
on, 1
999
by R
oy-K
eith
Sm
ith
Min
t Oil
0935
8.11
-MIR
05E
ina
Abo
uzie
d&L
este
r G
eiss
e
Cal
cula
tion
s
For
mu
las
Attachment B: Calculation Worksheets, Standard Curves and LOD/LOQ Calculations
IR-4 North Central Region Laboratory, Michigan State University Analytical Summary Report PR# 09358
Page 123

An
alys
isO
bse
rved
Per
cen
tN
um
ber
of
On
e-T
aile
dD
ate
Am
oun
tR
ecov
ery
Ob
serv
atio
ns
't' s
tati
stic
11-J
ul-1
20.
0177
893
.08
1∞
11-J
ul-1
20.
0166
887
.31
231
.821
IR-4
LO
D /
LO
Q C
alcu
lato
r11
-Jul
-12
0.01
781
93.2
63
6.96
506
-Aug
-12
0.01
505
78.7
94
4.54
130
-Jul
-12
0.01
572
82.3
15
3.74
730
-Jul
-12
0.01
814
94.9
66
3.36
57
3.14
38
2.99
8A
naly
st:
92.
896
Dat
e P
rint
ed:
102.
821
112.
764
122.
718
Spi
ke A
mou
nt:
0.01
910
ppm
132.
681
Num
ber
of O
bser
vati
ons:
614
2.65
0A
vera
ge A
mou
nt O
bser
ved:
0.01
686
ppm
152.
624
Sta
ndar
d D
evia
tion
:0.
0012
64pp
m16
2.60
2A
vera
ge R
ecov
ery:
88.2
8 ±
6.6
%17
2.58
3O
ne-T
aile
d 't'
sta
tist
ic:
3.36
5 f
or n
= 6
182.
567
Lim
it o
f D
etec
tion
(L
OD
):0.
0042
55pp
m19
2.55
2L
imit
of
Qua
ntit
atio
n (L
OQ
):0.
0127
6pp
m20
2.53
921
2.52
822
2.51
823
2.50
824
2.50
0
Min
t
IR-4
LO
D /
LO
Q C
alcu
lato
r
Pro
ject
In
form
atio
n
0935
8F
loni
cam
idT
FN
G
LO
D =
(S
tand
ard
Dev
iati
on)
x (O
ne-T
aile
d t-
Sta
tist
ic)
LO
Q =
(3)
x (
LO
D)
Bas
ed o
n th
e m
etho
d de
scri
bed
in H
andb
ook
of E
nvir
onm
enta
l Ana
lysi
s, F
ourt
h E
diti
on, G
eniu
m P
ubli
shin
g C
orpo
rati
on, 1
999
by R
oy-K
eith
Sm
ith
Min
t Oil
0935
8.11
-MIR
05E
ina
Abo
uzie
d&L
este
r G
eiss
e
Cal
cula
tion
s
For
mu
las
Attachment B: Calculation Worksheets, Standard Curves and LOD/LOQ Calculations
IR-4 North Central Region Laboratory, Michigan State University Analytical Summary Report PR# 09358
Page 124
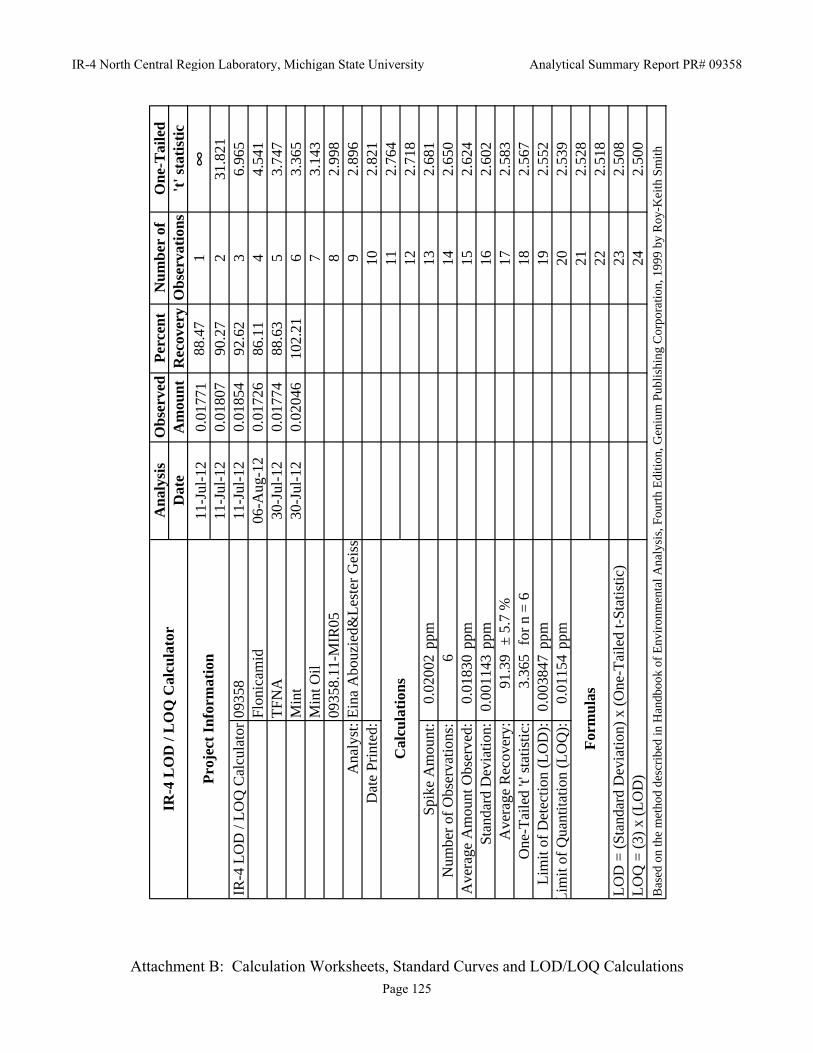
An
alys
isO
bse
rved
Per
cen
tN
um
ber
of
On
e-T
aile
dD
ate
Am
oun
tR
ecov
ery
Ob
serv
atio
ns
't' s
tati
stic
11-J
ul-1
20.
0177
188
.47
1∞
11-J
ul-1
20.
0180
790
.27
231
.821
IR-4
LO
D /
LO
Q C
alcu
lato
r11
-Jul
-12
0.01
854
92.6
23
6.96
506
-Aug
-12
0.01
726
86.1
14
4.54
130
-Jul
-12
0.01
774
88.6
35
3.74
730
-Jul
-12
0.02
046
102.
216
3.36
57
3.14
38
2.99
8A
naly
st:
92.
896
Dat
e P
rint
ed:
102.
821
112.
764
122.
718
Spi
ke A
mou
nt:
0.02
002
ppm
132.
681
Num
ber
of O
bser
vati
ons:
614
2.65
0A
vera
ge A
mou
nt O
bser
ved:
0.01
830
ppm
152.
624
Sta
ndar
d D
evia
tion
:0.
0011
43pp
m16
2.60
2A
vera
ge R
ecov
ery:
91.3
9 ±
5.7
%17
2.58
3O
ne-T
aile
d 't'
sta
tist
ic:
3.36
5 f
or n
= 6
182.
567
Lim
it o
f D
etec
tion
(L
OD
):0.
0038
47pp
m19
2.55
2L
imit
of
Qua
ntit
atio
n (L
OQ
):0.
0115
4pp
m20
2.53
921
2.52
822
2.51
823
2.50
824
2.50
0
Min
t
IR-4
LO
D /
LO
Q C
alcu
lato
r
Pro
ject
In
form
atio
n
0935
8F
loni
cam
idT
FN
A
LO
D =
(S
tand
ard
Dev
iati
on)
x (O
ne-T
aile
d t-
Sta
tist
ic)
LO
Q =
(3)
x (
LO
D)
Bas
ed o
n th
e m
etho
d de
scri
bed
in H
andb
ook
of E
nvir
onm
enta
l Ana
lysi
s, F
ourt
h E
diti
on, G
eniu
m P
ubli
shin
g C
orpo
rati
on, 1
999
by R
oy-K
eith
Sm
ith
Min
t Oil
0935
8.11
-MIR
05E
ina
Abo
uzie
d&L
este
r G
eiss
e
Cal
cula
tion
s
For
mu
las
Attachment B: Calculation Worksheets, Standard Curves and LOD/LOQ Calculations
IR-4 North Central Region Laboratory, Michigan State University Analytical Summary Report PR# 09358
Page 125

Attachment C: Certificates of Analysis
IR-4 North Central Region Laboratory, Michigan State University Analytical Summary Report PR# 09358
Page 126
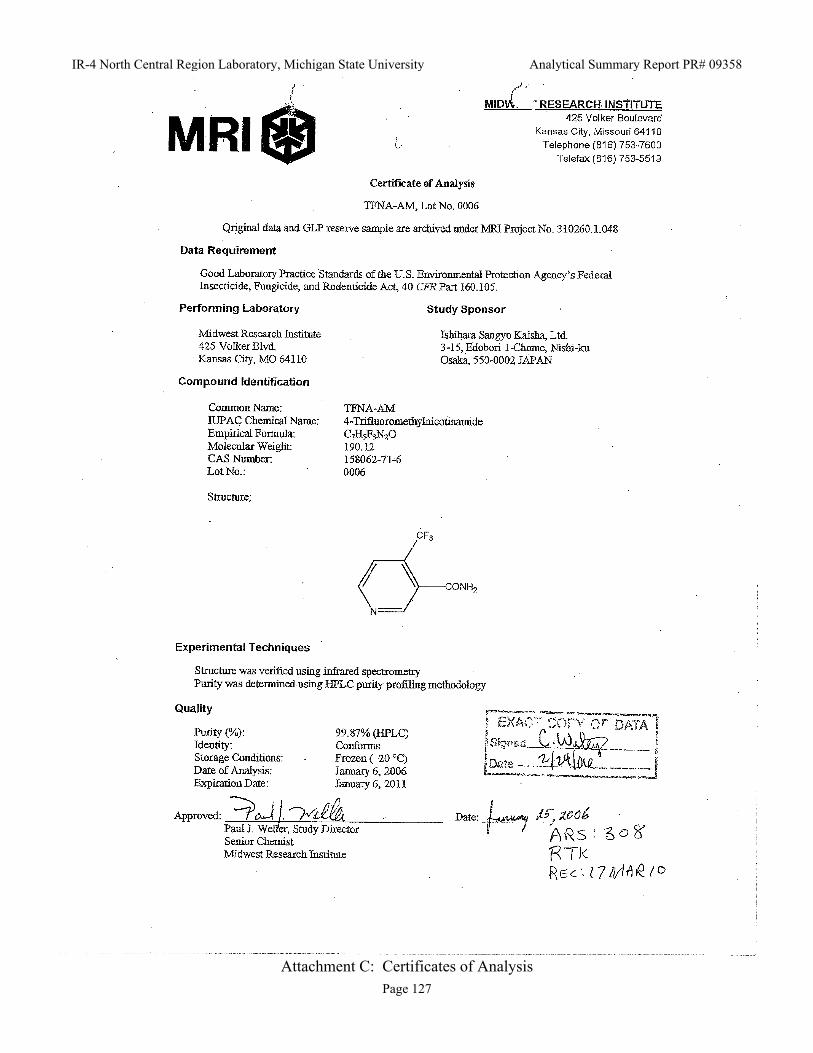
Attachment C: Certificates of Analysis
IR-4 North Central Region Laboratory, Michigan State University Analytical Summary Report PR# 09358
Page 127

Attachment C: Certificates of Analysis
IR-4 North Central Region Laboratory, Michigan State University Analytical Summary Report PR# 09358
Page 128

Attachment C: Certificates of Analysis
IR-4 North Central Region Laboratory, Michigan State University Analytical Summary Report PR# 09358
Page 129

Attachment C: Certificates of Analysis
IR-4 North Central Region Laboratory, Michigan State University Analytical Summary Report PR# 09358
Page 130

Attachment C: Certificates of Analysis
IR-4 North Central Region Laboratory, Michigan State University Analytical Summary Report PR# 09358
Page 131

Attachment D: Working Outline 9.166 V1
IR-4 North Central Region Laboratory, Michigan State University Analytical Summary Report PR# 09358
Page 132

Attachment D: Working Outline 9.166 V1
IR-4 North Central Region Laboratory, Michigan State University Analytical Summary Report PR# 09358
Page 133

Attachment D: Working Outline 9.166 V1
IR-4 North Central Region Laboratory, Michigan State University Analytical Summary Report PR# 09358
Page 134

Attachment D: Working Outline 9.166 V1
IR-4 North Central Region Laboratory, Michigan State University Analytical Summary Report PR# 09358
Page 135

Attachment D: Working Outline 9.166 V1
IR-4 North Central Region Laboratory, Michigan State University Analytical Summary Report PR# 09358
Page 136

Attachment 3
Checklist for Review of Analytical Summary Reports

Ver
sion
1.0
05/1
2/08
Pa
ge 1
of 5
Che
cklis
t for
Rev
iew
of A
naly
tical
Sum
mar
y R
epor
ts
PR #
:
Act
ive
Ingr
edie
nt/C
rop:
Y
es
No
NA
N
otes
1)
Sam
ple
Pre
par
atio
n 1.
1 Fo
r eac
h sa
mpl
e, w
as th
e fu
ll sa
mpl
e gr
ound
, and
m
ixed
thor
ough
ly?
2)
Inst
rum
ent
Con
dit
ion
2.
1 Fo
r GC
/MS,
are
tune
file
s or o
ther
app
ropr
iate
do
cum
enta
tion
avai
labl
e fo
r eac
h ru
n, to
show
that
the
inst
rum
ent w
as in
goo
d w
orki
ng o
rder
at t
he ti
me
the
run
was
mad
e?
If
2.1
is n
o, o
r if t
he a
naly
st h
as c
once
rns r
egar
ding
th
e in
stru
men
t con
ditio
n, th
e LR
D m
ust b
e co
nsul
ted.
Was
th
e LR
D c
onsu
lted?
2.2
For o
ther
det
ecto
rs, w
as th
e in
stru
men
t in
good
w
orki
ng o
rder
for e
ach
run?
The
ans
wer
to th
is q
uest
ion
will
rely
on
the
anal
yst’s
pro
fess
iona
l jud
gmen
t and
will
in
clud
e an
eva
luat
ion
of a
ppro
pria
te d
ata
obta
ined
th
roug
hout
the
stud
y, fo
r exa
mpl
e, th
e st
anda
rd c
urve
, the
pe
ak re
tent
ion
times
, the
are
a co
unts
of t
he st
anda
rds a
nd
the
sign
al to
noi
se ra
tio.
Not
e w
hat d
ata
was
con
side
red.
If 2
.2 is
no,
or i
f the
ana
lyst
has
con
cern
s reg
ardi
ng
the
inst
rum
ent c
ondi
tion,
the
LRD
mus
t be
cons
ulte
d. W
as
the
LRD
con
sulte
d?
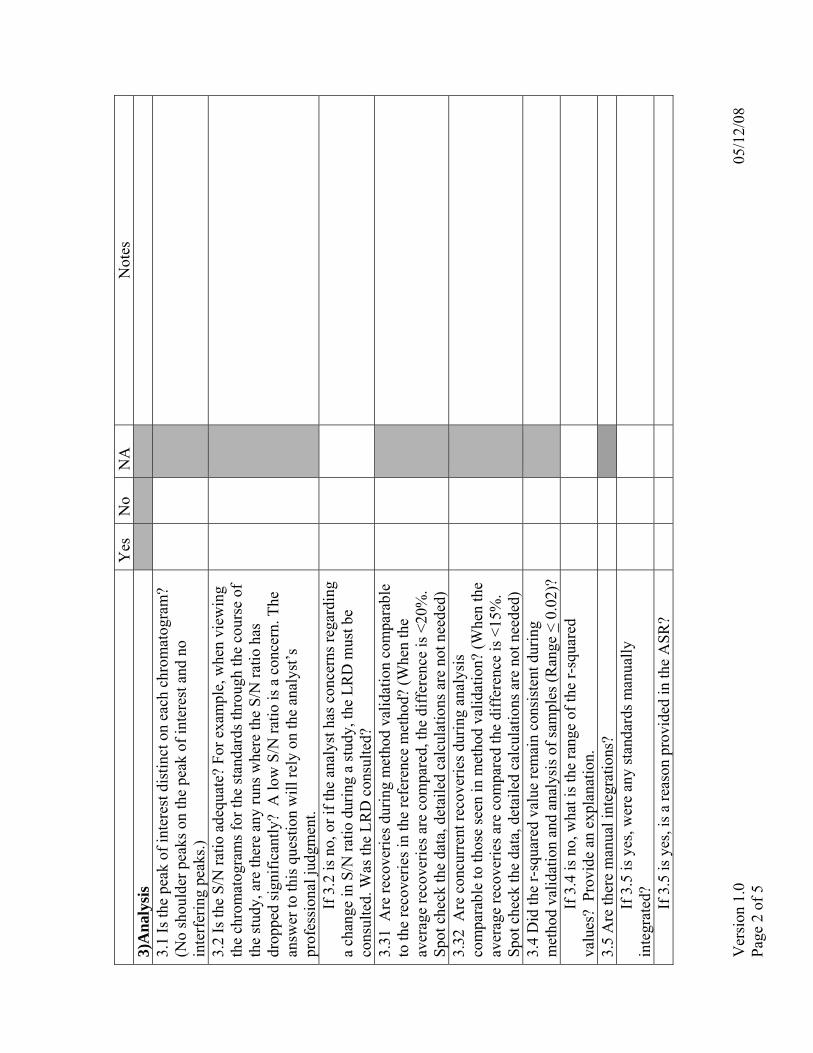
Ver
sion
1.0
05/1
2/08
Pa
ge 2
of 5
Y
es
No
NA
N
otes
3)
An
alys
is3.
1 Is
the
peak
of i
nter
est d
istin
ct o
n ea
ch c
hrom
atog
ram
? (N
o sh
ould
er p
eaks
on
the
peak
of i
nter
est a
nd n
o in
terf
erin
g pe
aks.)
3.
2 Is
the
S/N
ratio
ade
quat
e? F
or e
xam
ple,
whe
n vi
ewin
g th
e ch
rom
atog
ram
s for
the
stan
dard
s thr
ough
the
cour
se o
f th
e st
udy,
are
ther
e an
y ru
ns w
here
the
S/N
ratio
has
dr
oppe
d si
gnifi
cant
ly?
A lo
w S
/N ra
tio is
a c
once
rn. T
he
answ
er to
this
que
stio
n w
ill re
ly o
n th
e an
alys
t’s
prof
essi
onal
judg
men
t.
If 3
.2 is
no,
or i
f the
ana
lyst
has
con
cern
s reg
ardi
ng
a ch
ange
in S
/N ra
tio d
urin
g a
stud
y, th
e LR
D m
ust b
e co
nsul
ted.
Was
the
LRD
con
sulte
d?
3.31
Are
reco
verie
s dur
ing
met
hod
valid
atio
n co
mpa
rabl
e to
the
reco
verie
s in
the
refe
renc
e m
etho
d? (W
hen
the
aver
age
reco
verie
s are
com
pare
d, th
e di
ffer
ence
is <
20%
. Sp
ot c
heck
the
data
, det
aile
d ca
lcul
atio
ns a
re n
ot n
eede
d)
3.32
Are
con
curr
ent r
ecov
erie
s dur
ing
anal
ysis
co
mpa
rabl
e to
thos
e se
en in
met
hod
valid
atio
n? (W
hen
the
aver
age
reco
verie
s are
com
pare
d th
e di
ffer
ence
is <
15%
. Sp
ot c
heck
the
data
, det
aile
d ca
lcul
atio
ns a
re n
ot n
eede
d)
3.4
Did
the
r-sq
uare
d va
lue
rem
ain
cons
iste
nt d
urin
g m
etho
d va
lidat
ion
and
anal
ysis
of s
ampl
es (R
ange
< 0
.02)
?
If 3
.4 is
no,
wha
t is t
he ra
nge
of th
e r-
squa
red
valu
es?
Pro
vide
an
expl
anat
ion.
3.5
Are
ther
e m
anua
l int
egra
tions
?
If
3.5
is y
es, w
ere
any
stan
dard
s man
ually
in
tegr
ated
?
If
3.5
is y
es, i
s a re
ason
pro
vide
d in
the
ASR
?
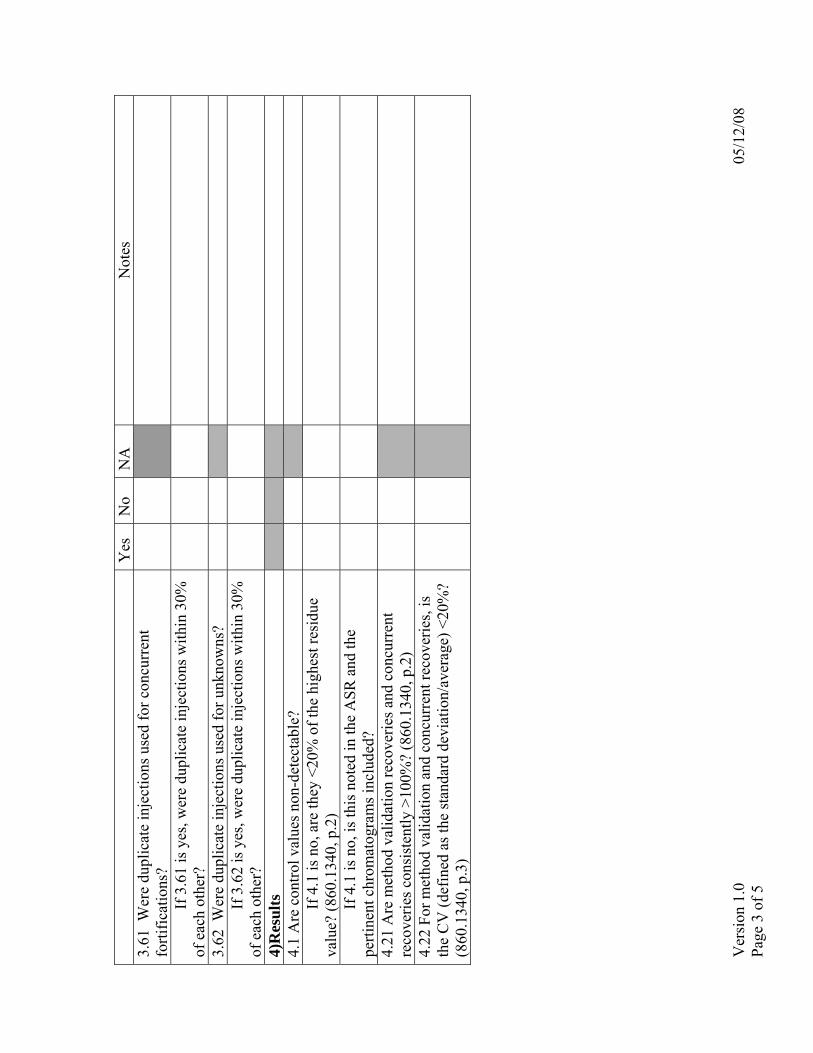
Ver
sion
1.0
05/1
2/08
Pa
ge 3
of 5
Y
es
No
NA
N
otes
3.
61 W
ere
dupl
icat
e in
ject
ions
use
d fo
r con
curr
ent
forti
ficat
ions
?
If 3
.61
is y
es, w
ere
dupl
icat
e in
ject
ions
with
in 3
0%
of e
ach
othe
r?
3.62
Wer
e du
plic
ate
inje
ctio
ns u
sed
for u
nkno
wns
?
If 3
.62
is y
es, w
ere
dupl
icat
e in
ject
ions
with
in 3
0%
of e
ach
othe
r?
4)R
esu
lts
4.1
Are
con
trol v
alue
s non
-det
ecta
ble?
If 4
.1 is
no,
are
they
<20
% o
f the
hig
hest
resi
due
valu
e? (8
60.1
340,
p.2
)
If
4.1
is n
o, is
this
not
ed in
the
ASR
and
the
perti
nent
chr
omat
ogra
ms i
nclu
ded?
4.21
Are
met
hod
valid
atio
n re
cove
ries a
nd c
oncu
rren
t re
cove
ries c
onsi
sten
tly >
100%
? (8
60.1
340,
p.2
) 4.
22 F
or m
etho
d va
lidat
ion
and
conc
urre
nt re
cove
ries,
is
the
CV
(def
ined
as t
he st
anda
rd d
evia
tion/
aver
age)
<20
%?
(860
.134
0, p
.3)

Ver
sion
1.0
05/1
2/08
Pa
ge 4
of 5
Y
es
No
NA
N
otes
5)
An
alyt
ical
Su
mm
ary
Rep
ort
5.1
Wer
e an
y sa
mpl
es re
-ext
ract
ed a
nd re
run?
If 5
.1 is
yes
, was
the
LRD
con
sulte
d? T
he L
RD
ne
eds t
o ap
prov
e sa
mpl
es n
eedi
ng re
-ext
ract
ion
due
to
judg
men
t cal
ls, f
or e
xam
ple,
sam
ples
with
une
xpec
tedl
y hi
gh o
r low
resi
due
resu
lts, o
r a n
eed
for m
anua
l in
tegr
atio
n.)
If
5.1
is y
es, w
as th
e st
udy
dire
ctor
not
ified
? (I
f the
si
tuat
ion
is c
over
ed in
an
SOP
i.e. s
ampl
es n
eedi
ng
dilu
tion,
rean
alys
is d
ue to
a p
ower
failu
re o
r the
via
l lo
catio
n w
as in
corr
ect f
or in
ject
ion,
doc
umen
t in
the
stud
y fil
e. T
he st
udy
dire
ctor
doe
s not
nee
d to
be
notif
ied)
. If
an
swer
to th
is q
uest
ion
is n
o, p
leas
e no
te w
hy.
If
5.1
is y
es, i
s the
re in
form
atio
n ex
plai
ning
the
situ
atio
n an
d its
reso
lutio
n in
the
ASR
?
5.2
Is th
ere
docu
men
tatio
n in
the
raw
dat
a re
gard
ing
any
unex
pect
ed c
ircum
stan
ces d
urin
g th
e ru
n?
If
5.2
is y
es, w
as th
e LR
D c
onsu
lted?
The
LR
D
need
s to
appr
ove
judg
men
t cal
ls, f
or e
xam
ple,
sam
ples
w
ith u
nexp
ecte
dly
high
or l
ow re
sidu
e re
sults
, or a
nee
d fo
r m
anua
l int
egra
tion.
)
If
5.2
is y
es, w
as th
e st
udy
dire
ctor
not
ified
? (I
f the
si
tuat
ion
is c
over
ed in
an
SOP
i.e. r
eana
lysi
s due
to a
po
wer
failu
re o
r the
via
l loc
atio
n w
as in
corr
ect f
or
inje
ctio
n, th
e st
udy
dire
ctor
doe
s not
nee
d to
be
notif
ied)
.If
ans
wer
to th
is q
uest
ion
is n
o, p
leas
e no
te w
hy.
If
5.2
is y
es, i
s the
re in
form
atio
n ex
plai
ning
the
situ
atio
n an
d its
reso
lutio
n in
the
ASR
?
If
5.2
is y
es, a
re c
hrom
atog
ram
s of s
ampl
es w
ith
unus
ual o
r inc
onsi
sten
t res
ults
incl
uded
in th
e A
SR?
(860
.100
0, p
.18)

Ver
sion
1.0
05/1
2/08
Pa
ge 5
of 5
Y
es
No
NA
N
otes
5.
3 A
re st
anda
rd c
urve
s and
pea
k he
ight
s/ar
eas f
or a
ll st
anda
rds a
vaila
ble
in th
e A
SR fo
r eac
h ru
n? (8
60.1
000,
p.
18)
If
5.3
is n
o, p
leas
e at
tach
a c
opy
of a
ny m
issi
ng
stan
dard
cur
ves w
ith p
eak
heig
hts/
area
s, so
the
stud
y di
rect
or m
ay a
dd th
em a
s an
appe
ndix
to th
e fin
al re
port.
5.4
Are
the
date
s the
test
com
poun
ds (s
tand
ard
solu
tions
) w
ere
prep
ared
incl
uded
in th
e A
SR?
(860
.150
0, #
3, p
. 37)
If 5
.4 is
no,
ple
ase
incl
ude
this
info
rmat
ion
with
th
is c
heck
list (
A c
opy
of th
e st
anda
rds p
rep
form
(s) i
s fin
e).
5.5A
re a
ll re
sidu
e va
lues
repo
rted
in th
e A
SR b
rack
eted
by
the
stan
dard
cur
ve?
If
5.5
is n
o, w
as th
e st
udy
dire
ctor
con
tact
ed?
Ana
lytic
al S
umm
ary
Rep
ort R
evie
wed
by:
Sign
atur
e D
ate