iq life after easy money - ssga.com€¦ · what forces are set to drive corporate performance as...
TRANSCRIPT

IQSpring 2018
Life After Easy Money

What forces are set to drive corporate performance as the age of easy money draws to a close?
Life After Easy Money
Using Tax Cuts to Help DB Plan Sponsors
How ESG Affects Stock Selection
New Valuation Calculus for R&D Assets
What a difference a quarter can make for markets and investors. Going into 2018, we argued that steady synchronized growth around the world and contained inflation would provide another supportive year for risk assets. At the same time, we cautioned that given where we were in the cycle and concerns around valuations, investors should prepare for a possible equity market correction and focus on downside risk management. This was especially true in the face of three anomalies that had puzzled investors over the last few years and which we flagged in our Global Market Outlook for 2018: historically low market volatility, low inflation despite continued declines in unemployment, and low productivity growth. As monetary stimulus yielded to fiscal stimulus, and a decade of easy money ended, we expected that the macro and market backdrop would become more challenging to navigate, with new risks and opportunities taking on greater significance for companies and investors. Specifically, in our Gray Swans risk forecast for the new year, we singled out tax reform, protectionism and inflation as the forces to watch.
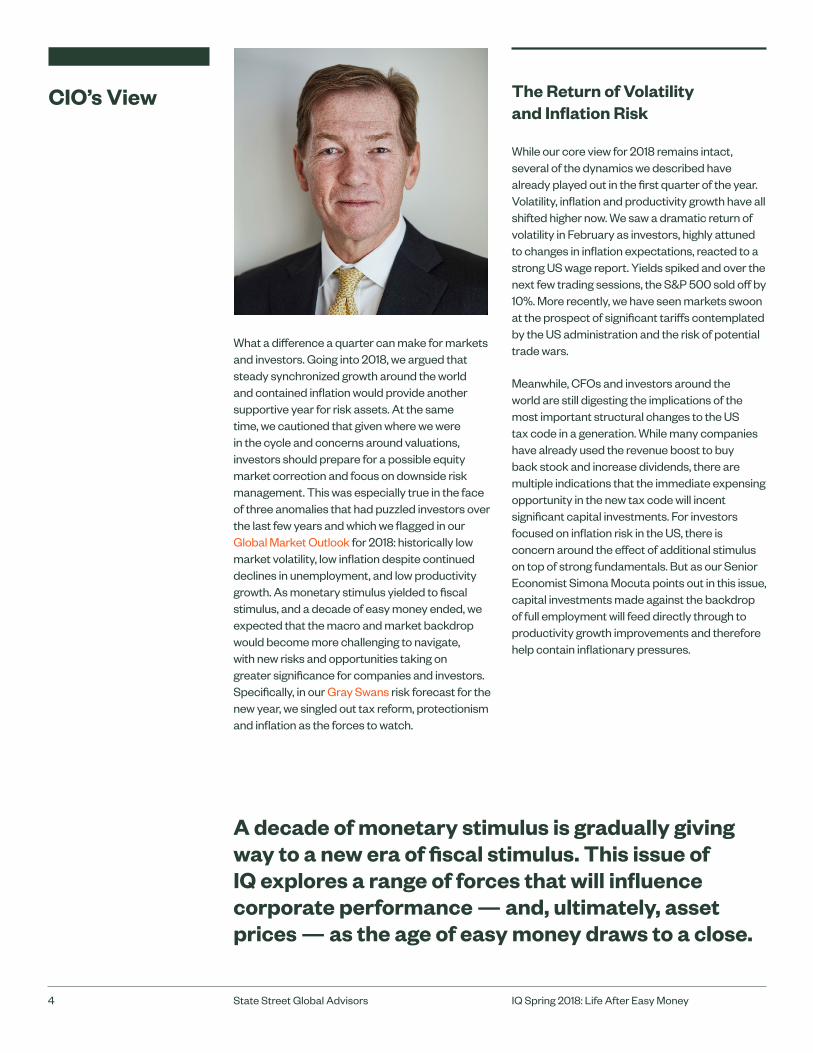
CIO’s View The Return of Volatility and Inflation Risk
While our core view for 2018 remains intact, several of the dynamics we described have already played out in the first quarter of the year. Volatility, inflation and productivity growth have all shifted higher now. We saw a dramatic return of volatility in February as investors, highly attuned to changes in inflation expectations, reacted to a strong US wage report. Yields spiked and over the next few trading sessions, the S&P 500 sold off by 10%. More recently, we have seen markets swoon at the prospect of significant tariffs contemplated by the US administration and the risk of potential trade wars.
Meanwhile, CFOs and investors around the world are still digesting the implications of the most important structural changes to the US tax code in a generation. While many companies have already used the revenue boost to buy back stock and increase dividends, there are multiple indications that the immediate expensing opportunity in the new tax code will incent significant capital investments. For investors focused on inflation risk in the US, there is concern around the effect of additional stimulus on top of strong fundamentals. But as our Senior Economist Simona Mocuta points out in this issue, capital investments made against the backdrop of full employment will feed directly through to productivity growth improvements and therefore help contain inflationary pressures.
A decade of monetary stimulus is gradually giving way to a new era of fiscal stimulus. This issue of IQ explores a range of forces that will influence corporate performance — and, ultimately, asset prices — as the age of easy money draws to a close.
4 IQ Spring 2018: Life After Easy MoneyState Street Global Advisors
The Tangible Value of Intangibles
Finally, we also introduce the economist Jonathan Haskel of Imperial College, London, to our investment roundtable. Jonathan’s book, Capitalism Without Capital: The Rise of the Intangible Economy, documents the structural shift in the global economy as companies driven by the value of their intellectual rather than physical property come to dominate capital investment. In both the US and UK, investment in intangible assets now outstrips that of tangible assets. This has a number of important implications, not the least of which is how to adapt traditional territorial taxation approaches to assets that are easily transferred across territorial boundaries. Moreover, traditional accounting approaches used to value and expense intellectual property and other intangible assets can give rise to mispricings that skilled managers can exploit. We also see evidence that the value of some intangible assets might be more sensitive to environmental, social and governance (ESG) issues, so that the importance of ESG factors is growing as the value of companies shifts from tangible to intangible. That is why we engage with our portfolio companies on a range of ESG themes through our asset stewardship practice and our investment teams consider ESG factors in their strategies. This year we called on companies to disclose their compliance with the corporate governance best practices we helped launch through the Investor Stewardship Group. Whether it is analyzing the winners and losers of changes to global tax regimes, the return of inflation risk or the rise of intangibles, life after easy money is providing fertile ground for skilled stock pickers to identify new growth and value opportunities.
Rick Lacaille Global Chief Investment Officer State Street Global Advisors
The End of International Tax and Trade Norms?
So what will life after easy money be like for companies and investors? At the very least, it will be more complex and more uncertain as the Trump administration challenges international norms across a variety of fronts, including trade and tax policies. In our investment roundtable discussion, global tax policy expert Mihir Desai of Harvard’s Business and Law Schools drills down into the instability the new US tax policy is inadvertently likely to create around the world. Desai applauds the core components of the historic tax reform: a lower corporate tax rate in line with headline rates around the world and a territorial system meant to remove incentives for US multinationals to offshore revenue. However, additional international taxes layered on top of this core, he says, have undone many of the positive effects. Instead they have increased complexity and the uncertainty of what the new rules will actually mean for US multinationals. They also seem to violate a number of international norms and so could be challenged for years at the World Trade Organization and other forums, while also opening the US to the risk of retaliatory tax cuts from other countries. Meanwhile, our investment teams weigh up the effects for global bond and equity investors, including the implications for private equity.
State Street Global Advisors Strategist Elliot Hentov argues that the tax cuts will also worsen the US trade deficit and heighten the risk of further protectionist moves from the Trump administration. This could be especially true as mid-term elections approach in November. While there is strong evidence that China has engaged in unfair trade practices, most trade experts argue that the blanket tariffs proposed thus far are a blunt instrument for challenges that require a more surgical approach to avoid all-out trade warfare. Investors must carefully monitor the unintended consequences of the US administration’s tax and trade policies and be prepared for choppier markets, including greater currency volatility.
5 IQ Spring 2018: Life After Easy MoneyState Street Global Advisors

The New Catalysts
Investment Roundtable
After a decade of central bankers acting as masters of the universe, deploying extraordinary monetary stimulus in the form of ultra-low interest rates and unprecedented asset purchases, investors now face a new set of forces driving growth and corporate earnings. All of that easy liquidity and low cost of capital was meant to spur spending in a painfully slow global economic recovery. In the event, it drove equity prices higher and seemed to reassure investors that the “Yellen collar” would provide both a floor and a ceiling to markets for as long as the recovery remained fragile. But with strengthening global growth, the Federal Reserve (Fed) is firmly on its policy normalization path and other major central banks are likewise beginning to tighten policy.
Clearly a new set of catalysts is taking precedence for corporate performance, as central bankers hand off the baton to fiscal stimulus. Deputy Global CIO Lori Heinel discusses the most significant of these new levers in the form of historic US tax cuts, the return of inflation and protectionist risks, as well as the inexorable rise of intangible-driven companies. Each of these will affect corporate winners and losers and create opportunities for skilled stock pickers. Joining Lori in the discussion are State Street Global Advisors Senior Economist Simona Mocuta, Harvard University’s Mihir Desai and Jonathan Haskel of Imperial College, London.
How Tax Cuts, Inflation Risk and Intangibles are Changing the Stock-Picking Calculus.

Jonathan Haskel, PhD, is Professor of Economics and Director of Research at Imperial College Business School. He received his PhD in economics from the London School of Economics and an undergraduate degree in economics from Bristol University. His main research interests are in productivity, innovation, intangible investment and growth. He was the joint winner of the Indigo Prize for his work on re-engineering GDP. His latest book is Capitalism Without Capital: the Rise of the Intangible Economy.
Mihir Desai, PhD, is the Mizuho Financial Group Professor of Finance at Harvard Business School, and a Professor of Law at Harvard Law School and an expert on global tax policy. He received his PhD in political economy from Harvard University, his MBA as a Baker Scholar from Harvard Business School and a bachelor’s degree in history and economics from Brown University. In 1994, he was a Fulbright Scholar to India. His latest book is The Wisdom of Finance, Discovering Humanity in the World of Risk and Return.
Simona Mocuta is a Senior Economist and Vice President with the Investment Solutions Group at State Street Global Advisors. She is responsible for monitoring and interpreting global economic developments, producing G8 economic forecasts with particular focus on Australia, Canada and the UK. She holds a Masters in International Economics from Suffolk University in Boston and an undergraduate degree in International Economic Relations from West University of Timisoara, Romania.
Lori Heinel, CFA is Deputy Global Chief Investment Officer at State Street Global Advisors. She is responsible for a range of activities that impact the effective delivery of investment strategies and solutions to our global client base, including representing our market outlook and investment themes, taking a lead role in investment strategy oversight, governance and innovation and managing the implementation of enterprise-wide initiatives. She received her MBA from Carnegie Mellon University and an AB in religion from Princeton University.
Lori Heinel, CFA Deputy Global Chief Investment Officer, State Street Global Advisors
Simona Mocuta Senior Economist, State Street Global Advisors
Mihir Desai, PhD Mizuho Financial Group Professor of Finance, Harvard Business School, Professor of Law, Harvard Law School
Jonathan Haskel, PhD Professor of Economics and Director of Research, Imperial College Business School
7 IQ Spring 2018: Life After Easy MoneyState Street Global Advisors
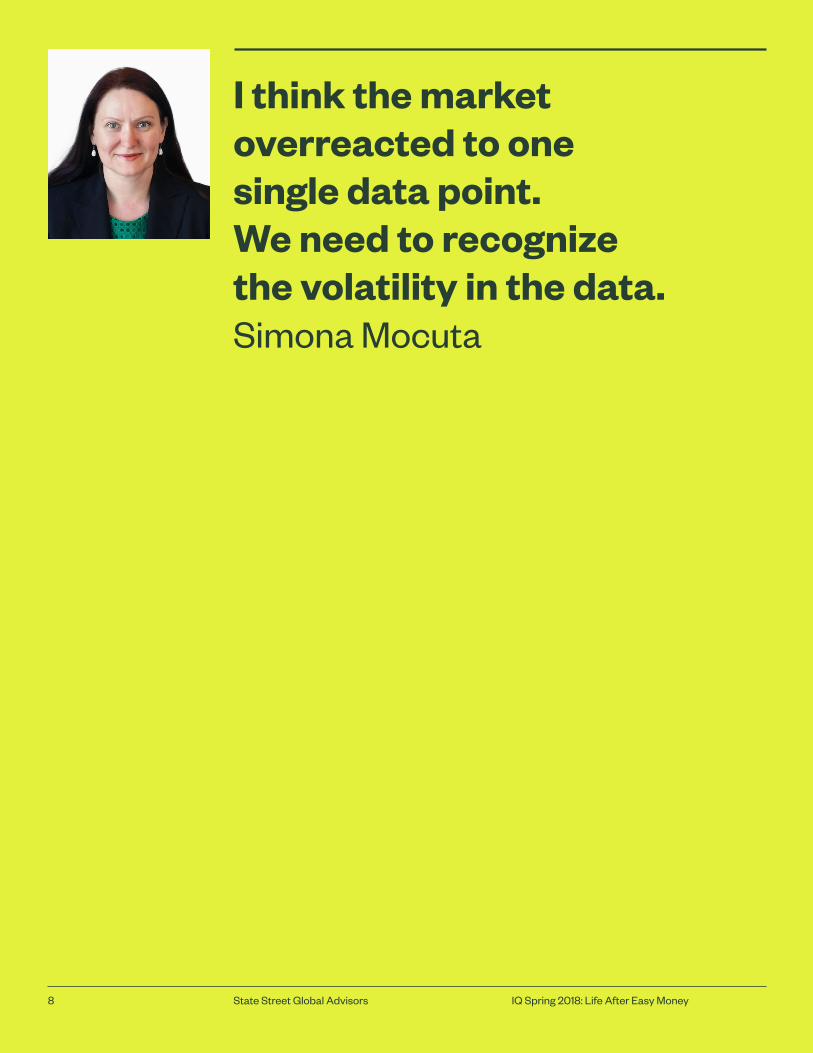
I think the market overreacted to one single data point. We need to recognize the volatility in the data. Simona Mocuta
8 IQ Spring 2018: Life After Easy MoneyState Street Global Advisors

Heinel. Let me start with you, Simona: as expected, we saw investor concern around inflation risk drive yields higher in early February after a strong US wage report. After a year of historically low market volatility, investors finally shed their complacency and we saw a 10% correction in the S&P 500. Are investors right to be worried about inflation risk?
Mocuta. Investors are certainly right to watch inflation more closely, given the closure of the output gap and incoming fiscal stimulus in the US, but I think the market overreacted to one single data point. We need to recognize the volatility in the data. In fact, that same overall average hourly earnings index that hit a cyclical high in January had touched a two-year low just two months prior. There are multiple measures of wage inflation and they are all accelerating, as they should be, given the length of the recovery and the decline in the US unemployment rate to 4.1%. However, investors should remember that generating persistent wage inflation is a long process, and I don’t see a spike in wage inflation as an imminent risk in 2018.
Heinel. If you do not see an immediate upside risk to price inflation from rising wages, why has the yield on the US 10-year risen so far in such a short amount of time?
Mocuta. I think it is important to remember where the bond market was with negative term premia. There is a case to be made that bond investors were already retreating from an extreme and unsustainable situation and that the wage data was just a further catalyst in that process. This is not to say that the move had nothing to do with inflation. A number of stimulative policies (the tax cut, increase in spending, etc.) will provide a demand boost; directionally, this is inflationary. But the question is about magnitude and timing. It takes time for these forces to play out. The wage story gets you there, but it is a slow-moving process. We’re not set to see a huge bump this year. We likely will see an uptick thanks to an increase in one-time bonuses following the tax cuts, but those will be limited. At the same time, the quit ratio in the US is still low, suggesting continued worker reluctance to change jobs or demand higher wages. Unless you get persistent wage inflation, you’re unlikely to get spiraling inflation.
My view is that the upside risk to inflation this year won’t come from wage inflation but rather from a policy mistake around, say, protectionism, which would be inflationary. Or there could be a supply shock to commodities that the Fed is not expecting. As global growth has improved, we have seen strong demand globally for commodities, so disruptions to supply would translate much more quickly into significant price changes.
Heinel. If either of those scenarios played out, you would see a differentiated effect across equity sectors. In the case of protectionism, small-cap companies less dependent on global trade would likely fare better. Similarly, a rapid rise in the price of oil would be felt most directly by energy-intensive industries.
Inflation Risk
9 IQ Spring 2018: Life After Easy MoneyState Street Global Advisors
Are investors right to be worried about inflation risk?
Why has the yield on the US 10- year Treasury bond risen so far in such a short amount of time?
For some companies, the effects are not as positive as originally hoped. Most importantly, the new international taxes mean that rather than move to territoriality, we have effectively kept a worldwide system and repealed deferral. Finally, this is a fairly unstable system because it violates a number of international norms and rules and it is fiscally pretty unsound. Mihir Desai
10 IQ Spring 2018: Life After Easy MoneyState Street Global Advisors
Heinel. What about the effect of the US corporate tax cuts? Mihir, you have made global tax policy the center of your career. How should we be thinking about the effects of the US tax changes, not only for US multinationals, but for companies around the world? Is it a net positive?
Desai. On the whole I would say the changes represent a moderate positive, but the devil is in the details. As corporate CFOs delve into what is some mind-boggling complexity, it is becoming clear that the rules will affect different companies and sectors in different and, in some cases, unexpected ways. This is what happens when you try to rush through major tax reform in three weeks in December. For some companies, the effects are not as positive as originally hoped. Most importantly, the new international taxes mean that rather than move to territoriality, we have effectively kept a worldwide system and repealed deferral. Finally, this is a fairly unstable system because it violates a number of international norms and rules and because it is fiscally pretty unsound. Like the tax reform of 1981, I expect there will be years of clean-ups and lobbying to change certain aspects of the rules. This creates a climate of uncertainty, and in the case of other countries, I expect we will see retaliatory cuts in their corporate tax rates, since the effective rate for many US multinational companies now undercuts what prevails outside the US.
Heinel. What about the macroeconomic implications of the new rules?
Desai. From a macro perspective, the better investment incentives for investing in the US will be moderated by the fiscal consequences of the bill and the attendant rise in rates. Moreover, the administration’s estimate that these cuts will cost the government USD 1.5 trillion underestimates the true number. Many expiring cuts will be made permanent and the lower pass-through tax rates will stimulate much avoidance activity. So fiscally, we are still faced with the hard truth that there is a significant gap between what the government spends and what it takes in from tax receipts. At the moment the US spends 21% of its GDP versus 17% in GDP in tax revenue — and that can last only so long.
Heinel. You have spoken about the unintended consequences of the new tax code. What do you mean by that?
Desai. Reducing the headline corporate rate and moving to a territorial system where companies are taxed only once on the revenue they earn outside the US were important and long overdue changes. Those alone would have been hugely important, much more so than what was last done in the 80s, because the changes are structural. They would have brought us in line with other countries’ practices and reduced the “self-help” approaches that led to the wave of mergers and offshoring we saw, particularly with tech and pharmaceutical companies, as US multinationals sought to evade the higher headline corporate rate. But the additional international taxes (a minimum tax, an export-contingent patent box and a base-erosion tax) and the pass-through rules offset much of the good from the core changes. At the very least, they add tremendous complexity to rules that companies are still trying to figure out.
How should we be thinking about the effects of the US tax changes for companies around the world? Is it a net positive?
What about the macroeconomic implications and unintended consequences of the new rules?
Tax Cuts
11 IQ Spring 2018: Life After Easy MoneyState Street Global Advisors
Heinel. Who are the winners and losers when it comes to equity sectors?
Desai. Truly domestic companies in the US will be clear beneficiaries of the new lower corporate tax rate, so for example, construction companies. For US multinationals, it is a much more mixed picture. For example, it is not at all clear whether the new rules will end the practice of offshoring intellectual property. Some of the clear losers are those companies who benefited from the previous “self-help” regime of shopping for lower rates abroad. The minimum rates of 10% or 13.125% for revenue earned abroad could actually be higher than what they had been paying. So I think we need additional clarity about how these overlapping rules will net out for companies, particularly those intangible-driven companies in the tech and pharmaceutical sectors.
Source: Professor Mihir Desai, Harvard Business School.
Heinel. Do we think US companies will use the opportunity presented by immediate expensing to increase capital investments?
Mocuta. We should see more capital expenditure because of where we are in the cycle. The previous tax rules incented companies to invest overseas. Now you have a lower corporate rate as well as immediate expensing for five years. Capacity utilization is high, demand is very strong, labor is tight. And now you have the new policy incentives to invest. If not now, then when? Another important effect of those capital expenditures in this full employment environment is that they will directly improve productivity growth, which should create a certain cap on inflation. That is another reason I do not see an immediate upside risk to inflation. The tax cuts and potential fiscal stimulus from infrastructure spending provide a demand boost, but immediate expensing and the shift to a territorial system, if it in fact reduces offshoring incentives, are conducive to a matching supply response.
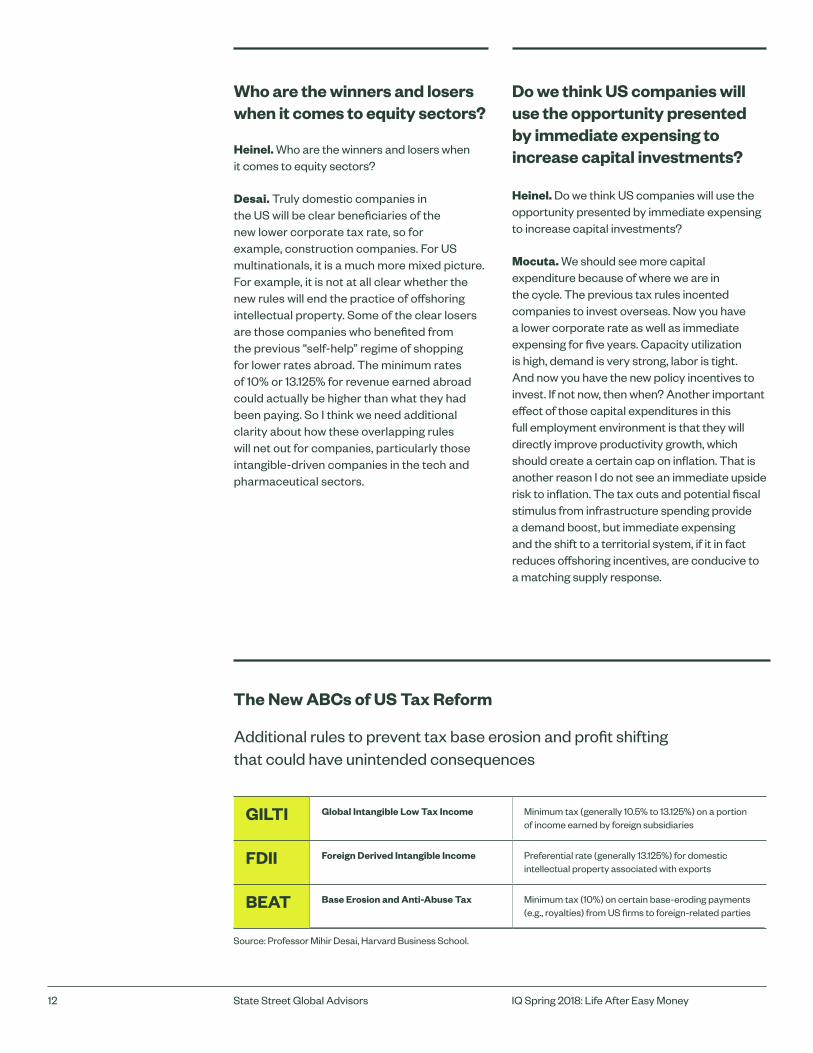
GILTI Global Intangible Low Tax Income Minimum tax (generally 10.5% to 13.125%) on a portion of income earned by foreign subsidiaries
FDII Foreign Derived Intangible Income Preferential rate (generally 13.125%) for domestic intellectual property associated with exports
BEAT Base Erosion and Anti-Abuse Tax Minimum tax (10%) on certain base-eroding payments (e.g., royalties) from US firms to foreign-related parties
Additional rules to prevent tax base erosion and profit shifting that could have unintended consequences
The New ABCs of US Tax Reform
12 IQ Spring 2018: Life After Easy MoneyState Street Global Advisors
Who are the winners and losers when it comes to equity sectors?
Do we think US companies will use the opportunity presented by immediate expensing to increase capital investments?
In the US and UK, intangible assets account for more investment than traditional tangible assets. That shift has important implications for how investors think about the valuations and growth prospects of these new kinds of companies. Jonathan Haskel
13 IQ Spring 2018: Life After Easy MoneyState Street Global Advisors
Heinel. Jonathan, I think Mihir’s points about the difficulties of understanding how the new US tax rules will affect the offshoring behavior of intangible-driven companies in, for example, the tech and healthcare sectors points to the larger issues that are at the center of your latest book, Capitalism Without Capital, The Rise of the Intangible Economy. This shift to intangibles has caused quite a bit of soul-searching among policymakers. You essentially argue that we need to completely rethink how we tax, regulate and value these companies, whose growth is driven by intangible assets like the intellectual property (IP) around software and drug patents or branding. Is this the biggest catalyst of all in terms of disrupting traditional methods of analyzing and valuing the growth prospects of companies?
Haskel. I think the first point to make is that this shift to the intangible economy is already well underway. In the US and UK, intangible assets account for more investment than traditional tangible assets (see Figures 1 and 2). That shift has important implications for how investors think about the valuations and growth prospects of these new kinds of companies. They also present policy challenges around areas like taxation and regulation. It is much easier for a company to relocate IP around the world than it is with physical property.
Analysts need to think differently about these companies’ growth prospects because the scalability of their growth model is very different from a traditional type of company. For example, if you’re running a taxi cab company and you want to carry more passengers, you have to order more taxi cabs. If you are running a platform-based company like Uber and you want to carry more passengers, you can basically use the same software, so there is no extra cost. So with very little incremental investment, these new kinds of companies can scale up very quickly and dramatically.
For traditional companies, investment analysts have thought of growth prospects in terms of taking on more staff and building additional physical plant and equipment. Again, taxi cab companies would have to acquire more taxis and Walmart would have to open more stores, all of which is very tangible. By contrast, in the new intangible economy, companies will expand and contract more quickly as many more firms vie to be the winner in the race to create and monetize intangible assets. And the cost of entry is much lower, so new sectors could have many more firms for investors to consider at early stages than in previous generations.
Intangibles
14 IQ Spring 2018: Life After Easy MoneyState Street Global Advisors
Are intangible assets like intellectual property the biggest catalyst of all in terms of disrupting traditional methods of analyzing and valuing the growth prospects of companies?
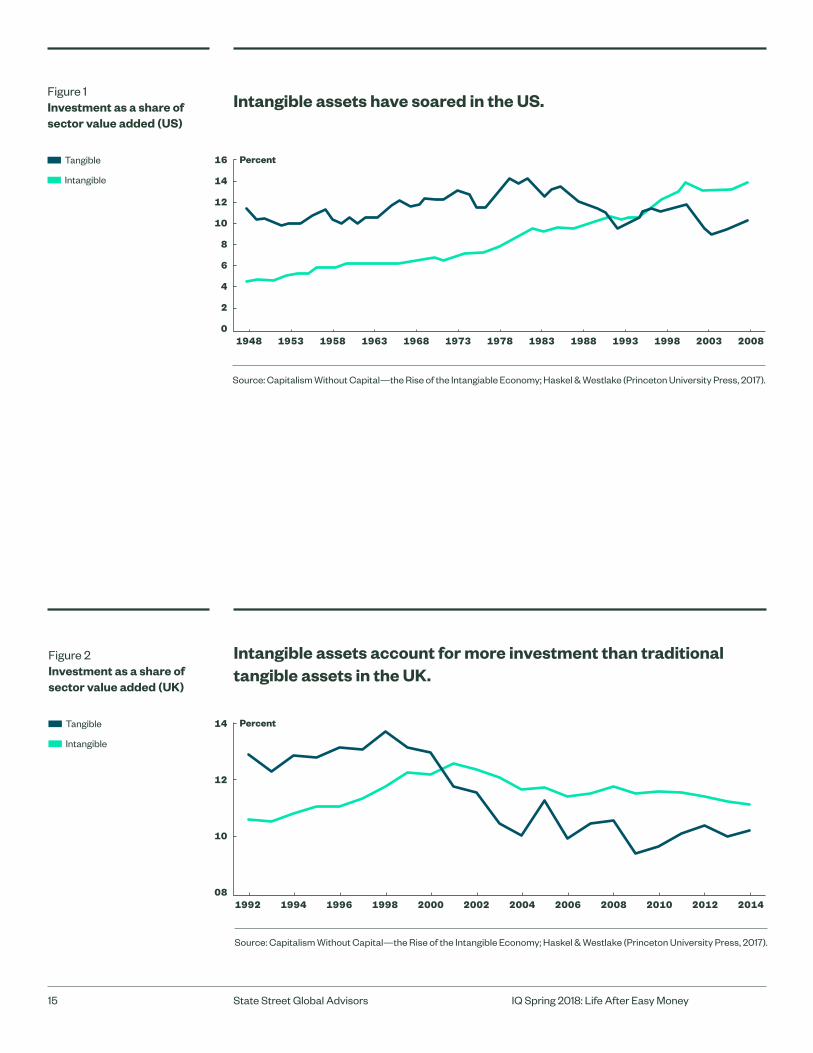
Figure 2 Investment as a share of sector value added (UK)
Tangible
Intangible
Source: Capitalism Without Capital—the Rise of the Intangible Economy; Haskel & Westlake (Princeton University Press, 2017).
Intangible assets account for more investment than traditional tangible assets in the UK.
Figure 1 Investment as a share of sector value added (US)
Tangible
Intangible
Source: Capitalism Without Capital —the Rise of the Intangiable Economy; Haskel & Westlake (Princeton University Press, 2017).
01948 1968 1973 1978 1983 1988 1993 1998 20031953 1958 1963 2008
16
10
12
14
2
4
6
8
Intangible assets have soared in the US.
081992 2000 2002 2004 2006 2008 2010 20121994 1996 1998 2014
14
12
10
Percent
Percent
15 IQ Spring 2018: Life After Easy MoneyState Street Global Advisors
Heinel. I agree that these companies present new challenges around valuing intangibles. Because we are still in the early stages of understanding how to account for them, I think there are significant opportunities for active managers to identify mispricings.
Our equity investors are already adjusting the way they value tech and healthcare companies, precisely because of the role of intangible assets. They have created a new, proprietary research and development (R&D) factor for their valuation models to account for the IP inherent in software or drug development in a more nuanced way. For example, in the case of pharmaceutical or biotech companies, the long-term nature of drug development means that the value of the IP varies according to what stage of development the compound is in. It is a much more complex analysis than the traditional depreciation models of physical assets.
Desai. I also think the rise of these intangible-driven companies is going to lead to far-reaching changes in global tax policies. Tech companies like Google and Facebook are already coming under pressure from European countries who are pushing back on their protestations that they earn no revenue in their countries. It’s a big problem, and one that I think will drive the shift toward a destination-driven taxation system, because consumption is the one variable that you can’t easily move somewhere else.
Globally the trend is to make all the tax regimes destination-based, so tax consumption rather than income. In a digital economy it is unclear where income is being generated so the system is unstable.
As intangibles grow, we’ll move toward a destination-based system in which consumption is taxed. I imagine that the US will have some form of consumption taxation in the next 10 years.
Heinel. In the meantime, however, it sounds as if we are likely to have an unstable global tax system with a range of uncertain outcomes. This might be another promising area for skilled managers to understand the intricacies of the interim system and, more importantly, discern how that will affect capital allocation decisions for companies across sectors and regions as well as their ability to generate strong, long-term earnings for their investors.
16 IQ Spring 2018: Life After Easy MoneyState Street Global Advisors
These companies present new challenges around valuing intangibles.
Because we are still in the early stages of under-standing how to account for them, I think there are significant opportunities for active managers to identify mispricings. Lori Heinel
17 IQ Spring 2018: Life After Easy MoneyState Street Global Advisors
What Do US Tax Cuts Mean for Global Investors?
Investment Impact
Amlan Roy, PhD Global Chief Retirement Strategist
Amy Le Investment Strategist Global Demographics & Retirement Research
The tax reform recently enacted in the US has been billed as the most comprehensive since the 1980s, with far-reaching consequences for US companies and their foreign counterparts. As companies can no longer rely on central banks to provide liquidity in an age of gradual policy normalization, catalysts such as changes in global tax regimes will exert a stronger influence on corporate performance. Given the complexities and uncertainties of the new system (discussed in our investment roundtable), an assessment of the impact of these reforms can be only preliminary. Nonetheless, our researchers found that some
sectors will derive significant long-term benefits, others will lose out and the overall economic impact could be modest.
There should, however, be substantial rewards for those companies that were previously highly taxed and that have strong balance sheets and large amounts of offshore cash to repatriate. In our view, the impact of the tax changes on these companies and the likely pick-up in M&A and share buybacks are underestimated by the market, creating the potential for outperformance.
Recent tax reform in the US will have far-reaching consequences for both US and foreign companies. Which sectors will benefit —and which will lose out?

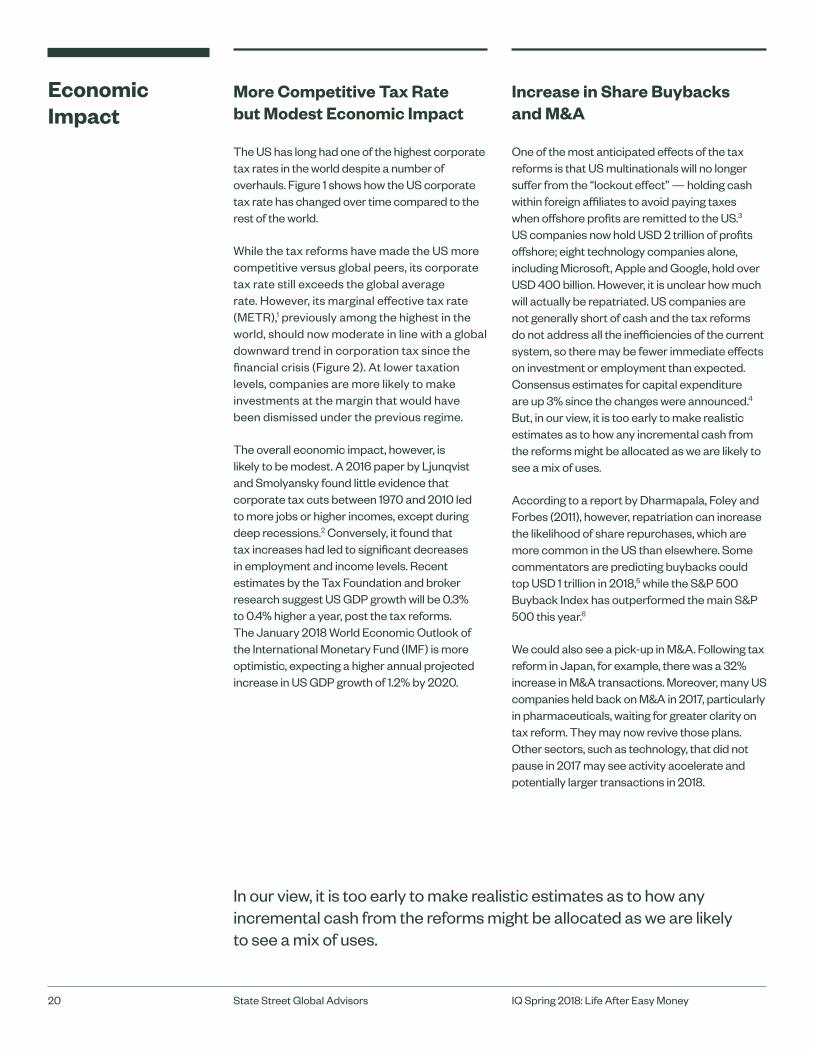
More Competitive Tax Rate but Modest Economic Impact
The US has long had one of the highest corporate tax rates in the world despite a number of overhauls. Figure 1 shows how the US corporate tax rate has changed over time compared to the rest of the world.
While the tax reforms have made the US more competitive versus global peers, its corporate tax rate still exceeds the global average rate. However, its marginal effective tax rate (METR),1 previously among the highest in the world, should now moderate in line with a global downward trend in corporation tax since the financial crisis (Figure 2). At lower taxation levels, companies are more likely to make investments at the margin that would have been dismissed under the previous regime.
The overall economic impact, however, is likely to be modest. A 2016 paper by Ljunqvist and Smolyansky found little evidence that corporate tax cuts between 1970 and 2010 led to more jobs or higher incomes, except during deep recessions.2 Conversely, it found that tax increases had led to significant decreases in employment and income levels. Recent estimates by the Tax Foundation and broker research suggest US GDP growth will be 0.3% to 0.4% higher a year, post the tax reforms. The January 2018 World Economic Outlook of the International Monetary Fund (IMF) is more optimistic, expecting a higher annual projected increase in US GDP growth of 1.2% by 2020.
Increase in Share Buybacks and M&A
One of the most anticipated effects of the tax reforms is that US multinationals will no longer suffer from the “lockout effect” — holding cash within foreign affiliates to avoid paying taxes when offshore profits are remitted to the US.3 US companies now hold USD 2 trillion of profits offshore; eight technology companies alone, including Microsoft, Apple and Google, hold over USD 400 billion. However, it is unclear how much will actually be repatriated. US companies are not generally short of cash and the tax reforms do not address all the inefficiencies of the current system, so there may be fewer immediate effects on investment or employment than expected. Consensus estimates for capital expenditure are up 3% since the changes were announced.4 But, in our view, it is too early to make realistic estimates as to how any incremental cash from the reforms might be allocated as we are likely to see a mix of uses.
According to a report by Dharmapala, Foley and Forbes (2011), however, repatriation can increase the likelihood of share repurchases, which are more common in the US than elsewhere. Some commentators are predicting buybacks could top USD 1 trillion in 2018,5 while the S&P 500 Buyback Index has outperformed the main S&P 500 this year.6
We could also see a pick-up in M&A. Following tax reform in Japan, for example, there was a 32% increase in M&A transactions. Moreover, many US companies held back on M&A in 2017, particularly in pharmaceuticals, waiting for greater clarity on tax reform. They may now revive those plans. Other sectors, such as technology, that did not pause in 2017 may see activity accelerate and potentially larger transactions in 2018.
Economic Impact
In our view, it is too early to make realistic estimates as to how any incremental cash from the reforms might be allocated as we are likely to see a mix of uses.
20 IQ Spring 2018: Life After Easy MoneyState Street Global Advisors
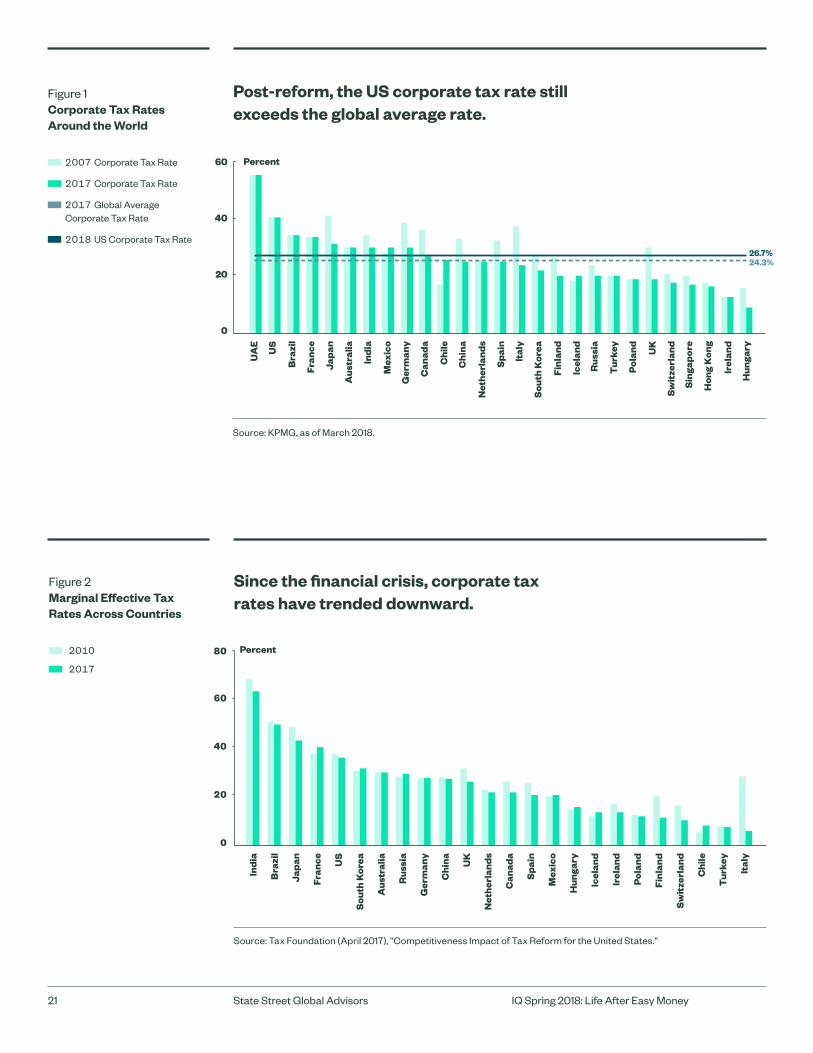
Figure 2 Marginal Effective Tax Rates Across Countries
2010
2017
Source: Tax Foundation (April 2017), “Competitiveness Impact of Tax Reform for the United States.”
0
Indi
a
Bra
zil
Japa
n
Fran
ce US
Sou
th K
orea
Aus
tral
ia
Rus
sia
Ger
man
y
Chi
na UK
Net
herl
ands
Can
ada
Spa
in
Mex
ico
Hun
gary
Icel
and
Irel
and
Pola
nd
Finl
and
Sw
itze
rlan
d
Chi
le
Tur
key
Ital
y
Percent
60
40
20
Figure 1 Corporate Tax Rates Around the World
2007 Corporate Tax Rate
2017 Corporate Tax Rate
2017 Global Average Corporate Tax Rate
2018 US Corporate Tax Rate
Post-reform, the US corporate tax rate still exceeds the global average rate.
Since the financial crisis, corporate tax rates have trended downward.
Source: KPMG, as of March 2018.
0
UA
E
US
Bra
zil
Fran
ce
Japa
n
Aus
tral
ia
Indi
a
Mex
ico
Ger
man
y
Can
ada
Chi
le
Chi
na
Net
herl
ands
Spa
in
Ital
y
Sou
th K
orea
Finl
and
Icel
and
Rus
sia
Tur
key
Pola
nd UK
Sw
itze
rlan
d
Sin
gapo
re
Hon
g K
ong
Irel
and
Hun
gary
Percent60
40
20
26.7%24.3%
80
21 IQ Spring 2018: Life After Easy MoneyState Street Global Advisors
Our AQE team looks at three main factors when assessing which stocks to include in its portfolio: quality, value and sentiment. The team finds a positive relationship between companies’ profitability and their effective tax rates, and that less leveraged companies, which do not benefit from tax shields, pay higher rates. Given such companies typically have better balance sheets and are more profitable, the team concludes that tax reform should favor the quality factor. Additionally, they find a positive relationship
between the value factor and tax rates, as the higher taxed companies are, on average, more attractively priced than those paying less tax. As regards sentiment, using a proxy of forecasted earnings trends across companies with different tax rates, the team finds little evidence of any meaningful relationship, suggesting that the market has yet to fully digest these reforms and factor them into earnings upgrades or downgrades. Such mispricing offers the potential for excess returns.
Factor Valuations
While complex tax reforms often have unforeseen consequences and will affect individual companies differently, we believe there are likely to be winners and losers in the equity market. Our active quantitative equity (AQE) team has designed a model to assess the impact of the changes on different sectors. It gives each company in the Russell 3000 a tax score,7 groups them into industries and takes the median score for the set. It also gives each company an alpha score8 — an estimate of how it will perform in the near future — and plots that against the tax score (Figure 3).
The AQE team believes that industries such as retail in the top right quadrant of this figure, with high tax and high alpha scores, should benefit most from the new tax regime. In particular, the highest tax-paying consumer-focused
industries, given their quality balance sheets and cheaper valuations, are likely to be winners in a lower tax regime, alongside transport and professional services. On the flip side, industries that screen poorly on the team’s alpha model, like biotechnology and energy, and pay the lowest taxes, stand to gain little and are likely to underperform going forward.
In addition, the ability to expense capital expenditure immediately should benefit capital-intensive industries such as railroads, airlines and manufacturing of heavy machinery and electrical equipment. Meanwhile, the lowering of mortgage interest deductions and the cap on state and local taxes, particularly in high tax states such as California and New York, could adversely influence the real estate sector.
Equities
The highest tax-paying consumer-focused industries, given their quality balance sheets and cheaper valuations, are likely to be winners in a lower tax regime, alongside transport and professional services.
22 IQ Spring 2018: Life After Easy MoneyState Street Global Advisors
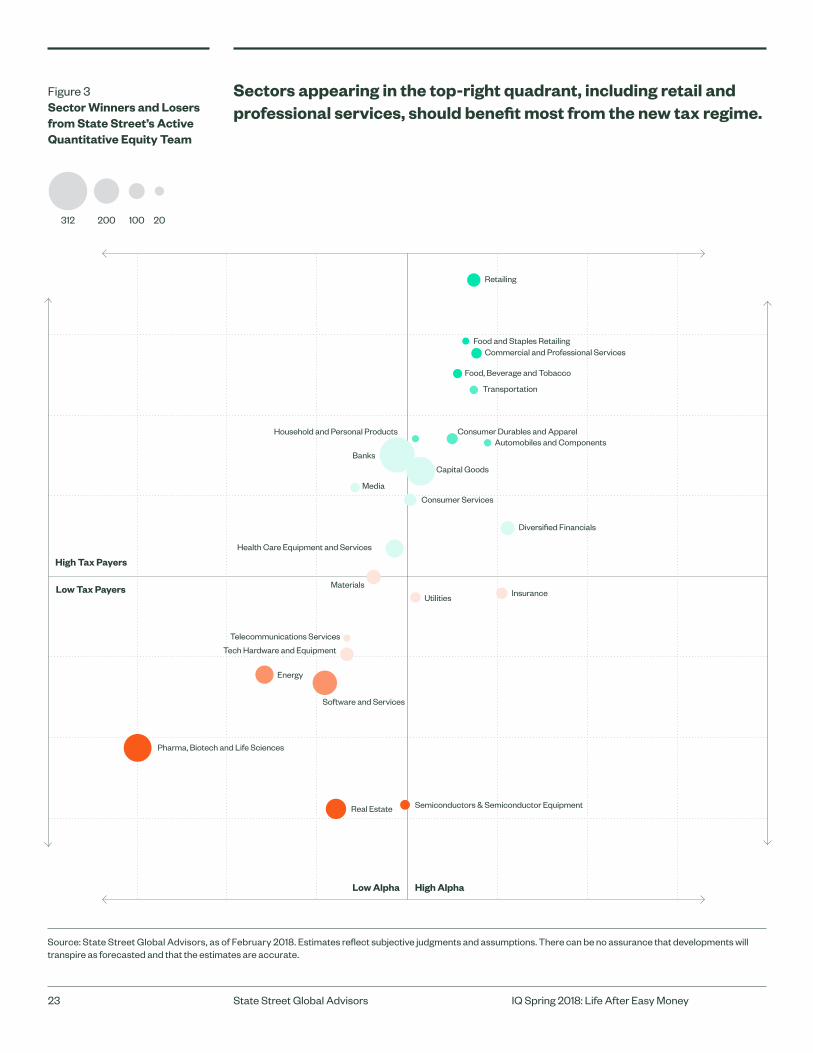
Figure 3 Sector Winners and Losers from State Street’s Active Quantitative Equity Team
Sectors appearing in the top-right quadrant, including retail and professional services, should benefit most from the new tax regime.
Retailing
Commercial and Professional Services
Food, Beverage and Tobacco
Transportation
Food and Staples Retailing
Household and Personal ProductsAutomobiles and Components
Capital Goods
Banks
Consumer Durables and Apparel
Media
Consumer Services
Diversified Financials
Health Care Equipment and Services
Materials
Utilities Insurance
Tech Hardware and Equipment
Telecommunications Services
Energy
Software and Services
Pharma, Biotech and Life Sciences
Real Estate Semiconductors & Semiconductor Equipment
312 200 100 20
High Tax Payers
Low Tax Payers
Low Alpha High Alpha
Source: State Street Global Advisors, as of February 2018. Estimates reflect subjective judgments and assumptions. There can be no assurance that developments will transpire as forecasted and that the estimates are accurate.
23 IQ Spring 2018: Life After Easy MoneyState Street Global Advisors
Sovereigns. The US Congressional Budget Office (CBO) estimates that the tax reforms will increase the deficit by roughly USD 1.5 trillion over the next 10 years. In concert with the Fed’s ongoing balance sheet reduction, this could lead to a big expansion in Treasury supply and cause further rises in longer-term US government bond yields such as the 10-year rate,9 pushing up the cost of borrowing for companies. The overall fiscal stimulus could lead to higher tax receipts over the long term, though, as we have seen above, tax cuts alone do not appear to drive economic growth.
Investment Grade. Despite the potential for higher government bond yields, a lower tax rate should be moderately positive for investment-grade bonds and we expect to see spreads over Treasuries narrow. As with equities, so with bonds; different companies will win or lose depending on their situations. However, using Internal Revenue Service (IRS) data, Longstaff and Strebulaev (2014)10 found a direct relationship between changes in corporate leverage and changes in corporate tax rates for all except the smallest firms, and that an increase in corporate leverage over time influences corporate capital structure.
Higher after-tax profitability should enable companies to reduce their debt levels, better service their existing commitments and avoid taking on new debt to fund growth. However, we expect the impact on overall financial leverage to be limited. Our fixed income team estimates that, assuming 25% of tax-reform-related incremental cash (excluding repatriation flows) is used to pay down debt, corporate bond spreads over Treasuries will narrow by slightly more than two basis points by the end of 2018 for the industrial component of the Bloomberg Barclays US Credit Index.
Repatriated cash, however, may be net negative for credit if the money is used for share repurchases or M&A and cash cushions are reduced.11 Also, more M&A could lead to greater supply of bonds, alongside cash, to finance deals. The new interest expense deductibility limits are not a material negative factor for investment-grade companies in the near term, in our view, and will only have a mild impact on bond supply over the long term.
Bonds Financials are likely to be among the winners in the credit space. They tend to pay higher effective tax rates than their industrial counterparts, due to a lack of tax-based incentives and depreciating assets that may be used to reduce tax. So the tax rate reduction should flow directly to the bottom line, making additional funds available for investment in operations or distribution to shareholders; regulations make it unlikely to be used to reduce debt. They will have to write off deferred tax assets, which will hurt short-term profits, but this should be offset by other changes over the long term.
Utilities are likely to be significant losers, because they generally pass through the corporate tax rate to customers, while paying little tax themselves. This difference, which is accounted for as deferred taxes, is a material benefit to utilities’ cash-flow measures and will now decrease with the lower rate. In our view, some utilities will have sufficient levers to manage this transition, while others could see their credit rating downgraded.
Municipal Bonds. Municipal bonds should gain from the tax changes in aggregate. The tax-free nature of muni coupons means retail demand for them is likely to increase in high-tax states where local taxation is now capped at USD 10,000 per annum and more people will be looking for ways to reduce their taxable income. Institutional demand on balance is likely to be negative, as demand from banks and insurers will decrease due to the lower corporate tax rate. However, this could be partially offset if Congress designates munis as High-Quality Liquid Assets (HQLA) later this year. If designated as HQLA, munis would become more valuable to banks in their liquidity calculation requirements for regulators.
We expect the muni supply to decrease by approximately 15% as the bonds can no longer be “advance refunded.” This means municipal issuers will now only be able to refinance their bonds after their call dates, as opposed to at any time after they had issued them, which had previously been the case. Historically, call dates have been set for 10 years after a bond was issued. We expect the elimination of advance refunding to cause issuers to gradually alter bond structures to include shorter call dates, shorter maturities and lower coupons or instead to issue taxable “advance refunding” bonds.12
24 IQ Spring 2018: Life After Easy MoneyState Street Global Advisors

25 IQ Spring 2018: Life After Easy MoneyState Street Global Advisors
Conclusion In our increasingly technology-driven and globalized world, the US tax changes are likely to make the country a more competitive place to do business. However, the complexity of the reforms and their failure to tackle more of the inefficiencies of the previous tax code means the long-term economic impact may be limited, especially at this point in the business cycle. Management teams will have more choices when it comes to allocating capital and trying to balance credit-friendly actions with shareholder awards, so security selection is likely to become more important to equity and bondholders alike. Certain sectors will benefit more than others, and until the market prices in the full impact of the reforms, including secondary effects around the world, this should create harvestable value for investors.
1 P. Bazel and J.M. Mintz (2017), “Competitive Impact of Tax Reform for the United States,” The Tax Foundation.
2 Alexander Ljungqvist and Michael Smolyansky (2016), “To Cut or Not to Cut? On the Impact of Corporate Taxes on Employment and Income.”
3 Dhammika Dharmapala (2017), “The Economics of Corporate and Business Tax Reform.”
4 Robin Wigglesworth, “As the Market Swoons, Share Buybacks Are Back,” Financial Times (February 21, 2018); https://www.ft.com/content/7a3529ce-1667-11e8-9e9c-25c814761640.>
5 http://www.valuewalk.com/2018/02/trump-corporate-buybacks/
6 Robin Wigglesworth, “As the Market Swoons, Share Buybacks Are Back,” Financial Times (February 21, 2018); https://www.ft.com/content/7a3529ce-1667-11e8-9e9c-25c814761640.>
7 An effective tax rate, an effective tax rate adjusted for extraordinary items and a cash tax rate are calculated. These rates are standardized into percentiles across the Russell 3000. The average of these scores is taken, then this final score is re-standardized again into percentiles. As of December 29, 2017.
8 Each company’s alpha score is our proprietary view of whether that company will outperform or underperform in the coming months. This is estimated using our bottom-up stock selection model, which looks at each company’s relative valuation, sentiment and quality.
9 Goldman Sachs Economics Research (2018), “Larger Deficits, Smaller Balance Sheet: Implications for the Treasury Market.”
10 Longstaff and Strebulaev (2014), “Corporate Taxes and Capital Structure: A Long-term Historical Perspective.”
11 J.P. Morgan North America Credit Research (2017), “HG Bond Supply and Tax Reform.”
12 Taxable “advance refunding” bonds can be refunded by the issuer earlier than the call date but only using taxable (not tax-exempt) debt. Typically, taxable debt is more expensive (with a higher yield) than tax-exempt debt, so interest rate levels will determine whether issuing them makes financial sense.
With contributions from State Street Active Quantitative Equity and Credit Strategies teams

26 IQ Spring 2018: Life After Easy MoneyState Street Global Advisors
Corporate Tax Cut. The permanent corporate tax cut from 35% to 21% should provide the main tailwind for both public and private companies, boosting the amount of profits available to fund operational investment and M&A. For some companies, particularly more cyclical or challenged businesses, changes in expense deductions and certain credits will offset some of the tax rate benefit. For example, companies will have to write down “deferred tax assets,” losses from prior years that can be used to reduce future years’ taxable income, as the new tax rate has reduced the size of these benefits.
Additionally, future net operating losses (NOLs) from 2018 onwards can offset no more than 80% of taxable income in any given year, though they can be carried forward indefinitely. Cyclical, loss-making firms, whether publicly or privately held, will be most impacted by the restrictions on utilizing losses. Separately, state income taxes, while still deductible for corporations, will become a larger part of companies’ overall tax liability as the federal tax burden shrinks, which may cause some firms to consider relocating.
Expensing Capital Expenditure. From 2018 through 2022, companies will be able to expense capital expenditure immediately, with this provision phasing out by 20% a year from 2023 to 2026. By encouraging investment in equipment now, this tax change is likely to aid future productivity growth and economic activity. Capital-intensive businesses, in particular, should see a significant reduction in their tax payments in the early years of the new tax law. We expect that companies will become more strategic in timing their capital expenditure to maximize this tax benefit, which could distort long-term investment patterns.
Cap on Interest Deductions. The cap on interest deductions above 30% of EBITDA, and later EBIT,2 will increase the effective tax rates for highly levered businesses. For companies that rely heavily on debt financing to fund large capital outlays, the interaction between the immediate expensing of capital expenditure, which reduces the EBIT number, and the EBIT-based cap on interest deductions will require careful planning to maximize benefits. As a result, companies with stable cash flows and reasonable debt levels could become even more attractive to investors, and highly leveraged businesses may want to restructure internal borrowings, borrow in different jurisdictions, rely more on leasing, or use more preferred or common equity financing.
As with any new law, it will take time for all the effects of the US tax reforms to be felt, and individual companies will be impacted differently. In the near term, we expect increases in post-tax profits to push valuations on companies higher, producing a one-time benefit for current holders. In time, companies’ increased profitability will be priced into their valuations and investment returns should revert to normal levels.
Other tax changes will likely ratchet up M&A, exits1 and cross-border transactions, and reduce the use of debt financing. Over the longer term, businesses may adjust their corporate and capital structures in response to the new tax regime. Less cyclical companies with moderate leverage should benefit the most. In aggregate, we view the changes as mostly positive for public companies and as positive overall, with more variation, for the private equity (PE) industry.
Anne-Marie Fink, CFA Portfolio Strategist, Alternative Investments
Impact of Tax Rules on Public and Private Equity
27 IQ Spring 2018: Life After Easy MoneyState Street Global Advisors
While the cap impacts PE firms that rely heavily on debt financing, we believe this detractor will be more than offset by the lower corporate tax rate and the immediate expensing of capital expenditure, and PE firms will find innovative solutions to avoid the cap. Interest expense deductions above the annual cap can be carried forward and applied in subsequent years or sold as a tax asset. The change may also be supportive for venture capital-funded businesses as it does not apply to companies with revenues of less than USD 25 million.
Repatriation. The US will no longer tax dividends received by domestic companies from their non-US entities. This levels the playing field for US corporates and should encourage more repatriation of overseas profits. Cross-border transactions by US companies should also cost less, which could further buoy M&A and exits for PE firms. Capital gains from the sales of foreign affiliate shares will still be taxed, so firms will need to consider tax effects when buying and selling PE portfolio companies or foreign subsidiaries. Those companies which previously structured overseas transactions to achieve lower rates will benefit less from the changes and could even lose out under the new regime.
Moreover, assets cannot be repatriated entirely tax-free. To prevent erosion of the tax base and abuse of the system, companies will have to pay a one-time repatriation tax of 8% for illiquid assets and 15.5% for liquid ones, that is, cash and near-cash. Fortunately, they have the option to pay the tax over eight years. There is also a minimum tax on foreign earnings, which applies to US corporations’ pro rata share of certain foreign profits at a 10.5% effective rate from 2018 to 2025 and 13.1% in subsequent years. On a positive note, the estimated USD 2 trillion that may be repatriated should help drive investment.
Pass-Through Structure. Unlike public companies, PE firms are often structured as partnerships. The new tax law’s 20% tax deduction on US business income from “pass-through” entities with sizeable staff wage bills should drive additional profits for any enterprises held as partnerships. Companies may also restructure themselves to maximize the benefits of this deduction, perhaps by reorganizing employees and assets within different legal entities, but they will need to be circumspect: the clause sunsets in 2025 and pass-throughs do not qualify for reduced taxation of foreign earnings.
1 An exit occurs when a private equity firm sells a stake in a company it owns.
2 EBITDA is earnings before interest, tax, depreciation and amortization; EBIT is earnings before interest and tax.
Market expectations are shifting to focus on when, not if, inflation pressures will re-emerge and volatility will revert to more normal levels. How should investors respond?
The Return of Volatility and Inflation Risk
Investment Impact
Ramu Thiagarajan, PhD Global Head of Fixed Income Currency and Cash (FICC) Research
The recent US inflation scare, which triggered a global spike in volatility and bond yields and a correction in share prices, demonstrated how acutely sensitive markets have become to changing inflation expectations and the prospect of higher interest rates. As indicated in this issue’s investment roundtable, our view is that markets appear to have overreacted to a single wage data point that has been historically quite volatile. Our core expectation is that inflation will remain contained this year and the fiscal stimulus from the historic US tax reforms will take longer to
translate into persistent wage and price rises than many believe. Nonetheless, there has been a clear shift in market expectations to when, not if, inflation pressures will re-emerge and volatility will revert to more “normal” levels. In this new, more febrile environment, it is important to assess the potential impact of higher inflation and volatility on company valuations and position portfolios accordingly. Asset allocators may also wish to consider whether previous diversification benefits still apply and how best to manage latent risks.

29 IQ Spring 2018: Life After Easy MoneyState Street Global Advisors
If, as expected, monetary stimulus has been effective and growth has improved, then a reversion in volatility to more normal levels is likely to be benign and conducive to the compression of premia in risk markets.
30 IQ Spring 2018: Life After Easy MoneyState Street Global Advisors
Volatility — Benign or Severe
Over the last few years, volatility has declined across major asset classes. Equity and bond volatility has fallen, as had currency volatility until recently. Historically, when the volatility of different asset classes declines simultaneously, it is primarily due to large amounts of liquidity provided by central banks as monetary stimulus. Figure 1 shows past levels of volatility in equity and bond markets compared to the current environment since the global financial crisis (GFC).
There are multiple sources of volatility that can affect asset prices and investor portfolios, but there are two significant ones for financial markets. Since volatility has been extraordinarily low for an unusually extended period and, until recently, was coming down, the return of volatility might just be a function of reverting to the mean as monetary stimulus is tapered in the US, the UK and Europe. If, as expected, monetary stimulus has been effective and growth has improved, then a reversion in volatility to more normal levels is likely to be benign and conducive to the compression of premia in risk markets.
However, if renewed volatility is the result of a spike in inflation risk, the consequences could be more severe. Prices in asset markets are driven by both realized inflation and anticipated inflation, which can be triggered by shocks in consumer prices, producer prices or employment costs. If volatility is driven by sharp rises in inflation or inflation expectations, equity and bond valuations will have to adjust quickly, which can be bumpy. We witnessed this effect on February 2 when markets reacted sharply after 200,000 jobs were added to the US economy compared to consensus forecasts of 180,000 and average hourly earnings grew by an unexpected 2.9%. Often central banks respond to a rise in inflation or inflation expectations by tightening policy or talking about higher rates, prompting further volatility. So far, that has yet to happen.
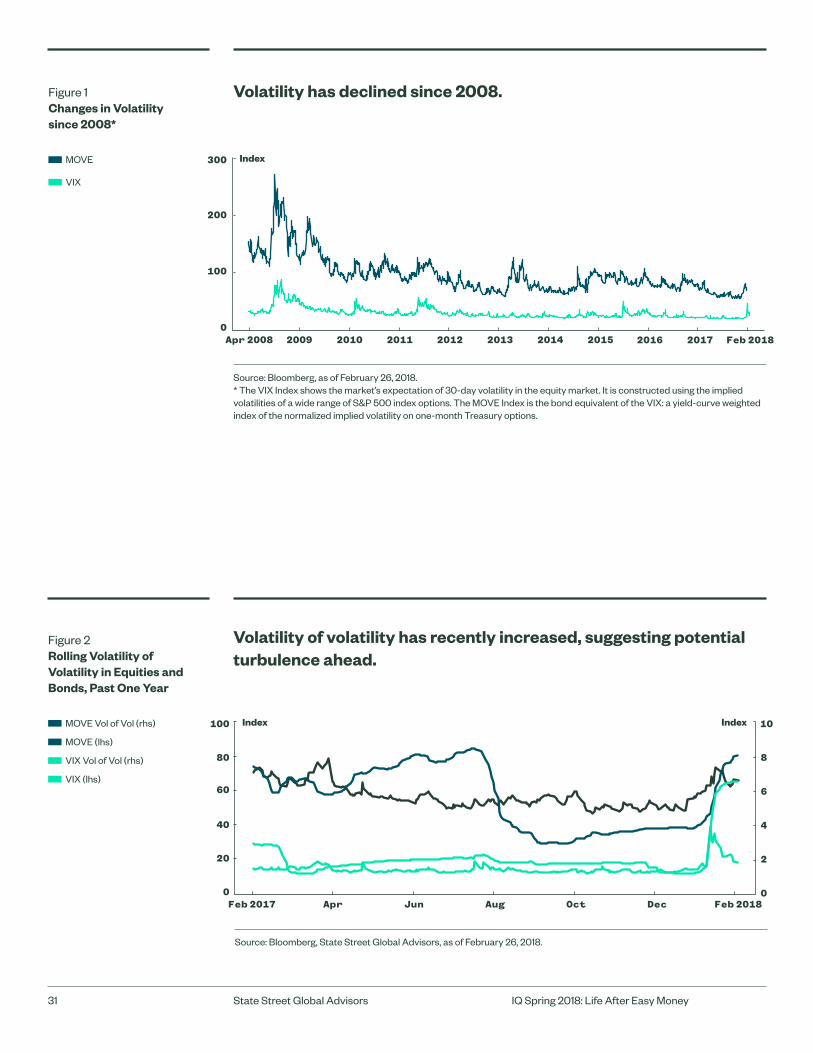
Figure 2 Rolling Volatility of Volatility in Equities and Bonds, Past One Year
MOVE Vol of Vol (rhs)
MOVE (lhs)
VIX Vol of Vol (rhs)
VIX (lhs)
Source: Bloomberg, State Street Global Advisors, as of February 26, 2018.
0 0
8
60 6
80
100
40 4
20 2
Feb 2017 Apr Jun Aug Oct Dec Feb 2018
Volatility of volatility has recently increased, suggesting potential turbulence ahead.
10
Figure 1 Changes in Volatility since 2008*
MOVE
VIX
Volatility has declined since 2008.
31 IQ Spring 2018: Life After Easy MoneyState Street Global Advisors
Source: Bloomberg, as of February 26, 2018. * The VIX Index shows the market’s expectation of 30-day volatility in the equity market. It is constructed using the implied volatilities of a wide range of S&P 500 index options. The MOVE Index is the bond equivalent of the VIX: a yield-curve weighted index of the normalized implied volatility on one-month Treasury options.
0
300
200
100
Apr 2008 2009 2010 2011 2012 2013 2014 2015 2016 2017 Feb 2018
Index
Index
Index
Modeling Volatility
It is especially difficult to model how volatility will evolve from here, given the unusual starting point after years of unprecedented amounts of liquidity going into the system; but it is unlikely to be a smooth ride. In the US, some of the liquidity deluge unleashed by the Federal Reserve in the wake of the global financial crisis is being drained out. As this starts to happen elsewhere in the world, volatility (and risk premia) could experience a series of uncomfortable spikes that could affect valuations. Indeed, the second derivative of volatility, that is, the volatility of volatility, has already picked up (see Figure 2), which could imply turbulence ahead.
The May 2013 “Taper Tantrum” is a useful reminder of how prickly markets can be. Back then, all that former Fed chairman Ben Bernanke said was that he planned to reduce the monthly asset purchases of the largest liquidity program of its kind by USD 10 billion, from USD 85 billion to USD 75 billion. This, and a very broad outline of when liquidity might begin to be withdrawn, was enough to rock global markets. It made real rates jump, equity and bond volatility surge and emerging market debt suffer. While economic conditions have improved since 2013 and central banks are normalizing policy gradually, if liquidity is withdrawn globally and growth (also a component of valuation alongside cost of capital) fails to meet expectations or takes time to materialize, then markets could react negatively.
How Investors Might Respond
The appropriate response to higher volatility also depends on the reasons for the increase. If volatility rises on inflation concerns and growth prospects remain uncertain, then over the longer term, we believe investors should de-risk their portfolios and consider risk management or hedging strategies such as tail risk hedges using some combination of options, Treasuries and defensive currencies such as the yen, the US dollar and the Swiss franc. Some of these hedges can be expensive and a robust investment process can help balance the value of the tail risk hedge against the cost. If, on the other hand, the increase in volatility is accompanied by reassurance that global growth will meet or exceed targets, then history tells us that equities should continue to rally and outperform bonds. Moreover, the right sort of increase in volatility could present a more conducive environment for stock-pickers, as stock- and sector-specific factors become more important to valuations and returns.
The right sort of increase in volatility could present a more conducive environment for stock-pickers, as stock- and sector-specific factors become more important to valuations and returns.
32 IQ Spring 2018: Life After Easy MoneyState Street Global Advisors

Figure 3 Inflation Measures in the United States: the NY Fed’s Underlying Inflation Gauge and PriceStats
PriceStats
UIG Full Data Set
UIG Prices-only
Headline CPI
Source: Bloomberg, PriceStats.com, as of January 2018.
-3
5
3
2
4
1
0
-1
-2
2009 2010 2011 2012 2013 2014 2015 2016 2017 2018
Percent
From a cyclical standpoint, inflation appears to be on an upward trend.
33 IQ Spring 2018: Life After Easy MoneyState Street Global Advisors
Inflation — Cyclical or Structural
A period of sustained liquidity from central banks, such as that we have seen over the last decade, frequently gives rise to concerns that inflation will spike, sparking bouts of volatility until there is clarity on growth, productivity and real rates. So far, however, a key measure of US money supply, M2, has remained well controlled and, as yet, there are no signs of significant wage growth or price shocks. But while our base case for moderate, range-bound inflation remains intact in the near term, it is worth distinguishing between two types of inflation trends. One is longer term and structural and the other is shorter term and cyclical.
Structurally, inflation is likely to be contained over the long term as a result of changing demographics, insufficient productive investment to absorb current labor supply and the disintermediation of technology putting downward pressure on prices and wages.
Anecdotal evidence suggests that rapid technological improvements, more knowledge-based and digital assets, mobile working and disruptive business models such as Amazon and Google are suppressing service inflation. While these factors increase productivity, the transmission of productivity gains into output may take time.
From a cyclical standpoint, however, inflation appears to be on an upward trend. On certain measures, including the traditional consumer price inflation (CPI) index, the picture is mixed. In the US, CPI is currently close to the 2% Fed annual inflation target at 2.1%. However, an underlying inflation gauge (UIG) published by the New York Federal Reserve, which attempts to capture price fluctuations through modeling both CPI components and a range of economic and financial data, recently rose to 3% year on year, making market participants nervous (Figure 3).
How Investors Might Respond
In a flexible economy, a certain amount of inflation is helpful in promoting growth. However, price changes must not be too sharp or too sudden or companies and individuals may be unable to absorb the costs. Historically, when inflation has been trending higher but is not excessive, equities have done well while bonds have underperformed. So if there is a cyclical uptick in inflation, it is worth considering maintaining a meaningful allocation to equities, while being mindful that some valuations looked overstretched prior to the recent pullback and growth will need to persist to justify further progress. As such, equities offering value, low volatility and quality should be most in demand.
Higher inflation erodes the value of fixed income, so investors may want to consider de-risking some of their bond holdings no matter whether inflation is cyclical or structural. Bond yields have already risen considerably in percentage terms from where they were last September, so if inflation readings surprise to the downside, we could see bond prices actually rally. If, however, the trend displayed by
the PriceStats model continues, then it makes sense to de-risk some bond exposure or use Treasury Inflation-Protected Securities (TIPS) to counter inflation risk.
A balanced portfolio of equities and bonds can offer diversification while both asset classes remain negatively correlated. However, history tells us that when inflation shoots upwards, equities and bonds can become positively correlated and investors lose some of the diversification benefit. As yet the correlation remains benign and negative, but if that changes and growth remains solid, then investors might want to consider increasing their allocation to equities or real assets. Commodities tend to outperform when better-than-expected economic growth leads to a negative supply shock and results in capital appreciation. While past performance is not a guide to the future, historically Real Estate Investment Trusts (REITs) have also benefited from such a backdrop, particularly when they help diversify risk in other parts of the portfolio.
34 IQ Spring 2018: Life After Easy MoneyState Street Global Advisors
The “prices-only” measure of this gauge, which includes select CPI components, is at 2.2%. The UIG measure can be triangulated by other metrics such as PriceStats, which shows inflation increasing through February. PriceStats gleans millions of real-time prices of popular goods from large online retailers in 22 countries, serving as a leading indicator for inflation before official monthly numbers are available.
Meanwhile, the Fed predicts inflation will rise over the next few months thanks to the year-on-year comparison. Last year’s inflation numbers were
suppressed by temporary factors, such as a sharp fall in cellphone prices. No similar changes are anticipated this year, although inflation will likely remain constrained by other factors such as ongoing moderation in rental costs. This year-on-year effect is likely to push core CPI above the Fed’s 2% target in April and May. Even then, the Fed believes inflation expectations will remain anchored, despite expressing concern about the possibility of the US economy overheating. Markets, however, are bracing for an increase in real rates, suggesting they too believe inflation will pick up in the near term.

35 IQ Spring 2018: Life After Easy MoneyState Street Global Advisors
What to Watch If the global recovery maintains momentum over the next 12 months, investors should expect continued positive economic growth and low unemployment. The flipside of this may well be that long-anticipated inflation pressures finally begin to materialize, volatility rises and markets adjust accordingly. There are three things investors need to watch out for: first, whether growth remains robust; second, whether higher inflation prints across different measures lead to a shift in the structural story of weak inflation; and third, whether higher risk premia in credit markets, measured by investment-grade and high-yield bond spreads, spill over into other
markets. We are in the late stages of the credit and market cycle at which point an increase in risk premia in credit markets becomes a leading indicator of potential turbulence in other markets. It is important for investors to be prepared for when they do.
With contributions from Santosh Prasad, Quantitative Analyst, and Rajni Tyagi, Senior Quantitative Analyst, FICC Research, and Esther Baroudy, Portfolio Manager, Global Equities
Beware the Politics of Deficits and TradeElliot Hentov, PhD Head of Policy and Research Official Institutions Group
Policy Watch
Even as we shift away from the age of easy money, central bank decision-making will rightly continue to hold the market’s attention. But there is a pernicious policy feedback loop that could hold nasty surprises for investors. Monetary policy does not operate in a vacuum, and in the wake of the latest budget decisions in the US, there is growing recognition that the resulting, massive build-up in US fiscal deficits could accelerate the pace of interest rate hikes. Less acknowledged is the potential turmoil those fiscal deficits could cause when they intersect with the politics of trade.
As fiscal deficits widen in the mature part of an economic cycle, additional fiscal stimulus cannot be absorbed by excess slack in the domestic economy. As a result, the stimulus is exported through higher import demand. Furthermore, fiscal expansion at this stage also leads to inflationary pressures, pushing monetary authorities to raise interest rates to combat inflation, thereby boosting the purchasing power of the home currency. The end result is usually higher trade deficits. In a different era, this economic linkage would be the end of the story.
Growing US fiscal deficits could not only accelerate the pace of interest rate hikes, but also generate turmoil where they intersect with the politics of trade.

In 2017, the Trump administration actually enacted fewer trade discriminations than the Obama administration in 2016, but 2018 is shaping up to be the year Trump gets serious about trade. In March, Trump announced sweeping tariffs on steel and aluminum, then swiftly extended the campaign to intellectual property disputes with China. We believe the incentives for the Trump administration to ramp up trade confrontation will be amplified by the policy loop outlined above. Fiscal policy will indirectly exacerbate a politically sensitive metric — the trade deficit — and this during a midterm election year and creeping judicial investigation.
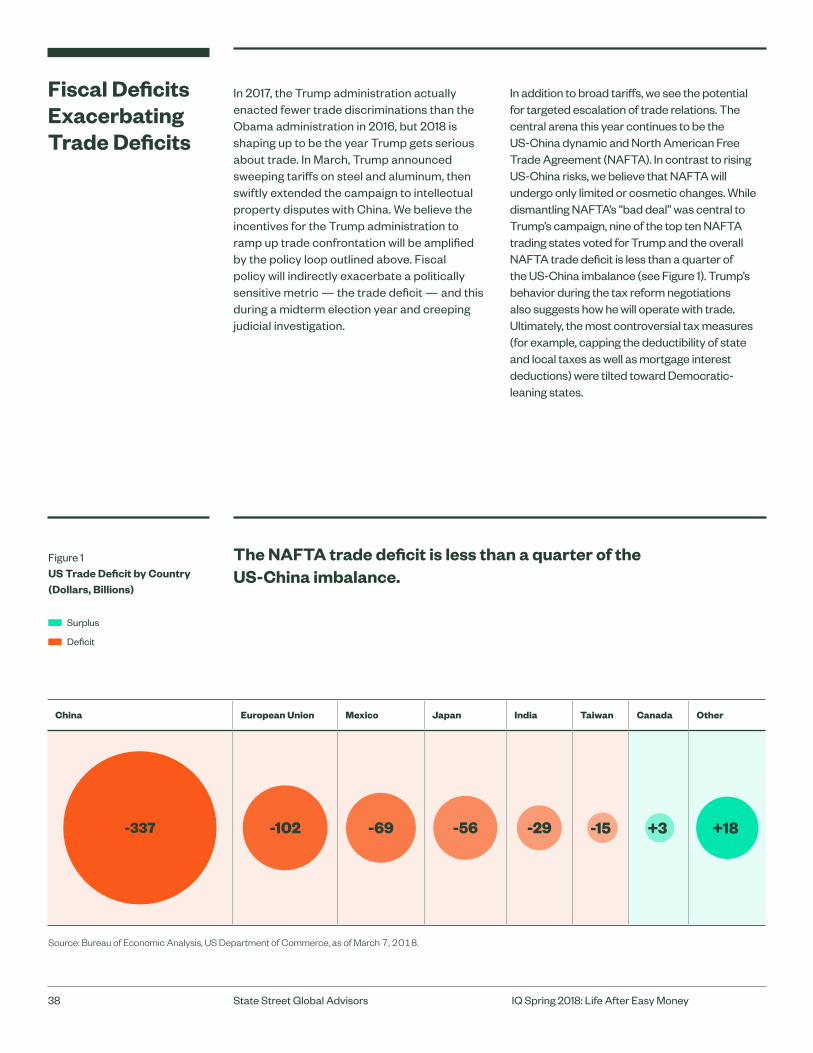
In addition to broad tariffs, we see the potential for targeted escalation of trade relations. The central arena this year continues to be the US-China dynamic and North American Free Trade Agreement (NAFTA). In contrast to rising US-China risks, we believe that NAFTA will undergo only limited or cosmetic changes. While dismantling NAFTA’s “bad deal” was central to Trump’s campaign, nine of the top ten NAFTA trading states voted for Trump and the overall NAFTA trade deficit is less than a quarter of the US-China imbalance (see Figure 1). Trump’s behavior during the tax reform negotiations also suggests how he will operate with trade. Ultimately, the most controversial tax measures (for example, capping the deductibility of state and local taxes as well as mortgage interest deductions) were tilted toward Democratic-leaning states.
Fiscal Deficits Exacerbating Trade Deficits
China European Union Mexico Japan India Taiwan Canada Other
-337 -102 -69 -56 -29 -15 +3 +18
The NAFTA trade deficit is less than a quarter of the US-China imbalance.
Figure 1 US Trade Deficit by Country (Dollars, Billions)
Surplus
Deficit
Source: Bureau of Economic Analysis, US Department of Commerce, as of March 7, 2018.
38 IQ Spring 2018: Life After Easy MoneyState Street Global Advisors
In stark contrast, the bilateral US-Chinese trade relationship is now inextricably bound up with the two countries’ wider geopolitical rivalry. Consequently, there is a greater chance of disruption as non-economic policy considerations increasingly shape key decisions. This bodes poorly for the coming year as non-economic relations are more confrontational, implying rising trade frictions. To make matters worse, the US political economy makes this outcome more likely: the US bilateral trade deficit with China accounts for over 60% of the overall US trade deficit and US exports to China are diffused across the country. Compounded with midterm congressional elections in November, the political incentives for the Trump administration are significantly in favor of escalating trade disputes. The current strong headline growth figures in the US obscure the underlying reality of growing income disparities in which lower-middle income groups are falling further behind and fueling a populist backlash. Given that Trump’s domestic agenda fails to address those economic struggles, at least part of his foreign policy will need to acknowledge the anti-globalization bent of his base.
In the event of a US-China trade war, exporters in both countries are obvious losers. However, import demand is rarely substituted by domestic producers and typically would draw on third- country providers. Looking at the US-China trade imbalances, Chinese consumer and capital goods are responsible for 94% of China’s surplus, making those goods most vulnerable to US punitive action. Chinese producers could therefore be ceding market share to Southeast Asian or European competitors. In contrast, the US surplus is mainly in food and service exports, with the former most easily targeted for substitution, presumably to the benefit of Latin American or European competitors.
The extent of the fallout will likely be a function of China’s preparedness to offer compromises. The leadership’s stated desire to rebalance the economy and China’s reduced dependence on this trade surplus does give them more leeway in 2018 than in previous years. In other words, the best outcome would be a skilful Chinese maneuver that aligns its economic reform priorities to deflect US demands. Beijing is
planning to open certain sectors (for example, financial and select technology sectors) to increased foreign participation where US firms have a competitive advantage. China could use the timing of such openings to inject greater US market access, which would naturally improve the trade balance. In sum, while increased US pressure appears inevitable, a mutually beneficial and pacifying outcome remains possible in 2018.
As for the US trade imbalance with the European Union (EU), it is the second largest after China.While US tax reform includes provisions that should structurally support increased US exports to Europe, Trump’s steel and aluminum tariffs have already provoked EU assurances of retaliatory measures. Even if US-China trade relations deteriorate, that is unlikely to alter the overall US current account deficit, which is a macroeconomic function of an imbalance in savings and investment.
That imbalance brings us back to US fiscal policy, which will be the primary driver of “dis-savings.” The US federal budget will quickly start to feel the effects of a deficit estimated to grow to roughly 4% of GDP in 2018, and rising far above 5% of GDP from 2019 onwards. This equates to roughly USD 400 billion to USD 500 billion more in annual issuance of US government securities just to fund the government shortfall. At this stage of the economic cycle, that could accelerate the increase in bond yields in addition to monetary tightening. Such high deficit levels in the late stages of an economic cycle could also undermine confidence and, once the sugar rush of the recent tax cuts has worn off, dent investment as expectations of future tax increases grow. For example, the 1981 Reagan tax cuts were followed by five distinct tax increases in the subsequent decade — and debt levels were roughly half what they are now. The other risk is that larger public debt issuance could begin to crowd out private sector borrowing, all of which could begin to slow the economy. At that stage, perpetually higher trade deficits could further amplify calls for tougher action and further undermine the case for cooperative globalization. Trade rhetoric is fast becoming one of the more important market signals for investors in 2018.
China Trade War Risk
39 IQ Spring 2018: Life After Easy MoneyState Street Global Advisors

Catalysts in Action
Case Studies

In the US, corporate tax cuts open possibilities for businesses with defined benefit (DB) plans to improve their funded status or make asset allocation shifts that could ease pension burdens over the long run.
For example, changes to the tax treatment of interest deductibility might incentivize additional voluntary contributions to a plan to reduce the funding deficit. And the lower corporate tax rate could boost net income and offset the decline in expected return on assets (EROA) from shifting a plan’s allocation to lower-risk investments.
Using Tax Cuts to Help DB Plan Sponsors
Voluntary Plan Contributions
Firms have until September 15, 2018 to make voluntary pension plan contributions for 2017, which allows them to take advantage of a higher tax shield than the one in effect for 2018. Hypothetically, a pension deficit of USD 100 could be funded with USD 65 at the old 35% rate, before that goes up to USD 79 at the new 21% rate.
Plan sponsors can accelerate the pace of contributions either from available cash or by borrowing. Corporate bond yields may be rising, but they are still relatively low by historical standards. So there is a case for companies with good credit to issue debt to fund their pension plans.
From an accounting perspective, plan sponsors are allowed to use their EROA to compute the pension cost on their income statements. Depending on the spread between the EROA of the new plan contributions and the interest paid on the new debt issued — and taking the new limits on interest deductions into account1 — borrowing to fund the plan could boost earnings per share.
From an equity perspective, quantitative analysis suggests that performance measured by beta has been more sensitive to pension underfunding than to other forms of corporate debt.2 Stocks of companies with shortfalls above a 5% threshold have been perceived as higher risk with lower risk-adjusted return, and tend to lag within their sectors. Past performance is no guarantee of future performance, but if this historical relationship holds, reducing the underfunding risk factor could have a positive impact on return. Figure 1 below shows the extent of underfunding across companies with pension plans in the S&P 500 Index.
There are other benefits to pre-funding. Reducing pension underfunding would limit the variable component of the annual premium that corporate DB plans must pay to the Pension Benefit Guaranty Corporation (PBGC). Plan sponsors that build up funding balances can also accrue credits against future contributions required by the Employee Retirement Income Security Act (ERISA). And fully funded plans can adopt LDI strategies that match income from investments to liabilities for pension benefits, which helps to maintain a stable funded status.
Now the lower corporate tax rate could add to net income, which could be used to lower the expected return on assets (EROA), and the sponsor can have more leeway in shifting the asset allocation to a less risky posture.
42 IQ Spring 2018: Life After Easy MoneyState Street Global Advisors
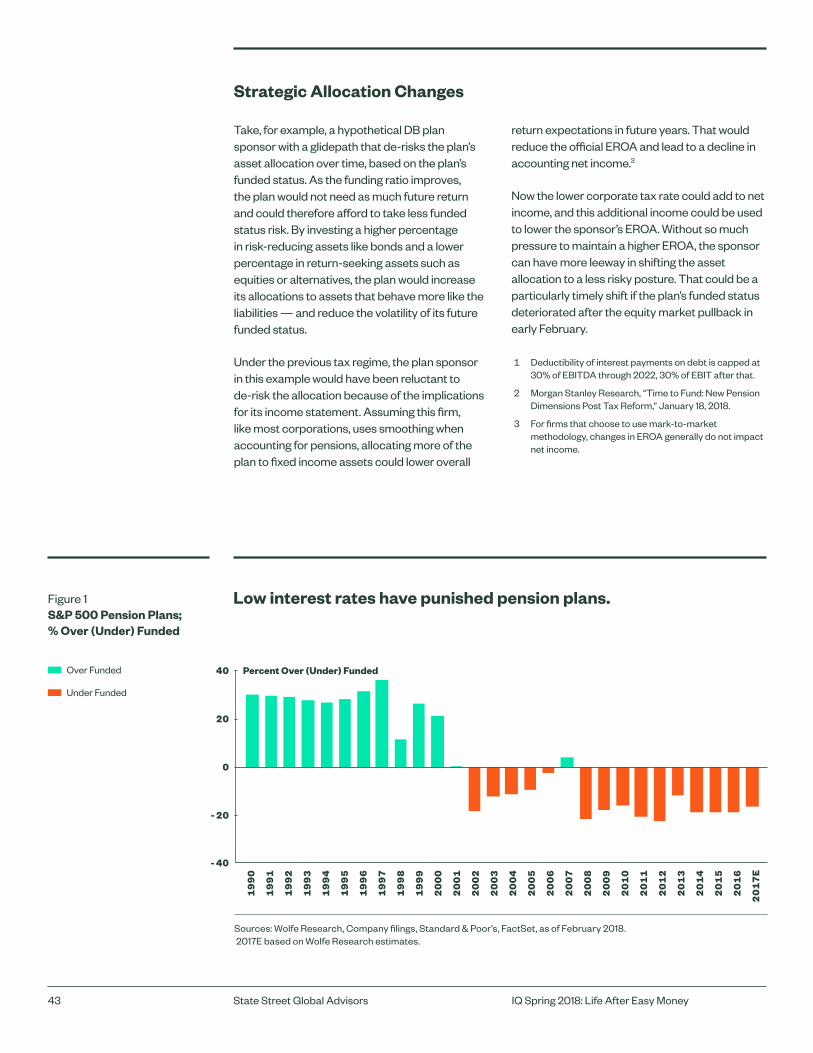
Strategic Allocation Changes
Take, for example, a hypothetical DB plan sponsor with a glidepath that de-risks the plan’s asset allocation over time, based on the plan’s funded status. As the funding ratio improves, the plan would not need as much future return and could therefore afford to take less funded status risk. By investing a higher percentage in risk-reducing assets like bonds and a lower percentage in return-seeking assets such as equities or alternatives, the plan would increase its allocations to assets that behave more like the liabilities — and reduce the volatility of its future funded status.
Under the previous tax regime, the plan sponsor in this example would have been reluctant to de-risk the allocation because of the implications for its income statement. Assuming this firm, like most corporations, uses smoothing when accounting for pensions, allocating more of the plan to fixed income assets could lower overall
return expectations in future years. That would reduce the official EROA and lead to a decline in accounting net income.3
Now the lower corporate tax rate could add to net income, and this additional income could be used to lower the sponsor’s EROA. Without so much pressure to maintain a higher EROA, the sponsor can have more leeway in shifting the asset allocation to a less risky posture. That could be a particularly timely shift if the plan’s funded status deteriorated after the equity market pullback in early February.
1 Deductibility of interest payments on debt is capped at 30% of EBITDA through 2022, 30% of EBIT after that.
2 Morgan Stanley Research, “Time to Fund: New Pension Dimensions Post Tax Reform,” January 18, 2018.
3 For firms that choose to use mark-to-market methodology, changes in EROA generally do not impact net income.
Sources: Wolfe Research, Company filings, Standard & Poor’s, FactSet, as of February 2018. 2017E based on Wolfe Research estimates.
40
0
20
-20
Low interest rates have punished pension plans.
1990
1991
1992
1993
1994
1995
1996
1997
1999
1998
2000
2001
2002
2003
2004
2005
2006
2007
2008
2009
2011
2013
2010
2012
2014
2015
2016
2017E
Percent Over (Under) Funded
Figure 1 S&P 500 Pension Plans; % Over (Under) Funded
-40
Over Funded
Under Funded
43 IQ Spring 2018: Life After Easy MoneyState Street Global Advisors
How ESG Affects Stock Selection
Research undertaken by State Street’s active quantitative equity (AQE) team showed that environmental, social and governance (ESG) issues could provide a differentiated quality factor in its investment process to include or exclude companies. The hypothesis underpinning the research was that companies behaving in a sustainable way should achieve better long-term performance, while firms that rank poorly on ESG criteria might be more prone to chronic operational issues or more exposed to regulatory risk and the prospect of public scandals, which could impair their stock valuations.
While some investors might think that an ESG focus is only relevant for large, developed market (DM) companies with the resources to finance ESG-related projects in more regulated countries, AQE’s research shows that emerging market (EM) and smaller DM companies with higher ESG scores have outperformed those with lower scores. In fact, this analysis finds that such companies are increasingly standing out, since participating in the global marketplace requires ESG awareness.
Take the case of two stocks in the Paper & Forestry industry that the AQE team was considering for its EM portfolio. The first company is a Brazilian manufacturer of coated and uncoated paper and a global leader in eucalyptus pulp production. The second company is a Chilean maker of forestry, pulp, paper and tissue products. In late 2017, expecting that pulp prices would remain strong, the team used ESG criteria to invest in the first company, but not the second.
AQE’s stock selection process seeks to identify companies that are well managed and therefore more likely to deliver sustainable future growth. Financial statements — and particularly balance sheets — can provide a good indication of quality, reflecting management decisions on acquisitions, debt financing, and cash flow. But other important
management actions are not captured by financial statements such as the quality of their corporate governance, their environmental profile and the way they treat their employees and their community. Those are the non-traditional areas that ESG scoring seeks to encompass to give a more complete view of a company’s long-term earnings prospects.
Both South American firms had attractive characteristics based on the team’s traditional stock selection criteria. The first company ranked well across many of the earnings and cash-flow based valuation metrics. Its order book was solid, and forward earnings estimates were rising thanks to its plans for future growth and diversification. The second company also scored highly on key valuation metrics and forward earnings expectations were increasing rapidly.
Widening the lens to broader ESG issues, however, the team understood the risks associated with the industry, such as deforestation and other issues related to climate change. Using a proprietary ESG materiality methodology to see how these firms fared relative to peers in the MSCI Emerging Markets Index and the Paper & Forestry industry, AQE’s evaluations of the two companies were quite different.
For example, the first company is a signatory to the United Nations Global Compact, a voluntary initiative in which firms commit to implementing universal sustainability principles and take steps to support UN goals. It also had high scores on metrics related to greenhouse gases (GHG) and water management, corporate governance and ESG reporting standards, including a thorough sustainability report. And it scored above the industry median on supply chain monitoring, health and safety certifications, human rights policy and community involvement programs — all positive ESG signs that enhanced the favorable traditional metrics.
Companies behaving in a sustainable way should achieve better long-term performance, while firms that rank poorly on ESG criteria might be more prone to chronic operational issues or more exposed to regulatory risk and the prospect of public scandals, which could impair their stock valuations.
44 IQ Spring 2018: Life After Easy MoneyState Street Global Advisors
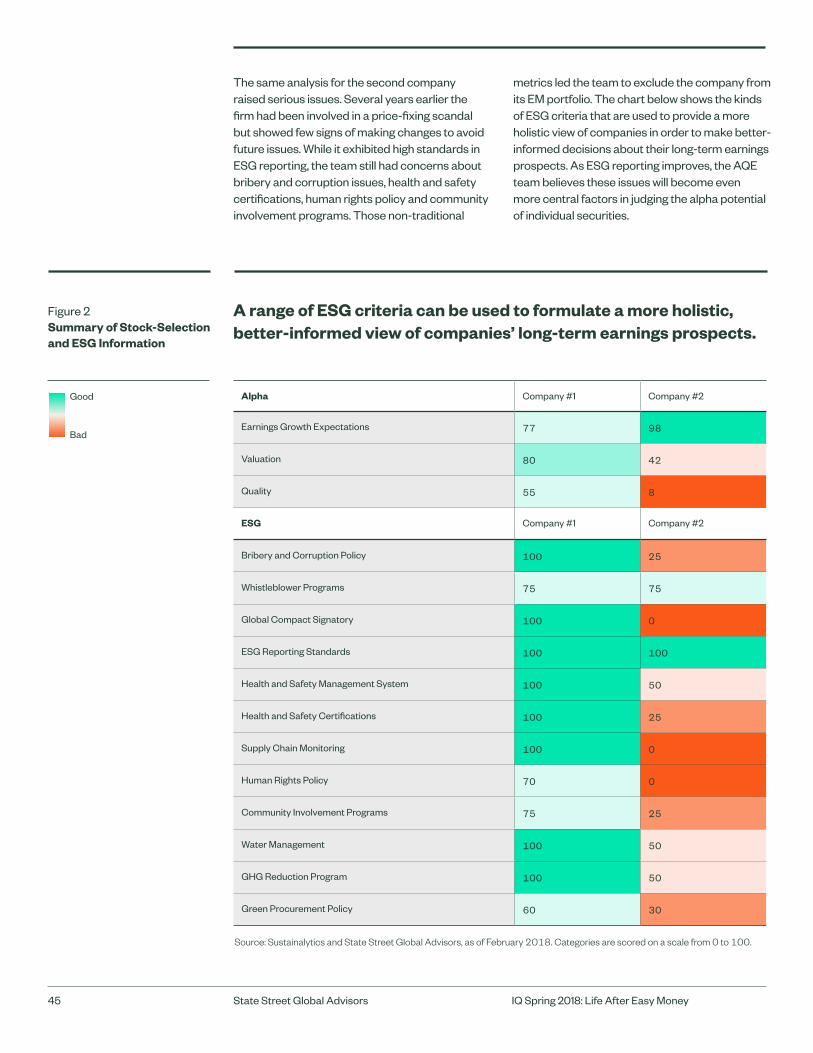
Alpha Company #1 Company #2
Earnings Growth Expectations 77 98
Valuation 80 42
Quality 55 8
ESG Company #1 Company #2
Bribery and Corruption Policy 100 25
Whistleblower Programs 75 75
Global Compact Signatory 100 0
ESG Reporting Standards 100 100
Health and Safety Management System 100 50
Health and Safety Certifications 100 25
Supply Chain Monitoring 100 0
Human Rights Policy 70 0
Community Involvement Programs 75 25
Water Management 100 50
GHG Reduction Program 100 50
Green Procurement Policy 60 30
A range of ESG criteria can be used to formulate a more holistic, better-informed view of companies’ long-term earnings prospects.
Figure 2 Summary of Stock-Selection and ESG Information
The same analysis for the second company raised serious issues. Several years earlier the firm had been involved in a price-fixing scandal but showed few signs of making changes to avoid future issues. While it exhibited high standards in ESG reporting, the team still had concerns about bribery and corruption issues, health and safety certifications, human rights policy and community involvement programs. Those non-traditional
metrics led the team to exclude the company from its EM portfolio. The chart below shows the kinds of ESG criteria that are used to provide a more holistic view of companies in order to make better-informed decisions about their long-term earnings prospects. As ESG reporting improves, the AQE team believes these issues will become even more central factors in judging the alpha potential of individual securities.
Good
Bad
Source: Sustainalytics and State Street Global Advisors, as of February 2018. Categories are scored on a scale from 0 to 100.
45 IQ Spring 2018: Life After Easy MoneyState Street Global Advisors
New Valuation Calculus for R&D Assets
The shift to a knowledge-based and service-oriented economy means that for an ever growing proportion of firms, most of their value is derived from intangible intellectual property (IP) like software, patents and royalties. The challenge for investors is to understand how such intangible assets should be valued and how they drive the growth prospects of those companies — especially as traditional business models are being disrupted at an increasingly fast pace.
The magnitude of this transformation is reflected in the impact that research and development (R&D) has on separating the winners and losers among pharmaceutical, biotech and high tech firms. R&D is a major driver of technological change and plays a central role in the future growth of firms. That is why it has such important implications for firm valuations.
Traditional accounting principles separate capital expenses, which create benefits over many years, from operating expenses, which produce a payback in the current year. While this approach might be appropriate in the manufacturing sector, it is less relevant for firms with large intangible assets. When R&D spending is fully expensed in the current year because of concerns over reliability and objectivity, it is not counted as one of the important assets on the balance sheet. This is where traditional accounting fundamentals fall short for intangible-driven companies and can distort the accuracy of their valuations.
That is why the AQE team has developed a proprietary R&D factor to include in their valuations models. The team recognizes that technology and companies with intangible assets need to be looked at in a more nuanced way.
Take, for example, a US multinational healthcare company that was considered for an AQE portfolio. It exhibited attractive fundamentals from a valuation standpoint based on traditional accounting measures. After adjusting for R&D and capitalizing expenses according to the lifecycle of its IP-based assets, however, the team found that return on equity fell from 6.58% to 3.54%. Similarly, the return on capital went from 3.46% to 2.10%. These are meaningful differences — with obvious implications for investment decisions — that expected return models should be designed to capture.
Such apparent mispricings provide opportunities for active managers to identify companies that can outperform market expectations. As the rise of the intangible economy continues, we believe successful active managers will need to rethink conventional valuation measures for intangible-driven companies and sectors.
As the rise of the intangible economy continues, we believe successful active managers will need to rethink conventional valuation measures for intangible-driven companies and sectors.
46 IQ Spring 2018: Life After Easy MoneyState Street Global Advisors

Latest Industry Research from State Street Global Advisors
At a time when innovation and research-driven insights are more important than ever to investors, State Street researchers are regularly featured in peer-reviewed journals. Below are the most recent publications, aimed at helping to drive better investment solutions for global investors. For more information on State Street research, please contact your State Street relationship manager.
Alexander Rudin and William Marr, “Hedging and Constructing Portfolios of Active Strategies — Strategy Time Horizon and Estimation Errors,” The Journal of Alternative Investments, forthcoming Fall 2018.
Alexander Rudin, “Persistence of Hedge Fund Returns and Fee-Aware Portfolio Construction,” The Journal of Portfolio Management, forthcoming Spring 2018.
Jennifer Bender, Xiaole Sun, Ric Thomas and Volodymyr Zdorovtsov, “The Promises and Pitfalls of Factor Timing,” The Journal of Portfolio Management, Special Issue — Quantitative Strategies: Factor Investing, Third Edition 2018.
Shawn McKay, Robert Shapiro and Ric Thomas, “What Free Lunch? The Costs of Overdiversification,” Financial Analysts Journal, First Quarter 2018.
Jennifer Bender, Todd Bridges, Chen He, Anna Lester and Xiaole Sun, “A Blueprint for Integrating ESG into Equity Portfolios,” Journal of Investment Management, Special Issue — Environmental, Social and Governance Exposures (ESG), First Quarter 2018.
Jennifer Bender, Xiole Sun and Taie Wang, “Thematic Indexing, Meet Smart Beta! Merging ESG into Factor Portfolios,” The Journal of Index Investing, Winter 2017.
Alfred Zhu Liu and Le Sun, “Revisiting Post-Downgrade Stock Underperformance: The Impact of Credit Watch Placements on Downgraded Firms’ Long-Term Recovery,” The Journal of Accounting, Auditing & Finance, April 2017.
Taie Wang, “Social Change through Indexing: A Gender Diversity Index,” The Journal of Index Investing, Spring 2017.
Jennifer Bender and Ritirupa Samanta, “Quality Assurance: Demystifying the Quality Factor in Equities and Bonds,” The Journal of Portfolio Management, Special Issue — Quantitative Strategies: Factor Investing, Second Edition 2017.
Jennifer Bender, Xiaole Sun and Taie Wang, “A New Metric for Smart Beta: Factor Exposure per Unit of Tracking Error,” The Journal of Index Investing, Summer 2016.
47 IQ Spring 2018: Life After Easy MoneyState Street Global Advisors

Contributors
Lori Heinel, CFA Deputy Global Chief Investment Officer
Rick Lacaille Global Chief Investment Office
Mihir Desai, PhDMizuho Financial Group, Professor of Finance at Harvard Business School Professor of Law at Harvard Law School
Elliot Hentov, PhD Head of Policy and Research, Official Institutions Group
Simona Mocuta Senior Economist
Anne-Marie Fink, CFA Portfolio Strategist for Alternative Investments
Patricia Hudson Global Head of Investment Communications
Arvind Narayanan Head of Investment Grade Credit
Jonathan Haskel, PhDProfessor of Economics and Director of Research at Imperial College Business School
Amy Le Investment Strategist
Amlan Roy, PhD Global Chief Retirement Strategist
Ramu Thiagarajan, PhD Global Head of Fixed Income, Cash & Currency (FICC) Research
48 IQ Spring 2018: Life After Easy MoneyState Street Global Advisors

To succeed in an ever-changing and increasingly complex global investment environment, new ideas and superior research are essential. Through our IQ magazine, we aim to share with our clients the best thinking of our global investment teams. IQ is a twice-yearly publication that puts the spotlight on a key investment theme driving global markets. Our investment teams provide expert insight and analysis from multiple angles — including macro-economics, markets, geopolitics and regulation — and explore how these are shaping new investment opportunities and risks to help inform your decision making.
About IQ
49 IQ Spring 2018: Life After Easy MoneyState Street Global Advisors

Alpha. A gauge of risk-adjusted outperformance that is measured relative to a benchmark because benchmarks are often considered to represent the market’s movement as a whole. The excess return of a portfolio relative to the return of a benchmark index is the portfolio’s alpha.
Base Erosion and Anti-Abuse Tax (BEAT). A minimum tax levied on certain base-eroding payments (for example, royalties) from US firms to foreign-related parties.
Beta. Measures the volatility of a security or portfolio in relation to the market, with the US broad market measured by the S&P 500 Index, for example. A beta of 1 indicates the security will move with the market. A beta of 1.3 means the security is expected to be 30% more volatile than the market, while a beta of 0.8 means the security is expected to be 20% less volatile than the market.
Bloomberg Barclays US Credit Index. An index designed to measure the investment grade, US dollar-denominated, fixed-rate, taxable corporate and government-related bond market. It is composed of the US Corporate Index and a non-corporate component that includes non-US agencies, sovereigns, supranationals and local authorities.
Chicago Board Options Exchange (CBOE) Volatility Index (VIX). An index constructed using the implied volatilities of a range of S&P 500 options to forecast 30-day volatility.
Foreign Derived Intangible Income (FDII). A preferential tax rate for domestic intellectual property associated with exports.
Global Intangible Low Tax Income (GILTI). A minimum tax levied on a portion of income earned by foreign subsidiaries.
Headline Consumer Price Inflation (CPI). The raw inflation figure that is released monthly by the US Bureau of Labor Statistics. The CPI calculates the cost to purchase a fixed basket of goods, as a way of determining how much inflation is occurring in the broad economy. The CPI uses a base year and indexes the current year’s prices according to the base year’s values.
Implied Volatility. A measure of the market’s estimate of the future volatility of the price of an asset.
Inflation. The rate at which the general level of prices for goods and services is rising and, consequently, the purchasing power of currency is falling.
International Monetary Fund (IMF). The IMF’s primary purpose is to ensure the stability of the international monetary system — the system of exchange rates and international payments that enables countries to transact with each other. Since 2012, this mandate has included all macroeconomic and financial sector issues that bear on global stability.
M0, M1, M2. Measures the money supply in a country. While specific definitions vary from country to country, M0 and M1 tend to refer to coins and notes in circulation, as well as highly liquid cash equivalents. M2 includes M0 and M1, as well as short-term time deposits and money market funds.
Merrill Lynch Option Volatility Estimate Index (MOVE). An index constructed using the implied volatility of one-month Treasury options.
MSCI Emerging Markets (EM) Index. A free float-adjusted market capitalization index designed to measure equity market performance in 23 global emerging market economies: Brazil, Chile, China, Colombia, Czech Republic, Egypt, Greece, Hungary, India, Indonesia, Korea, Malaysia, Mexico, Peru, Philippines, Poland, Qatar, Russia, South Africa, Taiwan, Thailand, Turkey and the United Arab Emirates.
North American Free Trade Agreement (NAFTA). A pact negotiated by Canada, Mexico and the US that came into force in 1994.
Premium. The expected excess return on a security or portfolio.
Real Rate. An interest rate that has been adjusted for inflation.
Russell 3000 Index. A market capitalization weighted equity index that provides exposure to the entire US stock market.
S&P 500 Index. A market value weighted index of 500 stocks that reflects the performance of a US large cap universe made up of companies selected by economists.
S&P 500 Buyback Index. An index designed to measure the performance of the top 100 stocks with the highest buyback ratios in the S&P 500.
US 10 Year Treasury Yield. The return on a 10 year US Government debt obligation.
Volatility. The extent to which the price of a security or commodity, or the level of a market, interest rate or currency, changes over time.
Volatility of Volatility. The standard deviation of volatility.
Yellen Collar. An implicit guarantee that the Federal Reserve will lower rates in the event of a stock market crash and raise rates in the event of an overheating stock market.
Yield. The income return on an investment, such as the interest or dividends received from holding a particular security.
Glossary
50 IQ Spring 2018: Life After Easy MoneyState Street Global Advisors

ssga.com
Australia State Street Global Advisors, Australia, Limited (ABN 42 003 914 225) is the holder of an Australian Financial Services Licence (AFSL Number 238276). Registered office: Level 17, 420 George Street, Sydney, NSW 2000, Australia. T: +612 9240-7600
Belgium State Street Global Advisors Belgium, Chaussée de La Hulpe 120, 1000 Brussels, Belgium. T: 32 2 663 2036, SSGA Belgium is a branch office of State Street Global Advisors Limited. State Street Global Advisors Limited is authorised and regulated by the Financial Conduct Authority in the United Kingdom.
Canada State Street Global Advisors, Ltd., 770 Sherbrooke Street West, Suite 1200 Montreal, Quebec, H3A 1G1, T: +514 282 2400 and 30 Adelaide Street East Suite 500, Toronto, Ontario M5C 3G6. T: +647 775 5900
Dubai State Street Bank and Trust Company (Representative Office), Boulevard Plaza 1, 17th Floor, Office 1703 Near Dubai Mall & Burj Khalifa, P.O Box 26838, Dubai, United Arab Emirates. T: +971 (0)4-4372800
France State Street Global Advisors Ireland Limited, Paris branch is a branch of State Street Global Advisors Ireland Limited, registered in Ireland with company number 145221, authorised and regulated by the Central Bank of Ireland, and whose registered office is at 78 Sir John Rogerson’s Quay, Dublin 2. State Street Global Advisors Ireland Limited, Paris Branch, is registered in France with company number RCS Nanterre 832 734 602 and whose office is at Immeuble Défense Plaza, 23-25 rue Delarivière-Lefoullon, 92064 Paris La Défense Cedex, France. T: (+33) 1 44 45 40 00
Germany State Street Global Advisors GmbH, Brienner Strasse 59, D-80333 Munich. Authorised and regulated by the Bundesanstalt für Finanzdienstleistungsaufsicht (“BaFin”). Registered with the Register of Commerce Munich HRB 121381. T: +49 (0)89-55878-400
Hong Kong State Street Global Advisors Asia Limited, 68/F, Two International Finance Centre, 8 Finance Street, Central, Hong Kong. T: +852 2103-0288
Japan State Street Global Advisors (Japan) Co., Ltd., Toranomon Hills Mori Tower 25F 1-23-1 Toranomon, Minato-ku, Tokyo 105-6325 Japan, T: +81-3-4530-7380 Financial Instruments Business Operator, Kanto Local Financial Bureau (Kinsho #345), Membership: Japan Investment Advisers Association, The Investment Trust Association, Japan, Japan Securities Dealers' Association.
Ireland State Street Global Advisors Ireland Limited is regulated by the Central Bank of Ireland. Registered office address 78 Sir John Rogerson’s Quay, Dublin 2. Registered number 145221. T: +353 (0)1 776 3000
Italy State Street Global Advisors Limited, Milan Branch (Sede Secondaria di Milano) is a branch of State Street Global Advisors Limited, a company registered in the UK, authorised and regulated by the Financial Conduct Authority (FCA), with a capital of GBP 62,350,000, and whose registered office is at 20 Churchill Place, London E14 5HJ. State Street Global Advisors Limited, Milan Branch (Sede Secondaria di Milano), is registered in Italy with company number 06353340968 - R.E.A. 1887090 and VAT number 06353340968 and whose office is at Via dei Bossi, 4 - 20121 Milano, Italy T: 39 02 32066 100
Netherlands State Street Global Advisors Netherlands, Apollo Building, 7th floor Herikerbergweg 29 1101 CN Amsterdam, Netherlands. T: 31 20 7181701. SSGA Netherlands is a branch office of State Street Global Advisors Limited. State Street Global Advisors Limited is authorised and regulated by the Financial Conduct Authority in the United Kingdom.
Singapore State Street Global Advisors Singapore Limited, 168, Robinson Road, #33-01 Capital Tower, Singapore 068912 (Company Reg. No: 200002719D, regulated by the Monetary Authority of Singapore) T: +65 6826-7555
Switzerland State Street Global Advisors AG, Beethovenstr. 19, CH-8027 Zurich. Authorised and regulated by the Eidgenössische Finanzmarktaufsicht (“FINMA”). Registered with the Register of Commerce Zurich CHE-105.078.458. T: +41 (0)44 245 70 00
United Kingdom State Street Global Advisors Limited. Authorised and regulated by the Financial Conduct Authority. Registered in England. Registered No. 2509928. VAT No. 5776591 81. Registered office: 20 Churchill Place, Canary Wharf, London, E14 5HJ. T: 020 3395 6000
United States State Street Global Advisors, 1 Iron Street, Boston, MA 02210 T: +617 786 3000
State Street Global Advisors Worldwide Entities
51 IQ Spring 2018: Life After Easy MoneyState Street Global Advisors

Disclosure
For use in Australia. Issued by State Street Global Advisors, Australia, Limited (AFSL Number 238276, ABN 42 003 914 225) (“SSGA Australia”). Registered office: Level 17, 420 George Street, Sydney, NSW 2000, Australia T: +612 9240 7600 Web: ssga.com. This communication is directed at institutional and wholesale clients only. The products and services to which this communication relates are only available to such persons and persons of any other description (including retail clients) are not entitled to rely on this communication.
For use in EMEA. The information contained in this communication is not a research recommendation or ‘investment research’ and is classified as a ‘Marketing Communication’ in accordance with the European Communities (Markets in Financial Instruments) Regulations 2007. This means that this marketing communication (a) has not been prepared in accordance with legal requirements designed to promote the independence of investment research (b) is not subject to any prohibition on dealing ahead of the dissemination of investment research. The information provided does not constitute investment advice as such term is defined under the Markets in Financial Instruments Directive (2004/39/EC) and it should not be relied on as such. This communication is directed at professional clients (this includes eligible counterparties) who are deemed both knowledgeable and experienced in matters relating to investments. The products and services to which this communication relates are only available to such persons and persons of any other description (including retail clients) should not rely on this communication.
For use in Switzerland. The information provided does not constitute investment advice as such term is defined under applicable Swiss regulation and it should not be relied on as such.
All material has been obtained from sources believed to be reliable. There is no representation or warranty as to the accuracy of the information and State Street shall have no liability for decisions based on such information.
This communication is directed at qualified investors (as defined by FINMA) who are deemed both knowledgeable and experienced in matters relating to investments. The products and services to which this communication relates are only available to such persons and persons of any other description (including retail clients) should not rely on this communication.
The information provided does not constitute investment advice and it should not be relied on as such. It should not be considered a solicitation to buy or an offer to sell a security. It does not take into account any investor’s particular investment objectives, strategies, tax status or investment horizon. You should consult your tax and financial advisor. All material has been obtained from sources believed to be reliable. There is no representation or warranty as to the accuracy of the information and State Street shall have no liability for decisions based on such information.
The views expressed in this material are the views of each of the respective authors noted as of March 22, 2018 and are subject to change based on market and other conditions.
This document contains certain statements that may be deemed forwardlooking statements. Please note that any such statements are not guarantees of any future performance and actual results or developments may differ materially from those projected.
The trademarks and service marks referenced herein are the property of their respective owners. Third party data providers make no warranties or representations of any kind relating to the accuracy, completeness or timeliness of the data and have no liability for damages of any kind relating to the use of such data.
CFA® is a trademark of the CFA Institute.
Investing involves risk including the risk of loss of principal.
The whole or any part of this work may not be reproduced, copied or transmitted or any of its contents disclosed to third parties without State Street Global Advisors’ express written consent.
All the index performance results referred to are provided exclusively for comparison purposes only. It should not be assumed that they represent the performance of any particular investment.
© 2018 State Street Corporation. All Rights Reserved.
2061941.1.1.GBL.RTL Exp. Date: 4/30/2019
52 IQ Spring 2018: Life After Easy MoneyState Street Global Advisors