ipo review full-year and q4 2016 - pwc...global technology ipo review full-year and q4 2016 8...
TRANSCRIPT

Global Technology IPO Review Full-year and Q4 2016

Global Technology IPO Review Full-year and Q4 2016 1
Global tech IPOs in 2016 dropped to their lowest level in the decade amidst macroeconomic and geopolitical turmoil, but a stream of high-profile companies in the pipeline will likely create a resurgence in 2017*
Raman Chitkara Partner and Global Technology Industry Leader PricewaterhouseCoopers LLP [email protected]
On the heels of two strong years, 2016 ended with the fewest global technology IPOs of any year in the decade, with only 54 tech companies completing initial public offerings for total proceeds of US$9.4 billion. That’s a 41% decline in volume and a 65% decline in proceeds from 2015. With 20 tech IPOs, Q3 was the best period of the year, but Q4 was the worst, with just ten tech IPOs. The market rally following the US elections bodes well for a healthier global tech IPO market in 2017.
The year started slowly with only 24 IPOs and US$2.2 billion in proceeds in the first half of 2016, a result of the steep stock market sell-off in January that froze out potential IPO companies. Volatility and uncertainty closed the US IPO window, and China posted just three tech IPOs in the first quarter. The UK, historically one of the leading markets in Europe, saw no tech IPOs in 2016, a result of uncertainty over the Brexit election that grew into concern about executing on the outcome. Although the UK was absent, Europe posted reasonable results with 10 IPOs from eight countries, including three of the largest tech IPOs of the year. They included the largest, Net A/S, a digital payments company in Denmark, at US$2.4 billion.
Given uncertainty associated with the US presidential election, most companies chose to remain on the sidelines in the fourth quarter. Overall, tech IPOs rebounded in the second half of 2016, with US$7.1 billion, a three-fold jump in proceeds. Even so, average proceeds of US$174 million was the second lowest, just above the average in 2010 (US$165 million). Big-ticket IPOs that were common in 2014 and 2015 were all but non-existent in 2016.
With 80% of tech companies that debuted in 2014 or 2015 typically trading below their first-day closing prices during most of 2016, valuations became a key concern.1 The combination of uncertain market conditions, high private valuations and ample cash caused many companies to wait until public markets offer a more favorable environment, like we’re starting to see in early 2017.
Looking ahead, optimism for higher economic growth post US elections has spurred a market rally. With investors keeping a sharp focus on profitability, not simply revenue growth, we expect the companies going public will likely have better earnings quality and less aggressive valuations than in recent years. This should help to support and accelerate tech IPOs in 2017.
Sincerely,
1. https://www.bdo.nz/getattachment/Insights/Advisory/Newsletters/2016-Technology-Risk-Factor-Report/2016-Technology-RiskFactor-Report-Brochure-WEB.pdf.aspx?lang=en-NZ
*Issue size greater than US$40 million (includes overallotment) and based on trade date; See Methodology

Table of contents
1. Full-year 2016 global tech IPO summary 3 2. A close look at full-year 2016 technology IPOs 12
Geographic IPO trends – Full-year 2016 ...................................................................................................................................... 12 Europe and the UK .................................................................................................................................................................. 12 China ........................................................................................................................................................................................ 13 United States ........................................................................................................................................................................... 14 Full-year 2016 tech IPOs – Offering details ........................................................................................................................... 15
3. Q4 2016 Global tech IPO summary 20 Q4 2016 Top 5 technology listings ................................................................................................................................................. 21 Q4 2016 Geographic tech IPO trends ........................................................................................................................................... 22
United States .......................................................................................................................................................................... 23 China ....................................................................................................................................................................................... 24 Europe (excluding UK) ........................................................................................................................................................... 25 UK ........................................................................................................................................................................................... 26 Asia (Excluding China) ........................................................................................................................................................... 27
Average proceeds .......................................................................................................................................................................... 28 Age of company ............................................................................................................................................................................. 29
4. Q4 2016 Stock exchange distribution 30 5. Q4 2016 Subsector distribution 31 6. Key financials—Q4 2016 33
Q4 2016 Technology IPO listings: Valuation metric ................................................................................................................... 38 Top three subsectors in Q4 2016 ................................................................................................................................................... 40
7. Methodology 61 8. For more information 62

Global Technology IPO Review Full-year and Q4 2016 3
Full-year 2016 global tech IPO summary
The year with the fewest tech IPOs in the decade As measured by numbers of IPOs and total proceeds, 2016 was the slowest year of the decade for global tech IPOs, beating 2013 for this dubious distinction. It was the second lowest for average proceeds, US$174million, since 2010 (US$165). IPOs declined 41% in volume and 65% in total proceeds from 2015 to 2016.
Figure 1: Global tech IPOs 2010-2016
Source: S&P Capital IQ with analysis by PwC
$17,952 $15,857
$23,155
$11,446
$51,193
$27,103
$9,374
109
87 69
64
118
92
54
-
20
40
60
80
100
120
140
2010 2011 2012 2013 2014 2015 2016 $-
$10,000
$20,000
$30,000
$40,000
$50,000
$60,000
No.
of I
POs
US$
mill
ionsTotal proceeds (US$mn) Total number of IPOs
“Several factors suggest the 2017 global tech IPO market will be much better: the postelection stock market rally, the promise of US tax reform, general economic conditions, cyclicality of the tech IPO market and pent-up demand for public offerings.”
Raman Chitkara Global Technology Industry Leader

Global Technology IPO Review Full-year and Q4 2016 4
After a slow start, global tech IPOs bounced back in the second half of 2016 The global technology IPO market gained momentum in Q3 after a slow first half. 30 technology IPOs were listed in the second half versus 24 in the first half. The second-half resurgence occurred in Q3 with 20 IPOS, as most tech companies shied away from the IPO market in Q4.
Five Unicorns completed their IPOs in 2016, two each in Q2 and Q4 and one in Q3.
Figure 2: 2010-2016 1st half vs 2nd half tech IPOs
Source: S&P Capital IQ with analysis by PwC
$8,699 $9,253 $8,710$7,147
$20,817
$2,338$4,588
$6,858
$18,955
$32,237
$12,225
$14,878
$2,250
$7,125
55 54 53
34
19
50
27
37
66
52
59
33
24
30
-
10
20
30
40
50
60
70
1st Half2010
2ndHalf2010
1st Half2011
2ndHalf2011
1st Half2012
2ndHalf2012
1st Half2013
2ndHalf2013
1st Half2014
2ndHalf2014
1st Half2015
2ndHalf2015
1st Half2016
2ndHalf2016
$-
$5,000
$10,000
$15,000
$20,000
$25,000
$30,000
$35,000
Total proceeds (US$mn) Number of IPOsU
S$m
illio
ns
No.
of I
POs

Global Technology IPO Review Full-year and Q4 2016 5
Number of offerings and proceeds declined for all regions except Europe (excluding UK) China led with 19 tech IPOs in 2016, followed by the US with 16; aggregate proceeds were US$2.1 billion and US$1.8 billion, respectively. Europe, excluding the UK, had 10 IPOs, including the largest of the year, Nets A/S. Nets, a digital payment services company, raised US$2.4 billion, which was two-thirds of the total proceeds of US$3.7 billion from Europe’s IPOs. The UK had no tech IPOs this year compared to nine in 2015 and seven in 2014 owing to uncertainty over the Brexit vote and its aftermath. Asia, excluding China, saw a dip in proceeds due to fewer IPOs. Only Japan provided some support for the region. It had three tech IPOs and the fourth highest proceeds, led by the second largest IPO of the year, Line Corp. Line, a messaging app, and raised US$1.1 billion in the year’s largest NYSE tech IPO. The US’s Nutanix was the largest VC-backed tech IPO listing on the NASDAQ in 2016, raising US$238 million. Overall, the US IPO market declined, registering 16 tech IPOs and raising US$1.8 billion compared with 23 tech IPOs and US$8.4 billion in 2015.
While several large leveraged buyouts and high-profile startups remain on the sidelines, there are signs of a possible flurry of tech IPOs in the next 12 months.
Figure 3: 2014-2016 Geographic distribution—Number of IPOs
Source: S&P Capital IQ with analysis by PwC
Figure 4: 2014-2016 Geographic distribution—Proceeds
Source: S&P Capital IQ with analysis by PwC
8
19
7
45
37
1117
9
3023
10 9
0
1916
Europe w/o UK Asia w/o China UK China US0
10
20
30
40
50No. of IPOs
2014 2015 2016
No.
of I
POs
$3,570$7,298
$3,277
$29,063
$7,850
$3,176 $3,381$7,811
$4,074$8,396
$3,674 $1,833$0
$2,067 $1,800
Europe w/o UK Asia w/o China UK China US$0
$5,000$10,000$15,000$20,000$25,000$30,000$35,000
Proceeds raised
2014 2015 2016
US$
mill
ions

Global Technology IPO Review Full-year and Q4 2016 6
Tech IPO activity in Europe remained brisk in 2016 despite challenges in other markets
Tech IPO activity in Europe, excluding the UK, remained brisk in 2016 despite challenges elsewhere. There was broad distribution across eight countries, including Denmark, which had the largest tech IPO of the year. Overall, Europe contributed three of the largest tech IPOs of 2016.
Figure 5: Full-year 2016 European tech IPOs
Source: S&P Capital IQ with analysis by PwC
"The European market proved to be notably strong in 2016, in spite of the migration crisis and the Brexit referendum. The expansionary monetary policy in place led investors to look for alternatives to the low interest rate environment. This was translated positively to the European capital market. With US$3,674 million in total proceeds, we experienced in Europe the largest volume of tech IPOs worldwide."
Werner Ballhaus Technology, Media and Telecommunications Industry Leader, PwC Germany

Global Technology IPO Review Full-year and Q4 2016 7
Lack of big-ticket IPOs pushed average proceeds down to a six-year low It was not a year for high-flying tech IPOs, with only two US$1 billion-plus offerings. This reduced average proceeds to US$ 174 million, the second lowest in the decade. However, the majority of tech companies going public in 2016 were long-standing enterprises with histories of strong financial performances.
Figure 6: 2010-2016 Average proceeds
Source: S&P Capital IQ with analysis by PwC
$165 $182
$336
$179
$434
$295
$174
109
87
6964
118
92
54
0
20
40
60
80
100
120
140
$-
$50
$100
$150
$200
$250
$300
$350
$400
$450
$500
2010 2011 2012 2013 2014 2015 2016
Average proceeds No. of IPOsU
S$ m
illio
ns
No.
of I
POs

Global Technology IPO Review Full-year and Q4 2016 8
Internet Software & Services (IS&S) and Software subsectors remained the growth engine for tech IPOs, with 33 IPOs raising US$5.3 billion The largest IPO of the year was an IT Consulting & Services company, Nets A/S of Denmark, which raised US$2.4 billion. But the pivotal subsectors for tech IPOs were Internet Software & Services and Software, with a combined 33 IPOs and proceeds of US$5.3 billion.
Figure 7: Full-year 2016 subsector distribution
Source: S&P Capital IQ with analysis by PwC
$5,284
$517$41
$239
$3,000
$293
33
8
1 2
5 5
-
5
10
15
20
25
30
35
Internet Software& Services and
Software
Semiconductors ComputerStorage &
Peripherals
CommunicationsEquipment
IT Consulting &Services
Electronics $-
$1,000
$2,000
$3,000
$4,000
$5,000
$6,000
Total proceeds (US$mn) Number of IPOsU
S$m
illio
ns
No.
of I
POs

Global Technology IPO Review Full-year and Q4 2016 9
Compared to the previous six years the Internet Software & Services and Software subsectors experienced a pullback in 2016 with the second lowest proceeds and number of IPOs in the decade
Figure 8: 2010-2016 IPOs for the Internet Software & Services and Software subsectors
Source: S&P Capital IQ with analysis by PwC
$3,369
$8,679
$20,172
$7,297
$40,620
$19,508
$5,284
22
38
34
42
82
56
33
-
10
20
30
40
50
60
70
80
90
2010 2011 2012 2013 2014 2015 2016 $-
$9,000
$18,000
$27,000
$36,000
$45,000
IS&S and Software - Total proceeds IS&S and Software - No. of IPOs
US$
mill
ions
No.
of I
POs

Global Technology IPO Review Full-year and Q4 2016 10
Broad participation across global exchanges With volatility and uncertainty dominating the major markets in China, the UK and the US, companies outside these countries largely chose to list on their home exchanges. Copenhagen’s OMX registered the biggest tech IPO of the year, Nets A/S, raising US$2.4 billion.
The Tokyo SE registered a total of US$111 million with two offerings and India’s BSE and NSE exchanges registered a total of three tech IPOs with US$318 million in proceeds. Australia listed three companies with proceeds of US$283 million, one of which is domiciled in Ireland. The OMX in Stockholm listed four companies with proceeds of US$320 million, one of which is domiciled in Malta. The Hong Kong Stock Exchange listed one company with proceeds of US$629 million, domiciled in China.
Figure 9: 2016 Full-year stock exchange distribution
Source: S&P Capital IQ with analysis by PwC
$1,669
$1,983
$782
$311$186
$283$369
$42$111 $134 $185
$2,371
$320
$629
4
17
10 5
1 3 1
1 2 2 1 1 4 1 -
6
12
18
24
30
36
$0
$500
$1,000
$1,500
$2,000
$2,500
Total proceeds (US$mn) Number of IPOs
US$
mill
ions
No.
of I
POs

Global Technology IPO Review Full-year and Q4 2016 11
Cross-border IPO activity has not changed much despite the pullback in IPOs Cross-border IPOs, as a percentage of the total, were within the 15%-to-17% range, which was mostly consistent with recent years.
Figure 10: 2010-2016 Cross-border tech IPO activity
Source: S&P Capital IQ with analysis by PwC
19 13 16 11 18 11 8
90
74 53
53
100
81
46
17%
15%
23%
17%15%
12%
15%
-
20
40
60
80
100
120
140
2010 2011 2012 2013 2014 2015 20160%
5%
10%
15%
20%
25%
US$
mill
ions
Cross-border IPOs Domestic IPOs % of Cross-border IPOs
No.
of I
POs

Global Technology IPO Review Full-year and Q4 2016 12
A close look at full-year 2016 technology IPOs
Geographic IPO trends – Full-year 2016 Europe and the UK
Europe, excluding the UK, posted strong performance, while the UK languished with no IPOs this year Europe, excluding the UK, was the best performing region in 2016, registering 10 IPOs with total proceeds of US$3.7 billion, a 16% increase over 2015.
Europe had the biggest IPO listing of the year (US$2.4 billion), Nets A/S, which provides digital payment services and related technology solutions. Other tech IPOs from Europe included Takeaway.com, a food delivery app from the Netherlands, with proceeds of US$369 million; Global Dominion Access, S.A., an IT and consulting services company from Spain, raising US$185 million; Talend SA, a software-based platform provider from France, raising US$95 million; German Internet software and services company Trivago NV, raising US$287 million; Catena Media PLC, an Internet software and services company from Malta, raising US$101 million; Oneview Healthcare PLC, an Irish company, with US$47 million; and three companies from Sweden all listing on the Nordic Exchange in Stockholm, LeoVegas AB (US$111 million), Paradox Interactive AB (US$65 million), and THQ Nordic AB (US$43 million).
Figure 11: 2010-2016 Europe (excluding UK) tech IPOs
Figure 12: 2010-2016 UK tech IPOs
Source: S&P Capital IQ with analysis by PwC
$2,777
$1,846
$352$754
$3,571
$3,176
$3,674
3
6
3 4
8
11
10
-
12
2010 2011 2012 2013 2014 2015 2016 $-
$1,000
$2,000
$3,000
$4,000
Total proceeds (US$mn) Number of IPOs
US$
mill
ions
No.
of I
POs
$843 $0 $0$730
$3,277
$7,811
$0
2
- -
4
7
9
- -
2
4
6
8
10
12
2010 2011 2012 2013 2014 2015 2016 $-
$1,000 $2,000 $3,000 $4,000 $5,000 $6,000 $7,000 $8,000 $9,000
Total proceeds (US$mn) Number of IPOs
US$
mill
ions
No.
of I
POs

Global Technology IPO Review Full-year and Q4 2016 13
China
Chinese tech IPO results were adversely affected by the decline in China’s economic growth, increased volatility on Chinese exchanges and regulatory actions China reported 19 IPOs, but the proceeds raised were relatively low (US$2.1 billion) with an average of US$108 million. The number of Chinese tech IPOs dropped 37% and proceeds fell 49% from 2015 to 2016.
China’s economic slowdown continued, with GDP growth declining from 7.4% in 2014 to 6.9% in 2015. Chinese stock exchange regulators stalled IPOs twice in the last two years for various regulatory reasons. New IPO regulations likely contributed to a more cautious atmosphere for Chinese tech IPOs. The Chinese market is expected to improve this year.
Figure 13: 2010-2016 China tech IPOs
Source: S&P Capital IQ with analysis by PwC
$9,249$7,415
$2,439$1,026
$29,063
$4,074$2,067
70
50
33
8
45
30
19
-
10
20
30
40
50
60
70
80
2010 2011 2012 2013 2014 2015 2016 $-
$5,000
$10,000
$15,000
$20,000
$25,000
$30,000
$35,000
Total proceeds (US$mn) Number of IPOsU
S$m
illio
ns
No.
of I
POs
“After a one-year adjustment, China’s capital market gradually returned to its normal rhythm during the second half of 2016, although the proceeds of each IPO was generally small. In November 2016 the Chinese Regulatory Commission (CSRC) sped up the approval of IPOs, setting the stage for acceleration in the number of 2017 IPOs for Hong Kong and domestic markets.”
Jianbin Gao
Technology Industry Leader, PwC China

Global Technology IPO Review Full-year and Q4 2016 14
United States
Historical cyclicality combined with a high level of uncertainty about the US presidential election led most US technology companies to remain on the sidelines in 2016
The US tech IPO market exhibited subdued performance in 2016. US tech IPOs slid by almost 79% in proceeds to US$1.8 billion and 30% by number of listings to 16 IPOs. The average deal size was a US$113 million.
Market volatility, geopolitical actions in Europe and the US presidential election left investors uncertain and uneasy and high-profile startups choosing not to test the public markets.
Figure 14: 2010-2016 US tech IPOs
Source: S&P Capital IQ with analysis by PwC
$2,150
$4,926
$20,316
$7,591 $7,850 $8,396
$1,800
19
24
32 35 37
23
16
-
8
16
24
32
40
2010 2011 2012 2013 2014 2015 2016 $-
$5,000
$10,000
$15,000
$20,000
$25,000
Total proceeds (US$mn) Number of IPOsU
S$m
illio
ns
No.
of I
POs
“After a slow start to 2016, there was some rebound in both the number of tech IPOs and returns to investors, despite ongoing uncertainty about the economy and election. We anticipate improvement in market conditions given positive equity market returns. This momentum creates a window for tech companies to pursue a potential IPO. Buy-side investors will demand a path to profitability, not simply revenue growth, to bring these companies to market in 2017.”
Alan Jones Technology Deals Partner, PwC US

Global Technology IPO Review Full-year and Q4 2016 15
Full-year 2016 tech IPOs – Offering details Table 1: 2016 tech IPOs – By issue date
Issue date Company Subsector Proceeds (US$mn) Primary exchange Domicile nation
Q1
3/17/2016 LeoVegas AB (publ) Internet Software & Services
110.7 Nordic Exchange Stockholm
Sweden
2/11/2016 Catena Media Plc Internet Software & Services
101.3 Nordic Exchange Stockholm
Malta
2/18/2016 Quick Heal Technologies Limited IT Consulting & Services
65.9 Mumbai Stock Exchange India
3/3/2016 Eoptolink Technology Inc Ltd Electronics 63.9 Shenzhen Stock Exchange
China
3/17/2016 Akatsuki Inc Software 56.5 Tokyo Stock Exchange Japan
3/15/2016 UMC Electronics Co Ltd Semiconductors 54.4 Tokyo Stock Exchange Japan
3/21/2016 Tongyu Commun Inc Communications Equipment
132.1 ShenzSME China
3/15/2016 Changsha Jingjia Micro Co Ltd Semiconductors 70.5 ShenzChNxt China
3/28/2016 Infibeam Inc Ltd Internet Software & Services
67.6 Mumbai Stock Exchange India
3/16/2016 Oneview Healthcare Plc Software 46.5 Australian Securities Exchange
Ireland
Q2
04/11/2016 Wisetech Global Limited Internet Software & Services
125.8 Australian Securities Exchange
Australia
04/21/2016 SecureWorks Corp Software 112.0 NASDAQ Global Select United States
04/24/2016 Nanjing Doron Technology Co Ltd
Software 75.2 Shanghai Stock Exchange China
04/26/2016 Global Dominion Access SA IT Consulting & Services
185.5 Bolsas y Mercados Espanoles
Spain

Global Technology IPO Review Full-year and Q4 2016 16
Full-year 2016 tech IPOs – Offering details Table 1: 2016 tech IPOs – By issue date
Issue date Company Subsector Proceeds (US$mn) Primary exchange Domicile nation
05/12/2016 Acacia Communications Inc Semiconductors 103.5 NASDAQ Global Select United States
05/16/2016 Hubei Jiuzhiyang Infrared System Co Ltd
Electronics 100.9 Shenzhen Stock Exchange
China
05/25/2016 Cotiviti Holdings Inc Software 237.5 New York Stock Exchange
United States
05/26/2016 Paradox Interactive AB (publ) Software 65.0 Nordic Exchange Stockholm
Sweden
06/02/2016 NantHealth LLC Software 91.0 New York Stock Exchange
United States
06/09/2016 China Online Education Group Internet Software & Services
65.6 New York Stock Exchange
China
06/20/2016 HAESUNG DS Co Ltd Semiconductors 41.5 Korea Stock Exchange South Korea
06/22/2016 Twilio Inc Internet Software & Services
1500 New York Stock Exchange
United States
06/22/2016 Wuxi New Hongtai Electrical Technology Co Ltd
Electronics 47.8 Shanghai Stock Exchange China
06/23/2016 Shenzhen Shengxunda Technology Co Ltd
Software 78.9 Shenzhen Stock Exchange
China

Global Technology IPO Review Full-year and Q4 2016 17
Full-year 2016 tech IPOs – Offering details Table 1: 2016 tech IPOs – By issue date
Issue date Company Subsector Proceeds (US$mn) Primary exchange Domicile nation
Q3
07/11/2016 LINE Corporation Software 1,125.2 New York Stock Exchange
Japan
07/14/2016 Larsen & Toubro Infotech Limited
IT Consulting & Services
184.8 National Stock Exchange of India
India
07/20/2016 Impinj Inc Semiconductors 67.2 NASDAQ Global Select United States
07/25/2016 Beijing Global Safety Technology Co Ltd
Software 65.6 Shenzhen Stock Exchange
China
07/28/2016 Talend SA Software 94.5 NASDAQ Global Market France
08/08/2016 Shenzhen Urovo Technology Co Ltd
Electronics 40.1 Shenzhen Stock Exchange
China
08/09/2016 GigaDevice Semiconductor (Beijing) Inc
Semiconductors 87.3 Shanghai Stock Exchange China
08/17/2016 Shenzhen Bingchuan Network Co Ltd
Software 139.5 Shenzhen Stock Exchange
China
09/13/2016 Beijing Advanced Digital Technology Co Ltd
Software 49.8 Shenzhen Stock Exchange
China
09/13/2016 Shenzhen Emperor Technology Co Ltd
Computers & Peripherals 40.8 Shenzhen Stock Exchange
China
09/14/2016 Shanghai Wondertek Software Co Ltd
Software 60.0 Shanghai Stock Exchange China
09/15/2016 Everbridge Inc Software 90.0 NASDAQ Global Market United States
09/20/2016 The Trade Desk Inc Internet Software & Services
84.0 NASDAQ Global Market United States
09/23/2016 Nets A/S IT Consulting & Services 2,371.3 Nordic Exchange Copenhagen
Denmark

Global Technology IPO Review Full-year and Q4 2016 18
Full-year 2016 tech IPOs – Offering details Table 1: 2016 tech IPOs – By issue date
Issue date Company Subsector Proceeds (US$mn) Primary exchange Domicile nation
09/23/2016 Apptio Inc Internet Software & Services
96.0 NASDAQ Global Market United States
09/23/2016 Gridsum Holding Inc Software 87.1 NASDAQ Global Market/NGS
China
09/28/2016 Hubei TKD Crystal Electronic Science & Technology Co Ltd
Electronics 40.3 Shanghai Stock Exchange China
09/29/2016 Takeaway.com Holding BV Internet Software & Services
369.1 Euronext Amsterdam Netherlands
09/29/2016 Tabula Rasa HealthCare Inc Software 51.6 NASDAQ United States
09/30/2016 Nutanix Inc Software 237.9 NASDAQ United States
Q4
10/05/2016 Coupa Software Incorporated Software 133.2 NASDAQ Global Select United States
10/07/2016 Everspin Technologies Inc Semiconductors 40.0 NASDAQ Global Market United States
10/27/2016 BlackLine Inc Software 146.2 NASDAQ Global Select United States
10/27/2016 Quantenna Communications Inc Communications Equipment
107.2 NASDAQ Global Select United States
11/01/2016 GDS Holdings Limited IT Consulting & Services
192.5 NASDAQ Global Market China
11/16/2016 Bravura Solutions Limited Software 110.7 Australian Securities Exchange
Australia
11/21/2016 THQ Nordic AB Software 43.3 Nordic Exchange Stockholm
Sweden
12/08/2016 Ichor Holdings Ltd Semiconductors 52.9 NASDAQ Global Select United States
12/14/2016 Meitu, Inc. Internet Software and Services
629.1 The Stock Exchange of Hong Kong Ltd.
China

Global Technology IPO Review Full-year and Q4 2016 19
Full-year 2016 tech IPOs – Offering details Table 1: 2016 tech IPOs – By issue date
Issue date Company Subsector Proceeds (US$mn) Primary exchange Domicile nation
12/16/2016 Trivago NV Internet Software & Services
287.2 NASDAQ Global Select Germany
Source: S&P Capital IQ with analysis by PwC

Global Technology IPO Review Full-year and Q4 2016 20
Q4 2016 Global tech IPO summary Global IPO activity contracted in Q4 2016, but the tech IPO pipeline remains robust Q4 2016 was one of the slowest quarters on record with just ten tech IPOs raising US$1.7 billion. The number of tech IPOs declined by 50% sequentially from 20 IPOs in Q3. Proceeds declined 68% from US$ 5.4 billion in Q3.
Figure 15: Q4 2015-Q4 2016 Global technology IPO trends
Source: S&P Capital IQ with analysis by PwC
$10,785
$769$1,480
$5,382
$1,742
22
10
14
20
10
$-
$2,000
$4,000
$6,000
$8,000
$10,000
$12,000
Q4 2015 Q1 2016 Q2 2016 Q3 2016 Q4 20160
7
14
21
28
35
42
Total proceeds (US$mn) Number of IPOs
US$
mill
ions
No.
of I
POs

Global Technology IPO Review Full-year and Q4 2016 21
Q4 2016 Top 5 technology listings Ten tech IPOs were listed in Q4 2016. The Internet Software & Services subsector registered the highest proceeds with the Chinese Internet software and services company Meitu, Inc. raising US$629 million with a SEHK listing.
The Software and Internet Software & Services subsector dominated with two each of the five top grossing IPOs. China and the US each had two high-grossing tech IPOs in Q4 2016; and Germany registered one IPO. As for stock exchanges, the US was a clear favorite with four of the five top tech IPOs listing on NASDAQ.
Table 2: IPO summary – Top 5 listings
Issue date Company Subsector Proceeds (US$ mn)
Primary exchange Domicile nation
12/14/2016 Meitu, Inc. Internet Software & Services
629.1 The Stock Exchange of Hong Kong Ltd.
China
12/16/2016 Trivago NV Internet Software & Services
287.2 NASDAQ Global Select Germany
11/01/2016 GDS Holdings Limited IT Consulting & Services
192.5 NASDAQ Global Market China
10/27/2016 BlackLine Inc Software 146.2 NASDAQ Global Select United States
10/05/2016 Coupa Software Incorporated Software 133.2 NASDAQ Global Select United States
Source: S&P Capital IQ with analysis by PwC

Global Technology IPO Review Full-year and Q4 2016 22
Q4 2016 Geographic tech IPO trends US led Q4 tech IPO activity with five of the ten listings Compared to the first three quarters of the year, geographic distribution was low, with only five countries participating in Q4. Proceeds were also down. The US had the most—five IPOs—with total proceeds of US$480 million, but the largest IPO of Q4 was Meitu, Inc., of China, which raised US$629 million.
Figure 16: Q4 2016 Geographic distribution
Source: S&P Capital IQ with analysis by PwC
$480 $287
$822
$111
$43
5
1
2
1
1
-
1
2
3
4
5
6
United States Germany China Australia Sweden$0
$100
$200
$300
$400
$500
$600
$700
$800
$900
Total proceeds (US$mn) Number of IPOs
US$
mill
ions
No.
of I
POs

Global Technology IPO Review Full-year and Q4 2016 23
United States
The US had five tech IPOs with average proceeds of only US$96 million. Proceeds were in line with the prior three quarters, but were disappointing due to the overall uncertainty of the impending presidential election.
Figure 17: Q4 2016 US tech IPOs
Source: S&P Capital IQ with analysis by PwC
$4,041
$0
$694 $627 $480
6
-
5
6
5
-
1
2
3
4
5
6
7
Q4 2015 Q1 2016 Q2 2016 Q3 2016 Q4 2016$0
$500
$1,000
$1,500
$2,000
$2,500
$3,000
$3,500
$4,000
$4,500
Total proceeds (US$mn) Number of IPOsU
S$m
illio
ns
No.
of I
POs

Global Technology IPO Review Full-year and Q4 2016 24
China China had two IPO raising US$822 million in Q4 2016, however, the number of small-sized IPOs, with issue size below US$40 million, is increasing. With the move in November 2016 by the China Securities Regulatory Commission (CSRC) to speed up the approval of IPOs, it is expected there will be a higher number of tech IPOs approved and listed in 2017.
Figure 18: Q4 2016 China tech IPOs
Source: S&P Capital IQ with analysis by PwC
$551
$267
$368 $611
$822
6
3
5
9
2
$0
$100
$200
$300
$400
$500
$600
$700
$800
$900
Q4 2015 Q1 2016 Q2 2016 Q3 2016 Q4 2016 -
1
2
3
4
5
6
7
8
9
10
Total proceeds (US$mn) Number of IPOs
US$
mill
ions
No.
of I
POs

Global Technology IPO Review Full-year and Q4 2016 25
Europe (excluding UK) Europe had two IPOs, one each from Germany and Sweden. Trivago NV from Germany was the biggest IPO for the quarter, raising US$287 million and THQ Nordic AB from Sweden raised US$43 million. The companies belonged to the Internet Software & Services and Software subsectors respectively.
Figure 19: Q4 2016 European tech IPOs (Excluding UK)
Source: S&P Capital IQ with analysis by PwC
$307 $258 $250
$2,835
$331
2
3
2
3
2
$0
$500
$1,000
$1,500
$2,000
$2,500
$3,000
Q4 2015 Q1 2016 Q2 2016 Q3 2016 Q4 2016 -
1
2
3
4
5
Total proceeds (US$mn) Number of IPOs
US$
mill
ions
No.
of I
POs

Global Technology IPO Review Full-year and Q4 2016 26
UK UK markets are still languishing under the impact of Brexit. Lack of clarity on the regulatory impact continued to impact capital markets in Q4.
Figure 20: Q4 2016 UK tech IPOs
Source: S&P Capital IQ with analysis by PwC
$4,768
$0 $0 $0 $0
5
- - - -$0
$1,000
$2,000
$3,000
$4,000
$5,000
$6,000
Q4 2015 Q1 2016 Q2 2016 Q3 2016 Q4 2016 -
1
2
3
4
5
Total proceeds (US$mn) Number of IPOsU
S$m
illio
ns
No.
of I
POs

Global Technology IPO Review Full-year and Q4 2016 27
Asia (Excluding China) The participation of Asian countries other than China decreased significantly in Q4. One tech IPO outside China was listed by an Australian company, with proceeds of US$111 million.
Figure 21: Q4 2016 Asia tech IPOs (excluding China)
Source: S&P Capital IQ with analysis by PwC
$656
$244$167
$1,310
$111
2
4
2 2
1
$-
$200
$400
$600
$800
$1,000
$1,200
$1,400
Q4 2015 Q1 2016 Q2 2016 Q3 2016 Q4 2016 -
1
2
3
4
5
Total proceeds (US$mn) Number of IPOs
US$
mill
ions
No.
of I
POs

Global Technology IPO Review Full-year and Q4 2016 28
Average proceeds
Number of IPOs and average proceeds remained below historical norms
Figure 22: Q4 2016 Average proceeds
Source: S&P Capital IQ with analysis by PwC
$372$490
$77$106
$269
$17211
22
10
14
20
10
-
5
10
15
20
25
Q3 2015 Q4 2015 Q1 2016 Q2 2016 Q3 2016 Q4 2016 $-
$100
$200
$300
$400
$500
$600
Average proceeds Number of IPOsU
S$m
illio
ns
No.
of I
POs

Global Technology IPO Review Full-year and Q4 2016 29
Age of company
Mature companies with proven track records listed in Q4 Of the ten IPOs in the last quarter of 2016, 60% (six) of the companies are more than ten years old. Three companies are eight years old while only one company, Ichor Holdings, Ltd was less than five years old.
BlackLine Inc is the oldest and was founded in 2001.
During volatile and uncertain markets, those companies with longevity and proven track records are in a better position to obtain a fair valuation while those with limited earnings history are at risk of poor market reception.
Figure 23: Q4 2016 Age of company
Source: S&P Capital IQ with analysis by PwC
1110
15
10
12
10
4
8 8 8
10 10 10 10 10
0
2
4
6
8
10
12
14
16
Age of company Average age
Age
in y
ears

Global Technology IPO Review Full-year and Q4 2016 30
Q4 2016 Stock exchange distribution US NASDAQ exchange led Q4 listings With five of the ten Q4 tech IPOs being US companies, it is not surprising that NASDAQ led listings (seven) with proceeds of US$959 million. However the largest listing was on the SEHK, by Meitu, Inc. that occurred after the US presidential election when markets began to rally.
Figure 24: Q4 2016 Stock exchange distribution
Source: S&P Capital IQ with analysis by PwC
$43$111
$959
$629
1 1
7
1
-
1
2
3
4
5
6
7
8
OMX Nordic ExchangeStockholm (OM)
Australia StockExchange
NASDAQ The Stock Exchange ofHong Kong Ltd.
$-
$200
$400
$600
$800
$1,000
$1,200
Total proceeds (US$mn) Number of IPOs
US$
mill
ions
No.
of I
POs

Global Technology IPO Review Full-year and Q4 2016 31
Q4 2016 Subsector distributionInternet Software & Services maintained its lead and eclipsed Software subsector in Q4 In Q4 2016 the Software subsector led in numbers of IPOs (four) and Internet Software & Services in proceeds (US$916 million). Most of the big-ticket Internet Software & Services subsector companies chose not to test public markets in 2016.
Figure 25: Q4 2016 Subsector distribution
S&P Capital IQ with analysis by PwC
$916
$433
$93
$193$107
2
4
2
1 1
-
1
1
2
2
3
3
4
4
5
Internet Software &Services
Software Semiconductors IT Consulting &Services
CommunicationsEquipment
$-
$100
$200
$300
$400
$500
$600
$700
$800
$900
$1,000
Total proceeds (US$mn) Number of IPOs
US$
mill
ions
No.
of I
POs

Global Technology IPO Review Full-year and Q4 2016 32
Table 3: Q4 2016 tech IPOs
Issue date Company Subsector Proceeds (US$ mn) Primary exchange
Domicile nation
12/14/2016 Meitu, Inc. Internet Software & Services
629.1 The Stock Exchange of Hong Kong Ltd.
China
12/16/2016 Trivago NV Internet Software & Services
287.2 NASDAQ Global Select Germany
11/01/2016 GDS Holdings Limited IT Consulting & Services 192.5 NASDAQ Global Market China
10/27/2016 BlackLine Inc Software 146.2 NASDAQ Global Select United States
10/05/2016 Coupa Software Incorporated Software 133.2 NASDAQ Global Select United States
11/16/2016 Bravura Solutions Limited Software 110.7 Australian Securities Exchange Australia
10/27/2016 Quantenna Communications Inc Communications Equipment
107.2 NASDAQ Global Select United States
12/08/2016 Ichor Holdings Ltd Semiconductors 52.9 NASDAQ Global Select United States
11/21/2016 THQ Nordic AB (publ) Software 43.3 Nordic Exchange Stockholm Sweden
10/07/2016 Everspin Technologies Inc Semiconductors 40.0 NASDAQ Global Market United States
Source: S&P Capital IQ with analysis by PwC

Global Technology IPO Review Full-year and Q4 2016 33
Key financials—Q4 2016 The average last twelve months’ (LTM) earnings for Q4 2016 was a net loss of US$107 million, with only 20% of the companies reporting net income. Of the ten tech IPOs in the last quarter of 2016, only two companies, THQ Nordic AB of Sweden and Ichor Holdings, Ltd of the US reported net income. THQ Nordic AB in the Software subsector had the highest net income of US$6.8 million.
For the full year, the percentage of companies with net income was noticeably higher, at 57%, compared to Q4 2016. Larsen & Toubro Infotech Limited, an Indian IT Consulting & Services company, had the highest LTM net income in 2016, at US$147 million, while Acacia Communications, Inc, an American semiconductor company had the second highest LTM net income at US$51 million. Nutanix Inc of Japan and NantHealth LLC of the US incurred the highest net losses at US$169 million and US$91 million, respectively.
Software companies were partially responsible for pulling down the average LTM net income with three (43%) of the seven loss-incurring companies from that subsector. In 2016, 42% companies reported LTM net losses compared to 37% of 2015.
The companies that went public in the Internet Software & Services subsector, Trivago NV and Meitu Inc. Trivago NV recorded the highest average revenue overall at US$717 million, which also made it the subsector with the highest average revenue.
The Semiconductor subsector reported the second highest average revenue—US$183 million—from two listings, while the IT Consulting & Services subsector posted average revenue of US$138 million from one listing. The Software subsector reported the lowest average revenue, of US$100 million, from four listings in Q4 2016.
Figure 26: Full-year and Q4 2016 technology IPOs – Net income
Source: S&P Capital IQ with analysis by PwC
20%
80%
Q4 2016
Positive net income Net loss
57%
43%
Full-year 2016
Positive net income Net loss

Global Technology IPO Review Full-year and Q4 2016 34
Figure 27: Q4 2016—Average LTM revenue
Figure 28: Q4 2016—Average LTM EBITDA
Source: S&P Capital IQ with analysis by PwC
$117
$472
$138$183
$100
$202
1
2
12
4
10
0
2
4
6
8
10
12
$- $50.0
$100.0 $150.0 $200.0 $250.0 $300.0 $350.0 $400.0 $450.0 $500.0
CommunicationsEquipment
Internet Software &Services
IT Consulting & Services Semiconductors Software All sectors
No.
of I
POs
LTM revenue No. of IPOs
In U
S$ m
illio
ns
$1
($54)
$23
$4
($7) ($7)
1 21 2
4
10
0
2
4
6
8
10
12
-$60-$50-$40-$30-$20-$10
$0$10$20$30
CommunicationsEquipment
Internet Software &Services
IT Consulting & Services Semiconductors Software All Sectors
No.
of I
POs
LTM EBITDA No. of IPOs
In U
S$ m
illio
ns

Global Technology IPO Review Full-year and Q4 2016 35
Figure 29: Q4 2016—Average LTM net income
Source: S&P Capital IQ with analysis by PwC
($2)
($479)
($34) ($8) ($18)
($108)
12
12
4
10
0
2
4
6
8
10
12
$(600.0)
$(500.0)
$(400.0)
$(300.0)
$(200.0)
$(100.0)
$-
CommunicationsEquipment
Internet Software &Services
IT Consulting & Services Semiconductors Software All sectors
No.
of I
POs
LTM Net income No. of IPOs
In U
S$ m
illio
ns

Global Technology IPO Review Full-year and Q4 2016 36
Figure 30: Q4 2016—Average total debt
Source: S&P Capital IQ with analysis by PwC
$6$28
$362
$35 $30
$921
21
2
4
10
0
2
4
6
8
10
$-
$50.0
$100.0
$150.0
$200.0
$250.0
$300.0
$350.0
$400.0
CommunicationsEquipment
Internet Software &Services
IT Consulting & Services Semiconductors Software All sectors
No.
of I
POs
LTM debt No. of IPOs
In U
S$ m
illio
ns

Global Technology IPO Review Full-year and Q4 2016 37
Figure 31: Q4 2016—Average Enterprise Value
Source: S&P Capital IQ with analysis by PwC
$817
$4,587
$1,630
$342
$756
$1,627
1
2
1
2
4
10
0
2
4
6
8
10
$-
$500.0
$1,000.0
$1,500.0
$2,000.0
$2,500.0
$3,000.0
$3,500.0
$4,000.0
$4,500.0
$5,000.0
CommunicationsEquipment
Internet Software &Services
IT Consulting & Services Semiconductors Software All sectors
No.
of I
POs
Enterprise value No. of IPOs
In U
S$ m
illio
ns

Global Technology IPO Review Full-year and Q4 2016 38
Q4 2016 Technology IPO listings: Valuation metrics The overall valuation of technology IPOs marginally increased in Q4 2016 compared to Q4 2015. IT Consulting & Services and Internet Software & Services led the valuation metrics with an average with 12x and 10x, respectively.
The average EV/LTM revenue for listed IPOs in Q4 2016 was 8.1x, higher than 4.8x in Q4 2015. The IT Consulting & Services subsector had only one listing with an enterprise value of US$1,630 million and revenue of US$137.5 million, thus making the EV/LTM revenue 11.9x.
Software companies posted an average revenue multiple of 7.5x, followed by Communications Equipment at 7.0x. The Semiconductors subsector came last at 1.9x.
The Communications Equipment subsector led with the highest average EV/LTM EBITDA multiple of 1634.6x, followed by the Semiconductors subsector at 77.7x and IT Consulting & Services subsector at 72.1x.
Figure 32: Q4 2016 EV/LTM revenue
Source: S&P Capital IQ with analysis by PwC
7.0x
9.7x11.9x
1.9x
7.5x8.1x
1
2
1
2
4
10
0
2
4
6
8
10
0.0x
2.0x
4.0x
6.0x
8.0x
10.0x
12.0x
14.0x
CommunicationsEquipment
InternetSoftware &Services
IT Consulting &Services
Semiconductors Software All sectors
No.
of I
POs
EV/LTM revenue No. of IPOs
In m
ultip
les

Global Technology IPO Review Full-year and Q4 2016 39
Figure 33: Q4 2016 EV/LTM EBITDA
Source: S&P Capital IQ with analysis by PwC
1634.6x
NM 72.1x77.7x
NM NM
1
2
1
2
4
10
0
2
4
6
8
10
0.0x
200.0x
400.0x
600.0x
800.0x
1,000.0x
1,200.0x
1,400.0x
1,600.0x
1,800.0x
CommunicationsEquipment
Internet Software &Services
IT Consulting & Services Semiconductors Software All sectors
No.
of I
POs
EV/ LTM EBITDA No. of IPOs
In m
ultip
les

Global Technology IPO Review Full-year and Q4 2016 40
Top three subsectors in Q4 2016
Software The Software subsector registered four IPO listings in Q4 2016, with total proceeds of US$433 million and an average LTM revenue of US$100 million. The subsector witnessed negative growth year to year (down 55%) and quarter to quarter (down 60%). Bravura Solutions Limited of Australia grossed the highest proceeds with US$134 million. Average LTM EBITDA for Q4 2016 was US$7 million compared to US$31 million in Q4 2015. Average net income was actually a loss of US$18 million, which has been a persistent trend from the previous quarter as well as since Q2 2015. Average debt declined 54% compared to Q3 2016. EV/LTM revenue decreased from 12x in Q4 2015 and 9.8x in Q3 2016 to 7.5x in Q4 2016. EV/LTM EBITDA declined from a positive 85.3x to a negative 105.7x year on year.
Figure 34: Software – LTM revenue
Source: S&P Capital IQ with analysis by PwC
$223
$21
$199
$253
$100
4 2
6
10
4
0
2
4
6
8
10
12
$0
$50
$100
$150
$200
$250
$300
Q4 2015 Q1 2016 Q2 2016 Q3 2016 Q4 2016
No.
of I
POs
LTM revenue No. of IPOs
In U
S$ m
illio
ns

Global Technology IPO Review Full-year and Q4 2016 41
Figure 35: Software – LTM EBITDA
Source: S&P Capital IQ with analysis by PwC
$31
($11)
$21
$4
($7)
4
2
6
10
4
0
2
4
6
8
10
12
($15)
($10)
($5)
$0
$5
$10
$15
$20
$25
$30
$35
Q4 2015 Q1 2016 Q2 2016 Q3 2016 Q4 2016
No.
of I
POs
LTM EBITDA No. of IPOs
In U
S$ m
illio
ns

Global Technology IPO Review Full-year and Q4 2016 42
Figure 36: Software – LTM net income
Source: S&P Capital IQ with analysis by PwC
($4) ($4)
($11)
($19) ($18)
4
2
6
10
4
0
2
4
6
8
10
12
($20)
($18)
($16)
($14)
($12)
($10)
($8)
($6)
($4)
($2)
$0
Q4 2015 Q1 2016 Q2 2016 Q3 2016 Q4 2016
No.
of I
POs
LTM Net income No. of IPOs
In U
S$ m
illio
ns

Global Technology IPO Review Full-year and Q4 2016 43
Figure 37: Software – EV
Source: S&P Capital IQ with analysis by PwC
$2,675
$320
$1,627
$2,468
$7564 2
6
10
4
0
2
4
6
8
10
12
$0
$500
$1,000
$1,500
$2,000
$2,500
$3,000
Q4 2015 Q1 2016 Q2 2016 Q3 2016 Q4 2016
No.
of I
POs
Enterprise value No. of IPOs
In U
S$ m
illio
ns

Global Technology IPO Review Full-year and Q4 2016 44
Figure 38: Software – Total debt
Source: S&P Capital IQ with analysis by PwC
$0 $2
$178
$65
$30
4
2
6
10
4
0
2
4
6
8
10
12
$0
$20
$40
$60
$80
$100
$120
$140
$160
$180
$200
Q4 2015 Q1 2016 Q2 2016 Q3 2016 Q4 2016
No.
of I
POs
Total debt No. of IPOs
In U
S$ m
illio
ns

Global Technology IPO Review Full-year and Q4 2016 45
Figure 39: Software – EV/LTM revenue
Source: S&P Capital IQ with analysis by PwC
12.0x
15.2x
8.2x
9.8x
7.5x
4
2
6
10
4
0
2
4
6
8
10
12
0.0x
2.0x
4.0x
6.0x
8.0x
10.0x
12.0x
14.0x
16.0x
Q4 2015 Q1 2016 Q2 2016 Q3 2016 Q4 2016
No.
of I
POs
EV/LTM revenue No. of IPOs
In m
ultip
les

Global Technology IPO Review Full-year and Q4 2016 46
Figure 40: Software – EV/LTM EBITDA
Source: S&P Capital IQ with analysis by PwC
85.3x
NM
77.6x
587.6x
NM
4 2
6
10
4
0
2
4
6
8
10
12
0.0x
100.0x
200.0x
300.0x
400.0x
500.0x
600.0x
700.0x
Q4 2015 Q1 2016 Q2 2016 Q3 2016 Q4 2016
No.
of I
POs
EV/LTM EBITDA No. of IPOs
In m
ultip
les

Global Technology IPO Review Full-year and Q4 2016 47
Semiconductors The average revenue for semiconductors companies was US$183 million in Q4 2016, an increase of 24% on a quarter-to-quarter basis.
Average LTM EBITDA declined by 70% quarter to quarter, from US$15 million to US$4 million in Q4 2016. Semiconductor EV decreased 80% quarter to quarter, from US$1.7 billion in Q3 2016 to US$342 million in Q4 2016.
LTM net income declined from US$13 million in Q3 2016 to a net loss of US$8 million in Q4 2016.
Total debt for Q4 2016 increased by 260%, from US$10 million in Q3 to US$35 million in Q4.
In Q4, the subsector’s valuation multiple of EV/LTM revenue declined to 1.9x from the 11.5x of Q3 2016. EV/LTM EBITDA also sequentially declined to 77.7x in Q4 2016 from 113.4x in Q3 2016.
Figure 41: Semiconductors – LTM revenue
Source: S&P Capital IQ with analysis by PwC
$529
$276
$147$183
2 2 2 2
-
1
2
3
4
$0
$100
$200
$300
$400
$500
$600
Q4 2015 Q1 2016 Q2 2016 Q3 2016 Q4 2016
No.
of I
POs
LTM revenue No. of IPOs
In U
S$ m
illio
ns

Global Technology IPO Review Full-year and Q4 2016 48
Figure 42: Semiconductors – LTM EBITDA
Source: S&P Capital IQ with analysis by PwC
$17
$57
$15
$40
2 2 2 2
-
1
2
3
4
$0
$10
$20
$30
$40
$50
$60
Q4 2015 Q1 2016 Q2 2016 Q3 2016 Q4 2016
No.
of I
POs
LTM EBITDA No. of IPOs
In U
S$ m
illio
ns

Global Technology IPO Review Full-year and Q4 2016 49
Figure 43: Semiconductors – LTM net income
Source: S&P Capital IQ with analysis by PwC
$14
$51
$13
($8)0
2 2 2 2
-
1
2
3
4
($20)
($10)
$0
$10
$20
$30
$40
$50
$60
Q4 2015 Q1 2016 Q2 2016 Q3 2016 Q4 2016
No.
of I
POs
LTM Net income No. of IPOs
In U
S$ m
illio
ns

Global Technology IPO Review Full-year and Q4 2016 50
Figure 44: Semiconductors – EV
Source: S&P Capital IQ with analysis by PwC
$345
$1,279
$1,689
$342
0
2 2 2 2
-
1
2
3
4
$0
$200
$400
$600
$800
$1,000
$1,200
$1,400
$1,600
$1,800
Q4 2015 Q1 2016 Q2 2016 Q3 2016 Q4 2016
No.
of I
POs
Enterprise value No. of IPOs
In U
S$ m
illio
ns

Global Technology IPO Review Full-year and Q4 2016 51
Figure 45: Semiconductors – Total debt
Source: S&P Capital IQ with analysis by PwC
$109
$3$10
$35
0
2 2 2 2
-
1
2
3
4
$0
$20
$40
$60
$80
$100
$120
Q4 2015 Q1 2016 Q2 2016 Q3 2016 Q4 2016
No.
of I
POs
Total debt No. of IPOs
In U
S$ m
illio
ns

Global Technology IPO Review Full-year and Q4 2016 52
Figure 46: Semiconductors – EV/LTM revenue
Source: S&P Capital IQ with analysis by PwC
0.7x
4.6x
11.5x
1.9x
0
2 2 2 2
-
1
2
3
4
0.0x
2.0x
4.0x
6.0x
8.0x
10.0x
12.0x
14.0x
Q4 2015 Q1 2016 Q2 2016 Q3 2016 Q4 2016
No.
of I
POs
EV/LTM revenue No. of IPOs
In m
ultip
les

Global Technology IPO Review Full-year and Q4 2016 53
Figure 47: Semiconductors – EV/LTM EBITDA
Source: S&P Capital IQ with analysis by PwC
20.8x 22.6x
113.4x
77.7x
0
2 2 2 2
-
1
2
3
4
0.0x
20.0x
40.0x
60.0x
80.0x
100.0x
120.0x
Q4 2015 Q1 2016 Q2 2016 Q3 2016 Q4 2016
No.
of I
POs
EV/LTM EBITDA No. of IPOs
In m
ultip
les

Global Technology IPO Review Full-year and Q4 2016 54
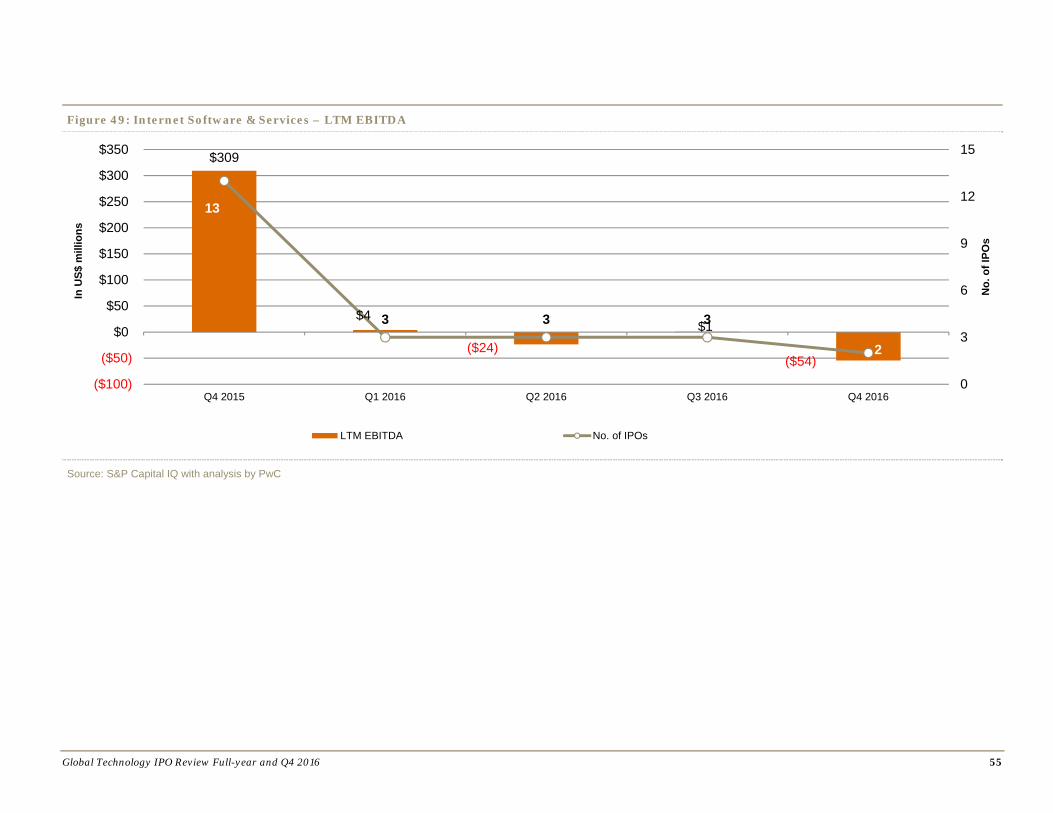
Internet Software & Services The Internet Software & Services subsector registered two listings. The two IPO’s Trivago N.V. and Meitu Inc. had the revenue of US$ 287million and US$629 million respectively. The two IPOs led to average revenue growth of 259% quarter to quarter, from US$131 million in Q3 to US$472 million in Q4. However, the year-to-year average LTM revenue declined 56%.
Average LTM EBITDA for Q4 2016 was a net loss of US$54 million compared to net income of US$309 million in Q4 2015. The average for Q4 2016 was a net loss of US$479 million, compared to an average net loss of US$26 million in Q4 2015.
EV/LTM revenue (9.7x) declined both quarter on quarter (5.2x) as well as year on year (4.9x). EV/LTM EBITDA declined drastically to a negative 84.2x from 1,083.7x of Q3 2016.
Figure 48: Internet Software & Services – LTM revenue
Source: S&P Capital IQ with analysis by PwC
$1,082
$52$96 $131
$472
13
3 3 32
0
3
6
9
12
15
$0
$200
$400
$600
$800
$1,000
$1,200
Q4 2015 Q1 2016 Q2 2016 Q3 2016 Q4 2016
No.
of I
POs
LTM revenue No. of IPOs
In U
S$ m
illio
ns
Global Technology IPO Review Full-year and Q4 2016 55
Figure 49: Internet Software & Services – LTM EBITDA
Source: S&P Capital IQ with analysis by PwC
$309
$4
($24)$1
($54)
13
3 3 3
2
0
3
6
9
12
15
($100)
($50)
$0
$50
$100
$150
$200
$250
$300
$350
Q4 2015 Q1 2016 Q2 2016 Q3 2016 Q4 2016
No.
of I
POs
LTM EBITDA No. of IPOs
In U
S$ m
illio
ns

Global Technology IPO Review Full-year and Q4 2016 56
Figure 50: Internet Software & Services – LTM net income
Source: S&P Capital IQ with analysis by PwC
($26)
$4
($28) ($14)
($479)
13
3 3 32
0
3
6
9
12
15
($600)
($500)
($400)
($300)
($200)
($100)
$0
$100
Q4 2015 Q1 2016 Q2 2016 Q3 2016 Q4 2016
No.
of I
POs
LTM Net income No. of IPOs
In U
S$ m
illio
ns

Global Technology IPO Review Full-year and Q4 2016 57
Figure 51: Internet Software & Services – Enterprise value
Source: S&P Capital IQ with analysis by PwC
$5,286
$351
$1,526
$686
$4,58713
3 3
3 2
0
3
6
9
12
15
$0
$1,000
$2,000
$3,000
$4,000
$5,000
$6,000
Q4 2015 Q1 2016 Q2 2016 Q3 2016 Q4 2016
No.
of I
POs
Enterprise value No. of IPOs
In U
S$ m
illio
ns

Global Technology IPO Review Full-year and Q4 2016 58
Figure 52: Internet Software & Services – Total debt
Source: S&P Capital IQ with analysis by PwC
$2,390
$1$8 $18 $28
13
3 3 32
0
3
6
9
12
15
$0
$500
$1,000
$1,500
$2,000
$2,500
$3,000
Q4 2015 Q1 2016 Q2 2016 Q3 2016 Q4 2016
No.
of I
POs
Total debt No. of IPOs
In U
S$ m
illio
ns

Global Technology IPO Review Full-year and Q4 2016 59
Figure 53: Internet Software & Services – EV/LTM revenue
Source: S&P Capital IQ with analysis by PwC
4.9x
6.8x
15.8x
5.2x
9.7x
13
3 3
32
0
3
6
9
12
15
0.0x
2.0x
4.0x
6.0x
8.0x
10.0x
12.0x
14.0x
16.0x
18.0x
Q4 2015 Q1 2016 Q2 2016 Q3 2016 Q4 2016
No.
of I
POs
EV/LTM revenue No. of IPOs
In m
ultip
les

Global Technology IPO Review Full-year and Q4 2016 60
Figure 54: Internet Software & Services – EV/LTM EBITDA
Source: S&P Capital IQ with analysis by PwC
17.1x85.5x
NM
1083.7x
NM
13
3 3 32
0
3
6
9
12
15
0.0x
200.0x
400.0x
600.0x
800.0x
1000.0x
1200.0x
Q4 2015 Q1 2016 Q2 2016 Q3 2016 Q4 2016
No.
of I
PO's
EV/LTM EBITDA No. of IPOs
In M
ultip
les

Global Technology IPO Review Full-year and Q4 2016 61
Methodology The Global Technology IPO Review for Q4 and full-year 2016 is based on PwC’s analysis of transaction data extracted from S&P Capital IQ. The analysis considers IPOs across all countries worldwide during the period 1 October 2016 to 31 December 2016 (Q4), 1 January 2016 to 31 December 2016 (full-year) and from 2010-2016. Financial data was also obtained from S&P Capital IQ.
The definition of the Technology sector is based on the S&P Capital IQ database industry classifications and includes the following subsectors:
Internet Software & Services IT Consulting & Services Professional Services (e.g., Application Software, Software Solutions) Semiconductors Software Computers & Peripherals
– Computers, Computers Peripheral Equipment – Computers, Storage Device Manufacturing
Electronic Computers Manufacturing (“Electronics”) Communications Equipment
Only IPOs with issue size greater than US$40 million were included in the analysis.
All monetary amounts are in US dollars unless otherwise indicated.
LTM – Last 12 months
Most figures are rounded to one decimal.

Global Technology IPO Review Full-year and Q4 2016 62
For more information
If you would like to discuss how these findings might impact your business or your future strategy, please reach out to any of our technology industry leaders listed below.
Raman Chitkara Global Technology Leader Phone: 1 408 817 3746 Email: [email protected]
Rod Dring – Australia Phone: 61 2 8266 7865 Email: [email protected]
Estela Vieira – Brazil Phone: 55 1 3674 3802 Email: [email protected]
Christopher Dulny – Canada Phone: 1 416 869 2355 Email: [email protected]
Jianbin Gao – China Phone: 86 21 2323 3362 Email: [email protected]
Pierre Marty – France Phone: 33 1 5657 58 15 Email: [email protected]
Werner Ballhaus – Germany Phone: 49 211 981 5848 Email: [email protected]
Sandeep Ladda – India Phone: 91 22 6689 1444 Email: [email protected]
Masahiro Ozaki – Japan Phone: 81 3 5326 9090 Email: [email protected]
Hoonsoo Yoon – Korea Phone: 82 2 709 0201 Email: [email protected]
Ilja Linnemeijer – The Netherlands Phone: 31 88 792 4956 Email: [email protected]
Yury Pukha – Russia Phone: 7 495 223 5177 Email: [email protected]
Mark Jansen – Singapore Phone: 65 6236 7388 Email: [email protected]
Jass Sarai – UK Phone: 44 0 1895 52 2206 Email: [email protected]
Pierre-Alain Sur – US Phone: 1 646 471 6973 Email: [email protected]
Alan Jones – US (Deals partner) Phone: 1 415 498 7398 Email: [email protected]

About PwC’s technology institute The Technology Institute is PwC’s global research network that studies the business of technology and the technology of business with the purpose of creating thought leadership that offers both fact-based analysis and experience-based perspectives. Technology Institute insights and viewpoints originate from active collaboration between our professionals across the globe and their first-hand experiences working in and with the technology industry.
About PwC At PwC, our purpose is to build trust in society and solve important problems. We’re a network of firms in 157 countries with more than 223,000 people who are committed to delivering quality in assurance, advisory and tax services. Find out more and tell us what matters to you by visiting us at http://www.pwc.com/
This content is for general information purposes only and should not be used as a substitute for consultation with professional advisors.
© 2017 PwC. All rights reserved. PwC refers to the US member firm or one of its subsidiaries or affiliates, and may sometimes refer to the PwC network. Each member firm is a separate legal entity. Please see www.pwc.com/structure for further details.