ipdet module 10: data analysis and interpretation · data analysis and interpretation...
TRANSCRIPT

IPDET Module 10: Data Analysis and
Interpretation
SubevaluationsQualitative vs.
QuantitativeQualitativeQuantitative
Intervention or
Policy

IPDET 22
Introduction
• Data Analysis Strategy
• Analyzing Qualitative Data
• Analyzing Quantitative Data
• Linking Quantitative Data and Qualitative Data

IPDET 33
Data Collection and Analysis
Time
Hou
rs S
pent
Data Collection
Data Analysis
Pilo
t

IPDET 44
Qualitative Analysis
• Best used when for in-depth understanding of the intervention
• Answers questions like:– Is the intervention being implemented according to
plan?– What are some of the difficulties faced by staff?– Why did some participants drop out early?– What is the experience like for participants?– Are there any unexpected impacts on families and
communities?

IPDET 55
Quantitative Analysis
• Can be used to answer questions like?– What is the percent distribution?
– How do participants rate the usefulness and relevance of the intervention?
– How much variability is there in the data?
– What is the relationship between a program and the outcome measures?
– Are the results statistically significant?

IPDET 66
Qualitative Data
• Description of program, process, and experiences
• To understand context of the situation
• To understand perceptions
• Research evolves as questions emerge
• Flexible design

IPDET 77
Qualitative Data Analysis
• Used for any non-numerical data collected as part of the evaluation– unstructured observations– open-ended interviews– analysis of written documents– focus groups transcripts– diaries, observations
• Analysis challenging• Take care for accuracy (validity concern)

IPDET 88
Making Good Notes
• Capture as much information as possible
• Pay close attention to language
• Write down observations
• Capture your immediate thoughts
• Leave time to write up notes immediately

IPDET 99
Triangulation
• Can use three or more sources of information to verify and substantiate your data
• Examples:– interviews, focus groups, questionnaires
– questionnaires, available data, expert panels
– observations, program records, interviews
– interviews, diaries, available data

IPDET 1010
Early Steps in Qualitative Analysis (1 of 3)
• While collecting data:– keep good records
– write up interview, impressions, notes from focus groups
– make constant comparisons as you progress
– meet with team regularly to compare notes and make adjustments

IPDET 1111
Early Steps in Qualitative Analysis (2 of 3)
• Write contact summary report– one page summary after each major
interview or focus group
– main issues
– major information obtained
– what was the most interesting, illuminating, or important?
– what new questions need to be explored?

IPDET 1212
Early Steps in Qualitative Analysis (3 of 3)
• Use tools to help you– create a subjectivity file with your own
reactions during the study, including your feelings, hunches, and reactions
– file your ideas that emerge as you proceed
– keep a file of quotations from the data collection

IPDET 1313
Maintain an Iterative Dialogue
• Share information early and often with key informants
• Have others review early drafts with the intention of eliciting information, questions, other ways of interpreting data

IPDET 1414
Drawing-out Themes and Patterns
• As you review, begin to make notes• Goal is to summarize what you have seen or
heard:– common words– phrases– themes– patterns
• Also identify where they are so you can find them again if you need to verify
• May want to use a spreadsheet
IPDET 1515
Computer Help for Qualitative Data Analysis
• Software packages to help you organize data
• Search, organize, categorize, and annotate textual and visual data
• Help you visualize the relationships among data

IPDET 1616
Examples of QDA
• N6 from QSR (previously called NUD*IST)
• Ethnograph
• Qualpro
• Hyperqual
• Anthropax
• Atlas-ti

IPDET 1717
Controlling for Bias
• We tend to see what we want to see and may miss things that do not conform to our expectations
• Use well trained recorders
• Evaluators review documents and code them in themes

IPDET 1818
Concluding Thoughts on Qualitative Data
• Qualitative data collection is not the easy option– labor intensive and time consuming
– reliability among coders, using a coding scheme is essential
• Can reveal valuable information

IPDET 1919
Quantitative Data: Statistics
• Quantitative data are analyzed with statistics– descriptive statistics: used with census or
non-random sample data
– inferential statistics: used with random sample data

IPDET 2020
Descriptive Statistics
• Describes the frequency and/or percentage distribution of a single variable
• Tells how many and what percent
• Example:– 33% of the respondents are male and 67%
are female (table on next slide)

IPDET 2121
Example of Descriptive Statistics in a Table
Male Female Total
Number Percent Number Percent Number
100 33% 200 67% 300
Write up: Of the 300 people in this program, 67% are women and 33% are men.
How many men and women are in the program?
Table 11.5: Distribution of Respondents by Gender
Source: Fabricated Data

IPDET 2222
Distributions
• Measures of central tendency– how similar are the data?
– example: How similar are the ages of this group of people?
• Measures of dispersion– how dissimilar are the data?
– example: How much variation in the ages?

IPDET 2323
Measures of Central Tendency
• The 3-M’s– mode: most frequent response
– median: mid-point of the distribution
– mean: arithmetic average
• Which to use depends on the type of data you have– nominal, ordinal, interval/ratio

IPDET 2424
Nominal Data
• Data of names or categories
• Examples: – gender (male, female)
– religion (Buddhist, Christian, Jewish, Muslim)
– country of origin (Burma, China, Ethiopia, Peru)
• Use mode as a measure of central tendency

IPDET 2525
Ordinal Data
• Data that has an order to it but the “distance”between consecutive responses is not necessarily the same
• Lacks a zero point
• Examples: – opinion scales that go from “most important” to “least
important” or “strongly agree” to “strongly disagree”
• Use mode or median as a measure of central tendency

IPDET 2626
Interval/Ratio Data• Data of real numbers, numbers with a zero
point and can be divided and compared into other ratio numbers
• Examples:– age, income, weight, height
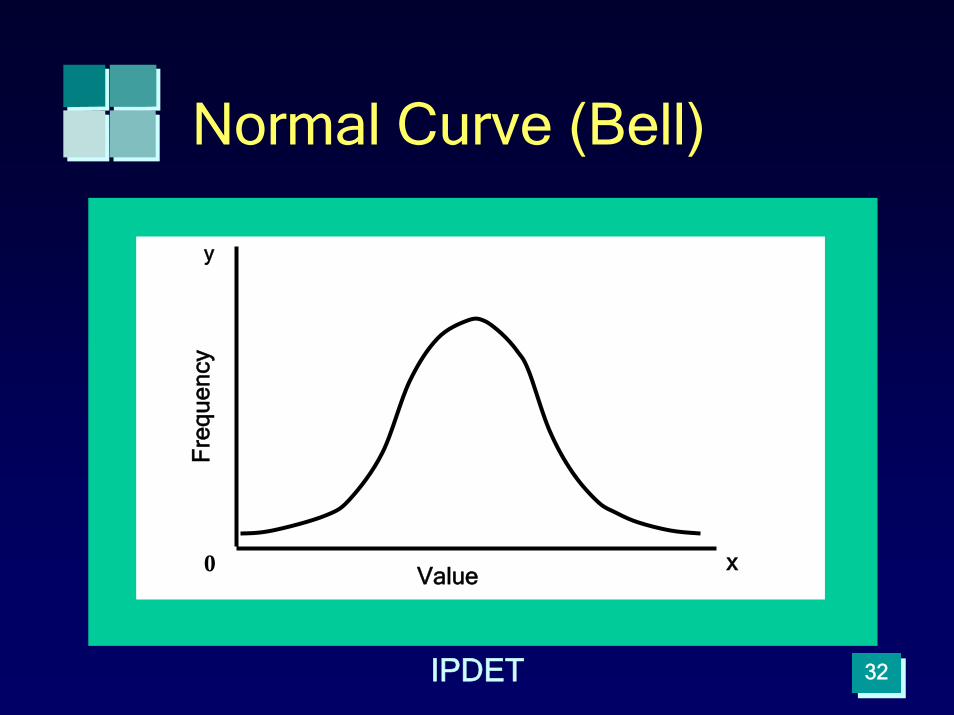
• Use mode, median, or mean as a measure of central tendency — the choice depends on the distribution– for normal data, mean is best – for data with few high – or - few low scores, median
is best

IPDET 2727
Calculating
• Mode: the one with the most
• Median: place in order then count down to half way
• Mean: (most people think of it as the average)

IPDET 2828
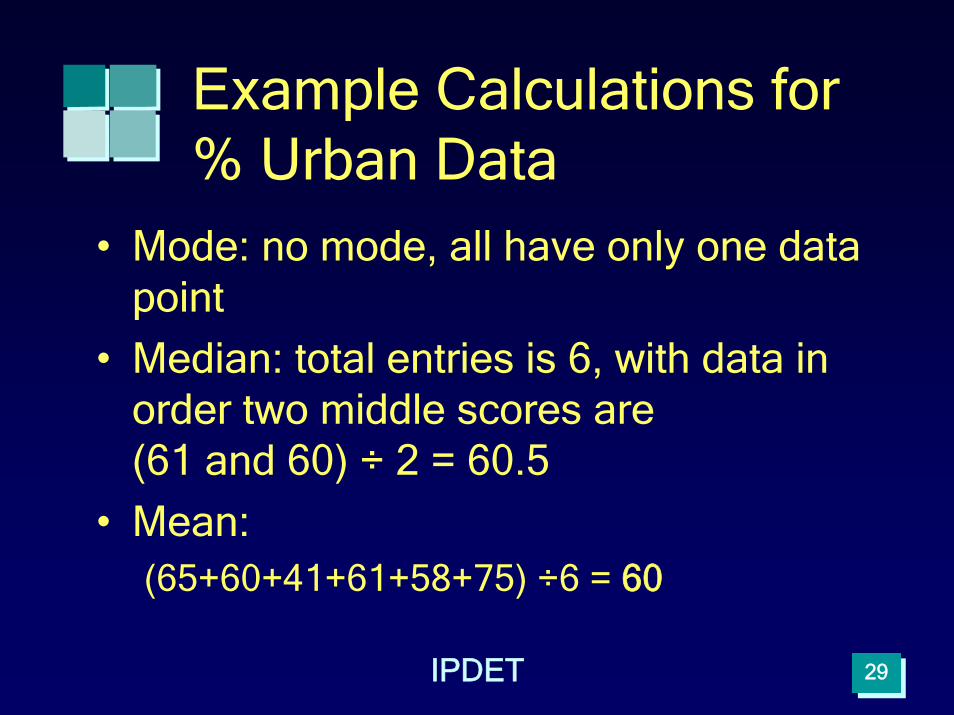
Example Data
Country % Urban
Bolivia 65
Algeria 60
Central Africa Republic 41
Georgia 61
Panama 58
Turkey 75Source: Fabricated Data
Table 11.7: Sample Data
IPDET 2929
Example Calculations for % Urban Data
• Mode: no mode, all have only one data point
• Median: total entries is 6, with data in order two middle scores are (61 and 60) ÷ 2 = 60.5
• Mean:(65+60+41+61+58+75) ÷6 = 60

IPDET 3030
Measures of Dispersion
• Range– difference between the highest and lowest
value– simple to calculate, but not very valuable
• Standard deviation– measure of the spread of the scores
around the mean– superior measure, it allows every case to
have an impact on its value

IPDET 3131
Example Calculation for Range
• Range: high score – low score = rangerange = 75 – 41
range = 34
IPDET 3232
Normal Curve (Bell)
y
x0
Fre
quen
cy
Value

IPDET 3333
Standard Deviation
y
x0
Mean One standard deviation from the mean
68%
95%
Two standard deviations from the mean
98%
Three standard deviations from the mean

IPDET 3434
Calculating Standard Deviation
• Calculating is time consuming
• Can use statistical programs:– SPSS
– Excel or other spreadsheet program
IPDET 3535
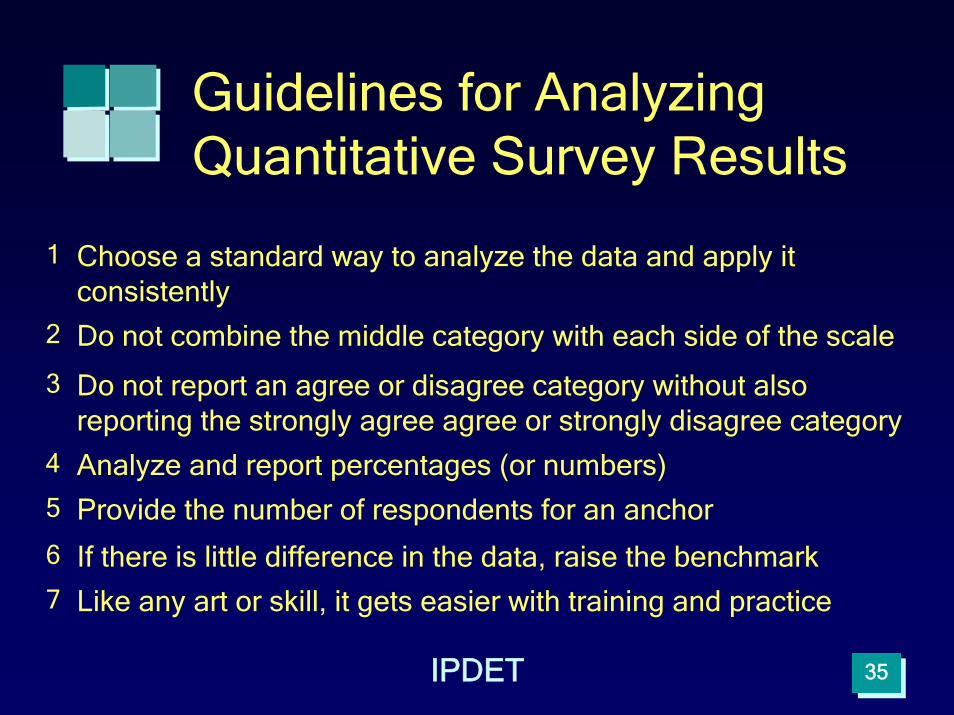
Guidelines for Analyzing Quantitative Survey Results
1 Choose a standard way to analyze the data and apply it consistently
2 Do not combine the middle category with each side of the scale
3 Do not report an agree or disagree category without also reporting the strongly agree agree or strongly disagree category
4 Analyze and report percentages (or numbers)
5 Provide the number of respondents for an anchor
6 If there is little difference in the data, raise the benchmark
7 Like any art or skill, it gets easier with training and practice
IPDET 3636
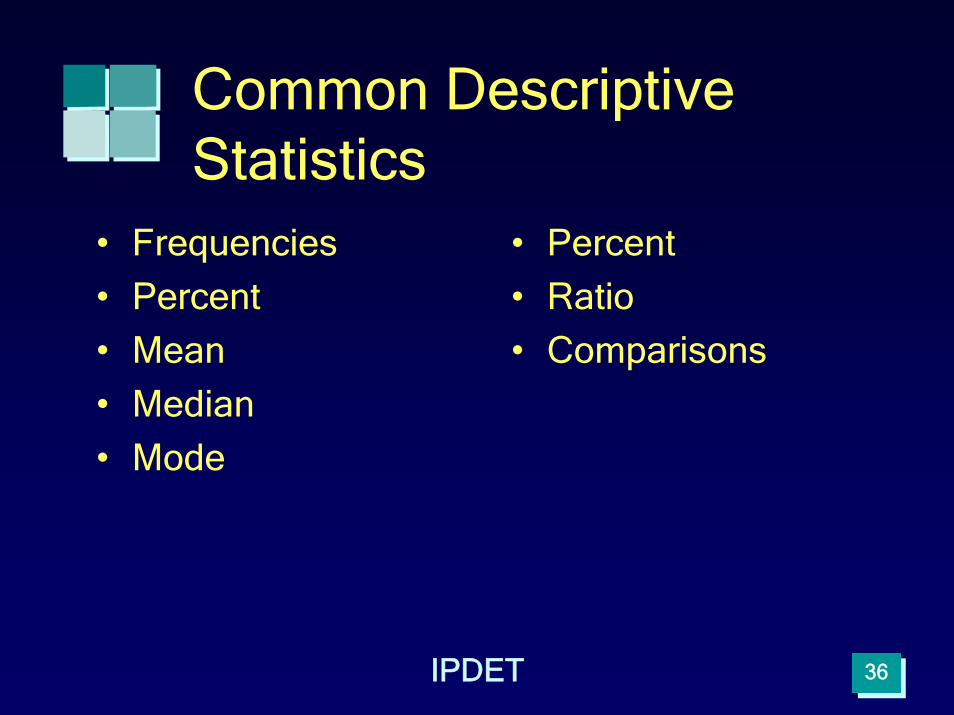
Common Descriptive Statistics
• Frequencies
• Percent
• Mean
• Median
• Mode
• Percent
• Ratio
• Comparisons

IPDET 3737
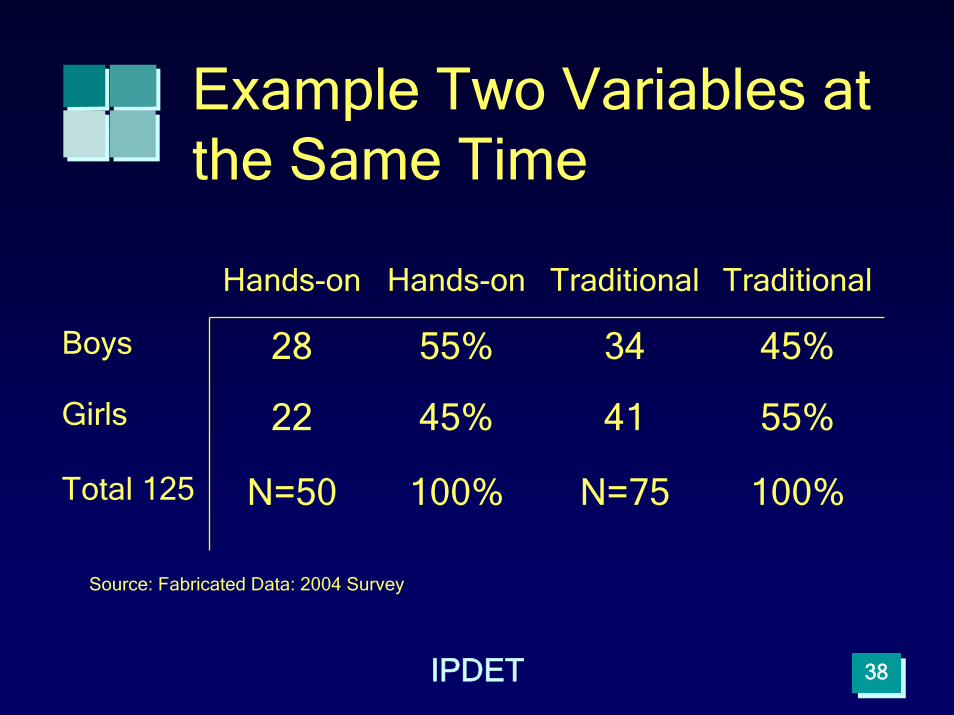
Describing Two Variables at the Same Time
• Two variables at once
• Example: What percent were boys and what percent were girls in hands-on and traditional classes?
IPDET 3838
Example Two Variables at the Same Time
Hands-on Hands-on Traditional Traditional
Boys 28 55% 34 45%
Girls 22 45% 41 55%
Total 125 N=50 100% N=75 100%
Source: Fabricated Data: 2004 Survey

IPDET 3939
Two Variables with Crosstabs
• Cross tabulation (crosstab)– presented in a matrix format
– displays two or more variables simultaneously
– each cell shows number of respondents

IPDET 4040
Example Crosstabs
Hands-on Traditional Total %
Boys(n=45)
45% 55% 100%
Girls(n=80)
35% 65% 100%
N=125 Source: Fabricated Data

IPDET 4141
Variables
• Independent– Variable which you believe explains a
change in the dependent variable
– Program evaluation: the program
• Dependent– Variable you want to explain
– Program evaluation: the outcomes

IPDET 4242
Example: Comparison of Means
Mean Income
Women 27,800 SA Rand
Men 32,400 SA Rand
-dependent variable: annual income
-independent variable: gender

IPDET 4343
Measure of Relationship
• How strongly variables are related, reported differently
• Measures of association– range from zero to 1
• Measures of correlation– range from –1 to +1

IPDET 4444
Interpretation of Correlation
• Measures of correlation:– perfect relationship: 1 or –1
• closer to 1 or –1: strong relationship
• .5: moderate/strong (maybe as good as it gets)
– closer to zero: no relationship• .2 - slight/weak relationship

IPDET 4545
Direct Relationship
• Plus sign +– both variables change in the same
direction
– example:• as driving speed increases, death rate goes up

IPDET 4646
Inverse Relationship
• Minus sign -– both variable change but in the opposite
direction
– example:• as age increases, health status decreases

IPDET 4747
Inferential Statistics
• Used to analyze data from randomly selected samples
• Risk of error because your sample may be different from the population as a whole
• To make an inference, you first need to estimate the probability of that error

IPDET 4848
Statistical Significance Tests
• Tools to estimate how likely the results are in error
• Called tests of statistical significance– to estimate how likely it is that you have
gotten the results you see in you analysis by chance alone

IPDET 4949
Statistical Significance
• Benchmark of .5%– .05 Alpha level or P value
• It means we are 95% certain that our sample results are not due to chance– or
• The results are statistically significant at the .05 level
• Most reports do not go beyond .5

IPDET 5050
Chi Square and t-Test
• One of the most popular statistics– easy to calculate and
interpret
• Used to compare two sets of nominal data (i.e marital status and religious affiliation)
• Used to compare two ordinal variables or a combination of nominal and ordinal variables
• Used to determine if one group of numerical scores is statistically higher or lower than another group of scores– two means
Chi Square t-Test

IPDET 5151
Hypothesis Testing
• Research hypothesis is your best guess as to the relationship between variables– Example: there is a difference between the per
capita incomes of men and women in South Africa
• Null hypothesis is always a statement that “there is no difference” or “no impact”between our variables– Example: there is no difference between the per
capita incomes of men and women in South Africa

IPDET 5252
Remember:
• A significant test is nothing more than an estimate of the probability of getting the results by chance if there really is no difference in the population

IPDET 5353
Linking Qualitative and Quantitative Data
• Should qualitative and quantitative data and associated methods be linked during study design? – How?
– Why?

IPDET 5454
Qualitative-Quantitative Linkages
• Confirmation or corroboration – triangulation
• Richer detail
• Initiate new lines of thinking
• Expand the scope

To continue on to theNext Module click here
To return to theTable of Contents click here