ipcr - riken...iper cyclotron progress report the institute of physical and chemical research...
TRANSCRIPT

Vol. 12
the Institute of Physical and Chemical Research
IPCR cyclotronProgress Report 1978
Wako-shi, Saitama Pref., JAPAN

IPeR Cyclotron Progress Report
The Institute of Physical and Chemical Research "RIKAGAKU KENKYUSHO" Wako-shi, Saitama, 351 JAPAN
December, 1978
Vol. 12
Editors
F. Ambe A. Hashizume
Y. Hattori T. Inamura
H. Kamitsubo T. Nomura
M. Odera N. Shiotani
T. Wada S. Yamaji
This volume contains recent information of the IPCR Cyclotron, informal reports and
abstracts of papers which will be published at scientific meetings or in publications
by staff members, guests, and visitors.
All rights reserved. This report or any part thereof may not be reproduced in any
form (including photostatic or microfilm form) without written permission from
the pu blisher.

CONTENTS
Page
1. INTRODUCTION ...................................................... .
2. MACHINE OPERATION 2
3. MACHINE DEVELOPMENT AND ACCELERATOR PHYSICS
3-1. A Proposed Multi-Purpose Separated Sector Cyclotron ................ . . . .. 4
3- 2. Design of Full Scale Magnet of Separated Sector Cyclotron ................. 7
3-3. Magnetic Field Profile of 1/4 Scale SSC Model Magnet .................... 10
3- 4. Beam Transfer Line between Linac and Separated Sector Cyclotron .......... 13
3- 5. Design of RF Resonators and RF Characteristics of a Half-scale Model Cavity for Proposed Separated Sector Cyclotron .................... 16
3-6. Computer Code for the Equilibrium Orbit in a Separated Sector Cyclotron . . . . . . . . . . . . . . . . . . . . . . . . . . . . . . . . . . . . . . . . . . . . . . . . . . . . . . .. 18
3-7. Measurement of the Turn-Separation, the Effective Acceleration Voltage and the Focusing Frequency Vz of the Ion Beams in the Cycl otron ..................................... ......... . .. 21
3-8. Acceleration of Lithium Ion in the Cyclotron. . . . . . . . . . . . . . . . . . . . . . . . . . .. 24
3- 9. Beam Study on the Baby Cyclotron ..... ................... ... ........ 27
4. NUCLEAR PHYSICS Scattering and Reactions
4- 1. Spin Flip Asymmetry in the Inelastic Scattering of Protons on 12C at 28 MeV ...................................................... 29
4-2. The (p, d) Reaction on p and s-d Shell Nuclei .......................... 32
4-3. Exact Finite-range DWBA Calculations Including the Deuteron D-state for the 58Ni (p, d)57 Ni Reaction at 52 MeV. . . . . . . . . . . . . . . . . . . . . . .. 34
4-4. Analyzing Power of the (p, t) Reaction Leading to the Unnatural Parity State .............................................. 36
4-5. Adiabatic Treatment of Elastic Deuteron-Nucleus Scattering ......... . ... . .. 39
4- 6. Study on (d, p) Reactions Number of Steps Which Should be Taken into Account. . . . . . . . . . . . . . . .. 42

Page
4-7. Quasimolecular Resonance by the 24Mg (0', 12C)160 Reaction ............... 45
4-8. Reformulation of DWBA Form Factor for Heavy Ion Transfer Reactions ......... . . . . . . . . . . . . . . . . . . . . . . . . . . . . . . . . . . . . . .. 47
4-9. Calculation of Friction Force, Inertia Tensor and Potential Energy for the System 20Ne + 28Si Based on the Linear Response Theory ....................................... ,.......... 50
4-10. Analysis of the Heavy Ion Reaction 20Ne + 28Si Based on the Linear Response Theory ...................................... , 53
4-11. Preequilibrium Emission of Light Particles in the 181Ta + 14N Reaction at 85 and 11 5 MeV ............................................... . 56
4- 12. Preequilibri urn 0' Emission in 14N-Induced Reactions The Most Probable Energies and Angular Distributions. . . . . . . . . . . . . . . .. 59
4-13. Energy Relaxation during the Fusion Process Probed by Preequilibrium 0' Emission in Heavy Ion Reactions . . .. ................... 62
4-14. Energy Distributions of O'-particles Emitted from the 14N + 159Tb Reaction . . . . . . . . . . . . . . . . . . . . . . . . . . . . . . . . . . . . . . . . . . . . . . . . . . . . . . . .. 65
5. NUCLEAR PHYSICS Nuclear Spectroscopy and Instrumentation
5 -1. Recoil-distance Lifetime Measurements of States in 120Xe .................. 68
5- 2. Multiplicity of 'Y-Rays Following Fast O'-Particle Emission in the 159Tb + 95 MeV 14N Reaction ............ . . . . . . . .............. 71
5-3. High Spin States in 160Yb . . . . . . . . . . . . . . . . . . . . . . . . . . . . . . . . . . . . . . . . . . .. 74
5-4. Conversion Electrons in the Decay of 206Bi . . . . . . . . . . . . . . . . . . . . . . . . . . . . .. 76
6. ATOMIC AND SOLID-STATE PHYSICS
6- 1. X-Rays Following Multiple Inner-Shell Ionization (3) . . . . . . . . . . . . . . . . . . . . .. 79
6-2. KO' X-Ray Spectra of Ar Produced by Impact of N-Ions in the 66 -11 0 MeV Energy Range. . . . . . . . . . . . . . . . . . . . . . . . . . . . . . . . . . . .. 81
6- 3. Relative Intensity of Kr KI3 X-Rays above Absorption Edge. . . . . . . . . . . . . . . .. 84
6- 4. REC X-Rays by 120 MeV Ne-Gases Collisions ........................... 86

Page
6-5. Dependence of F Ka Satellite Intensities Produced by Fast Ions on Chemical Environment ......................................... . . . .. 88
6-6. Z2 Dependence of L Shell Vacancy Rearrangement Process in Ka X-Ray Satellites .............................................. 90
6- 7. Energy Straggling of C and He Ions in Metal Foils . . . . . . . . . . . . . . . . . . . . . . .. 92
6-8. Secondary Electron Emission from Metal Surface by High Speed Ion Bombardment ........................................ . . .. 94
6-9. Helium Embrittlement of the First Wall Materials for Fusion Reactor . . . . . . . . . . . . . . . . . . . . . . . . . . . . . . . . . . . . . . . . . . . . . . . . . . .. 96
6- 10. Lattice Location of Ni Atoms Implanted in Al . . . . . . . . . . . . . . . . . . . . . . . . . .. 99
6- 11. Hyperfine Interactions of 119Sn in Magnetic Chalcogen Spinels .............. 102
6- 12. Positron Lifetime Study on Annealing Behavior of Irradiated or Quenched Plati num .............................................. 104
7. RADIOCHEMISTRY AND NUCLEAR CHEMISTRY
7 - 1. Measurement of Excitation Function for the 14N (p, n) 140 Reacti on .......... 106
7 -2. Chemical Separation for Charged Particle Activation Analysis of Trace Oxygen in Various Metals ...................................... 108
7 -3. Charged Particle Activation Analysis of Oxygen in Silicon Nitride Film on Silicon Wafer .................................. III
7 -4. Production of Radioisotopes and Labelled Compounds ..................... 114
7 -5 . Preparation of 73Se-2-Selenouracil ..................................... 116
8. RADIATION CHEMISTRY AND RADIATION BIOLOGY
8-1. Measurement of Fast Emission Decay of Heavy Ion-Irradiated Single Crystals; Nanosecond Time-Resolved a-Emission Spectra of KBr ................................................... , 118
8- 2. Effects of a-particles on Mammalian Cells ............................. 121
8-3. Studies on Molecular Damages Induced by High-LET Particles ............... 123
9. RADIATION MONITORING
9-1. Routine Monitoring ................................................ 125

Page
9-2. Leakage Radiation Measurement at the Underground Passage ................ 127
10. HEAVY ION LINEAR ACCELERATOR PROJECT
10-1. Status of the Constructional Work ..................................... 128
10-2. Installation and Alignment of the Resonators and Drift Tubes ............... 130
10-3. Control System ..................... . .............................. 131
10- 4. Design of a Beam-Emittance Measuring Device ............................ 133
10- 5. Studies on a PIG Source in the Test Facility ............................. 135
10-6. Beam Transport System ............................................. 138
10-7. Performance of an Axial Extraction PIG Ion Source ................... . .. , 141
11. LIST OF PUBLICATIONS ................................................. 143
12. LIST OF PERSONNEL ................................................... 149
13. LIST OF OUTSIDE USERS AND THEIR THEMES ............................. 153
AUTHOR INDEX ........................................................ 155

1. INTRODUCTION
During the past one year the IPCR cyclotron was operated in good condition as before. Several
improvements have been made in the machine itself and its accessory facilities which resulted in
more stable and efficient operation.
In the fields of research using the cyclotron a majority of research works have been carried
out with heavy ions. Extensive studies on pre equilibrium emmission of light particles and energy
relaxation phenomena were performed in nuclear reactions induced by heavy ions. Nuclear
structure studies were also continued. Multiple ionization phenomena in the collision of heavy
ions on gaseous and solid materials were extensively studied to get information on the excitation
mechanism as well as the effects of chemical environment on X -ray spectra. Channeling
experiments were continued to study the location of impurity atoms and radiation damage in
solids. Positron annihilation studies were made on transition metals. Activation analysis by
charged particles were applied for the study of the surface of semiconductors. Studies of radiation
chemistry and radiation biology were continued by using heavy ions as well as alpha particles.
All the resonators of the new heavy ion linac were installed and the oscillator system for the
first resonator was built. The beam transport system and the beam handling devices were
designed. Model study of the separated sector cyclotron was also continued.
Hiromichi Kamitsubo
Editor

2
2. MACHINE OPERATION
T. Kageyama, H. Nakajima, K. Ogi wara,
S. Fujita, K. Ikegami, S. Kohara,
H. Takebe, and I. Kohno
The cyclotron was operated on the 24 h a day basis during the period from Oct. 23, 1977 to
Oct. 22, 1978.
Statistics of machine operation time is shown in Table 1. The total beam tIme of 4535.3 h
is slightly, i.e. 2.2% (188.4 h), longer than that of the last year. This increase in beam time is due
to the decrease in the overhaul time.
Table 2 shows the machine time allotted to various activities in this period. In this period,
3427 h (59.6 %) of the 5748 h scheduled for use in experimental programs, were used by
nuclear physics groups and 2321 h (40.4 %) by groups of fields other than nuclear physics and
also by outside users. Requests for heavy ion beam continued to increase and the cyclotron was
operated with heavy ion for 4459 h which was 77 .6 % of the total scheduled beam time.
Table 3 shows the distribution of the beam time among particles accelerated. N5+ , 0 5+ , and
Ne6+ ions were accelerated using pulsed operation of the heavy ion source and the scheduled beam
time for these ions were 1795 h (31.2 %).
Reading of time meter on Oct. 23, 1977
Reading of time meter on Oct. 22, 1978
Difference Percentage of 365 days
Schedule in this period Beam time
Table 1.
Overhaul and installation work Periodical inspection and repair Vacation and holidays
Machine operation.
Oscillator
51750.8 (h)
56752.7
5001.9 57.1 %
Ion-source
55308.8 (h)
60594.1
5285.3 60.3 %
243 (days) 54 25 43
Beam
23821.8 (h)
28357 .1
4535.3 51.8 %

3
Table 2. Scheduled beam time and subjects of acti vity in the period XIII.
Subject Heavy ion Light particles Total
{ Nuclear reacti on 2673 (h) 141 (h) 2814 (h)
Nucl. Phys. In-beam spectroscopy 515 24 539 RI production 40 34 74
Nuclear chemistry 0 203 203 Radiation chemi stry 292 26 318
Fields others Radiation biology 205 90 295
than Nucl. Phys. Solid state physics 0 440 440 Inner atomic shell
excitation study 683 48 731
Stopping power study 27 39 66
{ Nuclear medicine 0 14 14
Outsi de users Nuclear fuel study 24 217 241 RI production 0 13 13
Total 4459 1289 5748
Percent in total 77.6 % 22.4 % 100 %
Maintenance, operation and engineering Exchange of ion sources 66 (h) Machine inspection and repair 600
Total 666
Table 3. Distribution of beam time among particles accelerated.
Particle (h) (%)
P 431 7.5 d 70 1.2
3He++ 240 4.2 4He++ 548 9.5
C4+ 348 6.1 N4+ 2316 40.3 N5+ 1168 20.2 0 5+ 83 1.5
2oNe6+ 549 9.6
Total 5748 100.0

4
3. MACHINE DEVELOPMENT AND ACCELERATOR PHYSICS
3-1. A Proposed Multi-Purpose Separated Sector Cyclotron
H. Kamitsubo, S. Motonaga, N. Kumagai, T. Nomura, N. Nakanishi,
T. Wada, 1. Kohno, J. Fujita, H. Nakajima,
K. Ogiwara, H. Takebe, and F. Yoshida
A 160 cm ordinary cyclotron constructed in 1967 has been used as a multi-purpose facility providing heavy
ions (B, C, N, 0, and Ne) as well as light particles to researchers in various fields. In course of time, demands for
heavier ions with higher energies have grown up among many users as clearly seen from recent statistics which shows
that about two thirds of the total beam time has been devoted to heavy ion experiments at nearly maximum
energies (around 9 MeV/u). Although much effort has been made to improve the existing cyclotron, it became
apparent even in the early 70's that the present machine could not meet the future demands satisfactorily.
Therefore, extensive discussion to upgrade the facility and a design study of a new heavy ion accelerator were
initiated at that time. 1) In 1972, a separated sector cyclotron combined with a variable-frequency linac of Wide roe
type was proposed.2)
The main beam requirements for this facility are as follows: It should be able to accelerate beam of all
elemen ts up to uranium. The beam energy should be high enough to overcome the Coulomb barrier in the whole
range of the accelerating ions, desirably over 100 Me V /u for fully stripped light ions and over lOMe V /u for very
heavy ions such as uranium. High intensity beam of protons, deuterons and a-particles are also reqUired for
studies of nuclear chemistry and radiation biology as well as nuclear physics.
Among various types of accelerator complex to satisfy the above requirements, a separated sector cyclotron
(SSC) with an appropriate injector has been selected to be the most suitable machine from various points of view.
The main advantages of the SSC can be considered to be a large value of flutter in the magnetic fields to enable
acceleration of energetic particles with high intensity over a wide range of ion masses and relative easiness for the
beam injection and extraction. The simpleness in the design and construction of SSC is considered also important
to facilitate attaining the level of the scheduled operation and thus to ascertain preparatory works in many
research fields expected at the proposed multi-purpose facility.
The proposed facility consists of a SSC with four 50° sector magnets, a variable frequency linac3) and an
AVF cyclotron. Figure 1 shows the energy-mass capability of the proposed facility. Table 1 shows the
characteristics of the proposed accelerators and injectors. The maximum beam energies of the SSC are about
120 Me V /u for light ions and about 15 Me V /u for very heavy ions. The accelerating abilities of this SSC for
various ions are shown in Fig. 2. The four non-spiral sector magnets yield the required isochronous field of
17.7 kG at maximum. From the matching conditions with the injectors under consideration, ions can be
accelerated, in prinCiple, with harmonic number h = 4, 6, 8, 10, and 12.
The focusing properties of the SSC were calculated with the modified SPYRING code4) including the
soft-edge effect on the magnetic field. Two sector magnets (approximately 1/4 scale model) have been
constructed to obtain detailed information on the properties of the sector magnets such as their excitation
characteristics and field distribution including the interference by adjacent magnets. Whole magnetic motive force,
maximum coil power and magnet weight are estimated to be 2 X 10⁵ AT, 960 kW and 1900 t, respectively. The
field distributions have been measured in the range of 8 - 17.5 kG by using a NMR calibrated Hall probe
(SBV-595) and an on-line computer. Detailed calculation of the beam dynamics is now in progress using the
measured magnetic fields of the model magnets.
Ions are accelerated by 22.5°, delta-shaped two dees located at opposite valley spaces between the sector
magnets. The frequency range of the RF system is chosen to be 17 - 45 MHz to realize the synchronous

Table 1. Characteristics of accelerators.
SSC
Maximum energy for U37+, (U40+)
Maximum energy for C6+, NelO+
Number of sectors
Sector angle
Magnet fraction
Magnet gap
Maximum magnetic field
Main coil power
Number of trimming coils
Magnet weight
Injection mean radius
Extraction mean radius
Ef/Ei Number of dees
Dee angle
Peak voltage
RF power
RF frequency range
Number of harmonic acceleration
LINAC
Number of tanks
Number of drift tubes per tank
Gap length
Peak voltage of gaps
Maximum total voltage gain
RF frequency range
Q-value of cavi~y
Accelerating mode
Duty factor (macroscopic)
Mass to charge ratio
Emittance at exit
Energy resolution
Energy constant, K
Number of sectors
Magnet gap at hill
A VF cyclotron
Maximum mean magnetic field
Extraction mean radius
Main coil power
Number of dees
Dee angle
RF frequency range
Maximum RF voltage
RF power
15 MeV/u
120 MeV/u
4
50°
0.555
8cm
18.0 kG
950 kW
>40
1900 ton
79 cm
338 cm
18 - 21
2
22.5°
250 kV
300 kW X 2
17(22) - 45 MHz
4,6,8, 12
6
19 - 11
4 - 9 cm
180 - 300 kV
16(20) MV
17 - 45 MHz
12000 - 17000
1T/31T, 1T/1T
100 % 4 - 24
7.8 cm mrad
0.3 %
90 MeV
4
",,20 cm
17 kG
79 cm
",,250 kW
2
90°
9 - 20 MHz
50 kV
150 kW
200
RI KEN SSC
5
0.5 CNe A
o 50
Kr Xe
100 150
Mass number
Hg
200
u 250
Fig. 1. Maximum beam energy per nuclear
vs. mass number of the proposed facility
together with those of heavy ion accelerators in
operation or under construction in some other
laboratori es.
E (MeV / u )
10 20 30 40 50 60 80 100
I I I I I
(
I
I II
I
"</ I
I /
Orbit frequency ( MHz )
/ /
/
i/
/
4.000
3,000
2,000
1.000 900 800 700 600 h
500~
4005 300
200
100 90 80 70 60
50
Fig. 2. Energies and orbit frequencies for
various ions obtained from the proposed
accelerator complex. Two vertical dashed
5
lines indicate the lower and upper energy limits
of the cyclotron- and linac-injected sse, respectively . Solid and dashed lines for heavy
ions correspond to the scheduled operation of
the linac in the early stage and its expected
energy increase afterwards.

6
operation with the linac, the optimum harmonic number in acceleration being h = 8, while h = 4 in the case of
injection from the AVF cyclotron. For this purpose, a half-wave cavity resonator having coaxial structure with
delta-shaped cross section has been designed. This structure of the cavity was chosen to realize reasonable values of
current density at the shorting end and power loss in the case of maximum dee voltage (250 kV) over the whole
range of frequency. The resonating frequencies, electric potential distributions and Q-values for the designed
resonator have been tested by a half-scale model cavity.
The operating pressure of 1 X 10⁻⁷ torr is desirable in the median plane of the SSC to limit beam losses due
to charge-exchange to less than about 10 % in the case of very heavy ions. Based on the estimated surface area of
vacuum chambers, the degassing rate has been estimated to be around 5 Ius. Two cryopumps of 25000 f /sec and
two titanium-sublimation pumps of 5000 f /sec, for example, will be needed to get the above mentioned vacuum.
More detailed design of vacuum chamber and pumping system is currently in progress.
This facility will be used for researchers in various fields such as nuclear and atomic physics, solid-state
study, material science, radiation chemistry and biology and RI production. The use for the radiotherapy is also
being considered. Figure 3 shows the proposed layout of beam lines in various experimental areas.
Fig. 3. Proposed layout of beam lines.
References
1) K. Matsuda: Sci. Papers I. P. C. R., 66, 33 (1972).
2) M. Odera and T. Tonuma: 283, AlP 9, Cyclotrons-1972; M. Odera, I. Kohno, and H. Kamitsubo: Intern.
Conf. Reactions between Complex Nuclei, Held at Vanderbolt University, Nashville, Tennessee, p. 63 (1974).
3) M. Odera: Proc. of the 1976 Proton Linear Accelerator Conf; T. Tonuma, F. Yoshida, and M. Odera: IEEE
Trans. Nucl. Sci., NS-23 , 1031 (1976).
4) I. Miura: Private communication.

7
3-2. Design of Full Scale Magnet of Separated Sector Cyclotron
N. Kumagai, S. Motonaga, H. Kamitsubo,
T. Wada, F. Yoshida, K. Ogiwara,
1. Yokoyama, J. Fujita, and H. Takebe
The separated sector cyclotron(SSC) proposed 1) at IPCR is intended to accelerate ions of all
elements up to 120 Me V /u for light ions(B, C, N, 0, and Ne) and 15 Me V /u for heavy ions (Pb, U,
etc.). This SSC consists of four non-spiral sector magnets with sector angle of 50° , gap distance
of 8 cm and maximum magnetic field of 17.7 kG. The geometrical shape and maximum
magnetomotive force of this SSC magnet were evaluated from the measurement of magnetic flux
along the return path of approximately 1/4 scale model of this magnet. The measurement of this
flux was carried out by using nine flux measuring coils and a flux meter of integrated type. Their
positions and the ratio of cross-sectional area of each coil to that of coilO) are shown in Fig. 1 (a)
and (b), respectively. From the measured relative flux and the ratio of the cross-sectional area,
the flux density at each position relative to that of pole surface was calculated along the return
path of model magnet. The results at Bc = 6.6 and 18 kG are shown in Fig. l(c). The flux
density was found to be 5 - 10 % higher at the position of coil(3), 5 - 10 % lower a! the position
of coil(S) and 5 - 15 % higher at the side yoke. On the basis of these density profiles, the full
scale SSC was designed to have approximately uniform flux density along the return path. The
- 1.5 C/J --
( a ) 1 070
8 7 6 5
/ ~ 9 ------ ~\ pole 2 ~ N - 1
coil I
~~_,-YOk--"e )
( b )
.--'-'---. ~ --.-.-. C/J 1.01-----""'---~'·----------
1.2
~ 1. 0
C!)-
0,5 -
1 2 3 4 5 6 7 8 9
(c ) Hc=66kG
~~~ /.~=~-=-'
1 23456789 Coil positio'l
Fig. 1. (a) Side view of model magnet
of 1/4 scale and positions of measuring
coils. Their positions are shown by a
dashed line. (b) The ratio of cross
sectional area of each coil to that of
coil (1). (c) The relative flux density
(Bi/B I ) measured at Bc = 6.6 and 18 kG.

8
result is shown in Fig. 2. The ratio of cross-sectional area of pole base to that of pole surface is
taken to be the same (1.28) as that of the model magnet but that of the pole base to side yoke is
modified from 1.15 of the model magnet to 1.10. The shape of pole edge is approximated by
that of the Rogowski profile. The total weight of this four magnet system was estimated to be
about 2000 tons.
The maximum magnetomotive force of this full scale magnet was estimated for the field of
Bc = 18 kG from following equation
where J10 and J1ri are free-space permeability and relative permability of iron, respectively and 6.£ i
length of flux path between adjacent flux coils. The value obtained was 2.07 X 10⁵ Ampere turn
for Bc = 18 kG. For this estimation, the relative flux density measured for 1/4 scale model and
approximate J1ri - values of iron along the return path at Bc = 18 kG were used. The maximum
coil power was calculated to be about 1000 kW for copper conductor with maximum current
density of 6 A/mm2. The size of the main coil was designed to be 5 cm in thickness and 50 cm
in height to accept the RF cavities in the narrow space between magnets. This coil is also shown
in Fig. 2.
(/
: 50 I ..;.;··w,....-,_--.
~~I ------ --------r---------r ' I
372
550 3653
6185
Fig. 2. Profile and dimension of the full
scale sse magnet.
Magnetomotive force evaluated for various fields was compared with the theoretical one
calculated by computer program TRIM.2) It is shown in Fig. 3. Agreement between the two is
very well at low field but poor at high field. This is supposed to be due to the saturation effect
of iron, since cross-sectional area of the yoke is taken much larger for TRIM calculation in order to
make the program coding easier.

20
15
• measureme nt
+ calculation by TRIM
1 X 10⁵ 2 X 10⁵
Am pere ·turn
References
3 X 10⁵
Fig. 3. Comparison of the measured
magnetomotive force with the theoretical
one calculated by computer code TRIM.
9
1) H. Kamitsubo et al.: IPCR Internal Report SSC-l; Presented at 2nd Symposium on Accelerator
Science and Technology, at INS Tokyo, Tokyo, March (1978).
2) J. S. Colonias and J. H. Dorst: Magnet Design Applications of the Magnetostatic Program Called
TRIM, UCRL-16382 (1965).

10
3-3. Magnetic Field Profile of 1/4 Scale sse Model Magnet
N. Kumagai, S. Motonaga, H. Kamitsubo, T. Wada,
F. Yoshida, K. Ogiwara, N. Nakanishi,
J. Fujita, I. Yokoyama, and H. Takebe
The magnetic field profile of a 1/4 scale model magnet of the proposed K = 620 MeV
separated sector cyclotron (SSC)1) was investigated in order to evaluate the injection and extraction
radii, focusing properties, beam dynamics and injection system of this SSC. The area between the
center line of the sector magnet (8 = 0°) and that of the free space between the magnets (8 = 45°)
was mapped out with polar grids which consisted of 59 points in radial direction and 90 points in
azimuthal one. The scan of field in radial direction was limited within 235 to 735 mm of the
model due to the geometry of the magnetic detection system. This mapping measurement was
carried out by using a NMR calibrated Hall element (FC-33) with its temperature and control
current stabilized. The Hall probe was mounted on an aluminum arm, which was rotated at the
step of 0.5° by a pulse motor controlled with a computer. The uncertainty of magnetic field due
to reproducibility of probe position was l.5 % in the region of large field gradient and less than
0.01 % in the region of uniform field, and the variation of output Hall voltage during a period of
one week was less than 4 X 10- 5 .
The field profile was obtained at the step of 1 kG over the excitation range from 8 to 17.5
kG. The results are presented in the following. Figure 1 shows the profile of magnetic field
along the center line 0 f the sector magnet at B c = 10, 15, 16, and 17.5 kG. A t higher field, the
magnetic field begins to sag appreciably at both inner and outer radii of this model magnet. This
field decrease at 17.5 kG is about 2 % near the injection radius and about 0.5 % at the extraction
radius. This is supposed to be due to the saturation of iron near the pole tip and the leakage of
magnetic flux from the pole edge. Also, radial magnetic profile at various azimuthal angles at
Bc = 17.5 kG are shown in Fig. 2. In this diagram, profiles for intermediate radii are not included
in order to emphasize the field gradient features at small and large radii. These results are
implying that the 2.5 - 3 times of the gap distance from the pole edge must be taken as the
100
"U
~ 98
'0 97 (1/
0:::
Injection radius
-+EE-Extraction radius
100 . Pol:=- ed,ge ,
200 300 400 500 600 D,ist~nce, fr~m ~ole , edQe (r;nm ~
200 400 600 800 Model radius (mm)
Fig. 1. Relative profiles of magnetic field
along the center line of the model magnet for
Bc = la, 15, 16, and 17.5 kG.

11
100 17.5 kG
100 1, _ n°
t! = ') 0
80 u= 15° 80
,..... 6=20° 0 C
0- 60 0 60 "'-
C 1J 0 til Q) ..... :J
U._ ..... Q)1J
Q) 40 '-0
.s~ 40
> 6=25° / .....
0 Q)
20 0=30° 20 0::
6=40° 6= 30°
1)= 45" tl=15°
0 500
0
Distance from pole edge (mm) I I I I I, I I
200 300 400 I I 700 SOD
Model radius (mm)
Fig. 2. Relative profiles of magnetic field for various azimuthal angles
at B c = I 7.5 kG.
position of injection and extraction orbits. The region of the rapid decrease of magnetic field are
not favorable for purpose of injection or extraction of the beam. It should be noted in the 45°
curve that the fringing field becomes about 10 % of maximum field at small radius, since along this
valley line the beam is transfered to the injection system of sse. The azimuthal profiles of the 17.5 kG field at 4 different radii are shown in Fig. 3, in which
8=0°
I 8 m'or =17. 5kG
8= 45°
535
735
1.0
0 .8
0.6 ~ 0::
'" a
0.4 ~
0.2
~~~~~ __ L-~~-L~~~O
50° 40° 30°
Azimuthal angle
Fig. 3. Azimuthal profiles of magnetic
field at 4 different radii in Bc = 17.5 kG.
12
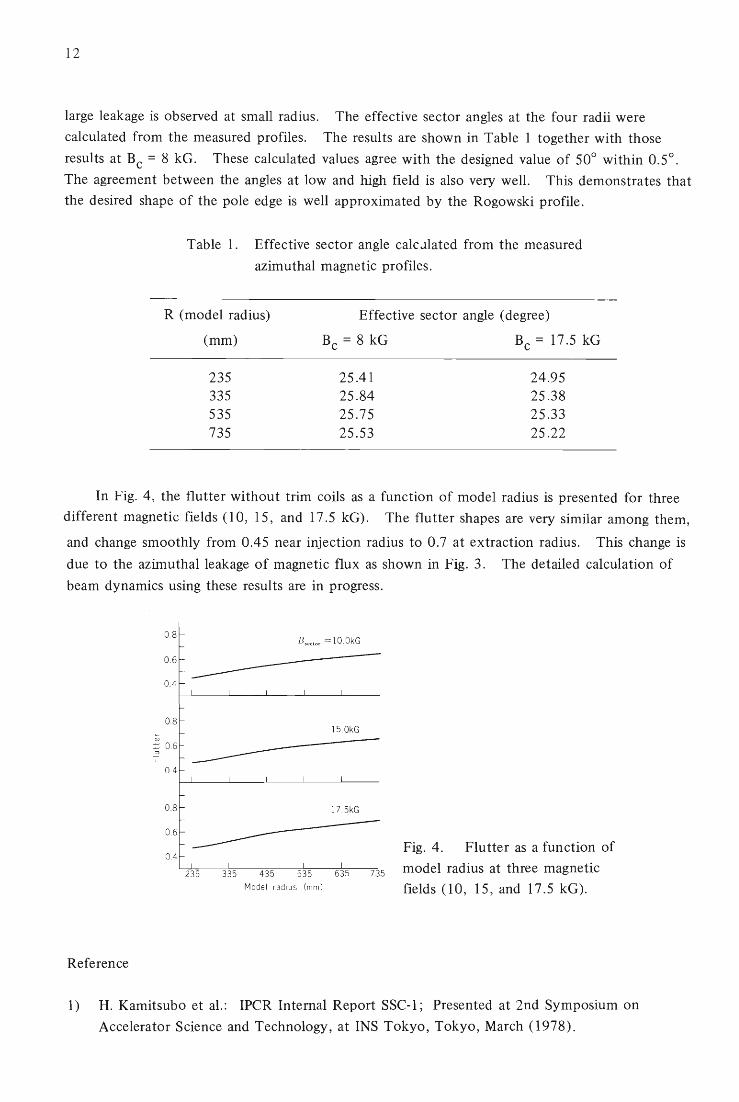
large leakage is observed at small radius. The effective sector angles at the four radii were
calculated from the measured profiles. The results are shown in Table 1 together with those
results at Bc = 8 kG. These calculated values agree with the designed value of 500 within 0.50•
The agreement between the angles at low and high field is also very well. This demonstrates that
the desired shape of the pole edge is well approximated by the Rogowski profile.
Table 1. Effective sector angle calc..llated from the measured
azimuthal magnetic profiles.
R (model radius) Effective sector angle (degree)
(mm) Bc = 8 kG Bc = 17.5 kG
235 25.41 24.95 335 25.84 25.38 535 25.75 25.33 735 25.53 25.22
In Fig. 4, the flutter without trim coils as a function of model radius is presented for three
diff eren t magnetic fields (10, 15, and 17. 5 kG). The flutter shapes are very similar among them,
and change smoothly from 0.45 near injection radius to 0.7 at extraction radius. This change is
due to the azimuthalleakage of magnetic flux as shown in Fig. 3. The detailed calculation of
beam dynamics using these results are in progress.
0.8
0.6
0.4
0.8
0.4
0.8
0.6
0.4
Reference
Bm'or = 10.0kG
15.0kG
17.5kG
Model radius (mm)
735
Fig. 4. Flutter as a function of
model radius at three magnetic
fields (10, 15, and 1 7.5 kG).
1) H. Kamitsubo et al.: IPCR Internal Report SSC-l; Presented at 2nd Symposium on
Accelerator Science and Technology, at INS Tokyo, Tokyo, March (1978).

13
3-4. Beam Transfer Line between Linae and Separated Sector eye lotron
N. Kumagai, T. Wada, H. Takebe, and H. Kamitsubo
We have designed a beam transfer line to be used between the proposed separated sector
cyclotron (SSC)1) and the IPCR variable frequency heavy-ion linac.2) This transfer line was
designed under the following conditions:
1) to guide the beam as shown in Table 1 without intensity loss from the linac to SSC;
2) to match the beam qualities to the acceptance of SSC in six dimensional phase space.
Table 1.
Maximum energy per nucleon M/q Beam emittance Energy spreading Bunch width
Characteristics of transfer beam.
4 MeV for 12C6+, 0.84 MeV for 238U40+ 2 for 12C 24 for 238U , 251T mm mrad in both x and y directions 0.3% ±33°
Figure 1 is the layout of the transfer line. The horizontal distance between the linac and
SSC is about 40 m and about 7 m vertically. This transfer line consists of a charge stripper, beam
bunchers, conventional bending magnets and quadrupoles. Thirteen quadrupole units (Q 1 to Q 13)
and six dipoles (D 1 to D6) were used for the transfer system in the horizontal and vertical
directions. The magnetic properties of these elements are calculated by using the computer code
TRANSPORT.3) In carrying out this calculation, we regarded the position of slit Sl to be the
starting point of this transfer line. The result is shown in Fig. 2. In order to make these transfer
elements to be compact and economical in size and to accelerate ions efficiently in SSC, M/q of
the ions is increased by a charge stripper.
51 01 I
li nac I
I
____________ --ll"'m' .. II
sS£;
Fig. 1. Layout of the beam transfer line between linac
and SSC. The S, Q, D, and B refer to slit, quadrupole
magnet, dipole magnet and buncher, respectively.

14
L (m) 0 5 10 15 20 25 30 35 I I I I I I I
10· s 5°
0°
] ~
>-::
~ ~
~
; ~~ mi~D ~~0~~ D~:~D ~ ~; ~ ~~ ~ ~ ~ ~~~0~~~ ~~~ DOD Ql OlQ2Q302 Q4 BIQ5 03Q6Q704 Q8 Q9 05 QIO 06 Qil 82 Ql 2 Ql3 1M I IESl
S 1 S2 S3 S4 1M2
Fig. 2. Beam envelopes in the longitudinal (<p), vertical (x) and
horizontal (y) directions along the transfer line from the linac to sse. The beam moves from left to right.
This charge stripper is placed at the position of double waist of slit S 1 in order to avoid the
deterioration of beam quality. The beam is vertically transfered from the beam line of linac to
that of sse by using two achromatic systems (D 1- Q2-Q3-D2 and D3-Q6-Q7 -D4) between S 1 and
S4. Ions of desired charge is selected at slit S2, at which the resolving power is chosen to be
about 250 for the slit S 1 of 4 mm in width. This value is enough to separate ions with adjecent
charge state in uranium region. A dispersion matching element (D5-Q 10-D 6) and two quadrupole
triplets , Q 12 and Q 13, match the beam qualities to the requirement of sse. The beam is injected
via a dee-free valley into injection element in sse. The layout of injection system is shown in
Fig. 3. Elements 1M 1 and 1M2 bend the beam into the entrance of a 39 cm long electrostatic
inflector (LES-l) , which brings the beam into the first orbit of sse. The characteristics of these
elements are presented in Fig. 3.
Low fie ld
I [M -l [M -2 I IES- l
Angle I r T 79° T 70°
/!, t;m", I 2kG 17kG I
110kV cm
Fig. 3. Layout of injection elements at the central region of sse.

15
Two beam bunchers are provided in order to match the bunch width to the RF acceptance of
SSC. The first buncher B 1 is placed at the double waist point between two achromatic systems
and focuses the bunch width (IP) at the middle point of "a burst phase shifter (BPS)" . The second
buncher B2 is used to match the bunch width to the longitudinal acceptance of SSC. A sinusoidal
buncher can be approximated as a thin lens if the beam width (IP) at the buncher is not large
compared with the linear part of a sinusoidal wave. The magnification, then, is given by the ratio
of an image distance to an object one. The result is shown in Fig. 2.
If the lowest frequency of the RF system of sse is limited to 20 MHz, very heavy elements,
such as Pb, U, can not be accelerated using the same frequency with the linac. In this case , not
all the beam bunch from the linac is accelerated by the phase mismatch as shown in Fig. 4 (a).
This can be avoided if the time interval between the beam bunches is transformed to the phase
interval of accelerating frequency of SSC as shown in Fig. 4 (b). For this purpose, a burst phase
shifter which consists of two beam bunchers is being investigated. Extensive computation of
transfer and injection system are in progress.
Linac RF ( 18 MH z)
(a) No.1 No.2
( b)
~ Bur sts f rom L inac
hl4 7 V ' t
Pha se out
SSC RF (27MHz) H = 12
1 2 3 4 ~ ~~/T' : "'-..7 : ~ : "'-....7 L inac ( 19MH z)
:------ 2~' ~ :
~.!!... I : Bur st : 3~~~ Phase Shi fter , : , : ( 9M Hz) $- -~ $- -~
DECEL ACCEL \ I
\ / \' I
~ h /\ h ~ SSC ( 27 MHz) ~v ~~v~ H= 12
1 2 3 4
References
Fig. 4. Operational scheme of the
proposed burst phase shifter.
1) H. Kamitsubo et al.: IPCR Internal Report SSC-l; Presented at 2nd Symposium on
Accelerator Science and Technology , at INS Tokyo, Tokyo , March (1978).
2) M. Odera: Proc. Proton Linear Accelerator Conference, Chalk River, p. 62 (1976).
3) K. L. Brown and S. K. Howry: SLAC Report, No. 91, Stanford (1974).

16
3-5. Design of RF Resonators and RF Characteristics of a Half-scale
Model Cavity for Proposed Separated Sector Cyc lotron
H. Nakajima, K. Ogiwara, F. Yoshida, and J. Fujita
1. Design of RF resonators
We designed the RF resonators according to the following conditions:
(1) 22.5° delta-shaped two dees locate at opposite valley spaces between the sector magnets.
(2) The RF frequency range is 17 - 45 MHz.
(3) The minimum clearance of acceleration gap is 10 cm.
(4) The power loss in cavity is as little as possible.
(5) The current density at the short end is less than or equal to 40 peak A/cm.
(6) The characteristic impedance of the coaxial part of the half-wave resonator is greater
than or equal to 30 Q.
(7) The stem is as short as possible when used for the low frequency and is as long as
possible when used for the high frequency.
Regarding the cavity as a series combination of distributed constant circuits, we calculated
characteristics of cavities of various shapes. The result is shown in Fig. 1, which approximately
meets above conditions.
225"
Scale o 1 2m ,'----'-, -----',
2. A half-scale model cavity
r<C i
Dee
Stem
B'
Fig. 1. Cross-sectional top and side view of
the proposed resonator for the Separated
Sector Cyclotron, giving the main dimensions.
A half-scale model cavity was constructed to investigate the radio-frequency characteristics.
Figure 2 shows this model cavity. Figure 3 shows the Q values and position of shorting panel as
function of the resonant frequency. Resonant frequency is satisfactorily compared with the
calculated one. The Q values obtained were about 10000 in all frequency range. Relatively
poor agreement between the measured and calculated Q values is probably due to dirty surface and

Fig. 2.
cavity.
Photograph of a half-scale model
Position along accellerating gap
Injection Extraction
0----.---0----------- ' F = 346 MHz
0_-._0 F=502 MHz
1 '----0.9[ 0____ .----0
OJ .----.--0----2 0.8 F == 75.3 MHz
<lJ >
<ul ~ ~ & 0.9l o ____ o __ o--o~o
08l F=86.5 MHz
~ f ---",o,---- o~/ 08l 0_
0---
F = 98.1 MHz
2
o ~ 0.5
0.2
30 40
Fig. 3.
ing panel.
50
Cal uclated
Q va lue X 10 3
20
'----':. 10
5
.~.
~. 60 70 80 90 100
Fr equency ( MHz)
Q value and position of short-
Fig. 4. Relative distribution of electrical
field intensity along the dee edge of the half
scale model cavity obtained by the perturbation
method.
17
poor contact at the shorting end of the model cavity. Figure 4 shows relative voltage distribution
along the accelerating gap at the half-scale model cavity measured by the perturbation method.
The distribution which was normalized at injection radius showed about 20 % decrease at the
intermediate radius at maximum frequency.

18
3-6. Computer Code for the Equilibrium Orbit in a
Separated Sector Cye lotron
N. Nakanishi and S. Motonaga
A 1/4-scale model magnet system was constructed for basic studies on a separated-sector
cyclotron (SSC) , and the magnetic field distribution in the median plane have been measured both
in radial and azimuthal directions at different excitation conditions . 1 ) This has been done in order
to calculate various beam dynamical properties in the cyclotron using the field shape measured,
and to deduce basic parameters which will allow design of the full scale magnet system. For this
purpose, a computer code has been developed for the calculation of some properties of the
equilibrium orbit.
Output voltage from a Hall probe is amplified and digitized to be stored in an online computer
OKIT AC 4500, and is transferred to a magnetic tape. The subsequent treatments are made with
a computer FACOM 230-75.
The measured data, which are the digital voltmeter readings (mV unit), are converted to
magnetic induction values (Gauss unit) using a polynomial expression which reproduces calibration
data, and Fourier analysis is done. Fourier coefficients obtained are stored in a disk. Since the
sse is of a 4-sector type and the angular range measured is 45 degrees, the following expression is
used:
B(r, fJ) = 2B(r)+~a 4k cos(4kfJ), k
where B (r) is the azimuthally averaged magnetic field at radius r. The maximum k is determined
to satisfy the least square conditiun
~ {Ba( fJ j ) - B( fJ j )} 2 ;:::; minimum, j
where Band Ba are, respectively, measured value and abridged one, the latter being truncated at
the index 4k. Points including accidental errors are difficult to be reproduced by the analysis.
Therefore the data points which show disagreement larger than a certain amount between observed
and calculated values are able to replaced by the calculated values by specifying the limit.
Generally, the number of measured data is much less than that required for exact integration.
Moreover, measured data will contain experimental error and show a certain fluctuation. The
Fourier analysis of data a priori has effect of giving the averaged tendency of the measured values
azimuthally. Interpolation and extrapolation in the radial direction are made for the Fourier
coefficients using the Lagrange six-point method. In integrating differential equations,
interpolation is done further using the previously calculated field.
Since the measured magnetic field is not of isochronous profile , it is necessary that the
isochronous field is formed in advance of the calculation of the equilibrium orbit. The fractional
change a = 6L/21Tr t:> in the length of the equilibrium orbit from that of the equilibrium circle is

given by 2)
where J1 and a4k are the magnetic field strength and Fourier coefficient respectively, and primes
ro d ] d d2
] 3) denote B dr r = rand B dr2 = Thus the isochronous field Bs(r) is
orr o'
B (r) = 1 + 6( r) s / 1 - r 2{ 1 + 6( r) P
The calculation of the equilibrium orbit is repeated changing the initial condition until we get
in which rand P r are the radius and the radial component of momentum respectively, and € is a
given small value. Thirteen differential equations , which specify the beam motion in the field,
19
are integrated through one sector by the Runge-Kutta-Gill method, after the equilibrium orbit is
found. 4) However, these equilibrium orbits have been found not to satisfy the condition of
isochronism. Therefore above calculations are iterated until both the conditions of the equilibrium
0.9
0.8
0.7
0.6
r: =8.4 , 40MeV/ n
I~',,, = 0.84 , 40MeV I n
,\ = 4
R,,,=84em
Fig. 1. Focusing frequencies calculated for 12C6+ and 238U37+ .
These nuclei are assumed to be
injected at the radius of 84 cm
with energies of 4.0 and 0.84
Me V In, respectively.
'-----__________ Z38 U37 ~
9.0
4°Ar' s-
~ 8.0 /
~ I:::::
7.0
I I I
/ /
--------~
-... " B= 14kG
6.0
~~1 ~1~6~0 ~~~~~20~10~~--L-~~3b-0 R (e m)
Fig. 2. Isochronous fields averaged
azimuthally. The broken line shows
the averaged field which has been
measured at 14 kG.

20
orbit and isochronism are fulfilled simultaneously.
Energy E, betatron frequencies vr' vz' mean radius <r>, amplitude of the beam, period and
so on are printed out. The isochronous field, also, is written down.
The innermost orbit in the SSC is restricted in its parameter value because it has to fulfill the
matching condition determined by the injector linac. The condition is that the length of the
innermost orbit should be the integral multiple of the length of the last drift tube section. This
condition, however, is not taken in the calculation because of the lack of data in the inner region.
Result of preliminary calculation on the behavior of focusing frequency is shown in Fig. 1 for
two nuclei. The calculation was done using the field shape measured at 14 kG. The radial range
of the magnet is limited by the data which is available at present. Figure 2 shows a comparison
between measured and isochronous fields which are averaged azimuthally.
Work is now in progress to check the accuracy of the calculation and to proceed further in
the calculation using the data expanded in the radial direction.
References
1) N. Kumagai, S. Motonaga, H. Kamitsubo, T. Wada, F. Yoshida, K. Ogiwara, N. Nakanishi,
1. Yokoyama, and H. Takebe: IPCR Cyclotron Progr. Rep., !1., 10 (1978).
2) L. Smith and A. A. Garren: UCRL-8598.
3) A. A. Garren: Nuc1. Inst. and Meth., 18·19,309 (1962).
4) M. M. Gordon, T. A. Welton, T. I. Arnette, and H. C. Owens: ORNL 59-11-2.

21
3-7. Measurement of the Turn-Separation, the Effective Acceleration
Voltage and the Focusing Frequency V z of the Ion Beams
in the eyc lotron
H. Takebe, K. Ogiwara, and I. Kohno
In order to study the motion of various ions in the cyclotron, a four-finger beam probe (Fig.
1), which has three differential electrodes and an integrating electrode, was installed to the
cyclotron.l) ,2) Radial distribution of the beam intensity measured by these electrodes is shown
in Fig. 2. As shown in Fig. 3, the turn-separation, 6r, the voltage gain per turn, 4V pCos 8, and
the phase of the ion with respect to the RF, 8, are deduced from these data by following
equations:
where 6E is the energy gain per tum, R the extraction radius, ER the maximum energy, q the
charge of the ion and r the radius of the ion orbit. V p is estimated from the maximum value of
4V pcos 8 obtained when 8 = 0, and is plotted in Fig. 4, against the nominal dee-voltage, V d' at the
control desk. This V d was calibrated by the dividing condenser method in 1977. The estimated
points are well on a straight line given by V p = y'L V d'
The difference in the current between the upper and the lower electrodes is shown in Fig. 5,
in which turn-number, t, of the beam in half period of the betatron oscillation in the z-direction is
also indicated. This t gives the n-value by 2t = wo/wz = v-I = n- l/2 , Further, n can be written
as n = n l + n2 + n3 , where n l is the focusing index of the main magnet, n2 is a term originating
from phase change of the accelerating voltage and n3 is a term which comes from velocity change
while the ions cross the dee gap. In Fig. 6, n-values are plotted and compared with n l derived
Fig. 1. Photographs of the four-finger beam probe head (left figure) and
the probe inserted in the port of the acceleration chamber besides the heavy
ion source.
22
1.0
(f)
OJ 05 (f)
c OJ
c
E <U OJ
m
05
Feb. 27,1978 P 6.5 MeV Vd = 35.5 kV
=7.593 MHz - 6 «
5 -3-
4 0 .;:-
3 . ~ OJ
2 ."§
~ OJ m
~~~~~----------------~ O
r (e m)
(f)
OJ
30
20
10
( b) Jan. 30,1978 C4+ 75 MeV, Vd =64.5 kV
Freq =7.436 MHz Are : 523 Vx8.92 A Del: 747.5,
100uter
.~ O r~--------------------------~
C "
~ 20 :: . - "
E I:: ~ :: : ;~
en I t I 'I 1' 1' \
10 \, If \ IJ I ' ,,,
~ " ~
r (em)
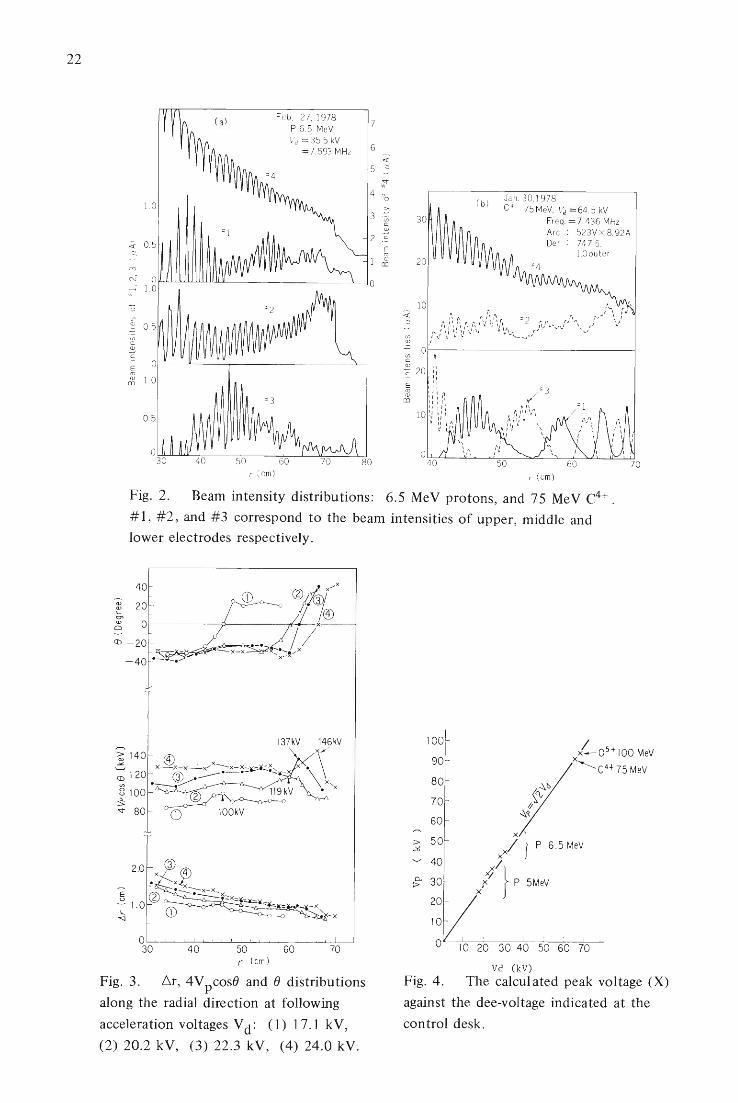
Fig. 2. Beam intensity distributions: 6.5 MeV protons, and 75 MeV C4+ .
# 1, #2, and #3 correspond to the beam intensities of upper, middle and lower electrodes respectively.
40
~ 20 0> Q)
o Ol----------~------~+--
r (em)
Fig. 3. 6r, 4V pcose and e distributions
along the radial direction at following
acceleration voltages V d: (1) 17.1 kV,
(2) 20.2 kV, (3) 22.3 kV, (4) 24.0 kV.
100 1-05+100 MeV 90 1'----c4
+ 75 MeV 80 \~~
70 I;
60 ~~
:> 50 ?;} P 6.5MeV ~
40
""I} Po 30 // P 5MeV :>
20
Vd (kV)
Fig. 4. The calcul ated peak voltage (X)
against the dee-voltage indicated at the
control desk.

10
cH 75 MeV
Vd =64.5 kV
,. =40cm
1.0 P 6.57 MeV Vd = 27.8 kV
Fig. 5. Vertical oscillation of the beam given
by .6.1 = lupper-Ilower along the radial direction and the turn-number in half period of the
betatron oscillation in z-direction.
23
1.01
1.00 0.03 x
0.99
- 098 ~.
~ 0.02 - 0,97
0.96
0.94 0.01
o 0~~10~~20~~3~0--~4~0--~50~~6~0~~7~0--~80
r (em)
Fig. 6. The n-val ue (X) calculated
from the experimentally obtained v z'
radial distributions of the main magnet
B and the focusing index n l derived
from the B distribution.
from the radial distribution of the magnetic field B of the cyclotron measured in 1966.3) These
measurements give good evidence that behavior of the beam in our cyclotron is in good agreement
with the theory of the weak focusing cyclotron, by which the machine was designed.
References
1) K. Ogiwara and H. Takebe: IPCR Cyclotron Progr. Rep., l!, 4 (1977).
2) H. Takebe, K. Ogiwara, and I. Kohno: Reports I.P.C.R., (in Japanese), 54,77 (1978).
3) S. Motonaga: Private communication.

24
3-8. Acceleration of Lithium Ion In the Cyclotron
K. Ikegami and I. Kohno
For the production of Li2+ or Li3+ ions we prepared two kinds of hot cathode PIG sources:
one has a sputtering electrode and the other a sputtering anode . We accelerated Li2+ and Li3+ in
the cyclotron using the source which has a sputtering anode. Li2+ and Li3+ ions are produced in
this source by a process that involves ions which are unable to cross the first acceleration gap
between the ion source and the dee. These ions are accelerated back into the ion source where
they sputter Li atoms into the arc. The Li atom is ionized and extracted from the source.
Figure 1 is a photograph of the source having a sputtering anode. A rectangular block of LiF of
dimension 8 X 8.5 X 16 mm 3 is installed in the anode chamber facing the slit. Figure 2 shows
the m/q spectrum measured with a beam probe fixed at the radius of 55 cm in the cyclotron by
varying the magnetic field strength under the conditions of constant oscillator frequency and dee
voltage when the source was operated at arc voltage of 350 V and current of 5.5 A using Xe as
the supporting gas. This spectrum shows clearly that 6 Li2+ , 7 Li2+ , 6 Li3+ , and 7 Li3+ ions were
produced and accelerated. The intensity of 7 Li2+ ion extracted from the cyclotron was 0.3 eJ.1A.
The ion source was operated stably for about 6 h.
In order to increase the intensity of Li ion beam, we are preparing another sputtering ion
source. Figures 3 and 4 show a cross sectional view and a photograph of this ion source. This
ion source is of a hot cathode PIG type source and has a sputtering electrode inserted into the
Fig. 1. A photograph of
the beam sputtering source.
10
« l1.0
E
'" (l)
.D
c 0.1 .Q
XIO
t---- 6Li · (3) 6Li3'
F3 - (3)
2.0
7L i - (3) 7Li3-
F2· (3)
I I I
I 6L i2 -
: I
2.5 30 ( m / q )
Frequency : 7.4938MHz Dee voltage : 53 kV Arc vo l tage : 35 OV
A 7L i2 . Arc current : 5.5 Suppo r ting gas: Xe (II) : Harmonic n umber
129 xe ll •
1
(3)
I
I
I
I I
3.5 4. 0
Fig. 2. The m/q spectrum measured in the cyclotron
at the radius of 55 cm.

25
SH
HSH
eM
SE
'- I
o 50mm I I
Fig. 3. Cross-sectional view of the ion source with a sputtering
electrode.
Kl : hot cathode (W) SE : charge material mount (copper,
K2 : reflector cathode (W) water-cooled)
CM : cathode mount (copper, water- I : insula tor (ceramic)
cooled) L : leading tube
HSH: cathode heat shiel d (W) CAl : upper cold anode (copper, water
SH : electron shield cooled)
F : filament (W) CA2 : lower cold anode (copper, water
SP : slit plate (Mo) cooled)
SM : charge material to be sputtered HA : hot anode (stainless steel)
T : supporting tube (stainless steel)
Fig. 4. A photograph of the ion source
with sputtering electrode.

26
anode chamber at the opposite position of the slit and insulated from the anode. A voltage of
500 - 1000 V is applied between the sputtering electrode and the anode, and the electrode
material is sputtered by bombardment with the ions in the arc plasma. We intend to try the
acceleration of Li ions in the cyclotron using this source in the future.
Reference
1) Y. Miyazawa, I. Kohno, T. Inoue, T. Tonuma, A. Shimamura, and S. Nakajima: IPCR
Cyclotron Technical Report, No.2 (1972).
27
3-9. Beam Study on the Baby eye lotron
T. Karasawa
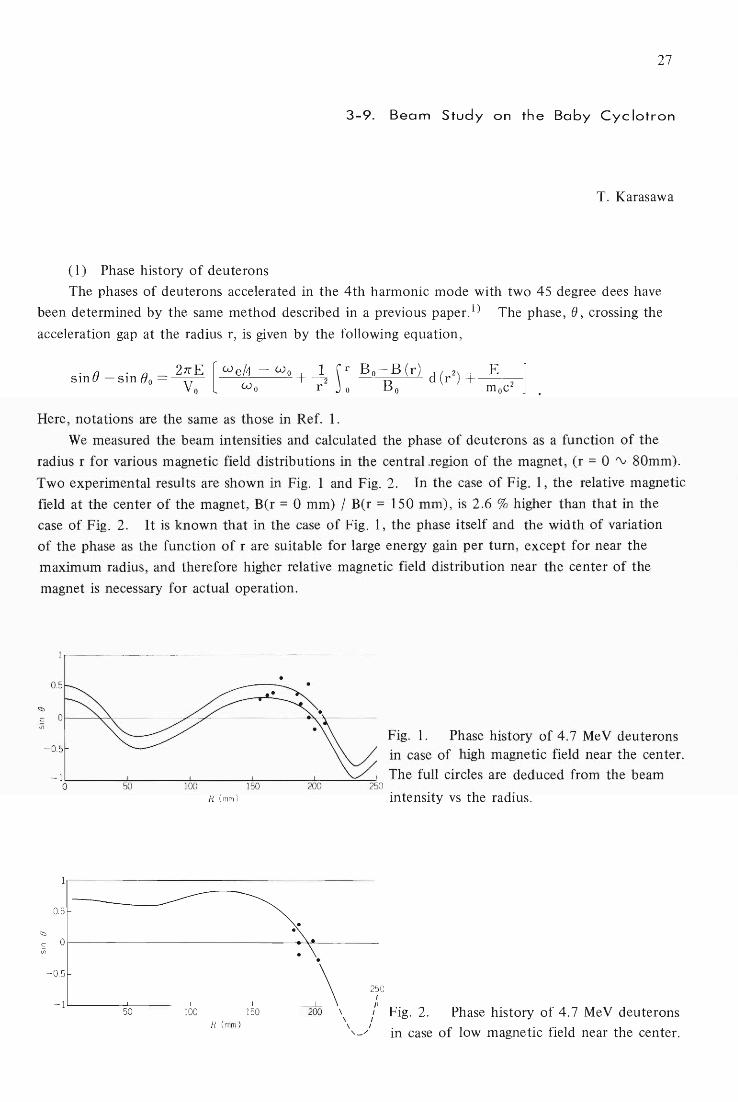
(1) Phase history of deuterons
The phases of deuterons accelerated in the 4th harmonic mode with two 45 degree dees have
been determined by the same method described in a previous paper. 1) The phase, 8, crossing the
acceleration gap at the radius r, is given by the following equation,
. f) . f) 2/TE [we/4- Wo+ 1 \r BO-BB(r)d(r2)+ E ] SIn -SIn 0 =-- -2 J ---Vo Wo rOO moc2
•
Here, notations are the same as those in Ref. l.
We measured the beam intensities and calculated the phase of deuterons as a function of the
radius r for various magnetic field distributions in the central.region of the magnet, (r = 0 'V 80mm).
Two experimental results are shown in Fig. 1 and Fig. 2. In the case of Fig. 1, the relative magnetic
field at the center of the magnet, B(r = 0 mm) / B(r = 150 mm), is 2.6 % higher than that in the
case of Fig. 2. It is known that in the case of Fig. 1, the phase itself and the width of variation
of the phase as the function of r are suitable for large energy gain per turn, except for near the
maximum radius, and therefore higher relative magnetic field distribution near the center of the
magnet is necessary for actual operation.
'<::l
L O~-~~----r~~-----~~----'w
Fig. 1. Phase history of 4.7 Me V deuterons - 0.5 in case of high magnetic field near the center.
-1'---_ _ ---J. ___ --,-L-,-__ ----':-:-___ =-'--=-_---=______=_:' The full circles are deduced from the beam o 50 100 150 250
R (mm) intensity vs the radius.
'<::l
L Or-----------------------__ ~--------w
-0.5
-1'--------750~---1~0~0----~1~50~----~:-~--~
R (mm) Fig. 2. Phase history of 4.7 MeV deuterons
in case of low magnetic field near the center.

28
(2) Displacement of the center of the ion orbit
In the high harmonic mode acceleration, displacement of the center of the ion orbit from the
magnetic center is induced by asymmetries of both the magnetic field and the electric accelerating
field. Even though the geometrical configuration of the accelerating electrodes is symmetrical,
asymmetry of the accelerating field is generated by the phase difference of the ion arriving at the
accelerating gaps. We express the displacement of the center by polar coordinates, (p, 'P), and
variation of p and 'P per revolution by 6.p and 6.'P, respectively. For the displacement caused by
the asymmetry of the electric acceleration field in addition to the magnetic field, the following
equations hold for the fourth harmonic mode acceleration,
6.p = 2 V'1 VIE p sin () sin 2i.p + 7Tr c 1 sin ('P - VJl)
6.'P = - 4V/E sin () (1 - 1/ ficos 2 'P) + 7Tr/p c 1 cos (9?- VJl) + 27T (Vr - 1)
Here, notations are the same as those in Ref. 1.
It is known from the equation that the smaller the value of sin () is, the smaller the
displacement is. As described in section (1), reduction of the value of sin () can be achieved by
the high relative magnetic field near the center of the magnet. In order to reduce the displacement
of the center of the ion orbit further, we are now preparing to install two pairs of harmonic coils
at proper positions on the pole faces of the magnet.
The harmonic coils will generate the first harmonics of the magnetic field at arbitrary azimuth.
The first harmonics generated by the coils can reduce the displacement caused by the asymmetries
of both the electric acceleration field and the magnetic field.
Reference
1) T. Karasawa: IPCR Cyclotron Progr. Rep., 11, 15 (1977).

29
4. NUCLEAR PHYSICS
Scattering and Reactions
4-1. Spin Flip Asymmetry In the Inelastic Scattering of
Protons on 12C at 28 MeV
T. Fujisawa, M. Nakamura,* M. Yasue,** N. Ueda,** T. Hasegawa,**
H. Kamitsubo, K. Hatanaka,* T. Tanaka,*** M. Sekiguchi,**
T. Wada, Y. Toba,**** and F . Soga**
We have measured the difference between the analyzing power and the polarization (A-P) in order to
investigate the spin dependence of the effective two-nucleon interaction and the reaction mechanism. 1) - 4) Direct
measurement of the polarization, however, is very difficult because it requires a double scattering. So the (A-P)
was deduced by measuring the spin-flip probability of polarized protons. S)
The spin flip probability was measured by the (p, p'')') method, i.e., by measuring the angular correlation
between protons scattered inelastically from the 2+ excited state and the E2(2+ -+0+ ground) de-excitation ,),-rays emitted perpendicularly to the scattering plane.6) ,7)
If the z-axis is chosen along the normal to the scattering plane the inelastic observables for a proton are
expressed as follows:
P
(0++ + 0+ _ + 0 _ + + 0 _ _ )/2,
(0++ - 0+ _ + 0_ + - 0 _ _ )/200 '
A = (0++ + 0+_ - 0 _+ - 0 __ ) / 200'
SF= (0+ _ + 0 _+) /2°0 ,
where 0+ _ is the partial differential cross section for scattering from an incoming spin-up state (+) to a final spin
down state (-) . In the experiment with proton counters at symmetric angles relative to the beam direction we
obtained the 00' A, SF, and SFA simultaneously.
The scattered protons were detected by four pairs of SSDs. The fixed pair at 62.5° was used sim ultaneously
as a monitor of the beam polarization. 8) Asymmetries caused by the detector system were compensated by
flipping the beam polarization about everyone minute .
Figure 1 shows the differential cross section and the analyzing power of the elastic scattering. The curves
-:
~ -.S J
100
10
30 60
- TFI ......... TF 2
- -- RDL - . - RMC
_ . . - JJK
90· 120 150·
Be"
50
* Department of Phy sics, Kyoto University.
30·
** Institute of Nucle a r Study, University of Tokyo.
*** Department of Engineering, Kyushu University .
* * * * Department of Physics, Tsuku ba University.
60· 90· 120· 150·
Be "
Fig. 1. The differential cross section
and the analyzing power of the elastic
scattering of protons from 12C at
28 MeV. The optical parameters used
for the calculation are in Table 1.

30
show the results of the optical model calculations. The sets of the optical parameters are listed in Table 1. The
sets TF-l, and 2 were obtained by X2 -fitting for A and a 0 of the elastic scattering with SEARCH code developed
by Wada. 9) All of the sets give good fits to the cross section but the predicted analyzing power is different
from each other.
Table 1. The optical parameters.
Potential Vo ro ao WD Wl rD aD Vso rso aso name (MeV) (fm) (fm) (MeV) (MeV) (fm) (fm) (MeV) (fm) (fm)
TF-1 60.9 L 0.665 8.26 O. 0.954 0.578 6.38 1. 0.697 TF-2 50. 1.08 0.593 6. O. 1.214 0.51 6. 1.09 0.388 RDL1O) 61.2 1.0 0.65 6.24 O. 1.055 0.68 6.01 1.05 0.51 RMC 8) 37. 1.25 0.65 0.6 7. 1.25 0.47 6. 1.25 0.54 11K 11) 48.48 1.07 0.634 3.33 O. 1.34 0.682 7.34 1.01 0.485
Figure 2 shows the differential cross section and the analyzing power of the inelastic scattering together with the
results of the macroscopic DWBA calculation. The code is developed by H. Sherif. The interaction potential is
obtained by deforming the optical potential. The deformed spin dependent term is of the full Thomas form or the
Oak Ridge form. It was shown that the full Thomas form gave better fits to inelastic asymmetries and spin flip probabilities than the Oak Ridge form. 12),13) Two forms give similar differential cross sections but different analyzing
powers in the present analyses. It seems that the full Thomas form is more suitable for the analyzing power at small
angles than the Oak Ridge form. All of the sets of the optical parameters give fairly good fits to the cross section but any set does not give a good fit to the analyzing power. As well-known, the spin-orbit part should have a
greater deformation than the central part. 10) The results of DWBA calculations for the different ratios of the
deformation parameters (~so/~o) are shown in Fig. 2. Dependence of the cross section on the ratios is small so
it is not shown. ( a)
Full Thomas IJ 1 IJ -1
~ 10' ,.,so ,.,. -
~ ~ -5 ........... ::::---_ . . ..... :.--:-~ -TFI •• ~ .,
....... TF2 _ .- RMC
O.I'--'---L-_-'------'_-----'--_--'
50
• ° 0 ••••••
- 50 30· 60· 90· 120· 150·
Be ....
( b)
Oak Ridge /3so l ,8.=1 50
10 ,.
~ g - TFI fJ~ ·~~~"·· ~ " ....... TF2 fl. =0.6 . --- RMC fl.=0.6
O.lL...L---'-----'------L--------'----'
50
• (c)
.........
- Pso l fJ.= 1 ....... • =1.5 --- n =0.5
Oak Ridge TFI
L,-L,-;,--:1:-::----,::S--~c::o_~c;;__---J - 50 30· 60· 90· 120· 150·
Be ... Be ...
Fig. 2. The differential cross section and the analyzing power of the inelastic scattering of protons from
12C at 28 MeV. The curves show the prediction with macroscopic DWBA theory. (a) The full Thomas form
deformation.(b) The Oak Ridge form deformation. (c) Changes of the Analyzing power to the ratio ~so/~o'
Figure 3 shows the SF, SFA, and (A-P). The value of SF have been corrected for non-spin-flip contributions
due to the off-z axis-'Y-ray. The solid bar shows the statistical error and the dotted bar indicates the uncertainty
caused by the lack of measurements of the other substate popUlations (m = ±2 and m = 0) and the finite solid
angle of the 'Y-ray detector. However, we can see the pronounced peak of the SFA at 1000
• The curves are the

Full Thomas
Po= 0.6, /3s0 1 Po=1 20
10
20
10
Full Thomas TFI Po= 0.6
20, Oak Ridge
Po=0.6, flso l Po=1 10
20
10
Oak Ridge RDL Po=0.6
31
.····'·····l:SL, -- .... r !-t'F-'::::::'O:'O
I"--==::::!:lI=----'
-20
50
40
~ 30
~ 20
-TFI ....... TF2 _.- RMC
.,J\ 10 ~,.,# . ••
o 30' 60' 90' 120' 150'
-20 -20
50
-50
50 - (3501,80= 1 50 = 1.5
40 = 0 40
30 30
·A 20
10 ~::;:;;# '\ 10 .. ~ --
20
Oe M
-TFI ..... . TF2 -'-RMC
Oe ...
. .
-20
50
40
30
20
10
-Pso llPo= 1 = 1. 5 =0
Oc .....
Fig. 3. The spin-flip probability, the spin-flip asymmetry and the (A-P) in the inelastic scattering
I
of proton on 12C at 28 Me V. The curves are the calculated values with macroscopic DWBA theory.
. .
value calculated with Sherif's code. The interaction including the full Thomas form deformation is invariant under
the projectile time reversal operator but one including the Oak Ridge form is not. Therefore the finite value of
the calculated SFA with the full Thomas form spin-orbit deformation, is due to non-adiabaticity but the SFA
predicted with the Oak Ridge form has a finite value in the adiabatic process (Ein = Eout)' Any parameter set
cannot reproduce the SFA or the (A-P). It was reported that the large values of the SF around 1500
are the
effect of the E2 quadrupole giant resonance. 8) The macroscopic DWBA calculations cannot reproduce such large
SF. If the effect of the resonance is small for the SF A, the interference between S = 1 and S = 0 components
of the effective two nucleon interaction arises in the reaction or the interaction potential of the macroscopic DWBA
needs some other spin-dependent force which gives an account of the SFA. The effect of such resonance on the
SFA, however, is not known. So it is interesting to see the energy dependence of the SFA.
References
1) G. R. Satchler: Phys. Lett., 19,312 (1965).
2) H. Sherif: Canadian J. Phys., 49, 983 (1971).
3) M. Thumm, G. Mertens, H. Lesiecki, G. Mack, and K. Schmidt: Proc. of the 4th Intern. Symp. on Pol. Phen.
in Nucl. React., Zurich, p. 799 (1975).
4) T. Hasegawa et al.: Proc. Intern. Conf. on Nucl. Phys., MUnchen, p. 409 (1973).
5) R. Boyd, S. Davis, C. Glashauser, and C. F. Haynes: Phys. Rev. Lett., 27,1590 (1971); ibid., 29, 955 (1972).
6) F. H. Schmidt, Ronald E. Brown, 1. B. Gerhart, and W. A. Kolasinski: Nucl. Phys., 52, 253 (1964).
7) T. Fujisawa, S. Motonaga, F. Soga, M. Yasue, N. Ueda, T. Hasegawa, M. Nakamura, T. Wada, H. Toba, and
H. Kamitsubo: IPCR Cyclotron Progr. Rep., !1, 18 (1977).
8) R. M. Craig, 1. C. Dore, G. W. Greenlees, 1. Lowe, and D. L. Watson: Nucl. Phys., 83,493 (1966).
9) T. Wada: IPCR Cyclotron Progr. Rep., 1, 87 (1968).
10) R. De Leo, G. D'erasmo, F. Ferrero, A. Pantaleo, and M. Pignanelli: Nucl. Phys., A254, 159 (1975).
11) 1.1. Kolata and A. Galonsky: Phys. Rev., 182, 1073 (1969).
12) G. R. Satchler: Proc. of the 3rd Intern. Symp. on Pol. Phen. in Nucl. React., Madison, p. 155 (1970).
13) H. Sherif and 1. S. Blair: Phys. Lett., 26B, 489 (1968).

32
4-2. The (p, d) Reaction on p and s - d Shell N uc le i
T. Noro, K. Hosono, * M. Kondo, * T. Saito , *
S. Nagamachi,* N. Matsuoka,* S. Kato,** K. Okada,**
K. Ogino,*** and Y. Kadota***
Differential cross sections a (8) and vector analyzing powers Ay (8) have been measured for
(p, d) reactions on 12C, 13C, 24Mg, 28Si, 29Si, and 40Ca using 65 MeV polarized proton beam
accerelated by RCNP AVF Cyclotron. Outgoing deuterons were detected by a pair of counter
telescopes positioned at the symmetric angles to the beam axis. Each telescope consisted of a
500 J.lm thick transmission-type Si-detector and a 15 mm thick high-purity Ge-detector cooled by
liquid nitrogen. The overall energy resolution was about 250 keV in FWHM.
The angular distributions of a (8) and Ay (8) obtained in this experiment are summarized in
Fig. 1. The Ay (8) for P3/2 and dS/2 U = e + 1/2) neutron pick up reactions are very similar to
each other. These Ay (8) show a dip at about 30° and increase with angles in wavy pattern. The
Ay (8) for PI/2 and d3/2 U = £ - 1/2) neutron pick up reactions are different from these for j = £
+ 1/2. The DWBA calculations have been carried out with TWOSTP code using FACOM230-75
at IPCR, and the results are also presented in Fig. 1 with the solid line. For the deuteron channel,
the adiabatic deuteron potentials proposed by Johnson and Soper were used and the parameters of
these potentials and proton channel optical potentials are listed in Table 1. In these calculation,
qualitatively good fits were obtained for the angular distributions of a (8) and Ay (8) when the
transferred ej are sl/2 and P3/2' but for the other cases, the fits are not so good. A more detailed
analysis is in progress.
Table 1. Optical potential sets.
Channel Vo fO aO Wy Ws f· 1 a· 1 Vso fSO aso
P + 12C 25.39 1.244 0.712 2.84 2.32 1.469 0 .390 6.79 1.041 0.532 a) d + 12C 102.0 1.15 0 .62 0.0 11.6 1.15 0.62 5.0 1.15 0.62 Ref. 3 p + 24Mg 40.26 1.112 0.747 8.40 2.00 1.358 0.557 6.127 1.041 0.532 a) d + 24Mg 89.6 1.21 0.64 0.0 16.9 1.14 0.55 5.15 0.97 0.32 Ref. 4 p + 28Si 38.63 1.116 0.739 7.18 3.46 1.288 0.507 5.79 1.021 0.587 a) d + 28Si 91.47 1.17 0.68 2.71 10.51 1.33 0.61 6.58 0.94 0 .60 Ref. 5
p + 40Ca 38.03 1.16 0.75 1.41 4.48 1.37 0.63 6.04 1.064 0.738 Ref. 6
d + 40Ca 98.98 1.152 0.718 0.0 16.45 b) 1.309 1.166 6.23 1.014 0.526 Ref. 7
a) Present set.
b) Gau ss typ e.
* Research Center for Nuclear Physics , Osaka University .
** Laboratory of Nuclear Studies, Osaka University .
*** Department of Nuclear Engineering, Kyoto University.

33
0. 1 29 Si Cp, d) 28S iooo
0.5 l j = s Y<
10- 2 .;: 9
0 10-3
10 12CCp, d) 11CO.oo
l j= p% 05
~
0.1 0
0 6 l3cep, d) 12Cooo 0. 5 ?
l j= p~ ¢ ¢ ¢9 t
(/) ¢ '-. 0.1 -D
~ E
~ 0 '-. 10- 2 b ~
¢
0 10 28 Si (15, d) 27 Sio45
l j=d%
0.5
0. 1 ~
0
10 IOCa Cp, d) 39Caooo
05 0 i )=d%
0
000
0 ') .;: 0.1 00 0 Fig. 1. Differential cross sections
0
0 and analyzing powers of (p, d) 0 10 - 2
reaction at 65 Me V. The solid lines
10- 3 - 0.5 show the results of DWBA
0 30 60 90 120 0 30 60 90 120 calculations.
Bl.~l Be M
References
1) M. Toyama and M. Igarashi: unpublished.
2) R. C. Johnson and P. J. R. Soper: Phys. Rev. , Q, 976 (1970).
3) P. G. Roos, et al.: Nucl. Phys. , A255, 187 (1975).
4) A. G. Blair, et al.: Phys. Rev., CI, 444 (1970).
5) C. R. Lamontage, et al.: Phys. Lett., 45B, 465 (1973).
6) C. B. Fulmer, et al.: Phys. Rev., 181, 1566 (1969).
7) K. H. Bray, et al.: Nucl. Phys., A167, 57 (1971).

34
4-3. Exact Finite-range DWBA Calculations Inc luding the Deuteron
D-state for the 58 N i (p, d) 57N i Reaction at 52 MeV
N. Kishida and H. Ohnuma
At lower energies D-state of the deuteron ground state has small effects on cross sections and
on vector analyzing powers, but is very important to describe tensor analyzing powers. At high
energy (==700 MeV) the D-state is known to give primary contributions to (p , d) differential cross
sections. However, the D-state effects have not been investigated well at intermediate energy
region. In this report data from INS for the (p, d) reaction on 58Ni at 52 MeV l ) are compared
with calculations based on the exact finite-range DWBA, in which the D-state is included.
The method of De1ic and Robson2) is used for all exact finite-range calculations (EFR) using
the computer code TWOFNR. 3) The n-p interaction, which is used to describe the transfer
reaction as well as to generate the deuteron internal wave function, is taken to be the soft core
interaction of Reid. Distorting potentials are the set 1 P-l D of Ref. 1 and non-locality corrections
(NL) are included with Pp = 0.85 fm and Pp = 0.54 fm. Form factors are generated by usual
separation-energy method.
Results of EFR DWBA calculations are shown in Figs. I - 3 together with the experimental
angular distributions. Solid and dashed curves are the predictions of EFRNL calculations with
and without the D-state contributions, respectively. None of the calculations reproduce the
U1 " .0 E
10°,.-------- --------, 58N i ( p,d )57 Ni E p =51.93 MeV
-. - s+ o ---- S
~ 10- 2
:3 "1j
" b "1j
10- 3
1.10 MeV ( 112 - ) ( X 1/ 10)
o
0~~-~20~~~40~~~6~0-~~80~~
fJC M (deg.)
Fig. 1. EFR DWBA calculations with and
without the D-state compared with the experi
mental angular distributions for the ground
state (3/2-) and the 1.10 MeV state 0/2-).
101 .------~---------, 58 Ni ( p, d) 57Ni E p = 51.93 MeV
10- 2
" . , -,~,~-.
\ . \\ \ . \ 'e.. •. ,~ , ........ / -.~
- s+o -- -- s
'"
0.76 Me V ( 512- ) (x 1/ 10 )
e'---. . ... ~~ . "
fJC M (deg.J
o
Fig. 2. EFR DWBA calculations for the
2.56 MeV state (7/2-) and for the 0.76 MeV
state (5/2-) compared with the experiment.

10°...------------------,
10- 1
o o 0
o
10- 3
E p = 51.93 MeV
- S+D ---- S
. . . . . . .
5.59 MeV ( 1/ 2+) (X 1/ 100 )
0~~~2~0-~-4~0-~~60-~~~~
Be M (degJ
Fig. 3. EFR DWBA calculations for the
6.02 MeV state (3/2+) and for the 5.59 MeV
state (1/2+) compared with the experiment.
35
experimental angular distributions well. It seems that the inclusion of the D-state slightly improves
the quality of fits for most transitions. However, the effects on the differential cross sections are
surprisingly small in spite of relatively large momentum transfer in the present (p, d) reaction (See
Ref. 4).
References
1) H. Ohnuma, T. Suehiro, M. Sekiguchi, and S. Yamada: J. Phys. Soc. Japan, 36, 1236 (1974);
ibid., p. 1245.
2) G. Delic and B. A. Robson: Nucl. Phys., A156, 97 (1970).
3) M. Igarashi: unpublished.
4) E. Rost and J. R. Shepard: Phys. Lett., 59B, 413 (1975).

36
~
4-4. Analyzing Power of the (p, t) Reaction leading to the
Unnatural Parity State
H. Amakawa and K. I. Kubo*
The conventional zero-range DWBA forbids the excitation of the unnatural parity states by
(p , t) reactions. A great deal of calculations concerning this type of transitions have been
performed with higher-order treatments and considerable successes of reproducing the differential
cross sections have been reported. 1), 2) The present authors have also reported successful results
of two-step excitation calculation for the 180(p, t) 160(2- , 8.88 MeY) transition. I), 2) A
particular interest is the energy dependence of the differential cross section; it decreases by a
factor of about one-thirtieth as the incident energy changes from 20 to 45 Me Y. The calculation
by the two-step approach has been reported to be able to reproduce this strong energy dependence
fairly well as well as the angular distributions of the cross sections.2)
So far those studies have been performed only for the differential cross sections. Other
important experimental informations, e. g., analyzing power and/or polarization were not concerned,
which might clarify the reaction mechanism more sensitively. Therefore, we calculate the
analyzing power of the 180(r, t) 160(2- , 8.88 MeY) transition at 24.4 MeY for testing the
two--step approach. The experimental data have been reported by Pignanelli et al. 3) only at this
incident energy. We use the same methods as employed in the previous papers. 1 ), 2) They are
summarized as follows. Three types of processes are included : the (p, p', t) process via 180(2+)
state, the (p, t, t ' ) processes via 1600- and 3- ) states and the (p, d, t) processes via 170(5/2+ ,
1/2- , 3/2- , and 3/2+) states. The wave functions of 180 and 160 are taken from Refs. 4 and 5.
The values of D6(p, d), D6(d, t), and D6(p, t) used are 1.58,3.37, and 145 in units of 104 Mey2fm3,
respectively, which are the same as those used in Ref. 2. The parameters of the distorting
potentials are listed in Table 1.
Table 1. Distorting potential parameters used in the calculations.
Y ro a Wy WD I I Yso ro a rso aso
180 + p6) 56.0 1.17 0.75 2.667 7.03 1.32 0.588 6.2 1.01 0.75
170 + d3) 115.6 1.07 0.717 9.18 1.39 0.67 5.0 1.03 0.59
160 + t 6) 146.8 1.4 0.44 12.51 1.4 0.551 1.4 0.44
Figure I shows the differential cross sections (at the upper portion) and the analyzing powers
(at the lower portion). The differential cross section illustrated by the solid line is the same as
that reported previously in Ref. 2 obtained by using the standard distorting potential parameters
* Department of Physics, Faculty of Science, Tokyo Metropolitan University.

37
given in Table l. The corresponding analyzing power (solid line) gives a good fit to the observed
value except for the forward angle region less than 30° where the calculated differential cross
section has previously been pointed out to deviate from the experimental data.!) ' 2) The
calculated value decreases with the decrease of the scattering angle from 30° but the observed
value shows an increasing trend.
180 ( p, t ) 160 ( 2 -, 8.88 MeV) Ep = 24.4 MeV
dO"/dQ (pb/ sr)
100
0.4
0,2
0
-0.2
-0.4
-0.6
00
• •
- -- Set 1
- - -- - ---- Set 2
- -- Set 3
Analyzing Power
\
600
1200
8C.M.
Fig. l. Angular distributions of the
differential cross sections and analyzing
powers for the 180 (p, t) 160 (2-, 8.88
MeV) reaction at 24.4 MeV. Parameters
of the distorti ng potential s are given in
Table 1 and those of the spin-orbit part 180
0
are listed in Table 2.
Arbitral changes of the distorting potential parameters have been tested. The parameters of
the spin-orbit potential tested here are given in Table 2 where set I is an original parameter set.
The parameters of the central part are fixed to those gi ven in Table 1. The cross sections
calculated with set 2 and 3 are illustrated by the dashed and dash-dotted curves, respectively. While
the differential cross section is scarcely changed by the change of the spin-orbit potentials, the
change of the spin-orbit potentials gives rather large effects on the analyzing power. A gross
structure of the analyzing power, however, is preserved. It can be concluded that the analyzing
power is determined mainly by the reaction mechanism.
Table 2. Spin-orbit potential parameters.
Set I 6.2 5.0 o
Set 2 o 5.0 o
Set 3 6.2 5.0 2.5
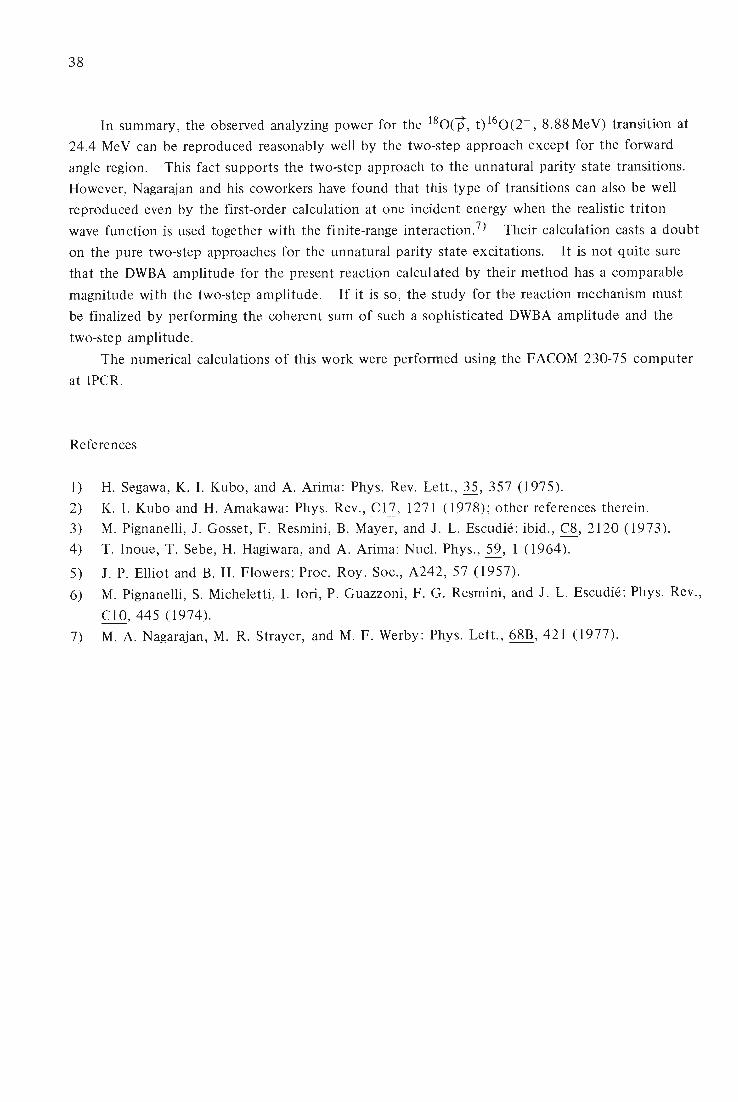
38
In summary, the observed analyzing power for the 180(p, t) 160(2-, 8.88MeV) transition at
24.4 MeV can be reproduced reasonably well by the two-step approach except for the forward
angle region. This fact supports the two-step approach to the unnatural parity state transitions.
However, Nagarajan and his coworkers have found that this type of transitions can also be well
reproduced even by the first-order calculation at one incident energy when the realistic triton
wave function is used together with the finite-range interaction.7) Their calculation casts a doubt
on the pure two-step approaches for the unnatural parity state excitations. It is not quite sure
that the DWBA amplitude for the present reaction calculated by their method has a comparable
magnitude with the two-step amplitude. If it is so, the study for the reaction mechanism must
be finalized by performing the coherent sum of such a sophisticated DWBA amplitude and the
two-step amplitude.
The numerical calculations of this work were performed using the FACOM 230-75 computer
at IPCR.
References
1) H. Segawa, K. 1. Kubo, and A. Arima: Phys. Rev. Lett., 35, 357 (1975).
2) K. 1. Kubo and H. Amakawa: Phys. Rev., C17, 1271 (1978); other references therein.
3) M. Pignanelli, J. Gosset, F. Resmini, B. Mayer, and J. L. Escudie: ibid., C8, 2120 (1973).
4) T. Inoue, T. Sebe, H. Hagiwara, and A. Arima: Nucl. Phys., 59, 1 (1964).
5) J. P. Elliot and B. H. Flowers: Proc. Roy. Soc., A242, 57 (1957).
6) M. Pignanelli, S. Micheletti, 1. lori, P. Guazzoni, F. G. Resmini, and J. L. Escudie: Phys. Rev.,
C 1 0, 445 (1974).
7) M. A. Nagarajan, M. R. Strayer, and M. F. Werby: Phys. Lett., 68B, 421 (1977).

39
4-5. Adiabatic Treatment of Elastic Deuteron-Nucleus Scattering
H. Amakawa, S. Yamaji, A. Mori,* and K. Yazaki**
We calculate the contributions of the d-wave and g-wave breakup channels to the elastic deuteron-58 Ni
scattering as well as the s-wave breakup channel in the framework of the three-body model using the adiabatic
approximation. I) In the three-body model, a deuteron-nucleus scattering system is assumed to consist of a proton,
a neutron and an inert target nucleus. The three-body wave function qr 6, R) satisfies the Schrodinger equation
(1)
where; and R are the relative and the center of mass coordinates of the p-n system with respect to the target,
Hpn = Tr + V pn is t~e ~amiltonian of the p-n relative motion, T R is the kinetic energy operator of the center of
mass motion and V (r, R) is given by the sum of the proton-target and the neutron-target potentials evaluated at
half of the incident energy of the deuteron. We neglect the Coulomb breakup, since its effect is expected to be
small for high energy deuteron. The spin-orbit potential is also neglected to simplify the calculation, and this
effect will be briefly discussed later. If the deuteron incident energy is sufficiently high, we can use the adiabatic
approximation in which the excitation energy of the p-n relative motion is neglected. Then, Eqn. (1) becomes
where Hpn h:s ... been replaced by a constant Ed' which is the binding energy of the deuteron. The total wave
function 'l1 (r, R) is written as
(3)
We solve the coupled equations for Xeu keeping r and J fixed, and obtain the r-dependent t-matrix Tl'L' :£L (r).
The deuteron wave function contains intrinsic d-state as well as s-state. In the absence of the spin-orbit potential,
however, the additional effects due to the intrinsic d-state contribute only incoherently and are expected to give
a minor correction. We therefore consider the intrinsic s-state only.
the breakup effect in the intermediate stage is given by, 1)
Then the elastic t-matrix T which includes
T = f T( r) I ¢d( r) 12r2dr,
T ( r) = ~ (2L + 1) T ~L: OL ( r) P L (cos e), L
where ct>d is the deuteron wave function. The numerical calculation can easily be performed by using the
conventional coupled-channel program with slight modification.
(4 )
We calculate the elastic deuteron scattering from 58Ni target. Optical potential parameters of nucleon-58 Ni
are taken from Refs. 2 and 3 which were obtained by the systematic search. The interaction V (;, R) is
expanded as
(5)
* Numazu Technical College.
** Department of Physics, University of Tokyo.

40
tf 8
0.1
Ed = 80 MeV
--- Adiabatic £. = 0 -+- 2
-- - --- Adiabatic i. = 0
tf "'b
0.1
Ed = 52 MeV
___ Watanabe Adiabatic R. = 0 + 2
0.01
8c.m.
Fig. 1. Elastic cross sections of deuteron- 58Ni
scattering at 80 MeV. Solid and dashed lines
show, respectively, the cross sections obtained
by the adiabatic method with s-wave and d-wave
breakup channels and with s-wave channel only.
Dashed-dot line illustrates the cross section for
the Watanabe potential . The experimental data
are taken from Ref. 6.
Ed = 21.6 MeV
--- Ad iabatic 2. = 0 -+- 2
- - -- -- Ad iabatic £. = 0
--- Watanabe
0.1
0.01
o 90
0.01
- - - - - - Adiabati c £. = 0
- - - Watanabe
8c.m.
Fig. 2. Elastic cross sections of deuteron- 58Ni
scattering at 52 MeV. The experimental data are taken from Ref. 7. See caption to Fig. 1.
Fig. 3. Elastic cross sections of deuteron- 58Ni
scattering at 21.6 MeV. The experimental
data are taken from Ref. 8. See caption to
180 Fig. 1.
o 120

41
and V 0 (r, R), V 2 (r, R)', and V 4 (r, R) are included in the actual calculation. The coupled equations are solved
with d-wave (P = 2) and g-wave (.e= 4) breakup channels as well as s-wave (.e= 0) breakup channel by using the
coupled-channel code CCSEARCH4) with minor modification. The t-matrix is calculated using Eqn. (4). In this
calculation, Hulthen wave function is used for ¢d (r).
Figures 1, 2, and 3 show the calculated and observed elastic cross sections for deuteron scattering from 58Ni
at 80 MeV, 52 MeV, and 21.6 MeV, respectively. In all cases, it is found that the cross sections obtained by the
present adiabatic method are appreciably different from those for the Watanabe potential 5) (folding potential) which
does not contain the effect of deuteron breakup. The effect of the d-wave breakup channel is found to be fairly
large. On the other hand, the effect of the g-wave breakup channel, which is not illustrated in the figures, is very
small. In the case of Ed = 80 MeV, the cross section calculated by the adiabatic method with s-wave and d-wave
breakup channels (solid line) is found to be in good agreement with the experimental data.6) The cross section
obtained by the Watanabe potential (dashed-dot line) is too large except in the forward angle region. Adding the
breakup channels changes the cross section towards the experimental data very nicely.
In the case of Ed = 52 MeV, the cross section obtained by the adiabatic method with s-wave and d-wave
breakup channels gives better agreement with the experimental data 7) than that by the Watanabe potential in the
forward angle region, but gives poorer agreement in the large angle region. The cross section obtained by the
adiabatic method with the s-wave breakup channel only well reproduces the experimental data in the large angle
region, while the inclusion of the d-wave breakup channel gives too much reduction of the cross section in the
neighbourhood of 8 = 60°.
The cross section at 21.6 MeV obtained by the adiabatic method gives fairly good account of the experimental
data8) in the forward (10° < 8 < 40°) and backward (90° < 8 < 140°) angle regions but gives too small cross
section in the region 40° < 8 < 90°. This bombarding energy might be too low to apply the adiabatic
approximation and to neglect the Coulomb breakup.
All of the above results are obtained by neglecting the spin-orbit potential. We include the spin-orbit
potential into Watanabe potential to examine its effect. The inclusion of the spin-orbit potential at 80 MeV is
found to change the cross section slightly in the forward angle region, while the effect seems to become important
at large angles. We therefore expect that the effect of the spin-orbit potential will not be important in the
forward angle region in the present adiabatic treatment.
The numerical calculations of this work were carried out using the FACOM 230-75 computer at IPCR.
References
1) Yu. A. Berezhnoi and E. V. Inopin: Yadern. Fiz.,.§., 1197 (1967); [English Transl., Soviet J. Nucl. Phys.,
.§.,872 (1968)]; N. Austern, C. M. Vincent, and J. P. Farrell, Jr.: Ann. Phys., N. Y., ill, 93 (1978).
2) F. D. Becchetti, Jr. and G. W. Greenlees: Phys. Rev., 182, 1190 (1969).
3) F. G. Perey: ibid., ill, 745 (1963); D. Wilmore and P. E. Hodgson: Nucl. Phys., 55,673 (1964).
4) T. Wada and S. Yamaji: Sci. Papers I. P. C. R., 68, 65 (1974).
5) S. Watanabe: Nucl. Phys.,.§., 484 (1958).
6) G. Duhamel, L. Marcus, H. Langevin-Joliot, J. P. Didelez, P. Narboni, and C. Stephan: ibid., A174, 485
(1971).
7) F. Hinterberger, G. Mairle, U. Schrnidt-Rohr, G. J. Wagner, and P. Turek: ibid., AlII, 265 (1968).
8) J. L. Yntema: Phys. Rev., @' 261 (1959).

42
4-6. Study on Cd, p) Reactions
Number of Steps Which Should be Taken into Account
M. Ichimura, B. Imanishi, and M. Kawai*
Rearrangement collisions are usually analysed by the distorted wave Born approximation
(DWBA). Recently, analyses which take account of two step rearrangement processes have also
been carried out for some specific processes such as eHe, t), (p, t), etc. However, few analyses
which take more steps into account have been performed except that of the infinite steps, namely,
the coupled channel (CC) calculations.
A study was made here as to how many steps should be taken into account in the analyses.
As examples, we analysed (d, p) reactions together with the associated (d, d) and (p, p) scatterings.
The analysis is based on the coupled integro-differential equations derived before1) for the wave
functions , xa(ra ), (a = d, p), of the relative motion of the deuteron- and the proton-channel:
(a, /3=d, p, a*(3),
where the kernel Ka{3 includes the so-called non-orthogonality term as well as the interaction kernel.
A constant A is intentionally introduced to investigate the question. The physical case corresponds
to the case of A = 1.
In order to estimate the number of steps, we solved the coupled equations for several values
of A ( = 0.0 I, 0.1, 0.5, 0.7, 0.9, and 1.0). Then, the obtained S-matrices, Sk(A), are simulated
by a polynomial of A as
If I s~n I decreases rapidly with increasing n, the power n of A may be interpreted as the number
of steps. In particular, n = 0 and I correspond to the optical potential scatterings and one-step
processes (:::::DWBA), respectively. Actual calculations show that the rapid decrease occurs in most
partial waves except for very low ones, for which the concept of steps becomes questionable.
We define the up-to-N-step cross sections a~~) as those calculated by the up-to-N-step S
matrices N
SJ,(N) = ~ SJ,n , aP n aP
and see how they reproduce the results of the full coupled channel calculations, a~C) Numerical analyses have been carried out for reactions (1) 160(d, p) 170(2s) with Q-value (Q)
* Department of Physics, Kyushu University.
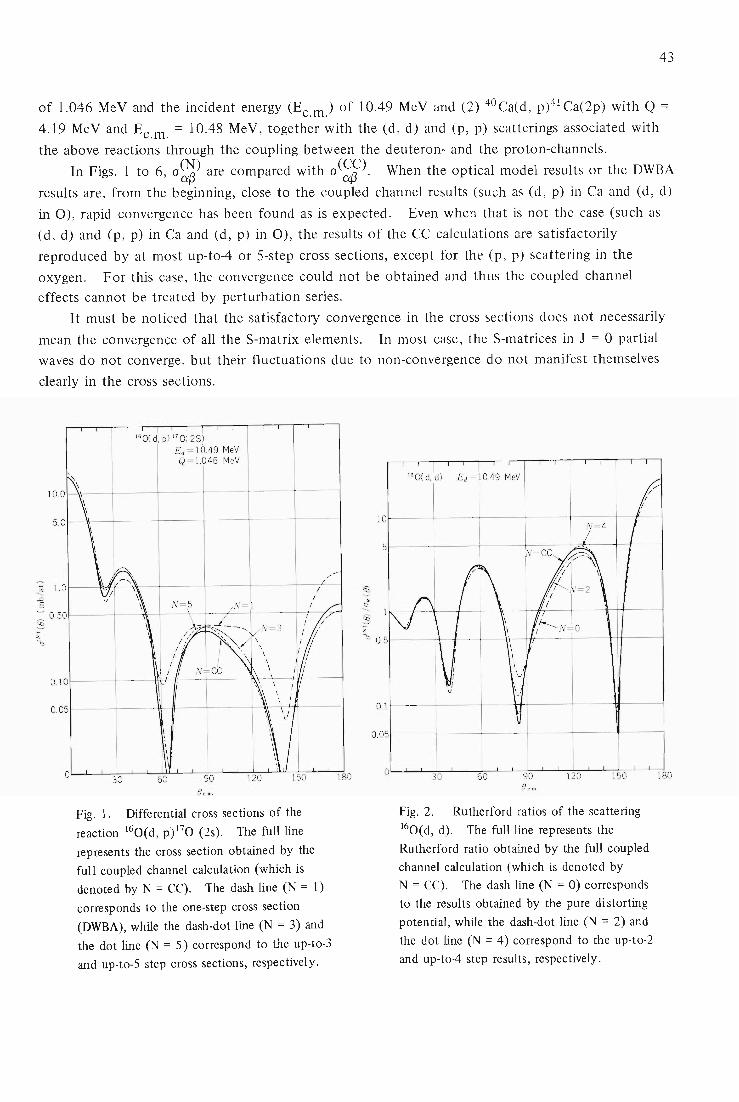
43
of l.046 MeV and the incident energy (Ec.m ) of 10.49 MeV and (2) 4oCa(d, p)'-;lCa(2p) with Q =
4.19 MeV and Ec.m. = 10.48 MeV, together with the (d, d) and (p, p) scatterings associated with
the above reactions through the coupling between the deuteron- and the proton-channels.
In Figs. 1 to 6, a~) are compared with a(~) When the optical model results or the DWBA
results are, from the beginning, close to the coupled channel results (such as (d , p) in Ca and (d, d)
in 0), rapid convergence has been found as is expected. Even when that is not the case (such as
(d, d) and (p, p) in Ca and (d, p) in 0), the results of the CC calculations are satisfactorily
reproduced by at most up-to-4 or 5-step cross sections, except for the (p, p) scattering in the
oxygen. For this case, the convergence could not be obtained and thus the coupled channel
effects cannot be treated by perturbation series.
It must be noticed that the satisfactory convergence in the cross sections does not necessarily
mean the convergence of all the S-matrix elements. In most case, the S-matrices in J = 0 partial
waves do not converge, but their fluctuations due to non-convergence do not manifest themselves
clearly in the cross sections.
1o,o 1-----4\--1-----1--- +----+-----j
5 0 ~-\\---t---1----t---t----t------j
0,101--- - 1-----1
o 051---l----\11-----l1-----1-----t~----T---Y+-------1
Dc, m,
Fig. 1. Differential cross sections of the
reaction 160(d, p) 170 (2s). The full line
represents the cross section obtained by the
full coupled channel calculation (which is
denoted by N = CC). The dash line (N = 1)
corresponds to the one-step cross section
(DWBA), while the dash-dot line (N = 3) and
the dot line (N = 5) correspond to the up-to-3
and up-to-5 step cross sections, respectively.
160( d, d) J:'d = 10.49 MeV
0.1 1---l----l--- -H-I1---- ---I-- ----Ht--- -t
0L-L-~3~0~~~6~0~~~9~0 ~~~12=0~~1~5~0~~180
Bc.m
Fig. 2. Rutherford ratios of the scattering
160( d, d). The full line represents the
Rutherford ratio obtained by the full coupled
channel calculation (which is denoted by
N = CC). The dash line (N = 0) corresponds
to the results obtained by the pure distorting
potential , while the dash-dot line (N = 2) and
the dot line (N = 4) correspond to the up-to-2
and up-t04 step results, respectively.

44
CD
'" b ........
~ b
Q:;
170(p, p) Ep=1l.54 MeV
100~----+-----~-----+------4------~~-/~/
10
1.0
N=O /
/
0~~~3~0~~~50~~~9~0-L-L-1~20~~-1~5-0~-L~180
Bc_m.
Fig. 3. Rutherford ratios of the scattering
l70(p, p). For details, see the caption of
Fig. 2.
.Dca! d, d) I l 1 1
Ed = 10.48 MeV
5.0
1\ '=4
N=2 N=CC
~ l.0 Q; ~ p, /
\; )
~ ~
~ / ~ -~ I
~ 0.5 -b
0.1
o
...- - , ~/ .~ // ~
/ .... / \ / \
\ \ /
' ''\ \ / \ /
N=O \ / ,~ /
30 50 90 120 150 Bc _m .
Fig. 5. Rutherford ratios of the scattering
40Ca (d , d). For details, see the caption of
Fig. 2.
Reference
180
10_0
5.0
Ul l. 0
........ .D
~ 0_5 CD
~ ~b
0. 1
005
o
I 4DCa( d, p),.l Ca ( 2p )
Ed = 10.48 MeV __ ---- --- -
/\ Q=4.19 MeV
V \ 1\, /;-~
~ ~~ N~CC ~ I/N= 1
N=5
" , /.J. ...-\ -~ "- / / ;:.:? \# 1\, / '/
' -" / N=~ \v 1/
30 50 120 150 180
Fig. 4. Cross sections of the reaction 40Ca
(d, p)41Ca (2p). For details, see the caption
of Fig. 1.
10_ Ol-------+------!-------I------+-------I--------I N=4
5. 0 I-------+------j-------I--------+-------I--~~
~ 0 50 I------+-------+------'~-+J~~"'--'+__Ii'__\___\_-llf,__------l ~
- b
O. 10 f-------+------j-----l--l#+------+----.;...H--------I
0_ 05 f-------+------j----+--H------+-------tt--+------l
Fig. 6. Rutherford ratios of the scattering
41Ca (p, p). For details, see the caption of
Fig. 2.
1) T. Ohmura, B. Imanishi, M. Ichimura, and M. Kawai: Progr. Theor. Phys., 11, 391 (1969).

45
4-7. Quasimolecular Resonance by the 24 Mg (a, 12C)160 Reaction
F. Soga, J . Schimizu, N. Takahashi, K. Takimoto,
R. Wada, T. Wada, T. Fujisawa, and H. Kamitsubo
Resonances in the 12C+160 system were studied with the 24Mg(~, 12C)160 reaction together
with the elastic and inelastic scattering of alpha particles on 24Mg nuclei.
The alpha-beam accelerated by the cyclotron was used. The 12C ion was detected and
identified with a 6E-E counter telescope of 6.8 JIm and 30 JIm Si detectors. The alpha
particles were detected with four independent Si detectors at different scattering angles.
The measured excitation function of the 24 Mg(~, 12C)160 reaction is shown in Fig. 1, in
which the open circles are the data obtained at IPCR and the closed circles are those obtained
at INS. Data on the elastic and inelastic scattering of alpha particles from 24Mg nucleus are
shown in Fig. 2. In Fig. 1, two peaks are seen at E~ = 22.77 MeV and E~ = 23.90 MeV,
which correspond to 12.73 MeV and 13.7 MeV in the 12C+160 system, respectively. The angular
distribution of the 24Mg(a, 12C)160 reaction at Ea = 22.77 MeV is shown in Fig. 3. The solid
line is the result of Legendre polinomials fit, where the differential cross sections were fitted with
the formula ~LaLPL(cos 6). In this analysis aL=14 has the maximum value. The dashed line
is the curve of 1 P7 (cos 6 ) 12 which shows good agreement with the experimental values with
regard to the peaks and the dips. The dotted line is the result of Hauser-Feshbach calculation
which can be considered as an estimation of the background reaction. Comparing these three
calculated lines with the experimental values, the spin-parity of the resonance at Ea = 22.77 MeV can
5.0 -
2.0-
• + .. • •• 1.0 - ••• • - - - - -.- - --... . --- ----... - .. - --
O~--------------------~ 4.0 r--
3.0 r--
2.0 -
1.0 -
Fig. 1. Experimental excitation function for the
reaction 24Mg (a , 12C)160. Open circles are data
obtained at IPCR and closed circles are those obtained
at INS. Dotted curve is Hauser-Feshbach calculation
using probable values for the parameters.
-
-

46
5
4
3
2
I
••
•••• Ot--.....L.......------L------L..~
L (f)
"""'-.0 10 E 5
~ u """'-b u
10 5
I 0.5
24 24 Mg(a,ao.l ) Mg
23 24 Ea (MeV)
Fig. 2. Experimental excitation
functions for elastic and inelastic
scattering of alpha particles from
24Mg at several backward angles.
Lines are drawn only to guide the
eye.
Ea = 22.77 MeV 12 16
Ec.M( C+ 0)= 12.73MeV
c; -0 """'-b -I
U 10
20 40 60 80 SC.M .
Fig. 3. Angular distribution for 24Mg (0:,
12C)160 at Eo: = 22.77 MeV. Solid curve
100
is Legendre polinomial expansion fit; dashed
curve is square of the Legendre polynomial of
order 7 and dotted curve is Hauser-Feshbach
calculation.
be clearly determined to be 7 -. The spin-parity of Eo: = 23.90 MeV resonance was found to be
8 + by the members of our group.1)
The correlation between the 0: + 24Mg channel and the 12C + 160 channel is clearly seen in the
excitation function as is shown in Fig. 2. At Eo: = 22.77 MeV which corresponds to the peak
of the 12C + 160 channel, the a + 24Mg elastic scattering shows deep minimum. This fact suggests
that there is a relation between the backward angle anomaly phenomena in the 0:+ 24Mg elastic
scattering and the molecular resonance in the 12C + 160 system.

47
4-8. Reformulation of DWBA Form Factor
for Heavy Ion Transfer Reactions *
T. Tamura, T. Udagawa,** and H. Amakawa
A great number of exact finite range DWBA (EFR-DWBA) calculations have been made for
transfer reactions induced by heavy ions. Most of these were based on the formulation of Austern
et al.l) This formulation becomes somewhat clumsy, however, when applied to transfer reactions
with a large transferred angular momentum I. (Throughout the present article , we use the notation
of Ref. 2.) The value of the factor sIAl t 1 Al s2 A2 t 2 A2 , which appears in the summand in the
expression for the finite-range form factor (Eqn. (4· 10) of Ref. 2) gets very large and a drastic
cancellation must follow. 3) This can result in serious numerical error, unless great care is exercised
about the numerical calculations. However, EFR-DWBA calculations with large 1 values are in fact
needed , e.g., in tpe direct reaction approach to quasi- and deep-inelastic scattering4) and in
calculation of the dynamical polarization effect for transfer reactions.5 ) Therefore , it is desirable
to reformulate the calculation of the EFR-DWBA form factor so that the above difficulty is
avoided. We do this reformulation in the following.
The definition of the form factor is
(1)
as given in Eqn. (4· 5) of Ref. 2. We transform from the coordinate system of Ref. 2 in which
zilka' to a new system in which Pb = Z' and all the vectors r a' rb' r 1 ' and r 2 lie in the x-z plane.
Then
Similarly
[Yr, (i\)Yl'z (r 2 )]~ r= ~ Y f,m,'( ( 10) X Yrzmz'( ( 2 0)(1\ m~ e2m; I f n r" ) m , 'm 2'n r"
* Supported in part by the U. S. Department of Energy.
** Department of Physics, University of Texas at Austin.
X ( _ )f+nr"D (* m ( - n p" • (3)

48
This choice of the coordinate system is very similar to that adopted in Ref. 6, which described a
DWBA calculation made in terms of the WKB approximation. Inserting (2) and (3) into (1) , we
obtain
(4)
In Eqn. (4)
and (i = 1, 2)
Al Al A2 A2 . Equation (4) is free from the large factor sIt I S2 t 2 and thus from dangerous cancellatIons.
An apparent disadvantage is the fact that summations over the magnetic quantum numbers m l ' m 2 ,
and mf remain, making the evaluation of Eqn. (4) rather time consuming. Actually, however, the
range of the integration over cos 8 in (4) is limited to the extreme near neighborhood of cos 8 = 1.2) This makes the factor P eamf (8) very small unless m i = 0 (and possibly mf = 1). Therefore ,
the summation over mf is in practice absent, and those over m 1 and m 2 are very much restricted.
In order to get some feeling for the merit of using the new algorithm of Eqn. (4) over the
use of the old version of Eqn. (4-10) of Ref. 2, we performed calculations for the case of the
208Pbe2C, 13C)207Pb (i13/2) reaction, which has I = 7. The FACOM 230-75 computer at IPCR
was used , which had 36 bit words. It was found that with the old version (Eqn. (4-10)), double
precision had to be used throughout: Calculation with single precision gave results which were
meaninglessly poor. On the other hand , with the new version , calculations with single precision
gave results which agreed with the double-precision results to within four significant figures. As
for running time, it took 81 sec to perform a calculation (up to fa = 90) with the old version and
with double precision. The corresponding time was reduced to 12 sec when the new version was
used with single precision and with mf = 0 and 1. The merit of using the new version is evident.
Delic et al. S) reported that they needed double precision on a CDC7600 computer which had
60 bit words. With our new version , single precision would have been sufficient. The
computational time they needed ( ~ 3 h ) would also have been reduced drastically.
Recently , several authors emphasized the merit of using a Gaussian expansion of various radial
wave functions involved in DWBA and coupled-channel calculations.7) This method might in
general be more powerful than what has been in general use in the past ,l) ,2) thus making even our
new formulation given above unnecessary. However, it seems that the possibility of performing a
Gaussian expansion of the distorted waves that appear in the case of heavy-ion reactions yet
remains to be investigated carefully. We therefore feel it is worthwhile to report on the new
formulation given here.

References
1) N. Austern, R. M. Drisco, E. C. Halbert, and G. R. Satchler: Phys. Rev., 133 , B3 (1964).
2) T. Tamura: Phys. Reports, l4C, 59 (1974).
3) K. S. Low and T. Tamura: Phys. Rev. , Cll, 789 (1975).
4) T. Udagawa, B. T. Kim, and T. Tamura: Proc. IPCR Symp. on Macroscopic Features of
Heavy-Ion Collisions and Pre-Equilibrium Proc~ss, Hakone, p. 3 (1977).
5) G. Delic, K. Pruess, L. A. Charlton, and N. K. Glendening: Phys. Letters, 69B, 20 (1977).
49
6) S. Landowne, C. H. Dasso, B. S. Nilsson, R. A. Broglia, and Aa. Winther: Nucl. Phys., A259,
99 (1976).
7) G. L. Payne and R. R. Carlson: Phys. Rev., C12, 1260 (1975);
M. Kawai, M. Kamimura, Y. Mito, and K. Takesako: Progr. Theor. Phys., 59, 674, 676 (1978).

50
4-9. Calculation of Friction Force, Inertia Tensor and
Potential Energy for the System 2°Ne + 28Si
Based on the Linear Response Theory
S. Yamaji, K. Sato, S. Yoshida,* and K. Harada**
We calculate the frictional coefficients, inertia tensors and potential for the system 20Ne + 28Si
in the coupled equations of motion derived from the linear response theory.1) We adopt a
two-center harmonic oscillator Hamiltonian H in which the relative distance R and the deformations
0(01
= O2 ) of two fragments appear as parameters. 2)
For the frictional coefficients 'Y IlV (11 = R or 0), the microscopic expressions were given in our
previous work3) in which, subtraction of a term arising due to a simple translation of two centers
of the potential from the quantity aH/aR was made in order to eliminate the spurious energy
dissipation at sufficiently large distance.
In the present work, we propose tentatively another way to eliminate this spurious energy
dissipation. We assume that the expression for the frictional coefficients 'Y IlV
given by the linear
response theoryl) is available without any subtraction when two fragments overlap. Even when
the fragments do not touch, there must be a tail region where the conservative forces are
signi ficant. The range of the tail region may be considered to be twice the diffuseness parameter
and is taken to be 2 fm in the present calculation. When the two surfaces including the tail region
overlap, we assume that frictions can still be obtained, modifying the expression for 'Yllv1) in the
following way. In the calculation of matrix elements of aH/aR with eigenfunctions of H, the
system is described in cylindrical coordinates, where the z-axis is taken to be the symmetric axis of
the system. The integration over the variable z is restricted within the two crossing points between
the z-axis and the surface of the overlapping region. When there is no overlapping between the
tail regions, the frictional coefficients 'YRR and 'YR5 vanish. The typical contour maps on the
R-o plane are shown in Fig. 1.
For the inertias m llV' the linear response theory gives the expression which corresponds to the
cranking formula with finite temperature. The inertias thus calculated, however, change very
rapidly with the change of variables Rand 0 due to their strong sensitivity to the single particle
level structure. Therefore, we approximately replace those extended cranking inertias with
hydrodynamical ones obtained by the use of the Werner-Wheeler method.4) The results are shown in Fig. 2.
For the potential energy, we use the sum of the extended liquid-drop energy5) and the shell
correction energy which includes the dependence of the nuclear temperature. 6) The extended
liquid-drop energy is the sum of the Coulomb energy and nuclear macroscopic energy which is
N Z } ~J (I r-r' 1 e-1r- r'l/a given by - as/(87r2a4fo2) { 1 - Ks( A- )2 - 2) -+ -+,
a 1 f-r I/a dr dr',
* Tohoku University.
* * Japan Atomic Energy Research Institute.
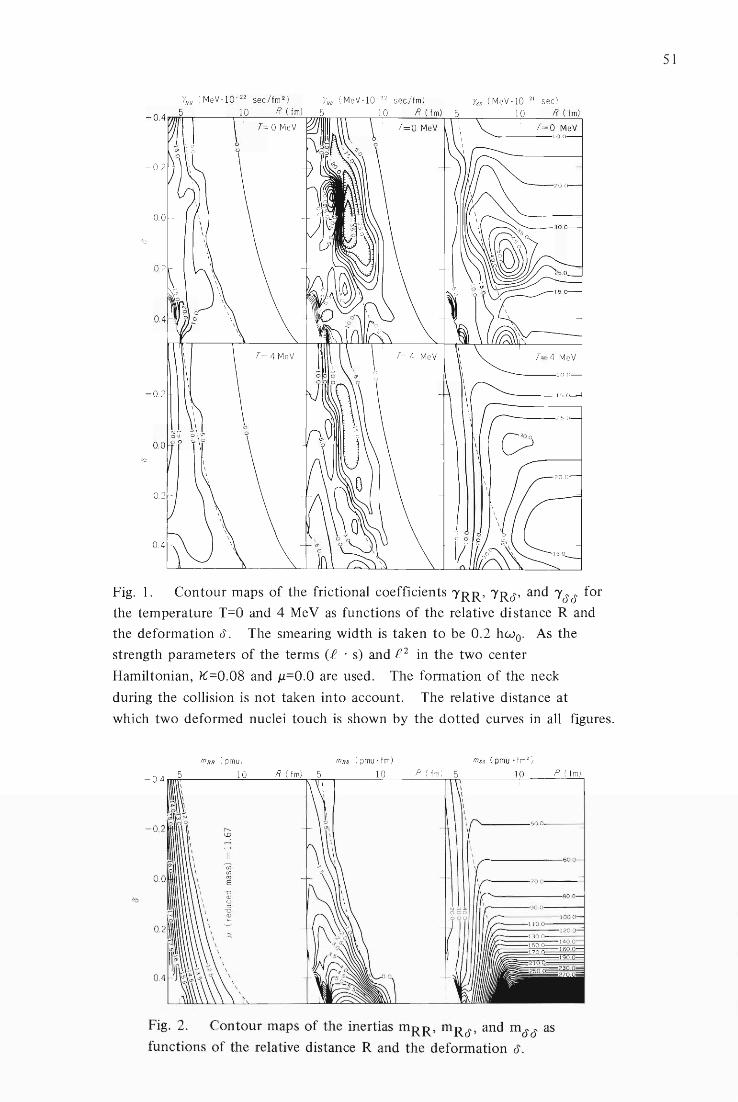
Iss (MeV .10 - 21 sec ) 10 R (1m)
T= O MeV ~---10 .0
0.0
T= 4 MeV
----10
~---15 . 0
----25.0
0.4
Fig. 1. Contour maps of the frictional coefficients 'YRR' 'YRo' and 1'00 for
the temperature T=O and 4 MeV as functions of the relative distance Rand
the deformation o . The smearing width is taken to be 0.2 hwo. As the
strength parameters of the terms (£ . s) and £ 2 in the two center
Hamiltonian, }{=0.08 and J.L=O.O are used. The formation of the neck
during the collision is not taken into account. The relative distance at
which two deformed nuclei touch is shown by the dotted curves in all figures.
m RS (pmu ' 1m)
-0.4
-0.2
0.0
0.2
0.4
Fig. 2. Contour maps of the inertias mRR' mRo ' and moo as
functions of the relative distance R and the deformation o.
51

52
Fig. 3. Contour maps of the potential V for the temperature T=O, 4,
and 6 Me V as functions of the relative distance R and the deformation
8. The order and smoothing range of the shell correction energy are
taken to be 6 and 1.1 hwo, respectively.
where ro = 1.18 fm, a = 0.65 fm, as = 21.7 MeV, and Ks = 3.0. N, Z, and A are numbers of
neutrons, protons, and nucleons, respectively. The potential energy is adjusted to vanish at
sufficiently large distances (R -+ 00) by adding a constant value. The contour maps of the
potential for the temperature T = 0, 4, and 6 MeV are shown in Fig. 3. The map for T = 4
MeV has a structure similar to that for T = 6 MeV which is almost identical to that for the
extended liquid-drop energy. Thus, the shell correction energy is considered to be negligible at
T = 4 MeV.
References
1) H. Hofmann and P. J. Siemens: Nucl. Phys., A257, 165 (1976).
2) A. Iwamoto, S. Yamaji, S. Suekane, and K. Harada: Progr. Theor. Phys., 55, 115 (1976).
3) K. Sato, A. Iwamoto, K. Harada, S. Yamaji, and S. Yoshida: Z. Physik A , 288, 383 (1978).
4) K.T.R. Davies, A.J. Sierk, and J.R. Nix: Phys. Rev., C13, 2385 (1976).
5) H.J. Krappe, J.R. Nix, and A.J. Sierk: Preprint LA-UR-78-2289, submitted to Phys. Rev. Lett.
6) A.S. Jensen and J. Damgaard: Nucl. Phys., A203, 578 (1973).

53
4-10. Analysis of the, Heavy Ion Reaction 2°Ne + 28Si Based
on the Linear Response Theory
S. Yamaji, K. Sato, S. Yoshida,* and K. Harada**
When classical approximation is introduced, the linear response theoryl) gives coupled
dynamical equations of motion for the relative distance R and the deformations 8(8 1 = 82 ) of two
fragments as
The frictional coefficients "'( J.lV' inertias mJ.lV and potential energy V are calculated in Ref. 2. We
adopt the centrifugal potential Vg = h2g2 12J1R 2, where J.l is the reduced mass.
In order to determine the time dependence of the nuclear temperature T(t) of the system,
we assume that the following relation holds3)
T(t) = V E(t)* I (A/20) ,
where A is the number of nucleons of the system. The nuclear internal exci tation energy E(t)*
resulting from the friction is calculated by
For the relative distance R 2 15 fm, we use a pure Coulomb trajectory determined by the
incident energy and the angular momentum g. The numerical integration of the coupled
equations is started at the relative distance of R = 15 fm with the relative velocity R obtained by
the pure Coulomb trajectory at the distance of R = 15 fm. The deformation 8 and its velocity 8
are kept zero until two fragments come close to 15 fm.
We have performed a numerical calculation for the collision of 120 MeV 20Ne on 28Si.
Several trajectories for various g values on the R-8 plane are shown in Fig.l to illustrate the
development of the deformation. Collisions with small g values lead to fusion. For all g values
large oblate deformation of both nucl ei is seen in the early stage of the reaction. It occurs
* Department of Physics, Tohoku University.
** Japan Atomic Energy Research Institute.

54
-0.2 2° Ne + 28 Si EL = 120MeV
t;, T=3 MeV
o T=4MeV
15
Fig. 1. Several trajectories for various relative angular momentum P illustrated for the
system 20Ne + 28Si at EL = 120 MeV on the R-8 plane. The temperatures during the
collision are 1 MeV(x), 2 MeV(O), 3 MeV(L), and 4 MeV(o).
because the effect of the coupling term 'YR8R in the surface region dominates over that of the
conservative force . As mentioned in Ref. 2, use of hydrodynamical inertias instead of extended
cranking ones may be somewhat responsible for the behavior of the deforming motion obtained.
If we have a large negative mR8 in the surface region, the term mR8'YRR R in the coupled
equations will prevent the development of the oblate deformation in the early stage of the collision.
N atowitz et al. 4) assumed in their analysis of the collision of 120 Me V 20Ne on 27 Al that the
system may be represented by a nuclear molecule in rigid rotation with the relative distance 10.2
fm which corresponds to the prolate deformation of 8'V0.45. Our calculation gives the prolate
deformation of 8'V0.35 in the neighbourhood of the scission point. This is consistent with the
above estimation.
The deflection function and energy loss versus angular momentum are shown in Fig. 2.
We have found that the value of the critical angular momentum is smaller than the value of
P cr = 34 deduced from the experiment. 4) This discrepancy can be reduced by making the
moment of inertia larger than J1R2. We define the heavily damped collision as the collision with
the negative scattering angle. We obtain the energy dissipation of about 30'V40 MeV which is in
good agreement with the experimental result.4)
The angular distribution is shown in Fig. 3. The calculated cross sections should be compared
with the sum of various elements by eliminating the quasi-elastic component of the collision. The
calculated angular distribution reproduces qualitatively the decreasing behavior of the experiment
with the increasing angle. If the quasi-elastic component which is large in the forward angle [cf.
Fig. 8 of Ref. 4] is subtracted from the experimental cross section in Fig. 3, the agreement between
them becomes better. However, the calculated cross section is, at least, by one order of
magnitude smaller than the experimental one.
In order to investigate an effect of the shell correction on the deflection function, energy loss
and cross section, quantities obtained only by the liquid-drop model energy are shown by the

o 30 35
no -50
~
-100
- 150
---- ( Liqu id drop energy )
t ( h) 0
10
20
>
30 ! *=..tl
40
50
60
-- ( Liquid drop energy ) + (Shell 70
55
10'
103 ~--- Na+Mg
~ ------0 E ~-...;:::::-""'"""::::"----- C+ CI
Q::, ~
'" b ~
102
-- Expe ri men tal re sul t s fr om 2°Ne+27AI E L =120MeV
--- ( Liquid drop energy)
-- (L iquid drop energy ) +(Shell cor rection energy )
cor recti on energy ) 1 01~_~:::--_~;:--_---7;~_~~_~;:;--_~:;--_---' o 20 40 60
Fig. 2. The deflection function f) and
the energy dissipation E * for the system
20Ne + 28Si at EL = 120 MeV plotted
versus the relative angular momentum £.
The dotted lines correspond to those of
the liquid-drop energy.
e ( deg)
Fig. 3. The cal culated cross sections ~e plotted for the system 20Ne + 28Si at EL = 120 MeV. The dotted line corresponds to
that of the liquid-drop energy. The thin
curves are taken from the experimental data.4 )
dotted curves in Figs.2 and 3. Since in the early stage of the collision the temperature increases
very rapidly up to the value at which the shell effect is negligible, neglecting the shell correction
energy does not give an appreciable effect to the results as shown in Figs.2 and 3.
The detail of this work is given elsewhere. 5)
References
1) H. Hofmann and P. 1. Siemens: Nucl. Physics, A257, 165 (1976).
2) S. Yamaji, K. Sato, S. Yoshida, and K. Harada: IPCR Cyclotron Progr. Rep., 11, 50 (1978).
3) P. Fong: Statistical theory of Nuclear fission, Gorden and Breach Press, p. 16 (1969).
4) 1. B. N~towitz, M. N. Namboodiri, R. Eggers, P. Gonthier, K. Geoffroy, R. Hanus, C. Twosley,
and K. Das: Nucl. Physics, A277, 477 (1977).
5) K. Sato, S. Yamaji, K. Harada, and S. Yoshida: Preprint of Tohoku University submitted to
Z. Physik A.

56
4-11. Preequilibrium Emission of light Particles in the
181Ta+ 14N Reaction at 85 and 115 MeV
H. Utsunomiya, T. Nomura, T. Inamura,
T. S ugi ta te, and J. Schimizu
It is well known that in heavy-ion collisions at energies well above the Coulomb barrier,
typically at 7 - 10 MeV /amu, ~ particles are emitted predominantly in the forward direction with
large probability.1) We have shown in the 209Bi + 14N reaction2) that the same phenomenon is
significant even at lower bombarding energies and that the projectile and target nuclei fuse
together after emitting ~ particles. Moreover, the energy spectra obserbed were shown to be well
reproduced by the statistical formula of Ericson3) with nuclear temperature decreasing
monotonically with increasing emission angles. Therefore, the above phenomenon can be
interpreted as evaporation of ~ particles from a locally heated nuclear system (hot spot) proposed
for preequilibrium phenomena by Weiner and Westrom~)
If the hot-spot interpretation is valid for the above phenomena, the similar features should be
expected in energy and angular distributions for other light particles like protons, for which the
cross sections turned out to be too small to be clearly measured in the 209Bi + 14N reaction. As
the extension of the previous work we have studied the 181Ta + 14N reaction, in which efforts were
made to measure protons, deuterons and tritons as well as ~ particles. Light particles emitted from
14N-bombardment of a self-supporting 181Ta target of about 4 mg/cm2 thickness were detected
with Si flE-E counter telescopes in a similar way as was described previously. 3)
Figures I , 2 show the measured angular and energy distributions. The angular distributions
for ~ particles were strongly forward-peaked, while those for protons were less forward-peaked even
1~
... . . 9 9 ¢
18ITa+"N
¢ ¢
• d I o P 115 MeV
o d
6. t
x P} 85 MeV .. a
-
t ¢ 0·0 -
t t t t t t • Il .0. o •• 0· ~
6. 0 0.
I
30
0. X X 0. o
x x IT' 0. oX x x x x
o 0
I I 60 90 120
8, .•. (degrees)
.. x
I 150
-
180
Fig. 1. Angular distributions of protons,
deuterons, tritons and ~ particles measured in
the 181Ta + 14N reaction at Elab = 115 MeV
and those of protons and ~ particles at Elab =
85 MeV. (Deuterons and tritons could not be
measured at 85 MeV due to their very small
cross sections.)

Ul
C ::J o U
:::-
f-
::-
r-
C-
o
181 Ta + 14 N( 85 MeV)
Proton
" tt" .... tt
.' " • 62.8· \ II II Ii
'+tt. l' 1'1,
/838· II' I
,.' .. II
I " " t , " 11
! 122 8· ' 1\ ,t . +
1 t dll
{, .... 1 (' .,\. III
,: \ / 151 r)' II I l( I 1\
I~
)
3 10
2 ,.--.. 10 >
(!.o
2:
Ul
"-.D
2;, 10
W -0 c::: -0
"- 2 Nb10
-0
L-
Ul ....... .D ::L
W -0 c::: 3 ~ 1 0
",b -0
x c
l81 Ta + 14N
115 MeV
I I 10
1 UL~~~~~~~~~f- 1 0~~UL~~~~~~~~~~~~
o 10 20 30 40 0 10 20 30 40 50 £;m ( MeV )
Ecm (MeV) Ecm (MeV)
Fig. 2. Examples of the measured energy spectra of protons, deuterons, tritons
and a particles observed in the 181Ta + 14N reaction at Elab = 115 MeV together
with those of protons measured at Elab = 85 Me V. Solid curves for p, d, t, and
a spectra show X2 -fit by the statistical formula given in Ref. 2, 3, where the
inverse cross sections were calculated from optical potentials for corresponding
particles.
60
at 115 MeV and almost flat at 85 MeV. These facts indicate that a particles are mainly emitted
in the preequilibrium process , while the compound reaction is more responsible for the proton
emission.
57
The energy spectra depend strongly , in general, on the observed angle as shown in Fig. 2,
except for the case of protons at 85 Me V, being consistent with the above mentioned interpretation.
A common feature of the energy spectra is a long exponential tail extending to high energies.
This feature is characteristic of "evaporation spectrum" with high nuclear temperature. In fact,
the statistical formula 3) yielded good fit to the observed spectra in all cases, when the nuclear
temperature T was assumed to depend on the emission angle and was treated as a free parameter
in a similar way as was described previously. 2)
Values of T obtained in the above fit are plotted versus the emission angle in Fig. 3. In the
case of 115 MeV, the resultant T values for d, t, and a are nearly equal to each other when
compared at the same angle , while the temperature for protons is slightly smaller at forward angles.
This is made more evident by the data at 85 MeV, where the nuclear temperature for p is almost
constant, indicating the dominant contribution of compound reaction to the proton emission as
mentioned before.

58
7 0 ,-----_~30"-------'6T'_0-____=T90"-------=-lr2 0'------____.:..:;1 5!."'-0 _~180
181 Ta +14 N ( 115 MeV)
601- l:> t r i ton
.. deuteron
501-
;;
T~~ 1.81 t ~ II ~ ~~T-~~~~~~~~-~~~~~~
~ 4.0
3.0f-
201-
1.0 Te~= l77
• a 0 P 11 5MeV
.. a '" P 85MeV
1.01- -
I I 0~~~30~~6~O~~90~~1+20~~15~O~~180
Bc.m. ( degre es)
References
Fig. 3. Nuclear temperature obtained
in the X2 -fit (see Fig. 2) versus the
emission angle . Dashed lines show the
equilibrium nuclear temperature of
residual nuclei produced after emitting
various light particles.
1) H.C. Britt and A.R. Quinton: Phys. Rev. , 124, 877 (1961).
2) T. Nomura, H. Utsunomiya, T. Motobayashi, T . Inamura, and M. Yanokura: Phys. Rev. Lett.,
40, 694 (1978) .
3) T. Ericson : Advan. Phys. , 2, 425 (1960) .
4) R. Weiner and M. Westrom: Nucl. Phys., A286 , 282 (1977).

59
4-12. Preequilibrium a Emission in 14N-lnduced Reactions
The Most Probable Energies and Angular Distributions
H. Utsunomiya, T. Nomura, and T. Sugitate
It is well known that Q particles are emitted with large probability in heavy-ion collisions at
the bombarding energy well above the Coulomb barrier. This phenomenon is often called "direct"
or "fast" a emission since its angular distribution is strongly forward-peaked and its energy
spectrum contains significant high-energy components. However, the reaction mechanism involved
is not well known although several authors have suggested possible origins for such Q emission like
projectile break-up , sequential decay from an exited projectile , effects of radial friction, massive
transfer and preequilibrium decay.
We have studied the systematical trend of energy and angular distributions of "fast" Q
emission with a hope that these will give important information on the origin of the relevant
phenomenon. Self-supporting 209Bi, 197 Au , 181Ta, 169Tm, and 159Tb targets of 2-3 mg/cm2
thickness were bombarded with 14N beam at 85, 95, and 115 MeV from the cyclotron. Charged
particles with Z ~ 8 w"ere detected with conventional Si 6E-E counter telescopes and measured
from 150 to 1650 in step of 100 in most cases .
Characteristic features of the measured energy and angular distributions of "fast" Q particles
were the same as described in the preceeding report!) in the case of 181 Ta + 14 N reaction. Namely,
the energy spectra were of evaporation type even at forward angles, being well reproduced by the
statistical evaporation formula with high nuclear temperature; the angular distributions turned out
to be forward-peaked in all cases.
1) The most probable energies
The present results on the energy spectra are consistent with the preequilibrium-decay
interpretation for the relevant phenomenon. In particular, we will describe the systematical trend
of the most probable energies (Emp)' The observed values of Emp in the 209 Bi + 14 N reaction at
various incident energies are shown in Fig. 1. The kinetic energy corresponding to the incident
projectile velocity (Einc) in also given by dashed lines. The values of Emp are close to the
Coulomb barrier in the exit channel at backward angles and increase monotonically with decreasing
angles. For the data at 85 MeV, the Emp values become larger than Ei~c at forward angles , but
in the case of the 115 MeV data the Emp values are considerably smaller than the corresponding
Einc even at forward angles. Emp also turned out to be strongly target-dependent; in the case
of the 159Tb target the Emp values are by about 3 MeV smaller than those in the 209 Bi + 14 N
reaction at the same angles as shown in Fig.!. This difference is roughly equal to the Coulomb
barrier difference in the two exit channels.
These facts indicate that the Coulomb barrier in the exit channel is a dominant factor to
determine the most probable energy. The increase of Emp with decreasing angles can be well
explained by angle-dependent nuclear temperature T( (J ) (see Ref. 1) which was found to increase
monotonically with decreasing angles in all cases.
The above fact is also consistent with the cases for other light particles. Since angular

60
30~------------------------~ ~
1------115 MeV--------------
28 ~ ~ 209Bi+14N A 115 MeV ~ • 95 MeV :; ..
;126 - 0 85 MeV
>- _ AAI/1.A £ 1~9Tb + 14N
~ All 115 MeV w ffi24 =.--95MeV~---------------
~
~ : Il 0:: rOO.
22 ~ £.... A A A ... • • A
-- 85 Met}-----------A ----... 00 •
• o •••
20~ ... • • • 11/lllllllllllf II II! I/i II! I~/I /;1// ~ Coulomb Barrier ..................... oA
~
II~
o I
30 • 1 I • I I I I
60 80 120 9cMlDegrees)
1150 110
Fig. 1. The most probable energies
(Emp) of a-particle spectra versus
emission angles in the 209Bi + 14N reaction
at 85, 95, and 115 MeV. The kinetic
energy corresponding to the initial
projectile velocity is shown by a dashed
line for each incident energy. The Emp
values in the 159Tb + 14N reaction at
115 MeV are also given for comparison.
distributions for protons, deuterons, tritons, and a particles turned out to be similar to each other
as described in Ref. 1, it is natural to think that the same reaction mechanism is mainly responsible
for the emission of these particles. If the Emp value is determined by the incident energy, then
Emp should be roughly proportional to the mass of particle; for example, Emp for tri ton must be
three times as large as that for proton. The observed values for p, d, and t are, however, roughly
the same even at forward angles (see Ref. I), being close to the Coulomb barrier in the exit channel.
2) Angular distributions
We shall show here that the forward-peaked angular distribution of "fast" a emission can also
be expected from the preequilibrium-decay interpretation. For this purpose, we take a simple
model in which the a emission of interest occurs from a "hot spot" sitting on the surface of the
rotating target-nucleus (see Ref. 2).
The energy-integrated emission probability per unit time, Pi' of a particle i from a hot spot
of temperature T is approximately given by
where gi' Mi ' Bi, and Si are the statistical spin factor, reduced mass, Coulomb barrier and separation
energy of a particle i, respectively, and R is the "radius" of the hot spot. Pi(T) clearly increases
very rapidly with increasing T. This may explain the very forward-peaked angular distributions
of the light-particle emission of interest since T increases monotonically with decreasing emission
angles. When we take the model in Ref. 2, the time interval effective to the emission angle e is independent of e, so that we can replace the angular distribution of a particle i with pi(T(e)).
Figure 2 shows pi(T(e)) for protons and a particles versus f) together with the experimental angular
distributions, where T(e) is taken from the experimentally deduced values for each particle in the
181Ta + 14N reaction at 115 MeV. Although some ambiguity remains in subtracting the
background the agreement between experiment and calculation is quite satisfactory in view of our
very simple model.

• 0 cI. P
0.1 '--_---'-__ .L..-_---'-__ .L..-_.........L._~
o 30 60 90 120 150 180 9 CM (DEGREES)
References
Fig. 2. The calculated (solid curves)
and experimental (circles and triangles)
angular distributions for protons and
a particles in the 181Ta + 14N reaction
at 115 MeV. Black circles and triangles
are raw experimental data, while open
ones indicate values after subtracting
the compound-reaction contribution
which has tentatively been estimated as
shown by dashed curves. R( t) in
Eqn. (2) is taken to be constant due to
lack of the detailed knowledge and for
simplicity, so that only relative values
are given for the calculation.
61
1) H. Utsunomiya, T. Nomura, T. Inamura, T. Sugitate, and J. Shimizu, IPCR Cyclotron Progr.
Rep., .u, 56 (1978). 2) T. Nomura, H. Utsunomiya, T. Motobayashi, T. Inamura, and M. Yanokura: Phys. Rev.
Lett., 40,694 (1978);
T. Nomura, H. Utsunomiya, T. Inamura, T. Motobayashi, and T. Sugitate: J. Phys. Soc.
Japan, 46, 335 (1979).

62
4-13. Energy Relaxation during the Fusion Process
Probed by Preequilibrium a Emission
in Heavy Ion Reactions
T. Nomura, H. Utsunomiya, T. Inamura,
T. Motobayashi, * and T. Sugitate
As described in the preceeding reports,l) or particles predominantly emitted in the forward
direction in 14N-induced reactions on various heavy targets have energy spectra characteristic of
evaporation from a locally heated nuclear system (hot spot) proposed for preequilibrium phenomena
by Weiner and Westrom. 2) In fact, the observed spectra could be excellently fitted by the
statistical evaporation formula when nuclear temperature was treated as a parameter depending on
the emission angle e. The resultant temperature T( e) decreases monotonically with increasing
angles, indicating the cooling-down process of the associated hot-spot .
.... , '+.+.,--~ 181 T a 75"
~. '+ '. +~ • +
+
e c. m. ( Degree )
0.1
Fig. 1. Difference between local temperature T(e) and Teq
versus the emission angles in various 14N-induced reactions. The
decay constant Jl derived from the given straight line is given for
each reaction, where the target nucleus used is also indicated.
* Present address: Department of Physics, Osaka University.

Figure 1 shows the plot of T( 8) minus T eq versus emission angles in various reactions,
where T eq is the equilibrium temperature expected in compound reactions and calculated by
63
Teq ::::: (Uav/a)1/2 with a = A/9 MeV- 1 (Uav is the averaged excitation energy of the residual nucleus
with mass number A and a the usual level density parameter). A remarkable feature seen in
Fig. 1 is that this difference falls almost exponentially with increasing angles; that is, the relation
of T( 8) - Teq exexp( -8//1) roughly holds in all cases, where the "decay constant" J.1 depends on the
target nuclei and bombarding energies.
Within the framework of the hot-spot model the above behaviour of T( 8) is considered to
show the internal decay of the hot spot due to nucleon-nucleon multiple scatterings2) provided the
emission angle is somehow related to interaction time, for instance, in the similar way as is the case
in deep inelastic phenomena. 3) In order to drive its decay time (7hs)' let us follow the
conventional macroscopic picture of heavy-ion collisions. Consider projectile and target nuclei
touching each other, which causes extreme local heating around the contact region (formation of
the hot spot) mainly due to dissipation of radial kinetic energy. On the other hand, the initial
orbital angular momenta are mainly transferred into the rotation of the target because of its large
moment of inertia. We postulate that ex particles of interest are emitted from this hot spot sitting
on the rotating target nucleus. Then, the emission angle is simply related to the rotational motion
of the target nucleus on the average.
We calculated the angular velocity (w) of the above rotational motion at the sticking
condition4) by assuming, for simplicity, the grazing angular momentum at the entrance channel.
This seems reasonable since the relevant ex emission has been suggested to originate from peripheral
collisions. Using w thus obtained we converted the decay constant J.1 into 7hs. The results are
given in Table 1. It is remarkable that values of 7hs obtained in various combinations of target
and bombarding energy are nearly the same, being around 1.8 X 10- 21 sec. We believe that this
lends strong support to the basis of the present model.
Table 1. Decay time of the hot spot obtained in
various 14N-induced reactions.
Incident w a) /1 711s Target energy
(MeV) (1020 rad· sec- 1) (degrees) (10- 21 sec)
209Bi 85 3.6 36 1.8 209Bi 95 4.6 50 1.9 209Bi 115 6.2 69 1.9 197 Au 85 4.0 42 1.8 181Ta 85 4.8 49 1.8 181Ta 115 7.7 75 1.7 169Tm 85 5.5 54 1.7
a) The angular velocity of the rotating target nucleus calculated at the sticking condition using
the rigid-body moment of inertia with fO = 1.25 fm.

64
References
1) H. Utsunomiya, T. Nomura, T. Inamura, T. Sugitate , and J. Schimizu: IPCR Cyclotron Progr.
Rep., 12,56 (1978).
2) R. Weiner and M. Westrom: Nucl. Phys., A286, 282 (1977).
3) J. Wilczynski: Phys. Lett., 47B, 484 (1973).
4) W.U. Schroder and J.R. Huizenga: Ann. Rev. Nucl. Sci., 27,456 (1977).

65
4-14. Energy Distributions of a-partie les Emitted from
the lAN + 159Tb Reaction
T. Inamura, T. Kojima, K. Hiruta, and T. Nomura
Energy distributions of ~-particles emitted forwards from the 14N + 159Tb reaction have been
studied by specifing the outgoing channel. This would provide an additional information on the
reaction leading to fast ~-particle emission. 1), 2)
Alpha-particles were detected using a Si annular counter telescope (50 JIm and 2000 JIm). The
solid angle subtended was 0.52 sr, the mean detection angle being 2l.6° to the beam. Scattered
beam was removed by an aluminium foil absorber placed in front of the counter telescope. To
specify the outgoing reaction channel, a Ge(Li) counter was used, and coincidences were measured
between the counter telescope and the Ge(Li) counter. The 159Tb target was a self-supporting
metallic foil 2.1 mg/cm 2 thick.
Figure 1 shows ~-energy distributions observed for ~3n , a4n, and a5n outgoing channels in
(f)
>
i D
£ 10- 1
No l ~ "'t-<'; "'t
95M eVl'N+159 Tb forward
(a)
~t1tWty a3n ~ ,. it / ! , /' j r ~ i
1\ ,
I \ ,
'! ,-JI~ a41l
, / \ f '\
Il!l ~
r #~
Il 1 ' ~l ;/" 1[11
t:a MeV (em .)
~
10-2
o
(b)
115MeV 14N+ 159Tb f orward
I f
Fig. 1. ~-energy distributions for a3n, a4n, and ~5n outgoing
channels in the 14N + 159Tb reaction at (a) E14 = 95 MeV and (b) N
E14N = 115 MeV, observed in the forward direction.

66
the 14N + 159Tb reaction at a) E14 = 95 MeV and b) E14 = 115 MeV. The aluminium foil N N
absorber used for 9 5 MeV 14N was 100 11m thick, and the one for 115 MeV 14N was 150 11m
thick. The ~-energies have been corrected for the effects of these absorbers. It is seen that the
~-energy distribution for the ~3n channel possesses a double humped shape: the lower peak is at
18 MeV, about the Coulomb barrier for ~-emission , and the higher peak is at 29 MeV. Here it
should be reminded that 'Y-ray spectra observed in coincidence with fast ~-particles (Ea 2: 30 MeV)
are distinctly different from those of HI-induced compound nuclear reactions.!)' 2) The high
energy component with the peak at 29 MeV is naturally expected to relate to the above 'Y-ray
observation.
It should also be noted that at E14N = 115 MeV, possible peak position of high energy
component is shifted towards higher energy by about 9 MeV compared with that at E14N = 95
MeV.
The yield of high energy component at E14 115 Me V is small compared with that at N
E14N = 95 MeV. This might be attributable to the difference in angular distributions for different
incident energies provided the process leading to fast ~-particle emission is induced by a direct
nuclear interaction between the projectile and the target nuclei: the maximum a-yield for higher
incident energies is expected to appear at smaller angles than that for lower incident energies.
Figure 2 shows energy distributions of a-particles observed in the backward direction (the
mean detection angle is 158.6° to the beam) for comparison.
10- 1
If)
>
i 1 blo, N :-<:J
"""<:ILl.l """<:I
10- 2
95MeV 14 N + 15 9 Tb backwa rd
jlll!l(j1rl a3n
I II II II II a4 ))
ll.'\ jIll a5 /l I
'\ If
II
f:;a MeV (em)
Fig. 2. a-energy distributions for
a3n, a4n, and a5n outgoing
channels in the 14N + 159Tb
reaction at E14N = 95 MeV,
observed in the backward direction.

67
References
1) T. Inamura, M. Ishihara, T. Fukuda, T. Shimada, and K. Hiruta: Phys. Lett., 68B, 51 (1977).
2) D. R. Zalnawski, H. Yamada, S. E. Cala, A. C. Kahler, and T. T. Sugihara: Phys. Rev. Lett.,
i.!, 92 (1978).

68
5. NUCLEAR PHYSICS
Nuclear Spectroscopy and Instrumentation
5-1. Recoil-distance Lifetime Measurements of States In 120Xe
T. Katou, H. Kumagai, Y. Tendow,
Y. A waya, and A. Hashizume
Lifetimes of several levels in the ground state band of 120Xe were measured with a plunger
apparatus reported before'!)
A 60-MeV 14N beam from the cyclotron was used to populate the levels of interest by the
109 Agct4N, 3n) reaction. The target consisted of a 300 J.lg/cm2 109 Ag layer evaporated onto a
1 mg/cm2 thick gold foil. A thicker gold foil of 20 mg/cm2 thickness was used to stop the
recoil nuclei. The gamma-ray spectra were measured with a Ge(Li) detector placed at 00 to the
beam axis at a distance of 5 cm from the stopper.
The gamma-ray spectra, gated by the beam bunch, corresponding to the transitions in the
ground state band are shown in Fig. 1 for different target-stopper distance (D). The analysis of
the gamma-ray spectra was carried out by means of least-squares fitting program in which some
Gaussian peaks superimposed on a straight background were assumed. The peak areas 10 and Is
for the un shifted and shifted gamma-rays were obtained from the analysis. The areas of the
Q)
c c
'" .J::
S2 (/)
C ::::J o
U
Channel
8 - --6 -701.3keV 10 Is
Fig. 1. Gamma-ray spectra for different target-stopper distances.
The solid lines are the results of the fitting procedure.
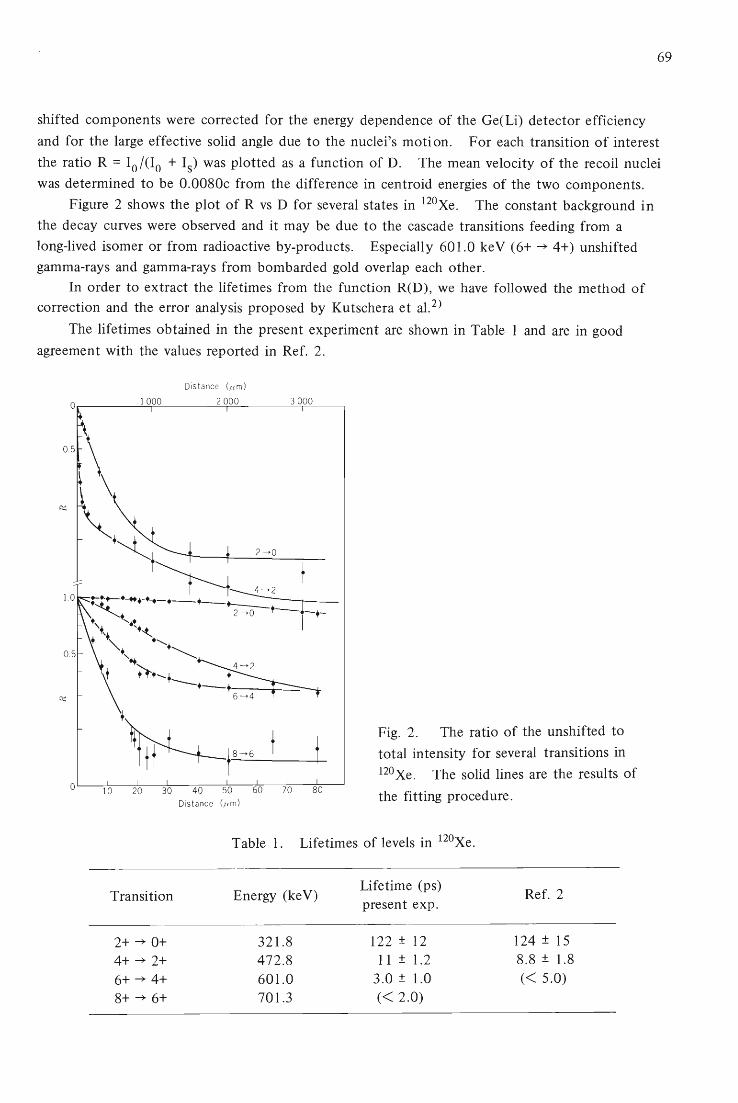
69
shifted components were corrected for the energy dependence of the Ge(Li) detector efficiency
and for the large effective solid angle due to the nuclei's motion. For each transition of interest
the ratio R = 10 /0 0 + Is) was plotted as a function of D. The mean velocity of the recoil nuclei
was determined to be 0.0080c from the difference in centroid energies of the two components.
Figure 2 shows the plot of R vs D for several states in 120Xe. The constant background in
the decay curves were observed and it may be due to the cascade transitions feeding from a
long-lived isomer or from radioactive by-products. Especially 60l.0 keY (6+ ~ 4+) unshifted
gamma-rays and gamma-rays from bombarded gold overlap each other.
In order to extract the lifetimes from the function R(D), we have followed the method of correction and the error analysis proposed by Kutschera et al. 2)
The lifetimes obtained in the present experiment are shown in Table 1 and are in good
agreement with the values reported in Ref. 2.
Dis tance (flm)
2000 3000
• \L-t-j,_S--46 _t ---+-t
Di st ance (flm)
Fig. 2. The ratio of the unshifted to
total intensity for several transitions in
l2OXe. The solid lines are the results of
the fitting procedure.
Table 1. Lifetimes of levels in 120Xe.
Transition
2+ ~ 0+ 4+ ~ 2+ 6+ ~ 4+ 8+ ~ 6+
Energy (ke V)
32l.8 472.8 60l.0 70l.3
Lifetime (ps) present expo
122 ± 12 11 ± l.2
3.0 ± l.0 « 2.0)
Ref. 2
124 ± 15 8.8 ± l.8 « 5.0)

70
References
1) T. Katou, H. Kumagai, Y. Tendow, Y. Awaya, and A. Hashizume: IPCR Cyclotron Progr.
Rep., 11, 85 (1977).
2) W. Kutschera, W. Dehnhardt, O. C. Kistner, P. Kump, B. Povh, and H. J. Sann: Phys. Rev.,
C5, 1658 (1972).

71
5-2. Multiplic ity of y-Rays Following Fast a-Partie Ie Em iss ion in the
159Tb+ 95 MeV 14N Reaction
T. Kojima, T. Inamura, K. Hiruta, T. Nomura
T. Sugitate, and H. Utsunomiya
We have measured for the first time ,),-multiplicity for fast ex-particle emission. A combination
of 159Tb and 95 MeV 14N was chosen for the present study because it is one of typical reactions
leading to fast ex-particle emission. A Si annular counter telescope (50 j.1m and 2000 j.1m) was used
to detect ex-particles. The solid angle subtended was 0.52 sr (() = 15.2° - 28.1° to the beam).
Scattered beam was removed by a 100 j.1m thick Al absorber placed in front of the counter
telescope. A Nal(Tl) detector (7.5 cm X 7.5 cm) was placed at 90° to the beam. The overall
detection efficiency n of 1.02 % was realized with 10 % accuracy for any ')'-rays of energy between
0.2 MeV and about 5 MeV by placing 4.6 mm thick Cu absorber in front of the detector and
surrounding it with about 4 mm thick Cu and about 6 mm thick Pb. Low energy ,),-rays, of
energy below 170 keV, detected with Nal(T 1) were cut off by a discriminator. To specify the
reaction channel, a 75 cm 3 Ge(Li) detector was placed at a distance of 4 cm from the target at
90° to the -plane defined by the Nal(T 1) detector and the beam. Channel specifing ')'-rays were
as follows: for a3n channel the 4 -+ 2 transition in 166Yb, for ex4n channel the 17/2 -+ 13/2
transition in 165Yb, for a5n channel the 4 -+ 2 transition in 164Yb.
To extract the average ,),-multip1icity M,)" triple coincidences were demanded between the Si
counter telescope, the Ge(Li) detector and the Nal(T1) detector. M')' is given, to first order in
n, by M')' - 1 = Ncoin / n-Nsingl' where Nsingl is the number of a-particles recorded in
coincidence with channel specifing ,),-rays, and Ncoin is the number of triple coincidences for each
reaction channel.
Table 1 presents the average ')'-multiplicity measured for different kinetic energy ranges of
a-particles in c.m. Multiplicity of "Total Energy" was calculated from the integrated ex-spectrum.
For comparison, ,),-multiplicity following ex-particles emitted backwards is given in Table 2.
It is notable that for fast ex-particles (Eex > 26 MeV) the ')'-multiplicity seems to decrease with
increasing kinetic energy. For ')'-rays in coincidence with a-particles (Eex > 30 MeV), we have
estimated the average angular momentum of entry state and obtained 1m = 13 h in the a3n channel
from ,),-intensities.l) The average ,),-multiplicity for ex-particles with energy Eex > 30 MeV is 9.3 .
If the average angular momentum removed by one,), transition is assumed to be 1.5 h, the value
supposed to be reasonable in compound nucleus deexitation,2) the value of 1m becomes 16 n. This value of 1m is slightly larger than the value estimated from ,),-intensity. Occurrence of such
difference is, however, understandable because only statistical dipole transitions were assumed to
feed the yrast band members in the latter estimation.
At present we do not make any correction for angular distribution effect, which is considered
to be less than 20 %. Recently we have made a measurement at 125° to the beam. A detailed analysis is in progress.

72
Table 1. The average 'Y-multiplicity for a-particles emitted in the forward direction in the 159Tbe4N, axn)169- xYb reaction.
Reaction
channel
Ea c.m. (MeV)
M'Y
a3n
a4n
a5n
(14.4 - 18.0 8.8 + 1.8) 16.0 - 20.0 12.8 + 2.2 18.0 - 22.0 15.2 + 2.7 22.0 - 26.0 15.9 + 2.5 26.0 - 30.0 12.4+ 1.7 30.0 - 34.0 9.8+ 1.4 34.0 - 8.3 + 1.5
Total energy 12.2 + 1.6
(14.4 - 18.0 13.6 + 1.9) 18.0 - 22.0 12.5 + 1.6 22.0 - 26.0 14.4 + 2.4 26.0 - 30.0 7.2 + 2.1 30.0 - 5.9 + 2.3
Total energy 12.3 + 1.3
(14.4 - 18.0 9.5 + 2.0) 18.0 - 22.0 11.8+3.7 22.0 - 13.8 + 8.8
Total energy 10.8 + 2.1
Table 2. The average 'Y-multiplicity for a-particles emitted in the backward direction in the 159Tb(14N, axn)169- xYb reaction.
Reaction* Ea c.m.
channel (MeV) M'Y
( 0.0 - 14.4 7.6 + 0.8) 14.4 - 18.0 9.7 + 1.0
a3n
} 18.0 - 22.0 9.7 + 1.0
a4n 22.0 - 26.0 9.4 + 0.9 a5n 26.0 - 8.9 + 0.9
Total energy 9.5 + 1.0
* Reaction channel are not specified.

73
References
1) T. Inamura, M. Ishihara, T. Fukuda, T. Shimoda, and K. Hiruta: Phys. Lett., 68B, 51 (1977).
2) G. B. Hargeman, R. Broda, B. Herskind, M. Ishihara, S. Ogaza, and H. Ryde: Nuc!. Phys.,
A245, 166 (1977).

74
5-3. High Spin States In 160Yb
A. Hashizume, T. Katou, Y. Tendow, and H. Kumagai
This study is one of the series of experiments on high spin states in Yb isotopes. 1) Since
20 Ne6+ ions were accelerated successfully by pulsed operation of an ion source developed last
year,2) these ions were used to excite 160Yb by means of the 144NdeoNe, 4n) reaction. A self
supporting and isotopically 97.8% enriched target of 144 Nd was prepared by use of a vacuum
evaporation where 144 Nd2 03 was reduced by thorium.
Excitation functions in the incident energy range 100 - 150 Me V, 'Y-'Y coincidences
and time spectra of 'Y-rays by using natural bunch of the cyclotron beam have been studied. The
,),-ray spectra of short life radioactivities were also examined by using the pulsed operation of the
ion source. The spectrum was observed about 3 ms after the activation of I ms for each
modulation cycle of the ion source.
The high spin states in 160 Yb have been studied by Ward et al. 3) and states up to 10+ have
been reported. Figure 1 shows the sum of 5 coincidence spectra gated by the members of the
ground state band from the 10+ state. Figure 2 shows excitation function for the 144NdeoNe, 4n)
reaction taken by the 243.8 (2+ ~ 0+) , 395.2 (4+ ~ 2+), 588.7 (8+ ~ 6+), and 636.0 (10+ ~ 8+)
')'-rays. The 508.8 keY (6+ ~ 4+) 'Y rays reported by Ward could not be resolved from strong 511
keY annihilation 'Y-rays in singles spectra. However, strong coincidences with 243 and 396 keY
'Y-rays were observed. This proves that the 508 keY 'Y-transition is one of the members of ground
state band.
Besides the transitions in the ground state band, 299.5, 404.0, 447.6, and 484.1 keV'Y -rays
were observed in the coincidence spectrum as shown in Fig. 1. The excitation functions taken
by these 'Y-rays show the same characteristics as those in the ground state band. However, 'Y-'Y
coincidence spectrum without gates shows the existence of unresolved peaks around the energy
1000
800 ClJ c c rcl 600 ..c u (f'
c 400 =:J 0 u
200
0
+0
+' N
O? LD
OJ (')
OJ -...t N
0
'Y-'Y Coincidence spectrum
+ + N -...t
.,. t
~ to
0-}o (0 co «-; cO LD--.:t r-- , 1
OJa -...t co 0 (') -...t -..s -...t LD
' I
500
Channel number
tn m t Co t
b ..-r--:- '-"
co to co (')
Lf) ~
Fig. 1. The sum of 5 spectra obtained by 'Y - 'Y coincidences
gated by the cascade transitions from 10+ to the ground state.
1000

60 144Nd (20 Ne 4n)160 Yb
144Nd (20Ne,4n )160Yb 396.2 keY 20
636·3 ke'l
LoO
10
..-.. 20 Q) (]) > >
+-' ell ~ 0
Qj ~ -::. ~ 5896 keY u 0 ::g a; 243·4 keY
Q) 20
>->.
>. >-40 ~ ~ I
><> )0
10 20
110 120 130 140 150 160 Ol~ __ ~ ____ ~ __ ~ __ ~ ____ ~ __ ~
100 110 120 130 140 150 160
ENe (MeV) ENe(MeV)
Fig. 2. Excitation functions of levels of the ground state rotational band
in 160Yb.
of 8+ ~ 6+ and 1 0+ ~ 8+ transitions. As the above 4 'Y rays coincide in energy with that of
8+ ~ 6+ or 10+ -+ 8+ transition, more information is needed before concluding that they result
from the transitions in 160 Yb. To elucidate this situation, more detailed study of coincidence
spectra is in progress by choosing the gate position carefully for examining the data stored event
by event in magnetic tapes.
The moments of inertia of the states up to 10+ in 160 Yb change smoothly as a function of
the square of rotational frequency. However, from the systematic feature of the backbending
curves of Yb isotopes and coincidence data , it is suggested that the backbending occurs from 12+
state in 160 Yb.
75

76
5-4. Conversion Electrons In the Decay of 206Bi
A. Hashizume, T. Kimura, Y. Tendow,
and T. Hamada
206Pb is a nucleus which has two neutron holes coupled with the closed shell core of 208Pb
and the low-lying states are expected to be described by the shell-model. Although the energy
levels excited by the decay of 206Bi were established, the multipolarity mixing ratios of many
transitions are not yet determined and their mixing ratios will be one of the sensitive tests of the
theories. Another point of interest in 206Bi is that it will be used for a conversion electron standard
source for energy and efficiency calibration of solid state detectors, if the intensities of conversion
electrons are well established.
The 206Bi(6.24 d) activity was prepared by bombarding natural lead (99.999 %) with IS MeV
protons for 5 to 20 h. After removing most part of lead by precipitation, bismuth was separated
from the target element by ion exchange method, and electro-deposited onto a 5 J.Lm nickel foil to
obtain a I X IS mm2 source.
The spectra of conversion electrons were taken by a double-focusing iron-free ~-ray spectrometer
with mean radius of 50 cm. The typical spectra are shown in Figs. 1 and 2. Preliminary results
of some relative conversion electron intensities of 184 and 262 keV transitions are shown in Table 1.
The 2.384 MeV 6- state de-excites to 2.200 MeV 7- state by the 184.02 keV transition.
The type of the transition is a nearly pure M 1. As the ratios .of the internal conversion in L
subshells are very sensitive to multipole orders, the L subshell-ratios are measured at resolution
setting of 0.06 % of the spectrometer. The results were LI/Lrr = 9.06 ± 0.19, LI/Lm = 115.8
± 19.7, and Lrr/Lm = 12.8 ± 2.2. In view of the values of conversion coefficients calculated by
Hager and Zeltzer, the mixing ratios determined by using these LI/Lrr , LI/Lm, and Lrr/Lm were
105
::.:: 206Bi decay I
0
~ ~
~ I 0
104 ~ ::.:: (/) ~ I
8 ~ r-- ~ I N I , \.D
(/) N 0 <
c I ~ I ::J 0 0
u ~a ~
103 t
,~~A;{.:~~f~:.~~ ~ !( ..... 'V •• "-' - • . ' . .. -.
102
0. 22 0.24 0.26 0.45 0.47 0.53
Current ( Rel at ive )
Fig. I. Conversion electron spectrum in 206Pb.

105
206Bi decay ::.:: 0.2 % se t t ing !
<::t m ~
104
(f)
8 ~ N > ----~ Q)
.:X-C r--. :::J N 0
0 <D N
103
.~.;1 <#
102
0.16 0. 18 0.20 0.22 0.26 0.28 0.30
Current (Re lative)
Fig. 2. Conversion electron spectrum in 206Pb.
Table 1. Conversion electron intensities of 184 and 263 ke V
transitions in 206Pb for the decay of 206Bi.
Transition energy Shell
K L
184.02 ± 0.03 M N 0
\
K L M N
262.70 ± 0.05
10.0 ,------- -------- -----,
-.l '::-
9.0~-----------:+·
80
-.l 7.0
50 ~-_:::l:::_-~-______:!:::__-~L-..l.__:_: 90 92 94 96 98 100
M1 ( %)
Electron energy Intensity of CE
96.02 1000 168.16 154.0 ± 2.1 180.16 35.8 ± 1.1 183.12 8.4 ± 0.7 183.8 1.6 ± 0.4
255.50 675.0 ± 5.0 327 .64 78.6 ± 1.7 339.69 25.3 ± 1.2 342.67 9.2 ± 0.9
Fig. 3. The M l-E2 mixing determined
by LI/Ln of the 184.02 keY transition.
77
· 1

78
1.0 ± 0.4 (Fig. 3), 0.2 ± 0.4, and 0.1 ± 0.5 %, respectively. The errors cited are statistical ones.
Due to the smallness of Lm peak, the experimentally obtained values of LI/Lm and Lrr/Lm contain probably some systematic errors. From the value of LI/Lrr , it can be concluded that the
184.02 keY transition has very small E2 admixture of 0.0 ± 0.4) % to Ml. The conversion
electrons of higher energy are now under investigation.

79
6. ATOMIC AND SOLID-STATE PHYSICS
6-1. X-Rays Following Multiple Inner-Shell Ionization (3)
Y. Awaya, T. Katou, H. Kumagai, T. Tonuma,
Y. Tendow, K. Izumo, T. Takahashi, A. Hashizume, M. Okano, T. Hamada, and S. bzkok
The spectra of Y K and L X-rays excited by 6 MeV /amu N-ions and a-particles were measured
using a Bragg crystal spectrometer. l ) A flat crystal of LiF(200) and a detection system of
scintillation counter were used for K X-ray measurements. By considering the energy values of
K diagram line and KL n satellite lines extrapolated from the previous work,2) the third reflection
in the Bragg condition was adopted for Ka X-ray measurement and the second reflection for K{3
X-ray measurement. The use of crystals of LiF(220) and LiF( 420) was also tested and we found
the LiF(200) crystal to be the best. The L X-rays were measured by adopting a crystal of
EDDT(020) and a dytection system of proportional counter. The Y target was a self-supporting
metallic foil of 1VO.8 mg/cm2 in thickness.
The Ka and K{3 spectra are shown in Figs. 1 and 2, respectively. The Ka spectrum
obtained by N-ion bombardment was resolved by least square fitting of the multiple Gaussian
curves and we found that the energy differences between the Kal and KW1
lines and between
/:' (keV)
15.2
500
0L---~----~----~----~78
2 () (deg.)
Fig. 1. Y Ka X-ray spectra
induced by 6 MeV /amu N-ions and
a-particles.
E (keV)
600
OL-~----~----~----~
Fig. 2. Y K{3 X-ray spectra
induced by 6 Me V / amu N-ions
and a-particles.

80
Ka2 and KLa2 lines are rv50 eV and the relative intensity of the KLal to the Kal line and that
of the KLa2 line to the Ka2 line take similar values. The energy values of Kal and Ka2 lines
induced by N-ion bombardment agree with those induced by a-particles within the limit of error,
whereas the energy value of K{3l line excited by N-ions is about 35 eV higher than that excited
by a-particles. This is due to the effect of the vacancies in the M-shell in addition to the K
vacancy. The parameter PL (0)3) obtained for Y is shown in Fig. 3 in comparison with previous
data. 3 ) The change of the fluorescence yield was not taken into account for the case of Y.
The spectra of L X-rays are shown in Fig. 4. The LMn lines whose origin is considered to
be the single L plus n M vacancies are observed for La and L{3l X-rays. The arrows on the La
X-rays in Fig. 4 indicate the result of the Hartree-Fock-Slater calculation obtained by using the
Herman-Skillman's program for single Land n M-shell vacancies and for double L-shell vacancies.
The LeX-rays could not be observed for the case of N-ion bombardment because of the high
background (caused mainly by 'Y-rays following nuclear reactions and radioactivities) and multiple
ionization.
A further analysis is in progress.
• Ti +0, • Ti +N 0 Ti +c 5000 + OCr+ N,0 Fe + NxNi + N
• Ti +0 +Present da ta, Y+N
4000 6
3000 if)
c :::J 0
u 2000
1000
2 f-
x o 1000
If- o
• 0 ! 0 •
,,;
---'
1
E (keV) l.9 l.8 1.7
N
0123456789 oL-----b-----~----~----~~--~~--_,~----~
Fig. 3. Plot of PL (0). Fig. 4. Y L X-ray spectra induced by 6 MeV/amu N-ions and
a-particles.
References
1) Y. Awaya, Y. Tendow, H. Kumagai, M. Akiba, T. Katou, and T. Hamada: IPCR Cyclotron
Progr. Rep. , 2., 79 (1975); H. Kumagai, Y. Awaya, Y. Tendow, T. Katou, and M. Akiba:
Reports I.P.C.R., (in Japanese), 53, 153 (1977).
2) Y. Awaya, M. Akiba, T. Katou, H. Kumagai, Y. Tendow, K. Izumo, T. Takahashi, A.
Hashizume , M. Okano, and T. Hamada: Phys. Letters, 61A, 111 (1977); IPCR Cyclotron
Progr. Rep. , 10, 78 (1976). 3) Y. Awaya, K~zumo, T. Hamada, M. Okano, A. Hashizume, T. Takahashi, Y. Tendow, H.
Kumagai, T. Katou, and T. Tonuma: IPCR Cyclotron Progr. Rep., 1L 93 (1977).

81
6-2. Ka X-Ray Spectra of Ar Produced by Impact of N-Ions
in the 66 - 110 MeV Energy Range
T. Tonuma, Y. Awaya, T. Kambara, H. Kumagai,
1. Kohno, and S. Ozk6k*
Change in the Ka X-ray spectra from argon is studied as a function of the argon target
thickness and of the nitrogen ion energy in the 66 - 11 0 MeV range. The spectra were observed
using a crystal spectrometer.1) As the argon target a gas chamber of relatively high pressure was
used.2) The highest pressure used was 300 Torr. The mean charge state of nitrogen ions was
6.8 - 6.9 after passing through the entrance window and the argon target. 3)
In Fig. 1 are shown Ar K X-ray spectra induced by 86 Me V N-ions when the argon gas
pressure is 300 Torr. The X-rays were detected by using a combination of a Ge( 111) crystal and
a side-window gas-flow proportional counter placed in the vacuum chamber. The energy
resolution was 11 eV (full width at half-maximum) at 2.98 keV. The pressure of the argon target
was monitored by an a-tron gauge throughout the experiment. The incident energy of 95 MeV
N-ions reduced to 86 MeV at the center of the argon target owing to the energy loss of beams by
an Al foil window and the argon gas. (The energy of N-ions described below is that at the center
of the gas target). The peak in the figure is labelled by a symbol such as KmL n which denotes
the initial configuration having m K-shell and n L-shell vacancies. The K-shell absorption edge is
denoted by Kabs with an arrow. The values of energy differences between the Ka1 2 diagram
peaks and KL na satellite peaks, between K2a and K2L na , and between the Ka1
, 2 a~d K2a are
shown in Table 1. Those val ues agree with values obtained from X-ray energy difference data of
the solid targets under the 84 MeV N-ion bombardment, by interpolating with respect to the
target atomic number.1) The energy difference between the Ka1 , 2 and K2a also agrees with that
a x (f)
C ::J o
U
EN=86M eV "
Ar ::s:::
300Torr 1CQ. ::s::: X5
o 70
* University of Istanbul Nuclear Physics Department, Istanbul, Turkey.
Fig. 1. Ar K X-rays spectra produced
by 86 MeV N-ions impact. Ar gas
pressure is 300 Torr.
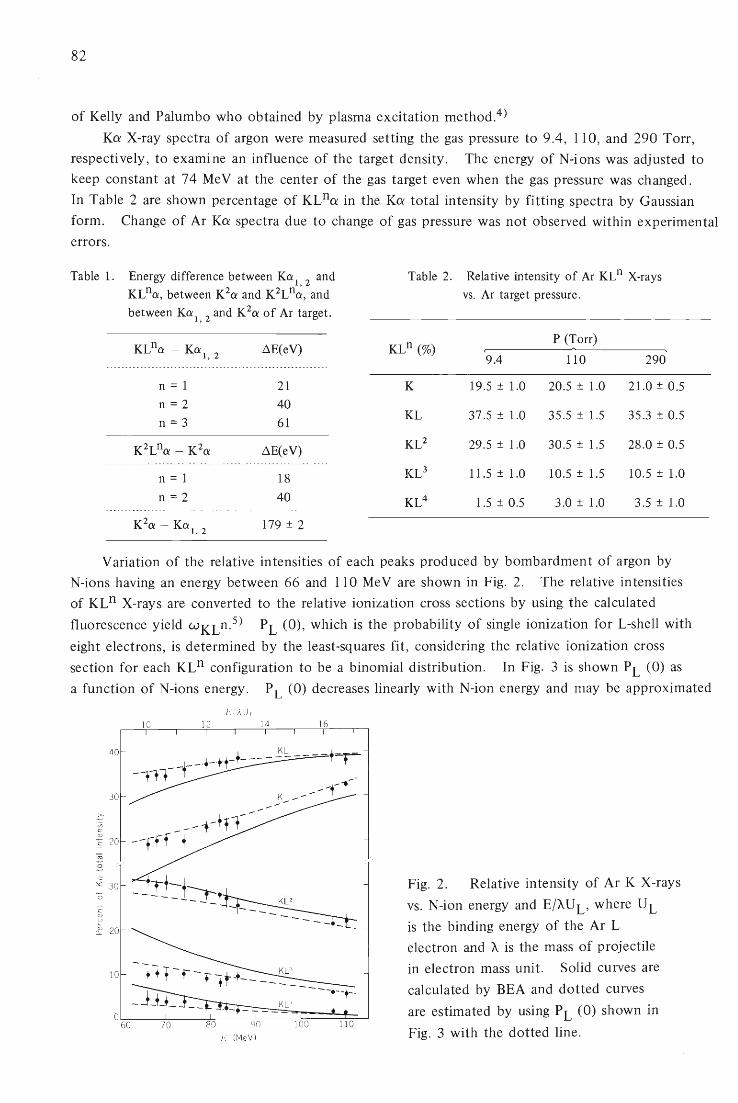
82
of Kelly and Palumbo who obtained by plasma excitation method.4 )
KO' X-ray spectra of argon were measured setting the gas pressure to 9.4 , 110, and 290 Torr,
respectively, to examine an influence of the target density. The energy of N-ions was adjusted to
keep constant at 74 MeV at the center of the gas target even when the gas pressure was changed.
In Table 2 are shown percentage of KL nO' in the KO' total intensity by fitting spectra by Gaussian
form. Change of Ar KO' spectra due to change of gas pressure was not observed within experimental
errors.
Table 1. Energy difference between Kat 2 and
KLna, between K2a and K2L n~, and
between Kat, 2 and K 2a of Ar target.
n = 1
n=2 n=3
n = 1
n=2
D.E(eV)
21
40
61
D. E(e V)
18
40
179 ± 2
Table 2.
KLn (%)
K
KL
KL2
KL3
KL4
Relative intensity of Ar KL n X-rays
vs. Ar target pressure.
P (Torr)
9.4 110 290
19.5 ± 1.0 20.5 ± 1.0 21.0 ± 0.5
37.5 ± 1.0 35 .5 ± 1.5 35.3 ± 0.5
29.5 ± 1.0 30.5 ± 1.5 28.0 ± 0.5
11.5 ± 1.0 10.5 ± 1.5 10.5 ± 1.0
1.5 ± 0.5 3.0 ± 1.0 3.5 ± 1.0
Variation of the relative intensities of each peaks produced by bombardment of argon by
N-ions having an energy between 66 and 110 MeV are shown in Fig. 2. The relative intensities
of KL n X-rays are converted to the relative ionization cross sections by using the calculated
fluorescence yield wKL n. S) PL (0), which is the probability of single ionization for L-shell with
eight electrons, is determined by the least-squares fit , considering the relative ionization cross
section for each KL n configuration to be a binomial distribution. In Fig. 3 is shown PL (0) as
a function of N-ions energy. PL (0) decreases linearly with N-ion energy and may be approximated
40
'" :s o
:::<:: 30 o C <lJ U
& 20
o 60
KL + --f--.+--+-t-+--- -- --- -- "'t -111 1--
_ ---t-
__ +,f-t ----~+~2
I---_~
100 110
I': (MeV)
Fig. 2. Relative intensity of Ar K X-rays
vs. N-ion energy and E!AUL, where UL is the binding energy of the Ar L
electron and A is the mass of projectile
in electron mass unit. Solid curves are
calculated by BEA and dotted curves
are estimated by using PL (0) shown in
Fig. 3 with the dotted line.

§
ce:
0.22
0.20
0. 18
0.16
0.14
0. 12
0.10
• xL l it
-BEA
Fig. 3. PL (0) vs. N-ion energy and E/AUL.
PL (0) shown with solid points are determined
by the least squares fitting. Dotted line is
':::-------=f;!:------:::':::-! ---::,:!:---~! :------,,-1-I.,,-JJ drawn to guide the eye. Solid curve is 70 80 90 100 110
L 60
E (MeV) calculated by BEA.
83
by a linear dotted line which is drawn to guide the eye in the figure. The PL (0) as given by the
dotted line is converted to the relative intensity of KL n X-ray and is shown in Fig. 2 with dotted
curves. Inner shell ionization cross section has been explained by the binary encounter
approximation (BEA) under the condition of Zl ~ Z2' where Zl and Z2 are the atomic number
of the projectile and the target element, respectively. The ionization probability PL (0) is
computed by using the combination of BEA and the impact parameter formula. 6 ) The calculated
PL (0) and the relative intensity KL n X-ray are shown by solid curves in Fig. 3 and Fig. 2,
respectively, though the condition Zl ~ Z2 is not satisfied in the present case.
In conclusion, the change of Ar Ka X-ray spectra owing to the target thickness was not
observed in the 10 - 300 Torr pressure region. The relative multiple ionization cross secti on fit
a binomial distribution reasonably well in the high energy region of nitrogen ions of the present
experiment. The ionization probability PL (0) decreases monotonically with the ni trogen energy
and differs from 1 IE dependence which the BEA theory predicts.
References
1) Y. Awaya, M. Akiba, T. Katou, H. Kumagai, Y. Tendow, K. Izumo, T. Takahashi, A.
Hashizume, M. Okano, and T. Hamada: Phys. Lett., 61A, 111 (1972).
2) T. Tonuma, Y. Awaya, T. Kambara, H. Kumagai, and I. Kohno: IPCR Cyclotron Progr.
Rep., 11, 16 (1977).
3) T. Tonuma, I. Kohno, Y. Miyazawa, F. Yoshida, T. Karasawa, T. Takahashi, and S. Konno:
J. Phys. Soc. Japan, 34, 148 (1973).
4) R. L. Kelly and L. J. Palumbo: Naval Research Laboratory Report, p. 7559 (1974).
5) F. P. Larkins: J. Phys., B4, L29 (1971).
6) J. H. MaGuire and P. Richard: Phys. Rev., A8, 1374 (1973).

84
6-3. Relative Intensity of Kr Kj] X-Rays above Absorption Edge
T. Tonuma, Y. Awaya,
T. Kambara, H. Kumagai , and I. Kohno
K~ X-ray spectra induced by heavy ion bombardment have satellite KLn~ similar to KL nex. It
is difficult, however, to detect some KL n~ satellites of which energies are above the absorption edge,
because of self-absorption and decrease of X-ray yields. When n ~ 2, the KL n~ energy of Kr
target is expected to be above the absorption edge (14.323 keV) by the analogy with the KP spectra
of Y target observed with a crystal spectrometer (see 6 -1 in this Report). We estimated relative
intensity of KL n~ (n ~ 2) from Kr target by the following method, using a Si(Li) detector.
Expressing by "a" the ratio of intensity of KP lines lying above the absorption edge to that of
the total K{3 lines when there is no self-absorption, the measured intensity ratio IKP/IKex of KP and
Kex lines is given by IK~ (IKf3
) (1 - a) e -aIm + ae-02m
IKa = IKa O· e-om
where uland u2 are cross sections of self-absorption below and above the absorption edge of KP spectra, respectively , and a is that for Kex spectra region. m is the thickness the photons have to
(f)
C :::J o
U
104
Ka
103
10'
10'
100
K(3
(
I
I r
! 1\ i
\~
Fig. 1. Kex and Kf3 spectra of Kr target
induced by 6 MeV/amu Ne ions. Kr gas
pressures were 30 and 284 Torr. Spectra
were observed with a Si(Li) detector.
0.1 ':::--0 ----,:1~0.,,---0 -----;::-20!:-,;0---~300
P (Torr)
Fig. 2. IK{3/IKa ratios of Kr X-rays
induced by 6 MeV /amu Nand Ne ions
as a function of Kr target pressure.
Solid lines are drawn to guide the eye.

85
go through in the Kr gas target to reach the detector. (lKP/IKa)o is the IKP/IKa ratio without
self-absorption, that is, when gas pressure approaches zero. The measurement of IKp/IKa varying
Kr gas pressure can give the relative intensity "a".
A gas chamber with windows for beam entrance and exit was used to measured Ka and KjJ
X-ray yields from Kr target.1) Self-absorption of K X-rays occurs between the center of the target
and the Be window, the distance of which was 77 mm, in the chamber. The attenuation of K
X-rays by the Be window and by air between the chamber and the Si(Li) detector was negligible.
The size of the heavy ion beam spot was less than 5 mm in diameter. Figure 1 shows Ka and K{3
spectra of Kr target obtained by the bombardment of 6 MeV /amu Ne ions. The pressures of the
target gas were 30 and 284 Torr, respectively. The energy resolution of the Si(Li) detector was
280 eV (full width at half-maximum) for 14.39 keV,-rays emitted by a 57Co source. The gas
pressure was measured with an a-tron gauge the accuracy of which was 10 percent. Figure 2
shows intensity ratios IKp/IKa of K X-rays from Kr gas target induced by 6 MeV/amu Nand Ne
ions as a function of Kr gas pressure. Table 1 shows the estimated "a" and (lKP/IKa)o using
values of 0 1 , O2
, and 0 in Ref. 2.
Table 1. Ratio of K{3 intensity "a" above the absorption edge to that of the
total KjJ of Kr target X-rays induced by bombardment of 6 MeV /amu
Nand Ne ions. (lK{3/IKa)o is the intensity ratio of Ka and KI3 when there is no self-absorption at nearly zero pressure.
a
N ion 0.35 ± 0.03 0.205 ± 0.002
Ne ion 0.61 ± 0.05 0.207 ± 0.002
In conclusion, we see that it is found the ratio of KP intensity "a" above the absorption edge
to that of the total K{3 lines increases with the atomic number Zl of the incident particle. The
increase of "a" means that intensity of higher order satellites of Kr KL n{3 produced by heavy ion
bombardment increases with Zl. The ratios (lKP/IKa)o obtained for two different kinds of ions,
Nand Ne ions, but of the same velocity are almost the same.
References
1) T. Tonuma, Y. Awaya, T. Kambara, H. Kumagai, and I. Kohno: IPCR Cyclotron Progr.
Rep., 11, 96 (1977).
2) Wm. J. Veigele: Atomic Data, 2, No.1, 64 (1973).

86
6-4. REC X-Rays by 120 MeV Ne-Gases Collisions
T. Tonuma, Y. Awaya, T. Kambara,
H. Kumagai, and I. Kohno
Highly stripped heavy ion can capture a free or weakly bound target electron directly into the
K-shell vacancy with subsequent emission of an X-ray photon. This process is known as radiative
electron capture (REC).1) The energy of the photon is given approximately by the sum of the
binding energy of a K electron in a hydrogen-like or helium-like ion and the kinetic energy of an
electron which is at rest in the target, relative to the moving ion.
About 20 % of 120 MeV Ne6+ accelerated by the cyclotron change to Ne9+ and 80 % to
Ne lO+ when the ions reach the center of the gas chamber after passing through the foil at the
entrance of the chamber. Therefore, the REC X-rays are mostly those of Ne lO+ and the energy
lies in the neighbourhood of 4 keV. Figure 1 shows REC X-ray spectra from 120 MeV Ne ions
colliding with gaseous targets of H2 , N2, Ne and Kr. Spectra were detected by a Si(Li) X-ray
detector which was plflced perpendicular to the beam direction. The energy resolution of the
detector was 230 eV (full width at half-maximum) at 6.4 keV. The gas pressures of H2 , N2 , Ne,
and Kr targets were measured with an a-tron gauge and were 180, 200, 300, and 13 Torr,
respectively. Energy shifts of REC X-ray peaks in the spectra shown with arrows come mainly
from different kinetic energies of Ne ions at the center of the target gas since the ions experience
different energy losses in different kinds of gases and gas pressures in traversing the distance of
70 mm between the entrance window and the center of the chamber.
(f)
C ::0
104 r--- ------------------,
13TorrK r
103
300Torr Ne
200Torr Nz
102
10'~-~-~--~-~--7_-~ o
Photon energy
Fig.!. REC Spectra observed in
120 MeV Ne ions-H2 , N2 , Ne, Kr
collisions. The arrows indicate Ne REC
peak energy in gases.

87
Figure 2 shows the relation between the energy width (FWHM) of REC X-ray spectra and
the atomic number ZT of target. It has been found that the width is approximately proportional
to (ZT )1/2 . Further study of REC is in progress.
'" I
2.0 1-
I Kr
I I I
0L---~1 ----~1--~1----71 ----1~--71 --~ 2 4 6
References
Fig. 2. Half width of Ne REC spectra
vs. atomic number ZT of targets. The
dotted line is drawn to guide the eye.
1) H. W. Schnopper, Hans D. Betz, J. P. Delvaille, K. Kalata , and A. R. Sohval: Phys. Rev.
Letters, 29, 898 (1972).
2) 1. B. Marion and F. C. Young: "Nuclear Reaction Analysis Graphs and Tables" ,
North-Holland, p. 45 (1968).
3) T. Tonuma, Y. Awaya, T. Kambara, H. Kumagai, and I. Kohno: IPCR Cyclotron Progr.
Rep., !l, 96 (1977).

88
6-5. Dependence of F Ka Satellite Intensities Produced
by Fast Ions on Chemical Environment
M. Uda, H. Endo, K. Maeda,
M. Kobayashi, and Y. Sasa
Chemical effect reflected in characteristic X-rays with satellite structure has received much
attention in recent years. X-ray spectra produced by fast ion impact have shown dramatic change
in intensity distributions from one compound to another, and some attempts have been made to
explain the distributions. However, discussion in this field is still a matter of conjecture. I) - 3)
A quantitative analysis of the satellite intensity distributions has been performed on F Ka
spectra of several fluorides induced by p, a , C4+, and N4 + (6 MeV!amu) , and is still in progress
with success. In such experiments an attention has been payed on the following points. l) An
incident energy of the projectiles is high enough to adopt the direct Coulomb ionization process in
which L shell vacancy distributions produced at the time of collision are independent of chemical
environment of the compounds used. 2) The ionization cross section varies with the energy of
the ions slowing down in the solid. 3) The valence band of compounds used is composed of L shell electrons of target element. In such a condition direct information of chemical bonding
is given through change in relative intensities of the X-ray satellites because a refilling of the
vacancies by ligand valence electrons prior to X-ray emission is expected. 4) Bonding nature of
the compounds should vary to a large extent from one compound to another. 5) Decomposition
or contamination of target materials should be avoided during ion bombardment.
Thin targets of a series of fluorides; NaF, Na3AlF6 , AlF3 , NiF2' CuF2, and (CF2)n
bombarded with ions with 6 Me V! amu were selected for our analysis. Change in the intensity
distribution of the F Ka X-ray spectra from these compounds related to the Pauling bond
:::j
cU
60
'7 40 S x
20
LL
'" Z
~ « LL'"
'" Z « u:' u:' Z
::> U
C=l- [
.-!' u:' U
0.6
0.4
0.2 Fig. 1. Variation of L shell width r L (closed circles) and L shell vacancy
refilling probability f (open circles) with
the covalency C.

ionicity or covalency. The ionicity I is defined by Pauling4) to be I = 1.0 - exp[ -0.2S(x A -
xB)2] where x A or xB is the electronegativity of element A or B. If we define the L shell
width r L as r L = fo r K/( 1 - f) where r K and fare K shell width and refilling probability of L
shell vacancies respectively, we get linear relationship between r L and the covalency C
( = 1.0 - I).5) An example for 84 MeV N4+ impact is shown in Fig. 1. This indicates that
89
F L shell vacancies produced at the moment of collision transfer only through the covalent
character of molecular orbitals made of the F L shell and the outer shells of the neighboring
atoms. The ion-induced X-ray spectroscopy offers promise for determining the ionicity or
covalency of chemical compounds without thermal and dielectric measurements of the compounds.
References
1) P. G. Burkhalter, A. R. Knudson, D. J. Nagel, and K. L. Dunning: Phys. Rev., A6, 2093
(1972).
2) J. McGuire, D. K. Olsen, H. H. Wolter, and C. F. Moore: ibid., AIO, 200 (1974).
3) J. A. Demarest and R. L. Watson: ibid., A17, 1302 (1978).
4) L. Pauling: The Nature of the Chemical Bond, third edition, Cornell U. P., Ithaca, N. Y.
(1960).
5) M. Uda, H. Endo, K. Maeda, Y. Awaya, M. Kobayashi, Y. Sasa, H. Kumagai, and T. Tonuma:
to be published elsewhere.

90
6-6. Z2 Dependence of l Shell Vacancy Rearrangement Process
in Ka X-Ray Satellites
H. Endo, M. Uda, K. Maeda,
M. Kobayashi, and Y. Sasa
Large difference between observed intensity distribution of Ka X-ray satellite and expected
intensity distribution from L shell vacancy distribution generated at heavy ion impact has been
pointed out. Recently L shell vacancy rearrangement process via inter- or intra-atomic transition
prior to the Ka X-ray emission has been proposed 1)- 3) to explain the difference. The Ka satellite
structure is expected to give information on a structure of the valence or conduction band in solids
through L vacancy relaxation process. The quantitative and detailed understanding of the L shell
vacancy rearrangement process for wide range of a target atomic number Z2 is indispensable for
the study of chemical effect as well as of the inner shell ionization mechanism. We have investigated the L shell vacancy rearrangement process in Ka satellites produced by
84 MeV N4+ impact. Chemical compounds composed of Z2 = 9 - 28 are used for the comparison
of their Ka X-ray spectra which are expected to show chemical effect in their intensity
distributions.
Assuming one-by-one cascading process of vacancy configurations and neglecting simultaneous
multi-electron transfer to the L shell holes, the relaxed nth satellite intensity y~ of the Ka X-rays
can be expressed by simultaneous equations as follows:
+ - - - - - + f8 , 7 • f7 , 6 • - - - • fl, 0 • Y 8 ) (1)
where W, y n' and f n n _ 1 are the average fluorescence yield, the initial L shell vacancy distribution
produced at the tim~ of collision, and the probability that K 1 L n configuration is transferred to
K 1 L n - 1 through L shell refilling, prior to the K shell vacancy refilling. In such a simple relaxation
scheme, the reaction mechanism of the multi-ionization is responsible only for the satellite structure
determined by the quantity y n. If the velocity of incident ions is much higher than that of K
and L orbital electrons, the initial vacancy distribution is expected to be almost independent of
the outer shell electron configurations. In such a case we can solve the simultaneous equations (1)
to get fn n -1 which is an atomic structural quantity. The L vacancy rearrangement probability
fn , n _ 1 'is connected with rK(K 1 L n) and rL(K 1 L n) which are the K and L shell widths for the
K 1 L n vacancy configuration state and is written as
rL(K1Ln ) fn n - l =
, r K ( K I Ln) + r L ( K 1 L n ) (2)
In the special case of small L shell ionization probability, the quantities f n n _ 1 ' rK(K 1 L n) and
rL(K l L n) can now be replaced by f, 'i~K and rL, independent of the L sh~ll vacancy configurations,
respectively.

We deduced f from the observed Ka satellite intensities of F(NaF, Na3AIF 6' AIF 3' NiF 2'
CuF2 , (CF2 )n)' Na(NaF , Na3A1F6 , Na2S04 , NaSCN, Na2 S2 0 6 ) , Mg(MgO) , Al(Al, A12 0 3 ),
S(Cu2 S, Na2 S04)' CI(KC1, NaCl) , K(KC1), Ca~aF 2)' Fe(Fe, FeO, Fe2 °3 ), and Ni(Ni, NiO)~ as
shown in Fig. 1.
for the fluorides.
Two important features of f are found. First is the dramatic change in f The large "chemical effect" is caused by the fact that the L shell of F- in
91
the fluorides constitutes the valence band , and hence the L vacancy rearrangement is directly
reflected in Ka satellite structure . We have discussed the chemical effect elsewhere.4) Second is
a monotonic increase of f with Z2 in the region where the valence or conduction band is composed
of its M shell. Although no calculations or observed data were reported on the L shell widths for
multiple Land K vacancy configuration states, fL can be replaced by rL(KOL 1 Mm) which should
be smaller than r L (KoLl MO) in our experimental condition. Assuming rK :::: rK(K 1 L 0),7 is then
expressed as
t3r L (KOL1MO ) f :::: ------------- (3)
r K ( Kl LO ) + t3r L ( KOLIMO )
where the quantity t3 is a constant smaller than unity. Using the calculated values of rK(K 1 L 0 )
and rL(KOL 1 MO)5)' 6) , the Z2 dependence of 7 is now well reproduced by the theoretical estimation
obtained from equation (3) with t3 :::: 1/3 (the dashed line in Fig. I).
The investigation of 7 for wide range of Z2 than that adopted here is in progress.
05
0.4
0.3
' ''-0.2
0.1
0.0
References
! ! //,,-T--- - -- - -- -+--
-- ---f' /< 1 f
Z2
Fig. 1. Variation of the L shell
vacancy rearrangement probability
r with the atomic number Z2 and
chemical compounds. Dashed
line denotes the theoretical value
of r
I) R. L. Watson , A. K. Leeper, B. I. Sonobe, T. Chiao, and F. E. Jenson: Phys. Rev., A15, 914
( 1977).
2) J. A. Demarest and R. L. Watson: ibid .. ~ A17 , 1302 (1978).
3) R. L. Kauffman , K. A. Jamison , T. J. Gray, and P. Richard: Phys. Rev. Lett ., 36 , 1074 (1978).
4) M. Uda, H. Endo, K. Maeda, M. Kobayashi, and Y. Sasa: IPCR Cyclotron Progr. Rep., 12, 88
(1978).
5) J. H. Scofield: Phys. Rev. 179, 9 (1969).
6) E. J. McGuire: ibid., A3, 587 (1971).

92
6-7. Energy Straggling of C and He Ions in Metal Foils
T. Takahashi, Y. Awaya, A. Hashizume, K. Izumo,
H. Kumagai, T. Tonuma, and S. Uchiyama
The energy loss straggling of C and He ions in foils of aluminum, silver, gold, and lead has
been studied using 5 - 7 MeV/nucleon cyclotron beams and results were compared with Bohr's
theory. According to Bohr's theory, the full width at half maximum is given by
'Yl = 2 (2 In 2)1/2 (4 'IT e4 Z2NZ 6. x)I/2 "Bohr 1 2 ,
where Zl e is the charge of the incident particle , N is the number of atoms per cm3 of the stopping
material with atomic number Z2 and thickness ~x. The foil thickness (~x), mean energy in the
foil (E/nucleon), the full width at half maximum obtained from our experiment (1]exp), the full
width at half maximum calculated from Bohr's theory (1]Bohr)' the ratio 1]exp/1]Bohr = Rand
RC/RHe are shown in Table 1. Here, RC is the ratio 1]~xp/71~ohr for C ion and RHe is that for
He ion. The ratio RC/RHe is given by 1]~xp/ (371~p), where numerical factor 3 comes from ZI
in Bohr's theory. 1]~xp and 1]~:p were compared with each other for the same foil to avoid the
effect of foil inhomogeneity. In Fig. I, the ratio RC/RHe is shown. If Bohr's theory is
applicable, RC/RHe should be unity, but the ratio is larger than unity for all foils investigated.
If RHe is 1.1 - 1.2, the foil can be regarded homogeneous, according to Strittmatter and
Wehring.l) RHe value for each foil is indicated in Fig. 1. Homogeneity of lead and gold
He in Al C in Al C in Al
He in Ag C in Ag C in Ag
He in Au C in Au C in Au C in Au
He in Pb C in Pb C in Pb
Table 1. Energy straggling of C and He ions in metal foils.
6x (mg/cm2) B/n (MeV) 71exp (keV) 71Bohr (ke V) R
3.195 6.931 81 ± 7 73.1 1.11 3.195 5.392 372 ± 24 220 1.69 3.195 4.834 377 ± 17 220 1.71
5.196 6.927 98 ± 7 88.6 1.11 5.196 7.095 470 ± 23 267 1.76 5.196 5.379 517 ± 24 267 1.94
12.03 6.856 211 ± 7 129 1.63 12.03 6.910 1570± 116 389 4.04 12.03 5.171 1910 ± 118 389 4.91 12.03 4.586 2060 ± 85 389 5.30
5.334 6.941 148 ± 7 85.6 1.73 5.334 7.150 1200 ± 69 257 4.67 5.334 5.436 1290 ± 72 257 5.02
1.53 ± 0.16 1.55 ± 0.15
1.59 ± 0.14 1.75 ± 0.15
2.47 ± 0.20 3.00 ± 0.21 3.24 ± 0.17
2.70 ± 0.20 2.90 ± 0.21

3
2
Pb·· · RHe = 1.73} AU "' RHe = 1.63 -..... 1 Ag" ' RHe = 1.11 E/n- 7MeV
f'.............1 AI .. . RHe = 1.11
Au l~--_ Au~ ~T-t
r"Pb Au
Bohr's the ory
°4~------75------~6------~~---
Energy of C ion El n
Fig. 1. RC/RHe versus energy of C
ions. RHe was obtained at E/n ~ 7
MeV (see Table 1).
93
foils seems unsatisfactory, but that of silver and aluminum foils seems to be good. The disagreement
between the theory and experiment (even for foils of satisfactory homogeneity) is apparent, but
no explanation for it is given yet.
Reference
1) R. B. Strittmatter and B. W. Wehring: Nucl. Instr. Meth. , 135, 173 (1976).
_______ ---'1

94
6-8. Secondary Electron Em ission from Metal Surface
by High Speed Ion Bombardment
A. Koyama, T. Shikata , and H. Sakairi
In the phenomenological theory of the secondary electron emission from metal surface by
high speed ion bombardment, the emission ratio was given semi-empirically on an assumption that
the number of excited electrons inside the solid is in proportion to the stopping power for an
incident ion. I) , 2) One of the present authors (A.K.) made, without the above assumption , a
calculation for the total backward secondary electron emission yield from Al by high speed proton
bombardment. 3) In the calculation the number of inner excited secondaries was calculated by the
Born approximation, and the transport and the emission process of them were expressed by the
Boltzmann equation. The calculated value of the emission yield was about one fourth of the
experimental value reported by Aarset et al. The addition of the contribution from L2, 3- VV
Auger electrons can only make it increase to a half of the experimental one. The origin of this
discrepancy must be investigated from both theoretical and experimental sides.
The study on the total backward secondary electron emission ratio has started this year with
the vacuum evaporated metal target which is expected to have cleaner surface than that used in the
previous experiment.4 ) It is planned to investigate the incident ion energy dependence of the
emission yield and the dependence of it on incident ion charge number, and the variation of these
dependences with the target materials by bombardments of proton, a-particle and heavier ions
such as C4 + , N4+ , and 0 5+ .
Figure I shows the schematic diagram of the measuring system. The target (T) is a vacuum
evaporated thick film on an iron substrate. After evaporation, the target can be set perpendicular
to the incident beam direction by turning the target holder without being exposed to the air.
The vacuum is about 1 X 10 - 7 torr and about 1 X 10- 8 torr during evaporation and during
measurement , respectively. The collimator is composed of slits Sl and S2 ' apertures of which are
1 mm and 3 mm in diameter, respectively. The collector (C) has a cover outside of it so as not
to catch stray electrons in the scattering chamber. The deflector (D) prevents the electrons
Vacuum chambe '
~T S,
~-~ - To cyclot ron
To ion pump
H"--------c:===l
Fig. 1. Schematic diagram of the
measuring system. T: rotatable
target holder and targets. C:
collector. D: deflector to prevent
secondary electrons emitted from
the edge of the slit Sl from
reaching the target and the
collector. Sl and S2: slit system
which has two apertures of 1 and
3 mm diameter, respectively. H:
heater for vacuum evaporation.

emitted by incident ions at the edge of the slits Sl from reaching the collector and the target.
A preliminary measurement is now in progress on Al target.
References
1) E. L. Sternglass: Phys. Rev. , 100, 1 (1957).
2) K. Kanaya and S. Ono: Japan. J. appl. Phys .. , 13 , 944 (1974).
95
3) A. Koyama: ibid. , 16,431 (1977); A. Koyama: Ionizing Radiation , (in Japanese),~ 17 (1978).
4) B. Aarset, R. W. Cloud, and J. G. Trump: J. appl. Phys., 25, 1365 (1951).

96
6-9. Helium Embrittlement of the First Wall Materials
for Fusion Reactor
H. Shiraishi, H. Shinno, R. Watanabe, * H. Kamitsubo, 1. Kohno, and T. Shikata
The degradation of mechanical properties by neutron irradiation is a serious problem in
nuclear reactor design. Stainless steels belonging to type 300 series (especially SUS 316) are
supposed to be the most promising materials for use in proto-type reactors, but it was widely
recognized recently that they have disadvantages of large void swelling and severe embrittlement.
High nickel austenitic alloys are well known to be highly resistive to the void swelling, therefore,
these materials are expected to be very promising as structural materials in fast breeder reactors
and fusion reactors. Other hopeful materials are molybdenum and its alloys because of their
attractive physical properties and large mechanical strength at high temperatures. Effect of helium
on the high temperature embrittlement is yet little known for the latter two kinds of materials.
The present work intends to clarify this point.
The details of the experimental procedures were reported previously. 1), 3) Here, only main
features will be given. The tensile test specimen was plate-like in shape and had a cross-section
of 0.2 X 4 mm with a gauge length of 10 mm. The cold work was done by cold rolling. Helium
injection was performed by the cyclotron. An Instron type machine was used for the tensile test
in the vacuum of 2 X 10 - 6 Torr. The strain rate was 5 X 10- 4/ sec. Test temperatures were
650°C and 750 °C.
Table I shows the . chemical composition of the high nickel austenitic alloys examined.
Sample 7502 is a solution hardened alloy. Sample 7510 is strengthened by a "1' - intermetallic
compound precipitation. The pre-injection conditions, the injection temperature, and the tensile
test results are given in Table 2. Pre-injection treatment by 5 % straining was very effective to
suppress the helium embrittlement in SUS 316 stainless steel. 2),3) Two kinds of treatments were
given to the precipitation strengthened alloy. The sample given the 20 % cold work before
aging had a lower strength but a higher ductility compared with the sample treated in the reversed
sequence.
The helium embrittlement was clearly observed in every helium injected specimen. Higher
the test temperature was, larger reduction of the ductility occurred. The embrittlement of the
solution hardened alloy was found to be severer than that in the similarly treated SUS 316
stainless steel, the result of which was already reported elsewhere. 2), 3) It is noteworthy that
there was no effect of 5 % prestrain. This point made a clear contrast to SUS 316 stainless
steel. 2),3) The largest embrittlement occurred in the "1' - precipitation hardened alloy. The
material which had the largest strength undergone the severest helium embrittlement. The helium
effect to these two types of materials (SUS 316 stainless steel and high nickel austenitic alloys)
was considerably different, but the fundamental mechanism of the embrittlement in the high
* National Research Institute for Metals.

Sample
7502 7510
Table 1. Chemical composition of the high nickel
austenitic alloys (wt. %).
C Ni Cr Si Mn Mo Ti Al
0.057 35.l2 14.72 0.45 1.41 1.59 0.063 35.60 14.86 0.51 0.94 1.71 1.79 0.24
Table 2. Experimental conditions and tensile test results of the helium injected
high nickel austenitic alloys.
97
B
<0.0002 <0.0002
Sample He cont. Irrad. Test 0.2% proof Tensile Uniform Total
Pre-irr.
No. treat. temp. temp. stress strength e1onga. e1onga.
(at. ppm) (C) (C) (kg/mm2) (kg/mm2) (%) (%)
7502 6.3 800 650 15.3 32.0 19.7 21.4
7502 ST * 0 750 650 16.2 33.2 32.3 62.4
7502 1050°C 6.3 800 750 14.1 18.8 6.6 7.6
7502 30 min 0 750 750 14.1 21.1 16.5 62.3 - ............. _-- ---- -- .... --- ---_ .. _----- --- -_ .. ------ --- -- ---- -- ------ ---------- ---- --- -- -------- ---------- ----- ------ --- ----------- -- ----- ----_ .. _---- ----- -- ------ ---- -------- --
7502 6.3 800 650 20.4 32.3 15.0 18.3
7502 5% 0 750 650 26.5 35.6 26.2 50.6
7502 prestrain 6.3 800 750 16.5 19.4 4.6 8.9
7502 0 750 750 19.6 21.8 9.8 49.1 --- -- ------ -- ------ ------ --- -------- ----- --- ---- -- ------------ ---- -- ----- -- ---- -- ------- ----- ---- ----- -- ---_ .. ---- --- -- --- ------ ---- ------ ----- ---- --- ------ --- --- ------- --
7510 5.0 650 650 31.6 44.0 8.0 12.8
7510 20% CR ** 0 500 650 28.9 46.6 15.7 50.3
7510 + 650°C, 103h 5.0 650 750 22.1 26.0 3.3 4.7
7510 0 500 750 22.0 27.7 9.6 58.4 _ ...... ............ _ .............. -_ ...... .. .. .. ...................... .......... --_ .......................... .. .. .. .. ...... .......... .. ................ .................. ...... .... - -- - - - -- - - - - - - - - - - - - - - - - _. - _. - - - - - - - - - - - - - - - - - - - - - - - - - - - - - - - - - - - - - - - - - - - - - - - --
7510
7510
7510
7510
650°C, 103h
+ 20% CR **
* Solution treatment
* * Cold rolling
** * No plastic strain
Tensile test strain rate : 5 X 10 - 4 I sec
5.0
o 5.0
o
650
500
650
500
650
650
750
750
63.6
73.2 26.7 * * *
43.4
67.6
78.5
50.4
1.7
2.3
o 2.3
2.2
14.4
o 13.5
nickel austenitic alloys was not established. A transmission electron microscopic study may clarify
this problem in the near future.
A molybdenum sample was helium injected at 1000°C. The injected helium concentration
was 10 atomic ppm. The main impurity contents were as follows: C 50, 0 4, N 8, and Zr 30
(ppm in weight). The sample was annealed at 1300°C for I h before the helium injection. The
tensile test at 1000°C and at the strain rate of 5 X 10 - 4 /sec showed no loss of ductility.

98
References
1) R. Watanabe, H. Shiraishi, H. Shinno, H. Kamitsubo, I. Kohno, and T. Shikata: IPCR Cyclotron
Progrs. Rep., 10, 104 (1976).
2) H. Shinno, H. Shiraishi, R. Watanabe, H. Kamitsubo, I. Kohno, and T. Shikata: ibid., 0 114
(1977).
3) H. Shinno, H. Shiraishi, R. Watanabe, H. Kamitsubo, I. Kohno, and T. Shikata: IPCR Cyclotron
Progr. Rep., Suppl. 7, to be published.

99
6-10. Lattice Location of Ni Atoms Implanted In AI
E. Yagi, A. Koyama, H. Sakairi, and R. R. Hasiguti*
The atomic configuration of interstitials in f.c.c. metals is one of the fundamental problems in
the field of crystal lattice defects. With respect to the determination of the magnitude of atomic
displacement of interstitials, the channeling method is the most effective one among several
experimental methods applied to the investigation of interstitial configuration. There have been
no channeling investigation on the self-interstitials in f.c.c. metals. But, on mixed interstitials
composed of Al and impurity atoms in Al solid solution, several investigations have been performed
by Swanson et al.l) In the present work, the location of Ni atoms implanted in Al was
investigated by means of proton backscattering. As Ni has very small solubility in Al it is expected
that the implanted Ni atoms occupy interstitial sites. If it is the case, the information on the
interstitial site will be obtained from the determination of Ni atom location.
Preliminary experimental results and a qualitative explanation of them were given in the last
volume. 2) Results of Jldvanced experiments and a quantitative explanation are presented here.
In order to investigate the location of the implanted Ni atoms, an angular scan was performed
through < 100 >, < 110 >, and < III > axes. Figure 1 shows the normalized backscattering
yields X from Ni and Al atoms as a function of the angle e between the incident beam direction
and the < 100> axial direction. Figures 2 and 3 show the results for the < 110> axis and the
< III > axis, respectively.
1.5
d 0.5 E L. o Z
(100)
-1.0
• Ni o Al(implanted)
• Al(unimplanted)
o 1.0
Angle 8 (degrees)
* Faculty of Science and Technology, Science University of Tokyo.
Fig. 1. Normalized backscattering
yields from Ni and Al atoms as a
function of the angle () between the
incident beam direction and the <100> axial direction. Incident proton energy
is 5.8 MeV.

100
1.5
X
u Qj >= 1.0 OJ c ·c 2 B u
IJ)
u <lJ
~ 05 (j .
E 0 Z
0
(110) • Ni
-1.0
° At (implanted)
• At (unimptanted)
Fig. 2. Nonnalized backscattering I
/II yields from Ni and Al atom as a function I I I I
of the angle () between the incident I I I
f beam direction and the < 11 0> axial ~ I direction. Incident proton energies are \ ~ ~, 4.8 MeV and 5.8 MeV for an implanted "
0 1.0 specimen and an unimplanted one,
Angle 8 (degrees) respectively.
(111) • Ni o Al(implanted)
-0 (l) ::;::: OJ
. ~
~ -0 u
{jJ
-0 Q.I
. ~ -0 E 0 z
0.5
- 1.0 0 10 Angle 8 (degrees)
Fig. 3. Nonnalized backscattering yields from Ni and Al atom
as a function of the angle () between the incident beam direction
and the <Ill> axial direction. Incident proton energy is
4.8 MeV.
The angular scan of the backscattering yield from Ni atoms shows a dip with minimum
yield Xmin of about 0.65 for the < 100> axis, while a double peak is obtained for both < 110 >
and < 111 > axes. The angle () p giving rise to the peaks are ±0.04° and ±0.03° for < 110> and
< III > axes. The peak height of the < 111 > double peak is smaller than that of the < 110 >
double peak. The < 100> Ni-dip has the same half-width at half-minimum as that of AI-dip.
The double peak results from the flux-peaking effect and indicates that Ni atoms are located at
interstitial sites. These experimental results suggest that the Ni atom occupies the interstitial
site displaced from the nonnal lattice site in the Al crystal in the < 100> direction. In the
< 110> angular scan, the AI-dip has fine structure consisting of a small double peak around the

101
center of the dip, i.e., 8p = ±0.03°. As in the case of Ni atoms, this result suggests the presence
of interstitial Al atoms displaced from normal lattice sites by nearly the same amount in the
< 100> direction. Such displacement of Al atoms is considered to be induced by Ni atoms
occupying the adj acent interstitial sites. Thus a split type interstitial consisting of an Al and a Ni
atoms is produced.
The first order expression to relate the angular position of the peak 8 p to the displacement
position from the center of the channel rj is given by
(1)
where E is the incident ion energy and U(r) is the continuum potential of the atomic row,
normalized to value of zero at the potential minimum. Using the continuum potential given by
Erginsoy for U(r),3) the magnitude of the displacement of Ni atoms from normal lattice sites
in the < 100> direction was estimated to be about 1.3(a/4) and 1.2(a/4) from the data of < 110>
and < 111 > angular scans, respectively, where a represents the lattice constant of the Al crystal.
These two values are in fairly good agreement. For interstitial Al atoms the displacement was
a little larger than that of Ni atoms, i.e., 1.4(a/4). The channeling experiments made by Swanson
et al. on Al-Mn alloys irradiated and annealed at low temperatures indicate the presence of < 100>
mixed split type interstitials.l) A Mn atom has the atomic size close to that of a Ni atom, and
the displacement of Mn atoms in the < 100> direction was estimated to be about 1.3(a/4). As
to such displacement no calculation has been made for Al crystal, but for a split type
self-interstitials in Cu crystal Gibson et al. obtained about 1.2(a/4) by the calculation using the
Born-Mayer potentia1.4 ) The experimental results by Swanson et al. and by the present authors
are in good agreement with the calcul ated one.
References
1) M. L. Swanson, F. Maury, and A. F. Quenneville: Application of ion beams to Materials,
Plenum Press, New York, P. 393 (1974).
2) E. Yagi, A. Koyama, H. Sakairi, and R. R. Hasiguti: IPCR Cyclotron Progr. Rep., 11, 102
( 1977).
3) C. Erginsoy: Phys. Rev. Lett., ~ 360 (1965).
4) 1. B. Gibson, A. N. Goland, M. Milgram, and G. H. Vineyard: Phys. Rev., 120, 1229 (1960).

102
6-11. Hyperfine Interactions of 119Sn In Magnetic Chalcogen Spinels
T. Okada, H. Sekizawa, and T. Yamadaya
Recently, much interest has been aroused by the discovery of large hyperfine magnetic fields
induced at the diamagnetic-atom nuclei in various magnetic materials. These magnetic fields are
induced by the supertransferred hyperfine interactions. The purpose of the present work is to
investigate the supertransferred hyperfine field (STHF) at diamagnetic ions such as tin ions in
magnetic materials by means of Mossbauer spectroscopy. Ions of stable isotope 119Sn is used in
our investigation. Investigations on hyperfine interactions of diamagnetic Sn ions in ferromagnetic
chalcogenide spinel system CuCr2
_ x SnX
S4 (0 < x < 1) have previously been carried out.!), 2)
The present investigation is an extension of the work to a series of similar magnetic Cr chalcogenide
spinels to elucidate the mechanisms giving rise to the hyperfine interactions in these systems.
Samples used are tin doped spinels with fonnula ACr 1.9 SnO.1 X4 , where A denotes various
divalent metal ions occupying tetrahedral sites and X denotes S, Se or Te. The Cr ions occupy
the octahedral sites, and a small amount of Sn ions doped into these crystals are known to
occupy the same sites repl'lcing Cr ions. All the samples were prepared by procedures similar to
those described before. 1) The observed Mossbauer line widths were generally much broader than
the natural width. The electric quadrupole splittings were negligibly small for all the samples.
For some of the samples, the sign of the hyperfine magnetic field was detennined by applying an
extemallongitudinal magnetic field of 35kOe. The values of the isomer shifts (IS) at room
temperature, the hyperfine magnetic field (Hhf) at 5K and the magnetic properties are listed in
Table 1. In Fig. 1 the IS of various samples are plotted against the lattice constant. As can
Table 1. Hhf at 5K, IS at room temperature, magnetic ordering temperature and magnetic properties of various Cr chalcogen.
Hhf IS Tc or Tn Mag. (kOe) (mm/s) (K)
CuCr1.9S%.1 S4 +600 +1.50 395 ferro
CuCr1.9S%.1 Se4 +570 +1.70 418 ferro
CuCr1.9S%.1 Te4 +280 +2 .10 343 ferro
FeCr1.9 S%.1 S4 +600 +1.25 186 ferri
CoCr1.9 S%.1 S4 +580 +1.35 212 ferri
MnCr1.9S%.1 S4 220 +1.20 90 ferri
CdCr1.9S11o.1 S4 +220 +1.15 82 ferro
HgCr1.9S%.1 S4 140 +1.15 31 meta
CdCr1.9S%.1 Se4 +270 +1.50 125 ferro
HgCr1.9S11o.1 Se4 160 +1.50 101 ferro
ZnCr1.gS11o.1 S4 120 +1.20 16 antiferro
ZnCr1.gS11o.1 Se4 130 + 1.55 18 antiferro

,...... +2.0 -Vl ...... S S
H <l> S
x=s
~ +1. 0 -
ACrl.9SnO.lX4 0: S A: Se
H
I I
9.5 10.0 10.5 Lattice constant
a: Te
1
11.0 (A)
Fig. 1. Isomer shifts at room
temperature relative to BaSn03 versus
lattice constants for ACr1.9SnO.l X4 .
0: sulfide, 6.: se1enide, 0: telluride.
11.5
I
A=Fe 0 10 Co
, ,
, I ,
CdMn , i Cd co'
Hg./ Hg &-0/ A
ZnZn
I , , I
I , ,
0: S A: Se C' Te
103
" eu 0,' ,'A
eu ,
d Cu I
O ______ ~r ______ ~r ____ ~I ______ .r ____ ~
o 100 200 300 400 Magnetic ordering temperature
500 ( K )
Fig. 2 Hyperfine fields at 5K versus
magnetic ordering temperatures for
ACr1.9 SnO.1 X4 · 0: sulfide, 6.: selenide,
o : telluride.
be seen, the IS varies systematically. These results can be interpreted as fair reflection of the
degree of covalency between Sn and chalcogen ions in these compounds: for a fixed cha1cogen
ion, the increase in the lattice constant makes the distance between Sn and chalcogen ions larger
resulting in a decrease in covalency; for a fixed divalent metal ion, the covalency increases on
going from sulfide to selenide and then to telluride.
In Fig. 2, Hhf at 5K are plotted against the ordering temperature, T c or Tn' Apparently,
the compounds can be classified into two groups: the one comprizing CuCr2 X4 's, and the other
comprizing all the others which show some tendency of rough proportionality between Hhf and
Tc (or Tn)' In the Cr cha1cogen spinels, the Cr-Cr (or B-B) interaction is considered to be the
dominant one in determing the ordering temperatures. This, along with the tendency seen in
Fig. 2, suggests that polarized spins coming (directly or indirectly) from Cr ions to Sn ions
play an important role in giving rise to the STHF at Sn ions. A noticeable feature of the STHF
in the Cr chalcogen spinels is that they are positive in sign without exception so far as we have
determined. Our investigations will be extended to radioactive isotope 119Sb or 119 m Te ions
--wfiiCh are prepared by the Cyclotron.
References
1) H. Sekizawa, T. Okada, and F. Ambe: Proc. Intern. Conf. of Magnetism, ICM-73,~ 152
(1974). 2) I. S. Lyubutin and T.V. Dmitrieva: JETP Lett.,~ 59 (1975).

104
6-12. Positron Lifetime Study on Annealing Behavior
of Irradiated or Quenched Platinum
K. Hinode , S. Tanigawa, H. Kumakura,
M. Doyama, and N. Shiotani
Annealing behavior of 3 He ion- or neutron-irradiated platinum, and quenched platinum was
studied by means of positron lifetime measurements. After the Stage III annealing, the positron
mean lifetimes (TM) of neutron-irradiated specimens and quenched specimens recovered nearly
completely. However, TM of 3 He ion irradiated specimens showed only a partial recovery in this
temperature range.
Experimental conditions arc as follows:
3He ion irradiation: dose = 1.3 X 10¹⁷ /cm2 at a temperature below 100°C,
Neutron irradiation: dose = 3.8 X 10¹⁶ /cm2 at 4.2 K,
Quenching: from 1500°C (in air) to O°C (water).
Isochronal annealing for 20 min was carried out for each specimen, and Fig. 1 represents the
results of mean lifetime (TM) analyses.
The decrease of TM in quenched specimen has indicated a simple annealing process with the
activation energy of 1.4 eV between 250°C and 450°C. Here the second order reaction was
assumed. This value agrees well with that evaluated for vacancy migration process from electrical
resistivity measurements.1) In neutron-irradiated specimen, TM increased in the temperature range
between 100°C and 200°C and decreased at around 250°C and 400°C. In such case of neutron
irradiation, the short-range defect migration stages often appear at lower temperature than the
typical temperature of the long-range migration stages because of the structure of the damage. It
is plausible that the short-range vacancy migration to so-called 'stabilized depleted zones' causes the
IJ)
0.
140
•
-e- 3 He Irrad. Pt
-~- Quenched Pt
~ 130
120
110
600 Annealing temp. ( OC )
Fig. 1. Positron mean lifetimes of the three types of
the platinum specimens measured after each isochronal
annealing treatments.

growth of the zone resulting in the increase of 'TM. Successive decrease of 'TM (at about 250°C)
may be attributed to the long-range migration and annihilation of the vacancies. The highest
stage of decrease at around 400°C may be attributable to the annealing of the vacancy clusters.
For the above mentioned two specimens, 'TM have reached the value of that of the specimen
annealed well at 500°C.
105
In 3 He ion-irradiated specimens, 'TM showed a stepwise decrease around 320°C, and thereafter
the gradual decrease continued up to the temperature above 600°C. The type of the residual
defects could be an association of single vacancy or di-vacancy with a He atom.
Reference
1) J. J. Jackson: "Lattice Defects in Quenched Metals", Academic Press Inc., New York, p. 467
( 1965).

106
7. RADIOCHEMISTRY AND NUCLEAR CHEMISTRY
7 -1. Measurement of Exc itation Function for the
14N (p, n) 140 Reaction
T. Nozaki, T. Karasawa, M. Iwamoto,
Y. Terai, and M. Okano
Reliable thick target yield for the 14 N(p, n) 14 0 reaction is needed for the estimation of the
following two quantities in the production of l1e by the 14 N(p, ex) 11 e reaction: (1) required
thickness of neutron shields in the use of the 'Self-shielding Baby Cyclotron', and (2) activity of 14 0 formed simultaneously with 11 C in the on-line diagnostic use of 11 CO2 and 11 CO. We
measured the excitation function for the 14N(p, n) 14 0 reaction up to proton energy of 15 MeV.
Nitrogen gas was used as the target of the measurement. It was contained in cylinders (25.0
mm in height and 60 mm in inner diameter) made of metal pipes and aluminium foils of known
thicknesses. A suitable number of the cylinders were closely lined up on an electrical insulator
and bombarded with protons (15 or 8 MeV, 1 JiA, 1.2 min). The cylinders were then transferred
as quickly as possible to a counting room. The 2 .31 MeV ,),-ray activity of 14 0 was measured by
a Ge(Li) detector connected to two analyzers, one being operated in multi-scaler mode and the
other for taking the entire 'Y-ray spectrum for each 5 seconds. Since annihilation radiations from
the coexisting 11 C were so strong as to badly disturb the measurement , lead plates with 25 mm
total thickness were inserted between the source and the detector to attenuate them.
The excitation function thus obtained is shown in Fig. 1. Although we are confident in
its shape, there still remains up to 30 % uncertainty in the absolute cross section. Marked
differences are found between the present result and the same excitation function reported by
Kuan and Risser. 1 ) The cross section in their report is higher than our value by almost one order
u w (f)
10
8
~ 4 u
2
0~--1H~--~----~----~1~2----~14~--~1~6----
Energy ( MeV )
Fig. 1. Excitation function for the
14N(p, n) 140 reaction.

107
of magnitude. In our experiment, the excitation function for the simultaneous formation of 11 C
was also measured; the cross section obtained agreed fairly well with the generally accepted
value.2) The 14N(p, n) 14 0 reaction has thus been found to be of such a small cross section that
neither the neutron generation by this reaction nor the 14 0 contamination in the 11 CO2 and 11 CO
production requires any serious consideration.
References
1) H. M. Kuan and J. R. Risser: Nucl. Phys., ~ 518 (1963).
2) E.g., B. W. Wieland and R. S. Howell: Proc. 2nd Intern. Symp. Radiopharm. Chern., July,
Oxford (1978).

108
7-2. Chemical Separation for Charged Particle Activation
Analysis of Trace Oxygen in Various Metals
T. Nozaki and Y. Terai
Although oxygen in metals has been analysed by various methods, there have been some
problems of sensitivity and interference of surface oxygen. Charged particle activation analysis
by the reaction of 160cJHe, p) 18p is useful for the determination of trace oxygen.1) In this
analysis, however, gamma emitters formed from the metal matrices themselves usually interfere
with the measurement of the 18p positron annihilation. Hence, chemical separation with
consideration of 18p life time (110 min. half life) is needed. We have investigated rapid chemical
separation procedures for 18p from various metal plate samples (iron , copper, zinc, germanium,
tin, lead, silver, titanium, aluminum, molybdenum, and stainless steel) of high purity (99.9
99.9999 %).
The sample was bombarded with 3He particles (1 - 3 /lA, 16 MeV at metal plate surface)
for 10 or 30 min. The surface was chemically etched to remove the effect of surface oxygen
(Table 1). The plate was then dissolved in a selected reagent (Table 1) containing KP (5 mm<:>l)
or HP (larger amount) and the 18p was separated by the chemical procedure shown in Fig. 1.
NaOH
Coprecipitation
and Filtration
a) 5 mmol
Precipitation and
Filtration of
Zn(OH)2 and Zr(OH)4
b)
Measurement of Carrier Recovery
L-______________ ~,,~ ____________________ ~
Fe, Cu, Sn, Ge, Pb,
Ag, AI, Ti, Mo,
Stainless steel(Sus)
a) Carrier HF for ~i
b) LiF is used for Ti
Zn
Pig. 1. Chemical separation procedure.

109
Table 1. Etching reagents and dissolution reagents.
Fe eu Zn Sn Ge Pb Ag AI Ti Mo Sus
Etching { Bf, Br2 Br2 Br2 HF AcOH HN03
NaOH HF HN03
HN03
reagent AcOH AcOH AcOH AcOH HN03
H20
2
{HN0
3
HN03
Hel HN03
H20
2 AcOH HN0
3 Hel HF HN0
3 HN0
3 Dissolution Hel NaOH H20 2
HN03
Hel HCI reagent Cu(N03)2
Table 2. Oxygen contents (ppm) and carrier recoveries (%) in various metals.
Exp. Fe eu Zn Ge Sn Pb
Date
2/8 160 (13% ) 1.9 (38 %)
3/29 2.1 (36 %)
2.1 (13 %)
4/6 184 (59 %) <4 (14 %)
200 ( 4 %)
5/29 184 (14 %) 2.5 (42 %) 20 (21 %) 0.4 (10 %)
6/14 183 (44 %) 2.4 (56 %) 30 (63 %) 0.47 (74 %) 6.2 (59 %) 1.8 (47 %)
3.2 (33 %) 32 (51 %)
11/1 4.3 (72 %) 13 (53 %)
Exp. Ag Ti AI Mo Sus
Date
9/26 8.7 (58 %) 1030 (43 %) 0.24 (31 %) 5.8 (68 %) 29 (53 %)
8.3 (66 %) 0.16(31%) 6.0 (31 %) 30 (57 %)
11/1 9.4 (65 %) 980 (47 %) 0.18 (66 %) 9.9 (14%) 31 (53 %)
1070 (59 %) 0.25 (34 %)
11/15 0.29 (64 %)
Radiochemical purity of the separated 18F was checked by the gamma-ray spectra and the decay
curve.
No gamma-rays except annihilation radiation were found, and the decay curve agreed well
with the decay of 18F even for gennanium samples with low oxygen contents (0.5 ppm). The

110
carrier recovery was measured by titration with the help of a fluoride electrode. Quartz plates
were used as the activation standard. The separation time was always 60 to 90 min., which was
shorter than the half life of 18p. The oxygen contents and the carrier recoveries are given in
Table 2. The first column in this table shows the experimental date. The present methods
have been shown to give fairly good reproducibility.
Reference
1) T. Nozaki , Y. Yatsurugi, N. Akiyama, Y. Endo, and Y. Makide: 1. Radioanal. Chern., ~
109 (1974).

111
7-3. Charged Partie Ie Activation Analysis of Oxygen in
Silicon Nitride Film on Silicon Wafer
T. Nozaki, M. Iwamoto, K. Usami,
1. Mukai, and A. Hiraiwa
Charged particle activation analysis by the 16 Oe He, p )18 F reaction was applied to the
determination of oxygen in silicon nitride films on semiconductor silicon wafers, which are often
used as protective film and diffusion mask in the production of integrated circuits. The sample
film was prepared by epitaxial deposition from a gas mixture of SiH4 -NH3 -N2 under a glow
discharge in the Central Research Laboratory of the Hitachi Electric Company . Thicknesses of
the wafer and film were about 500 /lm and 30 to 500 /lg/cm 2 , respectively.
We used the same bombardment apparatus and similar experimental procedures as were
described in our previous report.1) Two identical samples were placed , with the film sides face to
face in good contact, on a water-cooled target holder and set in the bombardment apparatus. The
sample disposition is illustrated in Fig. 1 together with the classification of the oxygen position
in the sample. After evacuation, the samples were bombarded with 3 He particles (0 .5 to 0.8 /lA,
5 to 20 min) of 32.5 MeV initial energy, which was degraded by the beam window foils and the
wafer to about 7.5 MeV at the films. The silicon nitride film with some part of the wafer (about
5 mg/cm2 thickness) was then removed from the main part of the wafer by mechanical grinding
and was collected in a counting tube. This process was carried out separately for each of the
two samples bombarded in contact.
SiN, f il m
-~ I : Surface f L---r -. / -
II : F i lm in t er ior - ~. _ _ /
III : Int erf ace ~ ------r---~=--...t - Si sub s trate
~------~I \~ ________ ~
Forward 18 F Backs ide 18F Fig. 1. Sample arrangement.
The annihilation radiation from the tube was measured by a scintillation counter with a well
type crystal and a single channel analyzer. The decay curve thus obtained agreed completely
with the decay of 18 F after more than 2 h from the bombardment .
As for the activation standard, a stack of Mylar foils (about 3 mg/cm2 thickness) was
bombarded at an almost identical position with the silicon nitride films under bombardment to
give an apparent excitation curve for the 18 F formation in a 3 He energy range about 7.5 MeV.
The effect of a small variation of the wafer and film thicknesses on the result of the analysis was
corrected by the use of this curve.
The oxygen quantities thus determined are shown in Fig. 2 vs. film thickness for samples
of different thicknesses and various preparation conditions. Type A samples and Type B samples
were prepared from the gases in different cylinders and on different days. The temperature in
Fig. 2 is the temperature of the silicon wafer at the epitaxial deposition of the nitride film.

112
13 "-no ::t
c
'" c 0 u
c
'" ~ 0
2.5
2.0
1.5
1. 0
0 5
TYPE - A( 200' C)
X
/ o
TYPE -A( 260' C)
o x ~x TYPE- B { X 120'C
-x.....L/)'>----;,z:s::---:-c:,,--:-x-:-------XD...~ -....;,..;...;~ c:" 200' C c:"
OL------l~OO------~----~~----~~---
Fi 1m th ickness ( f.l g / cm2 )
Fig. 2. Oxygen quantity vs film
thickness.
c 0
u
'" ~ Ul
..Y. U
'" ClJ
0.4
0.3
0.2
0.1 x x
o
x/ x.x TYPE-B
O~----~~----~----~~----~~
Film thickness (f.l g/ cm2)
Fig. 3. Backside 18F fraction vs
film thickness.
In Fig. 3 is shown the film thickness dependence of the backside 18 F fraction, which is
the fraction of 18 F in the backside sample to the sum of 18 F in both samples (see Fig. 1).
From Figs 2 and 3, the position of the main part of oxygen in the sample can be known for
each type of the sample by deduction based on the ralationships in Table 1. These relationships
can be easily understood from the nuclear recoil effect of the 18 F at its formation. A summary
of the results is shown in Table 2. In order to get some more quantitative information about the
oxygen position, the spectrum for the forward recoil range of the 18 F is necessary. We are going
to measure it for various 3 He energies and in different materials.
The oxygen was also measured by ESCA, which is sensitive only to a surface layer of about
5 nm thickness. Actually, the results of ESCA were found to be higher usually by about one
order than those of the activation analysis for Type A samples.
Table 1. Oxygen position vs. observation quantities.
Oxygen position Film-thickness
Backside 18 F F ilm-thickness
dependence of fraction
dependence of total oxygen the fraction
(1) Surface Independent Small Independent
Proportional Larger Increase to thickness than I with thickness
(II) Film interior
Independent Larger Steeper increase than II than II
(III) Interface

Table 2. Quantity and position of oxygen (Summary of results).
Sample type
Oxygen quantity
Total quantity
Film-thickness dependence
Film-thickness dependence of backside F -18 fraction
Main oxygen position
Reference
A
Large (0.4 - 2/lg/cm2 )
Linear increase with thickness
Slight increase with thickness
[
Film interior + (0.2 - 0.6 %)
Surface (0.4 - 1.0 /lg/cm 2 )
B
Small (0.2 - 0.3 /lg/cm 2
)
Independent of thickness
Pronounced increase with thickness
Interface (0.2 - 0.3 /lg/cm 2
)
1) T. Nozaki and M. Iwamoto: IPCR Cyclotron Progr. Rep., 11, 116 (1977).
113

114
7-4. Production of Radioisotopes and Labelled Compounds
T. Nozaki, S. Ambe, Y. Terai,
M. Iwamoto, K. Fukushi, and T. Irie
Following radioisotopes were produced for their carrier- and salt-free separation study, labelling experiment or tracer use: 18 F, 43 K, 73,74 As, 73 Se, and 77 Br.l) - 3)
Use of KF-crown ether (l8-crown-6) system proved to be effective for fluorination with 18F
produced by 3 He- or a-particle bombardment of water.!) Th~ 18F-Iabelling yield was examined
for various conditions of the fluorination experiment, such as the reaction medium and quantity
of the crown ether and of the added carrier. Carrier-free 21-fluoro-progesterone-18 F has been
obtained by the reaction of 21-mesylprogesterone with the carrier-free K 18 F-crown ether in
chloroform followed by chromatography of the product. It was found that the presence of a
trace amount of foreign metal ions which form complex with fluoride ion would noticeably lower
the 18 F-Iabelling yield.
By bombardment of germanium with protons (IS Me V) 73, 74As was produced. The metallic
germanium target was dissolved in HF-HN03 , the solution evaporated, and the residue dissolved
in ION HCl. From the solution, Ge(lV) was removed first by CCI4 extraction and then by anion
exchange. The 73,74 As was reduced to As(lII) , extracted into C6
H6
, and back-extracted into
water to give an almost neutral salt-free solution of carrier-free 73,74 As. By colorimetry with
phenylfluorone, no Ge(lV) was detected in this solution (less than 1 j.1g in 10 ml). This product
was offered to Kitazato University to be used as an 74 As (T 1/2 = 17.9 d) tracer. As for 73 As, the
count rates of its Ka X-rays, KP X-rays and 13.3 ke V 'Y-rays were found to be in the ratio of
1500 : 300 : 1 when measured by a 16¢ X 5 mm Si(Li) detector. Possibility of using 73 As as a
Mossbauer source of 73 Ge is now under consideration.
Carrier- and salt-free separation of 73 Se from arsenic targets was studied by various methods. 2)
Volatilization of 73 Se oxide from condensed polyphosphoric acid added with a small amount of
H2 0 2 was found to be the most suitable for this purpose, because the arsenic proved to be
retained in the glassy poly phosphoric acid. Our study of 73 Se-Iabelling is reported separately in
this volume.
Agricultural use of 77 Br and 43 K has been continued. Uptake of 43 K by rice plants under
various conditions was studied in order to get information about the most effective use of
potassium fertilizers.
Carrier-free 21-bromoprogesterone-77 Br was successfully synthesized from the corresponding
mesylate, similarly with 21-fluoroprogesterone-18 F. Synthesis of radio-halogen derivatives of
cholesterol has been continued, and their adrenal affinity and lipoprotein binding were measured
and discussed. 3 ) Also, radio-halogen labelling of tyrosine and phenylalanine is under way for the
study of their mis-incorporation in protein molecules caused by aging of protein-synthesizing
enzymes.

115
References
1) T. Irie, K. Fukushi, T. Ido, and T. Nozaki: Proc. 2nd Intern. Symp. Radiopharm. Chern., p. 17
(1978), (Printed in Hammersmith Hospital, London).
2) T. Nozaki, Y. Itoh, M. Iwamoto, and K. Ogawa: ibid., p. 223.
3) K. Fukushi, T. Irie, T. Nozaki, T. Ido, and Y. Kasida: ibid., p. 49.

116
7-5. Preparation of 73Se-2-Selenouracil
K. Ogawa, * K. Taki, and T. Nozaki
For the purpose of the medical use ofselenium-73 (T1/ 2 = 7.1 h) instead ofselenium-75
(T 1/ 2 = 120 d) , synthesis of 73Se-Iabeled compounds has been studied.1) It is well known that
sulfur atoms in some thio-compounds such as 2-thiouracil and 6-mercaptopurine can be labeled
by isotopic exchange with el emental 35 S-sulfur. From the similarity of sulfur and selenium in
chemical properties, such an isotopic exchange can be expected to take place also between some
selenium compounds and elem~ntal selenium.
Actually , 2-selenouracil was found to be labeled by isotopic exchange with red 75Se-selenium
in a mixture of pyridine and carbon disulfide (I: 1) at 110°C. The occurrence of exchange was
confirmed by paper chromatography using a mixture of n-butanol , acetic acid and water (2: 1 : 1)
and also by repetition of reprecipitation and activity measurement. The result of the latter is
shown in Fig. 1.
Figure 2 shows the activity of 75 Se-2-selenouracil in the reaction of 2-selenouracil (1 mg)
with red 75Se-selenium (4.9 J.lg) in 2 ml of the above solvent at 110°C, as a function of the heating
time. When 73Se is used instead of 75Se, the radioactivity of 73Se-2-selenouracil gives a maximum
at a reaction time of 5 to 7 h because of the short life of 73Se.
75 Se-.2-selenouracil formed as above was leached from the reaction mixture into an aqueous
solution after the addition of hold-back carriers of red selenium (10 ml of CS2 solution) and
metallic selenium (10 mg) followed by evaporation of the solvent. The radioactivity of elemental
selenium remaining in this solution as a contaminant was found to be less than 0.5 % of the
product activity.
u
'"
u <l.> 0.
(f)
10
0L-------~------~2--------~3--
Number of reprecipitati ons
Fig. 1. Specific activity of 75 Se-2-
selenouracil after repeated reprecipitations.
* Faculty of Hygenic Science , Kitasato University.
100 0.5
0
~ 6 0 0
/;: ..... ,~ 0.4 U E
<l.> / " 8 0
(f) / () "- <l.> ~ & 0 "- (f)
-'- /:. "- ~ u "- 0.3 '" "
.-::J "-
U
~ to. "-~
r ~,,-',,-::J
50 g <l.> <l.> <f)
N <l.>
0.2 <f)
"-, ~ N a
:::! 6 0 <l.> >->-
0. 1 > ~
u > « u «
10 20 Time ( hr )
Fig. 2. Activity yield of 75Se-2-selenouracil
( -- 0 -- ) and activity of 73Se-2-
selenouracil (------~ -- --- ) as a function of
reaction time (h).

117
As reported previously,2) the selenium-73 was produced by the nuclear reaction 75 As(p, 3n) 73Se
induced by bombardment with protons from the FM cyclotron. After the target (As20 3) was
dissolved into the mixture of conc. HN03 and conc. Hel (3: I) containing 5 j.1g of H2 Se03 as
carrier, the selenium was reduced to red selenium with hydrazine and extracted into carbon
disulfide. In order to examine the contamination by arsenic, carrier-free 74As-arsenous acid was
added to the target solution and its behavior was followed. No activity of the 74As was detected
in the final carbon disulfide extract.
Thus 600 j.1Ci of 73Se-2-selenouracil was obtained by the reaction of 5 mCi of 73Se with 1 mg
of 2-selenouracil in the above solvent (2 ml) at 110°C for 7 h.
References
1) K. Ogawa, K. Taki, T. Nozaki, and M. Okano: IPCR Cyclotron Progr. Rep., l!..z 137 (1977).
2) T. Nozaki, Y. Hoh, M. Iwamoto, T. Karasawa, K. Fukushi, T. Irie, and T. Hara: ibid., p. 134.

118
8. RADIATION CHEMISTRY AND RADIATION BIOLOGY
8-1. Measurement of Fast Emission Decay of
Heavy lon-Irradiated Single Crystals; Nanosecond
Time-Resolved O"-Emission Spectra of KBr
K. Kimura and M. Imamura
We have made measurement of the emission spectra for heavy-ion irradiated single crystals to
elucidate the nature and behavior of the electronic excited states, and compared with the results
for X-ray or electron irradiation. In fact, an extraordinarily large intensity-ratio of a-emission to
1T-emission has been found with a KBr single crystal irradiated with C-ions at 4 .2 K;l) the ratio
is about 5 times larger than that for X-ray or electron irradiation. We have intended, for better
understanding of the primary processes in the heavy-ion irradiated systems, to measure the
time-dependent emission spectra with a resolution of nano-subnanosecond. There are many
difficulties, however, for accomplishing such a resolution because of low and unstable beam
current and inherent widths of beam pulses as well as the requisition of a highly sensitive
detection technique. These difficulties have ultimately been overcome by developing the
assembly of equipments described below, and the measurement of decay curves was successfully
made with KBr at 4.2 K.
The decay processes of emissions were studied under the conditions of single-ion irradiation
and single photon counting using a TAC (time-to-amplitude converter). Experimental setup is
shown in Fig. 1. A thin plastic scintillator about 10J,Lm thick placed on the way of heavy
ion-beams emits several tens photons per an ion having passed through, which were detected with
a Hamamatsu R647 photomultiplier (dark counts: about 20 cps) to generate "stop pulses". As
the present beam current is less than the rate of an ion per a beam bunch, the width of the beam
bunch is negligibly small. 'Start pulses" were generated by the output from the photomultiplier
Scintillator
Cryostat
Fig. 1. Setup for measurement of
time-dependent emission spectra.

119
which detects emission from a target cooled at 4 .2 K. Since the frequency of the stop pulses
was conditioned to be much higher than that of the start pulses, exact measurement of the lifetimes
of excited states could be performed. Periods between the stop and start pulses were measured
with a T AC in the setup shown in Fig. 1. The counts of output pulses from the T AC were
accumulated using an online computer; the resulting plot of the counts vs. the pulse heights
gives the decay curve of the excited states at a given wavelength. The time scale was calibrated
using a RF frequency of the cyclotron or delay lines. Figure 2 shows such a decay curve
obtained at 280 nm for the a-exciton created in a KBr single crystal irradiated with 85Me V
C-ions at 4.2 K. Apparently the decay curve consists of two components as shown in Fig. 3,
where logarithm of photon counts is plotted as a function of time. The half-lives of the intense
and short-lived component and the weak and long-lived one were found to be 2 and 7 ns,
respectively; the corresponding values reported for electron or proton irradiation are 3.3 and 17 ns,
respectively. 2) Very close half-lives of the fast-decay components for heavy-ion and electron or
(f)
c: o
~
~ :::J o
U
o
1500 130 ns
1000
(f)
c 0 (3 -c c-
o
~ :::J 500 0 u
o~-------------------------------------------------
Fig. 2. A plot of photon counts vs. pulse heights for KBr irradiated
at 4.2 K. C6+ - beam currents were about 10 pA. Separation of beam
bunches was 130 ns.
Fig. 3. Exponential plot of the data 10 20 in Fig. 2.
ns

120
proton irradiation as well as a good straight line in Fig. 3 indicate that neither interaction of
the a-excitons with color centers nor interaction between a-excitons takes place in these irradiated
crystals. This conclusion supports the previous suggestion3) that the extraordinarily large intensity
ratio of the a-emission to 1T-emission is due to interaction of free excitons at the higher excited
states. In conclusion , we can say the yield of the a-exciton is 5 times higher than that of the
1T-exciton in the heavy-ion irradiated KBr single crystal.
Our technique is useful for elucidating dynamic processes in the primary stages of heavy-ion
irradiation which have been little known. Furthermore, this technique may be useful in the cases
of irradiation experiments under sparse beam currents, e.g., when using radioisotopes.
The authors are indebted to T. Fujisawa for helpful advice and support to the coincidence
technique.
References
1) K. Kimura and M. Imamura: Phys. Lett., 67A, 159 (1978).
2) I. M. Blair, D. Pooley, and D. Smith: AERE-R6906 (1971).

121
8-2. Effects of a-Particles on Mammalian Cells
M. Sasaki, S. Sawada, F. Yatagai,
1. Kaneko, and A. Matsuyama
Experimental studies are in progress on the action of high LET particles on mammalian cells
since 1976. Following works were done in 1978:
1. Relative effectiveness of ex-particles and ')'-rays in the formation of chromosome aberration in human blood lymphocytes.
Peripheral blood lymphocytes obtained from healthy person were irradiated with 4.8 MeV/ amu
ex-particles accelerated by the cyclotron and the frequencies of chromosome aberrations were
measured with the cells at the first mitosis after irradiation. Chromosome aberrations were
efficiently produced and a linear dose-response relation of I X 10- 2 / cell/rad was obtained for the
induction of dicentrics and rings. The distribution of chromosome aberrations among cells
deviated from the Poisson distribution. This fact indicates that a-particles do not give the uniform
effect on the cell, especially in the low dose range differing from that X-or ,),-rays. This feature
could be reasonably explained by the track model in which the dose is not given in rad but by the
number of particles which penetrated a cell. The track model when applied to the distribution of
chromosome aberrations indicates that a single passage of a 4.8 Me V / amu a-particle, corresponding
to the average dose of 27 rads , leads to the interphase death of the cell and/or the inactivation of
phytohemagglutinin activity to give survival level of approximately 37%.
2. Comparison between the effect of ,),-rays and that of a particles in the production of
double-strand cuts and their rejoing in DNA of mouse leukemic L5178Y cells by DNA fiber
autoradiography .
Mouse leukemic L5178Y cells labeled with 3 H-thymidine were irradiated with Co 60 ,),-rays
and a-particles acceralated in the cyclotron (4.8 Me V / amu at sample). Immediately after
irradiation, cells were collected to prepare for molecular auto radiograms of DNA to estimate the
number of double-strand cuts. At various times (up to 120 min.) of post-irradiation incubation
at 37°C, the number of rejoined broken DNA strand was determined. Cells collected in these
determinations were treated as described previously for the case of DNA fiber autoradiography.1)
Preliminary results showed that the length of DNA becomes shorter with the increase of
irradiation dose up to 20 krads but no further change occurs up to 50 krads in both ')'- and ex-ray
irradiation. It appears that Co 60 ,),-irradiation might be more effective for the production of the
double-strand cuts of DNA than a-irradiation, although the temperature effects during the
irradiation remains to be investigated. The length of the irradiated DNA increased in proportion
to the time of incubation at 37°C after the irradiation and returned to the length of the
unirradiated DNA by 120 min incubation at 37°C. These facts indicated that DNA damages by
a-particles were repairable as well as those by Co 60 ,),-rays. The rate of the repair in the case of
')'-ray irradiation was higher than that of a-particle irradiation.

122
3. Storage of cultured mammalian cells
To meet the need of constant supply of cells for further investigations concerning the effect
of high LET radiations on the mammalian cells, Chinese hamster V79 BIM, mouse L-929 , mouse
Lp3COR, and HeLa S3 cells have been stored in liquid nitrogen.
Reference
1) S. Sawada, M. Sasaki, S. Okada, F. Yatagai, I. Kaneko, and A. Matsuyama: IPCR Cyclotron
Progr. Rep. , 11, 42 (1977).

123
8-3. Studies on Molecular Damages Induced by High-LET Partie les
F. Yatagai, S. Kitayama, Y. Hattori, and A. Matsuyama
1. Inactivation of ribonuclease A in solution by a-particles
Effect of a-particles with energy of about 4.6 MeV /amu on the inactivation of bovine
pancreatic ribonuclease (RNase) A (EC 2.7.7.16) in solution was studied with particular attention
to the influence of co-existing substances. The apparatus and system were essentially the same as
described previously.1) Sample solutions were as follows: (1) 5 X 10- 6 M aqueous solution of
RNase A; (2) 5 X 10- 6 M RNase A plus salmon sperm deoxyribonucleic acid (DNA) (1 O~g/ml)
- RNase-DNA complex; (3) 5 X IO- 6M RNase A in O.IM NaCI04 plus DNA (10~g/ml) -
dissociated complex; (4) 5 X IO- 6M RNase A in O.IM NaCI04 . Experimental results obtained so
far showed some protective effects on the inactivation of RNase A in the above-mentioned three
types of mixed solutions: (2), (3), and (4).
According to Lynn,2) DNA protects RNase A against inactivation by ,),-rays when it forms
complex with RNase A, but DNA does not show such action when the complex is dissociated by
the presence of O.IM NaCI04 . Since CIO; has an extremely low affinity to OH radical and
hydrated electron as well,3) it seems improbable that CIO; acts as a scavenger for those species.
Thus the protective activity of the solutions containing NaCI04 in case of a-irradiation suggests
that the mechanism of enzyme inactivation by a-particles may differ from that by 'Y-rays.
In the course of study in this period it was found that the improvement of the cell for
irradiation is necessary in order to increase the reproducibility of data.
2. Induced rr.utagenesis in phage cf>X 174 irradiated with a-particles and N-ions
An amber 3 mutant of phage cf>X 174 was irradiated with a-particles and N-ions having energy
of about 4.6 MeV/amu to determine the efficiency of reverse mutation to (pseudo) wild-type. In
the cases of both ion beams, the efficiency did not increase with increasing dose to the phage
when host cells (§. coli HF47043 (uvrA)) had not been irradiated. On the other hand, mutation
induction was observed with UV-irradiated host cells. The induced mutagenesis observed can be
explained by the error-prone DNA repair (sos repair) in the UV-irradiated host cells.
Molecular mechanism of induced mutagenesis has been studied by analysis of the first round
DNA replication on UV-irradiated cf>X174 DNA.4) UV-induced photolesions in viral DNA are
considered to cause a permanent blockage of DNA replication in intact host cells, while a significant
fraction of irradiated cf>X 174 DNA molecules seems to be fully replicated due to the sos repair in
UV-irradiated host cells. Similar analysis was made on a-particle irradiated cf>X 174 DNA, but there
was no increase in the relative amount of double-stranded DNA which was estimated from
equilibrium CS2 S04- Hg density-gradient analysis. The relative amount of double-stranded DNA
was also found to be much higher than that predicted from the surviving fraction of irradiated
cf>X 174. These preliminary results suggest the possibility that some components other than
replicative form (RFI) may be included in the double-stranded DNA fractions obtained.

124
3. Enhanced priming activity of DNA in M. radiodurans by N-ions
Irradiation of cells or DNA at low LET range induces single strand breaks in duplex DNA and
some of them are priming sites for DNA polymerase. This is the reason why ,),-ray irradiation
stimulates DNA synthesis in living cells or permeable cells as previously reported.5 ) - 8) After
improvement of irradiation apparatus to keep the temperature near O°C, permeable cells of M.
radiodurans were irradiated ~ith ~-particles (4.78 MeV/amu). It was concluded that biochemical
lesions similar to those induced by ,),-rays were brought about along the track of ~-particles.8)
This conclusion was supported by "42°C effect" on M. radiodurans, i.e. loss of extreme
radioresistance of this bacterium by brief postincubation at 42°C following the irradiation with
,),-rays, ~-particles or treatment with chemicals which induce single strand breakage in DNA. 9)
Permeable cells of M. radiodurans covered with a thin filter were irradiated with N-ions (4.5
MeV/amu) to compare the changes in template/primer activity of endogenous DNA. DNA
synthetic rate was increased up to 2 fold by increasing the dose of N-ions as was the case in ,),-ray
irradiation. This result implies that N-ions induce the same biochemical lesions in DNA as
irradiation with low LET radiation along its track where many secondary electrons are ejected.
This supports the conclusion that biochemical lesions induced by high LET particle irradiation is
accompanied by many lesions similar to those induced by ')'-rays of 60 Co even if characteristic
biochemical lesions are induced by such particles.
References
1) Y. Hattori, F. Yatagai, and A. Matsuyama: IPCR Cyclotron Progr. Rep., il, 130 (1977).
2) K. R. Lynn: Radiat. Res., 66, 644 (1976).
3) M. Anbar and P. Nete: Int. 1. Appl. Radiat. and Isotopes, l..§., 493 (1967).
4) P. Caillet-Fauguet, M. Details, and M. Radman: 1. Mol. BioI., 117,95 (1977).
5) P. T. Emmerson and M. Kohiyama: Nature, New Biol., 233, 214 (1971).
6) D. Billen and G. R. Hellerman: Biochim. Biophys. Acta, 361,166 (1974).
7) S. Kitayama and A. Matsuyama: ibid, 418, 321 (1976).
8) S. Kitayama, F. Yatagai, and A. Matsuyama: IPCR Cyclotron Progr. Rep., 11, 126 (1977).
9) S. Kitayama, K. Siratori, F. Yatagai, and A. Matsuyama: Agr. BioI. Chem.,.±l., 2297 (1977).

125
9. RADIATION MONITORING
9-1. Routine Monitoring
K. Igarashi, 1. Sakamoto, and 1. Usuba
Results of routine radiation monitoring carried out on the cyclotron from April 1977 to
March 1978 are described.
No remarkable change in leakage radiation and residual activities was observed during this
period. Some aspects of the leakage radiation are described in the following report.
(1) Surface and air contamination
The surface contamination has been kept below 10- 6 /lCi/ cm2 on the floor of cyclotron
room and the underground passage, and below 10- 7 /lCi/ cm 2 in the experimental areas, hot
laboratory and chemical laboratories. The contamination was wiped off twice a year, and by this
decontamination, the contamination on the floor of cyclotron room and the underground passage
could be reduced to a value below 10- 7 /lCi/ cm 2 .
When the accelerating chamber was opened, slight contamination of the air in the cyclotron
room was observed. The value of radioactivity concentration (beta-gamma) was 10- 13 /lCi/ cm3 .
(2) Drainage
The radioactive concentration of the drain water from the cyclotron building was found to be
Table 1. Annual exposure dose received by the cyclotron
workers from April 1977 to March 1978.
Workers Dose undetectable
Operators Nuclear physicists 11 Accelerator physicists 5 Physicists in other fields 12 Nuclear chemists 1 Radiation chemists 7 Biological chemists 8 Health physicist
Average annual dose per person: 41.9 mrem
Maximum individual annual dose: 540 mrem
Number of persons
10-100 101 - 300 >300 (mrem) (mrem) (mrem)
1 5 9 2 1 8 7 4
Total
Collective dose (man-mrem)
1740 460 200 170 940
10 3520

126
of the order of 10- 7 j1Ci/cm3 . The total quantity of activities in the aqueous release in this
period was about 3.4 j1Ci, which is about 13 % larger than that of the last year.
(3) Personnel monitoring
The external exposure dose to personnel was measured with gamma-ray and neutron film
badges. The dose received during the present period by all the cyclotron workers is shown in
Table 1. The collective gamma-ray dose to all workers was 3520 man-mrem, while those owing
to thermal and fast neutron exposures were too small to be detected.
The dose to the cyclotron workers increased by ahout 61 % conlpared with that of the last
year. In this period the dose to the cyclotron operators was 1740 man-mrem, which was 49.4 % of the dose of cyclotron workers, and the maximum individual annual dose was 540 mrem.

127
9-2. Leakage Radiation Measurement at the Underground Passage
1. Sakamoto
Leakage radiation during operation of the cyclotron at the underground passage of the
cyclotron building was measured. Leakage dose received during the present period by the gamma
neutron film badges which were left at the underground passage, is shown in Table 1. The ratio of
neutron dose to total dose was about 0.3.
Among the dose values at the point No.1 measured every month, the maximum dose of 2770
mrem was observed in October. In this case, the values of gamma dose, thermal neutron dose and
fast neutron dose were 1680 mrem, 860 mrem and 230 mrem, respectively.
The machine time for deuteron acceleration was allotted in May, July and October. The
total dose at the point No.1 measured in the three months was 4990 mrem, which was 78.7 % of the total dose in this period.
Table 1. Leakage radiation dose (in mrem) at the underground
passage from April 1977 to March 1978.
Radiation
gamma ray (mrem) thermal neutron (mrem) fast neutron (mrem) Total (mrem)
* See the figure shown below.
4390 1670 280
6340
2
430 110 40
580
Cross section Ground plan Basement

128
10. HEAVY ION LINEAR ACCELERATOR PROJECT
10-1. Status of the Constructiona I Work
M.Odera
All resonators , except the first one which was installed at the end of 1976 were installed this
year without any significant change in their design from that of the first one. The first cavity was
tested for a year and only some minor modifications such as increase of capacity of motor for
shorting plane dri ve and change of material of the cooling water line inside of vacuum chamber
were found necessary. The second cavity arrived at the laboratory on Jan. 7th from theractory
and then at intervals of about ten days , other cavities were successively carried in. The installation
and alignment work was completed by the end of March. Figure I shows the array of six cavities
Fig. 1. Resonators in the accelerator vault.
129
installed in the accelerator vault.
Orders for the magnets of the beam transport line and their power supplies were given to the
factories in May and September respectively. Those will be installed before the end of Apr. 1979.
The radiation monitoring system is being manufactured. It will begin operation from Jan.
1979 to record background radiation before completion of the linac.
For the beam line , the ISO-type vacuum flanges and components have been adopted. Those
were developed from the European PNEUROP standard and can be easily mated with the Japanese
Industrial Standard components with the minimum number of converters. It is planned to
distribute the relatively small turbo-molecular pumps and getter ion pumps along the beam line
and to get high vacuum free of oil or other contamination.
Installation of the accelerator control system begins in Nov. and will be completed before
Aug. next year.
Construction of the remaining parts of the building such as the target areas, remote control
and measurement room, electronic shop, vacuum equipment testing room, ion source preparation
room etc. began in Feb. and finished at the end of November.

130
10-2. Installation and Alignment of the Resonators
and the Drift Tubes
M. Odera, Y. Miyazawa, and M. Hemmi
It took nearly three months to install the five resonators and to align them to the first one.
Some parts were rechecked for vacuum tightness before assembling, though they were tested
already at the factory. Some small leaks were found and stopped. Alignment of the drift tubes
in each tank was checked in the accelerator vault by the hot-wire method described in Ref. (1).
The optical axis of the drift tube quadrupole magnets was found within ± 0.1 mm of the beam
axis.
Relative positions of the six resonators were adjusted by use of the wedge and screw device
with the precision of ± 0.2 mm. The value is satisfactory since a couple of steering magnets can
easily correct beam trajectory for such small deviation if necessary.
Reference
1) I. Takeshita, I. Yokoyama, T. Kambara, and M. Odera: IPCR Cyclotron Progr. Rep., ~
140 (1976); I. Takeshita, T. Kambara, and I. Yokoyama: Reports I.P.C.R., (in Japanese),
53, 44 (1977).

131
10-3. Control System
T. Kambara, M. Odera, and S. Takeda
Parameters of many devices and power supplies of the linac should be set to different
combination of values corresponding to each energy-ion combination. In order to help operators
monitor and control the parameters, we introduce a control system using a minicomputer
HP2171A.
The computer plays the following functions: (1) a digital signal communication center
connecting the control room and the devices, (2) a signal conversion and display apparatus in
direct contact with operators, and (3) an auxiliary data keeper with which operators can talk and
interact. For the convenience of the software design, the IEC bus!) is used as the standard
data-way.
The interlock and sequence logic of the vacuum- and cooling-systems are hard-wired and
self-contained locally. Infonnations on their status are transmitted to the control room and
fed to the computer but no control commands are given from the computer.
Devices such as the magnet power supplies, the RF devices and the high-voltage power supply
of the injector can be controlled by the computer system. Protection, sequence and feedback
systems of each individual device are hard-wired locally. Every device sends its status infonnations
(on/off and interlock status, analog values) to the computer and when the device is not in local
control mode it receives commands (on/off, analog setpoints) from the computer.
As the interface between the computer system and the devices, four data stations are installed
in the accelerator vault and one in the control room. Those in the accelerator vault are connected
to the computer by a serial data link and the IEC bus. The data station has an intelligent
interface (a standard product of the Hewlett-Packard Company) and signal conditioner modules.
The intelligent interface has a control board with a microprocessor which talks with the computer, and several function boards which provide analog-to-digital conversion and digital input/output
under the control of the microprocessor. The signal conditioner modules are installed between
the function boards and accelerator devices for electric isolation and signal conversion. The data
station can provide the following input/output functions; (1) analog input by voltage signals with
full scale of 1 V or 1 OV, (2) analog output by voltage signal with full scale of 10V and resolution
of 10bit or l4bit, (3) digital input by floating contacts for status monitoring, (4) digital output by
relay contacts for status control.
A control console is installed in the control room which provides the interface between
operators and the computer. The data (status and numerals) gathered by the computer are
displayed on each of two CRT's (one character display and one graphic/character display) in the
most convenient fonnat. Operators can change the status and setpoints using a cursor and a
keyboard, and they can also command calculations or data-loggings by calling adequate programs.
The graphic/ character display is used to show the results in diagrams or graphs.
The device hierarchy is shown in Fig. 1. The computer uses a real time operating system
RTE IV which provides foreground and background capability.

132
Serial line
I E C
b u s
Communi cati on in te rf ace
Console
~§
Contr ol room Accele rato r vau lt
Fig. I. Hardware hierarchy of the computer system.
Video and other fast signals are transmitted to the control room via coaxial cables individually.
A TV display panel and an oscilloscope panel are set in the control room. There are also
monitoring panels for cooling, vacuum, and radiation leakage watching systems. The display
circuits of them are hard-wired independent of the computer system.
The hardwares such as the signal conditioner modules are being manufactured and tested in
the factory of the contractor. The whole system will be installed in spring 1979.
Reference
Table 1. Hardware components of the computer system.
Computer
They are the standard products of the
Hewlett-Packard Company.
CPU HP2ll3
Main memory 16 bit 96 kW
Disc 20 MB
Magnetic tape 9 track 800 bpi
Console
24 X 80 character display
24 X 80 graphic/character display
Serial printer
I/O devices
HP2240A/2241 A intelligent interface
IEC bus
Serial link compatible to the IEC bus
I) Dale Horelick: IEEE Trans. Nuc1. Sci. , NS-22 , No. I, p. 488 (1975).
5

133
10-4. Design of a Beam-Emittance Measuring Device
J . Schimizu and M. Odera
Besides beam intensity one of the most important properties of an injector system is the beam
quality as measured by emittance. A detailed knowledge of the beam-emittance behavior as a
function of particle mass to charge ratio, injector voltage and transport parameters is needed to
match the injector system to the later section of the accelerator. A device to measure simply and
quickly the emittance of an ion beam is therefore a valuable diagnostic tool for injector system
and for ion source development and test work. In this report a simple beam-emittance measuring
device is described.
Figure 1 shows the principle of the emittance-measuring device . The beam of the injector
impinges upon the aperture plate; that part of the beam which passes each slit is analyzed by a
scanning probe after traversing the drift length L of 15 cm. The current collected by the scanning
probe is fed into x-y recorder. The position of a particular slit gives the transverse coordinate on
the emittance diagram (xl or Y I) and the corresponding image is converted into a measure of the
divergence (x' or y') by means of the following formulae: 1)
(a)
(b)
Apert ure plate
"i\ ~
~--~~~~--~-=-=-=---------- - -
"" • ·Beam ~
,
~
~ ~
::'::l ~-
~ 15cm
drift distance "L "
X : horizontal coordi nate Y : vertical coordinate
aperture plate
Si,t WidthLLe,-"d " I 82
distance between axis and sl it ce nter "Xl" or "Y j "
Sca nning probe
~ tantalum
[S'Sl copper
Beam --+--
Axis
Scanni ng probe
image width "W "
lJ.. di stance between .. axis and ..
image center "X 2 or "y 2
beam axis
Fig. 1. Principle of beam-emittance measurement. (a) Schema of
emittance measuring apparatus. (b) III ustrating method of calculating
angular limits of beam.

134
8 1 = arctan [{ (X2 + w/2) - (xl + d/2) } /L] ,
82 = arctan [ {(X2 - w/2) - (xl - d/2) } /L] .
The meaning of various symbols is given in Fig. l(b). The normalized emittance N is calculated
from following formulae:
N = €~'Y (mm mrad),
where € is the emittance given by
€ = A/n (mm mrad),
A = area of emittance diagram,
~ = ion velocity/c, 'Y = (1 - (32) - 1/2 .
Values of the main parameters of this device are as follows:
Ten slits of size 0.2 X 50 X 0.5t (Ta), each being separated by 6 mm, a probe of O. 3¢ X 50
(W) which is driven by a pulse motor with speed of 2 mm/sec and stroke of 75 mm,
drift distance 150 mm.
The beam-emittance measuring device described above does not work quickly but is very
simple. To study the quality of the beam from the injector system this emittance device is used
until a computer controllable quick device becomes available.
Reference
1) H. Wroe: Nucl. Instr. and Meth., 52, 67 (1967).

135
10-5. Stud ies on a PIG Source In the Test Foc i lity
1. Kohno, A. Shimamura, and T. Tonuma
In the test facilityl) we studied production of metal and non-metal ions and formation of ion
beam at the position 1.4 m downstream from the source magnet.
For production of metal and non-metal ions a PIG source shown in Fig. 1 which has a
sputtering electrode was fabricated. The anode of this source consists of three parts. Upper and
lower parts are made of copper cooled by water and the part at the center is made of stainless
steel. A sputtering electrode is made of a charge material and insulated from the anode. When
25-
~ 20r-
3-c ~ 151-:J u
C
~ 10-
Charge material (Fe) supporting gas: Ar B=5.9kG
Arc (~~OV)
Ar+
56 40 28 20 13.3 10 8 (Mlq)
Fig. 1. Hot cathode PIG source with a
sputtering electrode.
CD Filament, CD Cathode, 0® Cold anode (Cu),
o Slit, ® Sputtering electrode,
® Insulator, (j) Anode (SUS),
® Anti-cathode.
Fig. 2. The m/q spectrum of the ion
beam measured in the test facility under
the source condition of Varc=440V,
Iarc=3A, supporting gas Ar, sputtering
electrode Fe.

136
an electrical potential of about -500 V relative to the anode potential is applied to the sputtering
electrode the charge material is sputtered by bombardment of ions from the arc plasma. Then
sputtered material is ionized and extracted from the ion source. Figure 2 shows a mjq spectrum
measured in the test facility when the ion source was operated under the following condition: arc
voltage 440 V, arc current 3 A, supporting gas Ar and sputtering electrode Fe. In this figure we
can recognize the existence of Fe+ and Fe2+ ions together with several Ar multiply charged ions.
Although Fe3+, Fe4+, and Fe5+ ions could not be found in the spectrum because of poor
resolution, it is supposed that they are produced in the ion source, because Ar3+, Ar4+, and
Ar5+ ions are produced with enough quantities. Figure 3 shows the eroded sputtering electrodes
after two hours operation and seven hours operation of the ion source, respectively.
Fig. 4.
facility.
Fig. 3. Three sputtering electrodes: from
right to left not eroded, eroded after two
hours' operation and seven hours' operation,
respectively.
Faraday cup
Emittance measu rement assembly
Cross sectional view of the test

137
We have studied the formation of the ion beams extracted from the ion source using Ar2+
ions. Figure 4 shows a cross sectional view of the test facility. We could obtain a beam of good
emittance at the position of moving wire, 1.4 m from the source magnet by reducing the effect
of the magnetic fringing field by a magnetic sield and using an einzel lens system as is shown in
Figs. 5 and 6.
20 -0 20 OJ
10 1 10
Left Righ t Lower 40 o 10 20 20 ~
-10 (mm) o lOmm
-20 -20
Fig. 5. Beam emittance measured for Ar2 + . Fig. 6. Beam profile
measured by moving wires.
Reference
1) I. Kohno, A. Shimamura, and T. Tonuma: IPCR Cyclotron Progr. Rep., l1. 149 (1977).

138
10-6. Beam Transport System
M. Hemmi, Y. Miyazawa, M. Odera, and T. Tonuma
Figure 1 shows the layout of the beam distributing, focusing and analysing system. At
present, there are nine pipe-end stations and two mid-line stations for experiments. To guide
and focus the beam into those stations, one switching magnet, two analysing, one small angle
deflecting, one vertically deflecting magnets and ten quadrupole-doublet magnets are necessary.
All these magnets use so-called tape-coilsl) to make power dissipation small.
Fig. 1. Layout of the beam transport system.
SW: Switching mag., BA: Analysing mag., VM: Vertically
bending mag., DQ: Quadrupole doublet mag.,
ST: Steering mag., P: Pump, V: Valve, COL: Slits and Beam stopper,
CS: Charge stripper.

139
Figure 2 shows dimensions of the switching magnet capable to deflect all kinds of particles
accelerated by the linac. Its special mechanical structure to be mentioned is construction of its
vacuum chamber. A thin stainless steel plate 1.5 mm thick forms the side wall of the chamber
and is welded to the sides of the upper and lower pole tips which function as the lids of the
chamber. The stainless steel spacers determine pole gap. Parts of the pole tips in the vacuum is
plated· with nickel.
The analysing magnet is shown in Fig. 3. It can analyse particles having magnetic rigidity
less than 1800 kG-cm. Some ions have rigidity larger than this value and need to be chargestripped in order to be accepted by this analysing magnet. Since experiments expected
to use analysed beam do not require beams of high intensity, the need of charge stripping and
subsequent decrease of the beam intensity for some ions will not make difficulty. Its vacuum
chamber is made of flattened non-magnetic stainless tube of circular cross section. Its wall
thickness is only 1.5 mm and is easily flattened when pressed between pole tips. Those two types
of the vacuum chambers, i.e. those for the switching and the analysing magnets have been
suggested by R.M. Main of the LBL, University of California, when he visited this laboratory in
1977.
The vertically deflecting magnet (VM) has a similar construction to the analysing magnet
:--_---"84=0 ±==--'5"------_---l--_~840 ± 5 . 1680
Fig. 2. Beam switching magnet.

140
560
1 300
<.0 00 o
Fig. 3. Beam analysing magnet .
except it has pole boundary with its nonnal making angle of 26.5 degree between beam trajectory
at the beam entrance and exit in stead of the normal incidence of beam with the boundary in the
case of the analysing magnets.
Figure 4 shows the quadrupole doublet. The method of fabrication and characteristics of
its coils were described elsewhere. 2)
The ISO NW-63 size has been adopted for the beam pipes. The turbomolecular pumps of
120 lis and the getter ion pumps of the same pumping speed are used to evacuate the beam
lines. Beam diagnostic elements such as the beam profile, bunch and emittance probes in addition
to the slit box or Faraday chamber are distributed at suitable positions of the beam lines.
Fig. 4. Quadrupole doublet magnet.
References
1) R. M. Main and R. Yourd: Proc. 4th Intern. Conf. on Magnet Technology, p. 349 (1972).
2) M. Hemmi and F. Yoshida: IPCR Cyclotron Progr. Rep. , 10, 145 (1976).

141
10-7. Performance of an Axial Extraction PIG Ion Source
S. Nakajima
An ion source commercially available for ion implantation processipg of semiconductors has
been purchased for preliminary testing of the 500 kV accelerating column of the injector.
Operating characteristics of the ion source was measured to obtain parameter values suitable for the
intended use.
Figure 1 shows the cross section of the cold cathode PIG source of axial extraction type.
Fig. 1. Axial extraction PIG ion source.
CD Solenoid coil ® Cathode
® Gas inlet ® Anode
® Cathode aperture ® Insulator
(j) Extracting electrode
Change of arc currents as a function of arc voltage is shown in Fig. 2. Rate of gas supply is
taken as the parameter in (a) and the current in the coil which produces magnetic field at the
position of discharge in (b). Field strength is 150 Gauss for coil current of I A. In Fig. 3,
extracted currents are given as functions of the gas supply rate and coil current. The extracted
current is not necessarily proportioned to the rate of gas supply, while increase of coil current is
clearly effective to obtain high current. Variation of the extracted intensity as a function of
extracted voltage is shown in Fig. 4. For our purpose of the column test, 10 J.lA is sufficient
and the gas load to the vacuum pump is quite small. Divergence of the beam is 0.05 rad. at full
width for extraction voltage of 6 kV and 0.04 rad. for 8 kV at this small current.
The ion source works stably with the following parameter values: gas supply between 0.05
cc/min. and 0.5 cc/min., magnetic field between 200 and 500 Gauss and arc voltage between I and
3 kV.

142
60
50
~ 40 <! E
~ 30 Q)
::J U
u 20 ~
10
50
40
10
B=1.2A
Arc vo l tage (kV ) 0.4-0.45
O.lcc / min / cc/min /'
y' B=1.2A air fi
A~
...... --- .... -._-.--.--.-_.- 0.2cc/min
0L-L-~~~-L-L~~2~.0~~L-~L-3~.0~~
Arc voltage (kV )
a) Effect of gas feed rate with
N2 (upper) and air (lower)
c Q)
40
~ 20 u
~ 10
60
50
<! ~ 40
u
~ 20
10
Nz gas
........... " 0.2cc/mi n / .......... _. B=1.4A --._e_e-
r· . ..........--\ • "e_._e_e ____ e \
/ • :'zA _. ........ 1.0 2.0
Arc vo ltage ( kV )
r·-
3.0
I· ........... ,
......... . • .......... 1. 5A
air •
02cc / min/
I· I· .-.-. B= 1 2A
.~ __ e __ e_ /.-.-I· ./.
./ .. / 1.0 2.0 3.0
Arc vol tage ( kV )
b) Effect of magnetic field with
N 2 and air as discharge gas.
Fig. 2. Arc current characteristics as functions of arc voltage.
(a)
c Q)
::J U
2 ~ 6
x
Nz gas Arc voltage :1.2 - 1.3kV
Extraction vo l tage : 4 kV
Coil current : 12 A
.,..---.---. ~. ~
W 5L-~~~~-L~~~~~~~~ Q1 0.2 Q3 Q4 0.5 Q6
(b)
c Q)
::J U
-0
10
2 5 u co
x W
Gas supply (cm3 1m)
1.0 1.5 Coil current
Fig. 3. Extracted current as function
of (a) gas feed rate and (b) coil current.
Current was measured at 100 cm from
the anode.
15
2 u ~ x
W 5
0L-~L-~J-~5~L-L-L-~~10~L-
Extrac ti on voltage (kV)
Fig. 4. Effect of extraction voltage
on the beam intensity.

143
11. LIST OF PUBLICATIONS
1. Machine development and accelerator physics
1) H. Takebe, K. Ogiwara, and I. Kohno: "Measurements of the Tum-Separation and Vz of the
Ion Beam in the IPCR 160 cm Cyclotron", Reports I.P.C.R., (in Japanese), 54, 77 (1978).
2) A. Shimamura, T. Tonuma, and I. Kohno: "On the Multiply-charged Metal Ion Source",
Reports I.P .C.R., (in Japanese), 54, 116 (1978).
2. Nuclear physics and nuclear instrumentation
1) T. Nomura: "Evidence for a Pure Prolate-to-Oblate Transition between 56Fe and 58Fe",
Genshikaku-kenkyu, (in Japanese), 22, 104 (1977).
2) T. Kammuri, T. Motobayashi, I. Kohno, S. Nakajima, M. Yoshie, K. Katori, T. Mikumo,
and H. Kamitsubo: "Effects of Recoil and Sequential Transfer on the 12C ct4N, 12C)14N
Reaction," J. Phys. G.: Nucl. Phys., 1, L94 (1978).
3) F. Soga, J. Schimizu, N. Takahashi, K. Takimoto, R. Wada, T. Fujisawa, T. Wada, and
H. Kamitsubo: "Study of the Quasimolecular Resonance by the 24Mg (a, "Y)12C, 160
Reactions", J. Phys. Soc. Japan, 44, Suppl., 644 (1978).
4) Y. Toba, H. Sakaguchi" A. Goto, F. Ohtani, N. Nakanishi, N. Kishida, M. Yasue, and
T. Hasegawa: "Proton Inelastic Scattering on 28,29, 30 Si and Blocking Effect in the Core
Excitation of 29Si", J. Phys. Soc. Japan, 45,367 (1978).
5) T. Nomura, J. Delaunay, C. Tosello, and N. Bendjaballah: "Partial Breakdown of the
Evaporation Model and Possible Preequilibrium a-Particle Emission in Heavy Ion Fusion
Reactions", Nucl. Phys., A305, 262 (1978).
6) H. Amakawa, S. Yamaji, A. Mori, and K. Yazaki: "Two-Step Process in Proton Inelastic
Scattering", Phys. Lett., 76B, 157 (1978).
7) K. I. Kubo and H. Amakawa: "Energy Dependence of Two-Step (p, t) Cross Sections",
Phys. Rev., C17, 1271 (1978).
8) F. Soga, J. Schimizu, H. Kamitsubo, N. Takahashi, K. Takimoto, R. Wada, T. Fujisawa,
and T. Wada: "Intermediate Structures in 12C + 16 0 System through a-induced Reactions
on 24Mg", Phys. Rev., C18, 2457 (1978).
9) T. Nomura, H. Utsunomiya, T. Motobayashi, T. Inamura, and M. Yanokura: "Statistical
Analysis of Preequilibrium a-Particle Spectra and Possible Local Heating", Phys. Rev.
Lett., 40, 694 (1978).
10) T. Fujisawa, M. Nakamura, M. Yasue, N. Ueda, T. Hasegawa, H. Kamitsubo, K. Hatanaka,
T. Tanaka, M. Sekiguchi, T. Wada, Y. Toba, and F. Soga: "Spin Flip Asymmetry in the
Inelastic Scattering of Protons on 12C at 28 MeV", Proc. of INS Intern. Symp. on Nucl.
Direct Reaction Mechanism, Fukuoka (1978)
11) T. Tamura, T. Udagawa, and H. Amakawa: "Reformulation of DWBA Form Factor for
Heavy Ion Transfer Reactions", Prog. Theor. Phys., 60, 1238 (1978).
12) K. Sato, A. Iwamoto, K. Harada, S. Yamaji, and S. Yoshida: "Microscopic Calculation of
Friction in Heavy Ion Reaction Using Linear Response Theory", Z. Physik A, 288, 383
(1978).
3. Atomic and solid-state physics
I) Y. Itikawa, Y. Awaya, and H. Suzuki: "Reports on the 10th Intern. Conf. on

144
the Physics of Electronic and Atomic Physics, The 5th Intern. Seminar on Ion-Atom
Collisions, and the Satellite Meeting of Electronic Collisions", Butsuri (Phys. Soc. Japan)
(in Japanese), 33, 157 (1978).
2) A. Koyama: "Secondary Electron Emission from A 1 by High Speed Proton or Q'-Particle
Bombardment (Calculation)", Ionizing Radiation, (in Japanese), i, 17 (1978).
3) Y. Awaya and H. Kumagai: "An on-line X-ray Crystal Spectrometer of IPCR", Ionizing
Radiation, (in Japanese), i, 74 (1978).
4. Radiochemistry, radiation chemistry and radiation biology
1) F. Ambe and S. Ambe: "Defect 119Sn Atoms after Nuclear Decays and Reaction in SnSb
and SnTe", J. Physique, 37, C6-923 (1976).
2) M. Matsui and M. Imamura: "The Radiolysis of Binary Mixtures of Tetrahydrofuran with
Benzene, Thiophene, Pyridine, and Nitrobenzene", Bull. Chern. Soc. Japan, iL 2191
( 1978).
3) K. Kimura and M. Imamura: "Emission Spectra of Excitons Created in a Single Crystal of
KBr by Irradiation of Heavy Ions at 4.2 K", Phys. Lett., 67 A, 159 (1978).
5. Heavy ion linear accelerator
1) M. Odera: "Linear Accelerators of the Heavy Elements", J. Atomic Energy Japan, (in
Japanese), 20, 553 (1978).
(Papers presented at meetings)
1. Machine development and accelerator physics
1) H. Kamitsubo, S. Motonaga, T. Nomura, N. Nakanishi, T. Wada, I. Kohno, J. Fujita,
H. Nakajima, K. Ogiwara, H. Takebe, F. Yoshida, T. Fujisawa, T. Inamura, M. Ishihara,
S. Nakajima, S. Fujita, T. Kageyama, S. Kohara, T. Karasawa, M. Hemmi, Y. Miyazawa,
T. Kambara, I. Yokoyama, and I. Takeshita: "A Proposed Multipurpose Separated
Sector Cyclotron at IPCR", (lPCR Internal Report SSC-I) 2nd Symp. on Accelerator
Science and Technology, Tokyo, March (1978).
2) N. Veda, T. Hattori, T. Fujino, Y. Ohshiro, Y. Sakurada, and J. Schimizu: "Development
of Heavy Ion Source I", Ann. Meeting of Phys. Soc. of Japan, Sendai, Apr. (1978).
3) N. Kumagai, S. Motonaga, H. Kamitsubo, T. Wada, F. Yoshida, K. Ogiwara, N. Nakanishi,
and J. Fujita: "Model Magnet of the Separated Sector Cyclotron Proposed at IPCR",
Autumn Divisional Meeting of Phys. Soc. of Japan, Matsumoto, Sept. (1978).
4) H. Kamitsubo, S. Motonaga, N. Kumagai, T. Nomura, N. Nakanishi, T. Wada, I. Kohno,
J. Fujita" H. Nakajima, K. Ogiwara, H. Takebe, and F. Yoshida: "A Proposed Multi
Purpose Separated Sector Cyclotron at IPCR", 8th Intern. Conf. on Cyclotrons and
their Applications, Indiana, Sept. (1978); Autumn Divisional Meeting of Phys. Soc. of
Japan, Matsumoto, Sept. (1978).
5) T. Wada, N. Kumagai, H. Kamitsubo, S. Motonaga, T. Nomura, N. Nakanishi, I. Kohno,
J. Fujita, H. Nakajima, K. Ogiwara, H. Takebe, and F. Yoshida: "The Injection in IPCR
Separated Sector Cyclotron", 8th Intern. Conf. on Cyclotrons and their Applications",
Indiana, Sept. (1978).

145
2. Nuclear physics and nuclear instrumentation
1) F. Soga, J. Schimizu, N. Takahashi, K. Takimoto, R. Wada, T. Fujisawa, T. Wada, and
H. Kamitsubo: "Quasimo1ecu1ar Resonance by 24Mg (a, 12C)160 Reaction", Ann. Meeting
of Phys. Soc. of Japan, Sendai, Apr. (1978).
2) T. Tanabe, K. Sato, M. Yasue, J. Schimizu, K. Ogino, Y. Kadota, and F. Shimokoshi:
"Experimental Study of the Heavy Ion Reaction Induced by 116 MeV 2oNe", Ann.
Meeting of Phys. Soc. of Japan, Sendai, Apr. (1978).
3) A. Hashizume, T. Katou, H. Kumagai, and Y. Tendow: "High Spin States in 164Yb", Ann.
Meeting of Phys. Soc. of Japan, Sendai, Apr. (1978).
4) S. Ise, T. Inamura, K. Hiruta, T. Shimoda, T. Nomura, and M. Ishihara: "Coincidence
Measurements of Forward-peaked a-Particles and 'Y-Rays in the 159Tb+14N Reaction", Ann.
Meeting of Phys. Soc. of Japan, Sendai, Apr. (1978).
5) K. Hiruta, T. Inamura, S. Ise, T. Shimoda, and M. Ishihara: "Angular Distributions of
'Direct' a-Particles Emitted from the 159Tb+ 14N Reaction and Rainbow Angle", Ann.
Meeting of Phys. Soc. of Japan, Sendai, Apr. (1978).
6) T. Inamura, K. Hiruta, S. Ise, T. Shimoda, and M. Ishihara: "Kinematics of 'Direct'
a-Particles Emitted from the 159Tb + 14N Reaction", Ann. Meeting of Phys. Soc. of
Japan, Sendai, Apr. (1978).
7) H. Utsunomiya, T. Nomura, T. Motobayashi, T. Inamura, and M. Yanokura: "Preequi
librium a-Particle Emission in 14N-induced Reactions and Possible Local Heating I", Ann.
Meeting of Phys. Soc. of Japan, Sendai, Apr. (1978).
8) K. Sato, K. Harada, S. Yamaji, and S. Yoshida: "The Calculation of the Frictional
Coeffi cients on the Basis of the Linear Response Theory", Ann. Meeting of Phys. Soc.
of Japan, Sendai, Apr. (1978).
9) H. Amakawa, A. Mori, and K. Yazaki: "Core Polarization Effects on Inelastic Proton-13C
Scattering", Ann. Meeting of Phys. Soc. of Japan, Sendai, Apr. (1978).
10) K. Takimoto, R. Wada, E. Takada, M. Fukuda, T. Yamaya, H. Endo, K. Umeda,
T. Suehiro, J. Schimizu, and Y. Ohkuma: "The (d, 6 Li) Reaction on Light Nuclei at
54.25 MeV", 3rd Intern. Conf. on Clustering Aspects of Nuclear Structure and Nuclear
Reactions, Manitoba, June (1978).
11) A. Hashizume, T. Kimura, and T. Hamada: "The Decay of 206Bi and Measurement of
Internal Conversion Electrons", The 15th Ann. Meeting on Radioisotopes in Physical
Sciences and Industry, Tokyo, June (1978).
12) T. Inamura, K. Hiruta, S. Ise, M. Ishihara, T. Nomura, and T. Shimoda: "Angular
momentum Distributions of Residual Nuclei after Fast a-Particle Emission in Heavy-ion
Reactions", Intern. Conf. on Nuclear Interactions, Canberra, Aug. (1978).
13) K. Hiruta, T. Inamura, S. Ise, M. Ishihara, and T. Shimoda: "Angular Distributions of
Fast a-Particles Emitted from the 159Tb + 14N Reaction", Intern. Conf. on Nuclear
Interactions, Canberra, Aug. (1978).
14) K. Ogino, Y. Kadota, M. Yasue, J. Schimizu, Y. Nishiwaki, and K. Ohori: ,, 12C, 20Ne (a,d)
Reaction at Ea = 65 MeV", Autumn Divisional Meeting of Phys. Soc. of Japan,
Matsumoto, Sept. (1978).
15) K. Umeda, T. Yamaya, T. Suehiro, K. Takimoto, R. Wada, E. Takada, M. Fukuda,
J. Schimizu, and Y. Ohkuma:" 160, 40Ca, 58Ni(d, 6 Li) Reaction", Autumn Divisional
Meeting of Phys. Soc. of Japan, Matsumoto, Sept. (1978).

146
16) T. Kojima, T. Inamura, K. Hiruta, T. Nomura, and T. Sugitate: "Multiplicity of 'Y-Rays
Following Fast a-Particle Emission in the 159Tb + 95 MeV 14N Reaction", Autumn Divisional
Meeting of Phys. Soc. of Japan, Matsumoto, Sept. (1978).
17) K. Hiruta, T. Inamura, T. Kojima, and T. Nomura: "Energy Distributions of Channel
specified a-p1articles in the 159Tb + 95 MeV 14N Reaction", Autumn Divisional Meeting
of Phys. Soc. of Japan, Matsumoto, Sept. (1978).
18) H. Utsunomiya, T. Nomura, T. Sugitate, T. Inamura, and T. Motobayashi: "Preequilibrium
a-Particle Emission in 14N-induced Reactions and Possible Local Heating II", Autumn
Divisional Meeting of Phys. Soc. of Japan, Matsumoto, Sept. (1978).
19) T. Nomura, H. Utsunomiya, T. Motobayashi, T. Inamura, and T. Sugitate: "Energy
Relaxation during Fusion Processes Probed by Pre equilibrium a Emission", Autumn
Divisional Meeting of Phys. Soc. of Japan, Matsumoto, Sept. (1978).
20) M. Ichimura, B. Imanishi, and M. Kawai: "Study of (d, p) Reaction by Coupled Method",
Autumn Divisional Meeting of Phys. Soc. of Japan, Matsumoto, Sept. (1978).
21) T. Fujisawa, M. Nakamura, M. Yasue, N. Ueda, T. Hasegawa, H. Kamitsubo, K. Hatanaka,
T. Tanaka, M. Sekiguchi, T. Wada, Y. Toba, and F. Soga: "Spin Flip Asymmetry in the
Inelastic Scattering of Protons on 12C at 28 Me V", Autumn Divisional Meeting of Phys.
Soc. of Japan, Matsumoto, Sept. (1978).
22) T. Hoshino: "On the Adiabatic Approximation of TDHF", Autumn Divisional Meeting of
Phys. Soc. of Japan, Matsumoto, Sept. (1978).
23) K. Sato, S. Yamaji, K. Harada, and S. Yoshida: "Analysis of the Collision 2°Ne + 28Si by
Solving the Coupled Dynamical Equations of Motion" , Autumn Divisional Meeting of
Phys. Soc. of Japan, Matsumoto, Oct. (1978).
24) M. Ichimura: "How Many Steps Should be Taken into Account in (d, p) Reactions", INS
Intern. Symp. on Nuclear Direct Reaction Mechanism, Fukuoka, Oct. (1978).
25) H. Amakawa, S. Yamaji, A. Mori, and K. Yazaki: "Adiabatic Treatment of Deuteron
Nucleus Scattering", INS Intern. Symp. on Nuclear Direct Reaction Mechanism, Fukuoka,
Oct. (1978).
26) N. Kishida and H. Ohnuma: "The Variations of (d, p) j-Dependence with Energy and its
EFR-DWBA Analyses Including the Deuteron D-state" , INS Intern. Symp. on Nuclear
Direct Reaction Mechanism, Fukuoka, Oct. (1978).
27) T. Fujisawa, M. Nakamura, M. Yasue, N. Ueda, T. Hasegawa, H. Kamitsubo, K. Hatanaka,
T. Tanaka, M. Sekiguchi, T. Wada, Y. Toba, and F. Soga: "Spin Flip Asymmetry in the
Inelastic Scattering of Protons on 12C at 28 Me V", INS Intern. Symp. on Nuclear Direct
Reaction Mechanism, Fukuoka, Oct. (1978).
28) T. Nomura: "Preequilibrium a-Particle Emission in Low-Energy Heavy Ion Reactions and
Local Heating", Intern. Workshop on Reaction Models for Continuous Spectra of Light
Particles, Bad Honnef, Nov. (1978).
3. Atomic and solid-state physics
1) Y. Awaya and T. Tonuma: "X-Rays Induced by Heavy Ions", Symp. on Atomic Process by
Heavy Ions, Tokyo, Jan. (1978).
2) T. Takahashi, F. Yatagai, and A. Matsuyama: "Application of Katz's Theory to Radiation
Biology", Ann. Meeting of Japan Soc. of Appl. Phys., Tokyo, March (1978).
3) T. Takahashi, S. Uchiyama, Y. Awaya, A. Hashizume, H. Kumagai, T. Tonuma, and

T. Doke: "Electronic Stopping Power of Several MeV/amu C and He Ions", Ann.
Meeting of Phys. Soc. of Japan, Sendai, March (1978).
147
4) A. Koyama: "Secondary Electron Emission from Al by High Speed Proton Bombardment",
IPCR Symp. on Excitation of Secondary Electron and Auger Electron by Heavy Ions,
Wako, March (1978).
5) T. Tonuma, Y. Awaya, T. Kambara, H. Kumagai, and I. Kohno: "K X-rays of Gas Target
Elements Induced by Heavy Ions", Ann. Meeting of Phys. Soc. of Japan, Sendai, Apr.
( 1978).
6) T. Tonuma, ,V. Awaya, T. Kambara, H. Kumagai, and I. Kohno: "Ar K X-Rays Induced
by N-Ion Bombardment", Spring Divisional Meeting of Phys. Soc. of Japan, Sendai, Apr.
(1978).
7) E. Vagi, A. Koyama, H. Sakairi, and R. R. Hasiguti: "Lattice Location of Ni Atoms
Implanted into Al ", U.S.-Japan Seminar on Fundamental and Application of Particle
Channeling, Tokai, May (1978).
8) H. Sakairi: "Displacement and Replacement of Atoms in Irradiated Metals", IPCR
Symp. on Application of Ion Beams to Material Science, Wako, May (1978).
9) E. Vagi: "Interstitials in Reduced Rutile and in Ni-Implanted Al ", IPCR Symp.
on Application of Ion Beams to Material Science, Wako, May (1978).
10) T. Takahashi: "Spatial Distribution of Ionization Energy Deposited about the Path of a
Heavy Ion", Symp. on the Heavy Ion Irrad. Effect on Biological Material, Oiso,
June (1978).
11) T. Okada, H. Sekizawa, and T. Yamadaya: "Hyperfine Interactions of 119Sn in Magnetic
Cha1cogen Spinels", Intern. Conf. on the Applications of the Mossbauer Effect, Kyoto,
Aug. (1978).
12) Y. Awaya, T. Katou, H. Kumagai, T. Tonuma, Y. Tendow, K. Izumo, T. Takahashi,
M. Okano, T. Hamada, and S. Ozkok: "K and L X-Rays of Yttrium Induced by Heavy Ion
Bombardment", Autumn Divisional Meeting of Phys. Soc. of Japan, Shizuoka, Oct. (1978).
13) S. Uchiyama, T. Takahashi, Y. Awaya, H. Kumagai, T. Tonuma, A. Hitachi, and T. Doke:
"Energy Loss and Straggling of Several MeV/amu C and He Ions", Autumn Divisional
Meeting of Phys. Soc. of Japan, Shizuoka, Oct. (1978).
14) H. Shinno, H. Shiraishi, R. Watanabe, H. Kamitsubo, I. Kohno, and T. Shikata: "Effect
of Post Irradiation Aging Treatment on the Helium Embrittlement of SUS 316 stainless
steel", 83rd Ann. Meeting of The Japan Institute of Metals, Toyama, Oct. (1978).
15) Y. Awaya: "X-Rays Following Multiple Inner-Shell Ionization", Symp. on Atomic
Collisions, Tokyo, Dec. (1978).
16) T. Tonuma, Y. Awaya, T. Kambara, H. Kumagai, and I. Kohno: "Ar K X-Ray Spectra
Induced by 66-110 MeV N-Ion Bombardment", Symp. on Atomic Collisions, Tokyo,
Dec. (1978).
4. Radiochemistry, radiation chemistry and radiation biology
1) K. Kimura and M. Imamura: "Emission Spectra of Single Crystals Irradiated with Heavy
Ions at 4.2 K", Symp. on Solid State Physics Using Heavy Ion Beams, Tokai, Dec. (1977).
2) K. Kimura and M. Imamura: "Emission Spectra of Excitons Created in a KBr Single
Crystal Irradiated with Heavy Ions at 4.2 K", 2nd Symp. on Accelerator Science and
Technology, Tokyo, March (1978).

148
3) T. Nozaki, Y. Itoh, M. Iwamoto, and K. Ogawa: "Yield of 73Se and 77Br for Various
Reactions and Their Carrier- and/or Salt-free Separation", 2nd Intern. Symp. on Radio
pharm. Chern., Oxford, July (1978).
4) T. Irie, K. Fukushi, T. Ido, T. Nozaki, and Y. Kasida: " 18 F-fluorination by K18F-crown
Ether System", 2nd Intern. Symp. on Radiopharm. Chern., Oxford, July (1978).
5) K. Fukushi, T. Irie, T. Nozaki, T. Ido, and Y. Kasida: "Adrenal Affinity and Plasma
Lipoprotein Binding of Radioha1ogeno Derivatives of Cholesterol", 2nd Intern. Symp. on
Radiopharm. Chern., Oxford, July (1978).
6) K. Kimura: "Emission Spectra of Single Crystals Under Heavy Ion Irradiation", Symp. on
the Boundary Region between Physics and Radiation Chemistry, Osaka, Sept. (1978).
7) K. Kimura and M. Imamura: "Measurements of Subnanosecond Time-Dependent Emission
Spectra of KBr Single Crystals Irradiated with Heavy Ions at 4.2 K", 21 st Conf. on
Radiation Chemistry, Tokyo, Sept. (1978).
8) A. Kira, M. Matsui, and M. Imamura: "Yields of Trapped Electron in Ethanol Glass
Irradiated with Heavy Ions", 21 st Conf. on Radiation Chemistry, Tokyo, Sept. (1978).
9) T. Nozaki, M. Iwamoto, K. Usami, K. Mukai, and A. Hiraiwa: "Activation Analysis of
Oxygen in Thin Silicon Nitride Films on Silicon Substrates", Discussion Meeting on
Radiochem., Tokyo, Oct. (1978).
10) T. Nozaki and Y. Terai: "Chemical Separation of 18F in Charged Particle Activation
Analysis of Oxygen in High-purity Metals", Discussion Meeting on Radiochem., Tokyo,
Oct. (1978).
11) T. Nozaki, T. Karasawa, M. Iwamoto, Y. Terai, and M. Okano: "Excitation Function for
the 14N (p, n)140 Reaction", Discussion Meeting on Radiochem., Tokyo, Oct. (1978).
5. Heavy ion linear accelerator
1) 1. Kohno, A. Shimamura, T. Tonuma, and 1. Takeshita: "A Penning Multiply-Charged Ion
Source for the IPCR Linac", 2nd Symp. on Ion Source and Application Technology,
Tokyo, Feb. (1978).
2) A. Shimamura, T. Tonuma, and 1. Kohno: "PIG Heavy Ion Source for the IPCR Linac II
(Experimental Results with the Test Facility)", Ann. Meeting of Phys. Soc. of Japan,
Sendai, Apr. (1978).

12. LIST OF PERSONNEL
Members of the Board
DOTE Toshihiko ± -=¥- fJj!1: ~ (Chairman) KAMITS UBO Hiromichi J: ff 7.i JH NAKANE Ryohei ~ fR Et 3:fl
ODERA Masatoshi
Users Committee
HAMADA Tatsuji i~ EB :it = (Chairman) KAMITSUBO Hiromichi MA TSUY AMA Akira ODERA Masatoshi SEKIZA W A Hisashi
Operation and Machine Maintenance Group
FUJITA Shin KAGEYAMA Tadashi KOHNO Isao iilJ Iff
OGIWARA Kiyoshi
Scientific and 1Engineering Personnel Cyclotron Laboratory
AMAKAWA Hirotaka 7Z )11 ~ ~i
FUJIT A Jiro Ki EB = ~~ *ISHIHARA Masayasu
KARASA W A T akashi KUMAGAI Noritaka
::fi~1£* ~ IR q:
1m i:l- !fJ. q: MOTONAGA Shoshichi :TC 7]( Bg --t:;
NAKANISHI Noriyoshi ~ [!§ *,C %
SHIKATA Takashi Q] 1) ~i ?1:.
Y AMAJI Shuhei
(Visitors)
i~EBJi= HAMADA Tatsuji KOHNO Isao NOZAKI Tadashi
iilJ Iff l))
IMAMURA Masashi KOHNO Isao NOZAKI Tadashi SAKAI RI Hideo
IKEGAMI Kumio KOHARA Shigeo NAKAJIMA Hisao T AKEBE Hideki
Iff~ 1£
~ tt l))
Iff~ 1£
:l&A~ut
i'fu J:: :h. ~ ~
+~1t ,*
B E3
~ UJ.~ MJ ut m: ~~ ~ fM
FUJISA WA Takashi INAMURA Takashi KAMITS UBO Hiromichi
nl iR ~ it-
fiB ft -* J:ff1iJH
KOHNO Isao i"ilJ Iff
MOTOBA Y ASHI ·Tohru NAKAJIMA Shunji NOMURA Toru W ADA Takeshi
~ ffh ~¥ -Iff tt -,-
tD EB ut
HATTORI Toshiaki ~Ii ~~ llr 1ir (lnst. Nucl. Study, Univ. of Tokyo) HAYAKAWA Shunichiro !f.)1I11r - ~~ (Dept. Phys., Waseda Univ.) HIRUTA Kotaro ftEB¥*~~ (Dept. Phys., Tokyo Gakugei Univ.)
ICHIMURA Munetake m ft * m: (lnst. Phys., College General Education, Univ. of Tokyo)
IGARASHI Masamichi 1i. + !it 1£ @: (Tokyo Medical College) IMANISHI Bunryu KAMMURI Tetsuo
~ j!§ Jt ~ (Inst. Nucl. Study, Univ. of Tokyo) itt fg" '* (Dept. Phys., Osaka Univ.)
LEE S. M. ~;t13 a (Centrum de Recherche Nucl. Strasbourg) MIKUMO Takashi ~ (lnst. Phys., Tsukuba Univ.) NAKAHARA Hiromichi ~ ~ 51 @: (Dept. Chern., Tokyo Metropolitan Univ.)
* On leave to Cyclotron Inst., Texas A & M University untill Jan. 1979
149

150
NODA Akira H EB ~ (lnst. Nucl. Study , Univ. of Tokyo) OHNUMA Hajirne *- m m- (Dept. Phys. , Tokyo Inst. Techno!.) bZKbK S. (Dept . Phys., Istanbul Univ.) SHINNO Hitoshi ~ H' 1= (Nat. Res. Inst . for Metals) SHIRAISHI Haruki B E * :m (Nat. Res. Inst. for Metals) SOGA Furninori it ft Jt :g (lnst. Nucl. Study , Univ. of Tokyo) TAKAHASHI Noriyuki ~ m ~ ¥ (Dept. Phys. , Univ. of Tokyo) TAKIMOTO Kiyohiko ~ ::$: rn ~ (Dept. Phys. , Kyoto Univ.) TAMURA Taro EB ft *- ~~ (Dept. Phys. , Texas Univ.) UDAGAWA Takeshi * EB )11 ~~ (Dept. Phys. , Texas Univ.) WAD A Ryoichi tD ill ft - (Dept. Phys. , Kyoto Univ. )
(Students)
HASHIMOTO Naoki m ::$: 1Er m (Dept . Phys., Tokyo Inst. Techno!.) ISE Sugao 1JT~~JC~ ut (Dept. Phys. , Tokyo Gakugei Univ.) KISHIDA Norio f¥ EB ~IJ !:t (Dept. Phys. , Tokyo Inst. Technol.) KOJIMA Toshiyuki + ~ W9: 1T (Dept. Phys. , Rikkyo Univ.) MIAKE Yasuo -=- I3A rnt ~~ (Lab. Nucl. Study , Osaka Univ.) NORO Tetsuo H g rg- x (Dept. Phys. , Kyoto Univ.) SATO Kenichi ftc iii riff. - (Dept. Phys., Tohoku Univ.) SHIMODA Tadashi T EB iE (Dept. Phys., Kyoto Univ.) SUGITATE Toru f~ jL ~ (Dept. Phys ., Tokyo Inst. Technol.) TOBA Yoshiyuki 7i- )j)j "E ¥ (Dept. Phys., Kyoto Univ.) UTSUNOMIY A Hiroaki * ~~ '8 ~L ~ (Dept. Phys., Kyoto Univ.) Y ANOKURA Minoru * fff' if ~ (Dept. Chern., Tokyo Metropolitan Univ.)
Linac Laboratory
CHIBA Y oshiaki HOSHINO Tohru KAMBARA Tadashi ODERA Masatoshi SHIMAMURA Akira TONUMA Tadao YOSHIDA Fusako
-=f ~ H SA
£ H Y 1$ 1* iE
+ ~ iE 1:;r
~ ft ~
pmiE ut
"EEBm-r
HEMMI Masatake INOUE Toshihiko MIY AZA W A Yoshitoshi '8 ¥R H~ W9:
SCHIMIZU lun rn *- ~
T AKESHIT A Isao 1"T T ~ x YOKOY AMA Ichiro
(Visotor)
TAKEDA Shigeru tt EB ~ (Nat. Lab . High Energy Phys.)
Radiation Laboratory
AWAY A Yohko ~ ~ if -r HASHIZUME Akira m Jl\ ~JI
KATOU Takeo KUMAGAI Hidekazu ff~ ~ ~ tD TAKAHASHI Tan ~ m Q
(Visitors)
HAMADA Tatsuji iA EB :it = IZUMO Koichi tB ~ 7t -KONNO Satoshi ~Il
S
OKANO Masaharu JjYi] H A lEI
TENDOW Yoshihiko ;R. J1! 7.i ~
DOKE Tadayoshi FUJIOKA Manabu HA Y ASHIBE Shogo
J1! '* I~' ~ (Sci. and Eng. Res. Lab., Waseda Univ.) iii JjYi] ~ (Dept. Phys., Tohoku Univ.)
ft :g:~ sg .g. (Dept. Phys., Tohoku Univ.)

ISHII Keizo :;0 ft ~ € (Cyclotron, Tohoku Univ.) MORITA Susumu ~ B3 ;b (Dept. Phys., Tohoku Univ.) NAGAHARA Teruaki 7)( IJR jffi SJJ (lnst. Atomic Energy, Rikkyo Univ.) TAWARA Hiroyuki fj{ -pf z (Dept. Nucl. Eng., Kyushu Univ.) UCHIYAMA Sadayuki pq Li1 ~ ¥ (Clear Pulse Co. Ltd.)
Metal Physics Laboratory
KOY AMA Akio + Li1 Sfg Ul SAKAIRI Hideo :t& A :9!f Ul SHIOT ANI Nobuhiro :t;i[ ij- }[ 5i Y AGI Eiichi )\ * * -(Visitor)
TANIGAWA Shoichiro t:t}ll !± - fl~ (Dept. Metallurgy and Materials Sci. Faculty Eng., Univ. of Tokyo)
(Students)
HINODE Kenji B It lli:f:?El (Dept. Metallurgy and Materials Sci. Faculty Eng., Univ. of Tokyo)
KUMAKURA Hiroaki 1l~ :€I- ~ SJJ (Dept. Metallurgy and Materials Sci., Faculty Eng.,
Magnetic Materials Laboratory
ASAI Kichizo SAKAI Nobuhiko
i~ ft B iit :t& ft f§ ~
Univ. of Tokyo)
OKADA Takuya SEKIZA W A Hisashi
if (Dept. Phys., Gakushuin Univ.)
(Visitors)
MIZOGUCHI Tadashi YAMADA Y A Tokio LlJ B3 ij- ~ x (Matsushita Res. Inst. Tokyo, Inc.)
Solid State Chemistry Laboratory
ENDO Hiroshi it ii Jl
MAEDA Kuniko M B3 *~ i=-UDA Masayuki
Radiochemistry Laboratory
AMBE Fumitoshi ARA T ANI Michi IWAMOTO Masako :5 ::$: if i=-
TERAI Y oshiro ~ ft ~ .e~
(Visitors)
KOBA Y ASHI Masayoshi + ~* ~ Ii SASA Y oshihiko ft /;z ~ ~
AMBE Shizuko 17: fi~ 'Mt i=-
ITO Y oshiko f1l" * 7!f i=-NOZAKI Tadashi It ~ if
FUKUSHI Kiyoshi m ± m (Nat. Inst. of Radiological Sci.) HIRAIWA Atsushi f:5 ~ (Central Res. Lab., Hitachi Electric Co.) IRIE Toshiaki A rr f~ ~ (Nat. Inst. of Radiological Sci.) KASIDA Yoshihiko ~ B3 Ii ~ (Nat. Inst. of Radiological Sci.) MUKAI Kiichiro rPJ %-fl~ (Central Res. Lab., Hitachi Electric Co.) TAKI Ko ~ ¥ (Dept. of Hygen., Kitazato Univ.) USAMI Katsuhisa * ft ~.Im ~ (Central Res. Lab., Hitachi Electric Co.)
151
152
Radiation Chemi stry Laboratory
IMAMURA Masashi KIMURA Kazuie
(Visitor)
MATSUI Masao to .fj: IE 7c (Dept. of Pharmacy , Hokuriku Univ.)
(Student)
MOCHIZUKI Kiyoshi
Radiobiology Laboratory
HATTORI Yukihiko KIT A Y AMA Shigeru
YATAGAI Fumio
(Visitors)
m (Dept. Phys., Chuo Univ.)
~& 11~ iT j'j:
~t LiJ i~
~ 83ffil. Jt7c
KANEKO Ichiro ~ -=f - ~B
MA TS UY AMA Akira to LiJ jib
OKADA Shigefumi Itlii 83 !K Jt (Faculty of Medicine , Univ. of Tokyo) SASAKI Masao it!z * IE 7c (De pt. Cytogenetic, Medical Res . Inst., Tokyo Medical
and Dental Univ.) SAWADA Shozo ~R. 83 Bg -= (Res. Inst. Nuc!. Medicine and Biology, Hiroshima Univ.)
Safety Control Affairs Office
HAMADA Tatsuji SAKAMOTO Ichiro
IGARASHI Kazui US UBA Isao ri jj€

13. LIST OF OUTSIDE USERS AND THEIR THEMES
(Jan. - Dec. 1978)
1) M. Nakahara, M. Watanabe, Y. Nakamura,
H. Kudo, K. Muramatsu, Y. Nagame, T. Ishii,
K. Horiuchi, and Y. Murakami
"Production of 57, 58Co"
2) A. Hishinuma, T. Furuta, H. Kamizuka,
K. Fukai, and T. Otomo
"Simulation Test on Neutron Irradiation
Damage of Stainless Steel for Fast Breeder
Reactors by a-Bombardment"
3) Y. Wada, K. Senno, K. Fukuda, M. Suzuki,
K. Suzuki, and H. Sakamoto
"Study of Irradiation Damage of
Transistors by Proton Bombardment"
4) N. Nagashima, M. Tamura, and T. Suzuki
"Determination of C in Si by Activation
Analysis"
5) Y. Honma
"Production of 48y, 48Cr, 77Br and 81 Rb"
6) K. Usami and K. Mukai
"Surface Analysi s by Charged Particle
Activation"
7) M. Shimada, K. Kohashi, M. Terasawa,
and M. Iimura
"Cyclotron Irradiation for Study of
FBR Material Embrittlement"
8) K. Yuita
"Production of 43K"
Faculty of Science, Tokyo
Metropolitan Univ.
Japan Atomic Energy Research Inst.
Musashino Electrical Communication Lab.,
Nippon Telegraph and Telephone
Public Corporation
Semiconductor Dept., Hitachi Ltd.
Kyoritsu College of Pharmacy
Hitachi R&D Center
Toshiba R&D Center
National Inst. of Agricultural Sciences
153

154
9) S. Hayashi, S. Iwata, M. Yanokura, * and
A. Murakami * * "Calibration of Solid Track Detectors
with Heavy Ions"
10) A. Furusawa
"Production of 152, 154Eu"
Research Reactor Inst.,
Kyoto Univ.
* Faculty of Science, Tokyo
Metropolitan Univ.
* * Faculty of Science and Engineering,
Saga Univ.
Faculty of Science, Niigata Univ.

AMAKA W A Hirotaka
AMBE Shizuko
AWAYA Yohko
AUTHOR INDEX
7( JII -pf ~i 36, 39 , 47 IMAMURA Masashi
IMANISHI Bunryu
68, 79, 81 , 84, 86, INAMURA Takashi 92
56, 62, 65, 71
DOY AMA Masao 1t LlJ l§ ~ 104 IRIE Toshiaki A iT 1~ ~ 114
ENDO Hiroshi Ji • Jt 88,90 IW AMOTO Masako :5 ::$: IE T 106, 111, 114
FUJISAWA Takashi Jfi ~.R ~ ~ 29,45 IZUMO Koiehi tB ~ -'}t - 79,92
FUJITA lira • EB =- ~~ 4, 7, 10, 16 KADOTA Yusaku p~ 83 ~ flp 32
FUJITA Shin JfiEB ~ 2 KAGEY AMA Tadashi iE 2
155
FUKUSHI Kiyoshi m ± m 114 KAMBARA Tadashi 1$ DR iE 81, 84, 86, 131
HAMADA Tatsuji 76,79
HARADA Kiehinosuke DR 83 B.:L.1IJJ 50,53
HASEGAWA Takeo
KAMITS UBO Hiromiehi 4, 7, 10, 13, 29, 45, 96
KANEKO Iehiro ~ -=f - ~~ 121
KARASAWA Takashi ~ 1.R ~ 27 , 106
HASHIZUME Akira mJJ\ 68, 74, 76, 79, KATO Shohei 92
110 Jfi l§ ~ 32
HASIGUTI R. Ryukiti m 0 ~i B 99
HATANAKA Kiehiji
HATTORI Yukihiko
HEMMI Masatake ~Je.i&iF\: 130, 138
HINODE Kenji B !f tfj )f. lEI 104
HI RAIW A A tsushi ~:5 - 111
HIRUTA Kotaro ff 83 ¥ *~~ 65,71
HOSONO Kazuhiko *HI !f fD ~ 32
ICHIMURA Munetake -mIT * iF\: 42
IGARASHI Kazui 1i + m-fX: 125
IKEGAMI Kumio
KATOU Takeo 110 Jii iF\: 1itt 68, 74, 79
KAWAI Mi tsuji iilT -fr 7t R~ 42
KIMURA Kazuie * ft - + 118
KIMURA Toshimasa * IT fa& iE 76
KISHIDA Norio J¥ 83 ~IJ 1:. 34
KIT A Y AMA Shigeru
KOBAYASHI Masayoshi
KOHARA Shigeo
KOHNO Isao
i~ 123
;j-. ** ~ ft 88 , 90
2,4 , 21 , 24,81, 84, 86, 96, 135
KOJIMA Toshiyuki + ~ fa& iT 65, 71
KONDO Miehiya ili: Jfi Ji -tl1 32

156
KOYAMA Akio + LlJ Bg 1ii 94 , 99 OHNUMA Hajime *m ffi 34
KUBO Ken-ichi
KUMAGAI Hidekazu
KUMAGAI Noritaka
KUMAKURA Hiroaki
OKADA Kenji
!f~ ~ ~ fD 68, 74, 79 , 81, OKADA Takuya 84 , 86, 92
!f~ ~ fJ. 4 4 , 7 , 10, 13 OKANO Masaharu
!f~ ~ ra- BjJ 104 OZKOK S. 79, 81
JiYij E8 * i:l1 102
JiYij !ff ~ hs 79, 106
MAEDA Kuniko M E8 *~ -f- 88 , 90 SAITO Takane
MATSUOKA Nobuyuki ~ JiYij {$ iT 32 SAKAI RI Hideo :t& A * ut 94 , 99
MATSUYAMA Akira jt 121 , 123 SAKAMOTO Ichiro :t& * - J!l~ 125 , 127
MIY AZA WAY oshi toshi g ?R ft iii& 130, 138 SASA Y oshihiko ftc /:{ ~ ~ 88 , 90
MO RI Akihiko
MOTOBA Y ASHI Tohru
MOTONAGA Shoshichi
MUKAI Kiichiro
NAGAMACHI Shinji
* tt ~ 62
4 , 7, 10, 18
NAKAJIMA Hisao r:p UJ.~ r'#J Ui 2, 4, 16
NAKAJIMA Shunj i
NAKAMURA Masanobu r:p H iE {g 29
SASAKI Masao
SA TO Kenichi ftc Jii rs - 50 , 53
SAWADA Shozo iK 133 BB -=- 121
SCHIMIZU lun rn *- *4. 45 , 56, 133
SEKIGUCHI Masayuki ~ 0 :fff iT 29
SEKIZA W A Hisashi r'#J 102
SHIKA T A Takashi Q] 1] ~l ~ 94 , 96
SHIMAMURA Aki ra
NAKANISHI N oriyoshi r:p [§ *c % 4, 10, 18 SHINNO Hitoshi
NOMURA Toru
NORO Tetsuo
NOZAKI Tadashi
ODERA Masatoshi
OGAWA Koji ;]- )I I ¥ '* 116
OGINO Kouya
OGIW ARA Kiyoshi
4, 56 , 59 , 62, 65 , 71
106, 108, Ill , 114 , 116
128, 130, 131 , 133 , 138
2,4, 7, 10, 16 , 21
SHIOTANI Nobuhiro i1K ~ ][ 5L 104
SHIRAISHI Haruki B E * m 96
SOGA Fuminori ~ fl< )(:g: 29, 45
SUGITATE Toru frY. 56 , 59 , 62 , 71
TAKAHASHI N oriyuki
TAKAHASHI Tan ~ tt it 79 , 92
T AKEBE Hideki m: {f~ * m 2, 4,7,10,13,21

TAKEDA Shigeru t1 ffI ~ 13 1
TAKIKo $ 116
TAKIMOTO Kiyohiko
TAMURA Taro
TAN AKA Teruaki ffI J:j:l ~ 13j] 29
TANIGAWA Shoichiro
TENDOW Y oshihiko "7(Jll'Hi'if 68 , 74, 76, 79
TERAI Yoshiro =;f fr ff ~~ 106, 108, 114
TOBA Yoshiyuki 7t- )))) "E $ 29
TONUMA Tadao pi miEttt 79 , 81 , 84 , 86 , 92, 135 , 138
UCHIY AMA Sadayuki i1'J LlJ ~ $ 92
UDA Masayuki +ffI It-z 88, 90
UDAGA W A Takeshi + rn}l l ~..t 47
UEDA Nozomi J:rn 'iiI 29
USAMI Katsuhisa + ftc ~ 1m- ~ 111
157
USUBA Isao ~ 125
UTSUNOMIYA Hiroaki 56, 59, 62 , 71
W ADA Ryoichi fD ffI ft 45
W ADA Takeshi fD ffI ttt 4, 7, 10, 13 , 29,45
WATANABE Ryoji
YAGI Eiichi i\ * '* - 99
YAMADAYA Tokio LlJ ffI ~ a~ 3c 102
YAMAJI Shuhei LlJ ~-ft il~ f 39, 50, 53
Y ASUE Masaharu ~iI iEit 29
YATAGAI Fumio ~ffI.& Jt3e 121, 123
Y AZAKI Koichi * lil~ M: - 39
YOKOYAMA Ichiro m LlJ - ~~ 7, 10
YOSHIDA Fusako "Ern m -=f 4,7 , 10, 16
YOSHIDA Shiro "E rn I~' ~~ 50, 53

IPeR Cyclotron Progress Report
!11t:$~~pJT-if1 ., [J ~ [J /~**~ ~12~ (1978 )
IOn .\j;IJ Bt5:fD 54ip (1979 ) 3 ,Fj 25 B
~ fr Ht5:fD 54ip (1979 ) 3 ,Fj 30 B
~fr:1t ~ i ~ + 1iJf ~ pJT
tt~~ m; #- 1$ T 351 t~I!JiHD:J'tmJZr,R 2 :fli: 1 ~
i[~ (0484 ) 62 - 1 1 1 1
,j'i~:1t .f1lI1t+~JfJEpJT-tt 1 7 0 r 0 /fIJJfl~~ffii~
F-n.\j; IJ pJT n }1. ~n ,ij; 1j f* P:: ~ f± T130 JIOj('trS~ffilRti!.?,R 1 T § 3 if 3 ~
5E i[ffi 3, OOO Pi

埼玉県 和光市 広沢
理化学研究所