ipac big data 2017-11-02 - smd-prod.s3.amazonaws.com · 3. lessons learning at ipac 4. ... data...
TRANSCRIPT
Big Data at IPACDavid A. Imel, Manager
Caltech/IPAC
2 November 2017
1. Introduction to IPAC2. Big Data in the IPAC Context3. Lessons Learning at IPAC4. Opportunities and Challenges
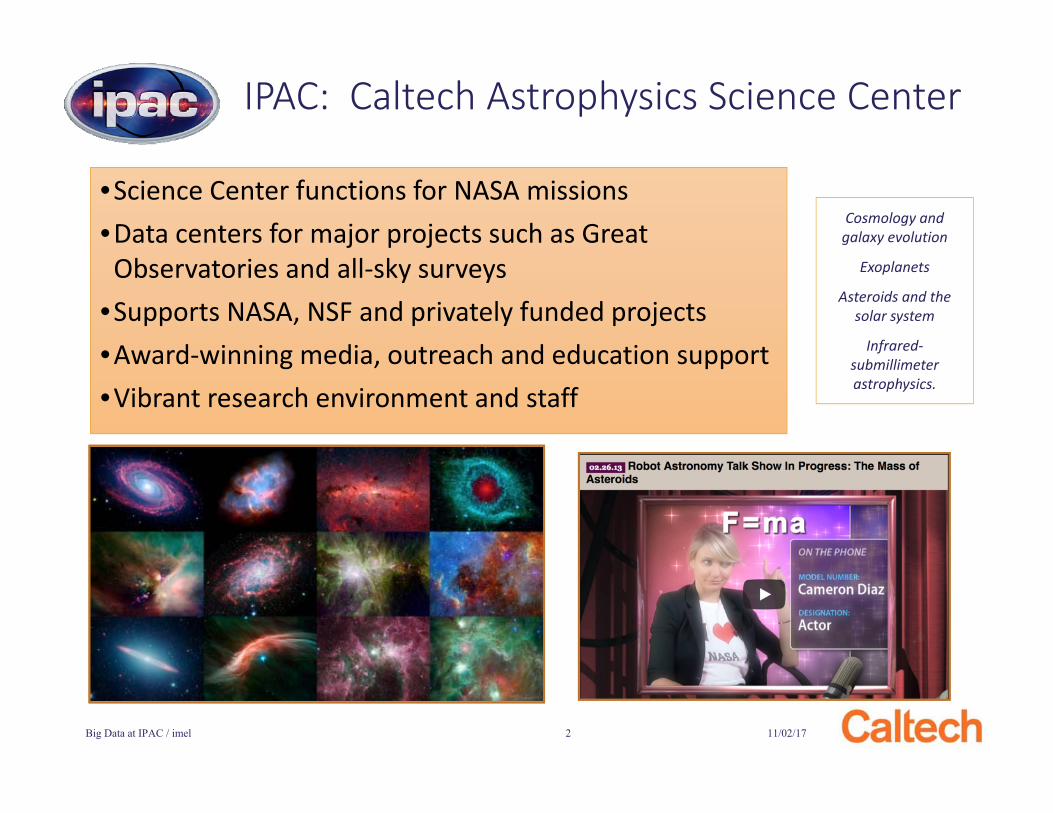
•Science Center functions for NASA missions•Data centers for major projects such as Great
Observatories and all-sky surveys•Supports NASA, NSF and privately funded projects•Award-winning media, outreach and education support•Vibrant research environment and staff
IPAC: Caltech Astrophysics Science Center
Cosmology and galaxy evolution
Exoplanets
Asteroids and the solar system
Infrared-submillimeter astrophysics.
11/02/17Big Data at IPAC / imel 2
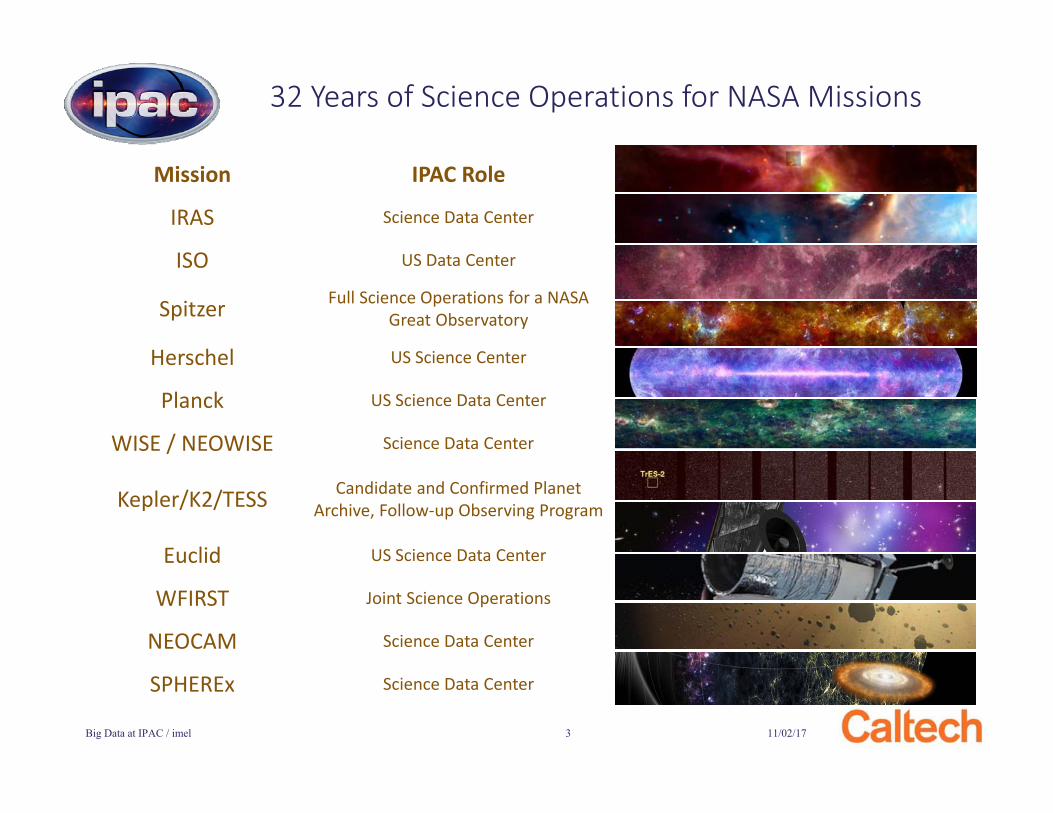
Mission IPAC Role
IRAS Science Data Center
ISO US Data Center
Spitzer Full Science Operations for a NASA Great Observatory
Herschel US Science Center
Planck US Science Data Center
WISE / NEOWISE Science Data Center
Kepler/K2/TESS Candidate and Confirmed Planet Archive, Follow-up Observing Program
Euclid US Science Data Center
WFIRST Joint Science Operations
NEOCAM Science Data Center
SPHEREx Science Data Center
32 Years of Science Operations for NASA Missions
11/02/17Big Data at IPAC / imel 3
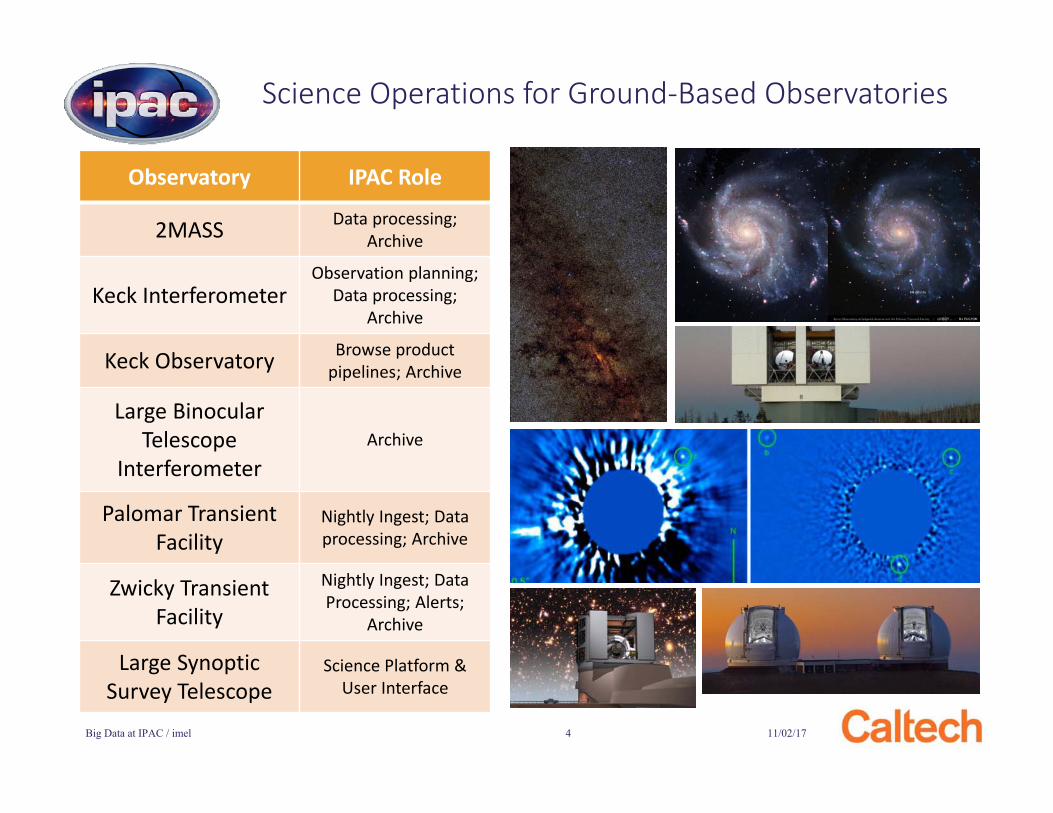
Science Operations for Ground-Based Observatories
11/02/17Big Data at IPAC / imel 4
Observatory IPAC Role
2MASS Data processing; Archive
Keck InterferometerObservation planning;
Data processing;Archive
Keck Observatory Browse productpipelines; Archive
Large Binocular Telescope
InterferometerArchive
Palomar Transient Facility
Nightly Ingest; Data processing; Archive
Zwicky Transient Facility
Nightly Ingest; Data Processing; Alerts;
Archive
Large SynopticSurvey Telescope
Science Platform & User Interface

Spitzer Finds Seven Earth-Size Planets in One System
11/02/17Big Data at IPAC / imel 5
• M-Dwarf, 10% Rsun 12 pc from here, first observed in 2000
• 2015: ground-based observing yields 3 Earth-sized planets
• System observed by Spitzer in 2016–2017: 7 earth-size planets.• Transit observations
give planet sizes.• With resonances and
timing variations, masses can be estimated.
• Combination gives density: rocky, volatiles, probably water!
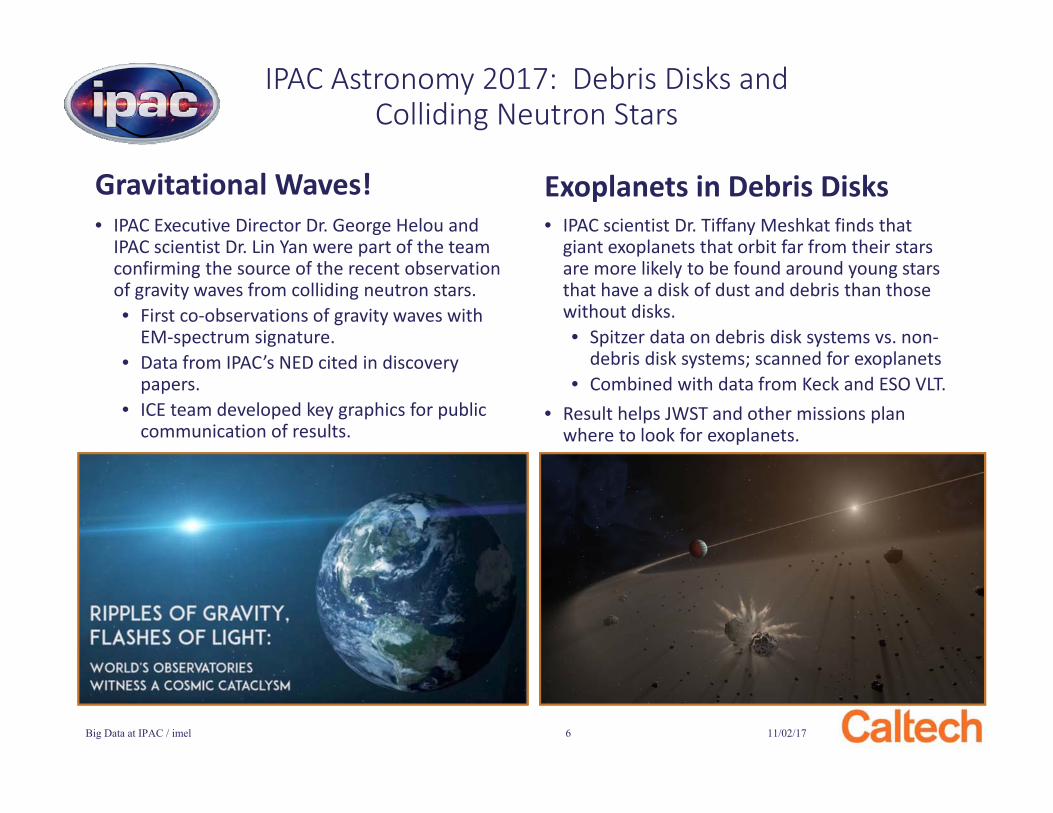
• IPAC Executive Director Dr. George Helou and IPAC scientist Dr. Lin Yan were part of the team confirming the source of the recent observation of gravity waves from colliding neutron stars.• First co-observations of gravity waves with
EM-spectrum signature.• Data from IPAC’s NED cited in discovery
papers.• ICE team developed key graphics for public
communication of results.
• IPAC scientist Dr. Tiffany Meshkat finds that giant exoplanets that orbit far from their stars are more likely to be found around young stars that have a disk of dust and debris than those without disks.• Spitzer data on debris disk systems vs. non-
debris disk systems; scanned for exoplanets• Combined with data from Keck and ESO VLT.
• Result helps JWST and other missions plan where to look for exoplanets.
Gravitational Waves! Exoplanets in Debris Disks
11/02/17Big Data at IPAC / imel 6
IPAC Astronomy 2017: Debris Disks and Colliding Neutron Stars
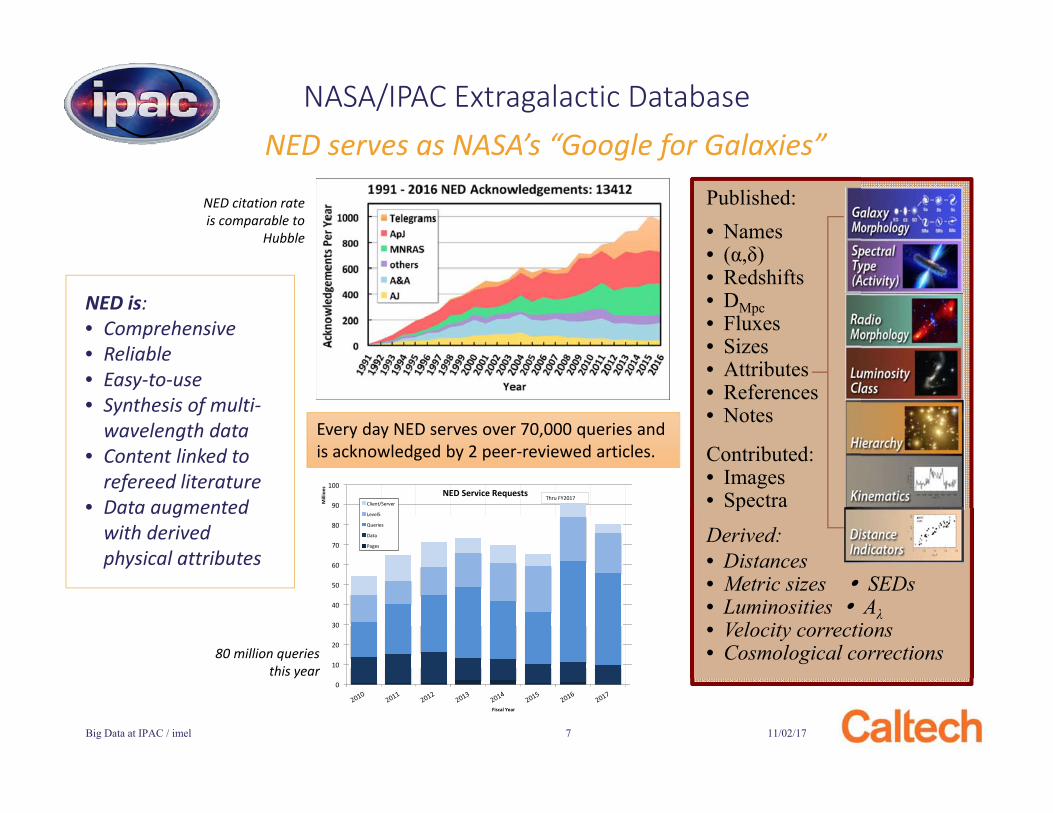
NED serves as NASA’s “Google for Galaxies”
11/02/17Big Data at IPAC / imel 7
NASA/IPAC Extragalactic Database
NED is: • Comprehensive• Reliable• Easy-to-use • Synthesis of multi-
wavelength data• Content linked to
refereed literature• Data augmented
with derived physical attributes
Published:• Names• (α,δ)• Redshifts• DMpc• Fluxes• Sizes• Attributes• References• Notes
Contributed:• Images• SpectraDerived:• Distances• Metric sizes SEDs• Luminosities Aλ• Velocity corrections• Cosmological corrections
Every day NED serves over 70,000 queries and is acknowledged by 2 peer-reviewed articles.
0
10
20
30
40
50
60
70
80
90
100
Mill
ions
Fiscal Year
NED Service Requests Client/Server
Level5
Queries
Data
Pages
Thru FY2017
NED citation rate is comparable to
Hubble
80 million queries this year
11/02/17Big Data at IPAC / imel 8
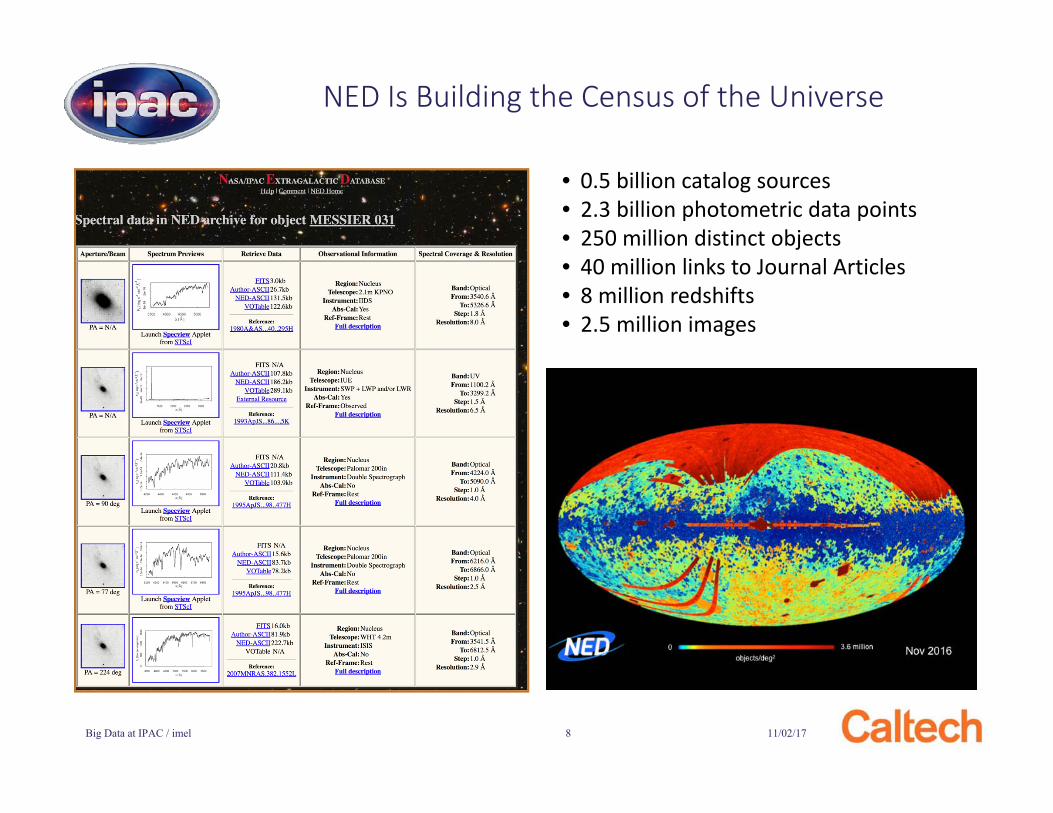
NED Is Building the Census of the Universe
• 0.5 billion catalog sources• 2.3 billion photometric data points• 250 million distinct objects• 40 million links to Journal Articles• 8 million redshifts• 2.5 million images
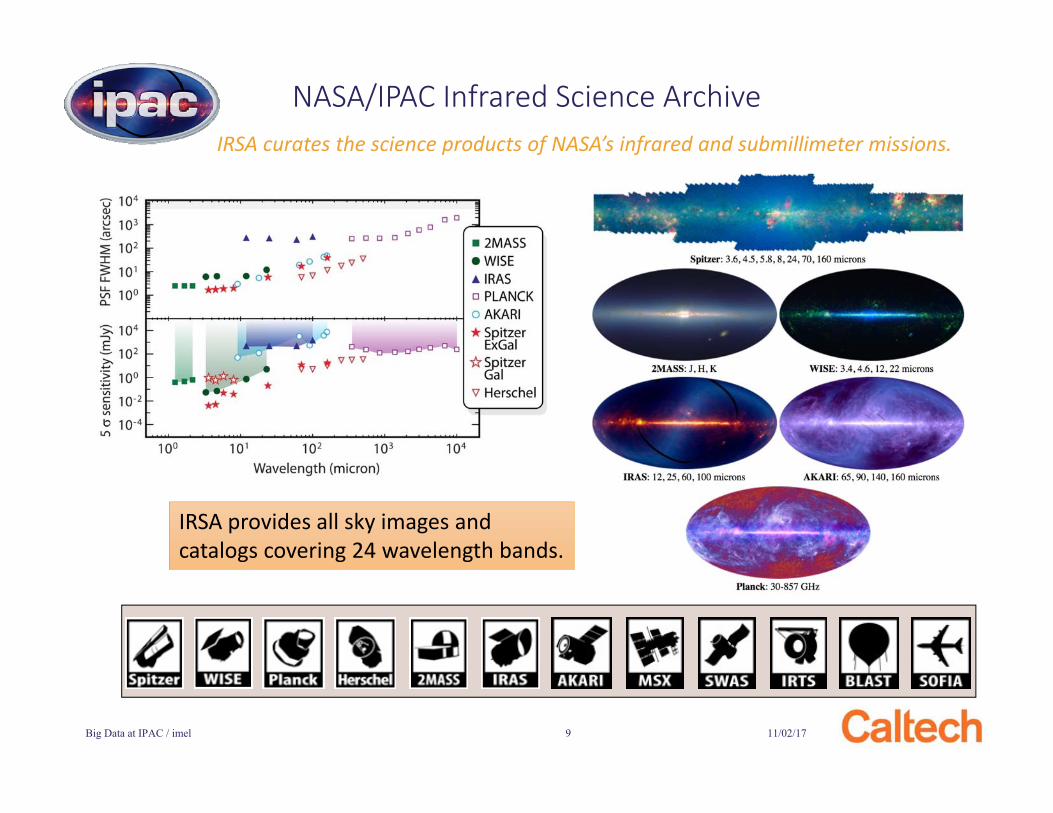
IRSA curates the science products of NASA’s infrared and submillimeter missions.
11/02/17Big Data at IPAC / imel 9
NASA/IPAC Infrared Science Archive
IRSA provides all sky images and catalogs covering 24 wavelength bands.
11/02/17Big Data at IPAC / imel 10
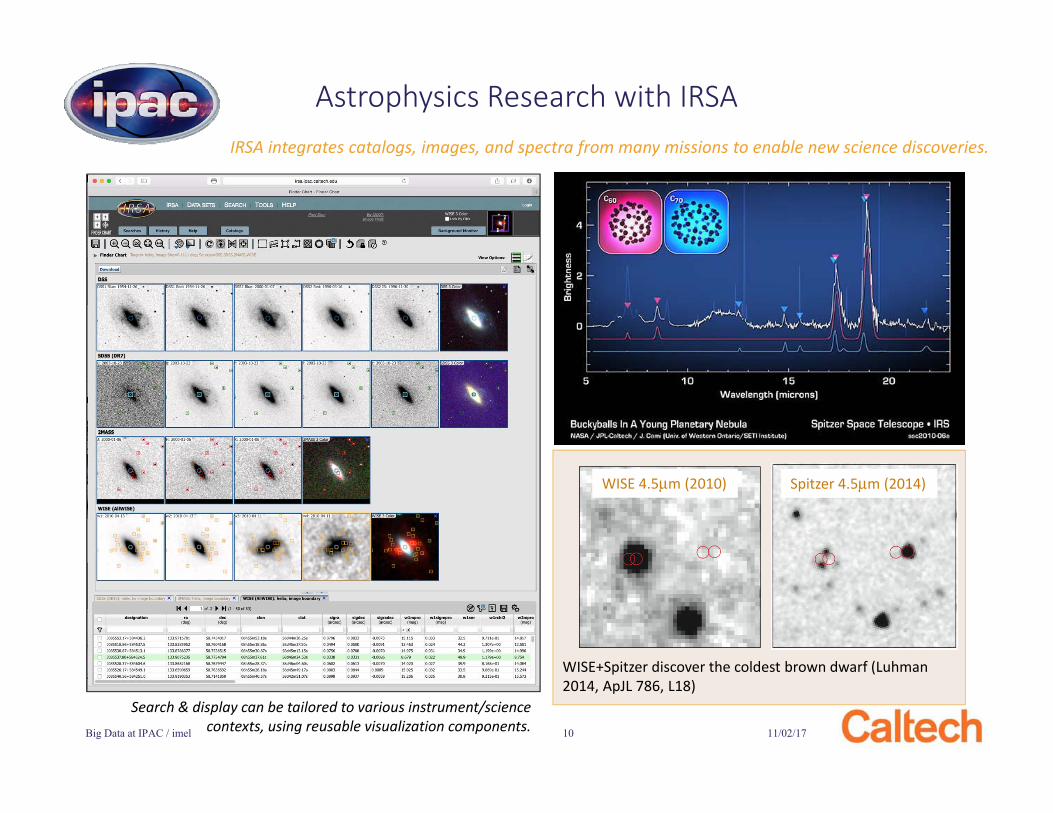
Astrophysics Research with IRSAIRSA integrates catalogs, images, and spectra from many missions to enable new science discoveries.
Search & display can be tailored to various instrument/science contexts, using reusable visualization components.
WISE+Spitzer discover the coldest brown dwarf (Luhman2014, ApJL 786, L18)
WISE 4.5μm (2010) Spitzer 4.5μm (2014)
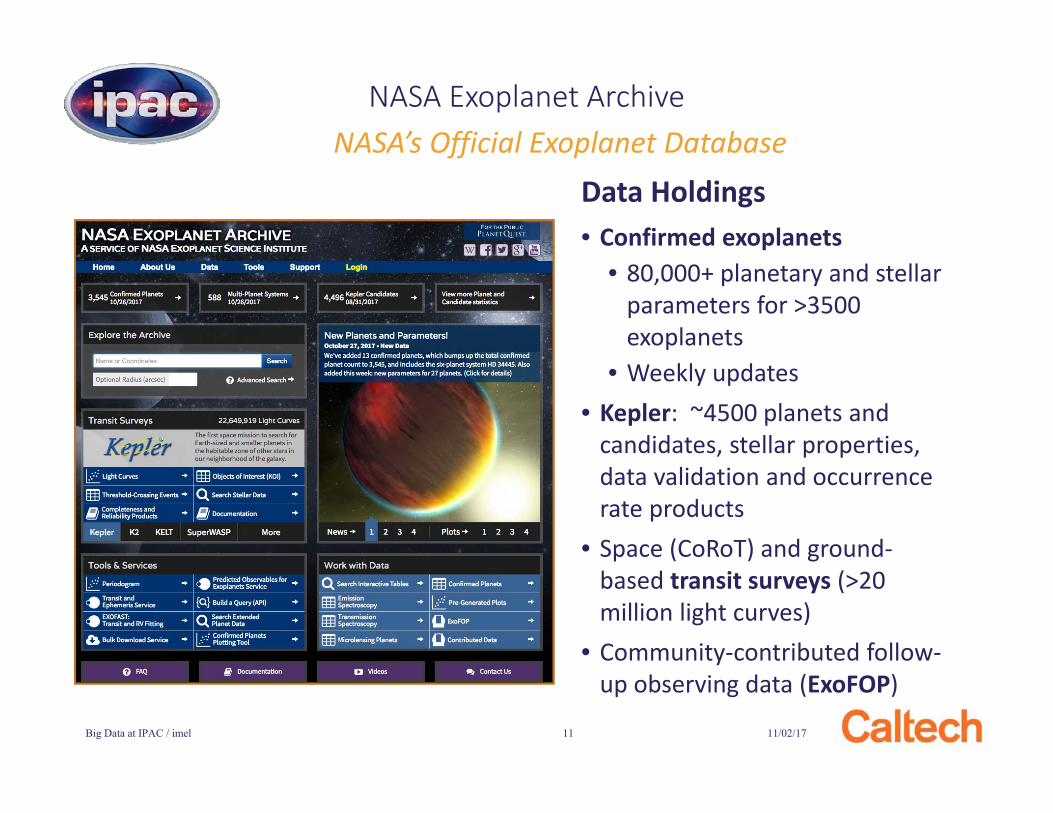
• Confirmed exoplanets• 80,000+ planetary and stellar
parameters for >3500 exoplanets
• Weekly updates• Kepler: ~4500 planets and
candidates, stellar properties, data validation and occurrence rate products
• Space (CoRoT) and ground-based transit surveys (>20 million light curves)
• Community-contributed follow-up observing data (ExoFOP)
Data Holdings
11/02/17Big Data at IPAC / imel 11
NASA Exoplanet ArchiveNASA’s Official Exoplanet Database
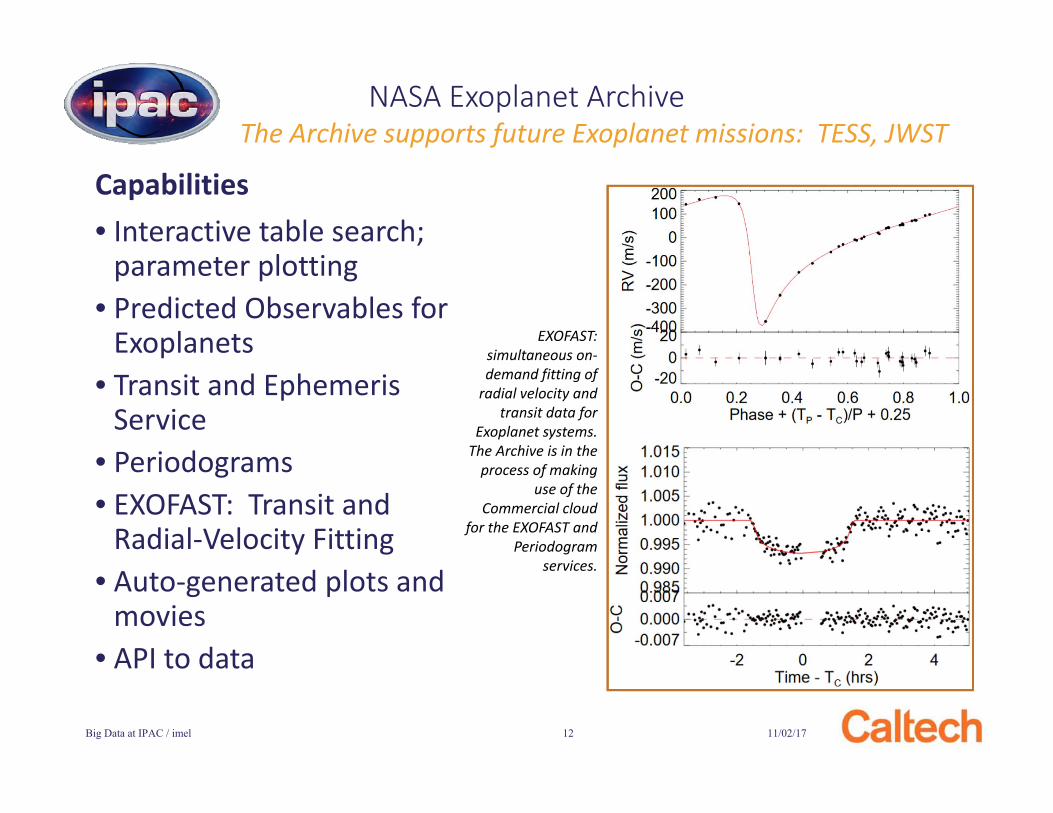
• Interactive table search; parameter plotting
• Predicted Observables for Exoplanets
• Transit and Ephemeris Service
• Periodograms• EXOFAST: Transit and
Radial-Velocity Fitting• Auto-generated plots and
movies• API to data
Capabilities
11/02/17Big Data at IPAC / imel 12
NASA Exoplanet ArchiveThe Archive supports future Exoplanet missions: TESS, JWST
EXOFAST: simultaneous on-demand fitting of
radial velocity and transit data for
Exoplanet systems. The Archive is in the
process of making use of the
Commercial cloud for the EXOFAST and
Periodogramservices.
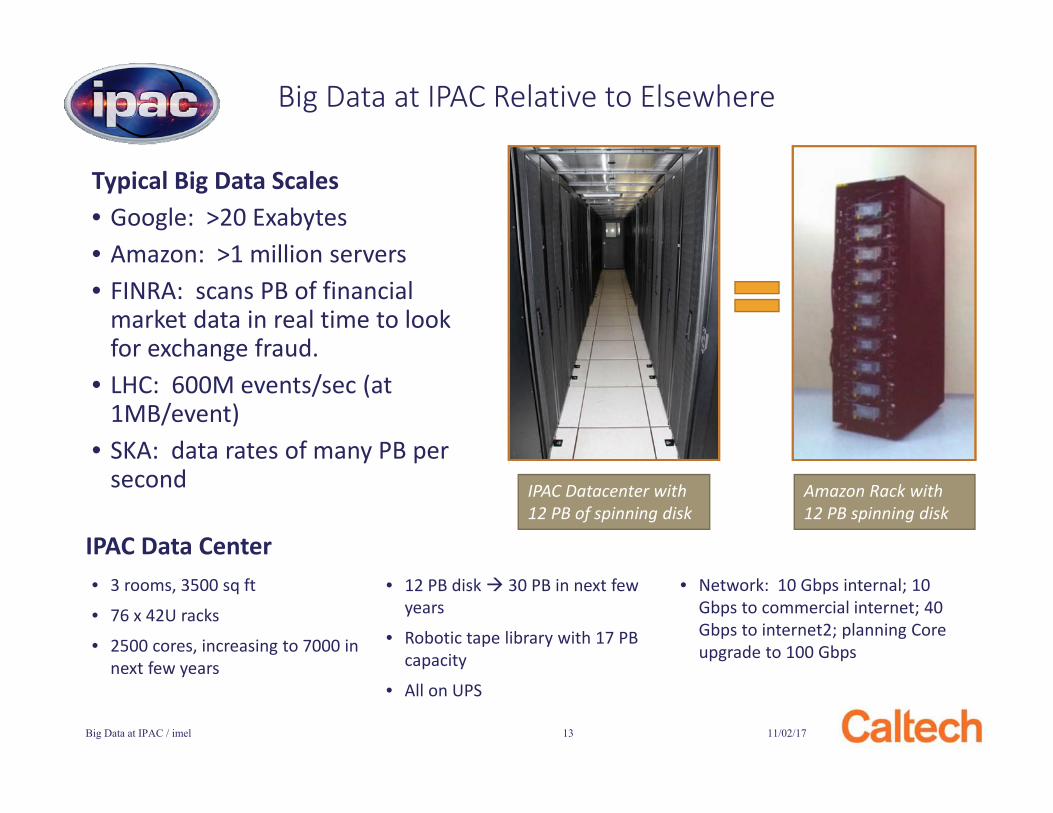
Typical Big Data Scales• Google: >20 Exabytes• Amazon: >1 million servers• FINRA: scans PB of financial
market data in real time to look for exchange fraud.
• LHC: 600M events/sec (at 1MB/event)
• SKA: data rates of many PB per second
11/02/17Big Data at IPAC / imel 13
Big Data at IPAC Relative to Elsewhere
IPAC Datacenter with 12 PB of spinning disk
Amazon Rack with 12 PB spinning disk
• 3 rooms, 3500 sq ft
• 76 x 42U racks
• 2500 cores, increasing to 7000 in next few years
• 12 PB disk 30 PB in next few years
• Robotic tape library with 17 PB capacity
• All on UPS
• Network: 10 Gbps internal; 10 Gbps to commercial internet; 40 Gbps to internet2; planning Core upgrade to 100 Gbps
IPAC Data Center
11/02/17Big Data at IPAC / imel 14
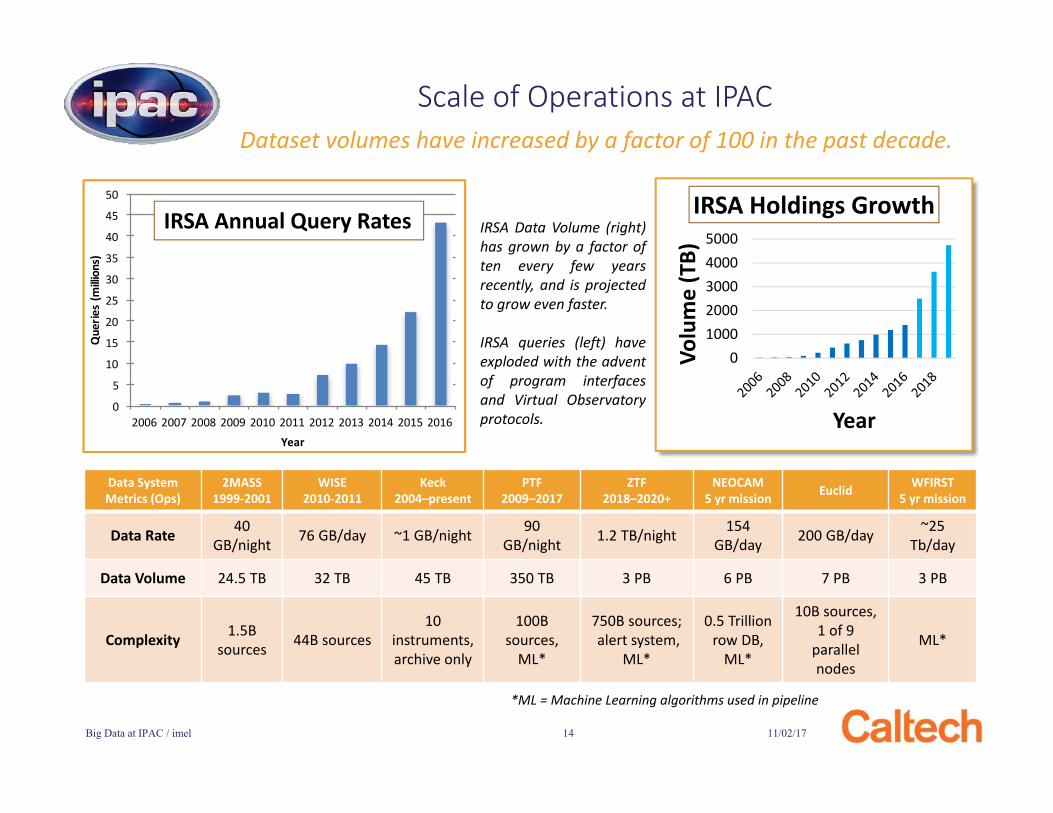
Scale of Operations at IPAC
010002000300040005000
Volu
me
(TB)
Year
IRSA Holdings GrowthIRSA Data Volume (right)has grown by a factor often every few yearsrecently, and is projectedto grow even faster.
IRSA queries (left) haveexploded with the adventof program interfacesand Virtual Observatoryprotocols.
Data System Metrics (Ops)
2MASS1999-2001
WISE2010-2011
Keck2004–present
PTF2009–2017
ZTF2018–2020+
NEOCAM5 yr mission Euclid WFIRST
5 yr mission
Data Rate 40 GB/night 76 GB/day ~1 GB/night 90
GB/night 1.2 TB/night 154GB/day 200 GB/day ~25
Tb/day
Data Volume 24.5 TB 32 TB 45 TB 350 TB 3 PB 6 PB 7 PB 3 PB
Complexity 1.5B sources 44B sources
10 instruments, archive only
100B sources,
ML*
750B sources;alert system,
ML*
0.5 Trillion row DB,
ML*
10B sources, 1 of 9
parallel nodes
ML*
*ML = Machine Learning algorithms used in pipeline
Dataset volumes have increased by a factor of 100 in the past decade.
0
5
10
15
20
25
30
35
40
45
50
2006 2007 2008 2009 2010 2011 2012 2013 2014 2015 2016
Que
ries
(milli
ons)
Year
0
5
10
15
20
25
30
35
40
45
50
2006 2007 2008 2009 2010 2011 2012 2013 2014 2015 2016
Que
ries
(milli
ons)
Year
IRSA Annual Query Rates
11/02/17Big Data at IPAC / imel 15
The Context of Operational Systems
• NASA Archives, like NASA missions, are necessarily conservative, focusing on reliable operations:o Data integrity, backups, guaranteed
uptime, IT security.o Support for mission operations; stability
of interfaces.o Ingestion of datasets is usually a higher
priority than new features.
• Data volumes and database table sizes are increasing exponentially, creating challenges for Ingest, query, and download.o Successful implementation of program
interfaces, e.g. virtual observatory protocols, has led to incorporation of NASA Archives into data processing pipelines, with skyrocketing access rates.
Summary of FY17 for IRSA and NED:• IRSA: 30 million queries, • IRSA: 200 TiB of data downloaded • IRSA: 20 new datasets• IRSA: All major data sets available through
VO protocols • IRSA: Time Series Tool • IRSA: User interface for NASA IRTF• NED: 80 million database queries• NED: 83 million new objects and cross-ids• NED: Redesign of User Interface and
supporting infrastructure
IPAC's highest priority for its resources is supporting NASA missions and the science community. Big Data Technology Innovation must happen in that context.
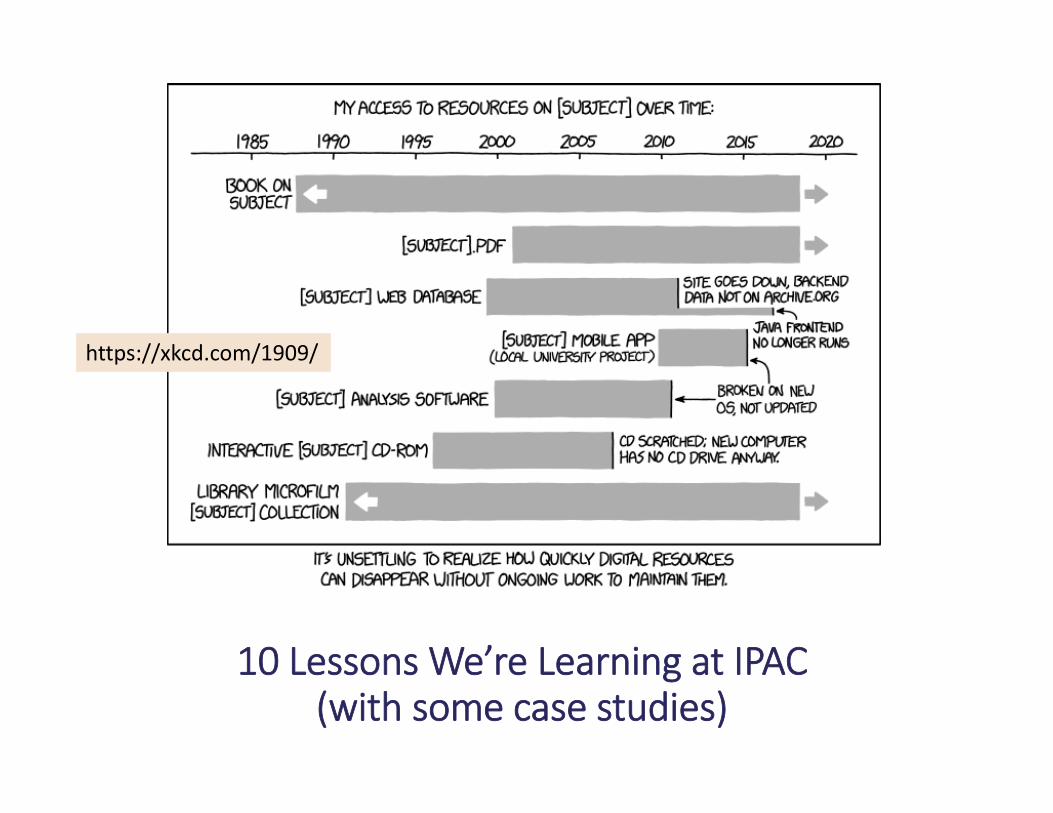
https://xkcd.com/1909/
10 Lessons We’re Learning at IPAC(with some case studies)
11/02/17Big Data at IPAC / imel 17
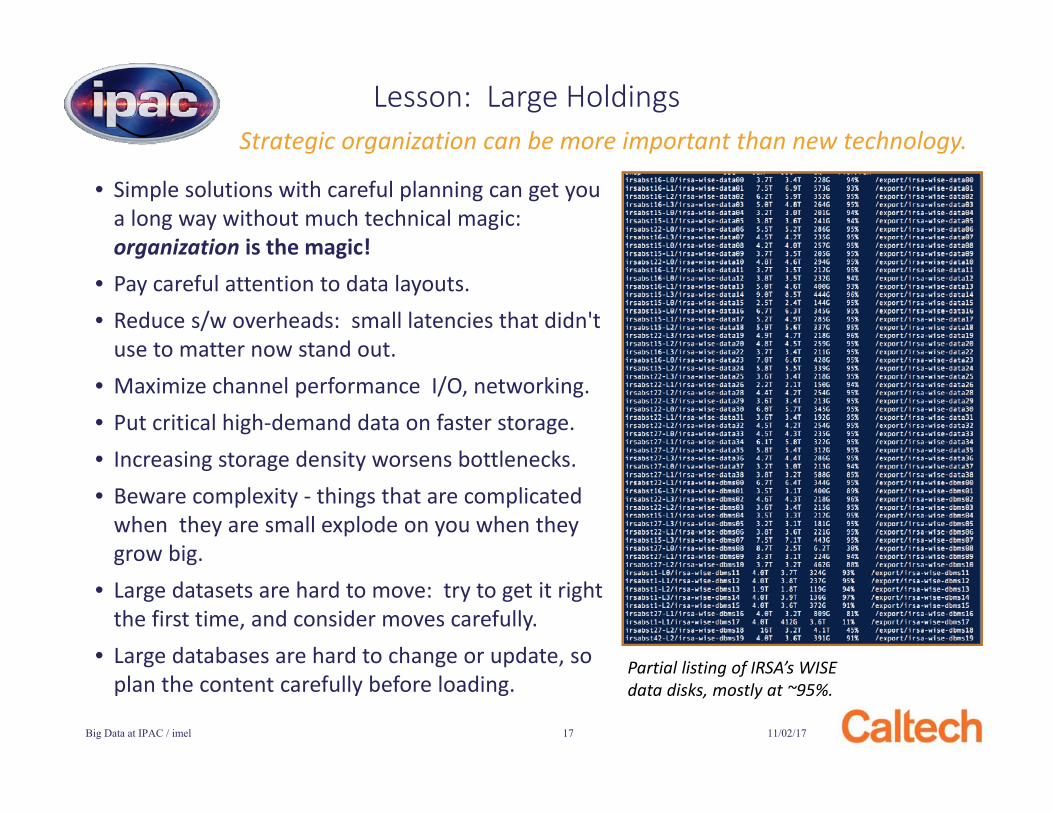
Lesson: Large HoldingsStrategic organization can be more important than new technology.
• Simple solutions with careful planning can get you a long way without much technical magic: organization is the magic!
• Pay careful attention to data layouts.• Reduce s/w overheads: small latencies that didn't
use to matter now stand out.• Maximize channel performance I/O, networking.• Put critical high-demand data on faster storage.• Increasing storage density worsens bottlenecks.• Beware complexity - things that are complicated
when they are small explode on you when they grow big.
• Large datasets are hard to move: try to get it right the first time, and consider moves carefully.
• Large databases are hard to change or update, so plan the content carefully before loading.
Partial listing of IRSA’s WISE data disks, mostly at ~95%.
• Optimize data layouts for most common use cases: But different use cases require different organizations.
• Increasing interest in summary/statistical queries vs. the typical past use case of simple retrieval: o This usage requires more expensive
table scan operations.
• May need to consider indexing in space-time, rather than just space, for moving object applications.
• Some tables are outgrowing our ability to handle them with previous techniques: for example, ZTF light curves.
11/02/17Big Data at IPAC / imel 18
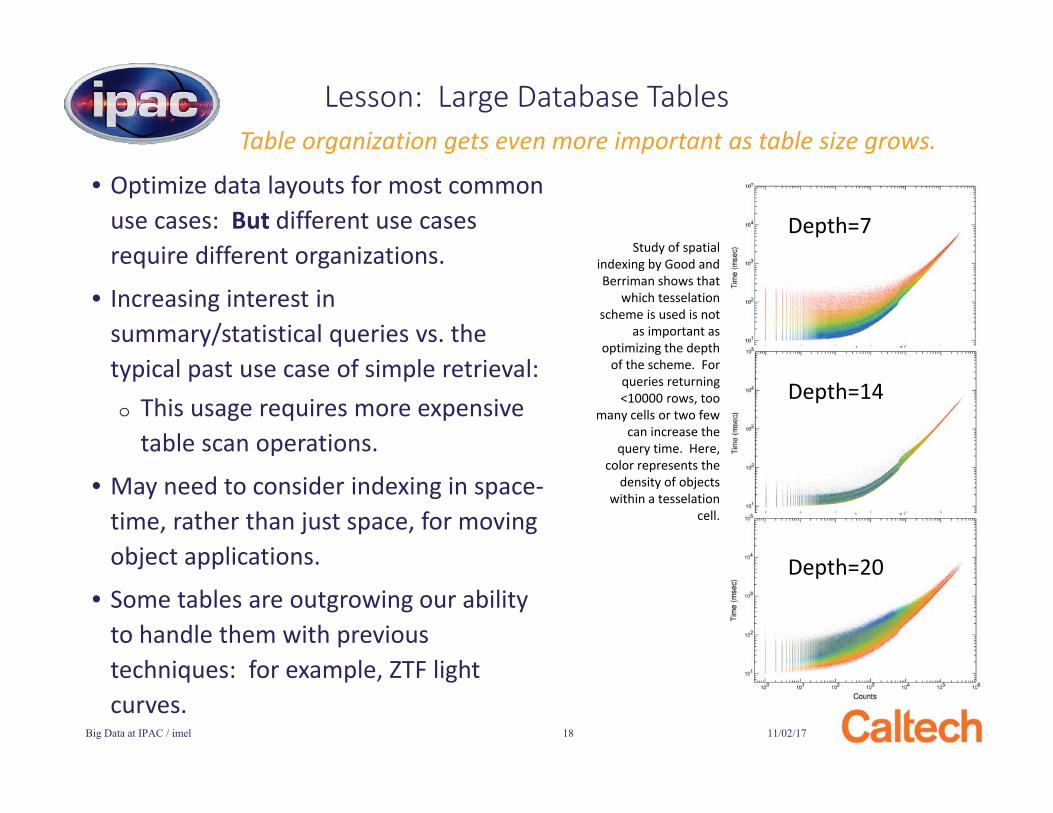
Lesson: Large Database TablesTable organization gets even more important as table size grows.
Study of spatial indexing by Good and Berriman shows that
which tesselationscheme is used is not
as important as optimizing the depth
of the scheme. For queries returning <10000 rows, too
many cells or two few can increase the
query time. Here, color represents the
density of objects within a tesselation
cell.
Depth=7
Depth=14
Depth=20
• Prior datasets have included a photometry table which includes a record for every measurement of every source.
• ZTF data rate would generate a table with more than a trillion entries.o Database servers to handle this scale of
data with traditional approach exceeds project budget.
o Especially difficult with nightly table updates / re-indexing.
• Hybrid approach:o Database for objects, photometry in files.o Metadata for objects and pre-calculated
photometric statistics.o Photometry extracted from files on-the-fly
in response to queries. 11/02/17Big Data at IPAC / imel 19
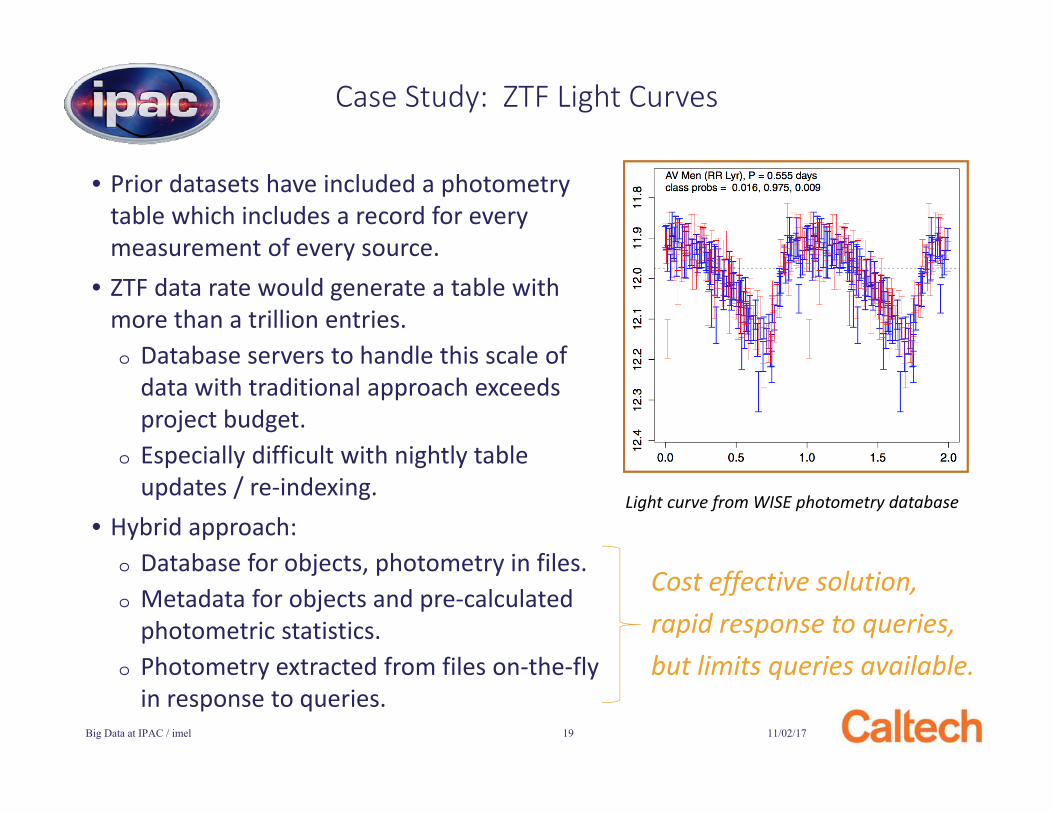
Case Study: ZTF Light Curves
Light curve from WISE photometry database
Cost effective solution, rapid response to queries, but limits queries available.
• Reliable and efficient operations requires rigorously verified metadata with tested process for interface changes.
• Tables can grow beyond what is feasible to re-index on a nightly basis: in some cases, we have implemented multi-stage table ingest. But this requires much more operations book-keeping.
• Because an interruption to operations is not acceptable, doing a redesign mid-mission can be very difficult. o WISE / NEOWISE / NEOWISE(R)
mission has been in operations for 8 years; Spitzer has been in operations for 14 years.
11/02/17Big Data at IPAC / imel 20
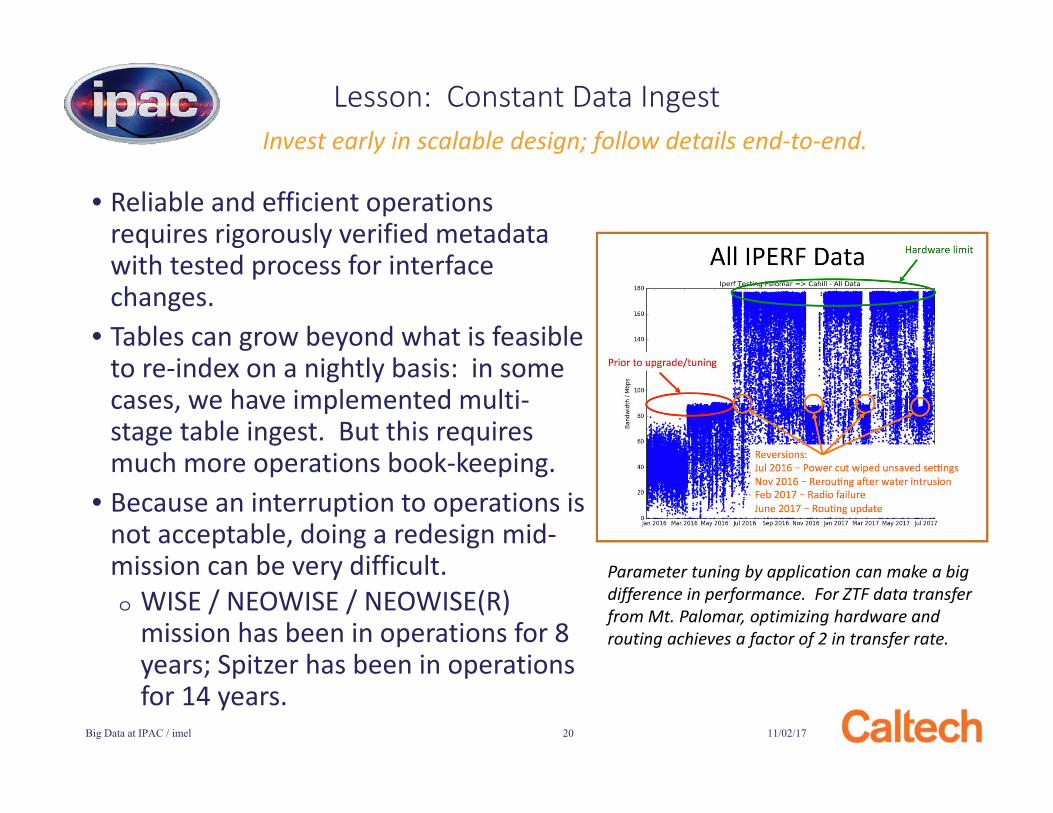
Lesson: Constant Data Ingest
Parameter tuning by application can make a big difference in performance. For ZTF data transfer from Mt. Palomar, optimizing hardware and routing achieves a factor of 2 in transfer rate.
Invest early in scalable design; follow details end-to-end.
• Metadata: o In order to perform searches across an archive,
need to have consistent metadata. o Need interface and metadata standards to
search across archives: We have adopted VO protocols. Working with other archives to adopt the
Common Archive Observation Model.• Objects:
o Co-registration of objects from one observation to next; moving objects!
o Cross-identification of objects between datasets: resolution, wavelength.
o Extended in space.o Hierarchical objects (galaxy vs. its components,
multiples with planets, planets with moons).o Evolving knowledge of the relationships
between objects as systems are observed.11/02/17Big Data at IPAC / imel 21
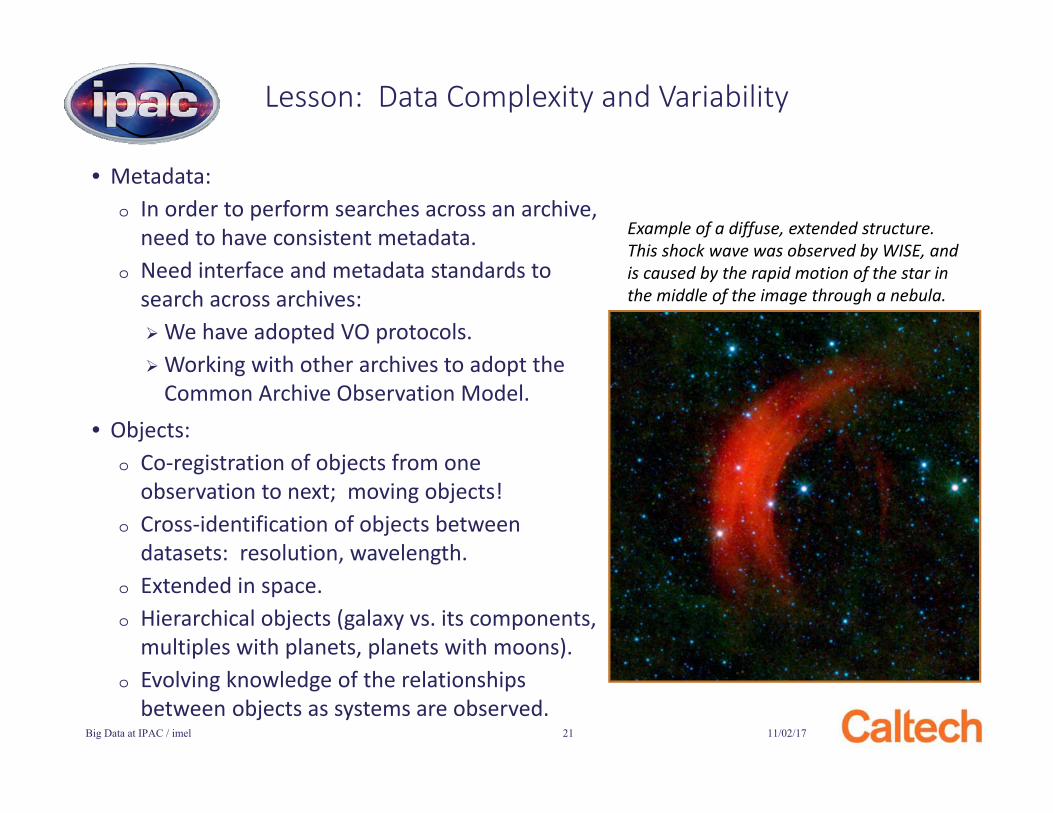
Lesson: Data Complexity and Variability
Example of a diffuse, extended structure. This shock wave was observed by WISE, and is caused by the rapid motion of the star in the middle of the image through a nebula.
11/02/17Big Data at IPAC / imel 22
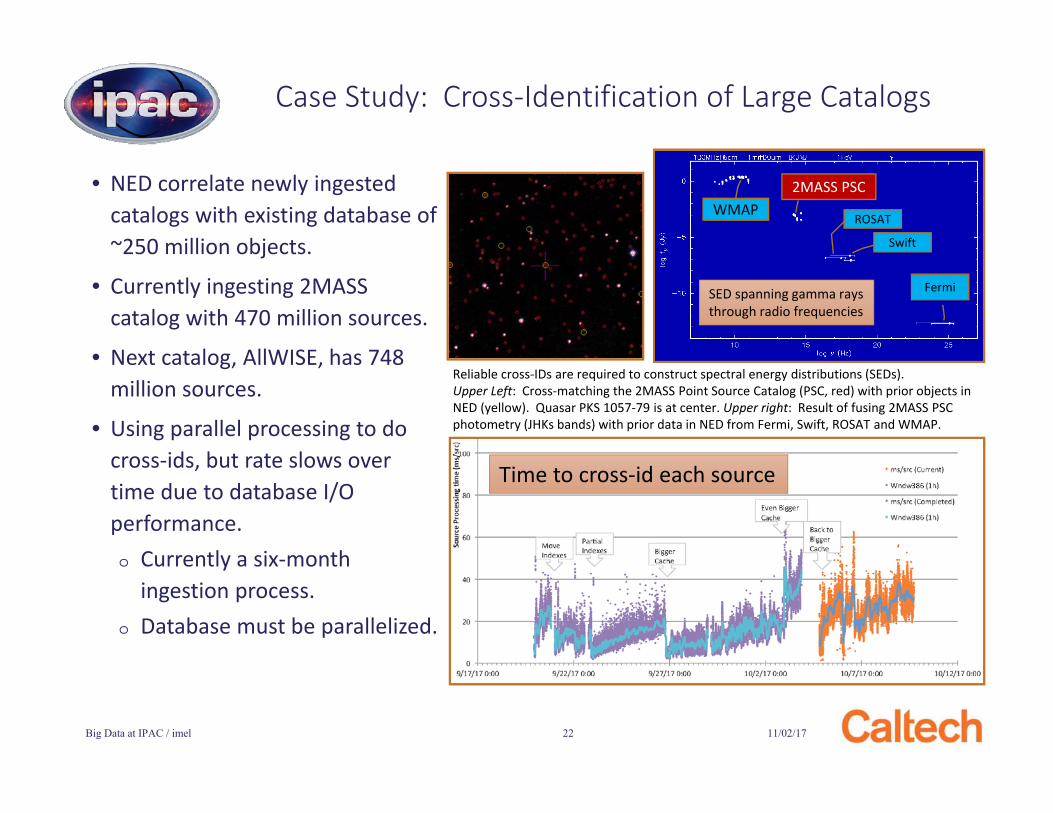
Case Study: Cross-Identification of Large Catalogs
• NED correlate newly ingested catalogs with existing database of ~250 million objects.
• Currently ingesting 2MASS catalog with 470 million sources.
• Next catalog, AllWISE, has 748 million sources.
• Using parallel processing to do cross-ids, but rate slows over time due to database I/O performance.o Currently a six-month
ingestion process.o Database must be parallelized.
Time to cross-id each source
Reliable cross-IDs are required to construct spectral energy distributions (SEDs). Upper Left: Cross-matching the 2MASS Point Source Catalog (PSC, red) with prior objects in NED (yellow). Quasar PKS 1057-79 is at center. Upper right: Result of fusing 2MASS PSC photometry (JHKs bands) with prior data in NED from Fermi, Swift, ROSAT and WMAP.
SED spanning gamma rays through radio frequencies
Swift
Fermi
ROSATWMAP
2MASS PSC
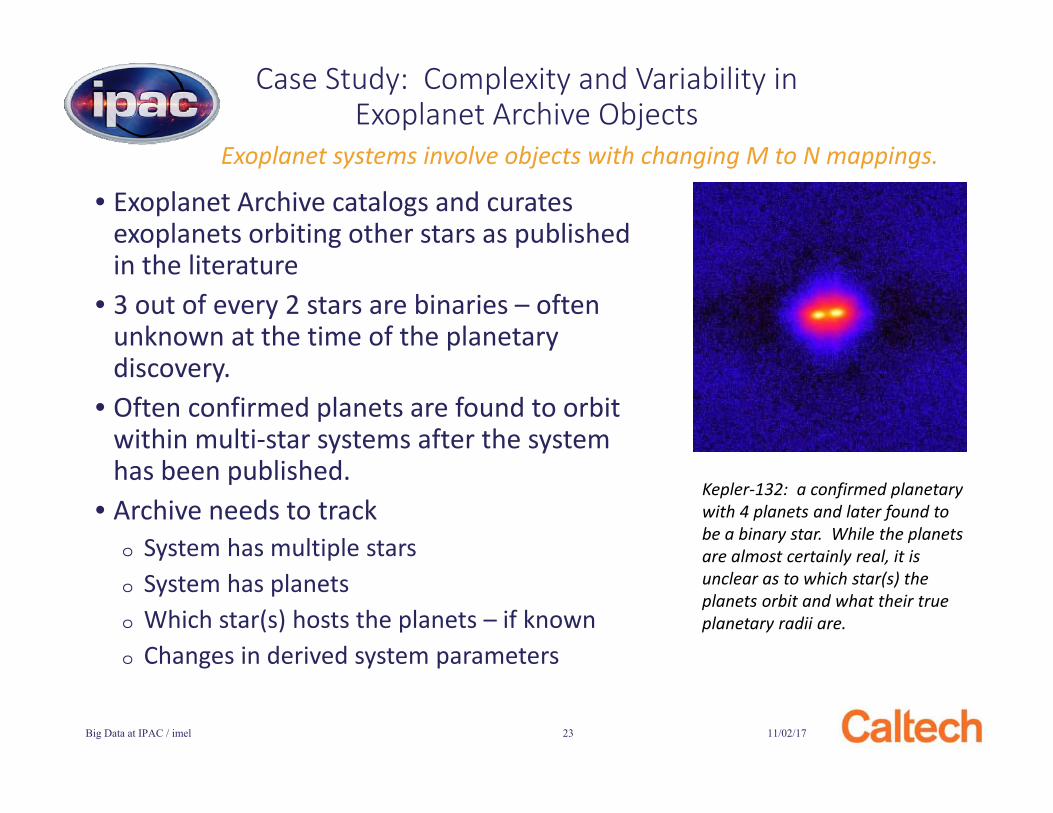
• Exoplanet Archive catalogs and curates exoplanets orbiting other stars as published in the literature
• 3 out of every 2 stars are binaries – often unknown at the time of the planetary discovery.
• Often confirmed planets are found to orbit within multi-star systems after the system has been published.
• Archive needs to track o System has multiple starso System has planetso Which star(s) hosts the planets – if knowno Changes in derived system parameters
11/02/17Big Data at IPAC / imel 23
Case Study: Complexity and Variability in Exoplanet Archive Objects
Kepler-132: a confirmed planetary with 4 planets and later found to be a binary star. While the planets are almost certainly real, it is unclear as to which star(s) the planets orbit and what their true planetary radii are.
Exoplanet systems involve objects with changing M to N mappings.
11/02/17Big Data at IPAC / imel 24
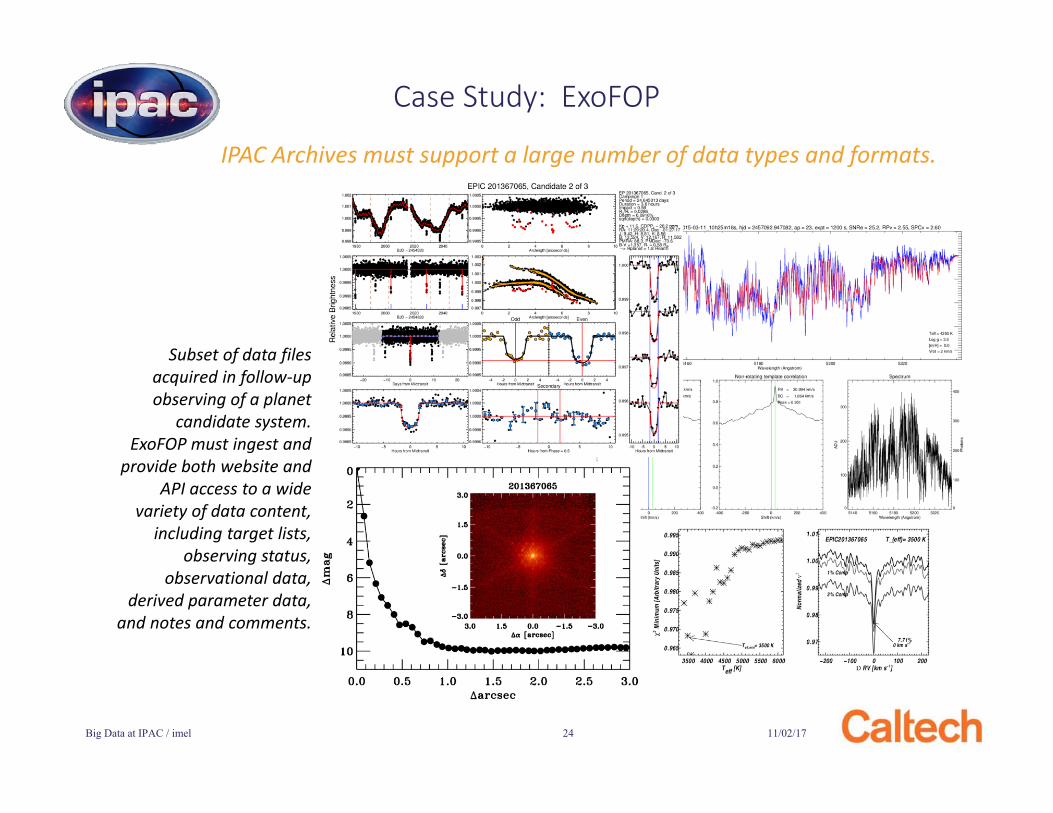
Case Study: ExoFOP
IPAC Archives must support a large number of data types and formats.
Subset of data files acquired in follow-up observing of a planet
candidate system. ExoFOP must ingest and
provide both website and API access to a wide
variety of data content, including target lists,
observing status,observational data,
derived parameter data,and notes and comments.
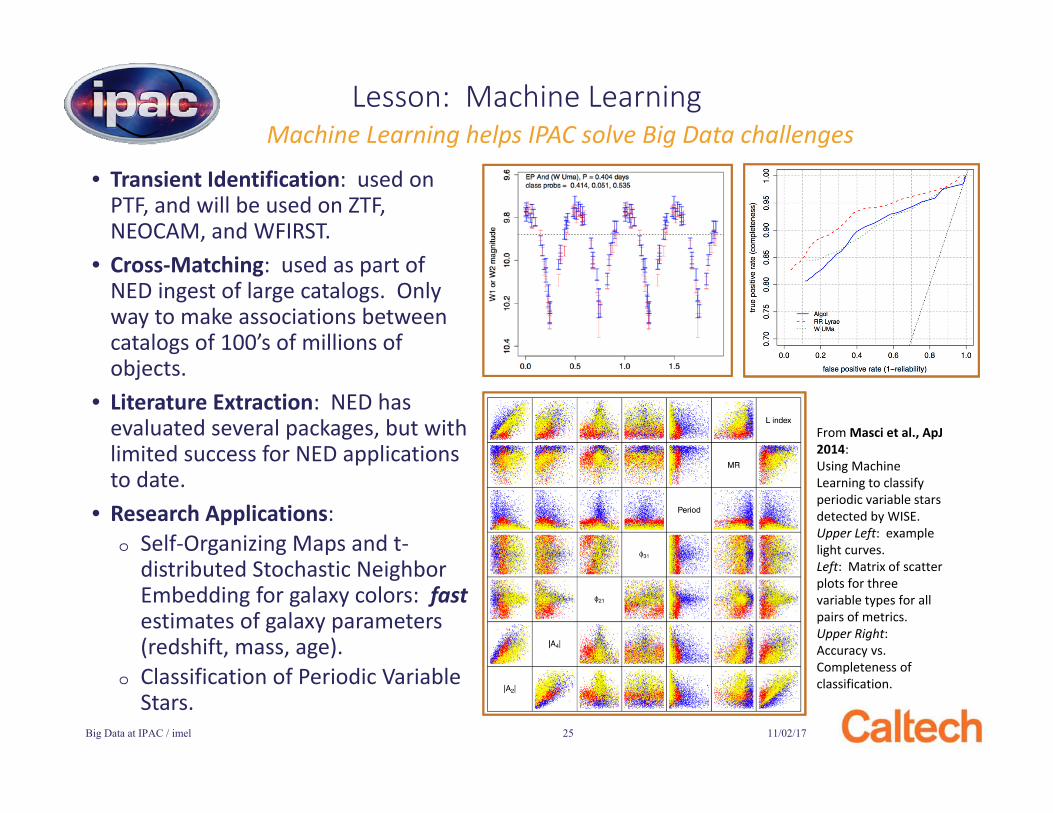
• Transient Identification: used on PTF, and will be used on ZTF, NEOCAM, and WFIRST.
• Cross-Matching: used as part of NED ingest of large catalogs. Only way to make associations between catalogs of 100’s of millions of objects.
• Literature Extraction: NED has evaluated several packages, but with limited success for NED applications to date.
• Research Applications:o Self-Organizing Maps and t-
distributed Stochastic Neighbor Embedding for galaxy colors: fastestimates of galaxy parameters (redshift, mass, age).
o Classification of Periodic Variable Stars.
11/02/17Big Data at IPAC / imel 25
Lesson: Machine Learning
From Masci et al., ApJ2014:Using Machine Learning to classify periodic variable stars detected by WISE.Upper Left: example light curves.Left: Matrix of scatter plots for three variable types for all pairs of metrics.Upper Right: Accuracy vs. Completeness of classification.
Machine Learning helps IPAC solve Big Data challenges
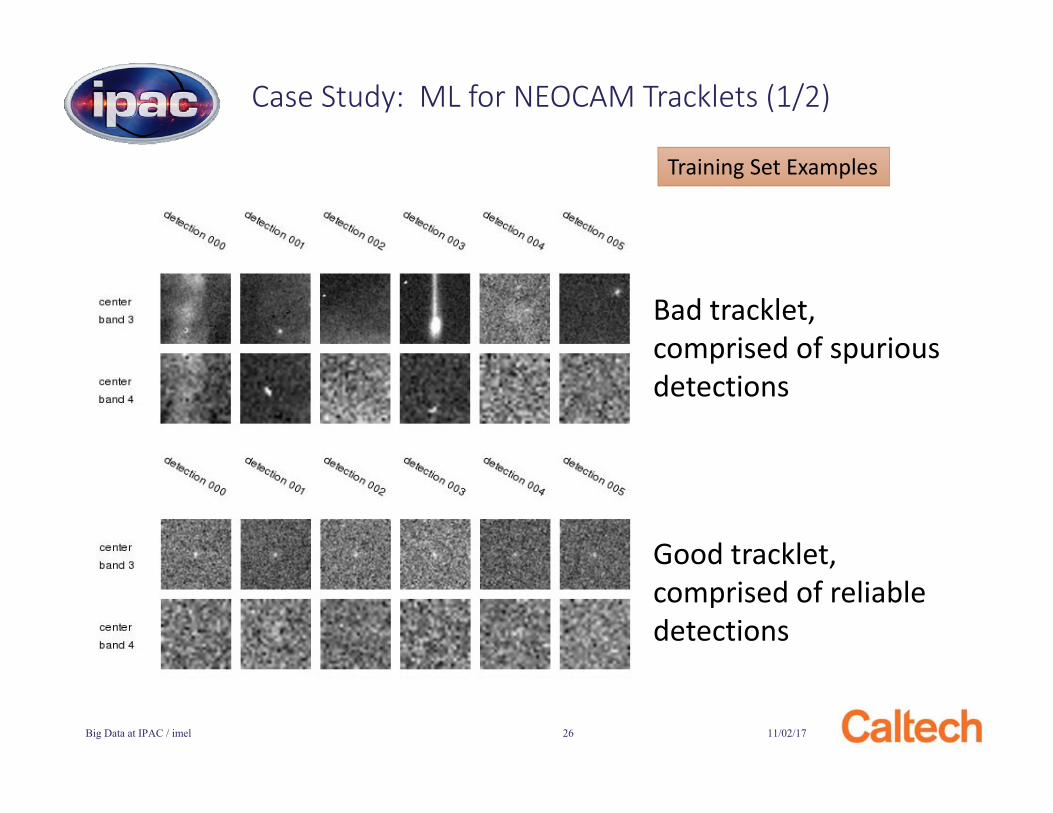
Case Study: ML for NEOCAM Tracklets (1/2)
Bad tracklet, comprised of spuriousdetections
Good tracklet, comprised of reliabledetections
Training Set Examples
11/02/17Big Data at IPAC / imel 26
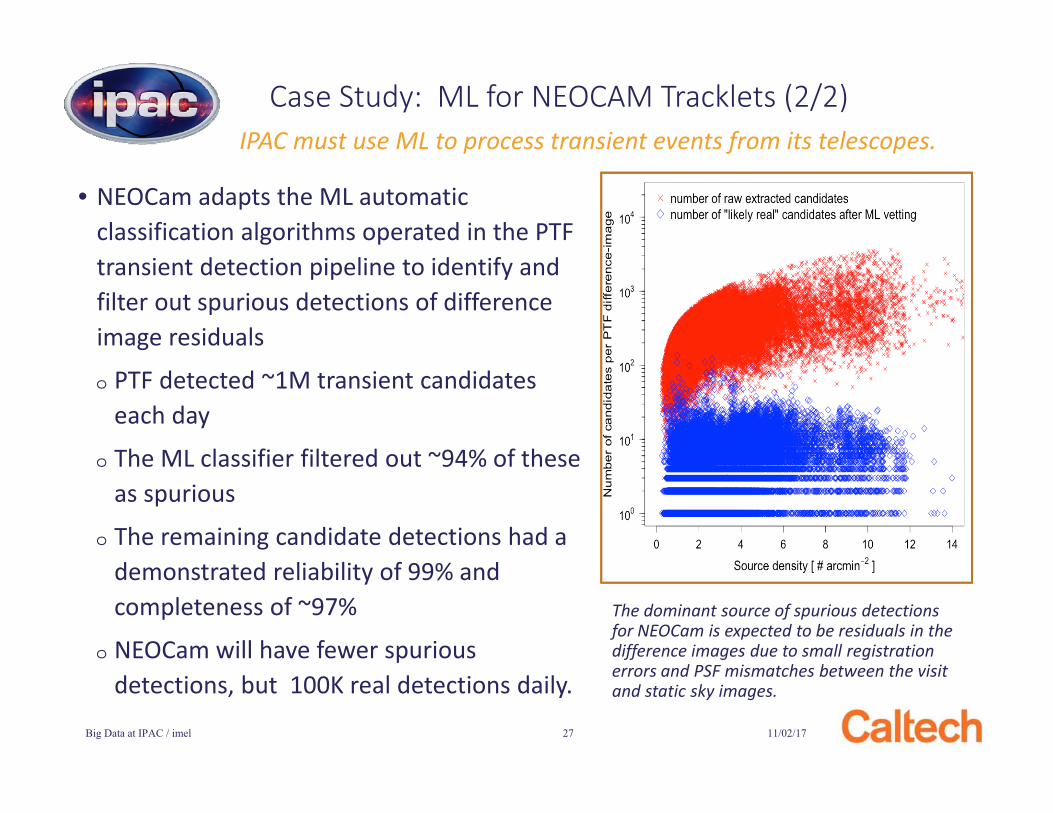
The dominant source of spurious detections for NEOCam is expected to be residuals in the difference images due to small registration errors and PSF mismatches between the visit and static sky images.
Case Study: ML for NEOCAM Tracklets (2/2)
• NEOCam adapts the ML automatic classification algorithms operated in the PTF transient detection pipeline to identify and filter out spurious detections of difference image residuals
o PTF detected ~1M transient candidates each day
o The ML classifier filtered out ~94% of these as spurious
o The remaining candidate detections had a demonstrated reliability of 99% and completeness of ~97%
o NEOCam will have fewer spurious detections, but 100K real detections daily.
IPAC must use ML to process transient events from its telescopes.
11/02/17Big Data at IPAC / imel 27
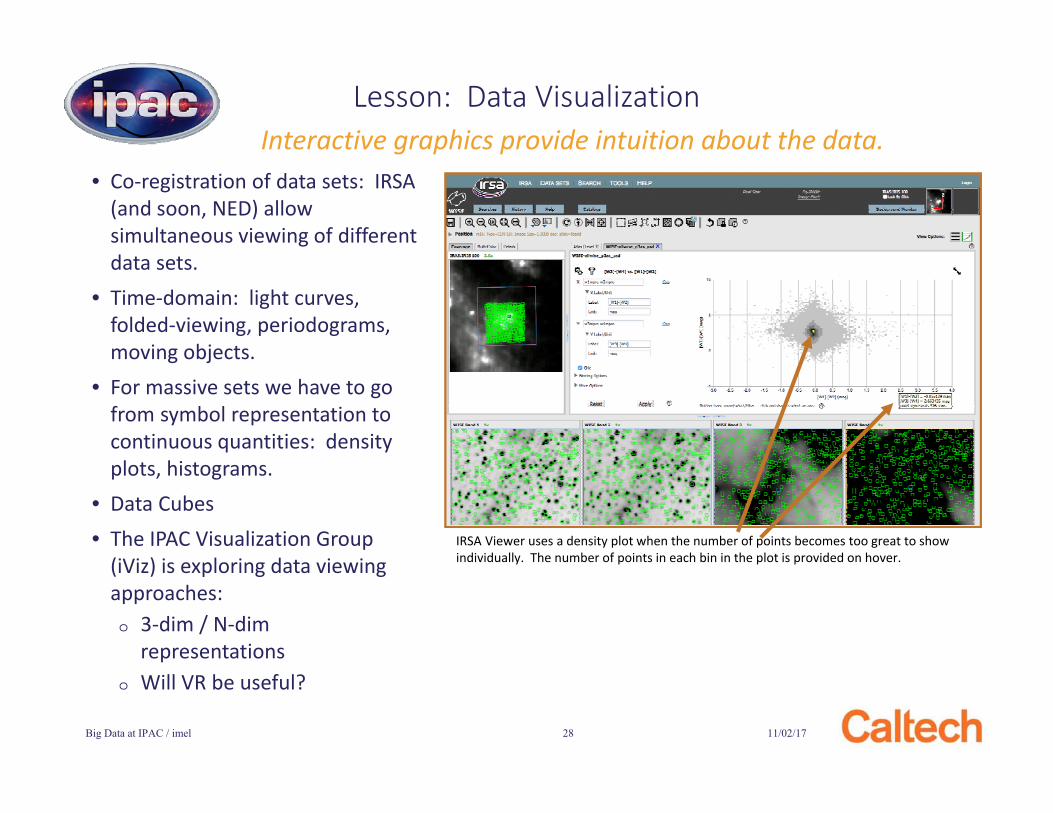
• Co-registration of data sets: IRSA (and soon, NED) allow simultaneous viewing of different data sets.
• Time-domain: light curves, folded-viewing, periodograms, moving objects.
• For massive sets we have to go from symbol representation to continuous quantities: density plots, histograms.
• Data Cubes• The IPAC Visualization Group
(iViz) is exploring data viewing approaches:o 3-dim / N-dim
representationso Will VR be useful?
11/02/17Big Data at IPAC / imel 28
Lesson: Data VisualizationInteractive graphics provide intuition about the data.
IRSA Viewer uses a density plot when the number of points becomes too great to show individually. The number of points in each bin in the plot is provided on hover.
11/02/17Big Data at IPAC / imel 29
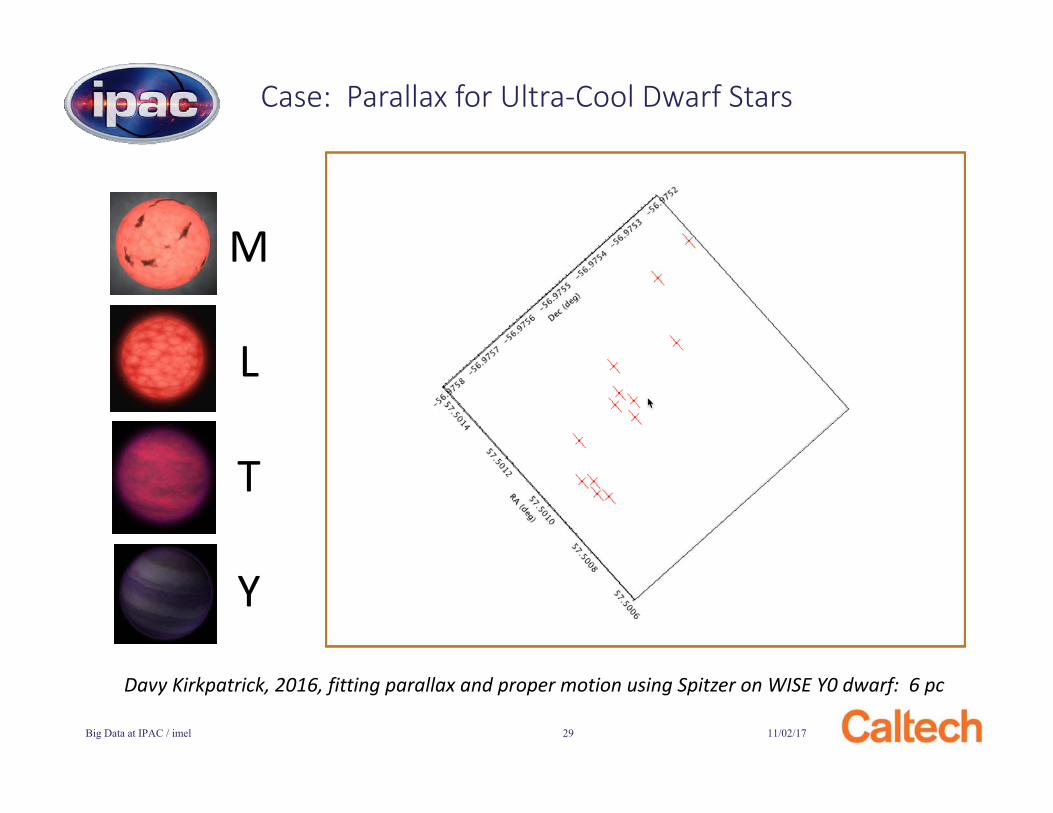
Case: Parallax for Ultra-Cool Dwarf Stars
M
L
T
Y
Davy Kirkpatrick, 2016, fitting parallax and proper motion using Spitzer on WISE Y0 dwarf: 6 pc
11/02/17Big Data at IPAC / imel 30
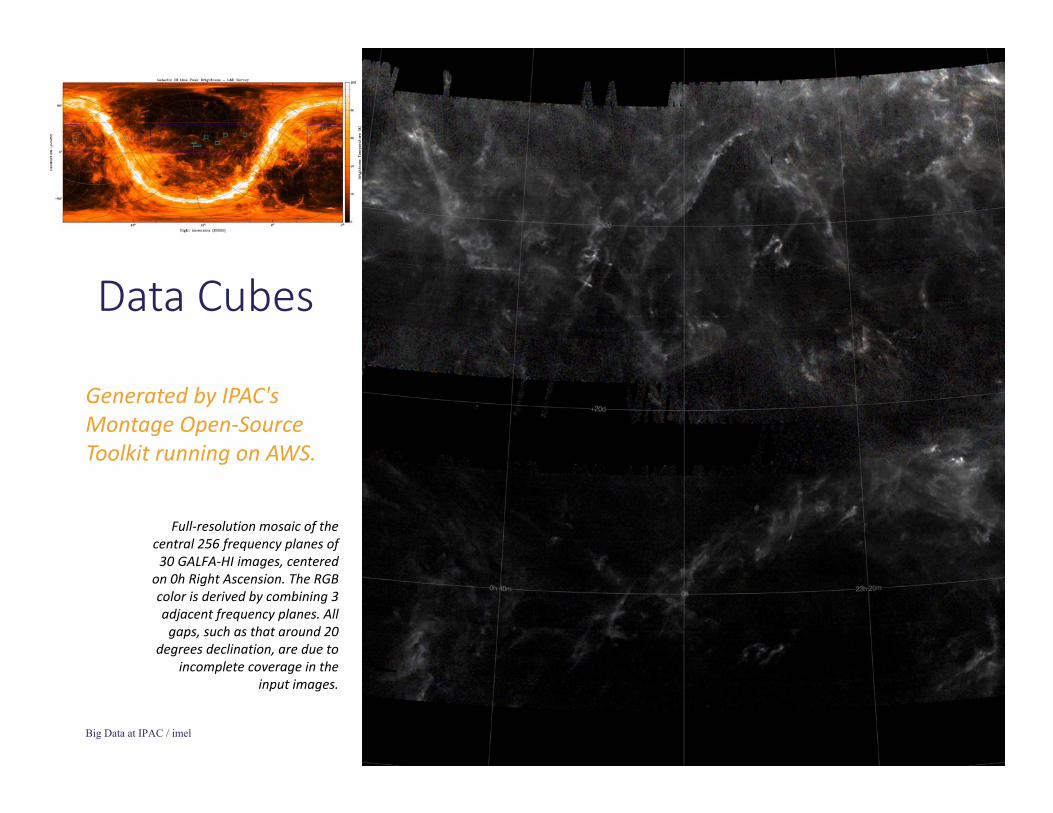
Data Cubes
Full-resolution mosaic of the central 256 frequency planes of 30 GALFA-HI images, centered
on 0h Right Ascension. The RGB color is derived by combining 3 adjacent frequency planes. All
gaps, such as that around 20 degrees declination, are due to
incomplete coverage in the input images.
Generated by IPAC's Montage Open-Source Toolkit running on AWS.
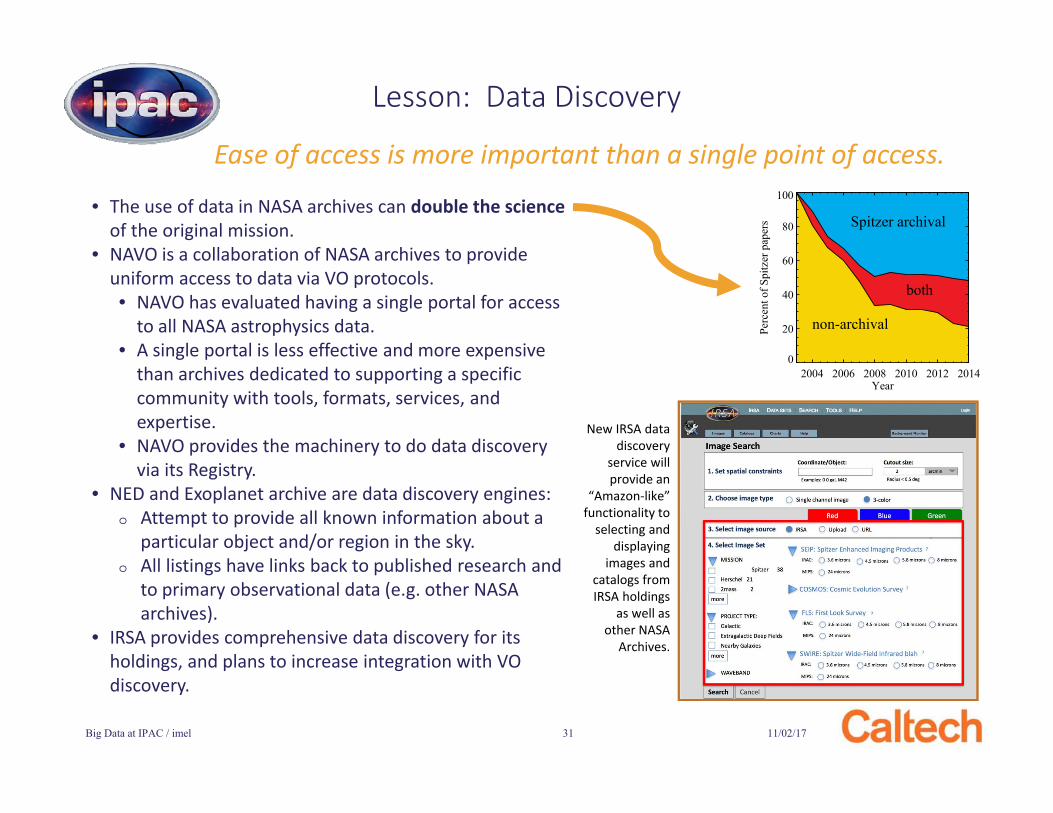
• The use of data in NASA archives can double the science of the original mission.
• NAVO is a collaboration of NASA archives to provide uniform access to data via VO protocols.• NAVO has evaluated having a single portal for access
to all NASA astrophysics data.• A single portal is less effective and more expensive
than archives dedicated to supporting a specific community with tools, formats, services, and expertise.
• NAVO provides the machinery to do data discovery via its Registry.
• NED and Exoplanet archive are data discovery engines:o Attempt to provide all known information about a
particular object and/or region in the sky.o All listings have links back to published research and
to primary observational data (e.g. other NASA archives).
• IRSA provides comprehensive data discovery for its holdings, and plans to increase integration with VO discovery.
Ease of access is more important than a single point of access.
11/02/17Big Data at IPAC / imel 31
Lesson: Data Discovery
2004 2006 2008 2010 2012 2014Year
0
20
40
60
80
100
Perc
ent o
f Spi
tzer
pap
ers
non-archival
both
Spitzer archival
New IRSA data discovery
service will provide an
“Amazon-like” functionality to
selecting and displaying
images and catalogs from IRSA holdings
as well as other NASA
Archives.
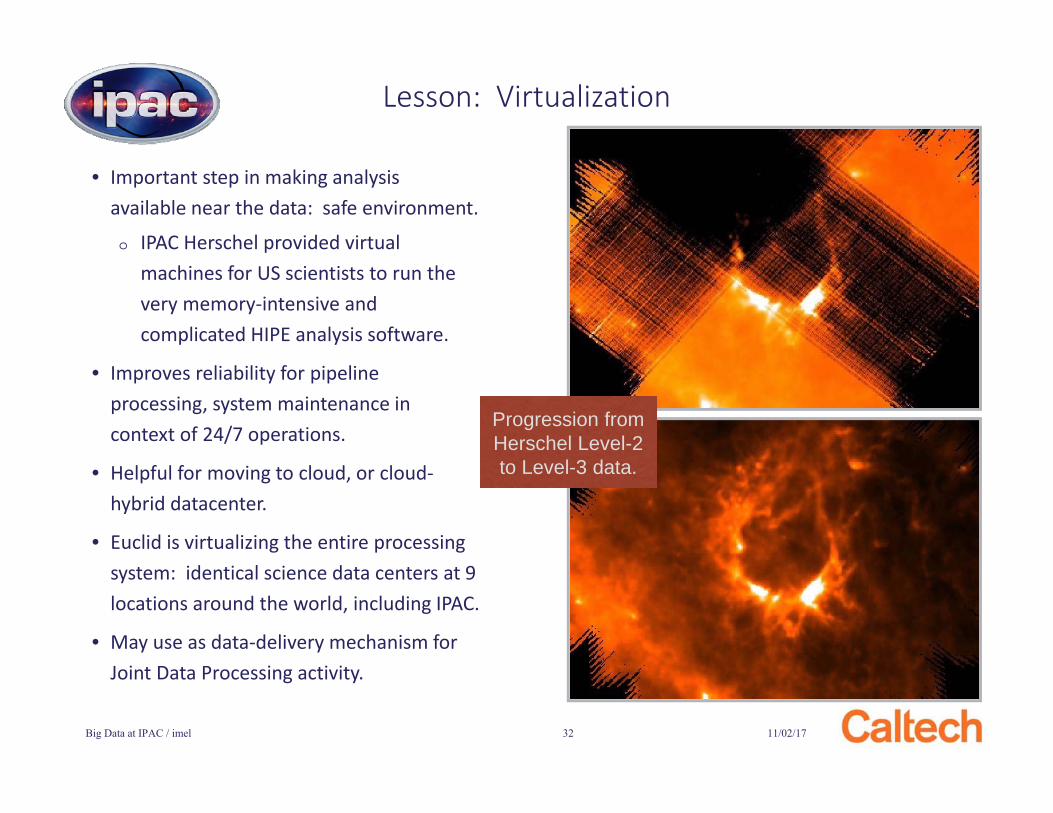
• Important step in making analysis available near the data: safe environment.
o IPAC Herschel provided virtual machines for US scientists to run the very memory-intensive and complicated HIPE analysis software.
• Improves reliability for pipeline processing, system maintenance in context of 24/7 operations.
• Helpful for moving to cloud, or cloud-hybrid datacenter.
• Euclid is virtualizing the entire processing system: identical science data centers at 9 locations around the world, including IPAC.
• May use as data-delivery mechanism for Joint Data Processing activity.
11/02/17Big Data at IPAC / imel 32
Lesson: Virtualization
Progression from Herschel Level-2 to Level-3 data.
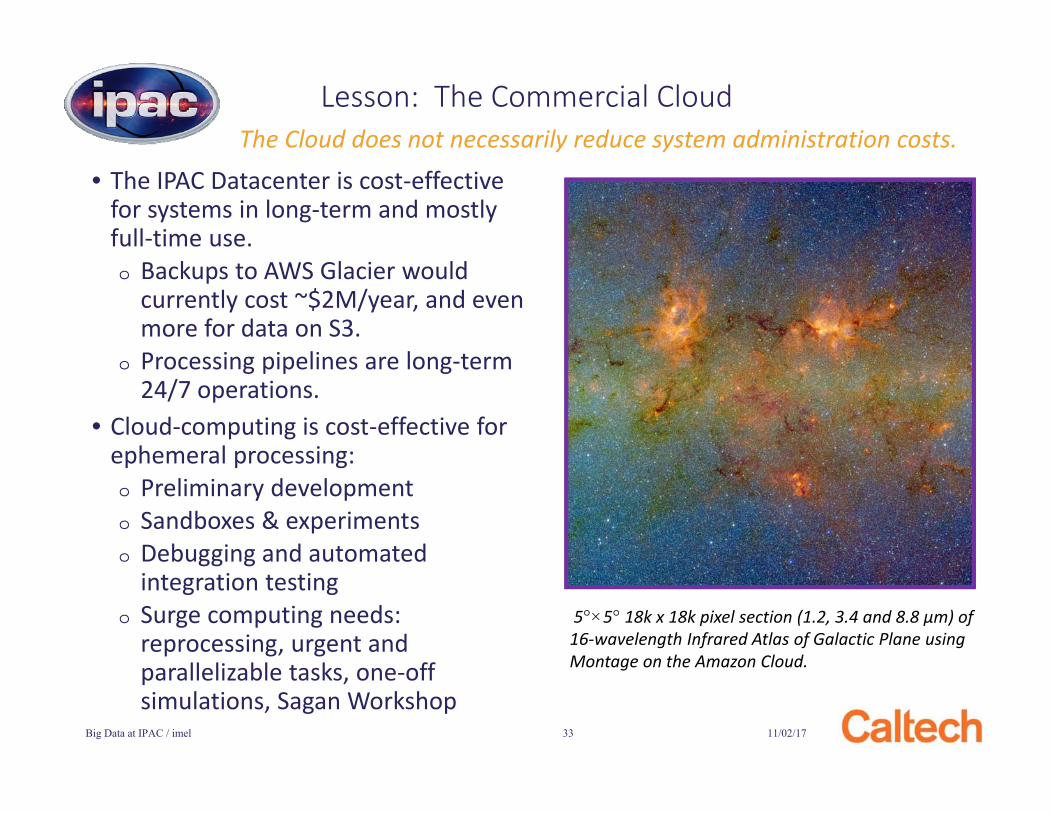
• The IPAC Datacenter is cost-effective for systems in long-term and mostly full-time use.o Backups to AWS Glacier would
currently cost ~$2M/year, and even more for data on S3.
o Processing pipelines are long-term 24/7 operations.
• Cloud-computing is cost-effective for ephemeral processing:o Preliminary developmento Sandboxes & experimentso Debugging and automated
integration testingo Surge computing needs:
reprocessing, urgent and parallelizable tasks, one-off simulations, Sagan Workshop
11/02/17Big Data at IPAC / imel 33
Lesson: The Commercial Cloud
5°×5° 18k x 18k pixel section (1.2, 3.4 and 8.8 μm) of 16-wavelength Infrared Atlas of Galactic Plane using Montage on the Amazon Cloud.
The Cloud does not necessarily reduce system administration costs.
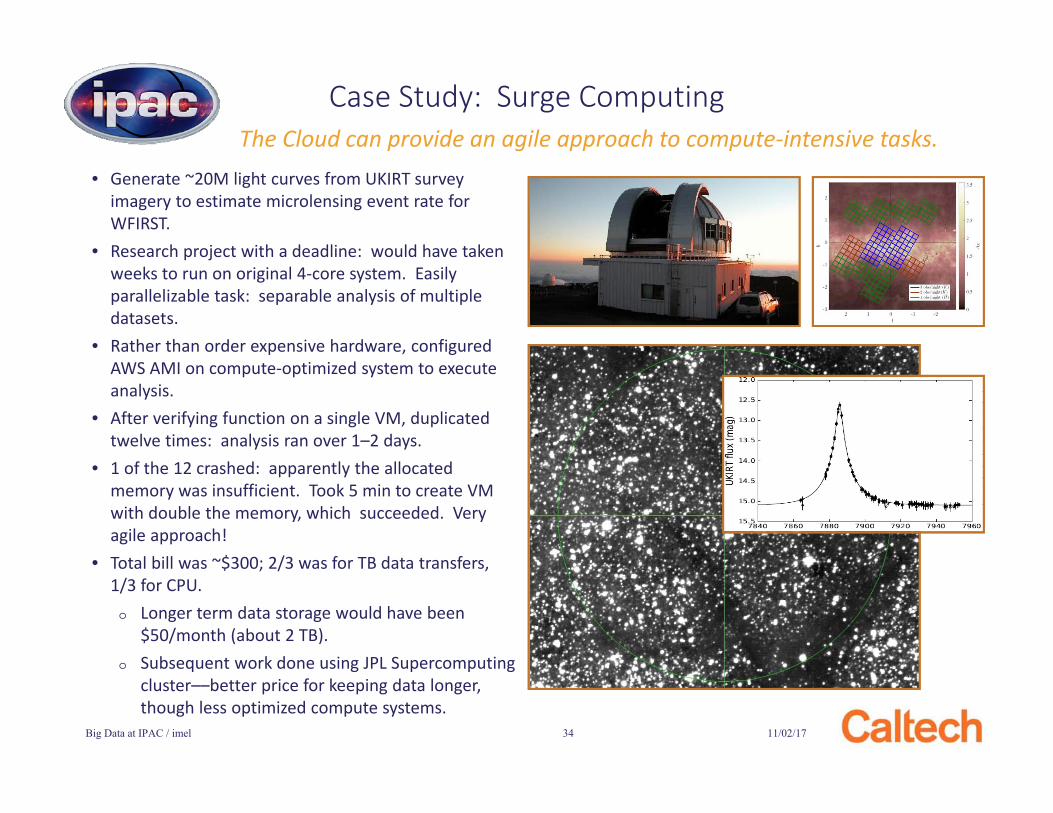
• Generate ~20M light curves from UKIRT survey imagery to estimate microlensing event rate for WFIRST.
• Research project with a deadline: would have taken weeks to run on original 4-core system. Easily parallelizable task: separable analysis of multiple datasets.
• Rather than order expensive hardware, configured AWS AMI on compute-optimized system to execute analysis.
• After verifying function on a single VM, duplicated twelve times: analysis ran over 1–2 days.
• 1 of the 12 crashed: apparently the allocated memory was insufficient. Took 5 min to create VM with double the memory, which succeeded. Very agile approach!
• Total bill was ~$300; 2/3 was for TB data transfers, 1/3 for CPU.o Longer term data storage would have been
$50/month (about 2 TB).o Subsequent work done using JPL Supercomputing
cluster––better price for keeping data longer, though less optimized compute systems.
11/02/17Big Data at IPAC / imel 34
Case Study: Surge ComputingThe Cloud can provide an agile approach to compute-intensive tasks.
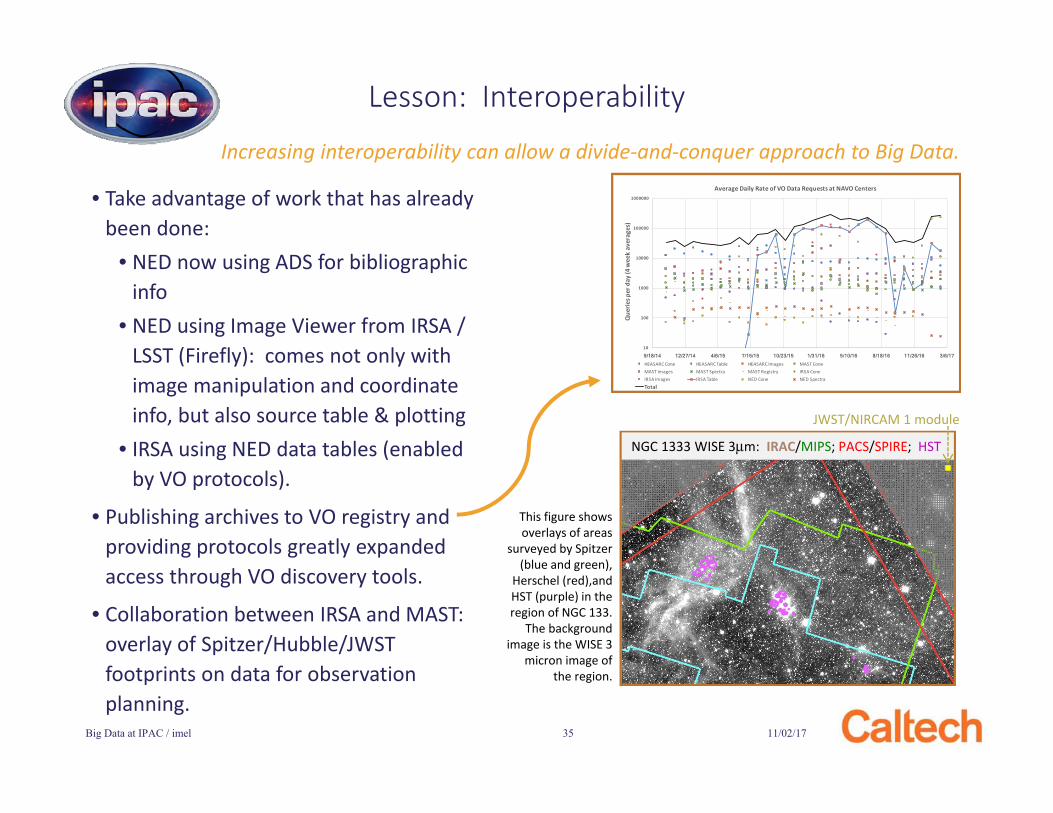
• Take advantage of work that has already been done:
• NED now using ADS for bibliographic info
• NED using Image Viewer from IRSA / LSST (Firefly): comes not only with image manipulation and coordinate info, but also source table & plotting
• IRSA using NED data tables (enabled by VO protocols).
• Publishing archives to VO registry and providing protocols greatly expanded access through VO discovery tools.
• Collaboration between IRSA and MAST: overlay of Spitzer/Hubble/JWST footprints on data for observation planning.
Increasing interoperability can allow a divide-and-conquer approach to Big Data.
11/02/17Big Data at IPAC / imel 35
Lesson: Interoperability
NGC 1333 WISE 3μm: IRAC/MIPS; PACS/SPIRE; HST
JWST/NIRCAM 1 module
This figure shows overlays of areas
surveyed by Spitzer (blue and green),
Herschel (red),and HST (purple) in the region of NGC 133.
The background image is the WISE 3
micron image of the region.
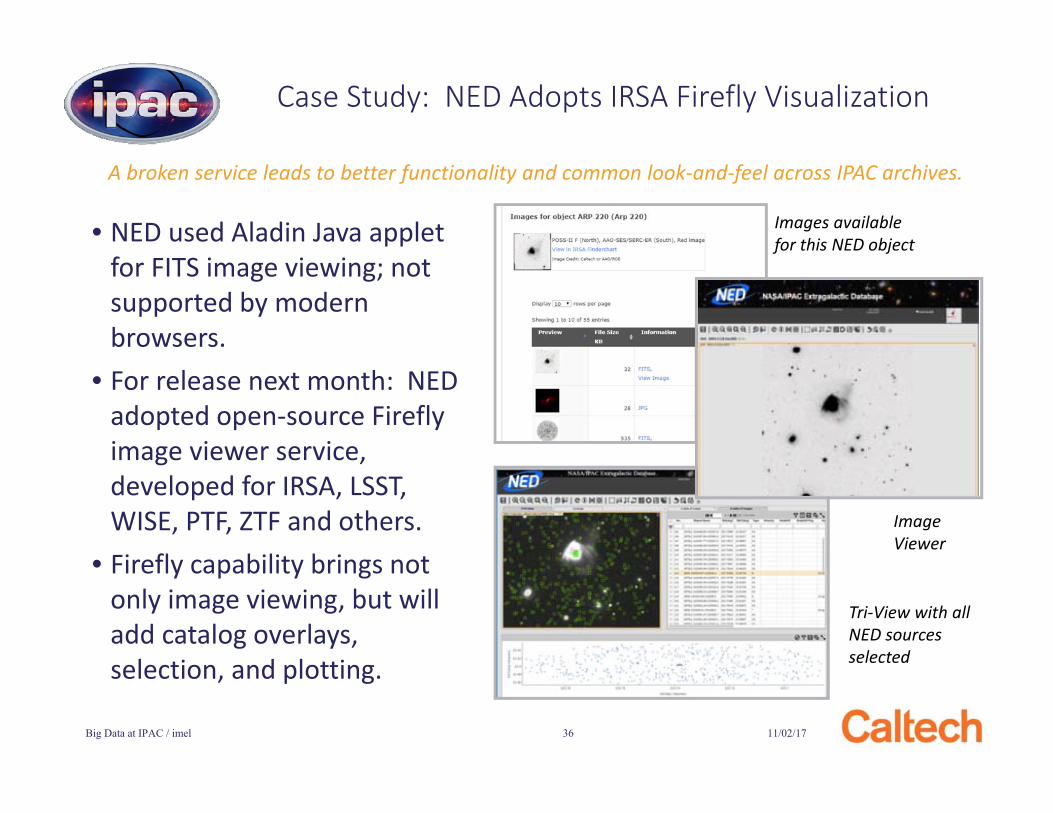
• NED used Aladin Java applet for FITS image viewing; not supported by modern browsers.
• For release next month: NED adopted open-source Firefly image viewer service, developed for IRSA, LSST, WISE, PTF, ZTF and others.
• Firefly capability brings not only image viewing, but will add catalog overlays, selection, and plotting.
A broken service leads to better functionality and common look-and-feel across IPAC archives.
11/02/17Big Data at IPAC / imel 36
Case Study: NED Adopts IRSA Firefly Visualization
Images available for this NED object
Image Viewer
Tri-View with all NED sources selected
Big Data at IPAC:Opportunities and Challenges
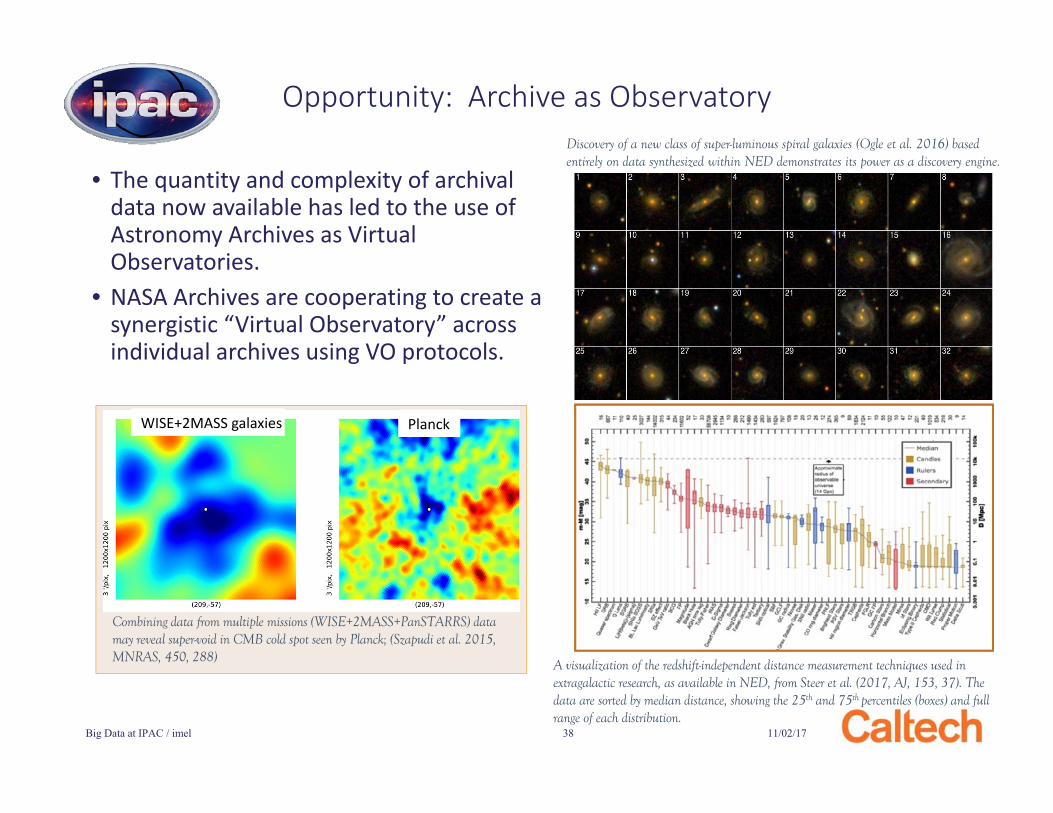
• The quantity and complexity of archival data now available has led to the use of Astronomy Archives as Virtual Observatories.
• NASA Archives are cooperating to create a synergistic “Virtual Observatory” across individual archives using VO protocols.
11/02/17Big Data at IPAC / imel 38
Opportunity: Archive as Observatory
A visualization of the redshift-independent distance measurement techniques used in extragalactic research, as available in NED, from Steer et al. (2017, AJ, 153, 37). The data are sorted by median distance, showing the 25th and 75th percentiles (boxes) and full range of each distribution.
Discovery of a new class of super-luminous spiral galaxies (Ogle et al. 2016) based entirely on data synthesized within NED demonstrates its power as a discovery engine.
Combining data from multiple missions (WISE+2MASS+PanSTARRS) data may reveal super-void in CMB cold spot seen by Planck; (Szapudi et al. 2015, MNRAS, 450, 288)
WISE+2MASS galaxies Planck
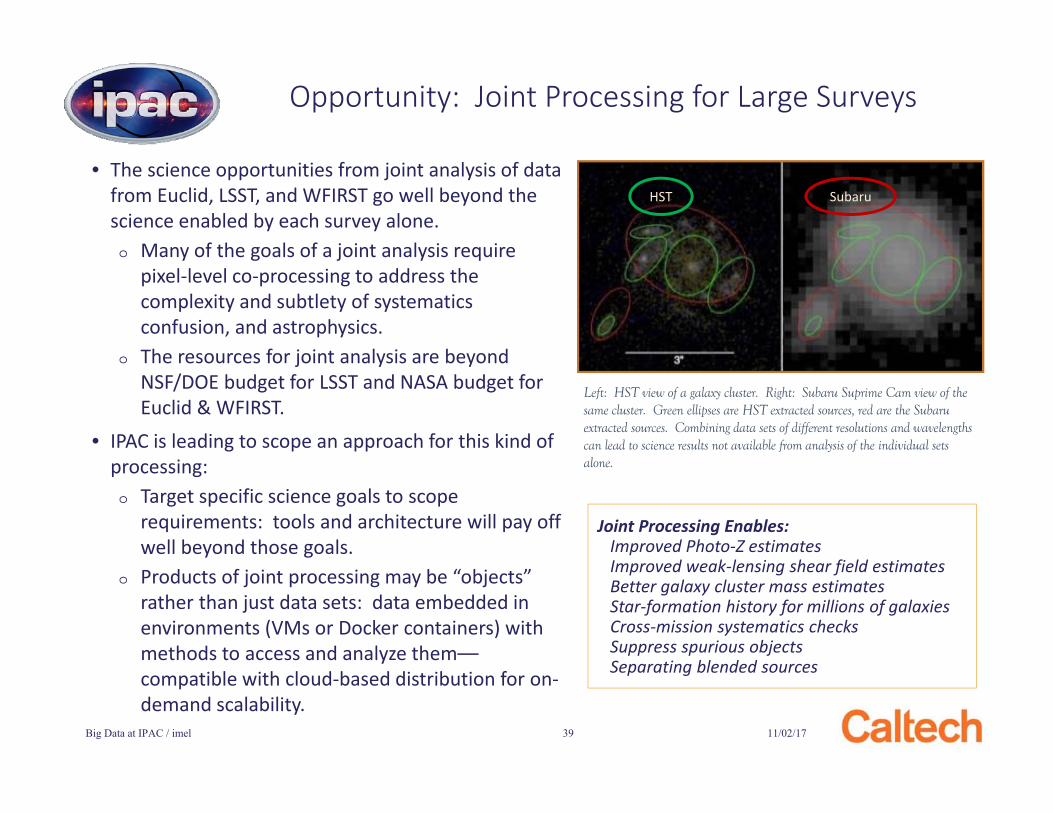
• The science opportunities from joint analysis of data from Euclid, LSST, and WFIRST go well beyond the science enabled by each survey alone.o Many of the goals of a joint analysis require
pixel-level co-processing to address the complexity and subtlety of systematics confusion, and astrophysics.
o The resources for joint analysis are beyond NSF/DOE budget for LSST and NASA budget for Euclid & WFIRST.
• IPAC is leading to scope an approach for this kind of processing:o Target specific science goals to scope
requirements: tools and architecture will pay off well beyond those goals.
o Products of joint processing may be “objects” rather than just data sets: data embedded in environments (VMs or Docker containers) with methods to access and analyze them––compatible with cloud-based distribution for on-demand scalability.
11/02/17Big Data at IPAC / imel 39
Opportunity: Joint Processing for Large Surveys
Joint Processing Enables:Improved Photo-Z estimatesImproved weak-lensing shear field estimatesBetter galaxy cluster mass estimatesStar-formation history for millions of galaxiesCross-mission systematics checksSuppress spurious objectsSeparating blended sources
Left: HST view of a galaxy cluster. Right: Subaru Suprime Cam view of the same cluster. Green ellipses are HST extracted sources, red are the Subaru extracted sources. Combining data sets of different resolutions and wavelengths can lead to science results not available from analysis of the individual sets alone.
HST Subaru
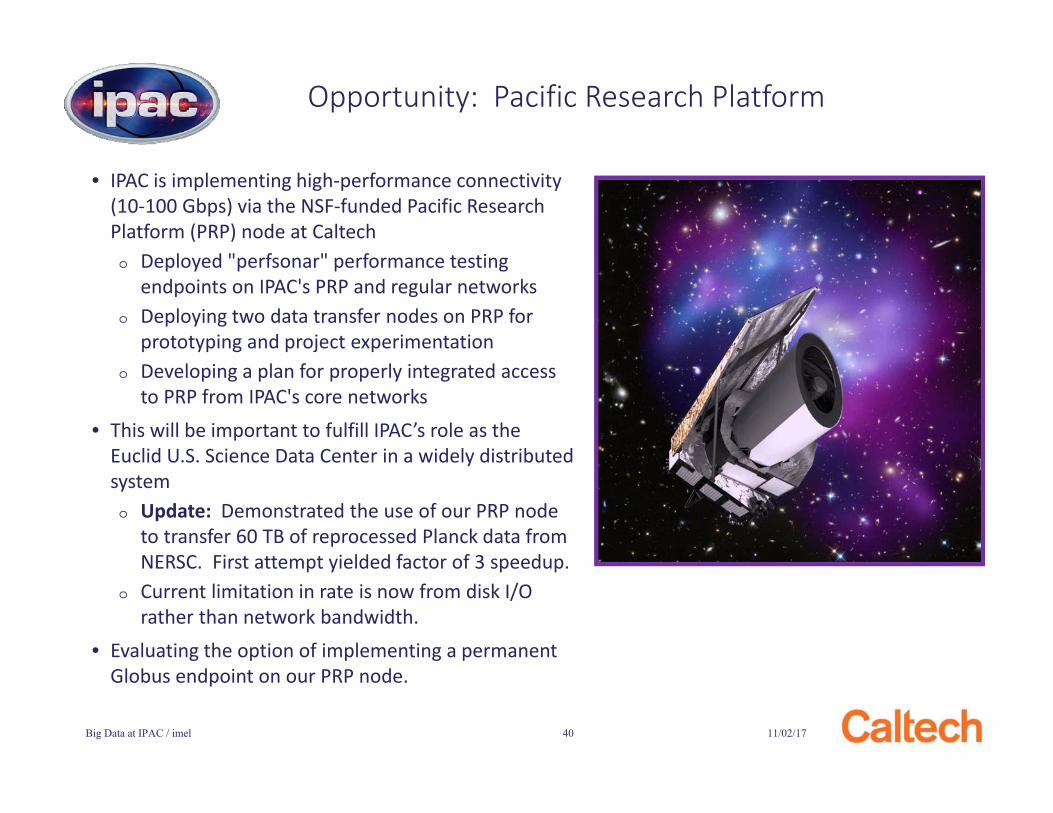
• IPAC is implementing high-performance connectivity (10-100 Gbps) via the NSF-funded Pacific Research Platform (PRP) node at Caltecho Deployed "perfsonar" performance testing
endpoints on IPAC's PRP and regular networkso Deploying two data transfer nodes on PRP for
prototyping and project experimentationo Developing a plan for properly integrated access
to PRP from IPAC's core networks• This will be important to fulfill IPAC’s role as the
Euclid U.S. Science Data Center in a widely distributed systemo Update: Demonstrated the use of our PRP node
to transfer 60 TB of reprocessed Planck data from NERSC. First attempt yielded factor of 3 speedup.
o Current limitation in rate is now from disk I/O rather than network bandwidth.
• Evaluating the option of implementing a permanent Globus endpoint on our PRP node.
11/02/17Big Data at IPAC / imel 40
Opportunity: Pacific Research Platform
11/02/17Big Data at IPAC / imel 41
Opportunity: Open Science Grid
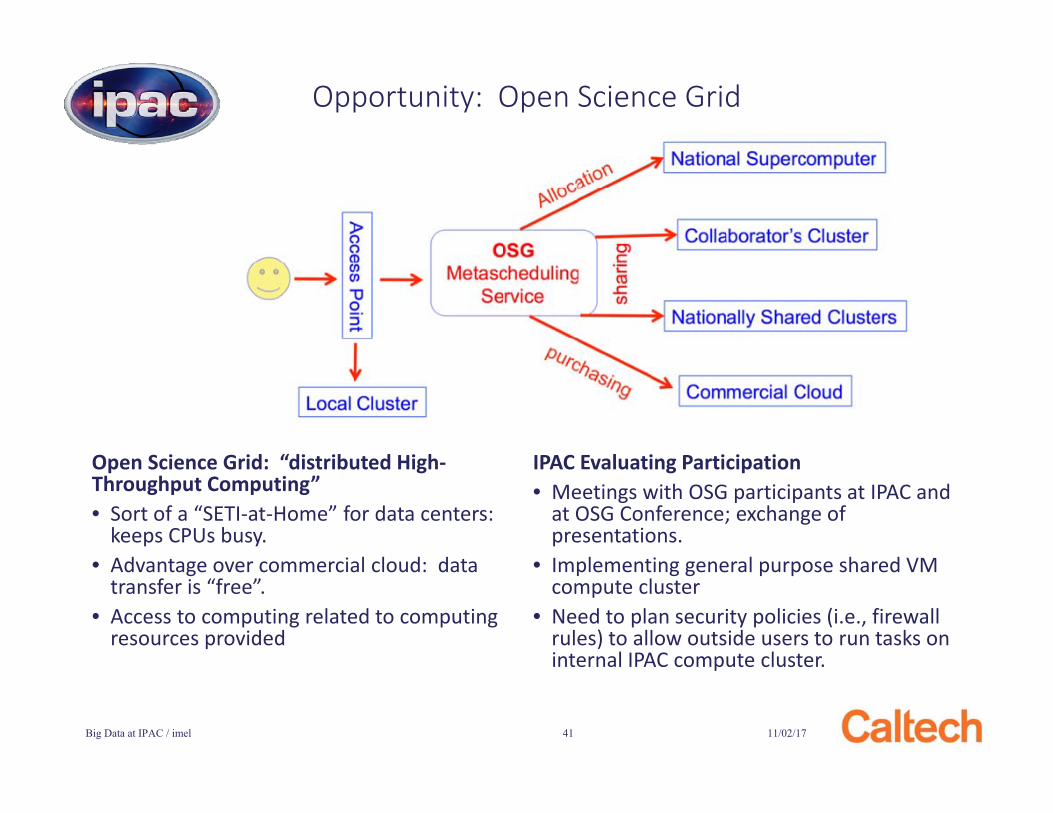
Open Science Grid: “distributed High-Throughput Computing”• Sort of a “SETI-at-Home” for data centers:
keeps CPUs busy.• Advantage over commercial cloud: data
transfer is “free”.• Access to computing related to computing
resources provided
IPAC Evaluating Participation• Meetings with OSG participants at IPAC and
at OSG Conference; exchange of presentations.
• Implementing general purpose shared VM compute cluster
• Need to plan security policies (i.e., firewall rules) to allow outside users to run tasks on internal IPAC compute cluster.
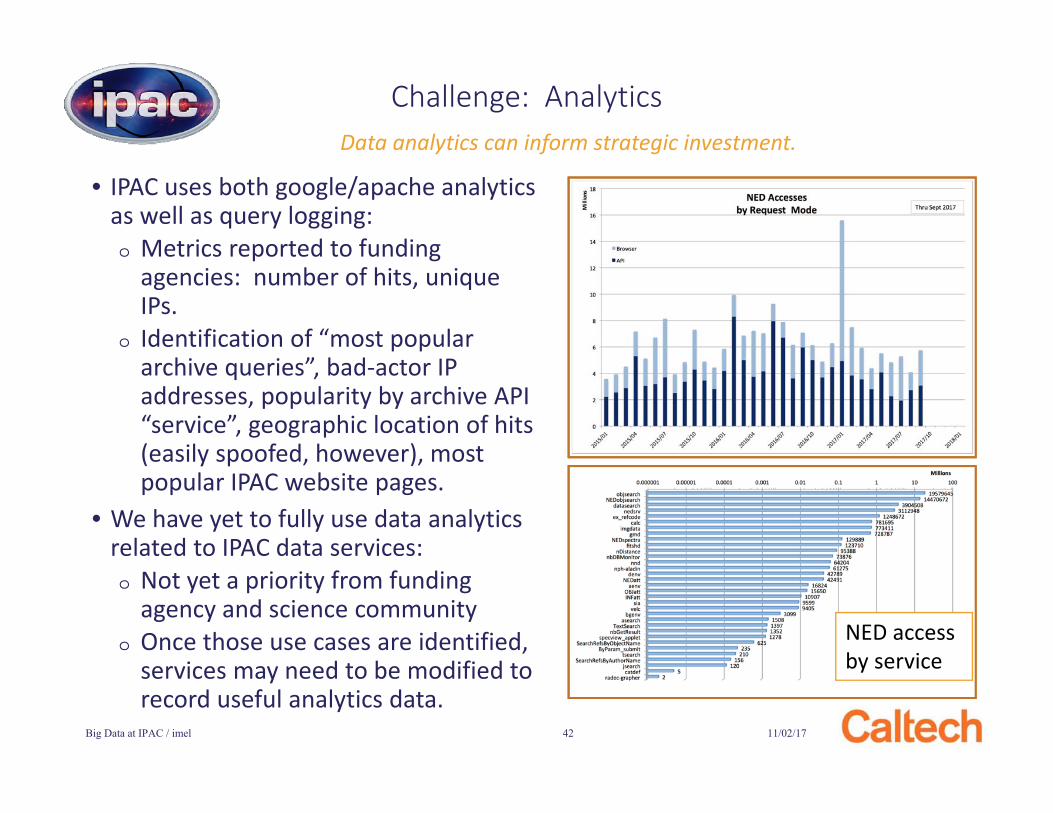
• IPAC uses both google/apache analytics as well as query logging:o Metrics reported to funding
agencies: number of hits, unique IPs.
o Identification of “most popular archive queries”, bad-actor IP addresses, popularity by archive API “service”, geographic location of hits (easily spoofed, however), most popular IPAC website pages.
• We have yet to fully use data analytics related to IPAC data services:o Not yet a priority from funding
agency and science community o Once those use cases are identified,
services may need to be modified to record useful analytics data.
11/02/17Big Data at IPAC / imel 42
Challenge: Analytics
NED access by service
Data analytics can inform strategic investment.
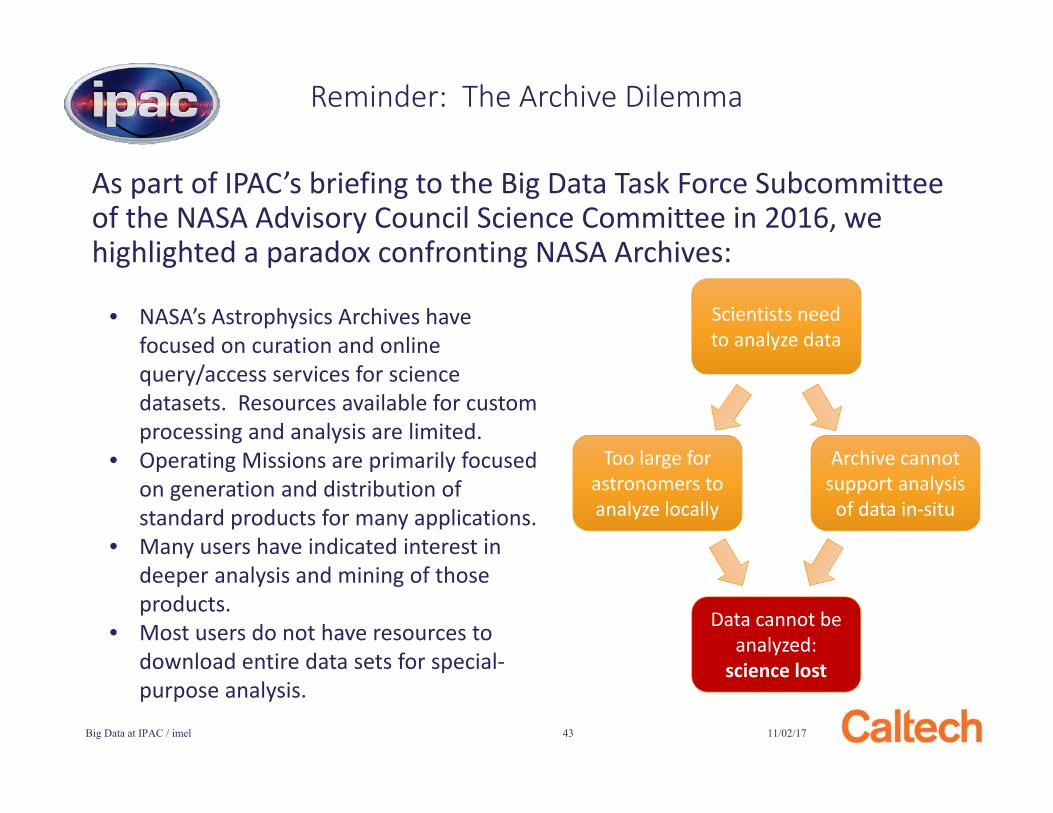
As part of IPAC’s briefing to the Big Data Task Force Subcommittee of the NASA Advisory Council Science Committee in 2016, we highlighted a paradox confronting NASA Archives:
Reminder: The Archive Dilemma
11/02/17Big Data at IPAC / imel 43
• NASA’s Astrophysics Archives have focused on curation and online query/access services for science datasets. Resources available for custom processing and analysis are limited.
• Operating Missions are primarily focused on generation and distribution of standard products for many applications.
• Many users have indicated interest in deeper analysis and mining of those products.
• Most users do not have resources to download entire data sets for special-purpose analysis.
Scientists need to analyze data
Archive cannot support analysis
of data in-situ
Too large for astronomers to analyze locally
Data cannot be analyzed:
science lost
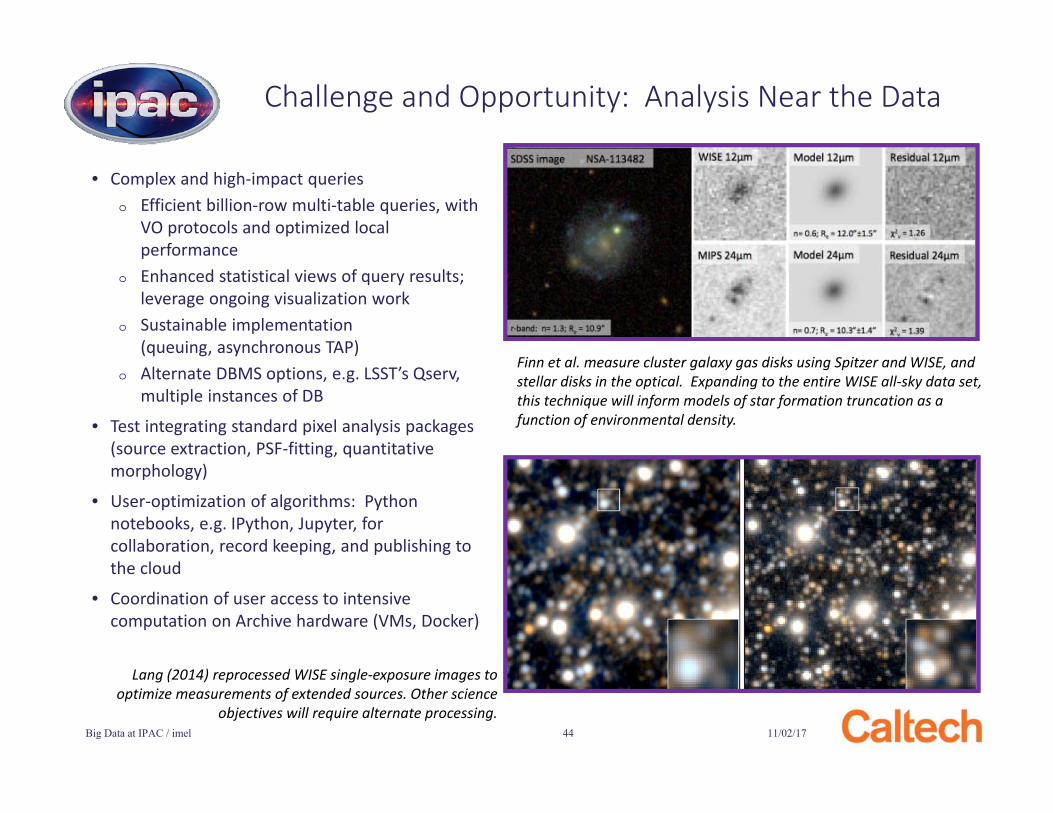
• Complex and high-impact querieso Efficient billion-row multi-table queries, with
VO protocols and optimized local performance
o Enhanced statistical views of query results; leverage ongoing visualization work
o Sustainable implementation (queuing, asynchronous TAP)
o Alternate DBMS options, e.g. LSST’s Qserv, multiple instances of DB
• Test integrating standard pixel analysis packages (source extraction, PSF-fitting, quantitative morphology)
• User-optimization of algorithms: Python notebooks, e.g. IPython, Jupyter, for collaboration, record keeping, and publishing to the cloud
• Coordination of user access to intensive computation on Archive hardware (VMs, Docker)
11/02/17Big Data at IPAC / imel 44
Challenge and Opportunity: Analysis Near the Data
Finn et al. measure cluster galaxy gas disks using Spitzer and WISE, and stellar disks in the optical. Expanding to the entire WISE all-sky data set, this technique will inform models of star formation truncation as a function of environmental density.
Lang (2014) reprocessed WISE single-exposure images to optimize measurements of extended sources. Other science
objectives will require alternate processing.
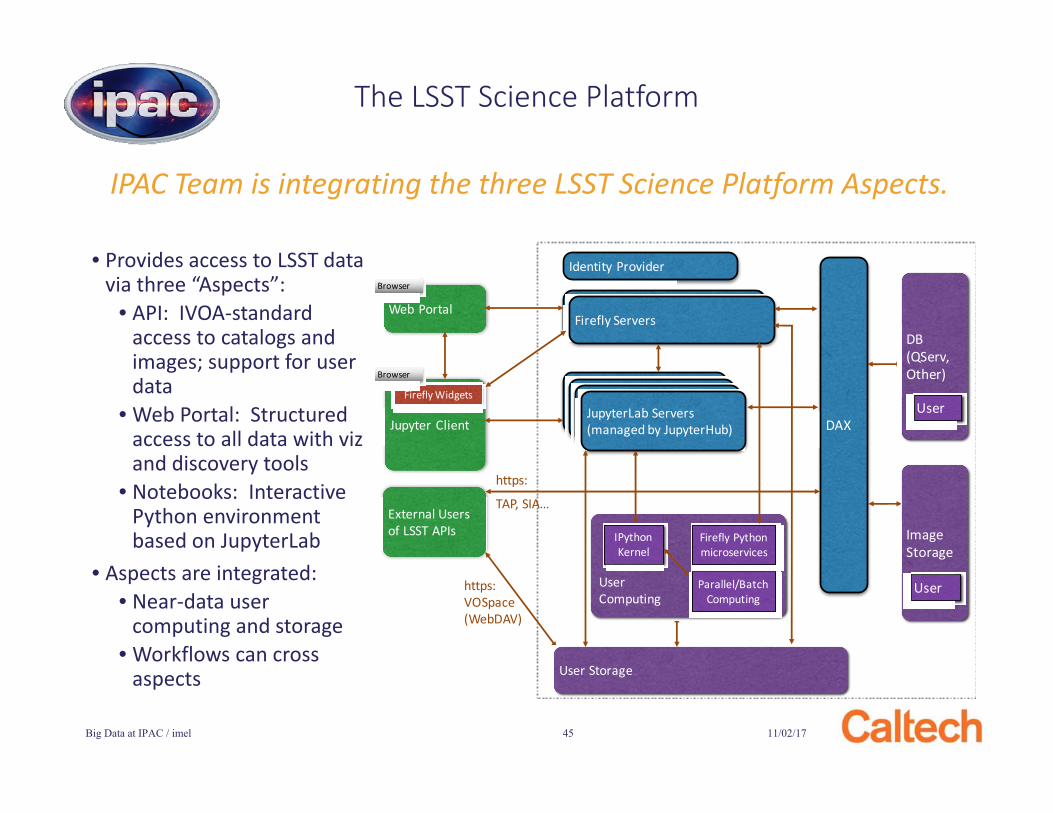
IPAC Team is integrating the three LSST Science Platform Aspects.
11/02/17Big Data at IPAC / imel 45
The LSST Science Platform
Firefly Servers
JupyterLab Servers (managed by JupyterHub) DAX
Web Portal
Jupyter Client
External Users of LSST APIs
Firefly Widgets
Browser
Browser
https:
TAP, SIA…
User Storage
DB(QServ, Other)
User
ImageStorage
User
Identity Provider
IPythonKernel
Firefly Python microservices
Parallel/Batch Computing
User Computing
https:VOSpace(WebDAV)
• Provides access to LSST data via three “Aspects”:
• API: IVOA-standard access to catalogs and images; support for user data
• Web Portal: Structured access to all data with vizand discovery tools
• Notebooks: Interactive Python environment based on JupyterLab
• Aspects are integrated:• Near-data user
computing and storage• Workflows can cross
aspects
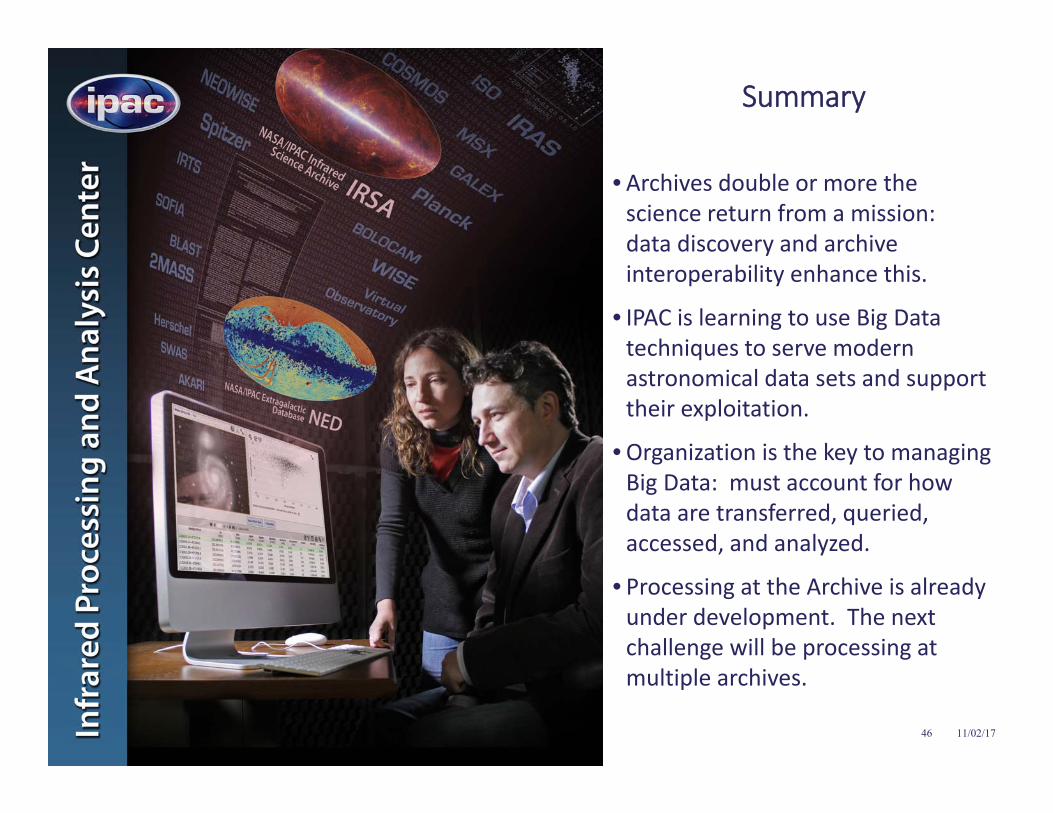
• Archives double or more the science return from a mission: data discovery and archive interoperability enhance this.
• IPAC is learning to use Big Data techniques to serve modern astronomical data sets and support their exploitation.
• Organization is the key to managing Big Data: must account for how data are transferred, queried, accessed, and analyzed.
• Processing at the Archive is already under development. The next challenge will be processing at multiple archives.
11/02/17Big Data at IPAC / imel 46
Summary
The following* directly contributed to this update:
• George Helou, IPAC Executive Director
• IRSA: Steve Groom, Harry Teplitz, Vandana Desai, Justin Howell, Luisa Rebull, and the IRSA team.
• NED: Joe Mazzarella, Rick Ebert, Jeff Jacobson, and the NED team.
• Exoplanet Archive: Rachel Akeson, David Ciardi, and the Exoplanet Archive team
• ZTF: Frank Masci, Ben Rusholme, and the ZTF team.
• Montage: Bruce Berriman and John Good
• Firefly: Trey Roby, Loi Ly
• LSST: Xiuqin Wu, Gregory Dubois-Felsmann
• Science Research: Yossi Shvarzvald, Davy Kirkpatrick, Peter Capak, Dan Masters
• Spitzer: Sean Carey, Jim Ingalls, and the Spitzer Science Center Team
• NEOCAM: Roc Cutri, Carrie Nugent
• ICE: Gordon Squires, Janice Lee, Robert Hurt, Tim Pyle, Jake Llamas, and the ICE Team
• IPAC Systems Engineering: Dave Flynn and the ISG SysEng Team
This update describes the work of scores of scientists, developers, and engineers.
11/02/17Big Data at IPAC / imel 47
Acknowledgements
*Many IPAC staff work on multiple activities. All are named only once here.