ip-probe users' manual
TRANSCRIPT

VB20 IP-Probe
Users' Manual
Sw version 4.9-xx
Form number 7652F
The current manual is always found in the log-in area of the www.bridgetech.tv site.
Refer to section 1.2 of this manual for more information.
VB20 IP-PROBE USERS' MANUAL VERSION 4.92011 © BRIDGE Technologies Co AS - Bentsebrugata 20 - N-0476 Oslo, Norway - tel: +47 22 38 51 00 - www.bridgetech.tv


Table of Contents1 INTRODUCTION.......................................................................................................................61.1 About the VB20 IP-Probe......................................................................................................6
1.1.1 VB20 - Overview...........................................................................................................61.1.2 VB20 - Functionality......................................................................................................7
1.2 How to Use This Manual.......................................................................................................82 PRINCIPLE OF OPERATION....................................................................................................93 SAFETY...................................................................................................................................114 INSTALLATION AND INITIAL SETUP......................................................................................124.1 Quick Start-Up Guide..........................................................................................................124.2 The VB20 Hardware...........................................................................................................124.3 Powering up the Unit...........................................................................................................134.4 Initial Configuration.............................................................................................................13
4.4.1 Initial Configuration Using the Pre-Set IP-Address......................................................134.4.2 Initial Configuration Via Serial Console Emulated Over USB.......................................144.4.3 Verifying Correct Initial Setup of the VB20 IP-Probe....................................................174.4.4 Initial Setup Troubleshooting.......................................................................................18
5 QUICK SETUP GUIDE............................................................................................................195.1 Basic Setup: All Interfaces..................................................................................................195.2 Input Signal Definitions.......................................................................................................19
5.2.1 ASI Input (for ETR 290 Option Only)...........................................................................195.2.2 Ethernet Input..............................................................................................................19
5.3 Monitoring: All Interfaces.....................................................................................................205.4 Adjusting Alarm Thresholds: All Interfaces..........................................................................20
6 THE VB20 GRAPHICAL USER INTERFACE...........................................................................216.1 Main....................................................................................................................................22
6.1.1 Main - Summary..........................................................................................................226.2 Alarms.................................................................................................................................26
6.2.1 Alarms - All alarms.......................................................................................................276.2.2 Alarms - Alarm setup...................................................................................................28
6.3 Compare (ETR 290 Option)................................................................................................326.4 Mon.....................................................................................................................................37
6.4.1 Mon - Parameters........................................................................................................376.4.2 Mon - Setup..................................................................................................................49
6.5 MW.....................................................................................................................................496.6 RDP....................................................................................................................................526.7 Ethernet..............................................................................................................................58
6.7.1 Ethernet - Traffic..........................................................................................................586.7.2 Ethernet - Summary....................................................................................................606.7.3 Ethernet - History........................................................................................................616.7.4 Ethernet - Detect.........................................................................................................636.7.5 Ethernet - IGMP..........................................................................................................646.7.6 Ethernet - Join.............................................................................................................656.7.7 Ethernet - Multicasts....................................................................................................666.7.8 Ethernet - Ethernet thresh...........................................................................................70
6.8 ETR 290 (ETR 290 Option).................................................................................................726.8.1 ETR 290 - ETR Overview............................................................................................72
VB20 IP-PROBE USERS' MANUAL VERSION 4.92011 © BRIDGE Technologies Co AS - Bentsebrugata 20 - N-0476 Oslo, Norway - tel: +47 22 38 51 00 - www.bridgetech.tv
4

6.8.2 ETR 290 - ETR Details................................................................................................736.8.3 ETR 290 - Services.....................................................................................................766.8.4 ETR 290 - Bitrates.......................................................................................................806.8.5 ETR 290 - Tables.........................................................................................................816.8.6 ETR 290 - PID list........................................................................................................826.8.7 ETR 290 - PCR...........................................................................................................846.8.8 ETR 290 - Status.........................................................................................................856.8.9 ETR 290 - ETR thresh.................................................................................................866.8.10 ETR 290 - PID thresh................................................................................................976.8.11 ETR 290 - Service thresh..........................................................................................99
6.9 ASI.....................................................................................................................................1016.9.1 ASI Status.................................................................................................................1016.9.2 ASI - Setup................................................................................................................103
6.10 FSM................................................................................................................................1046.10.1 FSM - Monitor..........................................................................................................1046.10.2 FSM - Setup............................................................................................................105
6.11 Setup...............................................................................................................................1076.11.1 Setup - Params........................................................................................................1076.11.2 Setup - Pages..........................................................................................................1096.11.3 Setup - Time............................................................................................................1106.11.4 Setup - Ethernet.......................................................................................................1106.11.5 Setup - VBC.............................................................................................................1156.11.6 Setup - Login...........................................................................................................1166.11.7 Setup - ETR.............................................................................................................1176.11.8 Setup - VBC thresh..................................................................................................1206.11.9 Setup - Scheduling..................................................................................................1226.11.10 Setup - Security.....................................................................................................123
6.12 Data................................................................................................................................1246.12.1 Data - Configuration................................................................................................1246.12.2 Data - Software.......................................................................................................1256.12.3 Data - Table Descriptors..........................................................................................1266.12.4 Data - Eii.................................................................................................................1266.12.5 Data - BOOT...........................................................................................................127
6.13 About...............................................................................................................................1286.13.1 About - Release info................................................................................................1286.13.2 About - License........................................................................................................1286.13.3 About - Technologies...............................................................................................129
I Appendix: VB20 Versus VideoBridge Controller - Alarms......................................................130II Appendix: Monitoring Practices............................................................................................131III Appendix: Software Upload.................................................................................................137
VB20 IP-PROBE USERS' MANUAL VERSION 4.92011 © BRIDGE Technologies Co AS - Bentsebrugata 20 - N-0476 Oslo, Norway - tel: +47 22 38 51 00 - www.bridgetech.tv
5
1 INTRODUCTION
1.1 About the VB20 IP-Probe
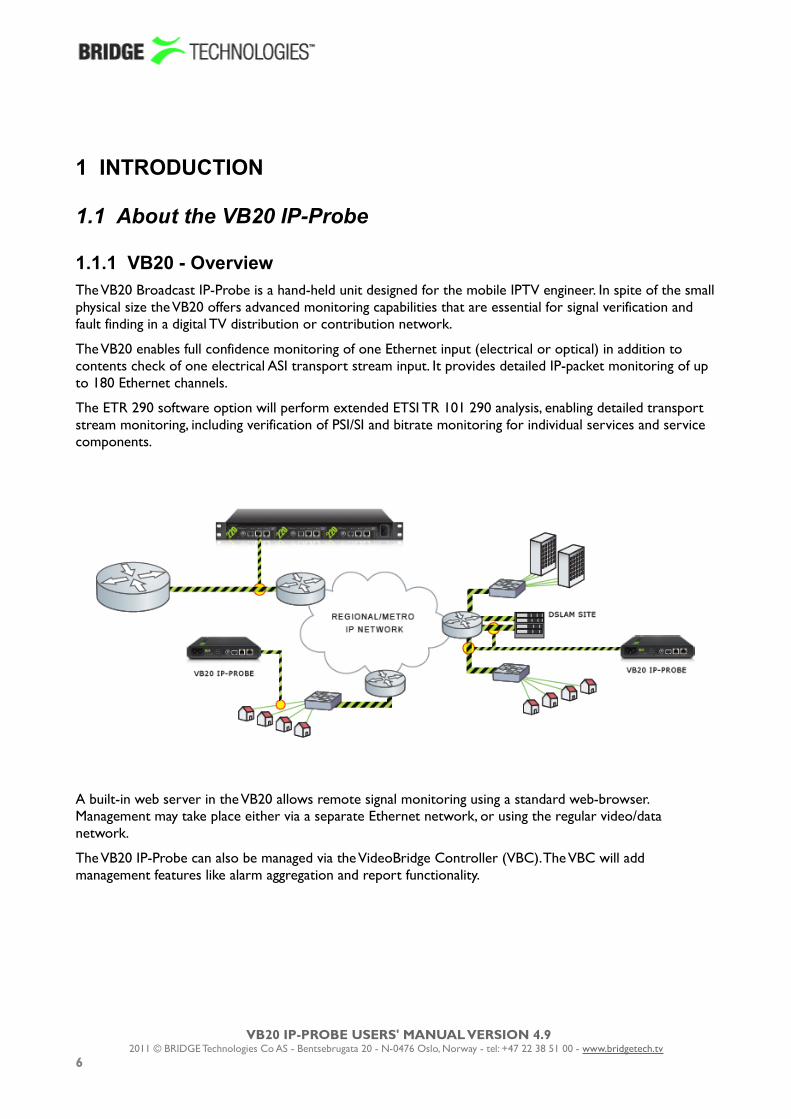
1.1.1 VB20 - OverviewThe VB20 Broadcast IP-Probe is a hand-held unit designed for the mobile IPTV engineer. In spite of the small physical size the VB20 offers advanced monitoring capabilities that are essential for signal verification and fault finding in a digital TV distribution or contribution network.
The VB20 enables full confidence monitoring of one Ethernet input (electrical or optical) in addition to contents check of one electrical ASI transport stream input. It provides detailed IP-packet monitoring of up to 180 Ethernet channels.
The ETR 290 software option will perform extended ETSI TR 101 290 analysis, enabling detailed transport stream monitoring, including verification of PSI/SI and bitrate monitoring for individual services and service components.
A built-in web server in the VB20 allows remote signal monitoring using a standard web-browser. Management may take place either via a separate Ethernet network, or using the regular video/data network.
The VB20 IP-Probe can also be managed via the VideoBridge Controller (VBC). The VBC will add management features like alarm aggregation and report functionality.
VB20 IP-PROBE USERS' MANUAL VERSION 4.92011 © BRIDGE Technologies Co AS - Bentsebrugata 20 - N-0476 Oslo, Norway - tel: +47 22 38 51 00 - www.bridgetech.tv
6
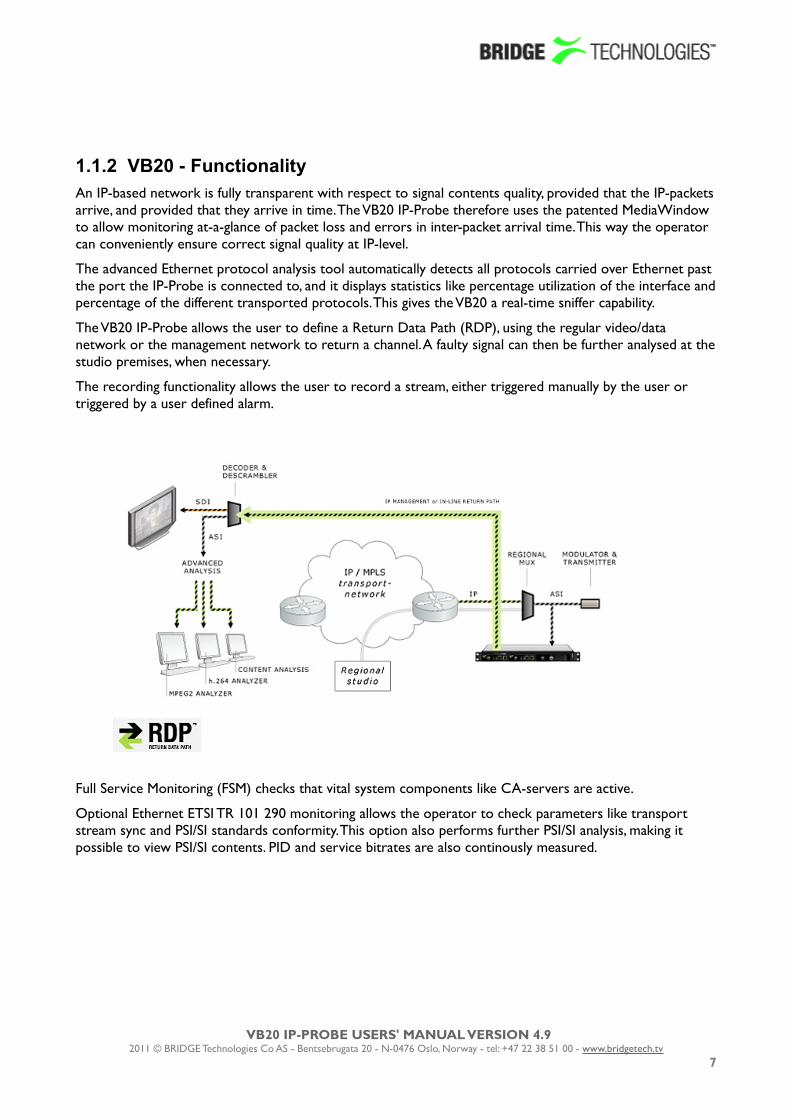
1.1.2 VB20 - FunctionalityAn IP-based network is fully transparent with respect to signal contents quality, provided that the IP-packets arrive, and provided that they arrive in time. The VB20 IP-Probe therefore uses the patented MediaWindow to allow monitoring at-a-glance of packet loss and errors in inter-packet arrival time. This way the operator can conveniently ensure correct signal quality at IP-level.
The advanced Ethernet protocol analysis tool automatically detects all protocols carried over Ethernet past the port the IP-Probe is connected to, and it displays statistics like percentage utilization of the interface and percentage of the different transported protocols. This gives the VB20 a real-time sniffer capability.
The VB20 IP-Probe allows the user to define a Return Data Path (RDP), using the regular video/data network or the management network to return a channel. A faulty signal can then be further analysed at the studio premises, when necessary.
The recording functionality allows the user to record a stream, either triggered manually by the user or triggered by a user defined alarm.
Full Service Monitoring (FSM) checks that vital system components like CA-servers are active.
Optional Ethernet ETSI TR 101 290 monitoring allows the operator to check parameters like transport stream sync and PSI/SI standards conformity. This option also performs further PSI/SI analysis, making it possible to view PSI/SI contents. PID and service bitrates are also continously measured.
VB20 IP-PROBE USERS' MANUAL VERSION 4.92011 © BRIDGE Technologies Co AS - Bentsebrugata 20 - N-0476 Oslo, Norway - tel: +47 22 38 51 00 - www.bridgetech.tv
7

1.2 How to Use This ManualThis users' manual is valid for software versions 4.9-xx of the VB20 IP-Probe.
Throughout this manual the term channel is often used rather than unicast or multicast. One channel may consist of one or more services, and refers to one IP-address (for Ethernet input) or one ASI transport stream input.
Chapter 3 lists safety precautions, and this chapter should be read prior to using the equipment.
Chapter 4 explains how to perform the necessary initial configuration of the VB20 management IP address.
Chapter 5 contains a quick setup guide; a step-by step description of how to setup a probe once the initial setup has been performed.
Chapter 6 describes the graphical user interface (GUI) as seen when pointing a web browser to the probe's IP-address.
Appendix I describes the alarm handling in the VB20 versus the VideoBridge Controller (VBC).
Appendix II describes some useful Ethernet monitoring practices.
Appendix III explains the VB20 software upload procedure.
Note that current versions of the users' manual can be found on the http://www.bridgetech.tv website. Log-in as end user: customer with password: xmas4u . Additional technical documentation is also found at the same location.
VB20 IP-PROBE USERS' MANUAL VERSION 4.92011 © BRIDGE Technologies Co AS - Bentsebrugata 20 - N-0476 Oslo, Norway - tel: +47 22 38 51 00 - www.bridgetech.tv
8

2 PRINCIPLE OF OPERATIONThe VB20 is equipped with two Ethernet ports and an SFP optical port. The user selects which transport stream signal input to be used by the monitoring engine, either the Ethernet video/data port or the SFP optical input. If connected the ASI input signal is always analysed. Management of the VB20 is conducted via the Ethernet management port or alternatively in-band via the Ethernet video/data port.
Figure 1: The VB20
VB20 IP-PROBE USERS' MANUAL VERSION 4.92011 © BRIDGE Technologies Co AS - Bentsebrugata 20 - N-0476 Oslo, Norway - tel: +47 22 38 51 00 - www.bridgetech.tv
9

A simplified diagram of the alarm handling mechanisms of the VB20 is shown in figure 2. The input signals are continuously analysed, and measured data are checked against user defined threshold values. If the data do not comply with the threshold values alarms will be generated. The overall alarm settings further make it possible to enable and disable alarms, thus defining which alarms should be reported in the VB20 alarm list and sent as SNMP traps to an external management system.
Figure 2: Simplified Diagram of the Alarm Handling in the VB20
VB20 IP-PROBE USERS' MANUAL VERSION 4.92011 © BRIDGE Technologies Co AS - Bentsebrugata 20 - N-0476 Oslo, Norway - tel: +47 22 38 51 00 - www.bridgetech.tv
10

3 SAFETYBlank faceplates and cover panels serve two important functions: they prevent exposure to hazardous voltages and currents inside the chassis and they provide electromagnetic interference shielding. Do not operate the VB20 unless all faceplates, front covers and rear covers are in place.
Only trained and qualified personnel should be allowed to service this equipment.
This equipment must be maintained by service personnel as defined by AS/NZS 3260. Incorrectly connecting this equipment to a general-purpose outlet could be hazardous.
Ultimate disposal of this product should be handled according to all national laws and regulations.
To prevent the system from overheating, do not operate it in an area that exceeds the maximum ambient temperature of 45 degrees Celsius.
Do not work on the system or connect or disconnect cables during periods of lightning activity.
The VB20 requires short-circuit (overcurrent) protection. Ensure that the protective device is rated not greater than 120 VAC, 15 A; 240 VAC, 10 A; 60 VDC 20 A.
VB20 IP-PROBE USERS' MANUAL VERSION 4.92011 © BRIDGE Technologies Co AS - Bentsebrugata 20 - N-0476 Oslo, Norway - tel: +47 22 38 51 00 - www.bridgetech.tv
11

4 INSTALLATION AND INITIAL SETUP
4.1 Quick Start-Up Guide1. Read the safety instructions, refer to chapter 32. Connect the signal cables, refer to section 4.23. Power up the unit, refer to section 4.34. Perform initial set-up of IP-addresses, refer to section 4.45. Verify that the GUI launches correctly, refer to section 4.4.3
4.2 The VB20 Hardware
The VB20 consists of a custom-made ruggedised chassis that allows fanless convection-cooled operation. A 100-240VAC power supply is built-in. The maximum power dissipation is 13W.
The VB20 is equipped with the following signal connectors at the front of the unit:
ASI INPUT: ASI transport stream input – 75 ohm BNC female
USB: USB serial port emulator for initial set-up of the probe – Type A
T10/100/1000:(Video – eth0)
For monitoring a 10/100/1000 electrical/copper signal – RJ-45.The probe can only monitor either the SFP input signal OR the T10/100/1000 input signal (selected from software).
SFP: Alternative SFP input used when connecting to optical networks
MANAGEMENT:(Management –
eth2)
For optionally running management of the probe on a separate network – RJ-45. This interface supports T10/100.
VB20 IP-PROBE USERS' MANUAL VERSION 4.92011 © BRIDGE Technologies Co AS - Bentsebrugata 20 - N-0476 Oslo, Norway - tel: +47 22 38 51 00 - www.bridgetech.tv
12

A number of LEDs serve the following purposes:
POWER: Green power LED
SFP LINK: Green LED indicating SFP link status
T10/100/1000: The green LED indicates link. The yellow LED indicates that the interface is receiving data (RX). Both LEDs are off if input is taken from the SFP module.
MANAGEMENT: The green LED indicates link. If the yellow LED is active the speed is 100Mbps – otherwise the speed is 10Mbps.
4.3 Powering up the UnitThe VB20 can be powered up by connecting the power cable to a mains source. When the power cable is connected the power LED should light up.
4.4 Initial ConfigurationThere are two alternative ways of performing an initial configuration of the VB20:
1. By using the preconfigured IP-address of the VB20 management port (eth2)
2. Via serial console emulated over USB
For most users the first method will be the easiest.
4.4.1 Initial Configuration Using the Pre-Set IP-AddressThe VB20 is shipped with the following factory settings:
Management (eth2) IP address: 10.0.20.101
Management (eth2) subnet mask: 255.255.0.0
In order to connect to the eth2 management port the PC used for setup should have corresponding network settings.
For Windows XP the network parameters are set in the Control Panel - Network Connections - Local Connections - Properties - Internet Protocol (TCP/IP) view. Select the user defined address, and set the PC's IP-address to 10.0.20.100 and the netmask to 255.255.0.0.
VB20 IP-PROBE USERS' MANUAL VERSION 4.92011 © BRIDGE Technologies Co AS - Bentsebrugata 20 - N-0476 Oslo, Norway - tel: +47 22 38 51 00 - www.bridgetech.tv
13

When the IP-address of the PC has been set to match the VB20 factory setting, the permanent network settings can be configured through the VB20 web browser interface. Refer to sections 4.6.3 and 6.15.3 for details on how to launch the VB20 graphical user interface and how to set the network parameters.
4.4.2 Initial Configuration Via Serial Console Emulated Over USBIf the VB20 for some reason cannot be reached through Ethernet communication, the initial set-up may be performed via serial console emulated over USB. This is done by:
1. Installing a driver for the USB communication, if not already supported by the operating system
2. Setting the management IP-address
1. Installing a Driver for the USB Communication
The VB20 module uses a serial port emulator chip called FT232. Newer operating systems will support the driver for this chip, but users of older operating systems may have to download and install it. The driver may be downloaded directly from the chip manufacturer at http://www.ftdichip.com . Select first Drivers, then VCP followed by the operating system (VCP is short for Virtual COM Port).
For Windows XP installation of the driver do the following:
1. Temporarily disconnect the internet connection of the PC.2. Connect the supplied USB cable between the probe and a USB port on the PC.3. When asked to connect to Windows Update, select “No not this time”.4. Select "Install from a list or specific location (Advanced)".5. Select “Search for the best driver in these locations” and specify a file path.6. If a warning appears, stating that the driver has not passed Windows Logo testing, select “Continue
anyway”.7. When asked to connect to Windows Update, select “No not this time”.8. Select "Install from a list or specific location (Advanced)".9. Select "Search for the best driver in these locations" and enter the file path.10. If a warning appears, stating that the driver has not passed Windows Logo testing, select “Continue
anyway”.11. Open the Device Manager (located in "Control Panel\System" then select the "Hardware" tab and
click "Device Manager"), open "Ports" - the probe appears as a new COM port with the label "USB Serial Port". Note the port number of this new COM port (e.g. COM3).
For operating systems other than Windows XP a similar driver installation procedure may have to be performed. Refer to the documents part of the http://www.ftdichip.com site for instructions.
VB20 IP-PROBE USERS' MANUAL VERSION 4.92011 © BRIDGE Technologies Co AS - Bentsebrugata 20 - N-0476 Oslo, Norway - tel: +47 22 38 51 00 - www.bridgetech.tv
14

2. Setting the Management IP-Address
1. Connecting the USB cableIf it is not already connected, connect the USB cable between the USB port on the probe and a USB port on the PC.
2. Starting a terminal program on the PCStart a terminal program. Window XP users can use Hyperterm, Linux users can use minicom and Windows Vista users can download from http://en.poderosa.org . Select the new COM port that should appear as the USB cable is plugged in (Linux users should check /var/log/messages to see what device to use).
The following serial port parameters should be used:
• Baud rate: 9600• Data bits: 8• Parity: None• Stop bits: 1• Flow control: None
Press ENTER a few times to bring up the login prompt.
3. Logging inLog in using the user name admin and the password elvis.
4. Setting initial network parameters
A simple text based menu system should now be displayed:
VB20 IP-PROBE USERS' MANUAL VERSION 4.92011 © BRIDGE Technologies Co AS - Bentsebrugata 20 - N-0476 Oslo, Norway - tel: +47 22 38 51 00 - www.bridgetech.tv
15

To change a setting, press the appropriate character (A-P) then enter the new value and confirm by pressing <ENTER>.
The probe is equipped with two network interfaces called management (or eth2) and data/video (or eth0). It is necessary to configure at least one of these interfaces from the terminal and then do the rest of the setup from a web browser.
The probe supports both in-band management (i.e. using eth0 for both data/video and management) and separate management (i.e. using eth2 for management). In any case make sure that the subnets configured for eth0 and eth2 do not overlap – otherwise the probe will not work properly. Note that if IP-addresses for eth0 and eth2 are configured so that the subnets overlap, the IP-address of one of the ports will be automatically set to 1.1.1.1 by the probe.
To configure the management interface, edit values for I, J and O, alternatively use DHCP (H). Make sure Management (K) is enabled (set to true) – otherwise management via web will not be possible. The speed and duplex mode settings are also available here (L, M).
To configure the data/video interface instead, enter values for B, C, D and O.
5. Saving the parameters and rebootingWhen all the listed parameters have been configured, the probe must be rebooted to let the parameters take effect. This is achieved by clicking the “Q” key and confirming by clicking “t”.
VB20 IP-PROBE USERS' MANUAL VERSION 4.92011 © BRIDGE Technologies Co AS - Bentsebrugata 20 - N-0476 Oslo, Norway - tel: +47 22 38 51 00 - www.bridgetech.tv
16

4.4.3 Verifying Correct Initial Setup of the VB20 IP-ProbeOnce the probe network interfaces have been configured, all further configuration takes place through HTTP.
1. Launch a WEB-browser application on the management PC.
The following WEB-browsers are supported:
• Internet Explorer 7.0 or higher
• Firefox 2.0 or higher
2. Type the IP-address of the probe in the browser URL field and press <ENTER>.
The IP-address of the probe is that of the eth0 or eth2 port (the one used for management) as set in the initial set-up procedure.
The default management view should be displayed inside the browser. This could look similar to the screen shot shown below.
VB20 IP-PROBE USERS' MANUAL VERSION 4.92011 © BRIDGE Technologies Co AS - Bentsebrugata 20 - N-0476 Oslo, Norway - tel: +47 22 38 51 00 - www.bridgetech.tv
17
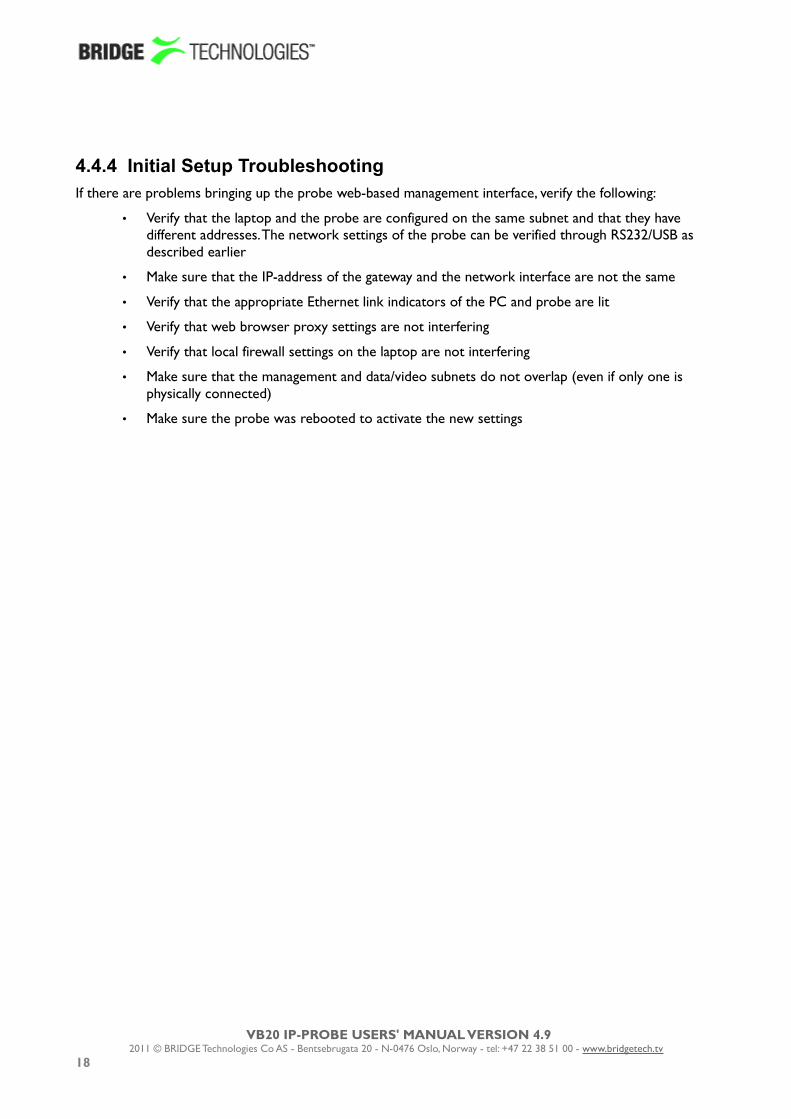
4.4.4 Initial Setup TroubleshootingIf there are problems bringing up the probe web-based management interface, verify the following:
• Verify that the laptop and the probe are configured on the same subnet and that they have different addresses. The network settings of the probe can be verified through RS232/USB as described earlier
• Make sure that the IP-address of the gateway and the network interface are not the same
• Verify that the appropriate Ethernet link indicators of the PC and probe are lit
• Verify that web browser proxy settings are not interfering
• Verify that local firewall settings on the laptop are not interfering
• Make sure that the management and data/video subnets do not overlap (even if only one is physically connected)
• Make sure the probe was rebooted to activate the new settings
VB20 IP-PROBE USERS' MANUAL VERSION 4.92011 © BRIDGE Technologies Co AS - Bentsebrugata 20 - N-0476 Oslo, Norway - tel: +47 22 38 51 00 - www.bridgetech.tv
18

5 QUICK SETUP GUIDEThis quick setup guide is intended to provide a step-by-step explanation of how to setup a probe once the initial setup has been performed (as described in chapter 4). More detailed instructions are found in chapter 6 of this manual.
The Return Data Path and Full Service Monitoring features are not covered by this quick setup guide.
5.1 Basic Setup: All Interfaces1. Set appropriate parameters in the Setup - Params and Setup - Ethernet views.
2. If no time reference for automatic time locking has been specified set the time in the Setup - Time view.
3. If access control is required, define a password in the Setup - Login view. Note that it is important to read the instructions in the associated section of this manual.
5.2 Input Signal Definitions
5.2.1 ASI Input (for ETR 290 Option Only)1. Set appropriate parameters in the ASI - Setup view. For a start the threshold templates TR 101
290, Default, Default and Default. may be used.
5.2.2 Ethernet Input1. Define multicasts, either by using the multicast detect feature (Ethernet - Detect) or by defining
multicasts from scratch (Ethernet - Multicasts). Note that often upstream equipment will not transmit multicasts unless join messages have been received, and in this case it will usually not be possible to detect multicasts automatically. Select predefined threshold templates that seem appropriate for the signal. Note that the sequence of the multicast definitions will be reflected in monitoring, so order the multicasts correctly if required. Also note that ETR 290 monitoring for Ethernet streams is disabled by default, so if this is required, it will have to be enabled by the user (on a per-stream basis).
2. Define stream page name(s) in the Setup - Pages view (not strictly necessary).
3. Join multicasts in the Ethernet - Join view.
VB20 IP-PROBE USERS' MANUAL VERSION 4.92011 © BRIDGE Technologies Co AS - Bentsebrugata 20 - N-0476 Oslo, Norway - tel: +47 22 38 51 00 - www.bridgetech.tv
19

5.3 Monitoring: All InterfacesWhen input signal parameters have been set, the signals may be monitored.
For Ethernet input the relevant monitoring views are: Main, Alarms, Mon, MW and possibly ETR 290 (if the VB20 is equipped with the ETR 290 option).
For ASI input the relevant monitoring views are Alarms , ETR 290 and ASI - Status.
Ethernet monitoring hints are found in Appendix II.
5.4 Adjusting Alarm Thresholds: All InterfacesWhen probe inputs and streams have been defined using default thresholds, the result will usually be a number of more or less permanent probe alarms, and not all of them are informative. In order for the user to get rid of unwanted alarms, the probe provides alarm filtering functionality in the form of alarm thresholds and alarm on/off selection.
By default Ethernet thresholds are set to raise alarms when service affecting errors occur, that are caused by the network. There may however be reasons for these thresholds to be altered, for instance to reflect recevier robustness in the case of IAT, or to reflect a TS into IP mapping different from the default (7TS/UDP).
Creating a new threshold template is done either by copying an existing one and altering the copy, or by creating a new threshold template from scratch. The Ethernet thresholds are defined in the Ethernet - Ethernet thresh. view. The thresholds are associated with streams in the Ethernet - Multicasts view.
In addition to the miscellaneous thresholds, that affect only the streams with which they are associated, the Alarm - Alarm setup view allows the user to enable and disable alarms on an overall basis. It is also possible to define the alarm levels for different alarms in this view.
ETR 290 option
The default ETR 290 thresholds are based on the ETSI TR 101 290 guidelines. These are however fairly strict, and the user may want to alter the limits to better reflect receiver sensitivity. The ETR 290 thresholds should also be changed if there are tables that are not relevant for a system, or if the user requires alarm functionality that exceeds the ETR 290 guidelines, for instance to raise alarms if the number of services present in a signal is lower than a preset limit.
The default PID and service thresholds do not affect alarming at all, they are completely transparent. The thresholds may be altered for instance in order to mask an alarm generated by an unreferenced PID or to ensure an alarm is raised if a service or PID bitrate is outside preset limits.
Creating a new threshold template is done either by copying an existing one and altering the copy, or by creating a new threshold template from scratch. The thresholds are defined in these views: ETR 290 - ETR thresh., ETR 290 - PID thresh. and ETR 290 - Service thresh.
The thresholds are associated with streams in these views: ASI - Setup and Ethernet - Multicasts - Edit.
VB20 IP-PROBE USERS' MANUAL VERSION 4.92011 © BRIDGE Technologies Co AS - Bentsebrugata 20 - N-0476 Oslo, Norway - tel: +47 22 38 51 00 - www.bridgetech.tv
20

6 THE VB20 GRAPHICAL USER INTERFACE
The VB20 IP-Probe web interface is reached by pointing a web browser towards the IP-address of the probe as shown in the screen shot above (the IP-address here is 192.168.7.189).
The following WEB-browsers are supported:
• Internet Explorer 7.0 or higher• Firefox 2.0 or higher
Note that different web browsers behave differently with respect to memory leaking, and if the probe GUI should be available at all times the browser should be selected carefully. Browser memory leak manifests itself as the browser responding more and more slowly, and this is corrected by closing down the application and restarting.
The interface is easy and intuitive to use. Navigate by clicking on the tabs just below the IP-Probe logo. Some of the pages have their own tabs for accessing nested pages. The bottom frame of the interface is always the Alarms & events list, usually referred to as the alarm list.
The WEB interface has been designed to be resizeable in both vertical and horizontal directions with a minimum screen resolution of 1024x768 pixels.
Tool-tip is available for most buttons and labels. To access tool-tip information simply navigate the mouse pointer towards a button or a label and leave it hovering for a second or two.
In this manual the term stream is generally used instead of the terms multicast and /or unicast. A stream may contain a single or multiple services.
VB20 IP-PROBE USERS' MANUAL VERSION 4.92011 © BRIDGE Technologies Co AS - Bentsebrugata 20 - N-0476 Oslo, Norway - tel: +47 22 38 51 00 - www.bridgetech.tv
21

6.1 Main
6.1.1 Main - Summary
The intention of this page, together with the alarm list, is to provide enough information for the operator to immediately see if there is anything seriously wrong with one or more input streams.
The following parameters are shown:
NTP/timesync
(Bulb): The NTP/timesync bulb indicates whether the probe clock is locked to an external time reference signal. Green indicates that the probe is locked to an external reference whereas grey indicates that the probe runs in unlocked mode.
Updated: The time since the last time synchronisation update
Timezone: The timezone as selected by the operator in the Setup - Params view
Time: The current local time (configured in Setup - Params or Setup - Time view)
VB20 IP-PROBE USERS' MANUAL VERSION 4.92011 © BRIDGE Technologies Co AS - Bentsebrugata 20 - N-0476 Oslo, Norway - tel: +47 22 38 51 00 - www.bridgetech.tv
22

RDP
(Bulb): The RDP bulb indicates whether RDP is active or not. Green indicates RDP active whereas grey indicates that RDP is currently not active.
Active: The RDP active state is either yes or no, yes indicating that RDP relaying or alarm triggered recording mode has been selected by the operator in the RDP view.
State: The current RDP state. The different RDP states are: Idle : relaying or recording is not active and alarm triggered recording has not been selected
Relaying (interface) : a transport stream or range of PIDs has been selected for forwarding to an operator determined IP address
Trigger : the operator has selected alarm triggered recording mode
RECORDING : a stream is currently being recorded, either due to the operator selecting manual recording or by an alarm triggering recording
Counters and alarms
Clear all: Click the Clear all button to reset all counters, graphs and alarms. All probe measurement and alarm history is cleared. Note that it is not possible to undo this operation.
Last cleared: The time since the the Clear all counters button was last clicked. If no time is indicated the counters have not been cleared since probe startup/reboot time.
Probe
Name: The probe name as defined by the operator in the Setup - Params view
Location: The probe location as defined by the operator in the Setup - Params view
Access: The access rights of the current user. Access rights are either full access or read only access.
Resources
CPU level: The CPU level indicates the workload of the probe, on a scale from 1 to 10 of total capacity.
Free mem: The available free probe memory
Free disk: The available free probe disk space
VB20 IP-PROBE USERS' MANUAL VERSION 4.92011 © BRIDGE Technologies Co AS - Bentsebrugata 20 - N-0476 Oslo, Norway - tel: +47 22 38 51 00 - www.bridgetech.tv
23

Traffic
RX data: The total bitrate of received data traffic
Monitoring: The total bitrate of multicasts and unicasts monitored (analysed) by the probe
Data interface
IPv4 status: The IPv4 status as defined in the Setup – Ethernet view
IPv4 address:
The probe IPv4 Ethernet data/video interface IP address as defined by the user in the Setup – Ethernet view
Ipv4 netmask:
The probe IPv4 Ethernet data/video interface netmask as defined by the user in the Setup – Ethernet view
Management interface
IPv6 status: The IPv6 status as defined in the Setup – Ethernet view
IPv6 address:
The probe IPv6 Ethernet data/video interface IP address as defined by the user in the Setup – Ethernet view
Ipv6 netmask:
The probe IPv6 Ethernet data/video interface netmask as defined by the user in the Setup – Ethernet view
ETH info
Joined: The number of joined streams (multicasts and unicasts)
Unicasts: The number of unicasts currently being joined/monitored by the probe
Multicasts: The number of multicasts currently being joined/monitored by the probe
IGMP ver: The IGMP version currently used by the probe. IGMPv2 is used unless the operator has selected source specific multicasts (Setup - Params view), in which case IGMPv3 is used.
VLAN tag: The VLAN tag currently used by the probe. If no VLAN tag has been specified by the operator (Setup - Params view), the VLAN tag value will read disabled.
ETH alarms per type
No signal: The number of currently active Ethernet 'No signal' alarms
CC skips: The number of currently active Ethernet 'CC skips' alarms
MLR>=thresh: The number of currently active Ethernet MLR alarms, i.e. the total number of 'MLR>= warning-threshold' and 'MLR>= alarm-threshold' alarms
IAT>=thresh: The number of currently active Ethernet IAT alarms, i.e. the total number of 'IAT>= warning-threshold' and 'IAT>= alarm-threshold' alarms
VB20 IP-PROBE USERS' MANUAL VERSION 4.92011 © BRIDGE Technologies Co AS - Bentsebrugata 20 - N-0476 Oslo, Norway - tel: +47 22 38 51 00 - www.bridgetech.tv
24

RTP alarms: The number of currently active RTP alarms, i.e. the total number of 'RTP packet drop', 'RTP duplicates' and 'RTP out of order' alarms
Other alarms: The total number of currently active Ethernet alarms not included in the alarm figures specified above
The ETR statistics table will only be present in the view if the probe is ETR290 licensed.
ETR statistics for each interface
Interface: The ETR290 monitoring engine. The list of monitoring engines will depend on probe hardware configuration and software license.
Sync: A green sync bulb indicates that the transport stream sync alarm of the associated stream is currently not active, whereas red indicates an active 'TS sync' alarm.
Roundtime: The round-robin 'tuning' time of the currently monitored transport stream. Note that if an ETR monitoring engine has been configured to analyse a single transport stream only or if monitoring has been manually locked to a transport stream, the roundtime figure is irrelevant as the stream will be continuously monitored.
Tot bitr: The total transport stream bitrate including null packets, summed for all streams monitored by an ETR engine
Mon bitr: The total effective transport stream bitrate excluding null packets, summed for all streams monitored by an ETR engine
Streams: The number of transport streams being analysed by a particular ETR engine
Pri1 errs: The number of streams with active priority 1 alarms as reported by a particular ETR engine
Pri2 errs: The number of streams with active priority 2 alarms as reported by a particular ETR engine
Pri3 errs: The number of streams with active priority 3 alarms as reported by a particular ETR engine
Other errs: The number of streams with active 'other' alarms reported by a particular ETR engine
Iface errs: The number of streams with active interface errors reported by a particular ETR engine
RR stream: Round-robin stream; the name of the transport stream currently being analysed by a particular ETR monitoring engine. For Ethernet this is the multicast/unicast name, for ASI this is the stream name defined by the operator. If the monitoring engine is locked to one stream by the user, this field will read LOCKED: <stream name>.
VB20 IP-PROBE USERS' MANUAL VERSION 4.92011 © BRIDGE Technologies Co AS - Bentsebrugata 20 - N-0476 Oslo, Norway - tel: +47 22 38 51 00 - www.bridgetech.tv
25

6.2 AlarmsFigure 7 shows an overview of the total alarm handling of a VB20. This figure is useful to obtain an understanding of the alarm processing of the VB20 - in particular how threshold settings and alarm setup will affect alarm handling.
The VB20 continuously compares measurement data with user defined thresholds in order to generate alarms. These alarms are further checked against the settings defined in the Alarms - Alarm setup view, and the resulting alarms are presented in the alarm lists. These alarms will also be sent as SNMP traps to support third party management systems. Refer to Appendix 1 for a description of alarm handling in the VideoBridge Controller (VBC).
Figure 7: Alarm handling in the VB20
The probe distinguishes between events and alarms. The ETR software module will always generate alarms and the Systems software module will always generate events. The Ethernet software module will by default generate events for errors that are resolved within 1 second, otherwise it will generate alarms. This can be overridden by checking the “Treat ethernet events as alarms” box in the Setup - Params view.
VB20 IP-PROBE USERS' MANUAL VERSION 4.92011 © BRIDGE Technologies Co AS - Bentsebrugata 20 - N-0476 Oslo, Norway - tel: +47 22 38 51 00 - www.bridgetech.tv
26

6.2.1 Alarms - All alarms
The Alarms view gives the user the possibility of viewing alarms according to type or as one complete list. The Ethernet alarms list, FSM alarms list, ETR alarms list and System alarms list can hold 400, 100, 400 and 100 alarms respectively and are independent of each other, meaning that one may become full without affecting the other lists.
If Auto-refresh list is selected, the alarm list will be continuously updated with new alarms. Active alarms are always located at the top of the list.
Clicking the View list offline button gives the user the opportunity to view all stored alarms and events. By clicking one of the blue information icons leftmost in the offline list, a detailed alarm description can be viewed. The search field in the upper right corner of the view allows the user to type a text string and the alarm list is updated to display only streams and alarms matching the specified text. To updated the offline alarm list click the Auto-refresh list button and then go back to the offline mode.
VB20 IP-PROBE USERS' MANUAL VERSION 4.92011 © BRIDGE Technologies Co AS - Bentsebrugata 20 - N-0476 Oslo, Norway - tel: +47 22 38 51 00 - www.bridgetech.tv
27

The alarm lists may be cleared by clicking the Flush alarms button. However it should be noted that this action will permanently clear the alarm lists – they cannot be restored.
The Export button enables export of the corresponding alarm list as an XML-file. This file will open in a new window.
6.2.2 Alarms - Alarm setup
The Alarm setup represents the final probe filtering stage for alarms. The user selects whether an alarm should be enabled or ignored, and associates an error severity level with each alarm.
Figure 7 in section 5.2 gives an overview of the total alarm handling of a VB20. The settings in the Alarm setup view are represented by the Alarm Settings box in this figure.
Note that the VB20 alarm handling will also depend on the threshold settings defined by the user in the Ethernet - Ethernet thresh., ETR 290 - ETR thresh., ETR 290 - PID thresh. and ETR 290 - Service thresh. views.
Also note that only enabled alarms are shown in the alarm lists and forwarded as SNMP traps. Enabling or disabling probe alarms does however not affect the alarms presented by the VideoBridge Controller. Refer to appendix I for a description of the VB20 versus VBC alarm handling.
The following alarm severity levels may be selected:
OK: If enabled, the alarm will be present in the alarm list, colour green
Warning: If enabled, the alarm will be present in the alarm list, colour yellow
Error: If enabled, the alarm will be present in the alarm list, colour orange
Major: If enabled, the alarm will be present in the alarm list, colour red
Fatal: If enabled, the alarm will be present in the alarm list, colour black
VB20 IP-PROBE USERS' MANUAL VERSION 4.92011 © BRIDGE Technologies Co AS - Bentsebrugata 20 - N-0476 Oslo, Norway - tel: +47 22 38 51 00 - www.bridgetech.tv
28

The following alarms and events are configured:
ETH (Ethernet) alarms
No signal: There has been no UDP packet for the predefined period of time (default 1sec)
Default: Enabled, severity Major
FEC packet drop:
One or more RTP packets could not be corrected by the FEC
Default: Enabled, severity Error
RTP packet drop:
Number of RTP packet drops - only available if RTP headers are present
Default: Enabled, severity Error
RTP duplicates:
Number of RTP packets with identical RTP counters
Default: Disabled, severity Warning
RTP out of order:
Number of RTP packets recevied out of order Default: Disabled, severity Warning
CC skips: Number of transport stream discontinuities due to packet loss. Note that the CC skips number does not necessarily equal the number of lost packets, as several consecutive packets lost will be counted as one CC skip.
Default: Disabled, severity Warning
IAT >= err-thresh:
The Inter-packet Arrival Time exceeds the error threshold
Default: Disabled, severity Error
IAT >= warn-
thresh:
The Inter-packet Arrival Time exceeds the warning threshold
Default: Disabled, severity Warning
MLR >= err-thresh:
The Media Loss Rate exceeds the error-threshold
Default: Enabled, severity Error
MLR >= warn-
thresh:
The Media Loss Rate exceeds the warning-threshold
Default: Disabled, severity Warning
TTL changed:
The Time-To-Live field is changing Default: Enabled, severity Error
TOS changed:
The Type-Of-Service field is changing Default: Enabled, severity Error
Multiple mcast
sources:
There are multiple multicast sources Default: Enabled, severity Error
Mcast source
changed:
The multicast source changed to one of the valid multicast sources specified by the operator.
Default: Enabled, severity Error
Bitrate overflow:
The stream bitrate exceeds the maximum bitrate Ethernet threshold value specified by the operator.
Default: Enabled, severity Error
Bitrate underflow:
The stream bitrate goes below the minimum bitrate Ethernet threshold value specified by the operator.
Default: Enabled, severity Error
VB20 IP-PROBE USERS' MANUAL VERSION 4.92011 © BRIDGE Technologies Co AS - Bentsebrugata 20 - N-0476 Oslo, Norway - tel: +47 22 38 51 00 - www.bridgetech.tv
29

ETR (ETR 290) alarms
TS Sync: No TS Sync Default: Enabled, severity Major
Sync byte: Sync byte error Default: Enabled, severity Major
PAT: Program Association Table error Default: Enabled, severity Major
Continuity: Continuity counter error Default: Enabled, severity Major
PMT: Program Map Table error Default: Enabled, severity Major
PID: PID is missing Default: Enabled, severity Major
Transport: Transport stream error indicator is set Default: Enabled, severity Major
CRC: Table checksum error Default: Enabled, severity Major
PCR: Program Clock Reference error Default: Enabled, severity Major
PCR Accuracy: Program Clock Reference accuracy error Default: Enabled, severity Major
PTS: Presentation Time Stamp error Default: Enabled, severity Major
CAT: Conditional Access Table error Default: Enabled, severity Major
NIT: Network Information Table error Default: Enabled, severity Major
SI Rep Rate: Wrong repetition rate for SI tables Default: Enabled, severity Major
Unref PID: PID is unreferenced Default: Enabled, severity Major
SDT: Service Description Table error Default: Enabled, severity Major
EIT: Event Information Table error Default: Enabled, severity Major
RST: Running Status Table error Default: Enabled, severity Major
TDT: Time Date Table error Default: Enabled, severity Major
MGT: Master Guide Table error Default: Enabled, severity Major
VCT: Virtual Channel Table error Default: Enabled, severity Major
PIM/PNM: PIM/PNM error Default: Enabled, severity Major
RRT: Region Rating Table error Default: Enabled, severity Major
ATSC EIT: ATSC EIT Table error Default: Enabled, severity Major
STT: System Time Table error Default: Enabled, severity Major
ETT: Extended Text Table error Default: Enabled, severity Major
CA System: CA System error Default: Enabled, severity Major
PID checks: PID check error Default: Enabled, severity Major
Service checks: Service check error Default: Enabled, severity Major
Pre FEC BER: Bit error rate prior to Viterbi FEC above specified threshold. This parameter is not relevant for VB20.
Default: Enabled, severity Major
VB20 IP-PROBE USERS' MANUAL VERSION 4.92011 © BRIDGE Technologies Co AS - Bentsebrugata 20 - N-0476 Oslo, Norway - tel: +47 22 38 51 00 - www.bridgetech.tv
30

Post FEC BER: Bit error rate after Viterbi FEC above specified threshold. This parameter is not relevant for VB20.
Default: Enabled, severity Major
MER: Modulation Error Ratio above specified threshold. This parameter is not relevant for VB20.
Default: Enabled, severity Major
SNR: Signal to Noise Ratio below specified threshold. This parameter is not relevant for VB20.
Default: Enabled, severity Major
Signal strength: Signal strength below specified threshold. This parameter is not relevant for VB20.
Default: Enabled, severity Major
SFN drift: SFN drift Default: Enabled, severity Major
Packet error count:
Detection of one or more errored packets after demodulator FEC. This parameter is not relevant for VB20.
Default: Enabled, severity Major
Interface overflow:
Input interface overflow error Default: Enabled, severity Major
SYS (system) events
[Critical system errors]:
Enable this to view all critical system errors Default: Enabled, severity Fatal
[System errors]: Enable this to view all system errors Default: Enabled, severity Major
[System info]: Enable this to view system information messages
Default: Enabled, severity OK
VB20 IP-PROBE USERS' MANUAL VERSION 4.92011 © BRIDGE Technologies Co AS - Bentsebrugata 20 - N-0476 Oslo, Norway - tel: +47 22 38 51 00 - www.bridgetech.tv
31

6.3 Compare (ETR 290 Option)
The Compare view allows comparison of services or transport streams across different probe interfaces. Clicking Show streams results in a list of selectable transport streams and services, and clicking Show services results in a list of selectable services. For a transport stream to be selectable it must be ETR monitored. Note that the screen is not auto-refreshed, click the Compare tab to perform an active refresh.
VB20 IP-PROBE USERS' MANUAL VERSION 4.92011 © BRIDGE Technologies Co AS - Bentsebrugata 20 - N-0476 Oslo, Norway - tel: +47 22 38 51 00 - www.bridgetech.tv
32

One or more services or transport streams are selected by clicking and later Ctrl + clicking items from the list. Clicking the Compare selected button will launch a condensed overview page that allows status parameters for services or streams to be viewed side by side. Key parameters are presented in one column for each service/stream, and it is easy to recognise differences in signal contents or alarm status. The number of streams that can be compared depends on screen size.
VB20 IP-PROBE USERS' MANUAL VERSION 4.92011 © BRIDGE Technologies Co AS - Bentsebrugata 20 - N-0476 Oslo, Norway - tel: +47 22 38 51 00 - www.bridgetech.tv
33

The compare column consists of several sub-views:
Stream overview
Stream overview shows a number of key parameters for the selected stream/service.
Stream overview
TS ID: The transport stream ID of the selected stream or the stream containing the selected service
NW ID: The network ID of the selected stream or the stream containing the selected service
Orig NW ID: The original network ID of the selected stream or the stream containing the selected service
Min. eff. bitr: The minimum effective bitrate (null packets removed) measured for the selected stream or the stream containing the selected service
Max. eff. bitr: The maximum effective bitrate (null packets removed) measured for the selected stream or the stream containing the selected service
Min. tot. bitr: The minimum total bitrate (including null packets) measured for the selected stream or the stream containing the selected service
Max. tot. bitr: The maximum total bitrate (including null packets) measured for the selected stream or the stream containing the selected service
Last update: The time since the last update. The information will be updated when the round robin ETR engine stops monitoring a stream or once every minute for streams which are permanently monitored.
VB20 IP-PROBE USERS' MANUAL VERSION 4.92011 © BRIDGE Technologies Co AS - Bentsebrugata 20 - N-0476 Oslo, Norway - tel: +47 22 38 51 00 - www.bridgetech.tv
34

Error statistics
Total monitoring time: The total time the stream has been monitored by the ETR engine
ETR Priority 1: The time the stream has been affected by ETSI TR 101 290 Priority 1 errors
ETR Priority 2: The time the stream has been affected by ETSI TR 101 290 Priority 2 errors
ETR Priority 3: The time the stream has been affected by ETSI TR 101 290 Priority 3 errors
No signal: The time the stream has been affected by 'No signal' alarm
CC errors: The time the stream has been affected by 'CC error' alarm
Interface errors: The time the stream has been affected by 'Interface error' alarm
Other checks: The time the stream has been affected by miscellaneous 'Other' alarms
Pie charts indicate for how long the stream has been affected by errors compared to the total monitoring time, green colour representing 'OK' and red colour 'Error'.
Service alarms
If a transport stream is selected for comparison the Service alarms subview displays a list of services present in the stream. If there is one or more active alarms for a service this will be indicated by a red 'bulb' whereas a green 'bulb' indicates no active alarms. If a service is affected by one or more active alarms these alarms may be viewed by expanding the service tree. If relevant the PIDs affected by alarms are also displayed. Note that only alarms detected during the last monitoring period are displayed.
If a service is selected for comparison this subview simply shows the selected service and any active alarms affecting the service.
VB20 IP-PROBE USERS' MANUAL VERSION 4.92011 © BRIDGE Technologies Co AS - Bentsebrugata 20 - N-0476 Oslo, Norway - tel: +47 22 38 51 00 - www.bridgetech.tv
35

Services
If a transport stream is selected for comparison the Services subviewdisplays a list of services present in the stream. Clicking the plus icon at a service will expand the service tree, displaying the service's individual components. The minimum and maximum effective bitrates of a service/component are also shown, in addition to the number of continuity counter errors and the maximum measured PCR jitter (if relevant).
Coloured PIDs indicate scrambling; blue and green representing odd and even scrambling respectively.
Note that all references to a PID will result in a PID entry, i.e. one PID may be displayed several times in the list.
Alarm graph
The Alarm graph subview shows similar alarm graphs as the ETR - ETR details - Alarm graph popup view. Please refer to the ETR - ETR details section of this users' manual for a comprehensive description of this view.
VB20 IP-PROBE USERS' MANUAL VERSION 4.92011 © BRIDGE Technologies Co AS - Bentsebrugata 20 - N-0476 Oslo, Norway - tel: +47 22 38 51 00 - www.bridgetech.tv
36

ETR Details
The ETR details subview shows the same alarm overview as the ETR - ETR details view. Clicking a check will open a pop-up view displaying alarm details. Please refer to the ETR - ETR details section of this users' manual for a comprehensive description of this view.
6.4 Mon
6.4.1 Mon - Parameters
The Mon - Parameters view displays detailed information about each stream.
The user selects which group of measurements should be displayed. Selections are IP parameters, TS parameters, Ethernet parameters, RTP and FEC parameters, Userdefined parameters and Statistical parameters. If Userdefined parameters is selected, the Mon view displays parameters selected by the user in the Mon - Setup view.
For each page the Accumulated row at the bottom of the multicast list displays accumulated values for all streams associated with the page. The accumulated Min bitrate and Max bitrate is the minimum and maximum value of the Accumulated current bitrate.
VB20 IP-PROBE USERS' MANUAL VERSION 4.92011 © BRIDGE Technologies Co AS - Bentsebrugata 20 - N-0476 Oslo, Norway - tel: +47 22 38 51 00 - www.bridgetech.tv
37

When the Current page button is clicked it is possible to select the page from a drop-down menu. The associated thumbnails are shown in the leftmost column of the list of measurements. Click one of the small thumbnails to view a larger thumbnail that is updated more frequently. Note that it is possible to disable probe thumbnail extraction in the Setup - Params view.
When All streams (offline) is clicked a complete list of measurements for all joined streams is displayed. A search field allows the user to type a text string and the multicast list is updated to display only multicasts matching the specified text. Note that monitoring parameters and thumbs will not be updated in All streams (offline) mode.
Peak and aggregate measurements are cleared when the Clear counters or Clear counters all pages button is clicked.
Clicking the Export button will allow export of the measurement data as an XML file that is opened in a new window.
Click the Trim ch-list button to unjoin streams with current status 'No signal', thereby removing them from the list.
VB20 IP-PROBE USERS' MANUAL VERSION 4.92011 © BRIDGE Technologies Co AS - Bentsebrugata 20 - N-0476 Oslo, Norway - tel: +47 22 38 51 00 - www.bridgetech.tv
38

The Statistical parameters view lists sum or peak values for parameters over the interval indicated by the selected time button (Last 4d, Last 24h, Last 8h, Last 20m, Last 1m).
Clicking a stream brings up the Detailed monitoring popup described later in this section.
In All streams (offline) mode a search field allows the user to type a text string and the multicast list is updated to display only multicasts matching the specified text.
VB20 IP-PROBE USERS' MANUAL VERSION 4.92011 © BRIDGE Technologies Co AS - Bentsebrugata 20 - N-0476 Oslo, Norway - tel: +47 22 38 51 00 - www.bridgetech.tv
39

Current measurements
Joined multicasts
: Click the information icon to access the Detailed Monitoring pop-up view.
Thumb: A thumbnail is displayed for each stream. Click the small thumbnail to view a larger image that is updated more frequently.
Name: The stream name specified by the user in the Edit Multicast view
Signal: Time since last signal loss
Page: The page associated with the multicast
Mapping: The number of MPEG-2 packets mapped into each RTP or UDP packet
Net bitrate: Instantaneous MPEG-2 Transport Stream bitrate excluding null packets (PID 8191). The instantaneous bitrate is measured over a time period of 1000 ms.
CC errs: The number of times a discontinuity has been detected for all the MPEG-2 Transport Stream continuity counters. This value is the total number of discontinuities detected for all PIDs present.
Note that this value does NOT represent the number of MPEG-2 TS packets lost because any continuity counter mismatch detected for an IP-frame will increase CC errs by one.
CC errors are serious as they will in practice usually result in visual video artefacts ('blocking') if occurring on the video PIDs. CC errors can be due to an erroneous input signal to the streaming head-end (e.g. from satellite rain fading or changes in the uplink). Alternatively, CC errors can arise from IP packets being dropped in the network.
PIDs: Number of PIDs in the MPEG2-TS
Syncb errs: Number of transport stream packets with wrong syncbyte (0x47)
Curr bitrate: Instantaneous MPEG-2 Transport Stream bitrate including null packets (PID 8191). The instantaneous bitrate is measured over a time period of 1000 ms. For non-TS traffic the bitrate is calculated from the size of the UDP payloads.
Min bitrate: The minimum current bitrate measurement
Max bitrate: The maximum current bitrate measurement
IP packets: The number of IP packets received
Dst address: Multicast/unicast destination address : port
TOS: Type-Of-Service (also called Differentiated Services Field)
TTL: Time-To-Live
VLAN ID: Native VLAN ID of this stream
Src address: Multicast/unicast source address : port
Joined src: The source address of the originally joined multicast.
IAT avg: Average Inter-Arrival Time. The average time between consecutive IP frames (in milliseconds). Recalculated each second.
VB20 IP-PROBE USERS' MANUAL VERSION 4.92011 © BRIDGE Technologies Co AS - Bentsebrugata 20 - N-0476 Oslo, Norway - tel: +47 22 38 51 00 - www.bridgetech.tv
40

IAT min: The Minimum Inter-Arrival Time is the minimum registered time between two consecutive IP frames carrying video. Units are in milliseconds.
IAT max: The Maximum Inter-Arrival Time is the maximum registered time between two consecutive IP frames carrying video. Units are in milliseconds.
The Max-IAT is a measure of the maximum amount of network-induced packet jitter present. IP packet jitter affects video quality and should be minimised.
Src MAC: Source MAC address
Dst MAC: Destination MAC address
RTP drops: Accumulated number of dropped IP-frames due to network errors.
Only available for multicasts that carry RTP information.
When running video inside an RTP wrapper it is possible to exactly deduce the number of dropped IP frames due to network issues. This is possible as a result of the 16-bit sequence counter inside the RTP header.
The following sequence will generate an RTP drops of +3:..., 10, 11, 12, 16, 17, 18, ...
RTP dups: Accumulated number of duplicate IP-frames.
Only available for multicasts that carry RTP information.
Duplicate IP-frames in the network can occur under normal circumstances and does not necessarily indicate network problems.
The following sequence will generate an RTP dups of +2: ..., 10, 11, 12, 12, 12, 13, 14, ...
RTP ooo: Accumulated number of times a packet has been found to be out of order.
Only available for multicasts that carry RTP information.
An out-of-order situation is defined to have occurred when the current sequence number is lower than the previous one.
The following sequence will generate an RTP ooo of +2 (since there are two occurrences): ..., 10, 11, 15, 12, 16, 17, 13, 14, 18, 19, ...
RTP lag: The maximum number of packet positions an out-of-order packet has been moved relative to its correct position. So for example 1,2,3,5,6,7,8,4,9,10 will result in an RTP lag of 4.
The RTP lag is a good measure of how big a packet re-ordering buffer is needed in the receiving equipment to re-order packets.
Min hole size: Minimum number of consecutive dropped RTP packets. The sequence 1,2,3,10,11,12,15 gives a min hole size of 2.
Max hole size: Maximum number of consecutive dropped RTP packets. The sequence 1,2,3,10,11,12,15 gives a max hole size of 6.
Min hole sep: Minimum number of RTP packets separating any holes. The sequence 1,2,3,10,11,12,15 gives a min hole sep of 3.
VB20 IP-PROBE USERS' MANUAL VERSION 4.92011 © BRIDGE Technologies Co AS - Bentsebrugata 20 - N-0476 Oslo, Norway - tel: +47 22 38 51 00 - www.bridgetech.tv
41

Num holes: Number of packet loss sequences. The sequence 1,2,3,10,11,12,15 gives a num holes of 2.
FEC mode: The CoP3 FEC mode
FEC drops: Number of RTP packet drops in the main stream that the FEC could not correct
C-FEC drops: Number of IP packets in the column-FEC streams dropped
R-FEC drops: Number of IP packets in the row-FEC streams dropped
Statistical parameters
MPEG-2 transport stream parameters
i: Click the information icon to access the Detailed Monitoring pop-up view.
Name: The stream name specified by the user in the Edit Multicast view
ES(IAT): Number of seconds during selected period with Inter-packet Arrival Time higher than associated Ethernet IAT warning threshold
ES(MLR): Number of seconds during selected period with Media Loss (corresponding to number of seconds with CC-errors)
ES(RTP): Number of seconds during selected period with RTP packet drops
ES(overfl): Number of seconds during selected period with bitrate overflow
ES(nosig): Number of seconds during selected period without signal
Peak(IAT): Peak Inter-packet Arrival Time during selected period.
Sum(MLR): Sum of Media Loss during selected period (equals number of TS packets lost)
Peak(bitr): Peak stream bitrate during selected period
VB20 IP-PROBE USERS' MANUAL VERSION 4.92011 © BRIDGE Technologies Co AS - Bentsebrugata 20 - N-0476 Oslo, Norway - tel: +47 22 38 51 00 - www.bridgetech.tv
42

Thumbnails
The probe will try to generate thumbnail pictures for all streams. For multi-program transport streams (MTPS) the first video component is selected. Both MPEG-2 and MPEG-4 video formats are supported (standard and high definition).
The thumbnail update rate will depend on the number of streams available in the view, i.e. the update rate will generally be higher in 'Current page' mode than in 'All' mode. When a small thumbnail is clicked the larger thumbnail image will have an increased update rate.
If the probe cannot generate a thumbnail from the signal, it will present one of the following icons:
Shown if no data is received for the stream. There should be a match between presenting this icon and a No-signal alarm; however since the alarm and thumbnail mechanisms work independently of each other they have been given different names (loss of signal and no signal).
Shown while the thumbnail engine is trying to decode a thumbnail picture and more precise status information has not yet been obtained. This icon is typically displayed after probe reboot or if new streams have recently been joined.
Shown if the stream does not carry a video PID – which is the case for radio streams.
The probe does not support thumbnail generation for this protocol mapping. In this version of the probe TS/UDP and TS/RTP are supported.
This icon is shown if the probe is unable to receive or analyse the PMT PID. Only streams with PSI information can have thumbnails decoded since the probe does not support a manual specification of the video PID.
The probe can only generate a thumbnail picture if the video data is not scrambled.
The signal is recognised as being MPEG-2 encoded but cannot be correctly decoded by the thumbnail extractor.
The signal is recognised as being MPEG-4 encoded but cannot be correctly decoded by the thumbnail extractor.
The signal cannot be decoded due to excessive CC errors.
The stream contains no service, as signalled in PSI.
VB20 IP-PROBE USERS' MANUAL VERSION 4.92011 © BRIDGE Technologies Co AS - Bentsebrugata 20 - N-0476 Oslo, Norway - tel: +47 22 38 51 00 - www.bridgetech.tv
43

Detailed Monitoring
The Detailed Monitoring popup is activated by clicking a stream line in the monitoring list.
The probe is continuously gathering detailed information for the selected multicast. The probe will continue updating the detailed information for the selected multicast until another is selected. Clicking the Clear button will clear all information about the selected stream, including PSI/SI analysis data.
The Detailed Monitoring - Services view lists detected MPEG-2 TS services (by analysing the PSI/SI tables) and provides the following aggregate information for each service:
Service/Pid: For each service, the service-name or service-id is obtained from the PSI/SI tables. PIDs that do not belong to a service are denoted “Other PIDs”. The service ID is presented in square brackets.
Bitrate: Service or component bitrate in megabits per second
Min bitr.: Minimum service or component bitrate in megabits per second
Max bitr.: Maximum service or component bitrate in megabits per second
CC errors: Number of Continuity Counter occurrences
Thumb: Click the icon to access the Thumb pop-up view
Type: The list entry service type or PID type
PCR: This field will be checked if the corresponding PID carries PCR
Scr: This field will be checked if the corresponding PID is scrambled
Under this list the Mon - Parameters (Current parameters) measurements for the selected stream are displayed.
VB20 IP-PROBE USERS' MANUAL VERSION 4.92011 © BRIDGE Technologies Co AS - Bentsebrugata 20 - N-0476 Oslo, Norway - tel: +47 22 38 51 00 - www.bridgetech.tv
44

In the Detailed Monitoring - IAT view the Inter Arrival Time histogram shows the accumulated number of IAT measurements within each presented interval. Vertical green lines indicate the maximum and minimum IAT values. By clicking the IAT range buttons it is possible to change the zooming of the graph. If the IAT auto button is pressed the diagram will auto-scale to always include the minimum and maximum IAT readings.
The IAT histogram is a very useful and intuitive measure of how well the network is performing in terms of forwarding real-time traffic. A predictable and tightly bunched graph indicates small levels of network jitter. An unbound graph indicates network jitter issues typically brought forward by traffic congestion or misconfigured routers. Clicking the Clear IAT button will clear the IAT graph.
Under the IAT histogram the Mon - Parameters (Current parameters) measurements for the selected stream are displayed.
Clicking the Clear button will clear all information about the selected stream, including PSI/SI analysis data.
Clicking the MediaWindow button will open the Media Window Selected channel view. This is described in section 6.5.
Note that due to the way the probe aggregates interrupts for high bitrates the sub-millisecond accurracy of the IAT measurements may be affected when the probe experiences a combined bitrate of 200 Mbit/s or above. Below this limit there is no interrupt aggregation so the IAT measurements will be accurate. The inaccuracy has been measured to be plus minus 0.2 ms at 750 Mbit/s.
Note that for variable bitrate streams the IAT histogram will show a very different IAT distribution compared to the histogram for a constant bitrate stream. The histogram in the screenshot above displays the IAT distribution for a CBR stream.
VB20 IP-PROBE USERS' MANUAL VERSION 4.92011 © BRIDGE Technologies Co AS - Bentsebrugata 20 - N-0476 Oslo, Norway - tel: +47 22 38 51 00 - www.bridgetech.tv
45

Thumb View
The Thumb View pop-up is accessed by clicking an information icon in the Detailed Monitoring - Services view. This view displays a large thumbnail of the selected stream with an increased update rate compared to non-selected streams. Service audio level is indicated by one audio level bar per audio component.
Clicking the Close button will close the Thumb View.
Audio fields
PID: The audio PID for which the associated parameters apply
Language: The audio language, as derived from PSI/SI
Average: The average audio level in dB, measured over a period of approximately 0.5 second
Peak: The peak audio level in dB, detected during a period of approximately 0.5 second
Audio level: An audio level bar displaying the average audio level as a green bar referenced to the peak audio level, the peak level being indicated by a white line
VB20 IP-PROBE USERS' MANUAL VERSION 4.92011 © BRIDGE Technologies Co AS - Bentsebrugata 20 - N-0476 Oslo, Norway - tel: +47 22 38 51 00 - www.bridgetech.tv
46

The following metadata information is displayed:
Multicast (Stream Name)
Transport stream ID:
The transport stream ID of the stream containing the selected service
Name: The name of the multicast containing the selected service, as defined by the user
Type: The type of the stream containing the selected service; multicast or unicast
Multicast address: The multicast address of the stream containing the selected service
Multicast port: The port number of the multicast containing the selected service
Source address: The SSM source address of the multicast containing the selected service
Bitrate: The total stream bitrate of the multicast containing the selected service (bits/s)
Stream status: The status of the stream containing the selected service, as reported by the decoding engine
Service (Service ID)
PSI/SI Name: The name of the selected service, as derived from SI
Service ID: The service ID of the selected service
Controlbit scramble state:
The scramble state as indicated by the MPEG TS control bit
PES sync scramble state:
The scramble state as detected from the PES sync state
Number of PIDs: The number of PIDs associated with the selected service
Bitrate: The total bitrate of the selected service (bits/s)
Video PID (PID Number)
PID: The video PID of the selected service
Bitrate: The video PID bitrate of the selected service
Status: The status of the video PID as reported by the decoding engine
PES sync: The latest PES sync state
PES length indicator:
If signalled in the PES packet header the PES packet length is displayed
VB20 IP-PROBE USERS' MANUAL VERSION 4.92011 © BRIDGE Technologies Co AS - Bentsebrugata 20 - N-0476 Oslo, Norway - tel: +47 22 38 51 00 - www.bridgetech.tv
47

Decoder Information
Size: The video picture size of the selected service
Aspect ratio: The video aspect ratio of the selected service
Pixel aspect ratio: The video pixel aspect ratio of the selected service
Codec: The video encoding format of the selected service
Quality: The video sampling format of the selected service
Frame rate: The video frame rate of the selected service (Hz)
Audio PID (PID Number)
PID: The audio PID of the selected service. Note that there may be several audio PIDs associated with a service.
Type: The audio encoding standard
Is scrambled: An indication of audio PID scrambling. The value may be 'yes' or 'no'.
Bitrate: The audio PID bitrate of the selected service
Language: The language of the audio, as defined in the Program Map Table (PMT).
Peak level: The peak audio level in dB, detected during a period of approximately 0.5 second
Average level: The average audio level in dB, measured over a period of approximately 0.5 second
Audio Information PID (PID Number)
Codec: The audio encoding format
Samplerate: The audio sample rate
Channels: The number of audio channels represented by the audio PID
Layout: The audio channel layout
Format: The number of bits used to represent an audio sample
Bitrate: The effective audio bitrate
VB20 IP-PROBE USERS' MANUAL VERSION 4.92011 © BRIDGE Technologies Co AS - Bentsebrugata 20 - N-0476 Oslo, Norway - tel: +47 22 38 51 00 - www.bridgetech.tv
48

6.4.2 Mon - Setup
The Mon - Setup view enables selection of the parameters to be displayed in the Mon - Parameters view. Note that thumbnails must also be enabled in the Setup - Params view for thumbnail availability.
6.5 MW
The MW Media Window view provides an at-a-glance status for each of the multicasts/unicasts being monitored. From the graphs it is easy to see the jitter characteristics of the signal and if there is packet loss or CC errors present in the signal. Periods of no signal are also displayed.
The measurements are always aggregated over a time interval – typically one second. The IAT(max) is the maximum time measured between two neighbouring IP frames within the measurement time interval (the peak packet Inter-arrival time). IAT is expressed in milliseconds.
The MLR is the peak estimated number of lost MPEG-2 Transport Stream packets inside any second within the actual time period. The number of lost TS packets is derived from the continuity counters inside the TS packet headers.
A common scenario is to have 7 TS packets per UDP frame. Losing an IP packet will therefore usually (but not always) result in an MLR of 7 (not always the case because some TS packets such as null pacets or PCR packets do not carry a valid CC field).
VB20 IP-PROBE USERS' MANUAL VERSION 4.92011 © BRIDGE Technologies Co AS - Bentsebrugata 20 - N-0476 Oslo, Norway - tel: +47 22 38 51 00 - www.bridgetech.tv
49

Bridge Technologies' patented Media Window presents both jitter and packet loss measurements in one graph, with jitter (IAT) values growing upwards (+ve Y) and packet loss (MLR) growing downwards (-ve Y). Each sample along the x-axis corresponds to a measurement time-interval that depends on the range of the graph selected. Periods of no sync are also displayed in the graph.
Error-second statistics for the graph-interval is displayed to the right. As the graphs are zoomed or scrolled the error-second statistics is updated as well as the graphs.
Tool-tip provides the exact jitter (IAT) and packet loss (MLR) values for a selected bar in a selected graph, the denotation is IAT::MLR. The current graph value displayed under “Running” provides the maximum MLR and IAT values measured during the last 3 seconds.
Red colour is used to indicate that within the period represented by the bar there has been one or more occurrences of no-signal. Orange is used to indicate error while yellow indicates warning. The error and warning thresholds are allocated to each multicast in the Ethernet - Multicasts view.
The user determines whether only multicasts associated with the currently selected page should be displayed (by clicking the Cur page button), or if all joined multicasts should be presented in one list (by clicking the All button). The time window buttons allow selection of x-axis resolution in the graphs, and by using the arrow buttons it is possible to move the timeline to view an error incident more accurately. Clicking Clear will clear all graphs. Note that clearing graphs cannot be undone. Clicking the +1 button will display the next page. Clicking the -1 button will display the previous page.
By zooming and panning the user can pinpoint more accurately when errors occurred. In the above diagram tooltip reveals that 'No signal' occurred between 9:15 and 9:20.
VB20 IP-PROBE USERS' MANUAL VERSION 4.92011 © BRIDGE Technologies Co AS - Bentsebrugata 20 - N-0476 Oslo, Norway - tel: +47 22 38 51 00 - www.bridgetech.tv
50

Media Window - Selected channel
The Media Window - selected channel view is activated by clicking a multicast label in the MW page.
This hi-resolution version of the Media Window reveals more details than the compressed version. There are 3 times more samples along the X-axis, and the graph indicates visually the error and warning thresholds. Note that the time windows of the regular Media Window and Media Window - selected channel are not exactly the same, even if the same time window has been selected for both views.
Bandwidth graph
By clicking the BW:MLR button the graph displays the peak bandwidth as a function of time. The negative part of the composite graphs is still the packet loss (i.e. the MLR).
If the stream contains a transport stream (mapping TS/x) the bitrate corresponds to the Mon parameter Net bitrate (i.e. bitrate excluding null packets). Otherwise the bitrate is the UDP payload bitrate corresponding to the Mon parameter Curr bitrate.
The bandwidth error threshold is configured in the Ethernet - Ethernet thresh. menu.
VB20 IP-PROBE USERS' MANUAL VERSION 4.92011 © BRIDGE Technologies Co AS - Bentsebrugata 20 - N-0476 Oslo, Norway - tel: +47 22 38 51 00 - www.bridgetech.tv
51

RTP graph
By clicking the IAT:RTP button the graph displays the packet jitter as a function of time. The composite graphs displays the RTP packet loss below the X-axis. If the monitored stream is not RTP encapsulated, IAT will be represented by grey colour and there will never be any indication of packet loss in the graph.
6.6 RDPThe Return Data Path feature enables forwarding of a stream from any probe interface to another destination IP-address. An Ethernet stream may also be recorded to file.
Although Bridge Technologies probes allow detailed analysis and inspection of signals, there will always be situations when other tools are required. Rather than carrying heavy and expensive equipment from site to site for remote investigation, it is much easier to forward the stream back to where the equipment is located.
Situations when RDP is particularly useful include testing of scrambled signals. Descrambling of a stream can be easily verified by forwarding the stream to a centrally located decoder or set-top box. Another example is when local insertion and PSI/SI multiplexing introduces lots of unknowns in remote locations. Bringing the signal back for analysis could be very useful.
VB20 IP-PROBE USERS' MANUAL VERSION 4.92011 © BRIDGE Technologies Co AS - Bentsebrugata 20 - N-0476 Oslo, Norway - tel: +47 22 38 51 00 - www.bridgetech.tv
52

RDP Relay
A stream can be RDP forwarded to a specified IP-address as a unicast stream or as a multicast stream. For multicast streams the probe needs to know on which interface to send. For unicast streams the probe needs to know the gateway to send the stream to, unless the destination address is on the same subnet as the probe.
The relaying functionality is enabled by clicking the grey Relay button. Relaying is stopped by clicking the green Relay active button. If a relay timeout period different from 0 is selected, relaying will be stopped when the relay timeout period has expired.
Note that when relaying signals originating from optional input modules, it is necessary to lock the tuning to one frequency for proper operation.
VB20 IP-PROBE USERS' MANUAL VERSION 4.92011 © BRIDGE Technologies Co AS - Bentsebrugata 20 - N-0476 Oslo, Norway - tel: +47 22 38 51 00 - www.bridgetech.tv
53
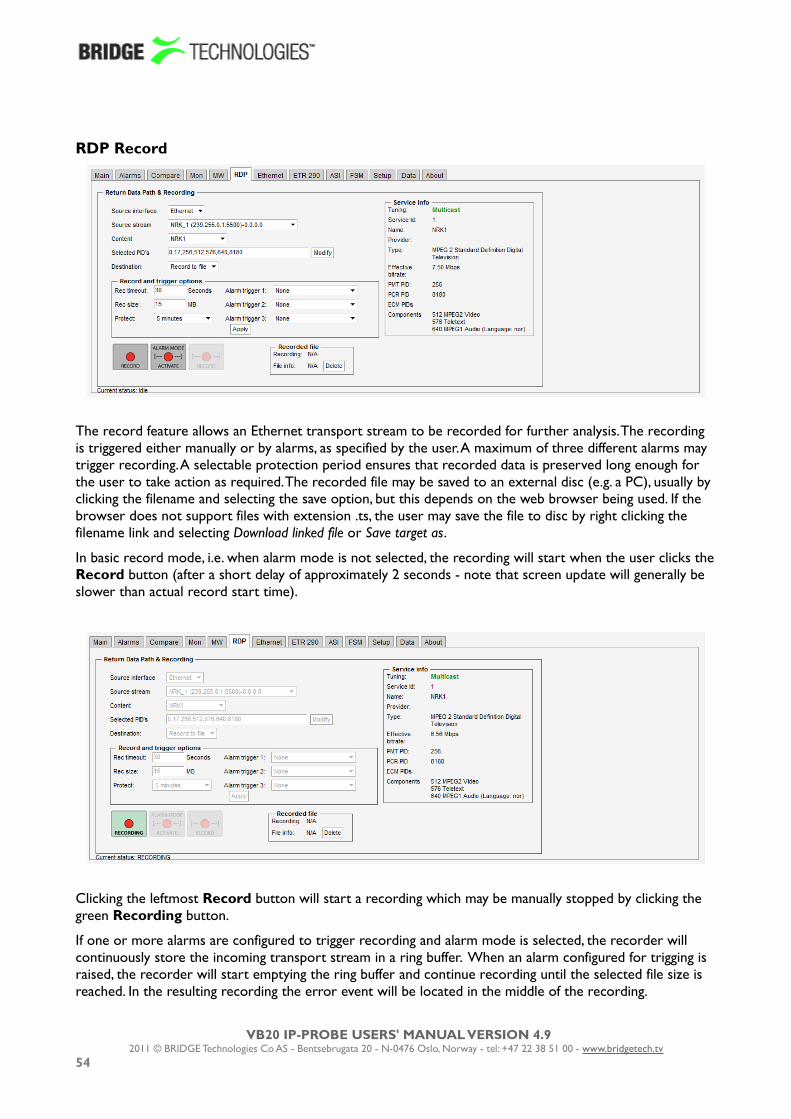
RDP Record
The record feature allows an Ethernet transport stream to be recorded for further analysis. The recording is triggered either manually or by alarms, as specified by the user. A maximum of three different alarms may trigger recording. A selectable protection period ensures that recorded data is preserved long enough for the user to take action as required. The recorded file may be saved to an external disc (e.g. a PC), usually by clicking the filename and selecting the save option, but this depends on the web browser being used. If the browser does not support files with extension .ts, the user may save the file to disc by right clicking the filename link and selecting Download linked file or Save target as.
In basic record mode, i.e. when alarm mode is not selected, the recording will start when the user clicks the Record button (after a short delay of approximately 2 seconds - note that screen update will generally be slower than actual record start time).
Clicking the leftmost Record button will start a recording which may be manually stopped by clicking the green Recording button.
If one or more alarms are configured to trigger recording and alarm mode is selected, the recorder will continuously store the incoming transport stream in a ring buffer. When an alarm configured for trigging is raised, the recorder will start emptying the ring buffer and continue recording until the selected file size is reached. In the resulting recording the error event will be located in the middle of the recording.
VB20 IP-PROBE USERS' MANUAL VERSION 4.92011 © BRIDGE Technologies Co AS - Bentsebrugata 20 - N-0476 Oslo, Norway - tel: +47 22 38 51 00 - www.bridgetech.tv
54

To activate the alarm triggered recording mode click the Alarm mode activate button. When in alarm triggered mode the Record button will allow the user to override the alarm trigger and make a recording based on data in the ring buffer. This enables the user to create a recording of a visually detected error.
To exit the alarm triggered recording mode click the green Alarm mode active button.
The basic settings in the RDP view are:
Return Data Path & record
Source interface: The source interface drop-down menu allows selection of available input signals. Note that ETR290 analysis of a demodulated signal should be locked (round-robin looping disabled) to obtain a continuous stream.
Content: When Ethernet input is selected the user selects the stream to forward or record. Ethernet streams being joined/monitored by the probe are available for selection.
When any other source interface than Ethernet is specified, the user selects the service to be relayed to a specified IP-address, or alternatively selects that the complete stream should be forwarded. The PIDs associated with the service are automatically displayed in the 'Selected PIDs' field, and these may be edited if required.
Selected PIDs: When the ASI input is selected the user can specify the PIDs to be forwarded. Typically PAT and PMT PIDs should be forwarded in addition to video and audio PIDs, however this depends on the equipment receiving the forwarded stream. When this field has been edited, click the Modify button for the changes to take effect.
Destination: For Ethernet input select Record to enable transport stream recording or Relay to forward a stream to another destination. For other interfaces only relay mode is selectable.The GUI will change to enable user selection of relevant parameters for the different modes of operation.
VB20 IP-PROBE USERS' MANUAL VERSION 4.92011 © BRIDGE Technologies Co AS - Bentsebrugata 20 - N-0476 Oslo, Norway - tel: +47 22 38 51 00 - www.bridgetech.tv
55
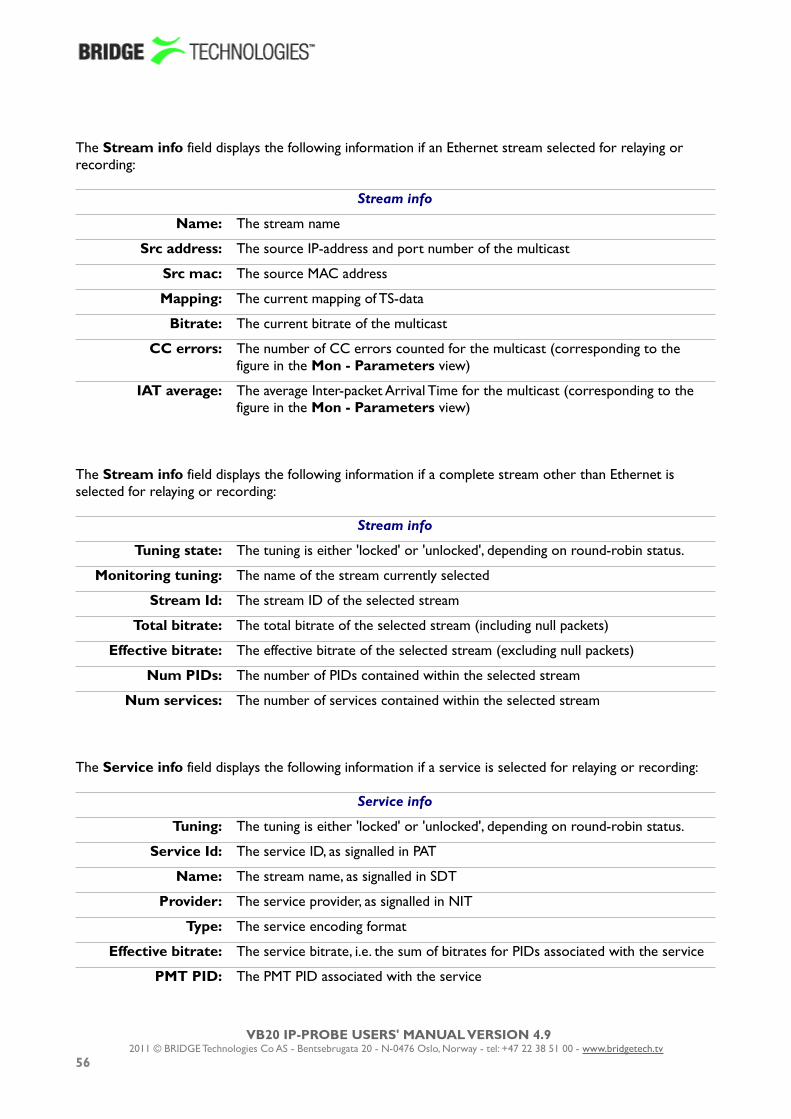
The Stream info field displays the following information if an Ethernet stream selected for relaying or recording:
Stream info
Name: The stream name
Src address: The source IP-address and port number of the multicast
Src mac: The source MAC address
Mapping: The current mapping of TS-data
Bitrate: The current bitrate of the multicast
CC errors: The number of CC errors counted for the multicast (corresponding to the figure in the Mon - Parameters view)
IAT average: The average Inter-packet Arrival Time for the multicast (corresponding to the figure in the Mon - Parameters view)
The Stream info field displays the following information if a complete stream other than Ethernet is selected for relaying or recording:
Stream info
Tuning state: The tuning is either 'locked' or 'unlocked', depending on round-robin status.
Monitoring tuning: The name of the stream currently selected
Stream Id: The stream ID of the selected stream
Total bitrate: The total bitrate of the selected stream (including null packets)
Effective bitrate: The effective bitrate of the selected stream (excluding null packets)
Num PIDs: The number of PIDs contained within the selected stream
Num services: The number of services contained within the selected stream
The Service info field displays the following information if a service is selected for relaying or recording:
Service info
Tuning: The tuning is either 'locked' or 'unlocked', depending on round-robin status.
Service Id: The service ID, as signalled in PAT
Name: The stream name, as signalled in SDT
Provider: The service provider, as signalled in NIT
Type: The service encoding format
Effective bitrate: The service bitrate, i.e. the sum of bitrates for PIDs associated with the service
PMT PID: The PMT PID associated with the service
VB20 IP-PROBE USERS' MANUAL VERSION 4.92011 © BRIDGE Technologies Co AS - Bentsebrugata 20 - N-0476 Oslo, Norway - tel: +47 22 38 51 00 - www.bridgetech.tv
56

PCR PID: The PCR PID associated with the service
ECM PIDs: The ECM PIDs associated with the service (if applicable)
Components: The service component PIDs and component types
When destination Relay over IP has been selected, the RDP parameters are:
RDP Ethernet
IPv4-address: The unicast address or multicast address to forward to. Multicast addresses are in the range 224.0.0.0 – 239.255.255.255.
Port: The port to forward to. The combination of IP-address and port fully describes the destination address.
Unicast gateway: If the unicast destination address can only be reached via a gateway, the gateway address must be specified.
TTL: The Time-To-Live flagging of the relayed signal. The default value is 64.
Timeout: The relaying period in minutes. If the value 0 is selected, no timeout applies, and relaying will continue until it is stopped manually.
Encapsulation: The encapsulation format of the relayed stream. UDP or RTP may be selected.
Relay multicasts via interface:
If the multicast is to be forwarded on the management subnet, eth2 is selected. If eth0 is specified, the multicast is forwarded on the data/video interface.
When destination Record has been selected the record and trigger options are:
Record and trigger options
Rec timeout: The maximum recording time in seconds. This setting enables the user to limit recordings of low-bitrate streams.
Rec size: The total file size of the recording (maximum 20MB). When in alarm trigger mode the resulting recording will consist of 12MB of data from before the alarm was raised and (Size - 12MB) of data from after the alarm occurrence. 1MB=1000000 bytes.
Protect: When in alarm trigger mode the user may select to protect a recording from being overwritten due to a new alarm occurrence. The user may select between 'Never overwrite', 'Do not protect', '30 seconds', '60 seconds' and '5 minutes'.
Alarm trigger1-3: Select a maximum of three different alarms that should trigger recording. Note that a recording will start upon a transition from status ok to status alarm. Alarms that have been disabled in the Alarms - Alarm setup view will be shown in brackets - these will never trigger a recording.
Note that it is necessary to click the Apply button for changes to take effect.
VB20 IP-PROBE USERS' MANUAL VERSION 4.92011 © BRIDGE Technologies Co AS - Bentsebrugata 20 - N-0476 Oslo, Norway - tel: +47 22 38 51 00 - www.bridgetech.tv
57

The recorded file and associated metadata may be accessed from the recorded file area of the view:
Recorded file
Recording: This field will read recording.ts when a recording has been stored to file, and N/A when there is no current recording. The recorded file may be accessed by clicking the recording.ts link or by right clicking the link (web browser dependant).
File info: This field will read metadata.txt when a recording has been stored to file and N/A when there is no current recording. The metadata text contains information about the recording, and it may be accessed by clicking the metadata.txt link. For best file info display formatting an application like Windows Word Pad should be used to read the file.
Delete: Click the Delete button to delete the current recording. Note that an existing recording should be deleted prior to software update, as otherwise there may not be enough memory to store the new sw image during the upgrade process.
6.7 Ethernet
6.7.1 Ethernet - Traffic
The Ethernet - Traffic view allows monitoring of IP traffic on the data/video port in terms of the protocols used.
Clicking the Clear counters button will reset displayed values.
VB20 IP-PROBE USERS' MANUAL VERSION 4.92011 © BRIDGE Technologies Co AS - Bentsebrugata 20 - N-0476 Oslo, Norway - tel: +47 22 38 51 00 - www.bridgetech.tv
58

The following measurements are presented:
Protocol (rx): The protocol for which the following measurements apply
Cur bitrate: The current total bitrate for this protocol (measured over the last 1s period)
Max bitrate: The maximum bitrate during any 1s period
Min bitrate The minimum non-zero bitrate during any 1s period
Frames: Number of Ethernet frames
Frames %: Percentage of total number of frames
Min flen: Minimum Ethernet frame length
Max flen: Maximum Ethernet frame length
Data/video interface (eth 0)
TX bitrate: The current total transmitted bitrate
RX bitrate: The current total received bitrate
VLAN tagged frames (%):
The percentage of Ethernet frames that are VLANtagged
IP-fragmented frames (%):
The percentage of IP packets that are fragmented,meaning they span more than one Ethernet frame
UDP unicasts: The number of detected UDP unicasts
UDP unicasts: The total bitrate of detected UDP unicasts
UDP multicasts: The number of detected UDP multicasts
UDP multicasts: The total bitrate of detected UDP multicasts
COP3 Payload: Total bitrate of all payload streams with FEC enabled
COP3 Fec columns: Total bitrate of all column-FEC streams
COP3 Fec rows: Total bitrate of all row-FEC streams
COP3 Correctable: Total count of dropped payload IP packets that are correctable by the FEC
COP3 Uncorrectable:
Total count of dropped payload IP packets that cannot be corrected by the FEC
COP3 Late: Payload or FEC packets are received slightly too late according to the buffer model and may result in errors in another implementation of the specifications. The number of packets with this error.
COP3 Errors: Either the L/D parameters are not consistent across the streams or payload/FEC packets are received too late or too early according to the buffer model. The number of packets with these errors.
VB20 IP-PROBE USERS' MANUAL VERSION 4.92011 © BRIDGE Technologies Co AS - Bentsebrugata 20 - N-0476 Oslo, Norway - tel: +47 22 38 51 00 - www.bridgetech.tv
59

Management interface (eth 2)
TX bitrate: The current total transmitted bitrate
RX bitrate: The current total received bitrate
6.7.2 Ethernet - Summary
The intention of this page, together with the alarm list, is to provide enough information for the operator to immediately see if there is anything seriously wrong with one or more Ethernet input streams. The overall status for the Full Service Monitoring (FSM) is also shown.
Throughout this view the bulb colours indicate the most severe active alarm. They may be green (no alarm), yellow (warning), orange (error) or red (major). The bulb colour is based on user defined alarm severity settings for each alarm. A grey bulb indicates that monitoring is disabled.
The following Ethernet parameters are shown:
Eth streams with active alarms:
Shows the number of streams that are presently in an alarm state (0-260). Note that the number of alarms counted refers to default settings, and alarms disabled by the user will still be counted.
Interface bitrate: This is the total bitrate sensed on eth0. It should be greater than or equal to the Monitoring bitrate.
Monitoring: This is the total number of Ethernet streams monitored (0-260) and the total bitrate for these streams.
Full Service Monitoring status:
The number of enabled FSM services / number of OK FSM services
The probe is capable of monitoring up to 260 streams simultaneously. The probe splits streams into pages for easy handling. Each of the 20 predefined pages can be given a name and have a user defined number of streams associated.
VB20 IP-PROBE USERS' MANUAL VERSION 4.92011 © BRIDGE Technologies Co AS - Bentsebrugata 20 - N-0476 Oslo, Norway - tel: +47 22 38 51 00 - www.bridgetech.tv
60

Part of the page-status is error-second statistics for the fundamental parameters MLR, RTP, overfl and nosig summed across all streams belonging to that page.
The error-second statistics interval is selected by clicking the buttons. For example, clicking the ES-8h button will present error-seconds for the last 8 hours. If 10 streams for a page have been without signal for the last 8 hours, the nosig will show as 80hours.
The following parameters are presented (note that the error second values are accumulated frome probe boot time, and they will only be cleared by reboot or by clicking the Clear all counters button in the Main view):
“Bulb”: The bulb indicates the most severe active alarm for any of the streams on the page. Active alarms are located on top of the alarm list. The alarm severity is reflected by the colour of the associated icon.
Next to the bulb is a link that will lead to the Monitoring page if pressed. The Monitoring page will present error-second statistics for each stream individually.
OK: Shows how many of the streams monitored on this page are without active alarms
ES(MLR): Number of seconds in selected period with continuity counter errors in the MPEG2 transport stream (which corresponds to the number of seconds with non-zero Media Loss Rate).
ES(RTP): Number of seconds in selected period with RTP packet-drop
ES(overfl): Number of seconds in selected period with bitrate overflow
ES(nosig): Number of seconds in selected period where no signal (i.e. no data) was received
6.7.3 Ethernet - History
The probe keeps statistical Ethernet information for the last 4 days for visual inspection in the history timeline view.
VB20 IP-PROBE USERS' MANUAL VERSION 4.92011 © BRIDGE Technologies Co AS - Bentsebrugata 20 - N-0476 Oslo, Norway - tel: +47 22 38 51 00 - www.bridgetech.tv
61

Each bar in the histogram corresponds to a number of events that occurred within a certain time interval. The interval that each bar represents depends on the scale, from 1 minute (when 90 min is selected) to 1 hour (when 4 days is selected).
Clicking the Clear history button will reset all history graphs.
Tool-tip information is available for each bar and shows the time-interval for the bar and its exact value. For example, the tool-tip information “1315-1330:2” means that within the time interval 13:15 – 13:30 there were 2 occurrences.
The histogram is updated every minute.
Any subset of the following parameters can be selected, click the Apply button for changes to take effect:
No signal: The number of streams that reported the “No signal” alarm during the interval represented by the bar.
CCerr: The number of times a discontinuity has been detected for all the MPEG-2 Transport Stream continuity counters in the interval represented by the bar. This parameter corresponds to the sum of CC errs reported by all streams.
RTPdrop: Accumulated number of dropped IP-frames due to network errors in the interval represented by the bar. This parameter corresponds to the sum of RTP drops reported by all streams.
RTPdup: Accumulated number of duplicate IP-frames in the interval represented by the bar. This parameter corresponds to the sum of RTP dups reported by all streams.
RTPooo: Accumulated number of times a packet has been found to be out of order in the interval represented by the bar. This parameter corresponds to the sum of RTP ooo reported by all streams.
Tot bitr: Bitrate sensed on the eth0 interface
Mon bitr: Bitrate on eth0 corresponding to joined multicasts
CRC errs: Detected CRC errors. Ethernet CRC errors are most likely caused by a bad cable or a misconfigured router. A CRC error may impact packet loss measurements such as CC errors and RTP errors.
Note that the history graphs show the sum for all streams being analysed across all pages. So for example, if two streams experience No signal at the same time the No signal graph will increase by 2.
VB20 IP-PROBE USERS' MANUAL VERSION 4.92011 © BRIDGE Technologies Co AS - Bentsebrugata 20 - N-0476 Oslo, Norway - tel: +47 22 38 51 00 - www.bridgetech.tv
62

6.7.4 Ethernet - Detect
The Detect page shows all UDP traffic sensed by the probe. Note that promiscuous network mode should be enabled in the Setup - Params view for the probe to detect all traffic, and not only multicasts already joined by the probe. Note that generally the upstream switch or router will not output streams that are not joined by downstream equipment, i.e. usually only joined streams will be available for monitoring.
If the unicast/multicast destination address is known to the probe (i.e. listed in the Ethernet - Multicasts menu) the stream’s Name is looked up, otherwise a generic name is used.
When the Ethernet - Detect view is entered after probe booting, the probe will perform a detect operation. For the probe to update the list, click the Refresh button.
The source address makes it possible for the probe to distinguish between multicasts with the same destination IP address and port, provided that Source specific multicasts has been enabled in the Setup - Params view.
If the stream is currently joined by the probe (i.e. the probe is currently monitoring the stream), the Joined field is set to yes.
VLAN ID is only available if the probe has enabled VLAN tagging for eth0 (Ethernet - Parameters).
Detected streams can be added to the probe’s stream list by selecting streams and clicking the Add selected to stream list. To add all detected streams the Add all to stream list button can be pressed. Only streams not already in the probe’s stream list are considered. Clicking the Export button will generate an XML-file that opens in a new window.
VB20 IP-PROBE USERS' MANUAL VERSION 4.92011 © BRIDGE Technologies Co AS - Bentsebrugata 20 - N-0476 Oslo, Norway - tel: +47 22 38 51 00 - www.bridgetech.tv
63

6.7.5 Ethernet - IGMP
The IGMP view shows all IGMP messages detected by the probe. This includes IGMP query messages sent by routers, IGMP reply messages sent by the probe itself and IGMP reply messages sent by other probes and devices on the same subnet.
The live IGMP page can be paused by clicking the View list offline button. The IGMP messages can be exported as XML by clicking the Export... button, and the list is cleared by clicking the Clear list button.
: Click the blue information icon to open the IGMP record pop-up view
No: The message number since the list was cleared
Time: The probe time when the message occurred
Millisec: The milliseconds timestamp
Source: The source IP address
Destination: The destination IP address
Code: The timeout code
Message: The interpreted IGMP message
Group: The IGMP group address
VB20 IP-PROBE USERS' MANUAL VERSION 4.92011 © BRIDGE Technologies Co AS - Bentsebrugata 20 - N-0476 Oslo, Norway - tel: +47 22 38 51 00 - www.bridgetech.tv
64
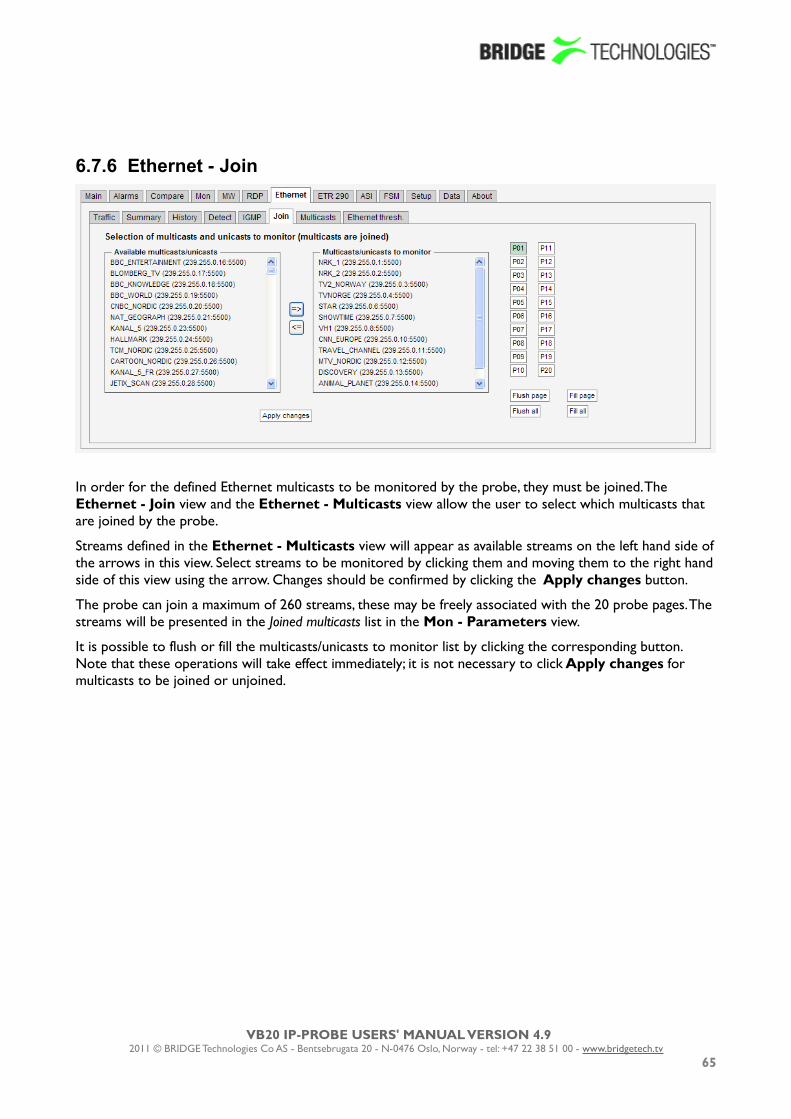
6.7.6 Ethernet - Join
In order for the defined Ethernet multicasts to be monitored by the probe, they must be joined. The Ethernet - Join view and the Ethernet - Multicasts view allow the user to select which multicasts that are joined by the probe.
Streams defined in the Ethernet - Multicasts view will appear as available streams on the left hand side of the arrows in this view. Select streams to be monitored by clicking them and moving them to the right hand side of this view using the arrow. Changes should be confirmed by clicking the Apply changes button.
The probe can join a maximum of 260 streams, these may be freely associated with the 20 probe pages. The streams will be presented in the Joined multicasts list in the Mon - Parameters view.
It is possible to flush or fill the multicasts/unicasts to monitor list by clicking the corresponding button. Note that these operations will take effect immediately; it is not necessary to click Apply changes for multicasts to be joined or unjoined.
VB20 IP-PROBE USERS' MANUAL VERSION 4.92011 © BRIDGE Technologies Co AS - Bentsebrugata 20 - N-0476 Oslo, Norway - tel: +47 22 38 51 00 - www.bridgetech.tv
65

6.7.7 Ethernet - Multicasts
In this view the operator can define multicasts available to the probe and associate a name with each multicast address. This name will be used by the probe when referring to the multicast. If no name has been defined the probe will use the multicast-address:port notation.
It is possible to add, delete or edit several entries simultaneously. Several entries are selected by using the regular Ctrl + click or Shift + click functionality. When adding new entries the current dialogue values will be used as the template with the values for Name and Address incremented for each.
The search field in the upper right corner of the view allows the user to type a text string and the multicasts list is updated to display only multicasts matching the specified text.
When the Edit button is clicked it is possible to define the following multicast parameters (note that some parameters are only relevant and selectable when the IP-Probe is equipped with the T2MI option):
VB20 IP-PROBE USERS' MANUAL VERSION 4.92011 © BRIDGE Technologies Co AS - Bentsebrugata 20 - N-0476 Oslo, Norway - tel: +47 22 38 51 00 - www.bridgetech.tv
66

General
Name: A name should be assigned to each unicast/multicast. The name will be used throughout the probe's user interface when referring to this stream. It may also be used by an external management system like the VideoBridge Controller.
Address: The IP-address of the unicast or multicast. For a T2MI inner stream enter a dummy address.
Port: The port number of the unicast or multicast. For a T2MI inner stream enter a dummy port number.
Ethernet thresholds:
The Ethernet thresholds specify various error limits. Selectable Ethernet thresholds templates are defined in the Ethernet - Ethernet thresh. View. For a T2MI stream select a dummy threshold template.
VBC thresholds: The VBC thresholds specify various error limits to be used by the VideoBridge Controller to generate alarms. These thresholds are only relevant if the VBC is used. VBC threshold templates are defined in the Setup - VBC thresh. view.
Join stream: Check the 'Join stream' box to join the stream. Only joined streams are analysed. A stream may also be joined from the Ethernet - Join or Ethernet - Multicasts views, and the status of this check box will be updated accordingly.
SSM
SSM source 1: The SSM address value is only needed for IGMP v3 systems. A name may be associated with each SSM address.
SSM source 2: Additional SSM source addresses may be specified to enable back-up solutions. Note that it is the operator's responsibility to ensure that a multicast is only transmitted by one SSM source at any time.
SSM source 3: Additional SSM source address
SSM source 4: Additional SSM source address
SSM source 5: Additional SSM source address
VB20 IP-PROBE USERS' MANUAL VERSION 4.92011 © BRIDGE Technologies Co AS - Bentsebrugata 20 - N-0476 Oslo, Norway - tel: +47 22 38 51 00 - www.bridgetech.tv
67

ETR (ETR290 Option)
Enable ETR: ETR monitoring of a stream will not take place unless it is enabled by this setting. This parameter is only relevant if the probe is ETR enabled.
Select ETR engine:
If the probe is licensed for several Ethernet ETR engines the user may select which engine should be used to analyse the stream. The default ETR engine selection is Ethernet1.
ETR thresholds: The ETR thresholds specify various error limits and alarm conditions. Selectable ETR thresholds templates are defined in the ETR 290 - ETR thresh. view. The round-robin cycling time is also defined by this threshold template. This parameter is only relevant if the probe is ETR enabled.
PID thresholds: The PID thresholds specify various error limits and alarm conditions. Selectable PID thresholds templates are defined in the ETR 290 - PID thresh. view. This parameter is only relevant if the probe is ETR enabled.
Service thresholds:
The Service thresholds selection defines various error limits and alarm conditions. Selectable service thresholds templates are defined in the ETR 290 - Service thresh. view. This parameter is only relevant if the probe is ETR enabled.
VB20 IP-PROBE USERS' MANUAL VERSION 4.92011 © BRIDGE Technologies Co AS - Bentsebrugata 20 - N-0476 Oslo, Norway - tel: +47 22 38 51 00 - www.bridgetech.tv
68

T2MI (T2MI Option)
Container stream: For an T2MI inner stream the container stream (outer stream) must be specified. Select the container stream from the drop-down menu. For streams other than T2MI inner streams (none) should be selected.
Data PID: The container stream PID carrying the inner stream
PLP ID: The PLP ID for the inner stream. Select a fixed PLP ID value from the drop-down menu or specify that the first detected PLP ID should be used.
Other
Has FEC: The user should specify if a stream uses COP3 forward error correction.
VB20 IP-PROBE USERS' MANUAL VERSION 4.92011 © BRIDGE Technologies Co AS - Bentsebrugata 20 - N-0476 Oslo, Norway - tel: +47 22 38 51 00 - www.bridgetech.tv
69

6.7.8 Ethernet - Ethernet thresh.
Thresholds are used to determine when to actually raise an alarm. If the defined threshold levels are exceeded for a parameter, an alarm will be raised. Ethernet thresholds are also used to scale some graphs like the MediaWindow graphs. The alarm level of each of these alarms is set in the Alarms - Alarm setup view. Note that it is also possible to disable alarms in the Alarms - Alarm setup view.
There are two different ways of creating user-defined thresholds. To create a new threshold template from scratch the operator should click the Add new threshold button. A pop-up window will appear allowing the user to define alarm conditions. Another way of creating a user-defined threshold template is by highlighting one of the threshold templates already defined and then click the Duplicate highlighted button.
Deleting a threshold template is done by highlighting the threshold template that should be removed and clicking Delete selected. It is possible to delete or edit several entries simultaneously. Several entries are selected by using the regular Ctrl + click or Shift + click functionality. Click the Edit button to edit one or more selected threshold templates.
VB20 IP-PROBE USERS' MANUAL VERSION 4.92011 © BRIDGE Technologies Co AS - Bentsebrugata 20 - N-0476 Oslo, Norway - tel: +47 22 38 51 00 - www.bridgetech.tv
70

The Ethernet parameter thresholds are used for generating Ethernet probe alarms as well as for calculating error-seconds. Error seconds and ETH probe alarms are issued whenever measurements exceed the parameter thresholds.
Ethernet parameter thresholds
Name: The name of the Ethernet threshold template
Refs: The number of streams associated with this Ethernet threshold template
IAT:MLR error: This threshold contains error limits for IAT (Inter-packet Arrival Time) and MLR (Media Loss Rate).
The IAT limit is the first parameter (before the colon), the MLR limit is the last parameter. If the IAT limit is exceeded the alarm 'IAT >= err-thresh' will be raised. If the MLR limit is exceeded the alarm 'MLR >= err-thresh' will be raised. The severity (and hence the colour used in the MediaWindow view) for IAT:MLR errors depend on the severity assigned to these alarms in the Alarms - Alarm Setup view.
Note that error seconds based on MLR are counted regardless of this threshold if one or more packets are missing.
IAT:MLR warning: This threshold contains warning limits for and MLR (Media Loss Rate).
The IAT limit is the first parameter (before the colon), the MLR limit is the last parameter. If the IAT limit is exceeded the alarm 'IAT >= warn-thresh' will be raised. If the MLR limit is exceeded the alarm 'MLR >= warn-thresh' will be raised. The severity (and hence the colour used in the MediaWindow view) for IAT:MLR errors depend on the severity assigned to these alarms in the Alarms - Alarm Setup view.
Max bitrate: The maximum bitrate in Mbit/s. An alarm will be raised if the stream bitrate exceeds the maximum bitrate.
Min bitrate: The minimum bitrate in Mbit/s. A value of 0 will never generate an alarm. A value of 0.1Mbit/s will generate an alarm if the minimum bitrate threshold is less than 0.1Mbit/s.
No signal: Number of milliseconds without receiving any signal before the 'No signal' alarm is raised
RTP drop limit: If the number of lost RTP packets exceeds the RTP drop limit an alarm will be raised. Note that error seconds based on packet drops are counted regardless of this threshold.
Ignore PID loss: A comma separated list of PIDs for which the probe should ignore packet loss. Packet loss that affects these PIDs will not result in an error-second count, and the ETR monitoring engine will not count these errors.
VB20 IP-PROBE USERS' MANUAL VERSION 4.92011 © BRIDGE Technologies Co AS - Bentsebrugata 20 - N-0476 Oslo, Norway - tel: +47 22 38 51 00 - www.bridgetech.tv
71

6.8 ETR 290 (ETR 290 Option)The ETR 290 tab and all sub-views will only be present in the user interface provided that the VB20 IPProbe is licensed with the ETR 290 option.
The ETR 290 views show information as reported by the ETSI TR 101 290 monitoring engines.
If ETR 290 analysis has been configured for multiple Ethernet streams to be monitored by a particular Ethernet ETR engine (refer to Ethernet - Multicasts - Edit), they will be analysed in a round-robin fashion by the engine. A maximum of 260 Ethernet streams may be analysed in total.
A basic ETR 290 license includes one ETR analysis engine for each enabled input: Ethernet and ASI. Additional ETR 290 analysis engines for Ethernet are available, making it possible to reduce the analysis round-trip time or allowing simultaneous full-time ETR analysis of several multicasts. The ETR 290 analysis engines operate in parallel.
It is possible to hide disabled inputs from being displayed in the various ETR 290 sub-views. This setting is found in the Setup – ETR view.
6.8.1 ETR 290 - ETR Overview
The ETR 290 - ETR Overview view will show ETR 290 status for ETR 290 monitored streams. ETR 290 monitoring may be enabled for Ethernet streams in the Ethernet - Multicasts - Edit view. The ASI input is always ETR 290 monitored unless the input is disabled, and demodulated streams are by default ETR 290 monitored.
The streams currently being analysed are highlighted and a clock icon shows the monitoring progress. The analysis time for each stream is set as part of the ETR thresholds parameters list in the ETR 290 - ETR thresh. - Edit view.
VB20 IP-PROBE USERS' MANUAL VERSION 4.92011 © BRIDGE Technologies Co AS - Bentsebrugata 20 - N-0476 Oslo, Norway - tel: +47 22 38 51 00 - www.bridgetech.tv
72

The result of the different ETR 290 tests are shown as table entries in a condensed view called MicroETR, a scaled down version of the regular ETR display, one icon representing one stream. Green colour indicates status OK whereas red colour indicates an active alarm for that particular test. A white field shows that a check has not yet been performed, usually due to lack of measurement data, and grey indicates that a check is disabled. Tool-tip functionality allows the user to view the name of an individual check in the MicroETR display. Let the mouse pointer hover over the field for a moment to view the tool-tip.
When clicking one of the MicroETR icons the detailed ETR 290 status for that stream is displayed in the ETR 290 - ETR Details view. By entering this view through the MicroETR, the view will remain static irrespective of the round-robin looping, thus making it easy to examine one stream in detail without interruptions. The round-robin looping and associated alarm handling will continue in the background.
Note that it is possible to deactivate individual ETR 290 alarms by defining appropriate ETR thresholds.
If the user wants to examine one particular Ethernet stream in more detail, he can lock the ETR 290 analysis to that stream by clicking the lock field at that stream. The round-robin operation of the ETR 290 engine will then be stopped and a lock icon will appear as an indication that the monitoring is locked to that stream. If a time limit has been set for the time lock (Setup - ETR view), a clock icon will be superimposed on the lock icon. To re-activate the round-robin cycling the lock icon should be clicked. Note that locking the ETR 290 processing to one stream will affect alarm handling and all ETR 290 views. Active alarms for streams that are not currently being analysed will freeze (remain active) until the processing lock is deselected and ETR 290 analysis eventually shows that the error state is cleared.
The user can select one input to be displayed exclusively by clicking the corresponding Show only this input button. This does not affect ETR 290 processing or alarming.
6.8.2 ETR 290 - ETR Details
The ETR Details view shows the ETR 290 status for the current stream of the user-selected input. The name of the current stream is displayed in addition to the two round-robin indicator icons when relevant: the time cycle icon and the lock icon. By clicking the lock icon the round-robin tuning process is stopped (locked to the current frequency) or resumed. A DVB or ATSC icon indicates the analysis mode. The analysis mode is defined as part of the ETR thresholds.
The ETR 290 parameters are grouped into five different categories. The first three groups are defined in the ETSI TR 101 290 guidelines. The fourth category contains checks defined by Bridge Technologies allowing CA system checks and custom PID and service checks. The last category contains checks of the input interfaces.
VB20 IP-PROBE USERS' MANUAL VERSION 4.92011 © BRIDGE Technologies Co AS - Bentsebrugata 20 - N-0476 Oslo, Norway - tel: +47 22 38 51 00 - www.bridgetech.tv
73

For each check a bulb indicates the current status of that parameter check: green indicates status ok whereas red indicates an active alarm. When the probe has not yet received data relevant for a particular check, the corresponding bulb is white. Grey colour indicates that the check has been deactivated (as set in ETR 290 - ETR thresh. - Edit).
When clicking one of the ETR 290 parameters, details about the current status can be viewed for that item.
Enable the Show additional measurements checkbox to view additional measurements that are a part of the alarm status. These will appear with a 'half-bulb' icon indicating that the check is disabled whilst also showing the status of this element. As an example this can be used to view the BAT section repetition interval and section gap, or to view a list of PIDs with CC errors including the PIDs for which this check has been manually disabled.
Click a PID in a PID list to view PID details.
If the Clear status button is clicked the error counts are reset and the ETR 290 analysis restarts.
The details of the individual ETR 290 measurements are described in a separate document called Bridgetech ETR 290 Details - Extended ETSI TR 101 290 Testing.
VB20 IP-PROBE USERS' MANUAL VERSION 4.92011 © BRIDGE Technologies Co AS - Bentsebrugata 20 - N-0476 Oslo, Norway - tel: +47 22 38 51 00 - www.bridgetech.tv
74

Clicking the Show alarm graph button opens the Alarm graph popup view.
The alarm graph shows the transport stream ETR alarm status over time in the form of a status timeline. The timeline bar shows the stream status for a time span of 90 minutes, 8 hours or 24 hours as selected by clicking the time selection buttons below the timelines. The stream bar reveals any alarm that has been present during the selected time period. The bar colour is either green for OK or coloured in accordance with the alarm severity if an alarm has occurred. Refer to section 6.2.2 for a description of the alarm colour representation. Periods of time when the stream has not been ETR monitored due to round-robin operation are represented by grey. By using the arrow buttons it is possible to view alarm occurrences up to 24 hours back in time even if the highest graph time resolution is selected.
If alarms have occurred during the selected time period, the status timeline will not be all green. In this case it is possible to expand the timeline tree by clicking the plus sign at the timeline. Individual timelines for different ETR priorities and for different alarms may be viewed as the tree is expanded into several levels. Tooltips reveals details about an error incident.
By default the 'Show only errors' mode is selected, and only timelines that are not all green will be displayed. By clicking the Show all checks button it is possible to access demodulator measurement graphs, if relevant. Note that graphs representing MER, SNR and Signal strength are always present, irrespective of probe hardware configuration. These graphs show the maximum and minimum values of the parameter during the period.
VB20 IP-PROBE USERS' MANUAL VERSION 4.92011 © BRIDGE Technologies Co AS - Bentsebrugata 20 - N-0476 Oslo, Norway - tel: +47 22 38 51 00 - www.bridgetech.tv
75

6.8.3 ETR 290 - Services
The ETR290 - Services view lists the services and service components of the current stream of the selected input.
The name of the current stream is displayed in addition to the two round-robin indicator icons when relevant: the time cycle icon and the lock icon. By clicking the lock icon, the round-robin cycling is stopped or resumed. A DVB or ATSC icon indicates the analysis mode. The analysis mode is defined as part of the ETR thresholds.
When tree nodes are selected, detailed information will be displayed on the right hand side of the view.
If the service tree 'Services' top node is clicked, a summary list of stream services and PIDs is displayed. Each service's service ID and each component's PID value and bitrate are displayed together with individual PID and service bitrates.
VB20 IP-PROBE USERS' MANUAL VERSION 4.92011 © BRIDGE Technologies Co AS - Bentsebrugata 20 - N-0476 Oslo, Norway - tel: +47 22 38 51 00 - www.bridgetech.tv
76

Services top node
Service: Service name and service ID
PID: Service component PID value
Type: Service and component encoding format
Bitrate: Individual current bitrate of services and components
When clicking a service, details about the service and service components will be displayed.
If a PID is scrambled this is indicated in the service tree by the colour green or blue (for even and odd scrambling respectively). A missing PID is indicated by the colour red. If one of the blue PID links is clicked, PID details are shown.
Click the Show thumbnail button to view a thumbnail of the selected service.
VB20 IP-PROBE USERS' MANUAL VERSION 4.92011 © BRIDGE Technologies Co AS - Bentsebrugata 20 - N-0476 Oslo, Norway - tel: +47 22 38 51 00 - www.bridgetech.tv
77

Service node
Service name: Name of the highlighted service, as signalled in SDT or VCT
Service ID: Service ID number
Service type: Service type
Service provider name:
The name of the service provider as signalled in NIT
Current bitrate: The current service bitrate
Minimum bitrate: The minimum service bitrate detected during the monitoring period
Maximum bitrate: The maximum service bitrate detected during the monitoring period
PMT PID: The service's PMT PID
PCR PID: The service's PCR PID
ECM PIDs: The service's ECM PID(s) and name of CA system(s). This information will only be displayed if one or more service components are scrambled.
Components: A list of the service component PIDs and component type
EPG: If DVB EIT is present in the stream and EIT table IDs are configured in the Setup - ETR view, EIT present/following is displayed. If EIT schedule is present in the stream, a blue 'Show full EPG' link is displayed. By clicking the link it is possible to view the EIT schedule information.
When clicking a service component, associated key parameters and references will be displayed.
For PIDs carrying PCR it is possible to view a PCR jitter histogram by clicking the blue 'show histogram' link. If one of the blue service links is clicked, service details are shown.
VB20 IP-PROBE USERS' MANUAL VERSION 4.92011 © BRIDGE Technologies Co AS - Bentsebrugata 20 - N-0476 Oslo, Norway - tel: +47 22 38 51 00 - www.bridgetech.tv
78

Service component node
Current bitrate: The current component bitrate
Minimum bitrate: The minimum component bitrate detected during the monitoring period
Maximum bitrate: The maximum component bitrate detected during the monitoring period
Carries PCR: An indication of whether the PID carries PCR or not. The value may be 'Yes' or 'No'. If PCR is carried by the PID, a blue 'show histogram' link is displayed. By clicking this link it is possible to view the PCR jitter histogram.
Scrambling: An indication of whether the PID is scrambled or not. If the PID is not scrambled, the value will be 'No'. If the PID is scrambled, information about the current control word is displayed: 'Even 0x3' or 'Odd 0x2'.
Number of CC errors:
The number of CC errors detected during the monitoring period
References: A list of PSI/SI references to the component PID. When one of the blue service links is clicked, detailed service information is displayed.
VB20 IP-PROBE USERS' MANUAL VERSION 4.92011 © BRIDGE Technologies Co AS - Bentsebrugata 20 - N-0476 Oslo, Norway - tel: +47 22 38 51 00 - www.bridgetech.tv
79

6.8.4 ETR 290 - Bitrates
This view shows a graphical representation of service and PID bitrates. The current bitrate is shown as the length of the light blue bar whereas the dark blue bar represents bitrate variation, spanning from minimum to maximum measured bitrate.
The name of the current stream is displayed in addition to the two round-robin indicator icons when relevant: the time cycle icon and the lock icon. By clicking the lock icon the round-robin tuning process is stopped (locked to the current frequency) or resumed. A DVB or ATSC icon indicates the analysis mode. The analysis mode is defined as part of the ETR thresholds.
The user may select to view either a list of services and component PIDs, to view PIDs only or to view PIDs without the null PID. This is selected by clicking the Show Services, Show only PIDs or Show only PIDs but not NULL PID button respectively.
VB20 IP-PROBE USERS' MANUAL VERSION 4.92011 © BRIDGE Technologies Co AS - Bentsebrugata 20 - N-0476 Oslo, Norway - tel: +47 22 38 51 00 - www.bridgetech.tv
80

6.8.5 ETR 290 - Tables
This view lists the PSI and SI or ATSC tables and table contents of the currently active stream of the selected input.
The name of the current stream is displayed in addition to the two round-robin indicator icons when relevant: the time cycle icon and the lock icon. By clicking the lock icon the round-robin cycling is stopped or resumed. A DVB or ATSC icon indicates the analysis mode. The analysis mode is defined as part of the ETR thresholds.
Clicking the 'Sections' node displays detected tables and associated repetition rates.
Clicking a table enables viewing the table contents in a readily readable format.
By clicking the plus-icon at a table the table contents is displayed in detail.
Clicking one of the table entries will allow viewing the table contents as a hexadecimal dump for detailed inspection.
VB20 IP-PROBE USERS' MANUAL VERSION 4.92011 © BRIDGE Technologies Co AS - Bentsebrugata 20 - N-0476 Oslo, Norway - tel: +47 22 38 51 00 - www.bridgetech.tv
81

The selected table entry is highlighted in the table dump. Note that values shown in the table list may not correspond directly to the highlighted hex dump byte(s), because some of the table entries do not add up to whole bytes.
By hovering the cursor over the items in the tree a tooltip is displayed showing the start position of the data in the hexadecimal dump and the length of data.
A description of each PSI/SI table is beyond the scope of this manual, please refer to the ITUT H.222.0 and ETSI EN 300 468 specifications for more information about PSI/SI.
6.8.6 ETR 290 - PID list
This view lists the PIDs of the currently active stream of the selected input. The PID list can be sorted by clicking a table column header.
VB20 IP-PROBE USERS' MANUAL VERSION 4.92011 © BRIDGE Technologies Co AS - Bentsebrugata 20 - N-0476 Oslo, Norway - tel: +47 22 38 51 00 - www.bridgetech.tv
82

The name of the current stream is displayed in addition to the two round-robin indicator icons when relevant: the time cycle icon and the lock icon. By clicking the lock icon the round-robin cycling is stopped or resumed. A DVB or ATSC icon indicates the analysis mode. The analysis mode is defined as part of the ETR thresholds.
By clicking the button Clear counters the minimum and maximum bitrates and the CC error counters will be reset. Note that this cannot be undone.
When clicking the blue information icon associated with a PID details concerning that PID will be displayed. All services referring to the PID are listed, and scrambling information is shown.
The following PID details are displayed:
PID Details:
PID: The PID for which the following parameters apply
Type: The type detected for this PID. For components the first reference is used, i.e. if a PID an video component for one service and PCR reference for another service, the PID type displayed here will depend on which service is listed in first in the PAT.
Bitrate: The current bitrate measurement for this PID. The bitrate is averaged over 1 second interval.
Min Bitrate: The minimum bitrate measurement for this PID since the start of the monitoring period. (I.e. when the probe tuned to the frequency or when the monitoring of this frequency was restarted by the user clicking on 'Clear status' in the 'ETR Overview'.)
Max Bitrate: The maximum bitrate measurement for this PID since the start of the monitoring period.
Num CC errors: The number of CC errors for the specified PID. For the Ethernet interface the number of CC errors is measured from when the probe started to monitor the multicast or when the user clicked 'Clear counters' in the 'Mon' page.
Carries PCR: If the PID carries Program Clock Reference information, this field will be set to Yes
Scrambling: If the PID is scrambled, this field will show if it is scrambled with Odd or Even control word.
VB20 IP-PROBE USERS' MANUAL VERSION 4.92011 © BRIDGE Technologies Co AS - Bentsebrugata 20 - N-0476 Oslo, Norway - tel: +47 22 38 51 00 - www.bridgetech.tv
83

6.8.7 ETR 290 - PCR
The PCR jitter histogram displays PCR jitter as measured by the probe.
A list of detected PCR PIDs in the selected stream is shown together with their current and maximum PCR jitter values. A PCR PID is selected for histogram presentation by clicking the associated table entry. The histogram shows the number of received PCR values versus jitter. PCR jitter is measured as PCR-AC for the Ethernet interface and as PCR-OJ for all other interfaces.
The name of the current stream is displayed in addition to the two round-robin indicator icons when relevant: the time cycle icon and the lock icon. By clicking the lock icon the round-robin cycling is stopped or resumed. The pushbuttons Zoom in and Zoom out enables rescaling of the graph. This makes it possible to view PCR jitter values that are outside the range defined by the auto-scaling. Clicking the Clear button will clear historical data from the histogram.
Tooltip functionality provides information about each histogram bar: the number of samples, the percentage of total number of samples and the jitter interval represented by the bar.
For PCR measurements to be valid it is essential that the signal be stuffed with null packets (PID 8191) to obtain an absolutely constant bitrate. The stream info above the histogram shows if the analysed stream contains null packets or not. A colour indicator above the PCR jitter histogram indicates whether the signal is of constant bitrate or not, as perceived by the PCR filter in the processing engine. Green indicates OK, red indicates that the PCR jitter measurements are not valid due to the bitrate not being constant.
Note that PCR jitter measurements for Ethernet streams are very sensitive to packet loss, and packet loss results in a large jitter values - often for all PCR PIDs of an MPTS.
VB20 IP-PROBE USERS' MANUAL VERSION 4.92011 © BRIDGE Technologies Co AS - Bentsebrugata 20 - N-0476 Oslo, Norway - tel: +47 22 38 51 00 - www.bridgetech.tv
84

The PCR PID list displays the following parameters:
PID: The PID for which the following parameters apply
Current: The last PCR jitter value measured
Overall max: The maximum PCR jitter value measured from transport stream sync was obtained. Note that this may not correspond to the maximum value for PCR jitter in the histogram, as the histogram displays values measured from the time when a PCR PID was selected.
Threshold: The PCR jitter threshold currently valid for the stream, as defined in the associated ETR threshold template
In addition to the histogram itself, the following parameters are displayed:
Max jitter (ns): The maximum jitter value measured from the time the PID was selected
Average jitter (ns): The average jitter in nanoseconds
Bin resolution (ns): The width of the jitter interval spanned by each histogram bar
Outside thresholds: The number of PCR values that are outside the PCR jitter thresholds (defined by the user as part of the ETR threshold template)
Out of view: The number of PCR values that are out of the currently displayed view
6.8.8 ETR 290 - Status
The ETR 290 - Status view shows a stream content overview linked to current alarms, making it easy to view what services and PIDs are currently affected by errors.
By clicking any of the 'Service view', service or component nodes it is possible to view the same details that are available in the ETR 290 - Service view plus status and alarm information for services and PIDs.
VB20 IP-PROBE USERS' MANUAL VERSION 4.92011 © BRIDGE Technologies Co AS - Bentsebrugata 20 - N-0476 Oslo, Norway - tel: +47 22 38 51 00 - www.bridgetech.tv
85

6.8.9 ETR 290 - ETR thresh.
The ETR thresholds make it possible to define detailed conditions for ETR 290 alarm triggering on a per-stream basis. There are six predefined ETR threshold templates that are write-protected and cannot be edited by the operator:
• TR 101 290• ATSC Default• Optimised• IP-SPTS• CMTS downlink• Analog carrier
These predefined thresholds may be used when defining a monitoring configuration, but it is a good idea to create editable copies of these threshold templates and use these copies rather than the originals. Doing so will allow fine-tuning of parameters later on.
There are two different ways of creating user-defined thresholds. To create a new threshold template from scratch the operator should click the Add new threshold button. A pop-up window will appear allowing the user to define alarm conditions and set the round-robin cycling time. The default values of the different parameters settings are in accordance with the ETSI TR 101 290 specification. Another way of creating a user-defined threshold template is by highlighting one of the threshold templates already defined and then click the Duplicate highlighted button. The copy created this way may be edited during the fine-tuning phase of system configuration.
Deleting an ETR threshold template is done by highlighting the threshold template that should be removed and clicking Delete highlighted. Note that if the deleted threshold template is assigned to a stream currently being monitored, the new threshold for that stream will default to the predefined TR 101 290 threshold template.
It is possible to perform multi-editing of existing threshold templates by selecting several threshold templates (using the regular Ctrl + click or Shift + click functionality) and clicking Edit selected. Parameters that differ between the threshold templates will be represented by an asterisk in the Edit ETR threshold view. Changes made will affect all selected threshold templates.
VB20 IP-PROBE USERS' MANUAL VERSION 4.92011 © BRIDGE Technologies Co AS - Bentsebrugata 20 - N-0476 Oslo, Norway - tel: +47 22 38 51 00 - www.bridgetech.tv
86

The ETR threshold template has the following settings:
ETR Thresholds - Parameters:
Name: A text field with the name of the ETR threshold template
Description: Text field that should contain a meaningful description of the threshold
Analysing Mode: The mode of table analysis. DVB or ATSC may be selected.
Error timeout (s): The number of seconds after an error has occurred before the alarm is cleared as long as no new alarms are generated. For all table related alarms the actual alarm timeout which is used is the sum of the Error timeout parameter and the maximum table repetition period. E.g. the TDT with table repetition set to 30 seconds will have an effective error timeout of 40 seconds. This avoids toggling of alarms for tables that are sent infrequently. Default value: 10 s
VB20 IP-PROBE USERS' MANUAL VERSION 4.92011 © BRIDGE Technologies Co AS - Bentsebrugata 20 - N-0476 Oslo, Norway - tel: +47 22 38 51 00 - www.bridgetech.tv
87

Tuning duration (s): The time (in seconds) the probe will stay tuned to a frequency/multicast during the round-robin loop.
For setting the tuning duration, use the following expression:max_table_rep*2+10Use the maximum table repetition, multiply by 2 and then add 10 seconds. E.g. with TDT table repetition set to 30 seconds, use 30*2+10=70 seconds tuning duration.
In order to speed up the tuning process tables should be transmitted more frequently. For instance if TDT, which is usually the least frequently transmitted table, is sent every 10 seconds, a tuning duration of 30 seconds may be used. For signals without TDT (common in SPTS) the TDT check can be disabled and the tuning duration may be reduced.
If only RF measurements are performed, the minimum recommended tuning duration is 30 seconds.
If the tuning duration is set too low the checks for tables with long table repetition periods will still be in an unknown state as the probe does not have enough measurements to determine the state for these. Tuning duration should never be set to less than 10 seconds for Ethernet streams and 15 seconds for all other streams. Default value: 70 s
Sync loss tuning duration (s):
The time (in seconds) the probe will stay tuned to a frequency/multicast with TS Sync loss during the round-robin tuning process. Usually there is no need to stay tuned to a frequency/multicast once the probe has established that there is no signal on the tuning setup. When monitoring a tuning setup with signal loss, the probe will use the lowest value of 'Tuning duration' and 'Sync loss tuning duration', e.g. if the former is set to 60 seconds and the latter to 1000 seconds, 60 seconds will be used. Default value: 15 s
Minimum section gap (ms):
The minimum gap between transmission of two consecutive sections with the same table ID. If the sections are transmitted too rapidly the STB may not be able to process the data in time and various problems can occur. However newer STBs can normally handle lower section gaps than the default value of 25ms.
The section gap time is measured as the time between reception of the last TS packet of two consecutive (complete) sections.
This section gap setting is used for PAT, PMT, CAT, NIT, RST, TDT, MGT, VCT, PIM/PNM, RRT, ATSC EIT, ETT and STT. There are separate gap settings for SDT and EIT. Default value: 25 ms
VB20 IP-PROBE USERS' MANUAL VERSION 4.92011 © BRIDGE Technologies Co AS - Bentsebrugata 20 - N-0476 Oslo, Norway - tel: +47 22 38 51 00 - www.bridgetech.tv
88

ETR Thresholds - Priority 1:
TS sync: Enable or disable alarming of no signal error (TS sync loss)
Sync byte: Enable or disable alarming of sync byte errors
PAT: Enable or disable alarming of Program Association Table errors
PAT - Maximum interval (ms):
The maximum allowed section repetition interval for the PAT table.
Default: 500 ms
PAT - Minimum number of services:
The minimum number of services that must be present in the PAT. Set to 0 to disable this check.
Default: 0
PAT - Allowed Transport Stream
IDs:
When this field is left blank all TS IDs are considered valid. If one or more TS IDs are specified (separated by commas or as a range) only these IDs are considered valid, and any other TS ID will trigger an alarm.
Example of a valid field: '100-120, 300,320'
Continuity: Enable or disable alarming of Continuity Counter errors
PMT: Enable or disable alarming of Program Map Table errors
PMT - Maximum interval (ms):
The maximum allowed section repetition interval for the PMT tables.
Default: 500 ms
PMT - Minimum number of
components:
The minimum number of components that must be present in all services. Set to 0 to disable this check.
Default: 0
PMT - Require language
descriptors:
If enabled it requires a language descriptor to be present for all audio components signalled in the PMT.
Default: Disabled
Missing PID: Enable or disable alarming of missing PID errors
Note that errors affecting individual PIDs may be effectively masked by creating suitable PID threshold templates that are associated with these PIDs. This is particularly useful for PIDs affected by continuity counter errors, missing PID errors and unreferenced PID errors.
VB20 IP-PROBE USERS' MANUAL VERSION 4.92011 © BRIDGE Technologies Co AS - Bentsebrugata 20 - N-0476 Oslo, Norway - tel: +47 22 38 51 00 - www.bridgetech.tv
89

ETR Thresholds - Priority 2:
Transport: Enable or disable alarming of Transport error indicator errors
CRC: Enable or disable alarming of checksum errors for tables
PCR: Enable or disable alarming of Program Clock Reference errors
PCR - Maximum interval (ms):
The maximum interval between reception of PCR values.
Default: 40 ms
PCR - Discontinuity threshold (ms):
The maximum change in the PCR value between two adjoining PCR values (where the discontinuity indicator flag has not been set).
Default: 100 ms
PCR Accuracy: Enable or disable alarming of PCR Accuracy (PCR Jitter) errors
PCR Accuracy - Jitter threshold
(ms):
The maximum allowed PCR jitter.
Default: 500 ms
PTS: Enable or disable alarming of Presentation Time Stamp errors
PTS - Maximum interval (ms):
The maximum allowed interval between the reception of two PTS values.
Default: 700 ms
CAT: Enable or disable alarming of Conditional Access Table errors
CAT - Maximum interval (ms):
The maximum allowed section repetition interval for the CAT table.
Default: 500 ms
Note that if both PCR checks are disabled in an ETR thresholds template the PCR for the associated streams will not be processed and the ETR 290 - PCR view will not display data for these streams.
VB20 IP-PROBE USERS' MANUAL VERSION 4.92011 © BRIDGE Technologies Co AS - Bentsebrugata 20 - N-0476 Oslo, Norway - tel: +47 22 38 51 00 - www.bridgetech.tv
90

ETR Thresholds - Priority 3:
NIT: Enable or disable alarming of Network Information Table errors.
Only relevant when DVB mode is selected.
NIT - Maximum interval Actual
(ms):
The maximum allowed section repetition interval for the NIT Actual table.
Default: 10 s
NIT - Maximum interval Other
(ms):
The maximum allowed section repetition interval for the NIT Other table.
Default: 10 s
NIT - Require network id:
If enabled the probe will require that the network ID found in the NIT matches the configured value.
Default: Disabled
NIT - Require original network id:
If enabled the probe will require that the original network ID found in the NIT matches the configured value.
Default: Disabled
NIT - Min. num. transport streams:
The minimum number of transport streams that must be present in the NIT. Set to 0 to disable this check.
Default: 0
NIT - Cable descriptor:
If set to 'Required' an alarm will be generated if a Cable descriptor is not present in the NIT for the monitored frequency. Similarly if set to 'Not allowed', an alarm will be generated if the Cable descriptor is present.
Default: Optional
NIT - Satellite descriptor:
If set to 'Required' an alarm will be generated if a Satellite descriptor is not present in the NIT for the monitored frequency. Similarly if set to 'Not allowed', an alarm will be generated if the Satellite descriptor is present.
Default: Optional
NIT - Terrestrial descriptor:
If set to 'Required' an alarm will be generated if a Terrestrial descriptor is not present in the NIT for the monitored frequency. Similarly if set to 'Not allowed', an alarm will be generated if the Terrestrial descriptor is present.
Default: Optional
NIT - Compare with reference
NIT:
If enabled the NIT will be compared with the NIT on the reference frequency, and an alarm will be generated if a mismatch is found. The first frequency in the tuning list will be used as the reference frequency. Both the CRC values of the different sections and the number of sections must be identical.
Default: Disabled
SI Repetition Rate: Enable or disable alarming of SI Repetition Rate errors.
Unreferenced PID: Enable or disable alarming of Unreferenced PID errors.
VB20 IP-PROBE USERS' MANUAL VERSION 4.92011 © BRIDGE Technologies Co AS - Bentsebrugata 20 - N-0476 Oslo, Norway - tel: +47 22 38 51 00 - www.bridgetech.tv
91

SDT: Enable or disable alarming of Service Description Table errors.
Only relevant when DVB mode is selected.
SDT - Maximum interval Actual
(ms):
The maximum allowed section repetition interval for the SDT Actual table.
Default: 2 000 ms
SDT - Maximum interval Other
(ms):
The maximum allowed section repetition interval for the SDT Other table.
Default: 10 000 ms
SDT - Minimum gap interval (ms):
The minimum allowed section gap interval for the SDT table.
Default: 25 ms
SDT - Verify SDT against PAT:
If enabled an alarm will be generated if a service found in the PAT is not listed in the SDT.
Default: Disabled
SDT - Require service name:
If enabled an alarm will be generated if a service found in the PAT does not have a service name or if the service name is empty.
Default: Disabled
SDT - Require BAT Presence:
If enabled an alarm will be generated if BAT is not present in the stream.
Default: Disabled
EIT: Enable or disable alarming of Event Information Table errors.
Only relevant when DVB mode is selected.
EIT - Maximum interval Actual
(ms):
The maximum allowed section repetition interval for the EIT Actual table.
Default: 2 000 ms
EIT - Minimum gap interval (ms):
The minimum allowed section gap interval for the EIT tables.
Default: 25 ms
EIT - Required Table IDs:
If one or more table IDs are specified an alarm will be generated if these table IDs are not present in the stream on the EIT PID. Entries should be separated by commas, or a range may be specified. Example: '78,79,80-85'
Default: Disabled
RST: Enable or disable alarming of Running Status Table errors.
Only relevant when DVB mode is selected.
TDT: Enable or disable alarming of Time Date Table errors.
Only relevant when DVB mode is selected.
TDT - Maximum interval (ms):
The maximum allowed section repetition interval for the TDT and TOT tables.
Default: 30 000 ms
VB20 IP-PROBE USERS' MANUAL VERSION 4.92011 © BRIDGE Technologies Co AS - Bentsebrugata 20 - N-0476 Oslo, Norway - tel: +47 22 38 51 00 - www.bridgetech.tv
92

TDT - Require TOT presence:
Check this checkbox if TOT presence is required.
Default: disabled
MGT: Enable or disable alarming of Master Guide Table errors.
Only relevant when ATSC mode is selected.
MGT - Maximum interval (ms):
The maximum allowed section repetition interval for the MGT table.
Default: 150ms
VCT: Enable or disable alarming of Virtual Channel Table errors.
Only relevant when ATSC mode is selected.
Require TVCT: Require presence of the Terrestrial Virtual Channel Table.
Require CVCT: Require presence of the Cable Virtual Channel Table.
VCT - Maximum interval (ms):
The maximum allowed section repetition interval for the VCT table.
Default: 400ms
PIM/PNM: Enable or disable alarming of Program Information Message and Program Name Message tables.
Only relevant when ATSC mode is selected.
Require PIM: Require presence of the Program Information Message table.
Maximum interval PIM (ms):
The maximum allowed section repetition interval for the PIM table.
Default: 500ms
Require PNM: Require presence of the Program Name Message table.
Maximum interval PNM (ms):
The maximum allowed section repetition interval for the PNM table.
Default: 1000ms
RRT: Enable or disable alarming of Rating Region Table errors.
Only relevant when ATSC mode is selected.
RRT - Maximum interval (ms):
The maximum allowed section repetition interval for the RRT table.
Default: 30000ms
ATSC EIT: Enable or disable alarming of ATSC Event Information Table errors.
Only relevant when ATSC mode is selected.
ATSC EIT - Maximum interval
EIT-0 (ms):
The maximum allowed section repetition interval for the ATSC EIT-0 table.
Default: 500ms
EIT - Maximum interval EIT-1 to
EIT-3 (ms):
The maximum allowed section repetition interval for the ATSC EIT-1 to EIT-3 tables.
Default: 5000ms
EIT - Maximum interval EIT-4 to
EIT-127 (ms):
The maximum allowed section repetition interval for the ATSC EIT-4 to EIT-127 tables.
Default: 30000ms
VB20 IP-PROBE USERS' MANUAL VERSION 4.92011 © BRIDGE Technologies Co AS - Bentsebrugata 20 - N-0476 Oslo, Norway - tel: +47 22 38 51 00 - www.bridgetech.tv
93

ETT: Enable or disable alarming of Extended Text Table errors.
Only relevant when ATSC mode is selected.
ETT - Maximum interval ETT-0
(ms):
The maximum allowed section repetition interval for the ATSC ETT-0 table.
Default: 2000ms
ETT - Maximum interval ETT-1 to
ETT-3 (ms):
The maximum allowed section repetition interval for the ATSC ETT-1 to ETT-3 tables.
Default: 5000ms
ETT - Maximum interval ETT-4 to
ETT-127 (ms):
The maximum allowed section repetition interval for the ATSC ETT-4 to ETT-127 tables.
Default: 30000ms
STT: Enable or disable alarming of System Time Table errors.
Only relevant when ATSC mode is selected.
STT - Maximum interval (ms):
The maximum allowed section repetition interval for the STT table.
Default: 1000ms
VB20 IP-PROBE USERS' MANUAL VERSION 4.92011 © BRIDGE Technologies Co AS - Bentsebrugata 20 - N-0476 Oslo, Norway - tel: +47 22 38 51 00 - www.bridgetech.tv
94

ETR Thresholds - Other checks:
CA system checks: Enable or disable alarming of Conditional Access System errors.
CA system checks - Maximum ECM interval (ms):
The maximum allowed ECM repetition interval
Default: 500 ms
CA system checks - Maximum ECM change period (ms):
The maximum time allowed between ECM changes
Default: 25000ms
CA system checks - Minimum avg. EMM bitrate (bps):
The minimum allowed average EMM bitrate
Default: 1000 bps
CA system checks - EMM bitrate average period (s):
The averaging period used to calculate EMM bitrate. Note that the average period must be at least 20s less than the round-robin tuning period, e.g. with a round-robin tuning period of 70s the maximum EMM bitrate average period is 50s.
Default: 10s
CA system checks - Maximum control word period (ms):
The maximum allowed control word period (the maximum time that can go by without a change in the scrambling control bits for scrambled PIDs)
Default: 25 000 ms
PID checks: Enable or disable alarming of PID minimum bitrate, maximum bitrate, presence errors and scrambling/clear required.
Service checks: Enable or disable alarming of service minimum bitrate, maximum bitrate, service presence, scrambling/clear required, service type, service name and service ID errors. Requirements are specified in the service threshold template associated with the stream.
Service checks - Only allow services listed in service
template:
Check this box to enable service ID checks against the service ID list specified in the service threshold template associated with the stream.
VB20 IP-PROBE USERS' MANUAL VERSION 4.92011 © BRIDGE Technologies Co AS - Bentsebrugata 20 - N-0476 Oslo, Norway - tel: +47 22 38 51 00 - www.bridgetech.tv
95

ETR Thresholds - Interface checks:
Pre FEC bit error rate
check:
If enabled an alarm will be raised provided that the pre FEC BER measured is above the demodulator threshold value associated with the stream.
Not relevant for VB20.
Post FEC bit error rate
check:
If enabled an alarm will be raised provided that the post FEC BER measured is above the demodulator threshold value associated with the stream.
Not relevant for VB20.
Modulation error ratio
check:
If enabled an alarm will be raised provided that the MER measured is above the demodulator threshold value associated with the stream.
Not relevant for VB20.
Signal to noise ratio check:
If enabled an alarm will be raised provided that the SNR measured is below the demodulator threshold value associated with the stream.
Not relevant for VB20.
Signal strength check:
If enabled an alarm will be raised provided that the signal level measured is below the minimum signal strength threshold value or above the maximum signal strength threshold value associated with the stream.
Not relevant for VB20.
SFN drift check: Enable or disable alarming of SFN drift errors.
Not relevant for VB20.
SFN drift check - Monitor SFN
Drift, max drift (100ns):
Check the Monitor SFN Drift box to enable SFN drift monitoring, and set the drift alarm threshold (in steps of 100ns, i.e. 100 indicates a threshold of 100*100ns).
Default: disabled and 100 = 10000ns
Not relevant for VB20.
SFN drift check - Drift zero
adjust (100ns):
SFN drift zero adjustment to compensate for delays in transmitter and receiver equipment. When an optimal system is configured the Drift zero adjust figure should be set to yield an SFN drift figure of zero in the COFDM - Status view.
Not relevant for VB20.
Center frequency check:
Enable or disable alarming of center frequency inaccuracy with reference to QAM threshold settings.
Not relevant for VB20.
Symbol Rate check:
Enable or disable alarming of symbol rate inaccuracy with reference to QAM threshold settings.
Not relevant for VB20.
Packet error count check:
Enable or disable alarming of one or more erroneous packets after FEC.
Not relevant for VB20.
Input overflow check:
If enabled an alarm will be raised provided input overflow is detected.
VB20 IP-PROBE USERS' MANUAL VERSION 4.92011 © BRIDGE Technologies Co AS - Bentsebrugata 20 - N-0476 Oslo, Norway - tel: +47 22 38 51 00 - www.bridgetech.tv
96

6.8.10 ETR 290 - PID thresh.
The PID thresholds make it possible to define detailed conditions for alarm triggering on a PID or PID type basis. There is one predefined PID threshold template that cannot be edited by the operator: 'Default'. The 'Default' PID threshold template contains no PID definitions and therefore will never trigger any alarms.
By associating scheduling templates to checks it is possible to disable alarming at pre-selected time intervals. Scheduling templates are defined in the Setup - Scheduling view and will be available from a selection drop-down menu for some of the checks.
In the 'PID Thresholds' table, the 'Refs' column shows how many streams are associated with each threshold template.
There are two different ways of creating user-defined thresholds. To create a new threshold template from scratch the operator should click the Add new threshold template button. A pop-up window will appear allowing the user to define alarm conditions. Another way of creating a user-defined threshold template is by highlighting one of the templates already defined and then click the Duplicate highlighted button.
Deleting a PID threshold template is done by highlighting the threshold template that should be removed and clicking Delete highlighted. Note that if the deleted threshold template was assigned to a stream being monitored, the new threshold for that stream will default to the predefined Default threshold template.
VB20 IP-PROBE USERS' MANUAL VERSION 4.92011 © BRIDGE Technologies Co AS - Bentsebrugata 20 - N-0476 Oslo, Norway - tel: +47 22 38 51 00 - www.bridgetech.tv
97

The PID threshold template has the following settings:
Edit PID Threshold:
Name: The name of the PID threshold template
Description: Text field that should contain a meaningful description of the threshold template
PID Threshold Parameters:
Selection: The user selects if the requirements should apply for a specific PID or for all PIDs of a specified type. Note that the PID type detection depends on correct PSI/SI/PSIP signalling.
PID: The PID for which the specified requirements apply. If a PID type is selected in the 'Match' column this field will update to read N/A when the Apply changes button is clicked.
Description: A text field describing the PID or PID type requirement
Require pres.: If this field is checked an alarm will be raised provided that the specified PID is not present in the transport stream. Note that this check is only available for specified PIDs and not for PID types.
Monitor min BW:
An alarm is raised if the PID bandwidth goes below the specified minimum bandwidth (bandwidth in kbit/s or Mbit/s) and monitoring is enabled.
Monitor max BW:
An alarm is raised if the maximum PID bandwidth specified is exceeded (bandwidth in kbit/s or Mbit/s) and monitoring is enabled.
Ignore CC: Select a scheduling template different from 'Never' for the probe to ignore CC errors for the specified PID or PID type.
Ignore missing: Select a scheduling template different from 'Never' for the probe to ignore that the specified PID or PID type is signalled in PSI but missing in the stream.
Ignore unref.: Select a scheduling template different from 'Never' for the probe to ignore that the specified PID is present in the stream but unreferenced in PSI.
Ignore all: Select a scheduling template different from 'Never' for the probe to ignore all errors for a specified PID or PID type.
Scrambling: An alarm will be raised provided that the specified PID is scrambled when 'require clr' has been selected. Similarly an alarm will be raised if the specified PID is clear when 'require scr' has been selected. The default setting is to ignore whether the PID or PID type is scrambled or not.
VB20 IP-PROBE USERS' MANUAL VERSION 4.92011 © BRIDGE Technologies Co AS - Bentsebrugata 20 - N-0476 Oslo, Norway - tel: +47 22 38 51 00 - www.bridgetech.tv
98

6.8.11 ETR 290 - Service thresh.
The Service thresholds make it possible to define detailed conditions for alarm triggering on a per-service basis. There is one predefined service threshold template that cannot be edited by the operator: Default. The Default service threshold template contains no service definitions and therefore will never trigger any alarms.
By associating scheduling templates to service threshold templates it is possible to disable alarming at pre-selected time intervals. Scheduling templates are defined in the Setup - Scheduling view and will be available from the schedule drop-down menu.
In the 'Service Thresholds' table, the 'Refs' column shows how many streams are associated with each threshold template.
There are two different ways of creating user-defined thresholds. To create a new threshold template from scratch the operator should click the Add new threshold button. A pop-up window will appear allowing the user to define alarm conditions. Another way of creating a user-defined threshold template is by highlighting one of the templates already defined and then click the Duplicate highlighted button.
Deleting a service threshold template is done by highlighting the template that should be removed and clicking Delete highlighted. Note that if the deleted threshold template was assigned to a stream being monitored, the new threshold template for that stream will default to the Default template.
VB20 IP-PROBE USERS' MANUAL VERSION 4.92011 © BRIDGE Technologies Co AS - Bentsebrugata 20 - N-0476 Oslo, Norway - tel: +47 22 38 51 00 - www.bridgetech.tv
99

The Service threshold template has the following settings:
Edit Service Threshold:
Name: The name of the ETR threshold template
Description: Text field that should contain a meaningful description of the threshold
Service Threshold Parameters:
Selection: The user selects if the requirements should apply for a specific service ID, for all services of a specified type or for a service with a specified service name. Note that the service type detection depends on correct PSI/SI/PSIP signalling.
ID: The service ID value
Monitor name: A text string may be specified that should match the service name of the associated service ID, as analysed from the received SDT. Note that the check is case sensitive. An alarm will be raised if there is not a perfect match.
Require presence:
If this field is checked an alarm will be raised provided that the specified service is not present in the stream. This check only requires that the service is present in the PAT, the other ETR checks will give alarms if there are other problems with the service, such as missing PMT or missing components. Note that this check is only available for specified services and not for service types.
Monitor min BW:
If enabled an alarm is raised provided that the minimum service bandwidth goes below the specified bandwidth (in kbit/s or Mbit/s).
Monitor max BW:
If enabled an alarm is raised provided that the maximum service bandwidth specified (in kbit/s or Mbit/s) is exceeded.
Report name: It is possible to define the service name that should be used for alarm traps and for alarm reporting to the VideoBridge Controller. This can be convenient to be able to track a service that changes name (as signalled in PSI/SI) in the signal chain. Note that this functionality will only work for services specified by service ID or by name (specified in the Selection column).
Scrambling: If a value different from 'Ignore' is selected an alarm will be raised if the service scrambling status differs from the requirement. A service is considered scrambled if one of its components is scrambled.
Service type: If a value different from 'Ignore' is selected it should match the service type detected by analysing the received SDT. An alarm will be raised if the service types differ.
Schedule: The Schedule drop-down menu allows the user to associate a scheduling scheme to a service or service type, in effect masking alarms during selected intervals. Scheduling templates are defined in the Setup - Scheduling view. The predefined scheduling templates 'Never' and 'Always' will always be selectable, and these will result in service alarms never and always being masked, respectively. Note that if a PID is shared between several services and alarm masking is defined for one of the services, no alarms will be raised due to errors affecting this PID.
VB20 IP-PROBE USERS' MANUAL VERSION 4.92011 © BRIDGE Technologies Co AS - Bentsebrugata 20 - N-0476 Oslo, Norway - tel: +47 22 38 51 00 - www.bridgetech.tv
100

Note that it is possible to create a service threshold template that allows probe alarming if a new service appears in a stream. This is done by creating a threshold template listing the service IDs that are allowed to be present in a stream, and associating it to the stream. A complementary ETR threshold template should be created, that has the 'Only allow services listed in service template' check enabled. This ETR threshold template should also be associated with the stream.
6.9 ASIThumbnails of ASI services are accessed from the ETR 290 - Services view.
6.9.1 ASI Status
The ASI view displays an overview of the ASI input signal contents, in addition to listing the threshold templates currently assigned to the ASI signal. Additional ASI measurements are found in Compare and ETR 290 views. If an optional VB242 ASI interface module is present in the chassis, the ASI tab will be labelled ASI 1.
VB20 IP-PROBE USERS' MANUAL VERSION 4.92011 © BRIDGE Technologies Co AS - Bentsebrugata 20 - N-0476 Oslo, Norway - tel: +47 22 38 51 00 - www.bridgetech.tv
101

ASI status - Stream info:
Status: Bulb indicating whether there is ASI sync or not. Green colour indicates sync whereas red indicates no sync. Grey colour shows that the ASI input is disabled.
Packet length: Indicates if the transport stream packets are 188 or 204 bytes
Original Network ID: The original network ID as specified in the NIT table
Network ID: The network ID as specified in the NIT table
Transport Stream ID: The transport stream ID as specified in the PAT table
Total Bitrate: Total transport stream bitrate
Effective Bitrate: Transport stream bitrate excluding null packets (PID 8191)
1 PPS input lock: Bulb indicating whether there is 1 PPM input lock or not. Green colour indicates lock whereas red indicates no lock.
Not relevant for VB20.
SFN drift: The ASI SFN drift measured, with the configured SFN drift zero offset subtracted
Not relevant for VB20.
ASI status - ASI config info:
Name: The name of the ASI transport stream as defined in the ASI – Setup view
ETR thresholds: The name of the ETR threshold template assigned to the ASI transport stream
PID thresholds: The name of the PID threshold template assigned to the ASI transport stream
Service thresholds: The name of the Service threshold template assigned to the ASI transport stream
VBC thresholds: The name of the VBC threshold template assigned to the ASI transport stream
VB20 IP-PROBE USERS' MANUAL VERSION 4.92011 © BRIDGE Technologies Co AS - Bentsebrugata 20 - N-0476 Oslo, Norway - tel: +47 22 38 51 00 - www.bridgetech.tv
102

6.9.2 ASI - Setup
The ASI - Setup view enables selection of thresholds for the ASI input transport stream. In addition a name is assigned to the ASI stream. When changes have been made in the ASI - Setup view the Apply changes button should be clicked for the changes to take effect.
ASI status - ASI config info:
Name: A user specified name for the ASI transport stream
ETR thresholds: The name of the ETR threshold template assigned to the ASI transport stream
PID thresholds: The name of the PID threshold template assigned to the ASI transport stream
Service thresholds: The name of the Service threshold template assigned to the ASI transport stream
VBC thresholds: The name of the VBC threshold template assigned to the ASI transport stream
Disable: Check the box to disable ASI monitoring and alarming.
VB20 IP-PROBE USERS' MANUAL VERSION 4.92011 © BRIDGE Technologies Co AS - Bentsebrugata 20 - N-0476 Oslo, Norway - tel: +47 22 38 51 00 - www.bridgetech.tv
103

6.10 FSMFull Service Monitoring (FSM) allows easy validation of any server reachable by the probe via Ethernet. The servers may be probed by either sending an ICMP Echo Request packet (also known as Ping) or performing an HTTP Get request.
Up to 10 services may be defined and each service will be checked at regular intervals. Any errors will be logged. An error is defined as no reply within 5 seconds for the Ping option or no, or incorrect, reply within 5 seconds for the HTTP option. If there are more consecutive errors than a fails threshold value an alarm will be raised.
6.10.1 FSM - Monitor
The following parameters are continuously monitored for each service:
Status: Current alarm status. Red = active alarm, Green=No alarm
Name: User defined service name
Protocol: Type of protocol. HTTP or Ping
IP address: IP address. Must be numeric, host name is not accepted
Ok: Total number of valid checks
Fail: Total number of invalid checks
Max: Maximum response time recorded
Min Minimum response time recorded
Current: The current (most recent) response time
Timer: Button to reset and immediately restart the service
State: Current state of the service. The states are: "Disabled", "Waiting to send", "Waiting for reply", "Got reply" and "Reset".
For convenience a manual ping field is located below the status table. By entering a valid IP address (not host name) and clicking the "ping now" button an arbitrary server may be pinged.
VB20 IP-PROBE USERS' MANUAL VERSION 4.92011 © BRIDGE Technologies Co AS - Bentsebrugata 20 - N-0476 Oslo, Norway - tel: +47 22 38 51 00 - www.bridgetech.tv
104

The Clear all button will clear accumulated data for all enabled FSM services, but active alarms will not be removed.
Clicking the Traceroute button will open a new window, allowing the user to trace the network route to a specified IP address.
6.10.2 FSM - Setup
Each of the 10 FSM services may be defined or edited by clicking on the corresponding Edit button in the left hand table.
The probe supports ping and generic HTTP-Get protocols for online status verification of arbitrary targets. After completing configuration of the selected service Apply changes must be pressed to save and apply the changes.
VB20 IP-PROBE USERS' MANUAL VERSION 4.92011 © BRIDGE Technologies Co AS - Bentsebrugata 20 - N-0476 Oslo, Norway - tel: +47 22 38 51 00 - www.bridgetech.tv
105

These fields are common for both the ping and the HTTP-Get protocols:
Enable: Enable by checking toggle button.
Name: User-defined name of service
Protocol: Select between ping and HTTP.
Probe cycle: Time interval in seconds to wait between each activation. A value below 30 is not recommended.
Fails threshold: The number of consecutive errors needed to raise an alarm
Hostname: The IP address for the target. Host names are supported for HTTP.
Comment: Optional comment field – maximum 100 characters
These fields are specific for the HTTP-Get protocol:
Http://<IP address>: The request to send to the target, for example index.html
Expect word reply: A case sensitive word or sentence to be expected in the reply. To find a suitable string, use the Show content link.
Leave this field empty to let the probe ignore the contents of the reply.
Last reply: The last reply Show content link points to the last HTML file that was generated by this service.
Port: The port used by the target server, often 80 for HTTP requests
Support cookies: If enabled, the HTTP-Get request will remember cookies returned by the target and provide them in subsequent requests.
VB20 IP-PROBE USERS' MANUAL VERSION 4.92011 © BRIDGE Technologies Co AS - Bentsebrugata 20 - N-0476 Oslo, Norway - tel: +47 22 38 51 00 - www.bridgetech.tv
106

6.11 Setup
6.11.1 Setup - Params
The Parameters page contains the following settings:
Various
Probe-name: Each probe can be assigned a user defined name. This name is shown in the Summary page which is the probe default page. The probe name is displayed in the browser's title line.
Probe location: The probe location is part of the probe's MIB, and this parameter is relevant for SNMP use only. The probe location is displayed in the browser's title line.
Enable thumbnails: For high bitrates (above 700 Mbit/sec) the probe may feel more responsive if thumbnail picture generation is switched off. This does not affect the accuracy of the measurements.
Alarms
Freeze log when full: When enabled the alarm list will freeze when full (an event will show that it is full). When the list is full new alarms are ignored until Clear alarms is pressed.
This can sometimes be useful if a unit is placed unattended.
Treat events as alarms: When enabled each event is treated as an alarm that is active for 5 seconds. This may be useful when reporting to external systems that do not support events but only active or cleared alarms. This setting affects the local alarm lists and SNMP traps.
VB20 IP-PROBE USERS' MANUAL VERSION 4.92011 © BRIDGE Technologies Co AS - Bentsebrugata 20 - N-0476 Oslo, Norway - tel: +47 22 38 51 00 - www.bridgetech.tv
107

Network settings
Promiscuous network mode:
The probe will only be able to detect additional multicasts if the Ethernet interface is set in promiscuous mode. With this option set to “off” the probe will not be able to detect multicasts not already joined by the probe. The probe load increases when this option is enabled since more packets are inspected.
Join multicasts: If switched off probe will not send IGMP messages which is useful if connected to a trunk port and there is no need to join multicasts.
Source specific multicasts:
Required for probe to support the IGMP v3 protocol.
Time synchronisation
Use time server: Select between Off, NTP (Ethernet), TDT (ASI) and TOT (ASI).
When NTP is selected the probe will synchronise approximately every 7 minutes. The exact interval is a function of the probe's MAC address to ensure that all probes do not access the NTP server at the same time.
When TDT time synchronisation is enabled the probe will use the UTC time found in the TDT table and add the configured local time offset. For VB20 the ASI input will be used as the clock source.
When TOT time synchronisation is enabled the probe will use the UTC time found in the TOT table and add the local time offset specified by the parameter TOT time zone. For VB20 the ASI input will be used as the clock source.
Time server: The IP-address or host name of the time server.
Time zone: By setting the time zone the probe-time can be offset from the reference NTP time.
TOT time zone: The local time zone to be used when TOT is selected as clock reference source. This is a three letter country code that should match a country code present in the received TOT. Note that this parameter is case sensitive. If the TOT time zone field is left blank the first time zone specified in the TOT will be used, and this time zone will also be used if the probe is unable to find the specified country code in the TOT. For countries with more than one time zone the region ID is specified by adding a colon and the region ID to the country code (e.g. 'USA:2' for country USA and region ID 2).
VB20 IP-PROBE USERS' MANUAL VERSION 4.92011 © BRIDGE Technologies Co AS - Bentsebrugata 20 - N-0476 Oslo, Norway - tel: +47 22 38 51 00 - www.bridgetech.tv
108

802.1Q VLAN tagging
Enable on eth0: If enabled probe will use VLAN tagging for the data/monitoring interface eth0. Changing this parameter requires the probe to reboot to take effect.
Native VLAN ID: Provided Enable on eth0 is enabled, the probe will send and receive traffic on the VLAN-ID entered here.
Force all VLANs: If enabled together with Enable on eth0 the probe will see all VLAN tagged traffic and not only traffic with the Native VLAN ID tag. The Mon/Detect list will be able to detect and list all VLAN tagged traffic. Note that the probe will only issue IGMP messages on the native VLAN ID, and traffic tagged differently must be present at the interface to be detected.
SNMP
Community string: The probe SNMP community string can be changed.
Trap destination 1-3: SNMP traps will be sent to the specified destinations. Set to 0.0.0.0 to disable SNMP trap transmission.
6.11.2 Setup - Pages
The Setup – Pages view allows names to be associated with different pages. This facilitates navigation in the Mon views.
VB20 IP-PROBE USERS' MANUAL VERSION 4.92011 © BRIDGE Technologies Co AS - Bentsebrugata 20 - N-0476 Oslo, Norway - tel: +47 22 38 51 00 - www.bridgetech.tv
109

6.11.3 Setup - Time
The time of the probe is used to timestamp events in the alarm list. The local time is always presented just below the alarm list.
The probe time should not be set manually if the probe is synchronising against a time server (refer to the Setup - Params view).
6.11.4 Setup - Ethernet
The Ethernet setup menu defines the Ethernet setup parameters for the management interface (eth2) and the data/video interface (eth0). The link statuses for the two interfaces are updated live to reflect the current settings. All changes except changes to Speed, Medium and Duplex require a reboot to take effect. Rebooting the probe from this page is achieved by clicking the Reboot button after changes have been confirmed by clicking the Apply button. Click the IPv6 Settings button to access the IPv6 view.
VB20 IP-PROBE USERS' MANUAL VERSION 4.92011 © BRIDGE Technologies Co AS - Bentsebrugata 20 - N-0476 Oslo, Norway - tel: +47 22 38 51 00 - www.bridgetech.tv
110
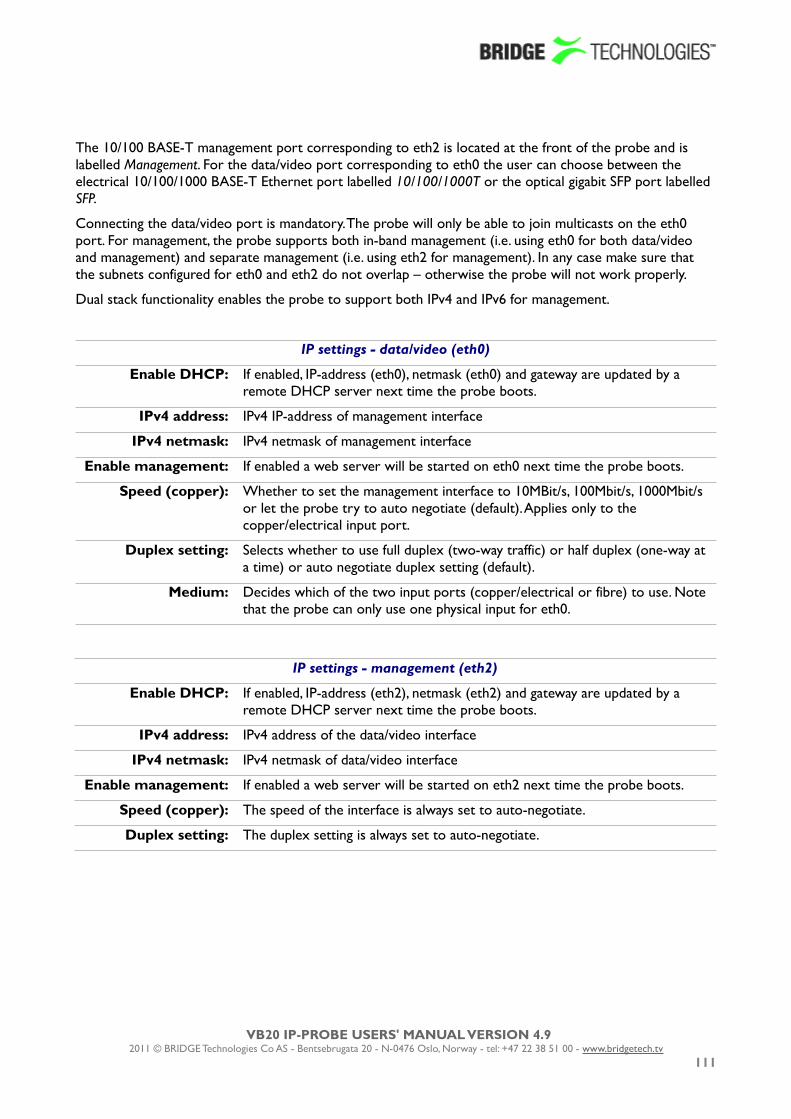
The 10/100 BASE-T management port corresponding to eth2 is located at the front of the probe and is labelled Management. For the data/video port corresponding to eth0 the user can choose between the electrical 10/100/1000 BASE-T Ethernet port labelled 10/100/1000T or the optical gigabit SFP port labelled SFP.
Connecting the data/video port is mandatory. The probe will only be able to join multicasts on the eth0 port. For management, the probe supports both in-band management (i.e. using eth0 for both data/video and management) and separate management (i.e. using eth2 for management). In any case make sure that the subnets configured for eth0 and eth2 do not overlap – otherwise the probe will not work properly.
Dual stack functionality enables the probe to support both IPv4 and IPv6 for management.
IP settings - data/video (eth0)
Enable DHCP: If enabled, IP-address (eth0), netmask (eth0) and gateway are updated by a remote DHCP server next time the probe boots.
IPv4 address: IPv4 IP-address of management interface
IPv4 netmask: IPv4 netmask of management interface
Enable management: If enabled a web server will be started on eth0 next time the probe boots.
Speed (copper): Whether to set the management interface to 10MBit/s, 100Mbit/s, 1000Mbit/s or let the probe try to auto negotiate (default). Applies only to the copper/electrical input port.
Duplex setting: Selects whether to use full duplex (two-way traffic) or half duplex (one-way at a time) or auto negotiate duplex setting (default).
Medium: Decides which of the two input ports (copper/electrical or fibre) to use. Note that the probe can only use one physical input for eth0.
IP settings - management (eth2)
Enable DHCP: If enabled, IP-address (eth2), netmask (eth2) and gateway are updated by a remote DHCP server next time the probe boots.
IPv4 address: IPv4 address of the data/video interface
IPv4 netmask: IPv4 netmask of data/video interface
Enable management: If enabled a web server will be started on eth2 next time the probe boots.
Speed (copper): The speed of the interface is always set to auto-negotiate.
Duplex setting: The duplex setting is always set to auto-negotiate.
VB20 IP-PROBE USERS' MANUAL VERSION 4.92011 © BRIDGE Technologies Co AS - Bentsebrugata 20 - N-0476 Oslo, Norway - tel: +47 22 38 51 00 - www.bridgetech.tv
111

Global settings
DHCP: Use gateway from:
If DHCP is enabled for both eth0 (data/video) and eth2 (management), the user must specify which input should be used as a source for the gateway address.
IPv4 Gateway: Required to allow clients with an address outside the probe subnets to access the probe (HTTP, FTP, TELNET, SNMP). It is also required for the probe to access an NTP server or VBC server with IP-address outside the probe’s subnets. If DHCP is enabled, this field is disabled, and the gateway provided by the DHCP server is used.
DNS Server: If DHCP is not enabled, this field can be used to define the IP address of the DNS server. If DHCP is enabled, this field is disabled, and the gateway provided by the DHCP server is used.
IPv6 Settings
IPv6 settings – data/video (eth0)
Enable IPv6: If IPv6 is enabled, the probe will use IPv6 for management on eth0.
Enable IPv6 autoconf:
If IPv6 auto-configuration is enabled, the probe will receive IPv6 address, IPv6 prefix and gateway address from a network router when booting.
Note that auto-configuration should only be enabled for one of the Ethernet ports to avoid possible conflicts.
IPv6 address: If IPv6 auto-configuration is not enabled, this field is used to define the IPv6 address of the probe.
IPv6 prefix: If IPv6 auto-configuration is not enabled, this field is used to define the IPv6 prefix of the probe (corresponding to netmask for IPv4).
VB20 IP-PROBE USERS' MANUAL VERSION 4.92011 © BRIDGE Technologies Co AS - Bentsebrugata 20 - N-0476 Oslo, Norway - tel: +47 22 38 51 00 - www.bridgetech.tv
112

IPv6 settings – management (eth2)
Enable IPv6: If IPv6 is enabled, the probe will use the management port for IPv6 management
Enable IPv6 autoconf:
If IPv6 auto-configuration is enabled, the probe will receive IPv6 address, IPv6 prefix and gateway address from a network router when booting.
Note that auto-configuration should only be enabled for one of the Ethernet ports to avoid possible conflicts.
IPv6 address: If IPv6 auto-configuration is not enabled, this field is used to define the IPv6 address of the probe.
IPv6 prefix: If IPv6 auto-configuration is not enabled, this field is used to define the IPv6 prefix of the probe (corresponding to netmask for IPv4).
Global settings
IPv6 Gateway: Required to allow clients with an address outside the probe subnets to access the probe (HTTP, FTP, TELNET, SNMP). It is also required for the probe to access an NTP server or DNS server with IPv6 address outside the probe’s subnets. If IPv6 auto-configuration is enabled, this field is disabled.
Example 1 – Separate Management IPv4
This model is useful if the management traffic is to be separated from the data/video traffic by utilising two completely disjointed networks. In this example the management subnet is defined as 192.168.0.0/16 and the data/video subnet is 10.0.30.0/24.
Parameter Management (eth2)
Data/video (eth0)
Explanation
Enable DHCP Optional Optional Use DHCP to configure the eth2 and/or eth0 interface automatically
IP address 192.168.7.5 10.0.30.5 The IP-addresses of each interface
Netmask 255.255.0.0 255.255.255.0 The netmasks – 16 and 24 bits
Enable management
Yes No Only run web server on the management interface
Gateway 192.168.0.1 - The default gateway is required for the probe to connect to devices that are not on the same subnet
VB20 IP-PROBE USERS' MANUAL VERSION 4.92011 © BRIDGE Technologies Co AS - Bentsebrugata 20 - N-0476 Oslo, Norway - tel: +47 22 38 51 00 - www.bridgetech.tv
113

Example 2 – In-Line Management IPv4
This model is useful if there is no separate management network and both data/video and management traffic are to use the same network. In this configuration the probe’s management network may not even be connected. Even if the probe’s management port is not to be used it must be configured carefully so that it does not interfere with the data/video interface.
In this example there is only one network defined as 10.0.30.0/24.
Parameter Management (eth2)
Data/video (eth0)
Explanation
Enable DHCP Off Optional We cannot use DHCP for eth2 since the device is not used
IP-address 0.0.0.0 10.0.30.5 The IP-addresses of each interface – configure eth2 to a non-existing address
Netmask 255.255.255.255 255.255.255.0 The netmasks – the subnet for eth2 contains only one address
Enable management
No Yes Only run web server on the data/video interface
Gateway - 10.0.30.1 The default gateway is required for the probe to connect to devices that are not on the same subnet
Example 3 – Mixed Mode IPv4
This model is similar to the separate management model with the difference that a web server is also run on the data/video management.
Since there is only one default gateway, in this case pointing to the management network, clients accessing the probe via the data/video interface need to be on the same subnet as the probe’s data/video interface.
Parameter Management (eth2)
Data/video (eth0)
Explanation
Enable management
Yes Yes Run web server on both interfaces
The other settings are the same as in example 1
The principles shown in the previous examples also apply for IPv6 management. IPv4 and IPv6 can be used simultaneously. In theory the probe's web server can be accessed using four different IP addresses, provided that the network architecture allows it.
VB20 IP-PROBE USERS' MANUAL VERSION 4.92011 © BRIDGE Technologies Co AS - Bentsebrugata 20 - N-0476 Oslo, Norway - tel: +47 22 38 51 00 - www.bridgetech.tv
114

6.11.5 Setup - VBC
The VideoBridge Controller (VBC) can automatically detect the VB20 IP Probe and add it to the VBC equipment list, provided that the auto-detect functionality is enabled and the VBC server address is known to the probe. Note that the network must be transparent to traffic between the VBC server and probes for auto-detection to work.
If DHCP is used, the VBC server's DNS name may be typed in the VBC server address field. The IP address associated with the DNS name will be displayed.
If DHCP is not used, it is necessary to type the VBC server's IP address.
When changes have been made in the Setup – VBC view, click the Apply button for changes to take effect.
VB20 IP-PROBE USERS' MANUAL VERSION 4.92011 © BRIDGE Technologies Co AS - Bentsebrugata 20 - N-0476 Oslo, Norway - tel: +47 22 38 51 00 - www.bridgetech.tv
115

6.11.6 Setup - Login
By default, there is no access control and all users have access to all features. Access control can be enabled for the probe, restricting users to read-only access until they log in.
Any user can enable access control, but only users who are logged in can disable it or change the password.
When access control is activated a READ-ONLY access message is displayed under the alarm list for users that are not logged in. It will be necessary to log-in each time a web browser application is launched and pointed at the probe.
Log-in is performed by providing the correct password. The default password is elvis. The operator may define a new password that should be easy to remember.
VB20 IP-PROBE USERS' MANUAL VERSION 4.92011 © BRIDGE Technologies Co AS - Bentsebrugata 20 - N-0476 Oslo, Norway - tel: +47 22 38 51 00 - www.bridgetech.tv
116

Note that when logged in from the VBC, the VBC user's access rights apply.
6.11.7 Setup - ETR
The Setup - ETR view allows the user to select miscellaneous ETR handling modes.
VB20 IP-PROBE USERS' MANUAL VERSION 4.92011 © BRIDGE Technologies Co AS - Bentsebrugata 20 - N-0476 Oslo, Norway - tel: +47 22 38 51 00 - www.bridgetech.tv
117

Parsing rules for private descriptors
Probe recognition of a number of selected private descriptors may be defined by the user:
129 (0x81): 'Disabled' or 'AC-3 audio stream descriptor'
131 (0x83): 'Disabled' or 'logical channel descriptor v1'
134 (0x86): 'Disabled' or 'caption service descriptor'
135 (0x87): 'Disabled', 'logical channel descriptor v2' or 'content advisory descriptor'
161 (0xa1): 'Disabled', 'service location descriptor' or 'etv_bif_platform_descriptor'
162 (0xa2): 'Disabled' or 'etv_integrated_signaling_descriptor'
231 (0xe7): 'Disabled' or 'private cable delivery system descriptor'
233 (0xe9): 'Disabled' or 'ip_delivery_system_descriptor'
The default value for private descriptors is 'Disabled'. To change this value, select a new descriptor interpretation from the drop-down menu and click the Apply changes button.
ETR 290 tuning control
By default authorised users will be allowed to lock the ETR 290 analysis to one stream for an infinite length of time and unauthorised users will not be allowed to lock the analysis. The Setup - ETR view makes it possible to time limit the locking for authorised users and unauthorised users can be granted permission to lock to a stream for a selectable time period.
If the locking mechanism works in a time limited mode a clock icon is superimposed on the regular lock icon in the different ETR 290 subviews. When the specified lock time is out the round-robin cycling will resume. When ETR tuning control parameters have been changed, click the Apply button for changes to take effect.
VB20 IP-PROBE USERS' MANUAL VERSION 4.92011 © BRIDGE Technologies Co AS - Bentsebrugata 20 - N-0476 Oslo, Norway - tel: +47 22 38 51 00 - www.bridgetech.tv
118

ETR 290 RF level mode
The user selects how RF level should be displayed in demodulator views: dBm, dBuV or dBmV. This setting is not relevant for VB20.
dBm: in decibels relative to a reference value of 1mW
dBuV: in decibels relative to a reference value of 1µ V
dBmV: in decibels relative to a reference value of 1mV
VB262 name convention
The user may select how a VB262 demodulator should be named throughout the menu system. The default setting is 'QAM', however this may be changed to 'VSB' or 'RF', as appropriate. This setting is not relevant for VB20.
VB242 ASI mode
The user may select whether two inputs of an ASI input module should be permanently monitored, or if up to six inputs should be monitored sequentially in round-robin mode. This setting is not relevant for VB20.
ETR details
The user selects if service names should be displayed in the ETR 290 - ETR details view. Note that a large screen size is required for proper service name displaying.
EIT table IDs
The user defines which DVB EIT table IDs should be analysed by the probe. By default only table ID 78 (EIT p/f actual) is analysed.
It is possible to extend EIT analysis to include EIT schedule, however this is not recommended except for ad-hoc troubleshooting, as analysis of EIT schedule can be extremely demanding on probe processing resources. If full-time monitoring of all EIT information is required, dedicated probes should be used for this task.
Table IDs are specified as a comma separated list, or alternatively an ID range can be defined, e.g. 78, 80-95.
EIT table IDs:
78: P/F for Actual TS79: P/F for Other TS80-95: Schedule for Actual TS96-111: Schedule for Other TS
Inactive inputs
It is possible to hide disabled inputs from the ETR 290 views. This is convenient when one ore more inputs are never used, and therefore have been disabled. Mark the Hide inactive inputs checkbox to hide disabled inputs.
VB20 IP-PROBE USERS' MANUAL VERSION 4.92011 © BRIDGE Technologies Co AS - Bentsebrugata 20 - N-0476 Oslo, Norway - tel: +47 22 38 51 00 - www.bridgetech.tv
119

6.11.8 Setup - VBC thresh.
The VBC error second thresholds are used by the VideoBridge Controller (VBC) to issue VBC specific alarms. The VBC will raise an alarm when the number of error seconds exceeds the error seconds threshold. The VBC thresholds are only relevant when a VideoBridge Controller is part of the monitoring system.
The reason for using error second thresholds is to avoid alarms that toggle on and off, which for a large monitoring system might otherwise lead to an unintelligible user interface. The VBC thresholds will allow masking of minor error incidences thus resulting in a control system GUI that presents persistent alarms only.
The VBC error second thresholds are specified as the number of seconds affected by an error situation. These thresholds refer to a monitoring window of one hour, meaning that if the number of error seconds summed over any one-hour period exceeds the associated error second threshold an alarm will be raised by the VBC.
If a monitoring window different from one hour is selected by the VBC user, the threshold values will be automatically recalculated to proportional values.
In the 'VBC threshold presets' table the 'Refs' column shows how many streams are associated with each VBC threshold template.
By clicking the Add new threshold button the user will enter a VBC thresholds edit view enabling definition of a new threshold template. It is possible to copy or delete an existing threshold template by clicking the Duplicate selected or Delete selected button respectively. To edit a highlighted threshold template the Edit selected button should be clicked.
VB20 IP-PROBE USERS' MANUAL VERSION 4.92011 © BRIDGE Technologies Co AS - Bentsebrugata 20 - N-0476 Oslo, Norway - tel: +47 22 38 51 00 - www.bridgetech.tv
120

Multi-edit functionality allows editing several VBC thresholds simultaneously. Highlight the list entries that should be edited and click the Edit selected button.
VBC thresholds
Name: The name of the VBC threshold template
No signal: Number of seconds with 'No signal'
RTP error: Number of seconds with RTP packet drops. This measurement will be zero unless the stream is encapsulated in RTP headers
MLR error: Number of seconds with packet drops in the TS layer (seconds when media loss rate is non-zero). This is equal to the number of error seconds with CC errors.
IAT error: Number of seconds when the inter-packet arrival time exceeds the threshold
Max bitrate error: Number of seconds the bitrate can exceed the error-threshold before a VBC alarm is generated
Min bitrate error: Number of seconds the bitrate can fall below the error-threshold before a VBC alarm is generated
ETR Pri 1 errors: Number of seconds with ETSI TR 101 290 Priority 1 alarms
ETR Pri 2 errors: Number of seconds with ETSI TR 101 290 Priority 2 alarms
ETR Pri 3 errors: Number of seconds with ETSI TR 101 290 Priority 3 alarms
ETR other errors: Number of seconds with ETR 'other' alarms
ETR interface errors:
Number of seconds with ETR interface alarms
VB20 IP-PROBE USERS' MANUAL VERSION 4.92011 © BRIDGE Technologies Co AS - Bentsebrugata 20 - N-0476 Oslo, Norway - tel: +47 22 38 51 00 - www.bridgetech.tv
121

6.11.9 Setup - Scheduling
The Setup - Scheduling view enables definition of scheduling templates which are associated with PIDs or services using the PID threshold or service threshold template system. This way it is possible to mask alarms during selected time intervals, e.g. due to maintenance.
In the Schedule list table the Refs column shows how many references exist for each scheduling template. References to scheduling templates may be found in PID and service threshold templates.
The search field in the upper right corner of the view allows the user to type a text string and the schedule list is updated to display only scheduling templates matching the specified text.
The predefined scheduling templates Never and Always result in alarms being masked never or always, respectively. A new scheduling template is created by clicking the Add new schedule button. It is also possible to copy an existing scheduling template by highlighting a schedule template and clicking the Duplicate selected button. The alarm masking intervals are defined for individual week days or for all week days. Intervals are specified on the form hhmm-hhmm, for instance the interval 1200-1400 means that alarm masking should start at noon and finish at 2 pm. Several alarm masking intervals may be specified for each day using comma separation. To edit an existing scheduling template, highlight it and click the Edit selected button. To delete a template, highlight it and click the Delete selected button.
When a scheduling template has been modified, click the Apply changes button. Defined scheduling templates become available as selections in the ETR 290 - PID thresh. - Edit and ETR 290 - Service thresh. - Edit views.
VB20 IP-PROBE USERS' MANUAL VERSION 4.92011 © BRIDGE Technologies Co AS - Bentsebrugata 20 - N-0476 Oslo, Norway - tel: +47 22 38 51 00 - www.bridgetech.tv
122

6.11.10 Setup - Security
The Setup - Security view makes it possible to disable selected communication protocols to increase safety against unauthorised access to the probe. It is also possible to have the probe disregard IP packets with source address outside the Ethernet interface's subnet.
Note that the Setup - Security view is not supported when Internet Explorer 6 is used.
The default user name and password to enter this view is admin and elvis . The password is changed by entering a new password and clicking the Apply changes button.
Note that if the password is lost, the probe will have to be factory reset to access the Setup - Security view.
To disable a protocol deselect it by removing the associated check-mark and click the Apply changes button. Available security parameters are:
(A) Enable telnet: If telnet is disabled, terminal login is only available via USB cable, i.e. remote login is disabled.
(B) Enable SNMP: If SNMP is disabled, no MIB is available on port 161. However SNMP traps are sent as usual on port 162.
(C) Enable ftp: If ftp is disabled, software upload needs to be performed via the regular web interface (from the Data view).
(D) Ignore spoofing: If disabled, IP packets received on the data interface are dropped if they are spoofed and would be replied to on the management interface
Changing settings for (B) and (D) should be followed by a probe reboot for changes to take effect. Reboot is performed from the Setup - Ethernet view.
VB20 IP-PROBE USERS' MANUAL VERSION 4.92011 © BRIDGE Technologies Co AS - Bentsebrugata 20 - N-0476 Oslo, Norway - tel: +47 22 38 51 00 - www.bridgetech.tv
123

6.12 Data
6.12.1 Data - Configuration
The configuration of the probe as well as alarm lists and statistics can be exported as XML documents. This is achieved by clicking one of the links inside the Export XML frame. A new browser window pops up containing the selected XML document. The browser will allow the contents of the page to be saved to file.
Restoring the probe configuration or multicast list is just as simple. Just click the Browse button and select the file that contains the XML document. Then click the Go! button and the information in the XML document will be applied. The configuration, stream list and thresholds exports can all be imported.
Configuration files generated by an IP-Probe can be imported by the VB20.
To import documents that have been manually edited the CRC attribute at the very top of the document must be deleted (i.e. delete crc=”...” from the file). This will bypass the checksum verification mechanism.
Note that the Ethernet setup parameters (IP-address, netmask and gateway) and probe-names are not part of the XML document. Hence exporting the configuration of one probe and restoring it on another will make the two probes identical except for the network settings.
Clicking the Debug data export option will generate a document containing debug information that may be useful if probe misbehaviour is reported. This file should be sent along with a description of the misbehaviour.
VB20 IP-PROBE USERS' MANUAL VERSION 4.92011 © BRIDGE Technologies Co AS - Bentsebrugata 20 - N-0476 Oslo, Norway - tel: +47 22 38 51 00 - www.bridgetech.tv
124

6.12.2 Data - Software
It is possible to software upgrade a probe by importing the new software image file the same way an XML configuration is imported (from software version 4.5). When clicking the Go! button the software is copied to the probe, and clicking the Save flash button will store the new software to flash. Note that the probe must not be powered down during the flash save process. Flash save progress is indicated by progress bars. Note that the probe will reboot when the new software has been successfully stored in flash, and it will be unresponsive until reboot is completed.
VB20 IP-PROBE USERS' MANUAL VERSION 4.92011 © BRIDGE Technologies Co AS - Bentsebrugata 20 - N-0476 Oslo, Norway - tel: +47 22 38 51 00 - www.bridgetech.tv
125

6.12.3 Data - Table Descriptors
It is possible to upload parser files to the probe adding support for private descriptors. Private descriptors should be enabled (in the Setup - ETR view).
Contact your Bridge Technologies reseller for more information about private descriptors.
6.12.4 Data - Eii
The External integration interface (Eii) allows inclusion of Bridge Technologies equipment into 3rd party NMS systems. In order to facilitate integration the Data - Eii view allows export of XML files containing the data typcally being requested by an NMS system via the regular Eii interface.
Please refer to the document Eii External Integration Interface for detailed information about Eii.
VB20 IP-PROBE USERS' MANUAL VERSION 4.92011 © BRIDGE Technologies Co AS - Bentsebrugata 20 - N-0476 Oslo, Norway - tel: +47 22 38 51 00 - www.bridgetech.tv
126

6.12.5 Data - BOOT
If the Data - BOOT tab is present, this indicates that the probe has an old boot monitor installed that needs to be upgraded.
The boot monitor is the firmware that controls things like flash memory read/write and other low level functionality that must be configured before the kernel loads. This has no direct effect on monitoring features but is an important part of the operating system.
Click the Upgrade button to start the procedure. The probe will reboot on completion, and the Data - BOOT tab will no longer be visible in the GUI.
VB20 IP-PROBE USERS' MANUAL VERSION 4.92011 © BRIDGE Technologies Co AS - Bentsebrugata 20 - N-0476 Oslo, Norway - tel: +47 22 38 51 00 - www.bridgetech.tv
127

6.13 About
6.13.1 About - Release info
This view shows the software version, the hardware type and the software build date of the VB20 IP-Probe.
6.13.2 About - License
This view shows the available probe options and current IP-Probe license details. By clicking the blue information icon associated with each option it is possible to view option details.
A basic VB20 IP-Probe may be upgraded to include one or more options. This can be done on-site by the user when the option has been purchased.
VB20 IP-PROBE USERS' MANUAL VERSION 4.92011 © BRIDGE Technologies Co AS - Bentsebrugata 20 - N-0476 Oslo, Norway - tel: +47 22 38 51 00 - www.bridgetech.tv
128

6.13.3 About - Technologies
This view shows a description of some of the technologies used by the probe.
VB20 IP-PROBE USERS' MANUAL VERSION 4.92011 © BRIDGE Technologies Co AS - Bentsebrugata 20 - N-0476 Oslo, Norway - tel: +47 22 38 51 00 - www.bridgetech.tv
129

I Appendix: VB20 Versus VideoBridge Controller - AlarmsThe VB20 IP-Probe alarms are independent of the VideoBridge Controller (VBC) alarms. The probe has been designed to yield instantaneous alarms based on the current measurements. This typically results in lots of short lived alarms that would be “too much” for the VBC to report, as the VBC may control a large number of probes. The VBC therefore generates alarms based on error-second statistics gathered from probes during a selectable time period (default 60 minutes - sliding window).
Ethernet measurement data are sent from the VB20 together with Ethernet error-second threshold values (as set in the VB20 Setup - VBC thresh. view). The VBC monitors the error seconds for each parameter and will raise an alarm provided that the error-seconds figure exceeds the threshold value, as monitored during the windowing period.
Figure 8: VBC alarming based on VB20 measurements
VB20 IP-PROBE USERS' MANUAL VERSION 4.92011 © BRIDGE Technologies Co AS - Bentsebrugata 20 - N-0476 Oslo, Norway - tel: +47 22 38 51 00 - www.bridgetech.tv
130

II Appendix: Monitoring PracticesThis Appendix summarises a few useful monitoring practices.
RTP Monitoring
When running video inside an RTP wrapper it is possible to exactly deduce the number of dropped IP frames due to network issues. This is possible as a result of the 16-bit sequence counter inside the RTP header. When the protocol mapping is nTS/RTP the RTP parameters RTPdrop, RTPdup, RTPooo and RTPlag will be updated and the corresponding alarms Packet drops:N, Duplicate packets:N and Out of order packets(lag:N) are fired (if not switched off).
Note that the probe will perform out-of-order corrections before RTP packet loss analysis is performed.
Example of RTP sequences and their effects on monitoring:
Sequence Effect
..., 10, 11, 12, 13, 14, 17, 18, 19, ...2 dropped packets (15-16)
Monitoring page: RTPdrop:+2
Alarms & events: RTP Packet drop: 2
..., 10, 12, 13, 16, 17, 18, 19, ...1 and 2 dropped packets (11, 14-15)
Monitoring page: RTPdrop:+3
Alarms & events: RTP Packet drop: 3
..., 10, 11, 15, 12, 14, 16, 18, 19, ...2 dropped packets (13, 17)1 out of order packets of order 3 (1512)
Monitoring page: RTPdrop:+2Monitoring page: RTPooo:+1Monitoring page: RTPlag: 3 (at least)
Alarms & events: RTP Packet drops: 2Alarms & events: RTP out of order packets (lag:3)
Default Monitoring
When the protocol mapping is nTS/UDP, meaning there is no RTP information in the multicast stream, there is no easy way to isolate and register network-induced errors. Assumptions can be done by performing continuity counter analysis for the content of each received UDP-frame on the fly. The probe will note CC-errors (CCerr) and generate corresponding alarms (CC skips:N).
VB20 IP-PROBE USERS' MANUAL VERSION 4.92011 © BRIDGE Technologies Co AS - Bentsebrugata 20 - N-0476 Oslo, Norway - tel: +47 22 38 51 00 - www.bridgetech.tv
131

Imagine the following MPEG-2 Transport Stream being generated by an encoder. The TS contains two PIDs (50 and 51) and the Continuity Counter (CC) values are continuous for each PID since there are no packets missing.
When the Transport Stream reaches our imaginary head-end some packets (those with red frame) have been lost (maybe due to a bad satellite connection). Our IP-Streamer packs 7 and 7 MPEG-2 TS packets into each UDP-frame (mapping is 7TS/UDP) and the resulting frames may look like:
Multicast packet 1:
Multicast packet 2:
....
The probe’s response to this multicast is summarised in the following table:
Sequence Effect
UDP packet #1 (7 MPEG2 TS packets):PID 50: 12, 13, 4,PID 51: 1, 2, 4, 5,
PID 50 has 1 CC discontinuity of 6 (13 4)PID 51 has 1 CC discontinuity of 1 (2 4)
Monitoring page: CCerr:+2
UDP packet #2 (7 MPEG2 TS packets):PID 50: 5, 6, 7, 8PID 51: 8, 9, 10
PID 51 has 1 CC discontinuity of 2 (5 8)
Monitoring page: CCerr:+1
If no more CC-errors for at least 1 second Alarms & events:CC skips:9 discontinuities:3
Depending on the thresholds you may also get: MLR >= warning-threshold (9 >= 1)
There were 9 TS packets missing (with red frame) and the alarm reflects this.
VB20 IP-PROBE USERS' MANUAL VERSION 4.92011 © BRIDGE Technologies Co AS - Bentsebrugata 20 - N-0476 Oslo, Norway - tel: +47 22 38 51 00 - www.bridgetech.tv
132
PID: 50 CC: 12
PID: 51 CC: 1
PID: 50 CC: 13
PID: 51 CC: 2
PID: 50 CC: 14
PID: 51 CC: 3
PID: 50 CC: 15
PID: 51 CC: 4
...
PID: 50 CC: 0
PID: 51 CC: 5
PID: 50 CC: 1
PID: 51 CC: 6
PID: 50 CC: 2
PID: 51 CC: 7
PID: 50 CC: 3
PID: 51 CC: 8
PID: 50 CC: 4
PID: 51 CC: 9
PID: 50 CC: 5
PID: 51 CC: 10
PID: 50 CC: 6
PID: 51 CC: 11
PID: 50 CC: 7
PID: 51 CC: 12
PID: 50 CC: 8
PID: 51 CC: 13
PID: 50 CC: 9
PID: 51 CC: 14
PID: 50 CC: 10
PID: 51 CC: 15
...
PID: 50 CC: 12
PID: 50 CC: 13
PID: 50 CC: 4
PID: 51 CC: 1
PID: 51 CC: 2
PID: 51 CC: 4
PID: 51 CC: 5
PID: 50 CC: 5
PID: 50 CC: 6
PID: 50 CC: 7
PID: 51 CC: 8
PID: 51 CC: 9
PID: 51 CC: 10
PID: 51 CC: 11

Strategy for MediaWindow Analysis
This section provides further insight into MediaWindow analysis and suggests how the Ethernet threshold settings can be configured to maximise the usefulness of the MediaWindow graphs and alarms.
The MLR value is always calculated using the continuity counter inside the transport stream packets. Since the continuity counter is expected to increase by one for each packet of the same PID it is possible to detect missing TS packets by noting gaps in the continuity counters. Knowing that there are usually 7 transport stream packets inside one UDP packet you expect a continuity counter error of 7 if one UDP packet goes missing. This corresponds to an MLR value of 7. The range of the continuity counter is 4 bits meaning that if you are unlucky and lose exactly 16 packets for the same PID you will not be able to detect the packet loss at all. Losing 16 or more packets of the same PID is very rare and will only happen in networks with plenty of obvious problems.
Not all PIDs carry continuity counters. The null packets (PID 8191) and PIDs carrying PCR (program clock reference) do not carry continuity counters. This is the reason why losing one UDP packet does not necessarily result in an MLR of 7 but maybe 6 or even 5 (assuming the mapping is 7TS/UDP).
Systems typically do not mix the mappings among their streams so there is seldom a need to remember the mapping for streams in order to interpret the exact impact of MLR values.
The range of the MediaWindow graphs can be configured by the user. Even when the graph is updated in “real-time” each bar in the graph will represent a large number of elementary measurements. For a 5Mbit/s stream there will be approximately 500 elementary measurements per second, assuming a mapping of 7 TS packets into each UDP-frame (i.e. there are approximately 500 UDP packets per second). An elementary measurement is generated for each interval between two neighbouring UDP frames.
Within each update-interval only the extreme IAT and MLR values are displayed in the graph. For IAT the peak inter-arrival time over the measurement period represents the IAT for that period. For MLR the highest loss ratio within any second represents the MLR for that period.
When the range of the graph is set to larger intervals, even more elementary measurements are merged for each bar-interval.
The rest of this discussion assumes the MediaWindow graph range is set to “running” since that lowers the probability that more packet losses occurred inside the same bar-interval.
VB20 IP-PROBE USERS' MANUAL VERSION 4.92011 © BRIDGE Technologies Co AS - Bentsebrugata 20 - N-0476 Oslo, Norway - tel: +47 22 38 51 00 - www.bridgetech.tv
133

The following figure shows how a large number of elementary measurements are represented by one bar in the graph.
IAT Before and After Router
Packet-loss that occurs before or inside a router will usually not be visible since the queuing mechanism at the outgoing interface of the router will send out packets in an orderly fashion. If however the packet-loss did occur after the router (due to line noise for example) thus affect the timing between two neighbouring packets - effectively doubling it – the packet loss will always affect the IAT component for CBR streams. For VBR streams, that are jittery by default, the extra time gap may have no effect since there may already be other larger gaps within the MediaWindow interval.
If a UDP packet goes missing after it has left the router it will visually affect both the IAT and MLR for CBR streams. The pink line represents one elementary measurement.
For VBR streams a similar packet-loss will not necessarily affect the IAT graph even if the time between two neighbouring packets doubles. The pink line represents the IAT and MLR value measured for the missing packet.
VB20 IP-PROBE USERS' MANUAL VERSION 4.92011 © BRIDGE Technologies Co AS - Bentsebrugata 20 - N-0476 Oslo, Norway - tel: +47 22 38 51 00 - www.bridgetech.tv
134

Identifying UDP Packet Loss
This discussion does not apply to streams with TS/RTP mapping since in that case identifying UDP packet loss is straight forward.
There is no fail-safe way to distinguish packet loss caused by dropping UDP packets from packet loss caused by dropping packets inside the TS layer. IP based networks will generally not introduce new errors in the TS layer. As soon as the TS layer is wrapped inside UDP packets all further processing operates on the UDP packets.
The pink line indicates a packet loss of 1-4 with no jitter component.
As a rule of thumb, the co-existence of small MLR readings (1-4) and no IAT readings can be assumed to have been caused by packet loss in the original TS data.
The pink line indicates a packet loss of 6 or 7 and a doubling of the jitter component.
A UDP packet-drop will usually show up in the MLR value as a multiple of the mapping value; for a mapping value of 7 TS packets into each UDP packet, the MLR component will be equal to 7, 14, 21 etc.
Slightly lower values such as 6, 13, and 20 can be expected if a missing UDP packet did contain one TS packet without continuity counter (i.e. a PCR packet with no payload).
As we have seen, there is no sure way to distinguish between UDP packet-loss and loss in the underlying TS packets. One way to deal with the situation is to have a probe doing zero readings close to the signal source before the network can introduce UDP packet loss.
VB20 IP-PROBE USERS' MANUAL VERSION 4.92011 © BRIDGE Technologies Co AS - Bentsebrugata 20 - N-0476 Oslo, Norway - tel: +47 22 38 51 00 - www.bridgetech.tv
135

Thresholds
It is useful to configure individual threshold settings for IAT for each stream unless they are fixed at the same bit-rate. Streams that are being monitored by several probes should have equal Ethernet thresholds configured on each probe to make it easy to compare measurements for a stream across several probes.
As a rule of thumb the IAT warning threshold could be set to 50% above the max IAT value observed over a considerable period of time, the last 24h or so. The IAT error threshold could be set a little below the maximum jitter the system can tolerate – usually limited by the STB jitter tolerance. STB manufacturers should be able to provide information about how much jitter they can handle. Setting the Ethernet warning-threshold too high results in a graph where almost all plots are close to the x-axis and it becomes less useful to visually compare MediaWindow graphs.
For streams with TS/UDP mapping the default MLR threshold is set so that errors are reported if the number of CC errors exceeds the number of TS packets in one UDP frame (assumed to be 7).
VB20 IP-PROBE USERS' MANUAL VERSION 4.92011 © BRIDGE Technologies Co AS - Bentsebrugata 20 - N-0476 Oslo, Norway - tel: +47 22 38 51 00 - www.bridgetech.tv
136

III Appendix: Software UploadThe process of performing a software upload to the VB20 involves the following steps:
1. Obtain the software image.2. Export and save the probe configuration.3. Delete an existing probe stream recording4. Transfer the image to the probe using the software upload functionality in the Data view (if
upgrading from version 4.5 or later) or by using ftp (upgrading from older software versions). Save the image to flash.
5. Wait while the software is being saved.6. Verify the new image.
Step 1: Obtain the software imageWhen upgrading a probe running software 4.2 or later, the combined software image file with extension .tea2 can be used, irrespective of hardware version. If the probe is upgraded from an earlier version, it will be necessary to upgrade in two steps: first upgrade to the 4.5 software and then to the newest software. In the first upgrade it will be necessary to use a software image matching the probe hardware version.
The image will have extension .tea or .tea2, .tea2 being a combined software image for HW1, HW2 and HW3. Version number, build date and possibly hardware version should be part of the file name. As an example, gbprobe_hw1-2_420-15_14dec09.tea is the 4.2.0-15 software release built 14. December 2009, valid for HW1 and HW2. The software gbprobe_420-15_14dec09.tea2 may be used for all hardware versions. Note however that probes running software older than 4.2 cannot recognise this combined software image, and dedicated software for HW1/HW2 or HW3 should be used when upgrading from an older version.
When upgrading from an older version than 4.2 one should either determine the probe hardware and select the appropriate software image, or simply try to upload one image and then use the other one if the probe responds with an error message to the first one. Trying to upload the incorrect software version will not harm the probe in any way.
For probes running software version 3.7 or older it is safe to assume HW1 or HW2.
One may upload the software without checking hardware version, and in this case the gbprobe_hw1-2... image should be tried first. If the software image is incorrect the probe will respond with an error message similar to this:
Simply use the other software image if the first one was incorrect.
VB20 IP-PROBE USERS' MANUAL VERSION 4.92011 © BRIDGE Technologies Co AS - Bentsebrugata 20 - N-0476 Oslo, Norway - tel: +47 22 38 51 00 - www.bridgetech.tv
137
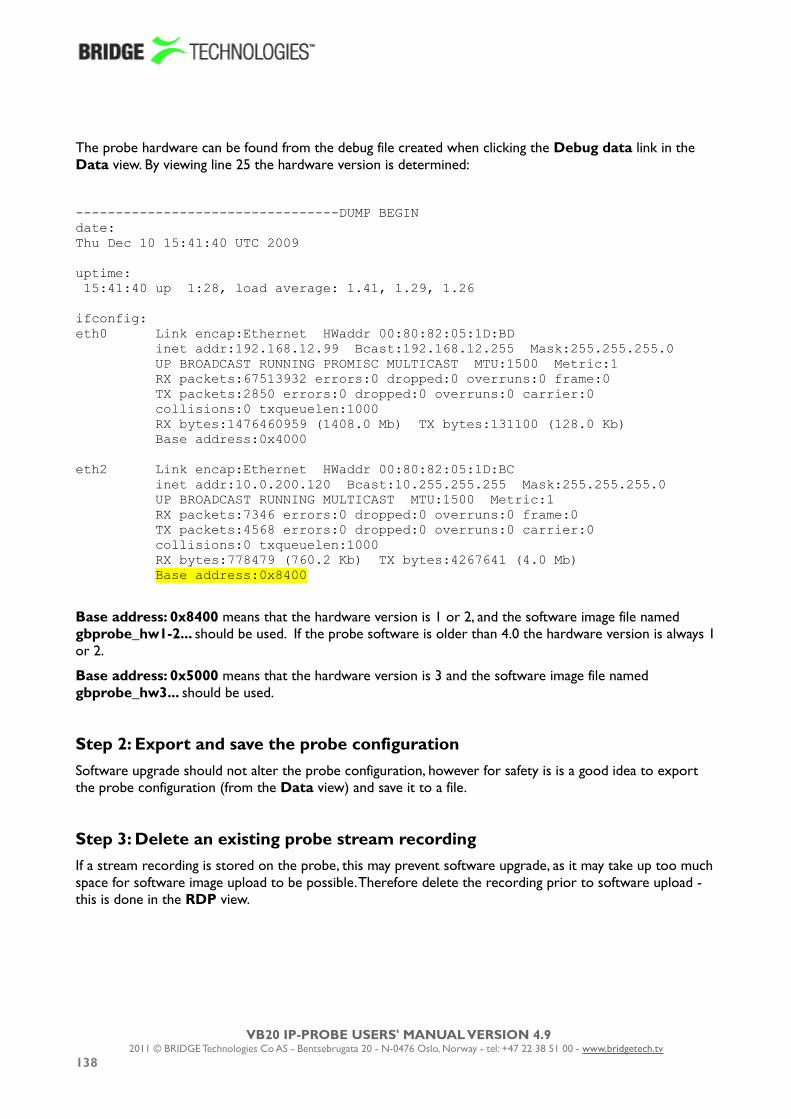
The probe hardware can be found from the debug file created when clicking the Debug data link in the Data view. By viewing line 25 the hardware version is determined:
---------------------------------DUMP BEGINdate:Thu Dec 10 15:41:40 UTC 2009
uptime: 15:41:40 up 1:28, load average: 1.41, 1.29, 1.26
ifconfig:eth0 Link encap:Ethernet HWaddr 00:80:82:05:1D:BD inet addr:192.168.12.99 Bcast:192.168.12.255 Mask:255.255.255.0 UP BROADCAST RUNNING PROMISC MULTICAST MTU:1500 Metric:1 RX packets:67513932 errors:0 dropped:0 overruns:0 frame:0 TX packets:2850 errors:0 dropped:0 overruns:0 carrier:0 collisions:0 txqueuelen:1000 RX bytes:1476460959 (1408.0 Mb) TX bytes:131100 (128.0 Kb) Base address:0x4000
eth2 Link encap:Ethernet HWaddr 00:80:82:05:1D:BC inet addr:10.0.200.120 Bcast:10.255.255.255 Mask:255.255.255.0 UP BROADCAST RUNNING MULTICAST MTU:1500 Metric:1 RX packets:7346 errors:0 dropped:0 overruns:0 frame:0 TX packets:4568 errors:0 dropped:0 overruns:0 carrier:0 collisions:0 txqueuelen:1000 RX bytes:778479 (760.2 Kb) TX bytes:4267641 (4.0 Mb) Base address:0x8400
Base address: 0x8400 means that the hardware version is 1 or 2, and the software image file named gbprobe_hw1-2... should be used. If the probe software is older than 4.0 the hardware version is always 1 or 2.
Base address: 0x5000 means that the hardware version is 3 and the software image file named gbprobe_hw3... should be used.
Step 2: Export and save the probe configurationSoftware upgrade should not alter the probe configuration, however for safety is is a good idea to export the probe configuration (from the Data view) and save it to a file.
Step 3: Delete an existing probe stream recordingIf a stream recording is stored on the probe, this may prevent software upgrade, as it may take up too much space for software image upload to be possible. Therefore delete the recording prior to software upload - this is done in the RDP view.
VB20 IP-PROBE USERS' MANUAL VERSION 4.92011 © BRIDGE Technologies Co AS - Bentsebrugata 20 - N-0476 Oslo, Norway - tel: +47 22 38 51 00 - www.bridgetech.tv
138

Step 4: Transfer the image to the probe and save to flashUsing the software upload functionality in the Data view (sw 4.5.0 and later)
From the Data view select the software image file to be uploaded and click the Go! button. When the software has been successfully transferred to the probe click the Save flash button and confirm.
Progress bars are displayed to show flash save status.
Note that the probe will reboot when new software is successfully stored in flash, and the probe will be unresponsive until reboot has completed.
VB20 IP-PROBE USERS' MANUAL VERSION 4.92011 © BRIDGE Technologies Co AS - Bentsebrugata 20 - N-0476 Oslo, Norway - tel: +47 22 38 51 00 - www.bridgetech.tv
139

Using ftp and telnet
Alternative A: Using Internet Explorer in Windows
Open an Internet Explorer window. In the URL field type
ftp://admin:[email protected]
(replace 192.168.7.196 with the probe’s IP-address) and hit <ENTER>. Follow the instructions given by Windows. It may be necessary to retype the string including user and password, as described above. Then drag the software image onto the empty Internet Explorer window. When the file has been copied onto the probe the Internet Explorer window may look as shown below.
Alternative B: Using a terminal based ftp client
In a terminal window type the following commands, replacing the software image name with the relevant one (the path to the folder in which the software is located should be specified):
ftp 192.168.7.196put gbprobe_sw_172_01sep06_145230.teabye
The image, which is now stored on the probe’s RAM-disk, needs to be saved to flash.In a terminal window type these commands, replacing the IP-address with the relevant one (note that the password will not be visible on the screen):
telnet 192.168.7.196gbprobe login: save_flashpassword: save_flash
VB20 IP-PROBE USERS' MANUAL VERSION 4.92011 © BRIDGE Technologies Co AS - Bentsebrugata 20 - N-0476 Oslo, Norway - tel: +47 22 38 51 00 - www.bridgetech.tv
140

Step 5: Wait while the software is being saved
This will take 6-15 minutes. The probe will then reboot automatically. The probe should state that the software image has been saved successfully.
When using the ftp/telnet method do not disconnect the telnet session before the software upgrade is completed.
Note that if the probe is powered off while saving image to flash it will not be able to reboot normally afterwards.
Step 6: Verify the new image
Connect a browser towards the probe and verify the version and build time in the About - Release info view.
Software upload troubleshooting
Probes that are unable to execute the user program (usually caused by interrupting the save-to-flash process described above) can still be upgraded. Contact your Bridge Technologies reseller for details.
To verify that the probe is unable to start the user program, connect the USB cable as explained in section 4.4.2 and reboot the probe. The diagnostics output will tell if the probe is unable to locate or execute the user program.
If the WEB interface does not appear to work correctly straight after upgrading the probe it may be because the WEB browser is using files that are cached. Files may be cached for up to 1 hour in the WEB browser. To manually clear the cache, select Tools/Clear Private Data (Firefox) or Tools/Internet Options/General/Browsing history/ Delete.../Delete files... (IE7).
Note that the probe configuration may be lost when downgrading to an older software version. In this case the saved configuration file may be useful.
VB20 IP-PROBE USERS' MANUAL VERSION 4.92011 © BRIDGE Technologies Co AS - Bentsebrugata 20 - N-0476 Oslo, Norway - tel: +47 22 38 51 00 - www.bridgetech.tv
141