iot! and then..? - ginkgo management consulting and then..? a ginkgo management consulting white...
TRANSCRIPT

A Ginkgo Management Consulting Publication 2014
HAMBURG | SHANGHAI | SINGAPORE | ZURICH
IoT! And then..?
A Ginkgo Management Consulting White Paper 2018

1www.ginkgo.com
Internet of Things (IoT) encompasses the connectivity
of all kinds of physical devices – and naturally opens up
a large set of opportunities. As a number of industries
surpass tinkering in this field of technology, IoT is
gradually developing into a business-changing factor.
New value creation paths become accessible, more
advanced competitive strategies emerge – the equilibrium
of competition is disrupted. Creating and managing IoT
via smart apps and devices is just the starting point. A core
contributor to value shall be found within the integration
of additional data sources into the digital value chain of
companies. The key questions who stands to gain and
who stands to lose are discussed in this whitepaper
Lars Godzik
Founding Partner, Ginkgo Management Consulting

2 www.ginkgo.com
Introduction
IoT and the digital value chain
In their 2014 article, Michael Porter and James Heppelmann have addressed the third wave of IT-driven competition1. This wave is caused by highly connected products that enable a vast variety of use cases. However, the internet of things is not a benefit driver by itself. Nor is sustainably producing added value based on a digital value chain an easy task. This paper seeks to investigate value adding opportunities along with their up- and downsides.
The IoT is comprised of a myriad of devices that have connectivity to the internet or to each other. They share information that would otherwise either be completely unknown or only available on local devices. Some IoT devices may even be remote-controlled or can execute algorithm-supported self-control. Nowadays, IoT is largely about delivering data to a central location, drastically increasing what is known about fielded assets.
A promising approach to better comprehend the complex topic of IoT is to define a digital value chain, as depicted in figure 1. This six-step process helps companies to strategically align their IoT activities. Put briefly, the assets have to be connected to a landside that collects and stores the asset-related data. Analysis of this data is then possible, enabling specific use cases and generating insights capable of transforming business.
Typical roadblocks emerge around topics such as data quality, system complexity or the sheer quantity of data. However, the most challenging aspect of implementing a digital value chain is change management. The goal is to actually transform the organization to fulfill a business-related target instead of just amassing loads of data.
Nevertheless, this is just the starting point. A whole new set of possibilities opens up when data or insights are integrated with other sources, such as transactional data in ERP Systems, legal or contracts databases or service documentation. This last step of the digital value chain widens the scope of possible users of asset data from engineers or asset-owners to customers, suppliers or subcontractors, just to name a few.
Smart, connected products are changing how value
is created for customers, how companies compete,
and the boundaries of competition itself.
- Michael Porter, James Heppelmann
“”
1 Porter, Michael E., Heppelmann, James E.; How smart, connected products are transforming competition, Harvard business review, November 2014

3www.ginkgo.com
Business Models enabled through data integration
As is usually the case with an overabundance of options, the question is which path to pursue. Should one chase each and every potential business model? Blue oceans everywhere from now on? Economic experience and common sense tell us that this cannot be the case. The contrary holds to be true: Availability of such options has made interacting with assets more
complex. Every player in the conventional value chain (supplier, OEM, customer, 3rd party) claims data or its (free) use. Data is the new oil they say – no business can run without it. In the following chapters we analyze the value creation and value capture potentials that emerge from these new options.
Figure 1: Digital value chain (Source: Ginkgo Research, 2018)
used. Network effects are generated by increasing the number of parties that use integrated data. The more users such a system has, the more important lower transaction costs become as running costs do not grow at the same pace as the system does. The combination of these effects enables three key improvements that may be gained by each player involved.
Essentially, data integration enables lower transaction costs and can create network effects. Lower transaction costs are driven by having data and insights readily available. Firstly, information made available by the digital value chain can be swiftly used. Secondly, that information may be correlated with data from other sources with comparably low effort. Information that would have been uneconomical to obtain can now be
Connect
Technology selection & equipment
Transfer
Telecommunication
Collect
ArchitectureData Lake
Integrate
Include other data sources
Use
Use Cases
Analyse
Dashboards
Value Creation
Prerequisites

4 www.ginkgo.com
For example, business analytics can be applied based on aggregated data from different players, enabling improved predictive maintenance on a large and possibly automated scale. However, the creation of such a service is only possible for a party with considerable market power, such as the owner of the integration platform. The resulting landscape of value generation and value capture options is diverse and should be investigated closer.
1. The solutions’ productivity drastically increases as search costs are minimized and the quality of information is made transparent. The information generated can be distributed easily to other users, reducing the cost of handovers.
2. Using the increased solution productivity, the user can improve asset management. Collaboration between different parties such as suppliers, OEMs, service providers etc. is simplified. A common product structure is one aspect of such a simplification. The most tangible improvement is the availability of integrated asset information to all relevant parties.
3. This in turn enables the generation of new services. Interestingly, while increased solution productivity and improved asset management offer an even perspective for improvement to all parties involved, the value capture from new services are restricted to specific players.
Transaction Cost
& Network Effects
Increased Solution Productivity
Generate New
Services
ImproveAsset
Management
• Multi Brand• Integrated Service• Business Analytics
• Search cost• Information quality• Information distribution
• Simplified collaboration• Common product structure• Integrated asset information
1
2 3
Figure 2: Business Models enabled through data integration (Source: Ginkgo Research, 2018)
5www.ginkgo.com
How can value be captured?
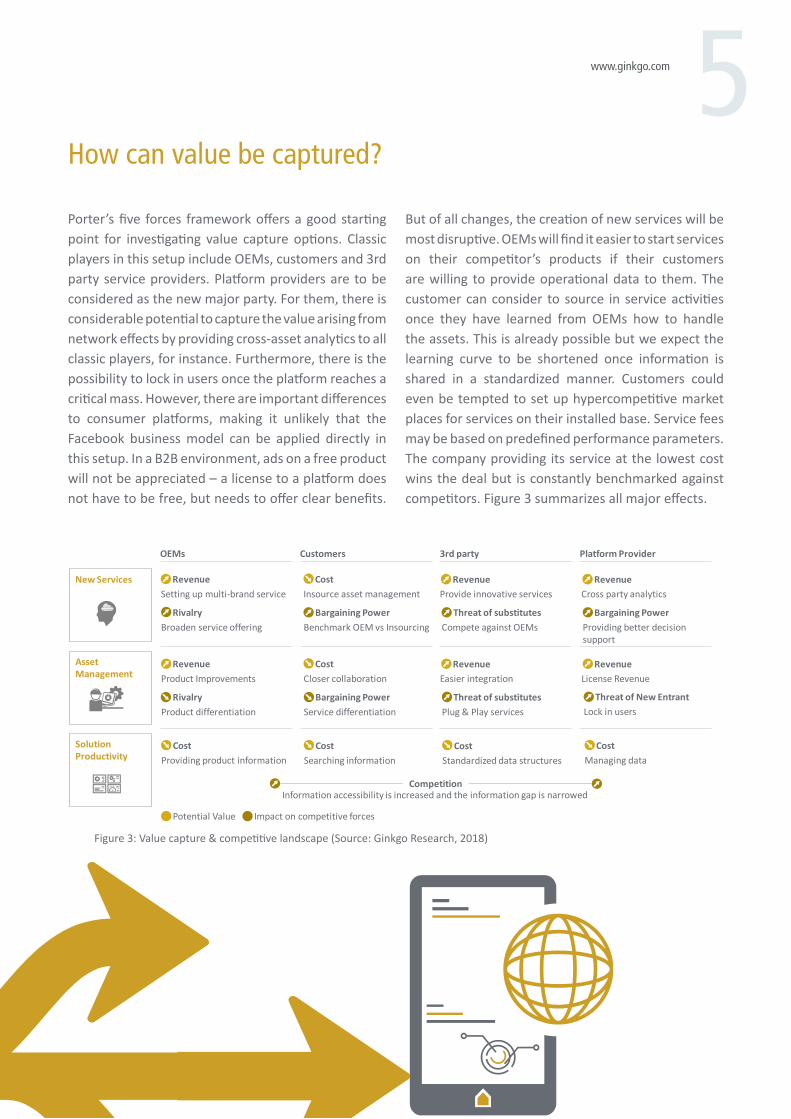
Porter’s five forces framework offers a good starting point for investigating value capture options. Classic players in this setup include OEMs, customers and 3rd party service providers. Platform providers are to be considered as the new major party. For them, there is considerable potential to capture the value arising from network effects by providing cross-asset analytics to all classic players, for instance. Furthermore, there is the possibility to lock in users once the platform reaches a critical mass. However, there are important differences to consumer platforms, making it unlikely that the Facebook business model can be applied directly in this setup. In a B2B environment, ads on a free product will not be appreciated – a license to a platform does not have to be free, but needs to offer clear benefits.
But of all changes, the creation of new services will be most disruptive. OEMs will find it easier to start services on their competitor’s products if their customers are willing to provide operational data to them. The customer can consider to source in service activities once they have learned from OEMs how to handle the assets. This is already possible but we expect the learning curve to be shortened once information is shared in a standardized manner. Customers could even be tempted to set up hypercompetitive market places for services on their installed base. Service fees may be based on predefined performance parameters. The company providing its service at the lowest cost wins the deal but is constantly benchmarked against competitors. Figure 3 summarizes all major effects.
Figure 3: Value capture & competitive landscape (Source: Ginkgo Research, 2018)
OEMs Customers 3rd party
New Services
Asset Management
Solution Productivity
Platform Provider
Setting up multi-brand serviceRevenue
Insource asset managementCost
Broaden service offering Rivalry
Benchmark OEM vs Insourcing Bargaining Power
Provide innovative servicesRevenue
Compete against OEMs Threat of substitutes
Cross party analyticsRevenue
Providing better decision support
Bargaining Power
Product ImprovementsRevenue
Closer collaborationCost
Product differentiation Rivalry
Service differentiation Bargaining Power
Easier integrationRevenue
Plug & Play services Threat of substitutes
License RevenueRevenue
Lock in users Threat of New Entrant
Providing product informationCost
Searching informationCost
Standardized data structuresCost
Managing dataCost
Information accessibility is increased and the information gap is narrowed Competition
Potential Value Impact on competitive forces

6 www.ginkgo.com
But who owns the data?Implications for your integration strategy
Data ownership and usage rights have a major impact on all parties’ positions. A platform provider might be able to provide great insights, but only if customers and OEMs allow this. Data management and data privacy are traditionally of higher importance in B2B environments, as opposed to B2C environments. In addition, why should an OEM allow to be benchmarked against a competitor unless the customer possesses sufficient bargaining power to force the OEM into doing this? A further complication is the challenge to put a price on data.
It is not yet evident in which direction the business of asset data sharing will evolve. Will companies prefer to share using one to one connections, develop their own platforms or use third party platforms? Several big software providers like SAP, GE or PTC are already offering own cloud solutions hoping to become the platform of choice. What seems fair to say, however, is that customers of OEMs will have an incentive to push towards more standardized sharing of information using easy to access applications – how will the others react?
In order to be prepared for the future, companies must now start to consider:
• How to define and manage the value of their data
• How to ensure usage rights for data they want but do not own
• How to capture the value created by analytics across products and installed bases
Asset information integration may be the next big digital disruptor. No company should underestimate the potential impact of asset information integration on their business model and competitive environment.Standardization of asset and information structures
will help and there are already some standards available (e.g. reference designation system for power plants for structuring power plant assets). But many industries still have a way to go until standards are broadly accepted and implemented.
Flows of data are not a commodity: each stream of information is different, in terms of timeliness, for example, or how complete it may be. This lack of ‘fungibility’, in economic lingo, makes it difficult for buyers to find a specific set of data and to put a price on it.
- Economist, May 2017
“
”

Authors & Experts
Johannes MäderHamburg
Clemens BarkowHamburg

HAMBURG
Lehmweg 1720251 Hamburg
Germany
SHANGHAI
83 Fumin Road#08-56
Mayfair TowerShanghai 200040
PR China
SINGAPORE
30 Cecil Street #19-08
Prudential TowerSingapore 049712
Singapore
ZURICH
Sihleggstrasse 238832 Wollerau
Switzerland
GINKGO MANAGEMENT CONSULTING
HAMBURG | SHANGHAI | SINGAPORE | ZURICH
w w w. g i n k g o . c o m