ioos in the great lakes: supporting management of drinking water quality kelli paige glos program...
TRANSCRIPT

IOOS in the Great Lakes: Supporting Management of
Drinking Water Quality
Kelli PaigeGLOS Program Coordinator

Huron - Erie Corridor
Lake St Clair
St Clair River
Detroit River
GoalReduce health risks and costs associated with pollutant spills in the Lake Huron to Lake Erie Corridor
Desired Outcomes Timely response to spill
events by water intake plant operators
More efficient and effective spill response / search and rescue
Protection of human health
Major Elements Link 2d model for corridor
to NOAA Great Lakes Forecasting System
Generate 3d public domain model
Use 3d model to support water intake risk assessment work

Predict currents, water-level for Lake St. Clair, St. Clair River, and Detroit River
Nowcasts every 3 hours, Forecasts every 12 hours
48 hour forecast
www.glerl.noaa.gov/res/hecwfsHECWFS
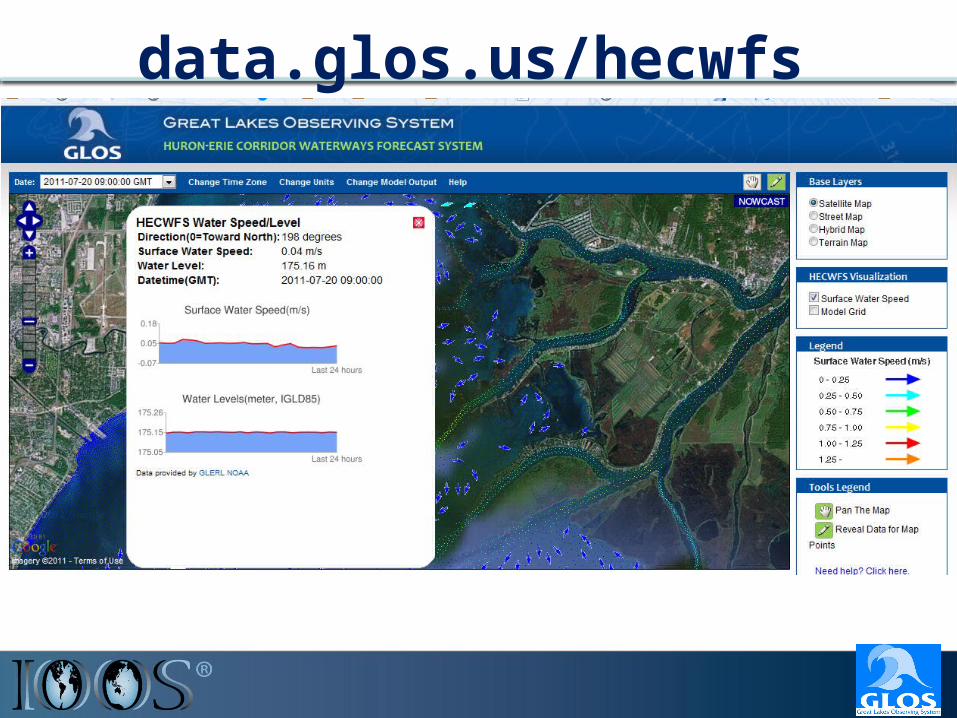
data.glos.us/hecwfs

Management UsesFeedback: How can this aid in spill response and planning?
Next Steps:
- Calibrated model to spill observations
3 dye releases in St. Clair River
- Generated a spill reference library Based on different spill scenario simulations
Simplified spill information for planning response
- Metro Beach/Clinton River forecasting
Aid in Metro Beach quality forecast
Increased resolution near Metro Beach
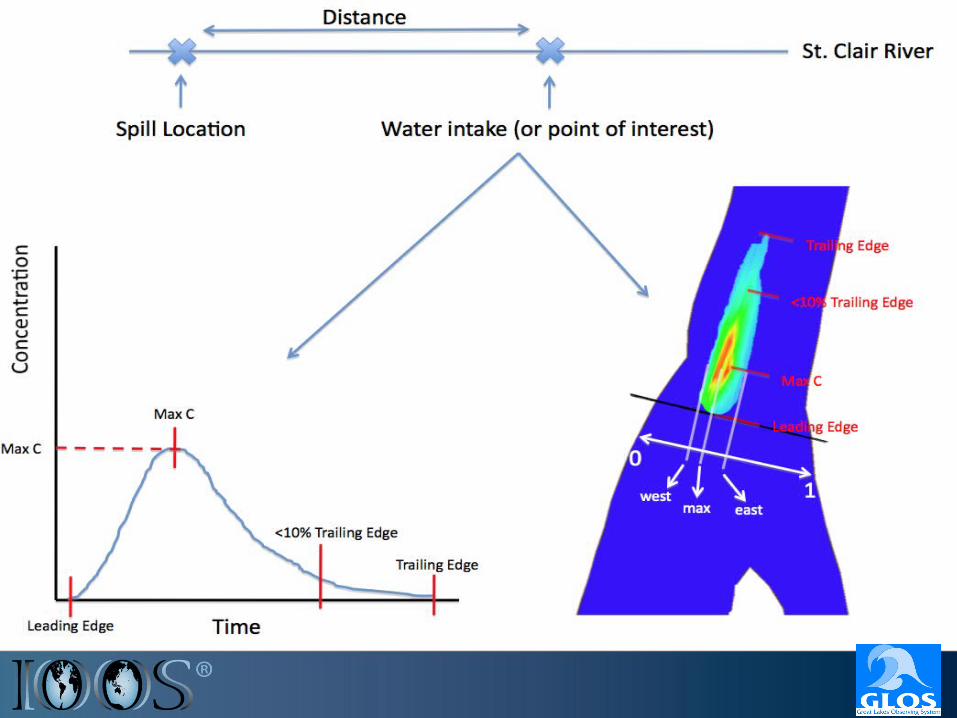


Spill location # 5
Impact Location
Leading Edge time
Dist (km)
Max Conc.
Timemax Conc.
Trailing edge time
Trailing edge < 10% Cmax
Trailing edge < 1% Cmax
W. edge
Max loc.
E. edge
1 0 hr 35 min 2.58 0.169 0 hr 05 min 0 hr 20 min 0 hr 15 min 0 hr 20 min 0.20 0.25 0.65
2 1 hr 05 min 4.44 0.0647 0 hr 05 min 0 hr 35 min 0 hr 30 min 0 hr 35 min 0.15 0.30 0.70
3 1 hr 15 min 4.98 0.0503 0 hr 05 min 0 hr 40 min 0 hr 30 min 0 hr 40 min 0.20 0.25 0.75
4 2 hr 35 min 9.43 0.0256 0 hr 35 min 4 hr 00 min 1 hr 15 min 1 hr 45 min 0.10 0.40 0.75
St. Clair water intake
4 hr 05 min 14.12 0.0184 0 hr 30 min 4 hr 15 min 1 hr 20 min 2 hr 20 min 0.05 0.20 0.75
6 5 hr 05 min 17.3 0.0205 0 hr 35 min 4 hr 25 min 1 hr 30 min 2 hr 05 min 0.05 0.25 0.80
7 6 hr 10 min 20.97 0.0158 0 hr 45 min 4 hr 35 min 1 hr 40 min 2 hr 25 min 0.15 0.35 0.80
8 11 hr 15 min 36.42 0.0064 2 hr 00 min 6 hr 30 min 4 hr 30 min 5 hr 45 min 0.05 0.15 0.95
Spill Reference Table
SAMPLE
ONLY

Additional ApplicationsIssues & Modeling needs
• Navigation needs (water levels, currents
• Search and Rescue• Recreational boaters
(>150,000)• Petrochemical spills• Drinking water safety• Swimming beaches, water
quality• Habitat restoration projects• ‘hotspot’ for invasive species
Capabilities• Real-time and forecasted
currents and water levels throughout the HEC
• Output via web-interface or raw-data
• Validated results for currents and water-levels
• Spill information (scenario or forecast)– Travel time, duration,
concentration
• River plume tracking & nearshore predictions
