ionisation by positron impact - institut for fysik og astronomi
TRANSCRIPT

Ionisation by Positron Impact
Henrik Bluhme
Institute of Physics and AstronomyUniversity of Aarhus, Denmark
April 2000

This thesis has been defended on May 25, 2000 at the Institute of Physics andAstronomy, University of Aarhus, Denmark.
External examiners:
Prof. Reinhold SchuchStockholm University, Sweden.
Prof. Paul G. ColemanUniversity of Bath, UK.
Internal examiner (chairman):
Sen. Assoc. Prof. Aksel S. JensenUniversity of Aarhus, Denmark.
This version of the thesis is identical to the one submitted, except for the cor-rection of a few minor misprints.
May 2000
This thesis has been printed at the Institute of Physics and Astronomy,University of Aarhus, Denmark.It can be found in the Acrobat PDF file format on:http://www.phys.au.dk/main/publications/PhD/home.shtm#2000
Preface
This thesis has been submitted to the Faculty of Science at the University ofAarhus, Denmark, in order to fulfill the requirements for the degree of Doctorof Philosophy (Ph.D.). The main part of the work presented in this thesishas been performed at the Institute of Physics and Astronomy, University ofAarhus, Denmark, under the supervision of Dr. Helge Knudsen. A part ofthe work has been obtained during a 10 months stay at the Department ofPhysics and Astronomy, University College London, UK, under the supervisionof Dr. Gaetana Laricchia.
Acknowledgements
The past years spent as a Ph.D. student in the Positron group in Arhus havebeen years filled with many interesting challenges and experiences. The numberof members in the group has always been small. This has meant that I as aPh.D. student have been trusted with a good share of the responsibility for theexperiments conducted and also been shown a large degree of freedom in thedaily work. At times when the experiments did not quite work out this couldseem frustrating, but in the end it has proven to be highly educational and veryrewarding. For this I would like to acknowledge a number of the people I haveworked with over the years.
First of all I would like to thank my supervisor Dr. Helge Knudsen for takingme on as a Ph.D. student in the first place. Helge has always monitored theprogress of my work and been the one who worried about the things that neveroccurred to me as being able of posing any problems. Helge is also acknowledgedfor teaching me about the framework of atomic collisions within which my workbelongs.
Next I would like to extend a sincere thanks to Dr. Jon Merrison who formost of the years has been my primary companion in the lab. It was Jon whoalready in the spring of 1994 allowed me as an undergraduate to join in onsome of the work in his lab. Since then he has taught me all the ‘tricks of thetrade’, teaching me most of what I know about experimental positron physics.Many enjoyable coffee breaks and discussions over the occasional beer have been
i

ii PREFACE
spent with Jon. Both Jon and Helge are also acknowledged for proof readingthis thesis.
Furthermore I would like to thank MSc Kim Nielsen who did the work forhis master’s thesis on my experiment, obtaining some of the results presentedin this thesis. Two visiting exchange students from Leeds, UK, Robin Mitchelland Daniel Walker, are thanked for their help in obtaining some of the data aswell.
The assistance of the technical staff in Arhus is also acknowledged. Thisextends in particular to Poul Aggerholm who has provided help with thingsfar beyond his normal work as an electronics technician. Thanks to the ef-fort of Poul most thing in our lab were kept running smoothly. FurthermoreH. J. Larsen is thanked for his good advice whenever I was about to hurt myselfin his workshop.
During my stay in London I had the experience of working with anothergroup of very talented people from within my field of research. Among theseI would first of all thank Dr. Nella Laricchia for letting me join her group andfor supervising me during my stay. Nella is also acknowledged for many usefuldiscussions and comments on my work in general. Next to be acknowledged ismy fellow Ph.D. student Dr. Vanita Kara and postdoc Dr. Karen Paludan, who’sexperiment I joined while there. These and other group members, Dr. AysunOzen, Dr. David Cassidy and Dr. Andrew J. Garner, are thanked for makingit an enjoyable stay in London. Furthermore from London (now at Swansea) isacknowledged Dr. Michael Charlton for providing useful comments and alwayspaying a keen interest in our work in Arhus.
Finally are all the people I have made friends with during my nearly 9years at the University of Aarhus. Some of these have become my closest andmost invaluable friends. They are all thanked for the fun times we have sharedtogether over the past years.
Henrik BluhmeApril 2000

LIST OF PUBLICATIONS iii
List of publications
The work presented in this thesis has been published in the following papers.When referring to any of these inside the thesis, the roman numerals below willbe used.
[I] ’Strong suppression of the positronium channel in double ionization ofnoble gases by positron impact’,H. Bluhme, H. Knudsen, J. P. Merrison, and M. R. Poulsen,Phys. Rev. Lett. 81, 73 (1998).
[II] ’Non-dissociative and dissociative ionization of nitrogen molecules bypositron impact’,H. Bluhme, N. P. Frandsen, F. M. Jacobsen, H. Knudsen, J. P. Merri-son, K. Paludan, and M. R. Poulsen,J. Phys. B: At. Mol. Opt. Phys. 31, 4631 (1998).
[III] ’Double ionization of noble gases by positron impact’,H. Bluhme, H. Knudsen, and J. P. Merrison,in Proc. of 15th Int. Conf. on Application of Accelerators in Researchand Industry 98, AIP Conference Proceedings 475, edited by J. L. Dug-gan and I. L. Morgan (AIP, New York, 1999), p. 357.
[IV] ’Ionization of helium, neon and xenon by positron impact’,H. Bluhme, H. Knudsen, J. P. Merrison, and K. A. Nielsen,J. Phys. B: At. Mol. Opt. Phys. 32, 5237 (1999).
[V] ’Non-dissociative and dissociative ionization of CO, CO2 and CH4 bypositron impact’,H. Bluhme, N. P. Frandsen, F. M. Jacobsen, H. Knudsen, J. P. Merri-son, R. Mitchell, K. Paludan, and M. R. Poulsen,J. Phys. B: At. Mol. Opt. Phys. 32, 5825 (1999).
[VI] ’Ionization of argon and krypton by positron impact’,H. Bluhme, H. Knudsen, J. P. Merrison, and K. A. Nielsen,J. Phys. B: At. Mol. Opt. Phys. 32, 5835 (1999).
[VII] ’Atomic collisions involving pulsed positrons’,J. P. Merrison, H. Bluhme, D. Field, H. Knudsen, S. Lunt, K. A. NielsenS. Stahl, and E. Uggerhøj,in The Physics of Electronic and Atomic Collisions, Proc. of XXIICPEAC, AIP Conference Proceedings 500, edited by Y. Itikawa, K.Okuno, H. Tanaka, A. Yagishita, and M. Matsuzawa (AIP, New York,2000), p. 420.

iv PREFACE
[VIII] ’Positron impact ionisation of atomic hydrogen’,V. Kara, G. Laricchia, K. Paludan, H. Bluhme, J. Moxom, H. Knudsen,and J. Slevin,submitted to J. Phys. B: At. Mol. Opt. Phys.
[IX] ’Ionisation of noble gases by positron impact’,K. A. Nielsen, H. Bluhme, H. Knudsen, and J. P. Merrison,to appear in Proc. of 1st Euro. Conf. on At. Phys. at Acc., HyperfineInteract.
In addition I have during my Ph.D. participated in a number of experimentswhich will not be discussed in this thesis. This work has resulted in the followingpublications.
[X] ’Hydrogen formation by proton impact on positronium’,J. P. Merrison, H. Bluhme, J. Chevallier, B. I. Deutch, P. Hvelplund,L. V. Jørgensen, H. Knudsen, and M. R. Poulsen,Phys. Rev. Lett. 78, 2728 (1997).
[XI] ’Experimental demonstration of hydrogen formation following the in-teraction of protons with positronium’,J. P. Merrison, H. Bluhme, M. Charlton, H. Knudsen, and M. R.Poulsen,Hyperfine Interact. 109, 313 (1997).
[XII] ’Non-dissociative and dissociative ionization of O2 molecules by impactof 40–1800 keV antiprotons’,H. Bluhme, H. Knudsen, U. Mikkelsen, E. Morenzoni, K. Paludan, S. P.Møller, and E. Uggerhøj,J. Phys. B: At. Mol. Opt. Phys. 30, 3417 (1997).
[XIII] ’Single, double and triple ionization of Ne, Ar, Kr and Xe by 30–1000 keV p− impact’,K. Paludan, H. Bluhme, H. Knudsen, U. Mikkelsen, S. P. Møller, E.Uggerhøj, and E. Morenzoni,J. Phys. B: At. Mol. Opt. Phys. 30, 3951 (1997).
[XIV] ’Ionization of rare gases by particle-antiparticle impact’,K. Paludan, G. Laricchia, P. Ashley, V. Kara, J. Moxom, H. Bluhme, H.Knudsen, U. Mikkelsen, S. P. Møller, E. Uggerhøj, and E. Morenzoni,J. Phys. B: At. Mol. Opt. Phys. 30, L581 (1997).
[XV] ’Atomic spectroscopy and collisions using slow antiprotons’,T. Azuma et al. (44 authors),CERN/SPS 97; 19 CERN/SPSC (1997).

LIST OF PUBLICATIONS v
[XVI] ’Measurement of the Barkas effect around the stopping-power maximumfor light and heavy targets’,S. P. Møller, E. Uggerhøj, H. Bluhme, H. Knudsen, U. Mikkelsen, K.Paludan, and E. Morenzoni,Nucl. Instr. and Meth. B 122, 162 (1997).
[XVII] ’Direct measurements of the stopping power for antiprotons of light andheavy targets’,S. P. Møller, E. Uggerhøj, H. Bluhme, H. Knudsen, U. Mikkelsen, K.Paludan, and E. Morenzoni,Phys. Rev. A 56, 2930 (1997).

vi PREFACE
Outline of thesis
The contents of this thesis have been structured into chapters according tothe different experiments performed. The chapters are therefore to a certainextent independent. Exceptions are when theory or experimental techniquesare so related that a cross-reference between chapters are more appropriatethan rewriting a whole section.
Chapter 1: The first part of this chapter gives a brief review of the field ofatomic collisions with positrons and the work previously done within the field.The second part of the chapter serves to give a reader unfamiliar to the fieldan introduction to the basic techniques for production of low-energy positrons,as these will not be discussed in any detail in the experimental sections of thesubsequent chapters.
Chapter 2: This chapter discusses the experiments performed on the noblegases. The main emphasis of these experiments has been on measuring thetotal double ionisation cross section with particular interest in positronium for-mation at near-threshold impact energies. In addition, new data on total singleionisation are also presented for some of the noble gases. This work has beenpublished in the papers [I,IV,VI] and further presented in the conference con-tributions [III,VII,IX].
Chapter 3: This chapter starts with an introduction to Wannier theory and theRost-Pattard model. It then treats the modified Rost-Pattard model developedfor double ionisation cross sections for the noble gases presented in chapter 2.This work has been published in the paper [I] and further presented in theconference contributions [III,VII,IX].
Chapter 4: This chapter looks at the experiment performed at UniversityCollege London which measured the direct and total ionisation cross sections ofatomic deuterium by positron impact. The goal of this experiment has been tosettle the dispute that exists in the literature concerning these cross sections.This work is to be published in the paper [VIII].
Chapter 5: This chapter contains a presentation of the measurements of thetotal non-dissociative and dissociative ionisation cross sections of a range ofsmall molecules by positron impact. This work has been published in the papers[II,V].
The thesis is concluded by a summary which will recapitulate some of the con-clusions of the previous chapters and make some more general observations onthe results obtained.

Contents
1 Introduction 11.1 Atomic collisions with positrons . . . . . . . . . . . . . . . . . . . 11.2 Slow positron beam production . . . . . . . . . . . . . . . . . . . 6
1.2.1 Positron sources . . . . . . . . . . . . . . . . . . . . . . . 61.2.2 Moderators . . . . . . . . . . . . . . . . . . . . . . . . . . 71.2.3 Beam transport . . . . . . . . . . . . . . . . . . . . . . . . 101.2.4 Accumulators and traps . . . . . . . . . . . . . . . . . . . 11References . . . . . . . . . . . . . . . . . . . . . . . . . . . . . . . 12
2 Ionisation of noble gases 172.1 Introduction . . . . . . . . . . . . . . . . . . . . . . . . . . . . . . 17
2.1.1 Single ionisation . . . . . . . . . . . . . . . . . . . . . . . 212.1.2 Double ionisation . . . . . . . . . . . . . . . . . . . . . . . 25
2.2 Experimental technique . . . . . . . . . . . . . . . . . . . . . . . 302.2.1 Experimental equipment . . . . . . . . . . . . . . . . . . . 312.2.2 Data analysis . . . . . . . . . . . . . . . . . . . . . . . . . 36
2.3 Results and discussion . . . . . . . . . . . . . . . . . . . . . . . . 402.3.1 Single ionisation . . . . . . . . . . . . . . . . . . . . . . . 402.3.2 Double ionisation . . . . . . . . . . . . . . . . . . . . . . . 44References . . . . . . . . . . . . . . . . . . . . . . . . . . . . . . . 54
3 Modified Rost-Pattard theory 593.1 Wannier theory . . . . . . . . . . . . . . . . . . . . . . . . . . . . 593.2 Rost-Pattard theory . . . . . . . . . . . . . . . . . . . . . . . . . 643.3 MRP theory and discussion . . . . . . . . . . . . . . . . . . . . . 67
References . . . . . . . . . . . . . . . . . . . . . . . . . . . . . . . 71
4 Ionisation of atomic deuterium 754.1 Introduction . . . . . . . . . . . . . . . . . . . . . . . . . . . . . . 754.2 Experimental technique . . . . . . . . . . . . . . . . . . . . . . . 78
4.2.1 Experimental equipment . . . . . . . . . . . . . . . . . . . 78
vii

viii CONTENTS
4.2.2 Data analysis . . . . . . . . . . . . . . . . . . . . . . . . . 814.3 Results and discussion . . . . . . . . . . . . . . . . . . . . . . . . 82
References . . . . . . . . . . . . . . . . . . . . . . . . . . . . . . . 86
5 Ionisation of molecules 895.1 Introduction . . . . . . . . . . . . . . . . . . . . . . . . . . . . . . 895.2 Experimental technique . . . . . . . . . . . . . . . . . . . . . . . 91
5.2.1 Experimental equipment . . . . . . . . . . . . . . . . . . . 925.2.2 Data analysis . . . . . . . . . . . . . . . . . . . . . . . . . 935.2.3 ‘Light-before-heavy’ effect . . . . . . . . . . . . . . . . . . 95
5.3 Results and discussion . . . . . . . . . . . . . . . . . . . . . . . . 965.3.1 Non-dissociative ionisation . . . . . . . . . . . . . . . . . 965.3.2 Dissociative ionisation . . . . . . . . . . . . . . . . . . . . 99References . . . . . . . . . . . . . . . . . . . . . . . . . . . . . . . 104
6 Summary 107
Dansk resume (Resume in Danish) 111
List of figures 115

Chapter 1
Introduction
The existence of the positron (e+) was predicted by Dirac in 1930 [1]. The firstexperimental observation of the particle was subsequently made by Andersonin 1932 [2]. Being the antiparticle of the electron (e−), the properties of thepositron can only be fully described through the theory of quantum electrody-namics (QED). However in the field of atomic collisions it is often sufficient toregard the positron as a particle of the same mass as the electron but with theopposite charge. The antiparticle nature of the positron needs only to be con-sidered when discussing annihilation. The cross section for in flight annihilationof a positron with an electron at low energies is given by
σannih = πr20c/v ≈ 1.26 × 10⁻²²cm2/
√E/eV, (1.1)
where r0 is the classical electron radius and v the relative velocity between theparticles [3]. Even though the effective number of electrons for a specific targetcan be high this cross section is usually at least a few orders of magnitudeless than the typical scattering cross section. In flight annihilation is thereforenormally ignored in these kinds of atomic collision experiments.
1.1 Atomic collisions with positrons
The first positron-gas experiments were conducted some 30 years ago. Despitethis the field of atomic collisions with low-energy positrons is much less ad-vanced than its electronic counterpart. The development of the field has alwaysbeen closely linked to advances in the technology for producing beams of slowpositrons. This technology is, as will be reviewed in section 1.2, very differentfrom the techniques used for producing low-energy electrons. With beam inten-sities some 10 orders of magnitude less than those used in electron experiments,the type of experiments that can be performed with positrons are still today
1

2 CHAPTER 1. INTRODUCTION
limited. However the results that have been produced over the years have pro-vided invaluable information about atomic collisions. This has lead to a betterunderstanding of the mechanisms of atomic collisions not just with positrons,but also with electrons and heavier projectiles [4]. This improved understandinghas spurred further developments in both experimental techniques and theory.The progress in the field has over the years been reviewed by several authors,see e.g. [5–8].
The positron being a positively charged particle can form a bound statewith an electron. This special hydrogen ‘isotope’ is called positronium (Ps).Being a pure QED system, positronium is the simplest ‘atom’ that exists. Witha reduced mass of half an electron mass, positronium has a binding energy ofhalf that of hydrogen, 6.8 eV, and twice the radius, 2a0. The existence of posi-tronium was predicted by Mohorovicic already in 1934 [9] and later discoveredexperimentally by Deutsch in 1951 [10,11]. Positronium is primarily formedin one of two ground states: The singlet (S = 0) para-positronium (p-Ps) orthe triplet (S = 1) ortho-positronium (o-Ps). In a general collision p-Ps ando-Ps will be formed in a 1:3 ratio, as can be argued from the possible statesof electron-positron spin orientations. Positronium is unstable in that the elec-tron and positron can annihilate. Para-positronium normally decays into two511 keV photons with a lifetime in vacuum of 125 ps. For ortho-positroniumthe two photon decay is forbidden due to its non-zero total angular momentum.Ortho-positronium therefore has to decay by a higher order process into at leastthree photons of total energy of 1.022 MeV. Ortho-positronium therefore has alonger lifetime than para-positronium of 142 ns.
Positronium has the ability just like hydrogen to bind a second electron toform a negative positronium ion, Ps−. The existence of this system was firstpredicted by Wheeler in 1946 [12] and since then various properties of the ionhave been studied theoretically. Among these is the total binding energy of7.13 eV (see e.g. [13]). Much less is known experimentally. The existence of theion was shown in an experiment by Mills in 1981 [14] who later also measuredthe ions annihilation decay rate [15].
The original use of the positron in atomic collisions was as a projectile. Itwas thought to complement electron experiments. It was hoped that positronexperiments would produce more ‘clean’ results due to the lack of the exchangemechanism that often complicated comparison of electron experiments to the-ory. It was however soon realised that the process of positronium formation incollisions with positrons proved far more complicated to account for in theoret-ical calculations than exchange.
Today positrons are still used as projectiles to study processes in which pos-itronium is just a reaction product often left undetected. However at the sametime an entire field devoted to the atomic physics of positronium has appeared.This includes for example spectroscopy of transitions in positronium [16,17] and

1.1. ATOMIC COLLISIONS WITH POSITRONS 3
experiments in which the positronium is used as an atomic target in collisionswith charged particles, e.g. [X]. In these experiments the positronium is formedby the emission of positrons from a solid, like a heated silver foil. This is farmore efficient than producing it in a positron-atom collision. Positronium hasalso recently been used as a projectile in positronium-atom collisions [18]. It hasbeen found that positronium produced in a positron-atom collision is emittedmostly in the forward direction with a fairly well-defined energy with respect tothe primary positron beam [19,20]. This has been utilised at University CollegeLondon (UCL) to build a positronium beam for atomic collision studies [18].
The first positron impact cross sections to be measured were total scatteringcross sections [21]. These included contributions from both elastic and inelasticprocesses. They were obtained by measuring the positron beam attenuationthrough the target gas. Great care had to be taken in these experiments to avoidsystematic errors, particularly from small-angle forward scattering. Informationabout partial cross sections could only be extracted below the threshold forinelastic processes, under which the total scattering cross section was equal tothe elastic scattering cross section.
Among some of the first experiments to follow the total scattering exper-iments were measurements of positronium formation cross sections. Differentmethods were used to measure these. At UCL a system to detect the uniquethree-photon signature of ortho-positronium annihilation was used [22–24]. Lat-er it was however found that this system suffered from a serious systematic error[5]. The ortho-positronium would sometimes live long enough to travel to thewalls of the experimental chamber. Upon collision with the wall, the positro-nium would be able to convert into para-positronium. This would decay bytwo-photon emission leading to a quenching of the observed three-photon sig-nal. At Arlington a magnetic system was used which confined all positrons,scattered and unscattered, to the system [25]. The only way positrons could belost were through positronium formation. By measuring the fraction of positronsthat were lost to positronium formation relative to the total fraction of the ini-tial beam scattered, the positronium formation cross section was determinedrelative to the total scattering cross section.
Around the same time experiments aiming to study the partial cross sectionsof inelastic processes (excitation and ionisation) appeared, see e.g. [26–29]. Ingeneral all of these experiments were based on a method suggested by Colemanet al. [30]. By using a time-of-flight method the energy of positrons which hadpassed through a gas cell was determined. Positrons which had collided inelas-ticly with the gas could be identified by having lower energy than the primarybeam. In this way the cross section for inelastic scattering could be determinedand through further analysis the cross sections for excitation and ionisationcould be disentangled. However the large energy width of the positron beamscomplicated this technique and made it almost impossible to e.g. distinguish

4 CHAPTER 1. INTRODUCTION
different excitation channels. This was further complicated by a general inabil-ity for these experiments to distinguish energy loss and large angle scattering.In many of the experiments the collection of scattered positrons was also lim-ited to an energy dependent forward scattering angle. There still are no othermethods than the energy loss technique for studying excitation. Examples ofrecent experiments are published in [31,32]. Measuring excitation cross sectionsby observing the de-excitation photons emitted from a target in coincidencewith a scattered positron has so far never been feasible due to the low intensityof positron beams. A study of simultaneous positronium formation and excita-tion in positron-molecule collisions is to date the closest to an attempt in thisdirection [33].
In 1986 Fromme et al. at Bielefeld introduced a new method for studyingthe partial cross sections for ionisation processes [34]. By detecting the ioncreated in coincidence with either the scattered or incident positron both di-rect and total ionisation cross sections could be measured. The positroniumformation cross section could be deduced be subtracting the former from thelatter. An important feature of this technique was the ability to single out aspecific ionisation mechanism. By determining the charge-state of the ion to bee.g. singly charged the measured cross sections would be single ionisation crosssections. All previous measurements of ionisation/Ps formation cross sectionshad in principle been studies of the sum of all ionisation/Ps formation processes.Comparison between the old and new data was still possible due to the fact thatsingle ionisation dominates over other ionisation processes by at least an orderof magnitude. The new technique however allowed the first studies of doubleionisation [35,36]. Today virtually all experiments studying ionisation use theion detection technique.
All the experiments discussed so far have involved measurements of angularintegrated cross sections. Emerging alongside these were experiments aimingto measure differential cross sections. Differential cross sections are from atheoretical point of view more interesting as they provide more stringent testsof theory. Differential cross sections often contain structures and effects thatare washed out in the angular integrated cross section. Developments in experi-ments for measuring differential cross sections have been more strongly disabledby the low intensity of positron beams than other experiments. Having to de-tect positrons or ejected electrons scattered into a small solid angle severelyreduces count rates. For this reason the most studied target has been argon,where the large cross section compensate somewhat for the lower detectionefficiency. The first experiments measured differential elastic scattering crosssections [37,38]. This later evolved into experiments studying ionisation usingsimultaneous ion detection, as in e.g. [39]. With improving beam intensitiesit also became feasible to study double differential cross sections by energyanalysing the positrons/electrons. Recent examples of such experiments are

1.1. ATOMIC COLLISIONS WITH POSITRONS 5
[40,41]. Finally on the absolute boarder of feasibility can be found a singlestudy of the triply differential cross section of molecular hydrogen [42].
In the early days of the field of atomic collisions with positrons there existeda regular gap between experiments and theory. This gap was mainly broughtabout by the difference in choice of systems studied. Experimentalists preferredto use easy-to-work-with targets like the noble gases or molecular gases, whichalso through their relatively large cross sections ensured reasonable count ratesdespite the low intensities of the positron beams. Theoreticians on the otherhand preferred the simple but experimentally elusive atomic hydrogen target.Also the fact that differential measurements were so few, as discussed in theprevious paragraph, did not improve the situation. Since then the gap has beensomewhat bridged by both sides. Today many experimentalists still prefer to usenoble or molecular gases, but some groups have taken on more ‘untraditional’targets like the alkali metals and magnesium [43]. The previously elusive hydro-gen target can also now be handled fairly comfortably due to the developmentof reliable hydrogen RF discharge sources [44].
At the present day new and exciting developments in the experimental tech-nique promise to change the field and provide even more detailed data for atomiccollisions with positrons. On the beam side the next generation of beam linesare becoming available. Utilising accumulators and traps, high intensity beamswith low energy spread can be produced [45]. This type of beam will be reviewedfurther in section 1.2.4. The first experiment using this new type of beam hasonly recently appeared [32]. On the collision experiment side the introductionof recoil-ion momentum spectroscopy (RIMS) promises all the advantages thatthis technique has already demonstrated in e.g. electron and ion impact ionisa-tion experiments. In general RIMS would be able to supply theory with more ofthe much requested differential cross section measurements. A general reviewof RIMS can be found in [46]. A progress report on one of the first experimentstrying to use RIMS to study atomic collisions with positrons has recently beenpublished [47].
The interest for positrons in Arhus came about from two directions. Thegroup was originally founded with the intention of studying ways to produceantihydrogen. The work in this direction still goes on today but is now doneelsewhere. The direct experimental engagement in Arhus in the project finishedwith the conclusion of the hydrogen test experiment [X,XI]. The other interest inpositrons came from studies of ionisation cross section dependence on projectilecharge and mass. Initial studies had been done with ion impact and were latersuccessfully expanded using antiprotons a projectiles (for further discussion ofthis work, see Knudsen and Reading [4]). In order to expand the investigationsto electron and positron impact for a more dramatic mass effect, a collaborationbetween UCL and Arhus was established to provide the, at that time, missingpositron cross sections. Several former master and Ph.D. students of this group

6 CHAPTER 1. INTRODUCTION
have contributed to this work [48–50]. The work presented in this thesis is tosome extent a continuation along this line, involving ionisation studies of atomsand molecules. Compared to the new developments mentioned in the formerparagraph, the experiments described in this thesis belong to the ‘old’ type.By this is meant that the experiments use the same technique as those usedover the last decade to produce the bulk of the ionisation data available today.Even some of the beam lines used are the same or improved versions of thoseused back then. However today these techniques are well tested and knownto produce reliable results, and by pushing them a little bit further new andexciting results can still be obtained.
1.2 Slow positron beam production
Behind every positron collision experiment is a beam line providing the posi-trons. It is not always discussed in the final publications, despite that muchexperimental work goes into the development of these beam lines. As men-tioned in the previous section, the progress in experiments with positrons havebeen closely linked to the developments in beam production technology. Animportant feature of slow positron beams is that they can be built in ‘table top’size using relatively simple technology. Since most of the interesting (atomic)physics occurs at energies below a few keV all acceleration voltages can be pro-vided by simple power supplies. This has allowed quite a few groups around theworld to build beam lines and participate in the field of atomic collisions withpositrons. This section is meant as a brief introduction to beam production. Amore complete and much cited review has been given by Schultz and Lynn [51]and another comprehensive review has more recently been given by Mills [52].
1.2.1 Positron sources
The main difference between positron and electron beams lies in the sourcesof the particles. While nearly unlimited amounts of electrons can be producedusing a simple heated filament, this is not possible for positrons. This wouldrequire an antimatter filament. Instead positrons must be obtained from ra-dioactive isotopes (β+ emitters) or be produced by e−- e+ pair production whichseverely limits the number of particles produced.
The radioactive isotopes are produced by nuclear reactions using either anaccelerator or a nuclear reactor. Some characteristics of the most commonlyused isotopes are listed in table 1.1. The positron yield from a source de-pends on the isotopes positron branching ratio and the source activity. Themaximum yield per area is limited by the self-absorption of the source. High-activity sources can be made by increasing the source area but this is not alwaysdesirable. The long-lived isotopes 22Na and 58Co are typically used in small lab-

1.2. SLOW POSITRON BEAM PRODUCTION 7
β+ branching Maximum Typical sourceIsotope Half-life ratio [%] energy [keV] activity [GBq]
22Na 2.6 y 90.6 546 0.5–258Co 70.8 d 15.0 474 5–2064Cu 12.7 d 19.3 657 ∼50
Table 1.1: Commonly used radioactive isotopes. The β+ branching ratio is thefraction of decays resulting in emission of a positron. The maximum energy is themaximum cut-off energy of the beta spectrum.
oratory beam lines where the source is mounted in a small capsule covered bya thin foil. A large fraction of the beam lines around the world use this typeof source. The more short-lived isotope 64Cu is normally used in conjunctionwith a nuclear reactor where the isotope is produced from 63Cu by capture ofthermal neutrons. The source can either be permanently mounted in the reactorcore, from where the positrons then have to be transported or the source can beremoved after irradiation and mounted in a separate beam line. Either way thisusually requires specialised equipment and involves strict safety precautions.
To attain positron intensities higher than those available from radioactivesources one has to use pair production. In this production scheme an acceleratordelivers a high-energy primary beam of e.g. 100 MeV electrons. This beam isimplanted into a high-Z material resulting in emission of intense bremsstrahlungradiation as the particles are stopped. Some of the bremsstrahlung photons willin turn convert into electron-positron pairs by pair production in the high-Zmaterial. Since both processes are strongly peaked in the forward directionwith respect to the primary beam, an intense shower of positrons is createdon the other side of the stopping material. Each primary projectile producesseveral positrons, the mean number depending on the projectile energy. Thetotal number of positrons is determined by the energy and current of the primarybeam. In principle unlimited intensities of positrons can be produced this way.One important feature of accelerator based beams is that the resulting positronbeam inherit the time structure of the primary beam. This means that if theprimary beam is pulsed (like from a LINAC) one gets a pulsed source of positronswhich can be very advantageous in certain experiments.
1.2.2 Moderators
The positrons produced by the sources discussed in the previous section cannot be used directly for atomic physics experiments. Positrons from radioactivesources have energies typically about half the maximum energy of the betaspectrum, i.e. a few 100 keV, while those produced in pair production can have

8 CHAPTER 1. INTRODUCTION
Figure 1.1: Advantage of moderation in production of 100 eV positrons. The curveis the normalised energy distribution for β+ particles emitted from a 22Na source.The shaded area shows the efficiency of velocity selection. The full bars show theefficiency of moderation and subsequent acceleration of the positrons using a typicalsource-moderator (polycrystalline tungsten) assembly.
mean energies of several MeV. These positrons are therefore not very usefulfor atomic physics where low-energy (≤ 1 keV) beams with well-defined energyare needed. One option would be to use velocity selection to choose low-energypositrons from the beta distribution. However as is illustrated in figure 1.1, theefficiency of this method can at maximum be in the range of 10−7. A moredesirable option would be to compress the entire beta distribution. Accordingto Liouville’s theorem such phase-space compression will require an irreversibleprocess. The simplest of such processes would be stopping the positrons ina solid. Positrons implanted into a solid thermalise through collisions on atime scale of less than 10 ps. There the positrons will diffuse around in thishostile environment with an average lifetime of ∼100 ps against annihilation. Itwas realised by Madansky and Rasetti already in 1950 [53] that this would besufficient time for some of the thermal positrons to diffuse back to the surfacewhere they could be re-emitted. This method of making low-energy positronshas later become known as moderation. Madansky and Rasetti were not able

1.2. SLOW POSITRON BEAM PRODUCTION 9
to observe the effect experimentally. Instead the first observation of reemittedlow-energy positrons was done by Cherry in 1958 [54]. It was however not until1972 that Canter et al. [55] discovered the first high-efficiency moderator, MgO.Being easy to produce and with an efficiency of ∼3 × 10⁻⁵ this moderatorcould produce low-energy positrons more efficiently than any other method.The discovery of the MgO moderator is usually considered the onset of low-energy positron physics. Today numerous other and more efficient moderatorsare known. The advantage of moderators is illustrated in figure 1.1. A positronbeam of any desired energy can be obtained just by accelerating the near-zeroenergy moderated positrons. Despite that moderators can be made reasonablyefficient today, many positrons are still lost in the process. Together with therelatively weak sources, this loss is the reason for the weak intensities of positronbeams and the experimental difficulties this gives rise to. Typical intensitiesof positron beams are in the order of 104–106 e+/s for source based beams,depending on source strength, moderator and beam transport. For acceleratorbased beams this number can go as high as 1010 e+/s.
Moderators can generally be classified into two groups: Negative work func-tion materials and wide band gap materials. The first efficient moderatorsdiscovered belonged to the negative work function materials. It was noted thatthe positrons emitted from these solids in general had mean energies a few eVhigher than expected for a thermal distribution. That meant that the positronsgained energy leaving the solid, giving rise to the name ‘negative work functionmaterials’. The theoretical explanation for this phenomenon (in metals) wasgiven by Tong in 1972 [56]. The work functions for electrons and positrons canbe viewed as having two contributions: One is the chemical potential of theparticle. For electrons this is the energy required to lift an electron from theFermi level and into vacuum. For the positrons a similar ‘binding energy’ arisesfrom the sum of the repulsive interaction with the ion cores in the solid andthe correlation potential from the attractive interaction with the electrons ofthe solid. The second contribution to the work functions arise from the effectof the solid surface dipole layer. At the surface the electron distribution tendsto spill out into the vacuum. Together with the ion cores inside the surface,these electrons create a dipole layer at the surface. The effect of this layer onan electron is to decelerate it as it leaves the solid, making it harder to remove.For the positrons the effect is the opposite. Positrons get accelerated by thesurface layer which counters the binding effect of the chemical potential. Forsome materials the contribution from the dipole layer is larger than the onefrom the chemical potential, making the positron work function negative.
Among the negative work function materials tungsten (W(110)) has thehighest reported efficiency of ∼3× 10⁻³ [57]. A moderator should in general bea single crystal solid. This is because defects tend to attract and trap positrons,preventing them from diffusing to the surface. To avoid this problem the mod-

10 CHAPTER 1. INTRODUCTION
erator can be prepared by heating it to high temperatures (annealing) whichremoves vacancies and dislocations. The width of the energy distribution ofpositrons emitted from a well-prepared single crystal is in the order of 0.5 eV(FWHM) or less. Popular alternatives to single crystals are polycrystallinetungsten foils or commercially available meshes. These are easier to prepareand handle and they allow for moderation in transmission mode as opposed toa thick crystal. However being polycrystalline the efficiency of these moderatorsis lower (∼10−4) and the energy width larger (1–2 eV FWHM).
The other group of moderators, the wide band gap materials, was discoveredlater than the negative work function moderators. Of this kind of moderatorthe rare gas solids are the most studied, but also diamond can be used. Thesematerials are all insulators characterised by large band gaps (> 5 eV). When ahigh-energy positron enters such a material it will only be able to lose energyefficiently as long as its energy is larger than the width of the band gap. Withinthe band gap energy loss can no longer take place by excitation, but only by thefar more inefficient phonon scattering. For this reason positrons slowed downin one of these materials are not thermalised completely and are considered tobe ‘hot’. These hot positrons have a longer diffusion length, so more of themwill make it to the surface of the moderator. At the surface the positron workfunction does not necessarily need to be negative for the positrons to be emittedfrom the solid. Since the positrons are hot, they may possess enough energy toovercome a positive work function and leave the solid. For these reasons thewide band gap materials have a higher positron yield than the typical negativework function material of around a factor of 10. One drawback is that beinghot the emitted positrons have a wider energy distribution of some 2–5 eV(FWHM). Of all moderators solid neon has the highest reported efficiency of∼7 × 10⁻³ [58]. Disadvantages of using rare gas solids are that they are noteasy to produce and have limited lifetimes. The production requires cryostaticcooling to a few Kelvin for the rare gases to solidify. The lifetime is determinedby how fast the surface of the moderator gets contaminated by other elementsand is therefore dependent on vacuum conditions. Typical lifetimes are in therange of hours. More experimentation with diamond could bring a solution tothese problems.
1.2.3 Beam transport
The simplest way to guide a low-energy positron beam is to apply a magneticfield along the direction of transportation. If a positron in the beam has avelocity component perpendicular to the beam direction it will be kept confinedto the beam by the cyclotron motion induced by the magnetic field. As a resultthe positron will follow a spiraling trajectory along the magnetic field lines.Since the positrons are so light and low in energy this guidance can be achieved

1.2. SLOW POSITRON BEAM PRODUCTION 11
by using even a modest magnetic field, which can be produced by for examplea solenoid or Helmholtz coils suitably placed along the beam line.
For some experiments however one may want to avoid having magnetic fieldspresent. An alternative is to use purely electrostatic guidance. The confinementof the beam in this case is not as good as in a magnetic beam which may causeloss of positrons during transport. However the electrostatic beam optics arewell understood and can be simulated in advance to minimise any loss.
One final thing should be mentioned about beam transport. This is the needto shift or deflect the slow positron beam out of the direct line of sight to thesource. This serves two purposes: Firstly, gamma radiation from the sourceis prevented from reaching the experimental region at the end of the beamline. Secondly by making the deflection energy/velocity dependent one ensuresthat the beam is monoenergetic and does not contain other components like forexample high-energy positrons from the source which have not been stoppedin the moderator. Such deflection can be done in various ways. In magneticsystems one can have a soft bend in the beam line and the confining magneticfield. Another popular choice for magnetic beams is to use an E × B velocityfilter with cylindrical (trochoidal) electrodes as devised by Hutchins et al. [59].In electrostatic beam line the deflection is usually done by a simple electrostaticanalyser.
1.2.4 Accumulators and traps
As mentioned in section 1.1 a new generation of beam lines is emerging. Char-acterising these beams is not that they devise new and more efficient ways ofmaking slow positrons, but rather make better and more economic use of thelimited amount of positrons available from the existing sources. The develop-ment of positron accumulators has been pioneered by the group of Surko in SanDiego. In their scheme positrons are caught using a Penning trap filled witha thin buffer gas (N2). Positrons are admitted into the trap at the top of thetrap potential. Through inelastic collisions with the buffer gas the positronslose energy and fall deeper into the potential and are trapped. In this way newpositrons can be stored on top of those previously trapped. Using this schemethe San Diego group has been able to accumulate as much as 108 positrons.One way to use the stored positrons would be to release them all at once cre-ating a very intense pulse. This could be used to study effects unobservablewith the intensity available from conventional beams. In San Diego they haveinstead devised a scheme where the positrons are allowed to slowly spill overthe top of the trap potential. In this way a beam with an energy resolutionmuch better than normal can be created. Energy widths of 18 meV (FWHM)have been achieved in this way [45]. This allows new high-resolution studies ofe.g. excitation [32].

12 REFERENCES
An alternative or further development of the San Diego accumulator wouldbe to use a Penning trap with the magnetic field supplied by a superconduct-ing magnet. In such an intense magnetic field positrons would lose energy byemitting synchrotron radiation. This would eliminate the need for a buffergas. The positrons would be able to cool down to the ambient temperaturewhich in a helium cooled trap would be only a few Kelvin. If released fromthe trap this would produce a beam with unprecedented intensity and energyresolution. Such a technique is presently being developed by the Arhus positrongroup [VII].
References
[1] P. A. M. Dirac, Proc. Roy. Soc. Lond. A 126, 360 (1930).
[2] C. D. Anderson, Science 76, 238 (1932).
[3] W. Heitler, The Quantum Theory of Radiation, 3rd ed. (Dover Publica-tions, New York, 1984), p. 270.
[4] H. Knudsen and J. F. Reading, Phys. Rep. 212, 107 (1992).
[5] M. Charlton, Rep. Prog. Phys. 48, 737 (1985).
[6] M. Charlton and G. Laricchia, J. Phys. B: At. Mol. Opt. Phys. 23, 1045(1990).
[7] W. Raith, in Photonic, Electronic and Atomic Collisions, Proc. of XXICPEAC, edited by F. Aumayr and H. Winter (World Scientific, Singapore,1998), p. 341.
[8] G. Laricchia and M. Charlton, Phil. Trans. Roy. Soc. Lond. A 357, 1259(1999).
[9] St. Mohorovicic, Astron. Nachr. 253, 94 (1934).
[10] M. Deutsch, Phys. Rev. 82, 455 (1951).
[11] M. Deutsch, Phys. Rev. 83, 866 (1951).
[12] J. A. Wheeler, Ann. NY Acad. Sci. 48, 219 (1946).
[13] Y. K. Ho, Phys. Rev. A 48, 4780 (1993).
[14] A. P. Mills, Jr., Phys. Rev. Lett. 46, 717 (1981).
[15] A. P. Mills, Jr., Phys. Rev. Lett. 50, 671 (1983).

REFERENCES 13
[16] S. Chu and A. P. Mills, Jr., Phys. Rev. Lett. 48, 1333 (1982).
[17] S. Chu, A. P. Mills, Jr., and J. L. Hall, Phys. Rev. Lett. 52, 1689 (1984).
[18] A. J. Garner, G. Laricchia, and A. Ozen, J. Phys. B: At. Mol. Opt. Phys.29, 5961 (1996).
[19] G. Laricchia, M. Charlton, S. A. Davies, C. D. Beling, and T. C. Griffith,J. Phys. B: At. Mol. Phys. 20, L99 (1987).
[20] G. Laricchia, S. A. Davies, M. Charlton, and T. C. Griffith, J. Phys. E:Sci. Instrum. 21, 886 (1988).
[21] D. G. Costello, D. E. Groce, D. F. Herring, and J. Wm. McGowan, Can.J. Phys. 50, 23 (1972).
[22] M. Charlton, T. C. Griffith, G. R. Heyland, K. S. Lines, and G. L. Wright,J. Phys. B: At. Mol. Phys. 13, L757 (1980).
[23] M. Charlton, G. Clark, T. C. Griffith, and G. R. Heyland, J. Phys. B: At.Mol. Phys. 16, L465 (1983).
[24] T. C. Griffith, in Positron Scattering in Gases, edited by J. W. Humberstonand M. R. C. McDowell (Plenum Press, New York, 1983), p. 53.
[25] L. S. Fornari, L. M. Diana, and P. G. Coleman, Phys. Rev. Lett. 51, 2276(1983).
[26] T. C. Griffith, G. R. Heyland, K. S. Lines, and T. R. Twomey, J. Phys. B:At. Mol. Phys. 12, L747 (1979).
[27] P. G. Coleman and J. T. Hutton, Phys. Rev. Lett. 45, 2017 (1980).
[28] P. G. Coleman, J. T. Hutton, D. R. Cook, and C. A. Chandler, Can. J.Phys. 60, 584 (1982).
[29] O. Sueoka, J. Phys. Soc. Japan 51, 3757 (1982).
[30] P. G. Coleman, T. C. Griffith, G. R. Heyland, and T. L. Killeen, J. Phys.B: At. Mol. Phys. 8, L454 (1975).
[31] S. Mori and O. Sueoka, J. Phys. B: At. Mol. Opt. Phys. 27, 4349 (1994).
[32] S. J. Gilbert, R. G. Greaves, and C. M. Surko, Phys. Rev. Lett. 82, 5032(1999).
[33] G. Laricchia, M. Charlton, and T. C. Griffith, J. Phys. B: At. Mol. Opt.Phys. 21, L227 (1988).
14 REFERENCES
[34] D. Fromme, G. Kruse, W. Raith, and G. Sinapius, Phys. Rev. Lett. 57,3031 (1986).
[35] M. Charlton, L. H. Andersen, L. Brun-Nielsen, B. I. Deutch, P. Hvelplund,F. M. Jacobsen, H. Knudsen, G. Laricchia, M. R. Poulsen, and J. O.Pedersen, J. Phys. B: At. Mol. Opt. Phys. 21, L545 (1988).
[36] M. Charlton, L. Brun-Nielsen, B. I. Deutch, P. Hvelplund, F. M. Jacobsen,H. Knudsen, G. Laricchia, and M. R. Poulsen, J. Phys. B: At. Mol. Opt.Phys. 22, 2779 (1989).
[37] P. G. Coleman and J. D. McNutt, Phys. Rev. Lett. 42, 1130 (1979).
[38] G. M. A. Hyder, M. S. Dababneh, Y.-F. Hsieh, W. E. Kauppila, and C. K.Kwan, Phys. Rev. Lett. 57, 2252 (1986).
[39] T. Falke, T. Brandt, O. Kuhl, W. Raith, and M. Weber, J. Phys. B: At.Mol. Opt. Phys. 30, 3247 (1997).
[40] A. Schmitt, U. Cerny, H. Moller, W. Raith, and M. Weber, Phys. Rev. A49, R5 (1994).
[41] A. Kover, R. M. Finch, M. Charlton, and G. Laricchia, J. Phys. B: At.Mol. Opt. Phys. 30, L507 (1997).
[42] A. Kover and G. Laricchia, Phys. Rev. Lett. 80, 5309 (1998).
[43] T. S. Stein, J. Jiang, W. E. Kauppila, C. K. Kwan, H. Li, A. Surdutovich,and S. Zhou, Can. J. Phys. 74, 313 (1996).
[44] J. Slevin and W. Stirling, Rev. Sci. Instrum. 52, 1780 (1981).
[45] S. J. Gilbert, C. Kurz, R. G. Greaves, and C. M. Surko, Appl. Phys. Lett.70, 1944 (1997).
[46] J. Ullrich, R. Moshammer, R. Dorner, O. Jagutzki, V. Mergel, H. Schmidt-Bocking, and L. Spielberger, J. Phys. B: At. Mol. Opt. Phys. 30, 2917(1997).
[47] R. D. DuBois, J. Phys. IV France 9, Pr6, 195 (1999).
[48] L. Brun-Nielsen, Master’s thesis, University of Aarhus, 1990.
[49] N. P. Frandsen, Master’s thesis, University of Aarhus, 1993.
[50] K. Paludan, Ph.D. thesis, University of Aarhus, 1997.
[51] P. J. Schultz and K. G. Lynn, Rev. Mod. Phys. 60, 701 (1988).

REFERENCES 15
[52] A. P. Mills, Jr., in Atomic, Molecular and Optical Physics: Charged Parti-cles, Vol. 29A of Exp. Meth. Phys. Sci., edited by F. B. Dunning and R. G.Hulet (Academic Press, San Diego, 1995), p. 39.
[53] L. Madansky and F. Rasetti, Phys. Rev. 79, 397 (1950).
[54] W. H. Cherry, Ph.D. thesis, Princeton University, 1958.
[55] K. F. Canter, P. G. Coleman, T. C. Griffith, and G. R. Heyland, J. Phys.B: At. Mol. Phys. 5, L167 (1972).
[56] B. Y. Tong, Phys. Rev. B 5, 1436 (1972).
[57] A. Vehanen, K. G. Lynn, P. J. Schultz, and M. Eldrup, Appl. Phys. A 32,163 (1983).
[58] A. P. Mills, Jr. and E. M. Gullikson, Appl. Phys. Lett. 49, 1121 (1986).
[59] S. M. Hutchins, P. G. Coleman, R. J. Stone, and R. N. West, J. Phys. E:Sci. Instrum. 19, 282 (1986).

.

Chapter 2
Ionisation of noble gases
2.1 Introduction
The noble gases are among the most studied targets in atomic collisions withpositrons. Ionisation studies of these gases have over the last decade improvedour understanding of ionisation processes greatly and helped the development ofwhat is now referred to as the ‘standard picture of ionisation’ [1]. Neverthelessthere are still processes, particularly in multiple ionisation, for which our knowl-edge is poor experimentally as well as theoretically. The main motivation forthe experiments presented in this chapter has been to provide data for a betterunderstanding of double ionisation by positron impact. Along with these, newdata for single ionisation were obtained for the heavier noble gases.
In single ionisation of a noble gas, A, by positron impact, one of two funda-mental processes takes place: Ionisation without and with positronium forma-tion, i.e.
e+ + A → A+ + e− + e+, (2.1)e+ + A → A+ + Ps. (2.2)
The two processes will in this thesis be referred to as direct single ionisationand single ionisation with positronium formation. In ion impact ionisation theprocess corresponding to (2.1) is often called ‘pure ionisation’. The process (2.2)is sometimes referred to as transfer or capture. The ions produced in (2.1) and(2.2) could in principle end up in an excited state (A∗+) but these processesare generally not discerned from the above as only the charge state of the ionis normally determined in experiments.
The partial cross sections corresponding to the processes (2.1) and (2.2)will be denoted σ+
I and σ+Ps respectively. If one performs a single ionisation
experiment in which it is not discerned whether positronium is formed or not,
17
18 CHAPTER 2. IONISATION OF NOBLE GASES
the measured cross section will be the total single ionisation cross section, σ+tot,
which is equal to the sum of σ+I and σ+
Ps. It is important not to confuse σ+tot
with the total scattering cross section which is sometimes denoted σtot.The two processes (2.1) and (2.2) have different threshold energies. The
threshold, E+I , of the direct ionisation channel is the ionisation potential of the
atom. The threshold, E+Ps, of the positronium formation channel lies 6.8 eV
below E+I . This difference is due to the energy gained from the binding of the
positronium. In this thesis, the gap between E+Ps and E+
I is referred to as theOre gap [2]. The strict definition of the Ore gap is the energy region in whichpositronium formation is the only inelastic channel open. This means that thegap is the region between E+
Ps and the first excitation energy, Eex, of the atom,provided that Eex is larger than E+
Ps as is the case in the noble gases. Otherwisethe gap does not exist. However in ionisation studies where excitation is of nointerest the definition of the Ore gap is usually broadened to include the entiregap between E+
Ps and E+I . Within the entire gap σ+
tot equals σ+Ps.
In double ionisation processes similar to (2.1) and (2.2) exist:
e+ + A → A2+ + 2e− + e+, (2.3)e+ + A → A2+ + e− + Ps. (2.4)
Analogous to single ionisation the two processes (2.3) and (2.4) will be referredto as direct double ionisation and double ionisation with positronium formation.In some works the positronium formation channel is also referred to as transferionisation. Following the notation for the single ionisation cross sections, thepartial cross sections corresponding to the two processes (2.3) and (2.4) aredenoted σ2+
I and σ2+Ps respectively. Similarly the threshold energies are E2+
I
and E2+Ps . The same 6.8 eV difference found between E+
Ps and E+I , exists be-
tween E2+Ps and E2+
I . Extending the analogy from single ionisation this gap issometimes referred to as the second Ore gap or just the Ore gap when it isimplicit that double ionisation is being discussed.
Apart from the two processes above, double ionisation may also take placeby a third process. This involves the formation of the negative positronium ion:
e+ + A → A2+ + Ps−. (2.5)
The process has threshold energy E2+Ps− which lies 0.3 eV below E2+
Ps due to theextra binding energy of the second electron. The corresponding cross sectionshould be denoted σ2+
Ps− . Due to the energy resolution of our positron beam andthe nature of our detection method, as will be described in section 2.2, we cannot separate the Ps− channel (2.5) from the Ps channel (2.4). Other groupsdoing similar experiments completely omit a discussion of this channel despitethat their experiments suffer from the same problem (see e.g. [3,4]). The totaldouble ionisation cross section, σ2+
tot, is equal to the sum of σ2+I , σ2+
Ps and σ2+Ps− ,
except within the second Ore gap where σ2+I is zero.

2.1. INTRODUCTION 19
Figure 2.1: Capture in double ionisation of helium by proton impact. (•) σ2+H by
Shah and Gilbody [5] and Shah et al. [6]; (◦) σ2+H− by Barnett et al. [7]. Proton impact
velocity given in atomic units.
There exist no experimental or theoretical estimates of how important thePs− channel is relative to the Ps channel in double ionisation. The only estimatethat can be obtained is through a comparison with the similar two processes inproton impact on helium:
p + He → He2+ + e− + H, (2.6)p + He → He2+ + H−. (2.7)
Measurements of the cross sections, σ2+H and σ2+
H− , for the two processes areshown in figure 2.1. The cross sections are plotted as function of proton impactvelocity. One way to estimate the importance of Ps− formation would be toassume that the behaviour of the positron cross sections are the same as theproton ones at a given impact velocity. From figure 2.1 one sees that doubleelectron capture is only important at impact velocities below ∼2 a.u. Viewedthis way the Ps− channel is of no importance since a positron travelling at avelocity of 2 a.u. or less has energy less than E2+
Ps− which therefore is insufficientto doubly ionise helium. It is the much smaller mass of the positron that causesthis difference to protons.

20 CHAPTER 2. IONISATION OF NOBLE GASES
Comparison of positrons to protons at low velocities is however, not asstraight forward as described above. As suggested by e.g. Raith [8], who lookedat positronium/hydrogen formation in single ionisation, it would be more re-alistic to compare positron and proton collisions with the same projectile exitvelocity. This is because at these velocities the positrons (unlike the protonswhich hardly change their velocity) suffer a dramatic change in velocity dur-ing the collision. This difference is again caused by the smaller mass of thepositrons. The effect is that positrons, at higher impact velocities, are more ef-ficient in capturing a target electron (in single ionisation) than protons are. Asthe positrons lose a large fraction of their total energy and suffer larger deflec-tion during the collision it is more likely for them to achieve the right matchingof velocity with the released electron. This is the all important condition fora capture process to take place. By comparing positrons and protons with thesame exit velocity this effect can to a certain extent be taken into account.
For the proton cross sections in figure 2.1 there is only an insignificantchange. The large mass of the proton makes the energy loss in the collisioninsignificant and the exit velocity is virtually the same as the impact velocity.For the positrons the calculation of the exit velocity for a given impact energy ismore complicated. Ignoring the 0.3 eV difference between E2+
Ps− and E2+Ps , one
first has to subtract E2+Ps from the impact energy. Next one has to remember
that Ps− is 1.5 times heavier than Ps. This makes the exit velocity of Ps ∼22%higher than that of Ps− formed from positrons with the same impact energy. Infigure 2.1 one sees that the maximum of σ2+
H− is around 1.2 a.u. This correspondsto a positron impact energy of ∼131 eV (∼59 eV exit energy Ps−). It shouldbe compared to σ2+
H at 1.22× 1.2 a.u. ≈ 1.46 a.u. This gives an estimate of thePs to Ps− formation ratio of approximately 3 to 1. At positron impact energiesof ∼100 eV and ∼200 eV respectively this ratio is 5 to 1 and at ∼250 eV it is10 to 1. So viewed in this way one has to say that the Ps− channel should givea contribution which, compared to that of the Ps channel, is significant fromE2+
Ps and up to some 100–150 eV above it.However it is not clear if one can make these kinds of comparisons between
double ionisation by positron and proton impact in either the impact or exitvelocity estimations. There is no experimental or theoretical evidence for this.Neither is it certain that these estimates done for a helium target can be usedfor the other noble gases. In conclusion we have to say that whenever, in theremainder of this chapter, Ps formation is discussed, we actually mean the sumof Ps and Ps− formation. We do however expect the contribution from the latterprocess to be smaller than or even insignificant as compared to the contributionof the former.
We will now turn to an introduction of the standard picture of ionisation anda brief review of some of the previous work done on single and double ionisationof the noble gases by positron impact. The standard picture of ionisation has

2.1. INTRODUCTION 21
Figure 2.2: Curves or smoothed curves fitted through measurements of the singleionisation cross sections of helium. Positron impact: ( ) σ+
tot by Moxom et al. [10],( ) σ+
I by Jacobsen et al. [11] and Moxom et al. [12]. Electron impact: ( ) σ+I
by Krishnakumar and Srivastava [13]. Proton impact: ( ) σ+tot, ( ) σ+
I both byShah et al. [5,6]. Antiproton impact: ( ) σ+
I by Andersen et al. [14] and Hvelplundet al. [15].
mainly been developed through comparisons of the cross sections for impactby the four projectiles: e+, e−, p and p [1]. In the introduction below we willbe discussing various effects in terms of all four projectiles. However as themain motivation of the present work has been to investigate the importance ofthe positronium channel in double ionisation (2.4), comparison of our data withproton and antiproton data will be limited in the later discussion. Investigationsof that kind have previously been discussed in the thesis and papers by Paludanet al. [9,XIII,XIV]. Threshold theories, like the Wannier theory, will not bediscussed below as chapter 3 is devoted to this.
2.1.1 Single ionisation
In figures 2.2 and 2.3 the single ionisation cross section for helium is plottedfor impact by various projectiles (e+, e−, p and p). These figures will be used
22 CHAPTER 2. IONISATION OF NOBLE GASES
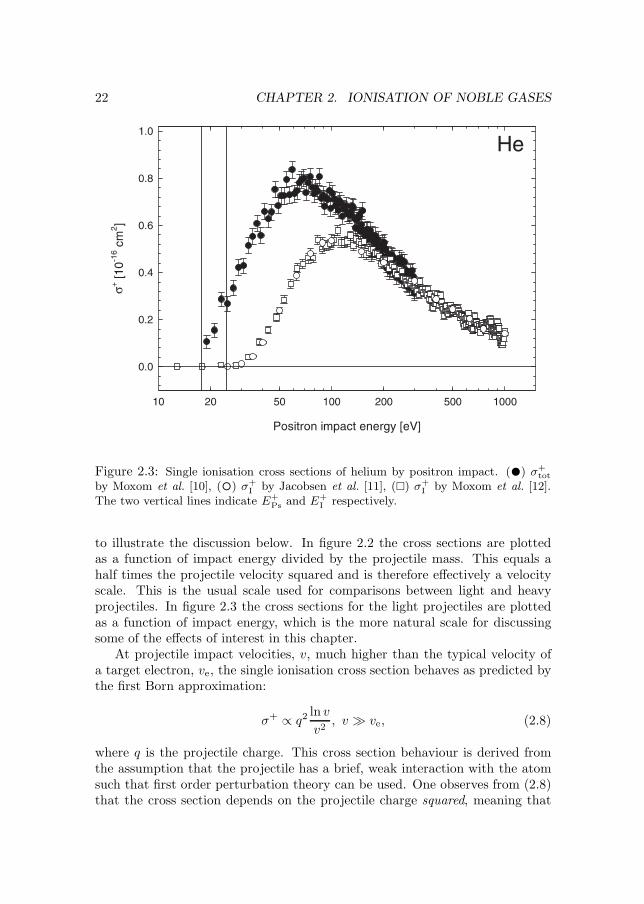
Figure 2.3: Single ionisation cross sections of helium by positron impact. (•) σ+tot
by Moxom et al. [10], (◦) σ+I by Jacobsen et al. [11], ( ) σ+
I by Moxom et al. [12].The two vertical lines indicate E+
Ps and E+I respectively.
to illustrate the discussion below. In figure 2.2 the cross sections are plottedas a function of impact energy divided by the projectile mass. This equals ahalf times the projectile velocity squared and is therefore effectively a velocityscale. This is the usual scale used for comparisons between light and heavyprojectiles. In figure 2.3 the cross sections for the light projectiles are plottedas a function of impact energy, which is the more natural scale for discussingsome of the effects of interest in this chapter.
At projectile impact velocities, v, much higher than the typical velocity ofa target electron, ve, the single ionisation cross section behaves as predicted bythe first Born approximation:
σ+ ∝ q2 ln v
v2, v � ve, (2.8)
where q is the projectile charge. This cross section behaviour is derived fromthe assumption that the projectile has a brief, weak interaction with the atomsuch that first order perturbation theory can be used. One observes from (2.8)that the cross section depends on the projectile charge squared, meaning that

2.1. INTRODUCTION 23
it is independent of the sign of the charge. Furthermore if plotted on a ve-locity (or E/m) scale there is no mass dependence either. In such a plot thecross sections of all (singly charged) projectiles whether positively or negativelycharged or whether light or heavy, should agree in this velocity regime. Thisbehaviour can be observed in figure 2.2. However this should be taken withreservation. When measuring cross sections experimentalists often rely on thevalidity of (2.8) to compare their data at high velocities with those of others toobtain an absolute scale for their cross section. As a result most absolute crosssections are normalised, sometimes indirectly, to the same set of measurements(Rapp and Englander-Golden [16]). The good agreement can therefore be anartifact of the normalisation. On the other hand one observes in figure 2.2 thatthe shape of the cross sections agree, which indicates the validity of (2.8) andthat the normalisation is sound. Capture processes are unimportant at highimpact velocities. As discussed before, these usually require v ≈ ve. Thereforeσ+
tot = σ+I at these impact velocities.
At projectile velocities lower than those above but which are still larger thanve, the projectile-atom interaction time becomes long enough for the target tobe polarised prior to ionisation. This polarisation is caused by the incomingprojectile attracting or repelling the target electrons depending on the projectilecharge. The effect is independent of projectile mass and only depends on thesign and size of the charge. Classically speaking the positive projectile attractsthe electrons, increasing the chance of ionisation, while the opposite happens forthe negative ones. This is reflected by the cross sections in figure 2.2 with thecross sections of the positrons and protons rising above those of the electronsand antiprotons at velocities below ∼1000 keV/amu. One observes that this isa charge and not a mass dependent effect as the positron and proton (electronand antiproton) cross sections stay merged below this velocity. This picturepersists until ∼500 keV/amu below which it is blurred by a mass dependenteffect setting in.
The electron and positron carry 1836 times less kinetic energy than equi-velocity protons/antiprotons. As the projectile impact velocity deceases, thisstarts to make the light projectiles less efficient at ionising the atom. Due tothis ‘lack of energy’ effect one observes that the (direct ionisation) cross sectionsof the light projectiles fall below that of their heavier counterpart. Also in thisvelocity regime capture (Ps and H formation) starts to set in making σ+
tot riseabove σ+
I . As discussed earlier this happens at higher velocities for positronsthan for protons, again due to the mass/energy effect.
At projectile velocities of the same order of magnitude as ve several neweffects start to influence the cross sections. As the velocity decreases, closecollisions become more important. For the proton and antiproton this givesrise to a number of effects. One is the ‘binding/antibinding’ effect where theproton/antiproton pass inside the electron cloud of the target, leading to an

24 CHAPTER 2. IONISATION OF NOBLE GASES
increase/decrease of the central charge in the atom as viewed by the electrons.This changes the binding of the electrons making them harder/easier to ionise.
Another important effect comes from the electrostatic Coulomb interactionbetween the projectile and the core/nucleus of the atom. The velocity of theprojectile is now so low that this Coulomb interaction may change the trajectoryof the incoming projectile. This ‘Coulomb trajectory’ effect causes the protonsto be decelerated and deflected away from the atom, while antiprotons getaccelerated further in towards the atom. Thirdly capture in proton impact isat its maximum probability at v ≈ ve. This leads to an overall increase in thetotal ionisation cross section for protons but at the cost of a decrease in thedirect ionisation cross section as capture is relatively more likely to take place.The sum of these three effects results in the direct ionisation cross section of theprotons decreasing below that of the antiprotons leading to a cross-over betweenthe two. This is what is observed in figure 2.2 at around 45 keV/amu.
For the electrons and positrons the picture is somewhat similar but witha few important differences. Due to the lower mass, the Coulomb trajectoryeffect is expected to be more important as the light projectiles are easier toaccelerate and deflect. The capture process has the same effect of raising thepositron cross section σ+
tot and lowering σ+I as on the proton ones. Contrary
to antiprotons, electrons are subject to the exchange mechanism, which tendto have the same effect of lowering the electron cross section as capture hason the positron direct ionisation cross section. The above effects cause thesame cross-over of the electron and positron direct ionisation cross sections asobserved between the proton and antiproton ones. However the most importanteffect for the light projectiles is the ever increasing significance of the ‘lack ofenergy’ effect. This causes the cross sections of both projectiles to decrease evenfurther until a velocity corresponding to E+
I is reached below which σ+I = 0. As
discussed earlier the same happens at E+Ps for σ+
tot for positrons.
The plots in figure 2.3 are better suited for emphasising the behaviour of thePs formation channel. One should remember that σ+
Ps is the difference betweenthe plotted σ+
I and σ+tot. The two threshold energies E+
Ps and E+I are indicated
by the two vertical lines in the figure and the region in between is the Ore gap.A few things in the figure should be noted: First of all Ps formation only gives asignificant contribution to the total cross section at energies below 200–300 eV.In this region however the channel grows with decreasing projectile energy tobecome the dominant one, contributing some 50% at the maximum of σ+
tot.Secondly one should note the threshold behaviour of σ+
Ps. One observes that inthe Ore gap σ+
Ps (or σ+tot) seems to start rising sharply from zero at E+
Ps andreach a significant value of ∼ 30% of the maximum value of σ+
tot already atE+
I . This should be compared to the slow rise from zero of σ+I above E+
I . Thisobservation of the near-threshold behaviour of Ps formation becomes importantwhen we later turn to discuss our results on double ionisation.

2.1. INTRODUCTION 25
Previous work on single ionisation of the noble gases by positron impact hasto a large extent focused on measuring direct ionisation cross sections as it isthese that can be directly compared to electron impact. For helium the two setsof measurements by Jacobsen et al. [11] and Moxom et al. [12] shown in figure2.3 are the most recent ones and are also considered to be the most reliable.The same groups (Arhus and UCL) have also performed measurements of σ+
I
for the other noble gases: Ne [11,17], Ar [11,12], Kr [12,17] and Xe [17]. Thegood agreement seen in figure 2.3 between the results of the two groups forhelium is also found for the other gases.
As mentioned in section 1.1, positronium formation cross sections, σ+Ps, have
earlier been measured directly by several different groups. At UCL σ+Ps was de-
termined for all the noble gases [18,19], but as discussed earlier these datasuffered from a systematic error. More confidence is placed in the measure-ments from the group at Arlington, who measured σ+
Ps for all the five noblegases [20–25]. In another experiment by Fromme et al. [26], σ+
Ps was deducedfrom simultaneous measurements of σ+
I and σ+tot. And finally using the same
technique as in the Arlington experiment Overton et al. [27] also measured σ+Ps
for helium.When it comes to measurements of the total ionisation cross section, σ+
tot,the amount of published data is far more scarce. This despite the fact thatthese cross sections (in principle) should be easier to measure than σ+
I and σ+Ps
as there is no need to discriminate between ionisation channels by e.g. detectingthe scattered positrons. Apart from the experiment by Fromme et al. [26]mentioned in the previous paragraph all other measurements have been doneby the group at UCL. Cross sections for helium and argon have been publishedby Moxom et al. [10,28] of which the helium data are those shown in figure2.3. These data are in full agreement with the older data by Fromme et al. Itshould however be noted that Moxom et al. used the data by Fromme et al. fornormalisation. Measurements of σ+
tot for all the gases have also been publishedin another study by Moxom et al. [29]. The emphasis of this experiment wasto study σ+
Ps by measuring σ+tot in the Ore gap and so the data are limited to
the near-threshold region. The measurements have however been extended upto higher energies [30], but apart form the argon data, which has briefly beenpresented in a conference paper [31], and the neon data, which has been madeavailable especially for us by Laricchia [30], the rest have remained unpublished.We will return to these cross sections in the discussion of our own results.Particular attention will be given to the argon data as a discrepancy existsbetween these data and those published by Moxom et al.
2.1.2 Double ionisation
The standard picture of ionisation is far less developed for double ionisationthan it is for single ionisation. Most of what is known concerns direct ionisation

26 CHAPTER 2. IONISATION OF NOBLE GASES
at high projectile impact velocities. Much less is known about the low velocityrange and about capture processes. When studying double ionisation it hasbeen customary not to investigate the cross sections directly but rather focuson the ratio:
R(2) ≡ σ2+
σ+. (2.9)
Experimentally this has certain advantages as we will return to later, but thereare also theoretical advantages to using this ratio. It has long been known thatthe key mechanism in double ionisation is the correlation between the two targetelectrons. In collisions at very high projectile impact velocity the projectile hastime for only a single interaction with the atom, just like in single ionisation.It is then electron-electron correlation that gives rise to double ionisation ofthe atom. One could therefore state that the double ionisation cross sectionis equal to the single ionisation cross section times a factor depending on theelectron-electron correlation. As it is the correlation that has been of interest inmany previous studies, it has made sense to study the ratio R(2) since it isolatesthe behaviour due to correlation mechanisms from the ‘trivial’ projectile-atominteraction. However, as it is the positronium formation channel (2.4) which is ofour main interest, we will tend to present our double ionisation data as absolutecross sections and only discuss them in terms of R(2) when it is more convenientfor comparison with previous experiments. However since single ionisation iswell-understood it is obvious that in the discussion of double ionisation below,it makes little difference whether we use the terms σ2+ or R(2).
In the discussion of double ionisation mechanisms the governing parameteris q/v, where as before q and v are the projectile charge and impact velocityrespectively. When comparing double ionisation data of light and heavy pro-jectiles, a velocity (or E/m) scale is again the appropriate choice. In figure2.4 the ratio for direct ionisation, R
(2)I , for e+, e−, p and p impact on helium
are plotted. This figure will be used to illustrate some of the concepts in thefollowing discussion.
As mentioned above, double ionisation at very high projectile impact ve-locities (v � ve) takes place through a single projectile-atom interaction inconjunction with correlation effects within the atom. It is customary to distin-guish between two different mechanisms: Shake-off (SO) and two-step 1 (TS1).In shake-off the first electron is (instantly) removed by the interaction with theprojectile. The remaining electron is left with a wave function which is not aneigenstate of the residual ion. In the subsequent rearrangement (shake) of theionic wave function there is a finite probability for the second electron to endup in a continuum state, thereby doubly ionising the atom. SO is a one-stepmechanism in that it can take place within the first Born approximation. Con-trary to this TS1, as the name indicates, is a two-step mechanism. This meansthat a second order Born term is needed to calculate the contribution from

2.1. INTRODUCTION 27
Figure 2.4: Ratio R(2)I for helium. Positron impact: (◦) by Charlton et al. [32].
Electron impact: ( ) by Charlton et al. [32]. Proton impact: ( ) by Shah et al.[5,6] and Hvelplund et al. [15]. Antiproton impact: ( ) by Hvelplund et al. [15]and Andersen et al. [33,34]. Other measurements exist of the electron and protonratios. However the advantage of those shown here (except those of [5,6]) is that theyhave been measured using the same type gas cell as in the positron and antiprotonexperiments. This should help eliminate systematic errors in the comparison betweenthe different curves
this mechanism. In TS1 the electron that interacts with the projectile leavesthe atom slowly enough to interact with the other electron and ionising it aswell. It is these two separate events that makes it a second order Born term.From the point of view of many-body perturbation theory (MBPT) diagrams,the correlation in TS1 is an electron-electron interaction while in SO it is anelectron-hole interaction.
It is the interplay between SO and TS1 which determines the asymptoticvalue of R
(2)I at high velocities. Since both mechanisms rely on a single projec-
tile-atom interaction the double ionisation cross section in this velocity regionis proportional to the single ionisation cross section and R
(2)I a constant. The
constant is for the same reason independent of the projectile charge as thedouble ionisation cross section depends on the charge squared just like the single
28 CHAPTER 2. IONISATION OF NOBLE GASES
ionisation cross section. For charged particle impact on helium the asymptoticvalue is found to be around 2.6 × 10⁻³ both experimentally and theoretically,see discussions in e.g. [1,35]. The velocity region in which this value is reachedis outside the range in figure 2.4.
It is not quite clear how high the exit velocity of the first electron has tobe for SO to be dominant over TS1. Experimentally it may not be possible todistinguish the two. At least not in the simple ion-counting type experimentswe perform. New experiments using RIMS (see discussion in section 1.1) mayin the future be able to do so through detecting different distribution patternsfor the two mechanisms in the recoil spectra. It is however certain that bothare important in determining the limiting value of R
(2)I . Even at very high
impact velocities the primary ejected electron tends to leave slow enough forTS1 to be important. This can be seen for example from comparison with thecorresponding ratio, R
(2)γ , for ionisation by high-energy photons. In photon
impact nearly all the energy of the photon tends to be deposited with theprimary electron which leaves very fast. The difference to charged particleimpact is seen in that the limiting value of R
(2)γ is around 1.7 × 10⁻² [35].
In figure 2.4 we are clearly below the asymptotic limit. One observes thatthe ratios of all the projectiles have not yet merged to a common constant.Rather the electron ratio seems merged with the antiproton ratio down to∼2000 keV/amu, while the positron and proton ones stay merged down to∼1000 keV/amu. Since all the single ionisation cross sections are merged atthese energies, as can be seen from figure 2.2, this difference lies entirely in thedouble ionisation cross sections. The effect causing this difference depends onthe projectile charge, particularly the sign of it. It arises from another mech-anism named two-step 2 (TS2) coming into play at these lower velocities (butstill v > ve). It was McGuire, who first suggested that it could be the interfer-ence between SO, TS1 and TS2 that gave rise to the observed difference [36].In TS2 the projectile is moving slowly enough to have time to interact withboth target electrons, ionising them individually. Since two separate eventstake place, TS2 is a second order Born mechanism just like TS1. However themajor difference from TS2 to SO and TS1 is that it is not correlation but directinteraction with the projectile that causes the double ionisation. This meansthat in a theory with no correlation within the atom, TS2 would be the lowestorder double ionisation mechanism. Similarly SO would be the only one in afirst Born calculation.
Since TS2 is the result of two separate electron ionisations, the cross sectionbehaves similarly to the product of two single ionisation cross sections. Thismeans that the cross section depends on the projectile charge to the fourthpower. However this should not result in any difference between the doubleionisation cross sections for impact of positively and negatively charged projec-tiles. This only appears in the following interference model. Looking at the

2.1. INTRODUCTION 29
probability amplitudes, a, of the three mechanisms, we have that
aSO/TS1 ∝ q/v, (2.10)
aTS2 ∝ (q/v)2 . (2.11)
In a velocity region where all mechanisms are important both (2.10) and (2.11)have to be included in the total probability amplitude
a = aSO/TS1 + aTS2
= c1 q/v + c2 (q/v)2 , (2.12)
resulting in an observable probability, P , which is
P = |a|2 = |c1|2 (q/v)2 + |c2|2 (q/v)4 + Re(c1c2) (q/v)3 , (2.13)
where c1 and c2 are independent of q and v. The expression in (2.12) correspondsto an expansion of a in a Born series in q/v. The probability in (2.13) translatesapproximately (ignoring the slowly varying ln v terms) into the ratio
R(2)I = C1 + C2 (q/v)2 + C3 q/v. (2.14)
In (2.14) we observe that due to the interference between aSO/TS1 and aTS2 thereis a term linear in q. This can explain the observations in figure 2.4. Theoreticalcalculations also indicate that C3 in (2.14) is negative [37] in agreement withthe observation that the electron and antiproton ratios lie above the positronand proton ones.
Finally it should be noted that the interference model is only a qualitativeexplanation for the observed effect. For a quantitative calculation one wouldhave to include the correlation in an even more complete way. For examplein the lowest order MBPT picture this would mean that one had to includeground state correlation, in which the electron-electron interaction takes placebefore the interaction with the projectile. This is the opposite of what happensin SO and TS1, which are due to final state correlation. Another approach tothe problem is the ‘forced impulse method’, which has been very successful forthe heavy projectiles (see e.g. [38]).
We should also here mention inner shell contributions stemming from Augerand Coster-Kronig processes. These are of course not relevant for helium butmay contribute to double ionisation in the other noble gases. The processesmay be viewed as SO where the two ejected electrons come from differentshells/subshells. Helms et al. have made predictions of the contribution todouble ionisation by electron and positron impact from inner shell processes[39] based on the theory by Lotz [40,41] and measurements by Carlson et al.[42]. Further discussion of the model and conclusions of Helms et al. will bepostponed to section 2.3.2.

30 CHAPTER 2. IONISATION OF NOBLE GASES
In the velocity region below ∼1000 keV/amu the situation becomes muchmore complicated as differences in the single ionisation cross sections also startto affect the R
(2)I ratios. In general we can only say that the double ionisation
cross sections and the ratios for the light projectiles again start to fall belowthe corresponding values for heavy projectile impact. This is due to the same‘lack of energy’ effect as in single ionisation. The effect is even stronger indouble ionisation as the ionisation threshold energy is higher and more outgoingparticles have to share the excess energy.
All of the above discussion involves direct double ionisation. When it comesto double ionisation with positronium formation, little theory exist. This ismainly because of the lack of data for this process and double ionisation ingeneral. Prior to our experiments the general conception of the behaviour of σ2+
Ps
was that it behaved just like the corresponding single ionisation cross section,i.e. rising sharply at the threshold E2+
Ps , reaching a significant value at E2+I
and being a dominant contribution to σ2+tot at low energies. We will discuss this
further in section 2.3.2.As stated before, prior to our experiments on the noble gases few double
ionisation measurements by positron impact existed. The first ever experimentwas done by Charlton et al. who measured R
(2)I for He, Ne and Ar [32,43].
Inspired by this Kruse et al. measured the same ratio for xenon [44]. The firstmeasurement of the total double ionisation cross section was done by Helmset al. who measured R
(2)tot for Ar, Kr and Xe [3,39]. Later they were the first to
deduce an absolute double ionisation cross section [45] by multiplying their ownratio for argon by a σ+
tot constructed by adding measurements of σ+Ps [20,46] to
measurements of σ+I [11]. In a recent experiment, Kara et al. measured both the
ratio R(2)I and the absolute cross section σ2+
I for Ne, Kr and Xe [17]. Furtherdiscussion of the results of the above experiments, plus those of an even morerecent experiment [4], together with our results will be given in section 2.3.2.Finally we should mention an experiment by Falke et al. in which σ2+
Ps for Ar andKr was measured directly [47–49]. This study however was differential withoutmeans of absolute normalisation. This study can therefore not say anythingabout the significance of the positronium formation channel, but can only claimto show its existence.
2.2 Experimental technique
All of our ionisation experiments on the noble gases have been performed usingthe Arhus electrostatic slow positron beam line. Six separate series of measure-ments were performed in all: One on each of the gases He, Ne, Ar, and Kr andtwo on Xe. In time the experiments span some 2 1
2 years from the first data onhelium to the last measurement on argon. During this time the experimental

2.2. EXPERIMENTAL TECHNIQUE 31
Figure 2.5: Schematic of the Arhus electrostatic beam line and gas cell. The addi-tional magnetic steering rods and Helmholtz coils are not shown. The lens elementsare made from 38 mm steel tube and the beam line is around 1 m long as measuredfrom the source to the grids at the end.
technique has to a large extent remained the same. As will be discussed below,the main difference has been that the Ar, Kr and second Xe experiments wereperformed using a gas mixture allowing us to measure both the absolute singleas well as the absolute double ionisation cross sections of these gases. Adjust-ments and improvements have also been made to the equipment, but these havemostly served to improve the stability and intensity of the positron beam andto reduce background. In the data analysis the introduction of mixed gasescaused some differences, but apart from this the main development has beenthe ability to take more and more experimental uncertainties into account inthe error estimation.
2.2.1 Experimental equipment
A schematic of the Arhus electrostatic slow positron beam line is shown infigure 2.5. The beam is source based, using a 22Na source. The activity of thesource was at the beginning of the experiments roughly 1.4 GBq (40 mCi) whichover the years has decayed to half the value of ∼0.7 GBq. The positrons aremoderated in a tungsten moderator made from a stack of four high-transmissiongrids which have been carefully annealed prior to installation. The source isalways held at a potential of a few volts higher than the moderator in order todrive slow moderated positrons emitted from the moderator in the backwardsdirection, back into the grids. The source and moderator are mounted in a Soagun [50], which takes care of the initial acceleration and focusing of the slow

32 CHAPTER 2. IONISATION OF NOBLE GASES
positrons. These are focused onto the 10 mm entrance hole of a 90◦ cylindricalelectrostatic mirror. This mirror serves to bend the beam out of the directline of sight to the source, preventing (together with lead shielding) the intensegamma radiation from the source from reaching the gas cell at the end of thebeam line. The mirror also acts as a crude energy analyser (∼200 eV energyacceptance window) removing from the beam any residual high-energy positronsnot stopped in the moderator.
On the exit side of the mirror, the beam gets transported and further focusedby a series of Einzel lenses. Four pairwise coupled conducting rods placedalong the beam direction around the outside of the vacuum tubing generatesa weak transverse magnetic field providing additional steering. At the end ofthe beam line, the positrons traverse four grids. The two central ones wereoriginally connected, but in the later experiments on Ar, Kr, and Xe, one gridwas removed, leaving only one central grid. The purpose of these grids is todecelerate the beam. All potentials for the beam line are provided by a high-voltage supply divided down by a resistive chain. The energy at which thepositrons are transported through the beam line is set by the potential of themoderator, which is usually held at around 960 V. The ground potential (Vf.gnd)of the high-voltage supply and the resistive chain can be floated by an additionalvoltage supply. Internally in the beam line this does not change the transportof the positrons as all potentials are set with respect to Vf.gnd. However at theend of the beam line, the last grid is permanently connected to the true ground.If Vf.gnd is set to be negative, the positrons will suffer a deceleration as theytraverse this last grid. The final energy of the beam can therefore be set solelyby adjusting Vf.gnd.
The beam enters the gas cell through a 10 mm aperture. In the region ofthe gas cell there are no means of steering the beam except for the Helmholtzcoils around the chamber. These are usually used to make the interaction regionfree of magnetic fields, but since this is of no importance to our experiments,the coils can be used to steer the beam. This is achieved by raising the fieldalong the beam direction to its maximum of a few Gauss, keeping the beammore focused while entering and passing the gas cell. The beam exits the gascell through a spherical retarding field analyser mounted on the downstreamside of the cell. The positrons can finally be detected by a multi-sphere-plate(MSP) detector. The DC beam intensity has at high energies been measuredon this detector to be around 3 × 10⁴ e+/s. From ∼300 eV and down to 50 eVthe intensity falls by a factor of 10. Below 50 eV it remains at a constant levelagain. This beam loss is probably due to defocusing in the deceleration of thebeam in the grids, causing a loss of positrons in the entrance aperture of thegas cell.
In runs below 110 eV, the beam energy distribution is measured directlyusing the retarding field analyser. Stepping the voltage on the central grids of

2.2. EXPERIMENTAL TECHNIQUE 33
the analyser using a multi-scaler, the integrated beam energy distribution canbe measured on the MSP detector. A typical beam energy spread of around1.5 eV (FWHM) has been found. The beam energy at higher energies is setthrough extrapolation of Vf.gnd from the low energies.
During experiments the beam was run in a pulsed mode. This was done bypulsing the voltage applied to the cylindrical mirror. Due to the wide energyacceptance window of the mirror, the voltage had to be switched down by∼200 V to turn the beam off completely. The positrons were pulsed on for1 µs with a repetition time of the order of 10 µs, reducing the effective beamintensity by a factor of 10. In the He, Ne and first Xe experiments, a gridplaced immediately after the moderator was used simultaneously with the bendto pulse the beam. The grid was however found to be superfluous and thereforeremoved before the subsequent experiments.
During measurements target gases were admitted into the gas cell through aneedle valve. The pressure was set depending on the gas, ranging from 2 mTorrfor He and down to 0.2 mTorr for Xe. These low pressures were maintained inorder to ensure single collision conditions, i.e. that each positron would at mostonly scatter once. Due to the low beam intensity and high pulsing rate, eachpositron pulse contained much less than one (∼0.03) positron. Together withthe low pressures this meant that only one ion was created per pulse, allowingfor single ion detection methods to be used. This was tested for all gases byperforming measurements at half the pressure, yielding consistent results.
The interaction region of the gas cell has been constructed as two parallelextraction plates. During the passage of the positron pulse, these plates wereheld at zero potential in order not to deflect and accelerate the positrons. Rightafter the passage of the beam, extraction voltages of equal size but oppositesign were applied to the plates. The size and duration of the extraction pulsevaried from gas to gas but were generally in the order of 150–200 V lasting1–1.5 µs. Any ions created would be extracted out of the interaction regionthrough a grid-covered hole in the negative plate and into a flight tube beforefinally being detected by a Ceratron detector. By using a time-to-amplitudeconverter (TAC) and a multi-channel analyser (MCA) the time-of-flight (TOF)between the onset of the extraction and the detection of the ion was measured.The flight time identified the mass/charge ratio of each ion. An example of aTOF spectrum can be seen in figure 2.6.
During the time from the end of the ion extraction pulse and to the passageof the next positron pulse, the extraction plates were in the early experimentsheld at zero potential. Later in the mixed gas experiments it was found thatapplying a sweep pulse to the extraction plates reduced the general backgroundin the TOF spectra. This is the background that just barely can be seen betweenthe peaks in figure 2.6. Reduction of this background was very important forthe signal to noise ratio in near-threshold measurements. The sweep pulse was

34 CHAPTER 2. IONISATION OF NOBLE GASES
Figure 2.6: Time-of-flight MCA spectrum from mixed gas (xenon-helium) experimentat 300 eV positron impact energy. The peaks can be identified by using that theirpositions follow the relation: Channel = a M/Q + b, where M and Q are the massand charge of the ion, while a and b are constants found by calibration. The smallnitrogen and oxygen peaks are due to residual background gas in the chamber.
generated by applying a positive pulse to the negative extraction plate in thetime gap between one extraction and the next positron pulse. Apart fromclearing up the TOF spectra, the sweep pulse also ensured that the interactionregion was free of any spurious ions prior to the admission of the positrons.
The optics of the extraction have been designed to provide both spatial andtemporal focusing of the ions. This means that the ions are spatially focusedonto the detector and that ions of the same kind arrive at the detector simulta-neously no matter from where in the interaction region they are extracted, thusgiving sharp peaks in the TOF spectrum. One observes in figure 2.6 that thepeaks are fairly well-defined except for a tail towards larger times. These tailsare due to the extracted ions undergoing collisions with the target gas resultingin the processes:
A+I + AII → AI + A+
II, (2.15)A2+
I + AII → AI + A2+II . (2.16)

2.2. EXPERIMENTAL TECHNIQUE 35
The new ions created this way are initially nearly at rest and are subsequentlyaccelerated towards the ion detector. Such ions give a tail on the ion peaksin the TOF spectrum. Evidence that the tails are caused by (2.15) and (2.16)are found in their pressure dependence. If one reduces the target pressure by afactor of 2 one observes the count rate of the main peak to go down by a factorof 2 as expected due to the lower target density. The count rate in the tail onthe other hand goes down by the factor of 2 squared i.e. 4 as both the numberof potential ‘projectiles’ and target atoms in (2.15) and (2.16) are reduced by afactor of 2 each.
In general we always observed a significant tail on the single ionisation peak,indicating the importance of (2.15). Tails were only observed in the double ioni-sation peak for the heavier gases as they were taken at relatively high pressures.The tails do not cause any problems themselves as they just have to be includedin the total number of counts. However one could fear that a doubly chargedion having a collision, instead of ending up in the tail due to (2.16) would belost due to the process:
A2+I + AII → A+
I + A+II. (2.17)
This process could potentially lead to an underestimation of the double ionisa-tion count rate. For helium we know that at the velocity the ions attain duringextraction and in the TOF region, the cross section for (2.17) is an order ofmagnitude smaller than the cross section of (2.16) [7]. For the other gases wehave not obtained such an estimate but have relied upon experimental tests.One would expect (2.17) to behave just like (2.16) with respect to the targetgas pressure. Since measurements at half the pressure yielded consistent results,we can conclude that any loss due to (2.17) is insignificant in these experiments.
Already during preliminary tests for the helium experiment it was found thata spurious background was present in the TOF spectra. It could be observedby performing runs at positron energies below the threshold E2+
Ps . At theseenergies double ionisation should not be energetically possible and yet a verysmall amount of counts were observed in the double ionisation peak in the TOFspectra. Further investigations into this background revealed that it stemmedfrom an electron component in the beam. It was found that the electrons havean energy, E−, corresponding to E− = E0 − E+, where E+ is the positronimpact energy and E0 ≈ 960 eV i.e. the electrons will be high-energy whenrunning low-energy positrons. The energy relation seems to indicate that theelectrons are generated by positrons hitting the last lens element or more likelyone of the first three grids in the decelerator. These are always held at Vf.gnd orat a potential very close to Vf.gnd, explaining the value of E0. Since the gridsact as a decelerator for the positrons, the electrons would instead be acceleratedby the grids right into the gas cell with an energy corresponding to the positrondeceleration i.e. E−.

36 CHAPTER 2. IONISATION OF NOBLE GASES
By using the MSP detector we found the electron current, n−, to be fairlyconstant over all positron energies below 600 eV. At first this seemed surprisingas one would expect it to be proportional to the positron current, n+, whichas mentioned before is not constant. However one has to remember that theelectrons are generated by the positrons in the first grids before the deceler-ation. Since the transport conditions inside the beam line is the same at allenergies, one would expect a constant amount of positrons reaching the firstgrids, explaining the observed n−. The electron current could not be measuredwith the MSP detector for positron energies above 600 eV. However in thisenergy range the exact behaviour of n− is not important since the ion back-ground induced by the electrons should be small compared to the number ofions produced by positron impact. We therefore assume that n− stays constantup until Vf.gnd ≈ 0.
Using our knowledge about n− and n+ we can correct for the backgroundin the data analysis as will be discussed in the next section.
2.2.2 Data analysis
The quantity measured in the pure gas experiments on He, Ne and Xe, was theratio, N2+/N+, between the number of counts in the double ionisation peak,N2+, to the number of counts in the single ionisation peak, N+. Both N+ andN2+ are corrected for the general background in the TOF spectrum. In ourexperiments there were no means of determining the final state of the positron.Therefore N+ contained counts from ions produced by both the processes (2.1)and (2.2). Similarly with N2+ and the processes (2.3) and (2.4) (and (2.5)) i.e.with Ps formation included.
The ratio N2+/N+ is related to the ratio R(2)tot by
R(2)tot ≡
σ2+tot
σ+tot
= εN2+
N+. (2.18)
The factor ε has been put in to correct for the difference in detector efficiencyfor the singly and doubly charged ions. Andersen et al. have found that thedetector efficiency for a Ceratron depends on the impact velocity of the ion onthe detector [33]. Due to the doubly charged ions being accelerated to a velocity√
2 times higher than the singly charged ions, the detector efficiency changeswith the charge state, except for the light ions. For helium and neon the ionshave irrespectively of the charge state sufficiently high velocity for the relativedetector efficiency to be 1 [33], i.e. ε = 1.
The advantage of measuring R(2)tot (or N2+/N+) is that it is independent
of the accumulation time, beam intensity, gas pressure and the geometry ofthe interaction region. The absolute total double ionisation cross section, σ2+
tot,can later be deduced from R
(2)tot by multiplication with known values of the

2.2. EXPERIMENTAL TECHNIQUE 37
total single ionisation cross section. Unfortunately things were not as straightforward in our experiments due to the electron induced background discussedin the previous section. Instead of (2.18) we had the relation
n+σ2+tot(E+) + n−σ2+
I (E−)n+σ+
tot(E+) + n−σ+I (E−)
= εN2+
N+, (2.19)
where n−, n+, E− and E+ are the currents and energies defined in section 2.2.1.σ+
tot(E+) and σ2+tot(E+) are like before the positron cross sections, while σ+
I (E−)and σ2+
I (E−) are the corresponding electron cross sections at the energy E−.From equation (2.19) one can isolate σ2+
tot(E+). However before we could deducevalues of σ2+
tot we needed an absolute calibration of the ratio n+/n−, for whichonly the shape was known (assuming n− constant and n+ a known functionof E+). This could be achieved using data taken at energies below E2+
Ps whereσ2+
tot = 0. At these energies (2.19) reduces to
σ2+I (E−)
n+n−
σ+tot(E+) + σ+
I (E−)= ε
N2+
N+, (2.20)
from which n+/n− could be calibrated. Using this in (2.19) the absolute totaldouble ionisation cross sections by positron impact were deduced.
Values of σ+tot(E+), σ+
I (E−) and σ2+I (E−) were found in the literature. For
all our noble gas experiments the electron cross sections of Krishnakumar andSrivastava [13] were used, except in the helium experiment where cross sectionsby Shah et al. [51] were used. For helium the values of σ+
tot(E+) shown in figure2.3 were used, while for neon the unpublished data by Laricchia [30] shown infigure 2.7 were used. In figure 2.7 are also plotted data for σ2+
I just to illustratethat the single ionisation cross section for neon behave completely analogousto those of helium and in accordance with the discussion in section 2.1.1. Forxenon however we were faced with a problem as no data for σ+
tot were available.To resolve this problem we turned to doing experiments using mixed gases.
In the mixed gas experiments, a mixture of the heavy noble gas under inves-tigation and helium was admitted into the gas cell. The idea was to determineboth the total single and total double ionisation cross section of the heavy gas(e.g. xenon) by measuring these relative to the known total single ionisationcross section of helium. For a heavy noble gas, A, we would therefore insteadof (2.18) be measuring the ratio
R(k)tot,AHe ≡
σk+tot,A
σ+tot,He
= ε(k)ρAHeNk+
A
N+He
, k = 1, 2. (2.21)
Like before Nk+A and N+
He are the ion count rates of the specified gases. ε(k)
corrects for the difference in detector efficiency between the ions of the heavy

38 CHAPTER 2. IONISATION OF NOBLE GASES
Figure 2.7: Single ionisation cross sections of neon by positron impact. (•) σ+tot by
Laricchia [30], (◦) σ+I by Kara et al. [17]. This cross section has also been measured
by Jacobsen et al. [11], but as their results agree with those of Kara et al. they arenot shown in this figure. The two vertical lines indicate E+
Ps and E+I respectively.
gas and the He+ ions. The factor ρAHe is the ratio between target densitiesof the two gases. This arises from two terms: First is the mixture ratio inthe gas bottle used. In all of our experiments we had a nominal ratio of 70%helium and 30% of the heavy gas. Secondly the target densities also dependedon how fast the gases diffused out of the gas cell. For thermal diffusion thiswould imply that 1
2Mv2diff = constant, meaning that the diffusion velocity vdiff
depends inverse proportionally on the square root of the mass of the gas, i.e.lighter gases escape faster than heavy ones.
Just as in the case of the pure gas experiments, corrections due to electroninduced background had to be made and (2.21) replaced by
n+σk+tot,A(E+) + n−σk+
I,A(E−)
n+σ+tot,He(E+) + n−σ+
I,He(E−)= ε(k)ρAHe
Nk+A
N+He
, k = 1, 2. (2.22)
All factors are as defined before. Calibration of n+/n− was again performed

2.2. EXPERIMENTAL TECHNIQUE 39
using below threshold double ionisation data. This calibration was then usedto deduce both single and double ionisation cross sections.
For double ionisation the factor ε(2) was calculated using estimates for thedetector efficiencies from the curve of Andersen et al. [33] just like in the puregas experiments. For the ions Ar2+, Kr2+ and Xe2+ values of the detectorefficiency (relative to the He2+ ion) of 0.95, 0.90 and 0.80 respectively wereused, all with an estimated uncertainty of 0.05. In single ionisation a differentapproach was used. Here the entire factor of ε(1)ρAHe was determined throughdirect normalisation of our data to the ratio σ+
I,A/σ+I,He for electrons at impact
energies above 700 eV. As discussed in section 2.1.1 this is a common approachbased on the first Born approximation for normalisation of single ionisationcross sections. From the values of ε(1) detector efficiencies for all the singlycharged heavy ions could be deduced and compared to the curve of Andersenet al. For Kr+ and Xe+ this yielded detector efficiencies of 0.80 ± 0.05 and0.63 ± 0.03 respectively in good agreement with the results of Andersen et al.However for Ar+ we found a value of 1.21 ± 0.07. This either meant that Ar+
was detected more efficiently than He+ in our experiment in disagreement withthe findings of Andersen et al. or more likely something else was going on.At first we suspected that a problem with the gas mixture ratio had led usto use a wrong ρArHe in our deduction of ε(1). However the final argon datawere taken over two separate runs using different gas bottles. These yieldedresults which only exhibited a difference in absolute magnitude so small thatit was within the expected variation on the gas mixture ratio. This at leastshowed that the two bottles contained similar mixtures. In the final data anaverage was taken using overlapping high-energy points in the two sets in orderto obtain better mixture accuracy. As another check on the mixture ratio, wededuced the double ionisation cross section for argon using the nominal gasmixture ratio and detector efficiency of Andersen et al. which, as will be seenin section 2.3.2, agrees well with several previous experiments. This indicatesthat the problem is not with the gas mixture and that it was limited to theAr+ ion. Another explanation of the problem could therefore be pick-up fromelectronic noise or other contamination of the Ar+ peak, though no traces ofsuch were observed. The nature of the problem therefore remained unresolvedand as a consequence the normalisation constant of Ar+ can not be satisfactorilyinterpreted in terms of experimental factors. However since the normalisationto electron data yielded good agreement with previous single ionisation data forargon (see section 2.3.1) we believe it to be reliable.
In all the mixed gas experiments cross-checks were made of the detectorefficiencies using electrons. This was done by setting the positron decelerationvoltage so high that all positrons were stopped at the end of the beam line andonly the background current of electrons would pass through the gas cell. Thissituation corresponds to n+ = 0 in equation (2.22). The efficiencies measured

40 CHAPTER 2. IONISATION OF NOBLE GASES
had unfortunately rather poor statistics due to the way they were obtained. Forargon we found values of 1.68 ± 0.43 and 0.80 ± 0.38 for Ar+ and Ar2+ ionsrespectively. For krypton the two values were 0.71±0.19 and 1.51±0.51 and forxenon 0.64 ± 0.12 and 0.82 ± 0.18 respectively. The high value for the Ar+ ioncould be related to the problem discussed above. The remaining values agreereasonably well with the values we used. Best agreement is seen in xenon.
Finally it should be remarked that one data point in the mixed gas xenonexperiment was taken at an energy below E+
Ps for helium. However assuming(2.22) valid even when σ+
tot,He(E+) = 0, the point could still be normalised.
2.3 Results and discussion
Our results for the total single and total double ionisation cross sections ofthe noble gases by positron impact are presented in the two following sections.All cross sections have been deduced as discussed in section 2.2.2 from relativemeasurements using the known σ+
tot for helium shown in figure 2.3. Exceptionsare σ2+
tot for neon which has been deduced using the σ+tot for neon shown in figure
2.7, and the pure gas σ2+tot for xenon which has been deduced using our own σ+
tot
from the mixed gas xenon experiment.The error bars on our data do not represent the same quantity in all of
the following figures. For σ2+tot for helium and neon they only represent the
statistical uncertainty whereas in the other cross sections they include all accu-mulated uncertainty i.e. statistical uncertainty and uncertainty introduced bybackground correction and normalisation to an absolute scale. This differencefrom the light gases to the heavy ones does not reflect any limitations imposedby the physics, but merely a development in our data treatment capabilities.The error bars in helium and neon could have been recalculated, but we havechosen to present the data here as they were originally published. In all casesthe statistical uncertainty is the dominant contribution to the error bars.
2.3.1 Single ionisation
Our results for the total single ionisation cross sections of argon, krypton andxenon by positron impact are presented in figures 2.8, 2.9 and 2.10 respectively.In figure 2.8 are also plotted a previous measurement of σ+
tot by Laricchia [31].In all the figures are, for comparison, included data for σ+
I by either Jacobsenet al. [11] or Kara et al. [17]. Extrapolated curves through these direct ionisationcross sections have been added to measurements of σ+
Ps by Fornari et al. [20]and Diana et al. [24,25] to provide an estimate of σ+
tot at low energies. Finallyin all figures the measurements of σ+
I for electron impact by Krishnakumar andSrivastava [13], which have been used for normalisation of our data, have beenincluded.

2.3. RESULTS AND DISCUSSION 41
Figure 2.8: Single ionisation cross sections of argon. Positron impact: (•) σ+tot
present results, (◦) σ+I by Jacobsen et al. [11]. This cross section has also been
measured by Moxom et al. [12], but as their results agree with those of Jacobsenet al., they are not shown in this figure. ( ) σ+
tot by Laricchia [31]. This cross hasalso been measured by Moxom et al. [10], see the discussion in the text. ( ) σ+
tot
sum of σ+Ps by Fornari et al. [20] and σ+
I by Jacobsen et al. [11]. Electron impact:( ) σ+
I by Krishnakumar and Srivastava [13]. The two vertical lines indicate E+Ps
and E+I respectively.
The behaviour of the cross sections are very similar for all three gases andcan be discussed as one. However, first we have to turn our attention to figure2.8. Here one observes a good agreement between the present data and themeasurement by Laricchia [31]. One also sees a reasonable merger between ourdata and the curve for σ+
tot estimated as the sum of σ+Ps by Fornari et al. [20]
and σ+I by Jacobsen et al. [11]. Both observations indicate of that our single
ionisation data for argon have been normalised correctly despite the problemdiscussed in section 2.2.2.
Regarding the data by Laricchia one has to remark that another set of datafor σ+
tot for argon was published by the same group nearly simultaneously withthose shown in figure 2.8 in a paper by Moxom et al. [10]. The measurements byMoxom et al. are normalised differently than our data and those by Laricchia,

42 CHAPTER 2. IONISATION OF NOBLE GASES
Figure 2.9: Single ionisation cross sections of krypton. Positron impact: (•) σ+tot
present results, (◦) σ+I by Kara et al. [17]. This cross section has also been measured
by Moxom et al. [12], but as their results agree with those of Kara et al., they arenot shown in this figure. ( ) σ+
tot sum of σ+Ps by Diana et al. [24] and σ+
I by Karaet al. [17]. Electron impact: ( ) σ+
I by Krishnakumar and Srivastava [13]. Thetwo vertical lines indicate E+
Ps and E+I respectively.
making them slightly larger than these at high energies. However at the crosssection maximum they are a factor of 2 higher than the Laricchia data whichis far more than can be accounted for by the different normalisation (factor of∼1.4). This discrepancy has never been discussed by any of the authors fromthe UCL group and remains unresolved. We choose in figure 2.8 to plot thedata by Laricchia as they are the most recent and are to be published togetherwith the cross sections for Ne, Kr and Xe in a forthcoming paper [30].
The single ionisation cross sections of the three heavy noble gases are seento behave in the same way as those of helium and neon in figures 2.3 and 2.7in accordance with the discussion in section 2.1.1. At high impact energies thecross sections for electrons and positrons are merged, due to the normalisationused. However one also observes that the shape of the cross sections are similar,indicating that we are in an energy region where the first Born approximationis valid.

2.3. RESULTS AND DISCUSSION 43
Figure 2.10: Single ionisation cross sections of xenon. Positron impact: (•) σ+tot
present results, (◦) σ+I by Kara et al. [17], ( ) σ+
tot sum of σ+Ps by Diana et al.
[25] and σ+I by Kara et al. [17]. Electron impact: ( ) σ+
I by Krishnakumar andSrivastava [13]. The two vertical lines indicate E+
Ps and E+I respectively.
Below ∼100 eV the present data for σ+tot start to rise above the corresponding
σ+I due to the growing importance of the positronium formation channel (2.2).
At the maximum of σ+tot positronium formation contributes around half of the
total cross section. Despite that our data do not extend all the way down tothreshold, their general trend seems to indicate a significant contribution frompositronium formation in the Ore gap. This is supported by the curves for σ+
tot
estimated from σ+Ps and σ+
I . These all show that σ+tot should rise sharply at
the threshold E+Ps and reach a value close to that of the cross section maximum
already at E+I . This shows that positronium formation is even more important
at low energies in these gases than in helium and neon. The present data mergereasonably with the estimated curves. Best agreement is seen for krypton infigure 2.9. In both krypton and xenon one observes that the estimated curvesovershoot our data at energies above ∼100 eV. This is because Diana et al.[24,25] find σ+
Ps to be non-zero at these energies, while a comparison between thepresent data and those for σ+
I indicates the opposite. In argon the estimate doesnot reach so high an energy. However if we had extended it by supplementing

44 CHAPTER 2. IONISATION OF NOBLE GASES
Figure 2.11: Double ionisation cross sections of helium. Positron impact: (•) σ2+tot
present results, ( ) σ2+I derived from R
(2)I by Charlton et al. [32] using σ+
I by Jacobsenet al. [11]. Electron impact: ( ) σ2+
I by Shah et al. [51]. The two vertical linesindicate E2+
Ps and E2+I respectively.
the σ+Ps by Fornari et al. [20] with the high-energy data for argon by Diana
et al. [22] the same would have been seen there. As discussed before it is not ingeneral believed today that positronium formation contributes significantly toσ+
tot at such high energies. This is also what is known from helium.In conclusion we may say that the present data for the total single ionisa-
tion cross section of argon, krypton and xenon by positron impact exhibit nosurprising features.
2.3.2 Double ionisation
Our results for the total double ionisation cross sections of the noble gasesby positron impact are presented in figures 2.11 to 2.15. In figure 2.15 thepresent results for xenon are plotted as two separate sets: One from the puregas experiment and another from the mixed gas experiment. In figure 2.13for argon is also plotted the previous measurement of σ2+
tot by Hippler et al.[45]. For comparison data for σ2+
I are included in all the figures. For Ne, Kr

2.3. RESULTS AND DISCUSSION 45
Figure 2.12: Double ionisation cross sections of neon. Positron impact: (•) σ2+tot
present results, (◦) σ2+I by Kara et al. [17], ( ) σ2+
I derived from R(2)I by Charlton
et al. [43] using σ+I by Jacobsen et al. [11]. Electron impact: ( ) σ2+
I by Krishnaku-mar and Srivastava [13]. The two vertical lines indicate E2+
Ps and E2+I respectively.
and Xe we have plotted the σ2+I measured by Kara et al. [17] and for He, Ne
and Ar are included values of σ2+I derived from R
(2)I by Charlton et al. [32,43]
using σ+I by Jacobsen et al. [11]. Finally data for double ionisation by electron
impact are included. In figure 2.11 for helium it is the results by Shah et al.[51] that are shown while in the remaining figures the results by Krishnakumarand Srivastava [13] are being displayed.
Before turning to discuss the detailed behaviour of the cross sections westart with two more general remarks: First one observes in figure 2.13 for argonthat there is a good agreement between the present results and those by Hippleret al. [45] over the entire energy range, verifying our experimental technique. Italso shows that all aspects of the data analysis are well understood includingthe normalisation of the double ionisation data. The normalisation problemdiscussed in section 2.2.2 is therefore clearly limited to the argon single ionisa-tion data. The second observation one makes is in figure 2.15 for xenon. Hereone notes a good agreement between the present results obtained in the pure

46 CHAPTER 2. IONISATION OF NOBLE GASES
Figure 2.13: Double ionisation cross sections of argon. Positron impact: (•) σ2+tot
present results, ( ) σ2+tot by Hippler et al. [45], ( ) σ2+
I derived from R(2)I by Charlton
et al. [43] using σ+I by Jacobsen et al. [11]. Electron impact: ( ) σ2+
I by Krishnaku-mar and Srivastava [13]. The two vertical lines indicate E2+
Ps and E2+I respectively.
gas experiment and those from the mixed gas experiment. Of course one hasto remember here that the pure gas data have been normalised using our ownmixed gas xenon single ionisation data shown in figure 2.10. Both sets of dataare therefore in essence normalised to σ2+
tot for helium. It however still shows aconsistency between our two methods and verifies our technique for measuringR
(2)tot in the pure gas experiment.
Starting at high energies one sees that the present cross sections behavemuch as expected. In all gases there is a merger between σ2+
tot and σ2+I . In
contrast to single ionisation this behaviour is not an artifact of some commonnormalisation and shows that there is no significant contribution from doubleionisation with positronium formation (2.4) to σ2+
tot at these energies. A fewminor deviations from the merger between the two cross sections are seen inkrypton and xenon. In figure 2.14 for krypton one observes that σ2+
I falls belowσ2+
tot at energies between 300 and 500 eV. We believe that this is due to a fewanomalously low points in σ2+
I rather than being an indication of positronium

2.3. RESULTS AND DISCUSSION 47
Figure 2.14: Double ionisation cross sections of krypton. Positron impact: (•) σ2+tot
present results, (◦) σ2+I by Kara et al. [17]. Electron impact: ( ) σ2+
I by Krish-nakumar and Srivastava [13]. The two vertical lines indicate E2+
Ps and E2+I respectively.
formation. In figure 2.15 for xenon one observes that the present data havea slight ‘bump’ at energies from 300 to 1000 eV which the corresponding σ2+
I
does not exhibit. This could possibly again be attributed to a few deviatingpoints. The observed bump is closely related to a structure seen in the ratioR
(2)tot. As can be seen in figure 4 in Bluhme et al. [IV] the R
(2)I by Kara et al.
[17] as well as other previous measurements of R(2)tot [39] and R
(2)I [44] all exhibit
similar structure. As there is no difference between between σ+I and σ+
tot atthese energies (see figure 2.10) one would expect the bump to be present in σ2+
I
as well. The conclusiveness of this is however limited by the scarcity of theσ2+
I data.The origin of the high-energy bump in σ2+
tot for xenon could be attributed toinner shell ionisation processes in which an inner shell electron is ionised by theinteraction with the positron followed by an Auger or Coster-Kronig processwhich leaves the atom doubly ionised. As already mentioned in section 2.1.2Helms et al. [39] have developed an estimate of the contribution to σ2+
tot frominner shell processes based on the semi-empirical cross sections by Lotz [40,41]

48 CHAPTER 2. IONISATION OF NOBLE GASES
Figure 2.15: Double ionisation cross sections of xenon. Positron impact: (•) σ2+tot
present results, pure gas, ( ) σ2+tot present results, mixed gas, (◦) σ2+
I by Kara et al.[17]. Electron impact: ( ) σ2+
I by Krishnakumar and Srivastava [13]. The twovertical lines indicate E2+
Ps and E2+I respectively.
and the branching ratios by Carlson et al. [42]. Comparing the estimates totheir measured ratios R
(2)tot for Ar, Kr and Xe Helms et al. conclude that inner
shell processes are responsible for most of the double ionisation at high energies.However there are several pitfalls in such a comparison: First of all comparingof ratios instead of absolute cross sections makes it hard to discern effects dueto σ2+
tot from those arising from σ+tot. As shown by the same group in a later
paper [45] the picture may change somewhat when comparing absolute doubleionisation cross sections instead. Secondly it is unclear how well inner shellcross sections are described by the Lotz model [52]. Finally there is the use ofthe branching ratios by Carlson et al. The ratios were measured using x-raysto create the inner shell vacancies in the atoms and are therefore effectivelymeasurements of R
(2)γ for inner shell ionisation. However as discussed in section
2.1.2 then it is generally known that there can be a large difference in magnitudebetween R
(2)γ and R(2) for charged particle impact. It is therefore questionable
whether or not the data by Carlson et al. can be applied in this situation.

2.3. RESULTS AND DISCUSSION 49
Finally it should be remarked that one would expect an inner shell contribu-tion in the electron cross section as well. However as discussed by Helms et al.[39] the contribution need not be the same for electrons as for positrons due tothe influence of the Coulomb trajectory effect (see section 2.1.1) which affectsthe two projectiles in opposite ways. This can explain why we do not observe abump in the electron cross section at the same energy.
Going down to intermediate energies the cross sections of the five gases startto differ in their behaviour. In figure 2.11 for helium one observes that at theseenergies there is still no difference between σ2+
tot and σ2+I , indicating insignificant
amounts of double ionisation with positronium formation. This suppression ofthe positronium channel (2.4) in helium is very surprising as it is opposite towhat is observed in single ionisation and therefore also generally expected fordouble ionisation (see section 2.1.2). Continuing to figure 2.12 for neon onenotices the disagreement between the two measurements of σ2+
I by Charltonet al. [43] and Kara et al. [17] respectively. Kara et al. attributed this differenceto inadequate discrimination against positronium formation in the experimentby Charlton et al. However such a lack of discrimination should only have putthe data by Charlton et al. somewhere between the σ2+
I by Kara et al. andthe present results for σ2+
tot. A contribution from σ2+Ps could never raise a σ2+
I
above our data unless these somehow should be in error for which we haveno indications. It therefore remains unexplained what, in the experiment byCharlton et al., has caused the disagreement. However even when comparingthe present σ2+
tot to the σ2+I by Kara et al. one finds none or at least very little
positronium formation at intermediate energies just like in helium. This is againunexpected. Turning to the three heavy gases one observes a change. In thefigures 2.13, 2.14 and 2.15 there is a clear difference between the present σ2+
tot andthe σ2+
I indicating that a contribution from positronium formation is presentat intermediate energies for all three gases. For argon and krypton this is inagreement with the findings by Falke et al. [48], who observed the existence ofpositronium formation in this energy range.
Descending to the threshold region and the second Ore gap one finds thatthe trend in helium and neon from the intermediate energies continues. Inthe second Ore gap where σ2+
tot equals σ2+Ps we find values for the cross section
consistent with zero in the entire gap for both gases, showing a clear lack ofdouble ionisation with positronium formation at threshold. The cross sectionsshow no indication of a sharp rise at E2+
Ps similar to that seen in σ+tot at E+
Ps.Instead the cross sections only start to rise slowly above E2+
I in a manner morelike the behaviour of σ+
I above E+I . It was this observation for the helium and
neon targets that first spurred our interest in the double ionisation thresholdbehaviour and lead us to conduct similar measurements on the three heavygases. Prior to our measurements Helms et al. [39] had seen an indication of arise in their ratios R
(2)tot for Ar, Kr and Xe within the second Ore gap. However

50 CHAPTER 2. IONISATION OF NOBLE GASES
it could be doubtful whether this was due to positronium formation or an effectof the poor energy resolution of their positron beam (∼6 eV FWHM [53]). Inargon one sees that the present results show a small rise within the second Oregap in agreement with the σ2+
tot derived by Hippler et al. [45] from the R(2)tot by
Helms et al. However the rise is still not as sharp that seen in single ionisation.In krypton our data are a bit inconclusive. In the second Ore gap the pointsseem to be consistent with zero, while the points right above E2+
I indicate asmall rise within the gap. When looking at the mixed gas results for xenon,which have the smallest error bars, there are a few points within the gap clearlyabove zero. This shows that there must be a rise, which is also supported bythe general trend of the data above E2+
I .
Our observations on the threshold behaviour have been supported by morerecent data. Inspired by our first paper on helium and neon [I] Moxom et al.[4] devised an experiment which would focus on the low-energy region. With amixed gas technique similar to ours they have measured σ2+
tot for Ne, Ar, Kr andXe with a better resolution. This was achieved by using a Penning trap-likesetup to increase the effective interaction length by several orders of magnitudeover ours [54]. Their results are shown separately together with the presentresults in figure 2.16. In general there is a good agreement between the presentresults and those by Moxom et al. An exception is in krypton where our dataare a bit lower than theirs at energies between 5 and 40 eV above E2+
Ps . In neonthe agreement is also a bit artificial. Moxom et al. perform a normalisation oftheir data using previous measurements. In neon they use our present resultsfor normalisation, explaining the observed agreement in absolute magnitude ofthe cross sections. In the remaining gases they use values deduced from theratios by Helms et al. [39]. One observes that the results by Moxom et al.confirm our conclusions about the behaviour of σ2+
tot at threshold: In neon theyalso find values of σ2+
tot consistent with zero in the entire second Ore gap. In thethree heavy gases they see a small rise within the gap indicating the presence ofdouble ionisation with positronium formation. The rise above E2+
Ps is howeverthe same slow one as we observe. If one takes the value of σ2+
tot at E2+I relative
to the value at the cross section maximum as a measure of the importance ofthe positronium channel (2.4), one sees that it increases with the mass of thetarget atom. However in double ionisation it never attains values as high asthe corresponding ratio in single ionisation, e.g. ∼15% compared to ∼75% forargon and krypton (see figures 2.8 and 2.9).
To briefly summarise we have found that double ionisation with positroniumformation is suppressed in helium and neon at all energies while in argon, kryp-ton and xenon a contribution from this channel is seen at low and intermediateenergies. The threshold behaviour exhibited in these gases is different fromthat seen in single ionisation. It should be remarked that a more quantitativediscussion of σ2+
Ps is mostly limited by the quality of data available on σ2+I .

2.3. RESULTS AND DISCUSSION 51
Figure 2.16: Threshold behaviour of the total double ionisation cross sections of thenoble gases Ne, Ar, Kr and Xe. (•) σ2+
tot present results, (◦) σ2+tot by Moxom et al. [4].
In xenon only the present mixed gas results are shown. The cross sections are plottedas a function of positron excess energy above E2+
Ps . The two vertical lines indicate inall the figures E2+
Ps and E2+I respectively.
In a very recent paper Humberston and Van Reeth [55] have given a possibleexplanation for the observed behaviour of σ2+
Ps at threshold. In their model theylook at the recapture process:
Ps + A2+ → A+ + e+. (2.23)
Arguing that the positronium formed in double ionisation travels at slowervelocities than the simultaneously escaping electron, the Ps will be left behindin the near vicinity of the doubly charged ion. In this situation there is aprobability for the process (2.23) to occur. This would lead to a reduction inthe number of doubly charged ions produced and to a suppression of the Pschannel (2.4). The quantity describing the strength of the Coulomb field felt bythe Ps and thereby also the probability for (2.23) to occur, is the energy, ∆E,released in the process. This is given by ∆E = E2+
I −E+I −6.8 eV = E2+
Ps −E+I .
The ∆E for the five noble gases are given in table 2.1. One sees that the values of∆E for helium and neon are somewhat larger than the values for the other gases.

52 CHAPTER 2. IONISATION OF NOBLE GASES
He Ne Ar Kr Xe∆E [eV] 47.62 34.16 20.83 17.56 14.41
Table 2.1: Values of ∆E for the noble gases.
According to Humberston and Van Reeth this should make the suppression ofpositronium formation stronger in helium and neon than in the other noblegases. This is in agreement with the experimental observations. FurthermoreHumberston and Van Reeth consider what happens as the positron energy israised well above E2+
Ps . Here they expect the velocity of the Ps to be larger thanit is near threshold, thereby reducing the probability of recapture. This explainsthe rise within the second Ore gap and the Ps formation at intermediate energiesobserved in Ar, Kr and Xe. However for helium and neon they suggest thatthe recapture probability remains high enough up to E2+
I for Ps formation tobe suppressed in the entire second Ore gap as observed. Even beyond E2+
I therecapture rate could remain high up to energies where the formation probabilityfor the Ps starts to be suppressed. The net result would be a suppression ofdouble ionisation with positronium formation at all energies in agreement withour observations. A disadvantage of the Humberston and Van Reeth model isthat they do not concern themselves with the formation of the positronium inany great detail. This mechanism could be as important for the behaviour ofσ2+
Ps as the recapture process.Finally Humberston and Van Reeth make an observation on positronium
formation in general. Recapture should, just like in double ionisation, occurin single ionisation. The recapture there would be the reverse process of (2.2).However the energy released in such a process would be equal to E+
Ps, and soonly a relatively small suppression would be expected. The two authors makea remarkable observation when plotting values of σ+
Ps and σ2+Ps measured within
the Ore gaps against the released energy i.e. E+Ps and ∆E respectively. In such
a plot the positronium formation cross sections seem to fit the relation:
σk+Ps =
A exp(−BEr)k2
, k = 1, 2. (2.24)
Er is the released energy and A and B are constants. The formula is purelyempirical and the factor of k2 added ad hoc. However the formula fits cross sec-tions ranging over five orders of magnitude which would indicate an underlyingmechanism. The validity of (2.24) will be tested in the near-future by Moxomet al. [56] by looking at triple ionisation (k = 3). One use of (2.24) would be topredict the value of σ2+
Ps for helium a few eV above E2+Ps . This yields approxi-
mately 1×10⁻²² cm2 [56] which is an order of magnitude smaller than the errorbars on the zero value we find ((2.2 ± 2.5) × 10−21 cm2 at 78 eV).

2.3. RESULTS AND DISCUSSION 53
Figure 2.17: Double ionisation cross sections of argon. Positron impact: (•) σ2+tot
present results, ( ) σ2+tot by Hippler et al. [45], ( ) σ2+
I derived from R(2)I by Charlton
et al. [43] using σ+I by Jacobsen et al. [11]. Electron impact: ( ) σ2+
I by Krishnaku-mar and Srivastava [13]. Proton impact: ( ) σ2+
tot, ( ) σ2+I both from DuBois
and Manson [57] and references within. Antiproton impact: ( ) σ2+I by Paludan
et al. [XIII,XIV].
Concluding this chapter we shall briefly return to the standard picture ofionisation. In all the figures 2.11 to 2.15 are included data for electron impactdouble ionisation. For all the gases, except xenon, there is no merger at highenergies between the positron and electron data as predicted in section 2.1.2.The data for argon and krypton show signs of a possible merger at energiesslightly above those in our figures. In all four gases the electron data lie abovethe positron data indicating that the constant C3 in (2.14) is negative. Toemphasise this we plot in figure 2.17 the data for argon from figure 2.13 ona velocity scale together with double ionisation cross sections for proton andantiproton impact. One observes that the cross sections in figure 2.17 staymerged towards lower velocities according to the sign of the projectile charge.This is the same behaviour as observed in figure 2.4 and confirms the interferencemodel. Finally in figure 2.15 for xenon one sees a somewhat different behaviourat high energies with our data lying above the electron ones. This is however
54 REFERENCES
due to the bump in our data discussed earlier on. If caused by inner shellprocesses this is clearly something not accommodated by the standard pictureof ionisation and therefore the deviation is quite understandable.
References
[1] H. Knudsen and J. F. Reading, Phys. Rep. 212, 107 (1992).
[2] A. Ore, University of Bergen Yearbook, Naturvitensk. rekke Nr. 9, 1949.
[3] S. Helms, U. Brinkmann, J. Deiwiks, R. Hippler, H. Schneider, D. Segers,and J. Paridaens, J. Phys. B: At. Mol. Opt. Phys. 27, L557 (1994).
[4] J. Moxom, D. M. Schrader, G. Laricchia, Jun Xu, and L. D. Hulett, Phys.Rev. A 60, 2940 (1999).
[5] M. B. Shah and H. B. Gilbody, J. Phys. B: At. Mol. Phys. 18, 899 (1985).
[6] M. B. Shah, P. McCallion, and H. B. Gilbody, J. Phys. B: At. Mol. Opt.Phys. 22, 3037 (1989).
[7] C. F. Barnett, J. A. Ray, E. Ricci, M. I. Wilker, E. W. McDaniel, E. W.Thomas, and H. B. Gilbody, Atomic Data for Controlled Fusion ResearchORNL 5206 (Oak Ridge National Laboratory, Oak Ridge, TN, 1977),Vol. 1.
[8] W. Raith, in Atomic Physics with Positrons, edited by J. W. Humberstonand E. A. G. Armour (Plenum Press, New York, 1987), p. 1.
[9] K. Paludan, Ph.D. thesis, University of Aarhus, 1997.
[10] J. Moxom, G. Laricchia, and M. Charlton, J. Phys. B: At. Mol. Opt. Phys.28, 1331 (1995).
[11] F. M. Jacobsen, N. P. Frandsen, H. Knudsen, U. Mikkelsen, and D. M.Schrader, J. Phys. B: At. Mol. Opt. Phys. 28, 4691 (1995).
[12] J. Moxom, P. Ashley, and G. Laricchia, Can. J. Phys. 74, 367 (1996).
[13] E. Krishnakumar and S. K. Srivastava, J. Phys. B: At. Mol. Opt. Phys.21, 1055 (1988).
[14] L. H. Andersen, P. Hvelplund, H. Knudsen, S. P. Møller, J. O. P. Pedersen,S. Tang-Petersen, E. Uggerhøj, K. Elsener, and E. Morenzoni, Phys. Rev.A 41, 6536 (1990).

REFERENCES 55
[15] P. Hvelplund, H. Knudsen, U. Mikkelsen, E. Morenzoni, S. P. Møller, E.Uggerhøj, and T. Worm, J. Phys. B: At. Mol. Opt. Phys. 27, 925 (1994).
[16] D. Rapp and P. Englander-Golden, J. Chem. Phys. 43, 1464 (1965).
[17] V. Kara, K. Paludan, J. Moxom, P. Ashley, and G. Laricchia, J. Phys. B:At. Mol. Opt. Phys. 30, 3933 (1997).
[18] M. Charlton, G. Clark, T. C. Griffith, and G. R. Heyland, J. Phys. B: At.Mol. Phys. 16, L465 (1983).
[19] T. C. Griffith, in Positron Scattering in Gases, edited by J. W. Humberstonand M. R. C. McDowell (Plenum Press, New York, 1983), p. 53.
[20] L. S. Fornari, L. M. Diana, and P. G. Coleman, Phys. Rev. Lett. 51, 2276(1983).
[21] L. M. Diana, S. C. Sharma, L. S. Fornari, P. G. Coleman, P. K. Pendleton,D. L. Brooks, and B. E. Seay, in Positron Annihilation, edited by P. C.Jain, R. M. Singru, and K. P. Gopinathan (World Scientific, Singapore,1985), p. 428.
[22] L. M. Diana, P. G. Coleman, D. L. Brooks, P. K. Pendleton, D. M. Norman,B. E. Seay, and S. C. Sharma, in Positron (Electron)-Gas Scattering, editedby W. E. Kauppila, T. S. Stein, and J. M. Wadehra (World Scientific,Singapore, 1986), p. 296.
[23] L. M. Diana, P. G. Coleman, D. L. Brooks, P. K. Pendleton, and D. M.Norman, Phys. Rev. A 34, 2731 (1986).
[24] L. M. Diana, P. G. Coleman, D. L. Brooks, and R. L. Chaplin, in AtomicPhysics with Positrons, edited by J. W. Humberston and E. A. G. Armour(Plenum Press, New York, 1987), p. 55.
[25] L. M. Diana, D. L. Brooks, P. G. Coleman, R. L. Chaplin, and J. P. Howell,in Positron Annihilation, edited by L. Dorikens-Vanpraet, M. Dorikens, andD. Segers (World Scientific, Singapore, 1989), p. 311.
[26] D. Fromme, G. Kruse, W. Raith, and G. Sinapius, Phys. Rev. Lett. 57,3031 (1986).
[27] N. Overton, R. J. Mills, and P. G. Coleman, J. Phys. B: At. Mol. Opt.Phys. 26, 3951 (1993).
[28] J. Moxom, G. Laricchia, and M. Charlton, J. Phys. B: At. Mol. Opt. Phys.26, L367 (1993).

56 REFERENCES
[29] J. Moxom, G. Laricchia, M. Charlton, A. Kover, and W. E. Meyerhof,Phys. Rev. A 50, 3129 (1994).
[30] G. Laricchia, private communication.
[31] G. Laricchia, in The Physics of Electronic and Atomic Collisions, Proc.of XIX ICPEAC, AIP Conference Proceedings 360, edited by L. J. Dube,J. B. A. Mitchell, J. W. McConkey, and C. E. Brion (AIP Press, New York,1995), p. 385.
[32] M. Charlton, L. H. Andersen, L. Brun-Nielsen, B. I. Deutch, P. Hvelplund,F. M. Jacobsen, H. Knudsen, G. Laricchia, M. R. Poulsen, and J. O.Pedersen, J. Phys. B: At. Mol. Opt. Phys. 21, L545 (1988).
[33] L. H. Andersen, P. Hvelplund, H. Knudsen, S. P. Møller, A. H. Sørensen,K. Elsener, K.-G. Rensfelt, and E. Uggerhøj, Phys. Rev. A 36, 3612 (1987).
[34] L. H. Andersen, P. Hvelplund, H. Knudsen, S. P. Møller, J. O. P. Pedersen,S. Tang-Petersen, E. Uggerhøj, K. Elsener, and E. Morenzoni, Phys. Rev.A 40, 7366 (1989).
[35] J. H. McGuire, N. Berrah, R. J. Bartlett, J. A. R. Samson, J. A. Tanis,C. L. Cocke, and A. S. Schlachter, J. Phys. B: At. Mol. Opt. Phys. 28, 913(1995).
[36] J. H. McGuire, Phys. Rev. Lett. 49, 1153 (1982).
[37] L. Vegh and J. Burgdorfer, Phys. Rev. A 42, 655 (1990).
[38] J. F. Reading, T. Bronk, and A. L. Ford, J. Phys. B: At. Mol. Opt. Phys.29, 6075 (1996).
[39] S. Helms, U. Brinkmann, J. Deiwiks, R. Hippler, H. Schneider, D. Segers,and J. Paridaens, J. Phys. B: At. Mol. Opt. Phys. 28, 1095 (1995).
[40] W. Lotz, Astrophys. J. Suppl. 14, 207 (1967).
[41] W. Lotz, Z. Phys. 216, 241 (1968).
[42] T. A. Carlson, W. E. Hunt, and M. O. Krause, Phys. Rev. 151, 41 (1966).
[43] M. Charlton, L. Brun-Nielsen, B. I. Deutch, P. Hvelplund, F. M. Jacobsen,H. Knudsen, G. Laricchia, and M. R. Poulsen, J. Phys. B: At. Mol. Opt.Phys. 22, 2779 (1989).
[44] G. Kruse, A. Quermann, W. Raith, G. Sinapius, and M. Weber, J. Phys.B: At. Mol. Opt. Phys. 24, L33 (1991).
REFERENCES 57
[45] R. Hippler, S. Helms, U. Brinkmann, J. Deiwiks, H. Schneider, and D.Segers, Can. J. Phys. 74, 373 (1996).
[46] T. S. Stein, W. E. Kauppila, C. K. Kwan, S. P. Parikh, and S. Zhou,Hyperfine Interact. 73, 53 (1992).
[47] T. Falke, W. Raith, and M. Weber, Phys. Rev. Lett. 75, 3418 (1995).
[48] T. Falke, T. Brandt, O. Kuhl, W. Raith, and M. Weber, J. Phys. B: At.Mol. Opt. Phys. 30, 3247 (1997).
[49] T. Brandt, T. Falke, and W. Raith, Nucl. Instr. and Meth. B 149, 201(1999).
[50] K. F. Canter, P. H. Lippel, W. S. Crane, and A. P. Mills, Jr., in PositronStudies of Solids, Surfaces, and Atoms, edited by A. P. Mills, Jr., W. S.Crane, and K. F. Canter (World Scientific, Singapore, 1986), p. 199.
[51] M. B. Shah, D. S. Elliott, P. McCallion, and H. B. Gilbody, J. Phys. B:At. Mol. Opt. Phys. 21, 2751 (1988).
[52] J. M. Rost, private communication.
[53] J. Paridaens, D. Segers, M. Dorikens, and L. Dorikens-Vanpraet, Nucl.Instr. and Meth. A 287, 359 (1990).
[54] J. Moxom, J. Xu, G. Laricchia, L. D. Hulett, D. M. Schrader, Y. Kobayashi,B. Somieski, and T. A. Lewis, Nucl. Instr. and Meth. B 143, 112 (1998).
[55] J. W. Humberston and P. Van Reeth, J. Phys. B: At. Mol. Opt. Phys. 33,L97 (2000).
[56] J. W. Humberston, private communication.
[57] R. D. DuBois and S. T. Manson, Phys. Rev. A 35, 2007 (1987).

.

Chapter 3
Modified Rost-Pattardtheory
In chapter 2 we looked at the total double ionisation cross section of the noblegases by positron impact. Comparison with theory was limited as virtually noneexists for total double ionisation. However one of the conclusions in chapter 2was that positronium formation is suppressed in double ionisation of helium andneon, particularly at threshold. Therefore our σ2+
tot for helium and neon must beapproximately equal to σ2+
I . This allows an unique opportunity for comparingour data to theories for direct double ionisation. One such theory is the so-called Wannier threshold theory which has recently been extended to doubleionisation by positron impact. In this chapter we will start with an introductionto Wannier theory and continue by discussing the semiempirical model for singleionisation by Rost and Pattard. Finally we will present the modified Rost-Pattard model we have developed for double ionisation and compare it to ourdata.
3.1 Wannier theory
Wannier theory was originally developed to describe the threshold behaviourin single ionisation of atoms and ions by electron impact1 [1]. It was inspiredby the corresponding law for two-particle break-up derived by Wigner [2] andwas based on some of the same ideas: In the fragmentation of a system intocharged particles, one can separate the process into a ‘reaction zone’ and a‘Coulomb zone’. In the reaction zone the detailed mechanics of the ionisation
1Despite not being discussed in the original paper, the theory can also describe doubleionisation by photon impact.
59

60 CHAPTER 3. MODIFIED ROST-PATTARD THEORY
process take place. A complete treatment of this part of the process wouldrequire an intricate quantum mechanical calculation. On the other hand in theCoulomb zone the fragments are drifting apart and only interacting throughlong-range Coulomb forces allowing for a classical treatment of their motion.Following Wigner, Wannier assumed that in near-threshold ionisation the en-ergy dependence of the cross section was determined entirely by the behaviourin the Coulomb zone. The reaction zone however was important for determiningthe absolute magnitude of the cross section. Even though Wannier ignored thereaction zone, he could still predict the energy dependence of the near-thresholdcross section.
In near-threshold ionisation the available phase-space in the Coulomb zoneis very limited. This is because the outgoing fragments have to be arrangedinto special configurations which allow for optimum usage of the scarce excessenergy available for escape. For the classic example of single ionisation byelectron impact the two electrons have to escape along a straight line, in oppositedirections away from the ion, while always keeping equal distances to it. Thisconfiguration as well as those of other systems are characterised by being in‘equilibrium’. In the classic case just described, it is the ion that is held atequilibrium midway between the two electrons. The ion has to stay here untilboth electrons escape (to infinity) for the ionisation to proceed successfully. Interms of the potential one often talks about a Wannier ‘saddle’ or ‘ridge’ uponwhich the system is in a unstable equilibrium. How the systems get arrangedinto these equilibrium configurations is not of concern to Wannier theory asthis takes place within the reaction zone. Wannier theory only predicts thatthey are necessary for the complete fragmentation (direct ionisation) to occur.For the configuration above Wannier found through classical calculations of thebreak-up the famous power-law σ+
I ∝ E1.127, where E is excess energy above theionisation potential E+
I . The exponent in the power-law is usually referred to asthe Wannier exponent or index. The result has later been confirmed quantummechanically [3,4].
In more recent papers concerning Wannier theory (see e.g. Poelstra et al.[5]) it has been realised that the mechanisms that govern the threshold power-law are the instabilities of the equilibrium configurations. These instabilitiesdescribe ways in which two or more fragments can end up in a bound stateand thereby lead to a failure of complete fragmentation. By the simple lawsof probability in quantum mechanics the chance of success is therefore also de-termined by the same instabilities. In a second order expansion of the systempotential, the instabilities are described as inverted oscillators. The ‘eigenfre-quencies’ of these oscillators determine the Wannier exponent through formulaederived quantum mechanically. Calculating Wannier exponents for various sys-tems therefore comes down to identifying the equilibrium configurations andthen determining eigenvalues for small deviations from these.

3.1. WANNIER THEORY 61
Approaches to finding the Wannier exponent of various systems are numer-ous. One of the most recent, and probably more elegant, has been publishedby Kuchiev and Ostrovsky [6]. Using what they call ‘scaling configurations’,they capture the essence of equilibrium configurations and the deviations fromthese in a very general way. After formulating the eigenvalue problem it isonly a question of a numerical calculation to solve it. Of the eigenvalues someare identified as belonging to the overall translation, rotation and expansionof the system. Of the remaining values, those which are negative describe un-stable modes. Another approach is that of Feagin et al. [5,7–9]. Using Jacobicoordinates to describe specific systems, they arrive at the eigenvalue problemthrough a number of rather tedious transformations. During these translation,rotation, overall expansion and sometimes also stable modes are removed ‘byhand’ leaving behind a reduced eigenvalue problem for the small deviations fromequilibrium. However it is important to realise that no matter which approachis used, the resulting eigenvalues should be the same. We will return to discussthis later.
Generalisation of Wannier theory to systems with three escaping electronswas first done by Klar and Schlecht [10]. The generalisation to systems with evenmore electrons is obvious as seen from the discussion in the previous paragraph.The same goes for systems with other particles than electrons and an ion. Klarwas the first to introduce positrons [11]. Looking at direct ionisation of atomichydrogen by positron impact (or equivalently direct ionisation of positronium byproton impact) he found the threshold law to be σ+
I ∝ E2.651. In more generalsystems than those containing only electrons and one ion, the center of massand center of charge do not necessarily coincide. The effect of this is that theequilibrium configurations do not necessarily have the high degree of symmetryas observed for systems with only electrons and one ion. Also for some systemsmore than one equilibrium configuration is possible. In these cases it is theconfiguration with the lowest Wannier exponent that determines the thresholdpower-law.
The first result for direct double ionisation by positron impact was calculatedby Poelstra et al. [5]. Looking at double ionisation of H− they found a Wannierexponent of 3.124 for this process. Upon request from us, Mendez and Feaginextended this result to Z = 2 i.e. double ionisation of a noble gas.2 They foundthat σ2+
I ∝ E3.613 at threshold [12]. E is still excess energy above the relevantthreshold energy i.e. E2+
I . Partially motivated by our work as well, Kuchievand Ostrovsky also looked at the process in their paper, finding a value of3.838 [6]. An explanation for the disagreement can not be given as Mendez andFeagin have not published the details of their calculation. However Kuchievand Ostrovsky also looked at double ionisation of H− for which comparison
2The mass of the target atom is taken to be infinite. The result should be valid within agood approximation for all the noble gases.

62 CHAPTER 3. MODIFIED ROST-PATTARD THEORY
Figure 3.1: Unstable normal modes in the plane break-up configuration of e+ on H−.Thin arrows are the Jacobi coordinates r, R and S used by Poelstra et al. [5]. Thickarrows indicate the direction of oscillation (eigenvectors) in the two unstable modesof the system.
can be made with the results by Poelstra et al. Both groups find initially thesame equilibrium configurations: Two linear and one plane. For the linearconfigurations they agree on the eigenvalues and therefore also on the partialWannier exponents these give rise to. However in calculating the final exponentKuchiev and Ostrovsky just add the partial exponents while Poelstra et al.multiply the sum by a phase-space factor. In this system this factor is equalto 2. Kuchiev and Ostrovsky dismiss this factor, which has partially beensupported by a more recent paper (and erratum) by Pattard and Rost [13,14].
Regarding the plane configuration the two groups agree that it is this onethat gives the lowest exponent and thereby the leading threshold law. In thisconfiguration the electrons escape in opposite directions along a line which isat 90◦ with the line connecting the proton and positron in a cross-like way asindicated in figure 3.1. Apart from the phase-space factor discussed above, asecond disagreement arises in this case. Kuchiev and Ostrovsky find two unsta-ble modes while Poelstra et al. only find one of these. Kuchiev and Ostrovskystate that the reason for this disagreement remains unclear. However one cansee either through an intuitive argument or a simple calculation, that it is theresult of Poelstra et al. that is in error. In the intuitive picture one can imaginethe proton and positron to be fixed in space. The instabilities of the electronsare that they can fall towards either of the positive particles. However this canhappen in two ways: Either they fall toward the same particle or instead onefalls toward the proton while the other falls toward the positron. In terms ofoscillations, these two ways represent two unstable normal modes. These couldbe denoted as ‘in-phase’ and ‘out-of-phase’ respectively.

3.1. WANNIER THEORY 63
The intuitive argument can be confirmed by a calculation. Following theapproach of Kuchiev and Ostrovsky, one can extend the calculation to notjust finding the eigenvalues but also the eigenvectors. The results for the twounstable modes are illustrated in figure 3.1. One observes that the calculationintroduces oscillation for the positron as well, which was fixed in the previousargument. This does not change the fact that there are two unstable modesbehaving as discussed in the previous paragraph.
In figure 3.1 are also shown the Jacobi coordinates used by Poelstra et al.to describe the system. The mistake they commit during their calculation is tofix r along S and also at the same time keep the angle between R and S fixedat 90◦. By doing so they ‘freeze out’ the out-of-phase motion. Only throughchanges in the length of r can the electrons move toward either the proton orthe positron. However they are confined to move toward the same particle.This is confirmed by the fact that the single eigenvalue which Poelstra et al.find, corresponds to the in-phase mode. If Poelstra et al. had not made thismistake, their final Wannier exponent would have been equal to twice the valuefound by Kuchiev and Ostrovsky due to the phase-space factor.
Returning to double ionisation of the noble gases by positron impact, onecould fear that the exponent by Mendez and Feagin suffers from problems similarto those seen in H−. In this case it is also the plane configuration that givesthe dominant power-law. Yet it is also clear that the problem is not exactlythe same. The result by Mendez and Feagin is not equal to twice the valueof any of the partial exponents found by Kuchiev and Ostrovsky, so somethingelse is going on as well. From an experimental point of view there is not muchdifference between the two results as they are numerically nearly equal. Howeveras can be seen from our discussion, more trust should be put in the exponentof Kuchiev and Ostrovsky. Finally it should be mentioned that a third value of3.764 has been published by Pattard and Rost [15]. However, this value shouldhave been in agreement with the one by Kuchiev and Ostrovsky according toone of the authors, who believe that the deviation comes down to numericalinaccuracy on their part [16].
Wannier theory has over the years been tested by a multitude of experimentsusing either electron or photon impact ionisation (see e.q. [17–21]). In generalgood agreement is found between the experimentally determined exponents andtheory. However views are divided when it comes to the range of validity i.e. howhigh above threshold the power-law should be valid. Theory does not provideany definite answer to this, but estimates are a few eV. The direct experimentaltests indicate in general ranges from below 1 eV and up to ∼5 eV with a fewclaiming ranges as high as ∼50 eV [22]. Only one test using positrons exists[23]. This has indicated that the range of validity for positron impact could besmaller than for electrons (< 1 eV). Finally one should, as always, rememberthat other threshold theories exist. Of these the Coulomb-dipole model by

64 CHAPTER 3. MODIFIED ROST-PATTARD THEORY
Temkin [24] is the one most often mentioned. This model predicts a crosssection which exhibits oscillatory structure at threshold. For a recent review ofthreshold theories in general, see Sadeghpour et al. [25].
3.2 Rost-Pattard theory
The Wannier theory only provides a parameterisation of direct ionisation crosssections in the near-threshold region. Attempts to describe cross sections overa larger energy range by semiempirical formulae are numerous. One exampleis the Lotz formula mentioned in section 2.3.2. It is characteristic for theseparameterisations that they mostly focus on the behaviour at high energiesand around the cross section maximum. The behaviour at threshold is rarelyaccounted for in any detailed way. One formula that does so for single ionisationhas been published by Rost and Pattard [26]. The idea behind their modelis to merge the threshold behaviour of Wannier theory with the high-energybehaviour of the first Born approximation in such a way that it also provides agood description of the cross section at intermediate energies.
As mentioned at the end of section 3.1, the range of validity is very limitedfor Wannier theory. At first it may therefore seem an odd choice of thresholdtheory to incorporate. Here one has to remember that the range of validity isthe range within which the cross section follows the power-law closely. Howeverthis does not mean that the slow onset at threshold dictated by the power-lawcan not influence the behaviour of the cross section up to much higher energies.For the high-energy behaviour, Rost and Pattard choose to use the classicalversion of the first Born result, i.e. σ+ ∝ E−1, which does not contain thelogarithmic term (see (2.8)). As they argue, this term only becomes importantat keV energies (for electron/positron impact) and can therefore be ignored forthis purpose. Rost and Pattard base their parameterisation on the function
f(E) =1
E + E0·(
E
E + E0
)α
(3.1)
→{
Eα for E → 0+
E−1 for E → ∞ ,
where E0 = EM/α. One identifies α to be the Wannier exponent in order forf(E) to have the right threshold behaviour. The behaviour at high energiesis also seen to be as desired. The energy EM is a free parameter. However itis easily shown that f(E) has its maximum at E = EM and that EM shouldtherefore be chosen to be equal to the energy at the cross section maximum.Both E and EM are excess energies above E+
I . The cross section is given by
σ+(E) = σM · f(E)f(EM)
, (3.2)

3.2. ROST-PATTARD THEORY 65
Figure 3.2: Direct single ionisation cross sections for hydrogen (helium) plotted inthe scaled coordinates x = E/EM and y = σ+/σM. ( ) y for proton impact [27,28],(•) y+0.5 for positron impact [29], ( ) y+1 for antiproton impact on helium [30,31],(◦) y + 1.5 for electron impact [32], ( ) Rost-Pattard parameterisation (3.3) forthe various projectiles. These curves only depend on the Wannier exponent of therespective systems.
where σM = σ+(EM) is the value of the cross section at its maximum. For aspecific cross section the two parameters EM and σM are found through a fit toexperimental data. Apart from these two parameters, the cross section in (3.2)only depends on the Wannier exponent. To emphasise this, one can transformthe cross section into the reduced coordinates x = E/EM and y = σ+/σM. Inthese coordinates (3.2) reduces to
y(x) =α + 1
α · x + 1·(
α + 1α · x + 1
· x)α
, (3.3)
which clearly only depends on the Wannier exponent. Viewed this way the Rost-Pattard model has therefore no free parameters. Figure 3.2 shows how well themodel compares to experimental data for impact ionisation by a wide range ofdifferent projectiles. This figure is nearly identical to the figure presented byRost and Pattard in their paper. The Wannier exponents used to plot the Rost-

66 CHAPTER 3. MODIFIED ROST-PATTARD THEORY
Pattard curves are those found by Rost and Pattard i.e. 1.127, 2.650, 1.199 and69.74 for e−, e+, p and p impact respectively. The value of α for antiprotonimpact is not entirely correct to use in figure 3.2 as it is the value for antiprotonimpact on hydrogen and not helium. However, as can be seen in the paper byRost and Pattard, this is less than ∼4% from the correct value.
One remarkable feature of the Rost-Pattard model is that for light projec-tiles (electrons or positrons) the scaling into coordinates x and y makes theparameterisation independent of the specific target as α is virtually the samefor all targets. The cross sections σ+
I of different targets under for exampleelectron impact, should therefore transform onto one common curve. This iswhat Rost and Pattard observe. However this observation is of a more generalkind as it does not depend on the specific parameterisation. It shows that thenatural scale of energy for σ+
I should be relative to EM rather than to E+I which
is the scale most widely used in parameterisations. The same statement is notnecessarily true for heavy projectiles like protons and ions. At least accordingto the Rost-Pattard model there could still be some target dependence in (3.3)through the Wannier exponent α. This is because when calculating α one cannot assume the target mass to be infinite relative to the projectile mass as isthe case for electron and positron impact. The Wannier exponent has thereforesome target dependence for these heavy projectiles. However the Wannier ex-ponents for proton and ion impact are generally large (e.g. 69.74 for p on H).One can show that
y(x) → 1x· exp
(1 − 1
x
)for α → ∞ . (3.4)
This means that provided that α is sufficiently large for all targets, y(x) is inde-pendent of its value, making the observation on the scaling true for proton andion impact as well. For antiprotons the dynamics of the break-up configurationare such that α is nearly the same for all targets anyway (∼1.2). The obser-vation on the scaling should therefore be true for antiproton impact ionisationcross sections as well.
The Rost-Pattard model of course also has its limitations. Its descriptionof direct single ionisation cross sections can not be applied to all types of tar-gets and projectiles. The parameterisation describes a smoothly varying crosssection. Cross sections exhibiting any kind of structure will therefore not bedescribed well by the model. Rost and Pattard themselves characterise themodel as applicable to cross sections which are dominated by ionisation of tar-get electrons with the same ionisation potential. This will ensure a uniquedetermination of the excess energy. In ‘standard’ ionisation experiments, likeours, this would mean cross sections dominated by outer shell ionisation.
Finally it has to be discussed whether or not the Rost-Pattard model has anyimplications for our understanding of the cross sections it describes. The pa-rameterisation in itself gives no real further insight into ionisation mechanisms

3.3. MRP THEORY AND DISCUSSION 67
as it has not been ‘derived’ in any stringent way such as through quantum me-chanics. However the fact that so many cross sections can be fitted to the samesimple formula seems to be a sign of some common underlying mechanisms. It isthe opinion of Rost [16] that the model should apply to σ+
I of any ‘simple’ targetwhich behaves in accordance with the discussion above. If an uncharacterisedcross section fits the model, this serves as an indication that the cross sectionis dominated by direct ionisation. However if a cross section does not fit themodel it should be a clear sign that the cross section contains other channelsthan that of outer shell direct ionisation. These points will be important forthe discussion of our modified Rost-Pattard model in the next section.
3.3 MRP theory and discussion
As mentioned already in the beginning of this chapter, it was our hope to beable to make a comparison between our data and Wannier theory. Howeveras discussed at the end of section 3.1, the energy range over which such acomparison could be made, would probably be very limited. Inspired by thesuccess of the Rost-Pattard model we set out to develop a modified Rost-Pattard(MRP) theory, that could describe our data over a wider energy range.
The Rost-Pattard model contains two aspects: A scaling law and a pa-rameterisation. Our model contains the same two aspects. The scaling law isbasically the same with x = E/EM and y = σ2+/σ2+
M , except that E and EM
now are both excess energies above E2+I . Just like in the Rost-Pattard model
the scaling is crucial. If we want to have any hopes of describing our data bya simple target independent formula like (3.3) the cross sections have to scaleonto a common curve. As can be seen in figure 3.3 this is actually the case withour data for σ2+
tot for helium and neon. The two sets of data are observed toagree extremely well when scaled into the coordinates x and y. With respectto the parameterisation further modifications are needed. As discussed in sec-tion 2.1.2 the energy dependence in the range corresponding to our high-energydata is not expected to follow the first Born approximation due to the interplaybetween the different double ionisation mechanisms. We therefore replace theE−1 high-energy behaviour of the Rost-Pattard model with a more general E−β
behaviour. The specific choice of the constant β will be discussed in a moment.As a result we base our parameterisation on the function
f(E) =1
(E + E0)β·(
E
E + E0
)α
(3.5)
→{
Eα for E → 0+
E−β for E → ∞ ,
where E0 = EM·β/α in order for EM to retain the meaning of being the energyat the cross section maximum. α should now be the Wannier exponent for

68 CHAPTER 3. MODIFIED ROST-PATTARD THEORY
Figure 3.3: Double ionisation cross sections for helium and neon plotted in the scaledcoordinates x = E/EM and y = σ2+/σM. (•) present results for helium, (◦) presentresults for neon, ( ) modified Rost-Pattard parameterisation (3.7) for positronimpact with α = 3.838 and β = 1.5.
double ionisation. The cross section is as before given by
σ2+(E) = σM · f(E)f(EM)
, (3.6)
where σM = σ2+(EM) again is the value of the cross section at its maximum.When expressed in the scaled coordinates x and y (3.6) reduces to
y(x) =(
α + β
α · x + β
)β
·(
α + β
α · x + β· x
)α
, (3.7)
which is independent of any specific target as long as α and β are constants.One also sees that (3.7) reduces to the Rost-Pattard parameterisation (3.3)when β = 1, as expected.
In our model we use the Wannier exponent value of α = 3.838 found byKuchiev and Ostrovsky [6] because we, as discussed in section 3.1, considerthis most reliable. The value of β is determined by the different high-energy

3.3. MRP THEORY AND DISCUSSION 69
double ionisation mechanisms. Returning briefly to section 2.1.2, we find that(ignoring logarithmic terms) the cross section due to SO or TS1 alone wouldbehave in a manner corresponding to β = 1 while that of TS2 would have aβ = 2 high-energy behaviour. In order to account for the interference betweenthese mechanisms, we therefore chose an intermediate value of β = 1.5 for ourmodel.
The parameterisation (3.7) is compared in figure 3.3 to the present resultsfor double ionisation of helium and neon. One observes a very good agreementbetween the data and the curve. As discussed at the end of section 3.2, this mayindicate that both cross sections are predominantly due to direct ionisation inaccordance with the conclusions of chapter 2. To test the MRP model furtherwe also compare it to the present results for argon and krypton. In chapter 2we found a contribution from double ionisation with positronium formation toσ2+
tot for these two gases. One would therefore expect some sort of deviation forthese data from the MRP model as this should only describe direct ionisation.The scaled cross sections for argon and krypton are plotted in figure 3.4, whichis similar to figure 3.3. One observes that there is a clear deviation between thedata and the curve. At low x (< 1) the points seem to lie above the curve. Thiscould be due to the Ps formation at near-threshold energies. Secondly one seesthat at high values of x (> 1) the data and the curve exhibit different energydependencies, indicating that maybe β = 1.5 is not the ideal choice for thesedata. As a result of this bad fit, the maxima of the cross sections are shifted tovalues of x and y slightly less than 1. One could therefore say that there is anobservable influence from the positronium channel.
The conclusions above should however be taken with reservation. One hasto remember that the MRP model contains the parameter β, the value of whichis chosen more or less ‘arbitrarily’. Another value of β could possibly changethe outcome. To test this, one can perform fits in which not just EM and σM,but also β are fitted. For helium and neon this yields a value β = 1.32 ± 0.06.This is not much below the 1.5 we had chosen. Also one does not gain any realimprovement in the overall fit of the curve compared to that with β = 1.5. Forargon and krypton one finds β = 1.11±0.05. This value is in clear disagreementwith the one we found for helium and neon confirming that the high-energybehaviours are different. The value for argon and krypton is actually more inagreement with the β = 1 for the original Rost-Pattard model. This new fitgives much better agreement between the curve and data at high energies andalso around the maximum, but the deviations at low x persists. So there is stillan observable influence from positronium formation. Finally one can fit theMRP model to our data by varying all of parameters of the model, includingα. This yields α = 2.43 ± 0.24 and β = 1.70 ± 0.15 for helium and neon, andα = 2.16 ± 0.38 and β = 1.23 ± 0.09 for argon and krypton. In both casesthe lower value of α gives a slightly better fit at low x. One sees that the

70 CHAPTER 3. MODIFIED ROST-PATTARD THEORY
Figure 3.4: Double ionisation cross sections for argon and krypton plotted in thescaled coordinates x = E/EM and y = σ2+/σM. (•) present results for argon, (◦)present results for krypton, ( ) modified Rost-Pattard parameterisation (3.7) forpositron impact with α = 3.838 and β = 1.5.
value of β becomes larger than before. This is because the ‘width’ of the crosssections is determined by both α and β. The lower value of α is compensatedby a higher value of β. For helium and neon this nearly keeps the shape of theparameterisation fixed as compared to before. However for argon and kryptonthe new β is still consistent (within the combined uncertainty) with the 1.11found before. This means that the curve is broader now as compared to beforedue to the much lower α. One should be careful about drawing too manyconclusions from these kinds of fits. By fitting the Wannier exponent α oneloses the connection there is between MRP theory and ‘real’ threshold theory,thereby reducing the parameterisation to a purely empirical fitting formula.However it is certain that the cross sections of argon and krypton exhibit abroader shape than that of helium and neon. In conjunction with our findingsin chapter 2 this is most likely due to the suppression of positronium formationin the two light gases.
Finally it should be remarked that the present results for double ionisationof xenon can not be compared to the MRP model due to the bump observed in

REFERENCES 71
σ2+tot at high energies (see figure 2.15 and the discussion in section 2.3.2). This
structure could never be satisfactorily accounted for in a comparison with theparameterisation (3.7). This is also in accordance with the expectation of Rostand Pattard for the original model, as discussed in section 3.2.
Ways to further test the modified Rost-Pattard theory presented here, wouldbe to compare it to double ionisation cross sections for something else than pos-itron impact. Electron impact data would probably provide the most criticaltests, as high quality data exist from high energies and down to threshold.However as the interference between SO, TS1 and TS2 influence electron crosssections conversely to positron cross sections, it is not certain that electronresults are directly transferable to the positron case. Another option is compar-ison with proton data. This could shed some light on how well one can discerncapture channels from direct ionisation using a comparison to the Rost-Pattardtheory. These kinds of comparisons are however beyond the scope of this the-sis, but it should be noted that Pattard and Rost [15] have already publishedsimilar considerations using a slightly different parameterisation. The same twoauthors have also successfully applied their original theory to double ionisationof negative ions by electron impact [33].
References
[1] G. H. Wannier, Phys. Rev. 90, 817 (1953).
[2] E. P. Wigner, Phys. Rev. 73, 1002 (1948).
[3] R. Peterkop, J. Phys. B: At. Mol. Phys. 4, 513 (1971).
[4] A. R. P. Rau, Phys. Rev. A 4, 207 (1971).
[5] K. A. Poelstra, J. M. Feagin, and H. Klar, J. Phys. B: At. Mol. Opt. Phys.27, 781 (1994).
[6] M. Yu. Kuchiev and V. N. Ostrovsky, Phys. Rev. A 58, 321 (1998).
[7] J. M. Feagin, J. Phys. B: At. Mol. Phys. 17, 2433 (1984).
[8] J. M. Feagin and R. D. Filipczyk, Phys. Rev. Lett. 64, 384 (1990).
[9] J. M. Feagin and M. J. Goddard, J. Phys. B: At. Mol. Opt. Phys. 30, 693(1997).
[10] H. Klar and W. Schlecht, J. Phys. B: At. Mol. Phys. 9, 1699 (1976).
[11] H. Klar, J. Phys. B: At. Mol. Phys. 14, 4165 (1981).
[12] J. C. Mendez and J. M. Feagin, private communication.

72 REFERENCES
[13] T. Pattard and J. M. Rost, Phys. Rev. Lett. 80, 5081 (1998).
[14] T. Pattard and J. M. Rost, Phys. Rev. Lett. 81, 2618 (1998).
[15] T. Pattard and J. M. Rost, Phys. Scrip. T80, 295 (1999).
[16] J. M. Rost, private communication.
[17] S. Cvejanovic and F. H. Read, J. Phys. B: At. Mol. Phys. 7, 1841 (1974).
[18] F. Pichou, A. Huetz, G. Joyez, and M. Landau, J. Phys. B: At. Mol. Phys.11, 3683 (1978).
[19] H. Kossmann, V. Schmidt, and T. Andersen, Phys. Rev. Lett. 60, 1266(1988).
[20] J. A. R. Samson and G. C. Angel, Phys. Rev. Lett. 61, 1584 (1988).
[21] R. Wehlitz, M.-T. Huang, I. A. Sellin, and Y. Azuma, J. Phys. B: At. Mol.Opt. Phys. 32, L635 (1999).
[22] M. Kamm, W. Weber, and W. Mehlhorn, J. Phys. B: At. Mol. Opt. Phys.27, 2585 (1994).
[23] P. Ashley, J. Moxom, and G. Laricchia, Phys. Rev. Lett. 77, 1250 (1996).
[24] A. Temkin, Phys. Rev. Lett. 49, 365 (1982).
[25] H. R. Sadeghpour, J. L. Bohn, M. J. Cavagnero, B. D. Esry, I. I. Fabrikant,J. H. Macek, and A. R. P. Rau, J. Phys. B: At. Mol. Opt. Phys. 33, R93(2000).
[26] J. M. Rost and T. Pattard, Phys. Rev. A 55, R5 (1997).
[27] M. B. Shah and H. B. Gilbody, J. Phys. B: At. Mol. Phys. 14, 2361 (1981).
[28] M. B. Shah, D. S. Elliott, and H. B. Gilbody, J. Phys. B: At. Mol. Phys.20, 2481 (1987).
[29] G. O. Jones, M. Charlton, J. Slevin, G. Laricchia, A. Kover, M. R. Poulsen,and S. Nic Chormaic, J. Phys. B: At. Mol. Opt. Phys. 26, L483 (1993).
[30] L. H. Andersen, P. Hvelplund, H. Knudsen, S. P. Møller, J. O. P. Pedersen,S. Tang-Petersen, E. Uggerhøj, K. Elsener, and E. Morenzoni, Phys. Rev.A 41, 6536 (1990).
[31] P. Hvelplund, H. Knudsen, U. Mikkelsen, E. Morenzoni, S. P. Møller, E.Uggerhøj, and T. Worm, J. Phys. B: At. Mol. Opt. Phys. 27, 925 (1994).

REFERENCES 73
[32] M. B. Shah, D. S. Elliott, and H. B. Gilbody, J. Phys. B: At. Mol. Phys.20, 3501 (1987).
[33] J. M. Rost and T. Pattard, J. Phys. B: At. Mol. Opt. Phys. 32, L457(1999).

.

Chapter 4
Ionisation of atomicdeuterium
4.1 Introduction
Ionisation of atomic hydrogen by charged particle impact is considered to beamong one of the most fundamental atomic collision processes. Being thearchetype of the Coulomb three-body problem, the process has great theoreti-cal interest. Particularly since the wave function of hydrogen is known exactly,it has also been favoured as a test-bench for atomic scattering theories. Froman experimental point of view, atomic hydrogen has always been one of themore elusive targets, mainly due to problems with producing sufficiently high(pure) target densities. This problem has been resolved with the invention ofreliable RF discharge sources (Slevin source) [1]. However for positron impactionisation the problem was twofold as the intensities available from the earli-est positron beam lines made ionisation experiments on hydrogen practicallyimpossible. Therefore up until 1990, no data had been published on positron-hydrogen collisions.
Ionisation of hydrogen by positron impact can either take place throughdirect ionisation or ionisation with positronium formation i.e. the processes
e+ + H → H+ + e− + e+, (4.1)e+ + H → H+ + Ps. (4.2)
Following the notation from chapter 2 the partial ionisation cross sections cor-responding to these two processes are denoted σ+
I and σ+Ps respectively and
similarly the threshold energies E+I = 13.6 eV and E+
Ps = 6.8 eV. The totalionisation cross section σ+
tot is equal to the sum of σ+I and σ+
Ps, counting ioncontributions irrespectively of the fate of the positron in either (4.1) or (4.2).
75

76 CHAPTER 4. IONISATION OF ATOMIC DEUTERIUM
The first measurement of σ+I for atomic hydrogen by positron impact was
performed in 1990 at Bielefeld by Spicher et al. [2] using an electrostatic crossedbeams technique. Discrimination against (4.2) was attained through coinci-dence detection of the ions with positrons scattered in the forward directioninto a ±30◦ cone. Time-of-flight was used to separate H+ ions from H+
2 ions,the latter stemming from ionisation of H2 present in the target due to incom-plete dissociation in the RF source. Dissociative ionisation of H2 was found tocontribute negligibly to the H+ count rate. Calibration and normalisation wereattained through measurements for electron impact, which were compared tocross sections from the literature. To correct for the incomplete collection ofthe scattered positrons Spicher et al. used a calculation based on the first Bornapproximation.
The cross section obtained by Spicher et al. agreed in shape but not inabsolute magnitude with the theoretical predictions at the time. However afterthe publication of their data, a more recent calculation by Acacia et al. [3,4]showed better overall agreement with the data. This was however questionedby Jones et al. [5], who at UCL also measured σ+
I for atomic hydrogen. Theirexperiment was performed using a magnetic positron beam line, which shouldgive nearly complete collection of the scattered positrons. Their results werelower by 30–80% as compared to those of Spicher et al. and were in betteragreement with previous theoretical results. The σ+
I by Jones et al. also showeda better merger with electron data at high energies, as expected from the firstBorn approximation (see section 2.1.1).
Around the same time, the Bielefeld experiment was moved to the high-intensity positron beam at Brookhaven National Laboratory. Supplementingthe old data with new measurements and doing a more careful data analysis,Weber et al. [6] recalculated the σ+
I by Spicher et al. However for normalisationWeber et al. still had to rely somewhat on the old Bielefeld results. The outcomeof the recalculation yielded a better agreement in shape with the σ+
I by Joneset al. but still an overall difference of ∼30% in absolute magnitude.
Further support was however gained for the data by Jones et al. First ofall Stein et al. [7] pointed out that the σ+
I by Spicher et al. (and thereby alsothe σ+
I by Weber et al.) was in disagreement with data for the total scatteringcross section for atomic hydrogen by positron impact measured by Zhou et al.[8]. The σ+
I by Jones et al. showed better agreement. Secondly Knudsen et al.[9] measured σ+
I for atomic hydrogen by antiproton impact. When plotted ona velocity scale these (and proton) data showed a better merger at high impactvelocities with the data by Jones et al., in accordance with the discussion insection 2.1.1.
Finally Hofmann et al. [10] repeated the Bielefeld-Brookhaven experimentusing an improved version of the apparatus. Instead of using the first Bornapproximation, a calculation by Acacia and Stauffer [10] was used to correct for

4.1. INTRODUCTION 77
the incomplete collection of scattered positrons. Their results for σ+I were now
in full agreement with those by Jones et al. The previous disagreement wereattributed to the electron data obtained by Spicher et al. for normalisation.Apparently the electron beam used did not possess the same characteristics(phase-space) as the positron beam. The disagreement surrounding σ+
I thereforeseemed resolved.
Concurrent with the measurements of σ+I , experiments to determine σ+
Ps foratomic hydrogen were performed. The first results for σ+
Ps were published in1992 by the Bielefeld-Brookhaven group in a paper by Sperber et al. [11]. In thisexperiment σ+
Ps was essentially found as the difference between σ+I and σ+
tot. Theresults were in reasonable agreement with theory at the time. However usingthe same equipment as Spicher et al. [2] these data also had to be correctedfor incomplete positron collection. Secondly Sperber et al. used the results bySpicher et al. for absolute normalisation. The determination of σ+
Ps was therebyclosely linked to that of σ+
I and therefore affected somewhat by the changes inσ+
I discussed above.
The recalculation by Weber et al. [6] yielded together with a better deter-mination of a detector efficiency from supplementing data a ∼30% reductionin absolute magnitude of σ+
Ps. As theory at the time exhibited a fairly widespread in absolute magnitudes, agreement with calculations remained reason-ably good. More recent theories showed even better agreement. The reductionof σ+
Ps was also in agreement with the conclusions of Stein et al. [7], who showedthat the original data by Sperber et al. would cause disagreement with the totalscattering cross section measured by Zhou et al. [8] by being too large. Hof-mann et al. [10] also remeasured σ+
Ps in their experiment. They found the ratioσ+
Ps/σ+I to be the same as that found by Weber et al. However with the 30%
reduction in absolute magnitude of σ+I , σ+
Ps was further reduced, breaking thegood agreement observed between theory and the results by Weber et al.
Finally Zhou et al. [12] measured σ+Ps directly. Their experiment did not
use crossed beams like the previous studies, but a specially built gas cell. Byobserving 511 keV annihilation radiation emanating from the gas cell, theymeasured a lower limit of σ+
Ps. Normally the group would also have measuredan upper limit of the cross section. This could be done by measuring theamount of unscattered as well as scattered positrons transmitted through thegas cell. Any attenuation in this number would be due to positrons lost due topositronium formation in (4.2) or positrons scattered in the backward directionin the gas cell. This way an upper limit of σ+
Ps could be determined. Howeverthis was not done due to too large uncertainties arising in the measurements.Instead Zhou et al. provided what they believed to be the best estimate of the‘true’ σ+
Ps. Both this and the lower limit were higher than the σ+Ps found by
Hofmann et al. The results showed instead good agreement with the σ+Ps by
Weber et al. and the most recent theory.
78 CHAPTER 4. IONISATION OF ATOMIC DEUTERIUM
In conclusion a disagreement therefore persists, in that the σ+I and σ+
Ps (orσ+
tot) by the Bielefeld-Brookhaven group one way or the other are in disagree-ment with other measurements and the most recent theory. The results by Zhouet al. indicate that the problem lies with σ+
Ps. To resolve this, new measure-ments of σ+
I and σ+Ps (or σ+
tot) for atomic hydrogen should be performed. Thisshould preferably be done on the same experimental system in order to avoidsystematic errors in e.g. the absolute normalisation. This has been the aim ofthe present experiment.
4.2 Experimental technique
The primary objective of the present experiment has been to measure σ+tot
for atomic hydrogen by positron impact. The experimental system and thetechniques used are similar to those previously used in other positron ionisationexperiments at UCL [13–15]. At the same time measurements of σ+
I have beenperformed in order to ensure that the experiment can yield data consistentwith the previous results by Jones et al. [5] and Hofmann et al. [10]. Thetechnique used for these measurements is the same as used by Kara et al. [15]for obtaining σ+
I for the noble gases. It will not be described in any detail here.All measurements have been performed using the deuterium isotope in orderto discriminate better against hydrogen ions created in e.g. ionisation of theresidual background gas.
4.2.1 Experimental equipment
A schematic of the UCL hydrogen ionisation experiment is shown in figure4.1. Positrons emitted by a 37 MBq (1 mCi) 22Na source are moderated ina moderator made from annealed tungsten mesh. The beam is confined alongthe entire experiment by an axial magnetic field of 50–150 Gauss. This isgenerated by Helmholtz coils placed along the outside of the vacuum tubing.The intensity of the beam has been measured to be around 104 e+/s and hasan energy resolution of ∼2 eV (FWHM). The moderator also emits secondaryelectrons, which are confined by the magnetic field as well. These are removedfrom the beam by keeping the lens element R1 at a potential of −1 keV. AnE×B velocity filter with trochoidal electrodes serves to remove any remaininghigh-energy positrons from the beam and also shifts it out of the direct lineof sight to the source. This prevents gamma radiation emitted by the sourcefrom reaching the interaction region. During measurements the velocity filterwas also used to chop the beam by pulsing the applied voltages at a rate of∼8.3 kHz. The duration of the positron pulse was of the order of 100 µs withthe beam only being switched off for ∼6 µs during ion detection.
Before entering the interaction region the beam passes through a retarding

4.2. EXPERIMENTAL TECHNIQUE 79
Figure 4.1: Schematic of UCL experiment. The positrons are confined by an axialmagnetic field generated by Helmholtz coils placed along the outside of the vacuumtubing. R1–R3 are electrostatic lens elements. In the interaction region the target isgenerated by a Slevin source forming a jet of atomic deuterium at 90◦ with the planeof the paper.
field analyser (RFA). The RFA can be used to reflect positrons scattered inthe backward direction from the interaction region back toward the positrondetector at the end of the beam line. However during the measurements of σ+
tot
we did not need to detect the scattered positrons. The RFA was therefore usedto minimise the flight time between the velocity filter and the interaction regionby accelerating the positrons instead.
In the interaction region the beam was intersected at 90◦ by a deuteriumtarget in the form of a jet. This was produced by a Slevin RF discharge source.The source was fed with D2 at a pressure of ∼3.8 mTorr. The flow of the gaswas controlled and purified by a hot palladium leak valve. During runs thesource was operated at an RF power of ∼14 W of which ∼85% was absorbedby the source. This yielded a dissociation fraction of ∼30%, meaning thatthe resulting target jet contained roughly equal amounts of D and D2. Betterdissociation could have been achieved by raising the RF power. However this ledto an undesired increase in the background in the final spectra, due to photonsemitted by the source being detected by the ion detector. The pressure of thetarget jet emerging from the source was around 0.5 µTorr.
The interaction region is situated between two parallel extraction plates.After the passage of a positron pulse, ±150 V were applied to these plates.This pulsing was controlled by the same generator that chopped the beam. Asuitable delay ensured that there were no positrons present in the interactionregion while the voltages were applied. The acceleration of the positrons in theRFA mentioned before helped to minimise this delay. The generated electricfield across the interaction region extracted any ions created through a grid-covered hole in the negative plate and accelerated them towards an ion detector.The extraction pulse lasted ∼3.4 µs after which the potentials of the plates

80 CHAPTER 4. IONISATION OF ATOMIC DEUTERIUM
were returned to ground. Ions were identified through a time-of-flight (TOF)method similar to that described in section 2.2.1. The method of extractionand detection of all ions meant that count rates were proportional to the totalionisation cross section, σ+
tot.
At the end of the beam line a second detector was mounted for positrondetection. During measurements of direct ionisation this detector was used todetect the scattered positrons. Lens elements R2 and R3 were then held at po-tentials that helped extract the positrons from the interaction region. Retardinggrids in front of the detector could be used to distinguish scattered and unscat-tered positrons. However in the measurements of σ+
tot the detector was onlyused to monitor the beam intensity before and after each run. Lens elementsR2 and R3 were therefore held at 0 V and −15 V potentials respectively. A mea-surement of the beam intensity at the interaction region was performed. Thiswas done by slotting in an aluminum plate immediately before the interactionregion, stopping the positrons. The radiation from the annihilating positronswas measured with a NaI detector. This measurement showed that as muchas 10% of the low-energy positrons relative to those at intermediate energieswere lost after the interaction region and therefore not detected by the detectorat the end of the beam line. Relative to the intensity at the highest energies(> 500 eV) the fraction of low-energy positrons not transported to the end waseven larger. Therefore the beam intensity measured with the NaI detector wasthe one used in the final data analysis, while those of the other detector wereonly used to ensure that beam intensities were stable and similar in all runs.
Both the ion and positron detector were channeltron electron multipliers(CEM’s). These were used rather than Ceratrons as the latter had been foundto deteriorate when exposed to atomic hydrogen.
The peak energy of the beam energy distribution was given by E = eVmod+φ,where Vmod is the moderator potential and φ is an energy shift primarily aris-ing from the negative positron work function of the tungsten moderator (seesection 1.2.2). A rather good calibration of the beam energy was needed in thisexperiment as the threshold energy E+
Ps is only 6.8 eV. Systematic deviationsin E e.g. of the order of 1 eV could therefore shift the energy scale in a waythat would induce significant disagreements in the final cross sections. There-fore instead of relying entirely upon retarding spectra, which can be affectedby for example contact potentials, a novel time-of-flight method was used todetermine φ. For this purpose a four-grid retarder was installed in the beamline immediately after the lead collimator and before the RFA. The RFA andthe remainder of the the beam line were kept at ground potential during theseinvestigations, so the positrons would not be accelerated by any electric fieldsduring their flight. The axial magnetic field was maintained as usual duringthese measurements. The potential of the two central grids in the retarder wasnormally held at Vmod + 9 V, thus stopping the beam. Using a pulser this

4.2. EXPERIMENTAL TECHNIQUE 81
barrier could however very rapidly be lowered to ground potential, letting thepositrons through. The time it took the positrons to traverse the distance fromthe retarder to the CEM detector at the end was measured using a time-to-amplitude converter. For a given Vmod the shortest flight times had to belongto the positrons in the beam with the highest axial energy. This flight timewould be proportional to the inverse of the positron axial velocity v. The ve-locity v would in turn be proportional to
√eVmod + δ, where δ is the energy by
which the highest energy positrons are shifted above eVmod in the beam energydistribution. The two energies φ and δ could be related to each other through aretarding spectrum of the beam energy distribution. By measuring flight timesfor a range of different moderator voltages, δ could be found through a fit henceproviding a calibration of the energy scale. Using this method, the value of φwas found to be 2.4 ± 0.1 eV.
4.2.2 Data analysis
Data were collected by an automated system. During a run the moderatorvoltage Vmod and hence the beam energy E was stepped over a range of valuesby a computer. At each step the number of counts in the window in the ionTOF spectrum corresponding to the D+ ions were recorded. The steps in energy(Vmod) in a given run were chosen to cover the whole energy range from aroundE+
Ps to ∼1 keV or at least to have a suitable overlap with other runs withinthis range. Measurements were also made to ensure that the D+ ion count rate,N+
D , did not contain significant contributions from processes such as dissociativeionisation of D2 or ionisation of D by fast positrons or gamma radiation from thesource. The first of these contributions was investigated by measuring N+
D withthe RF power for the Slevin source turned off, hence only admitting pure D2
into the interaction region. The latter contribution was investigated by turningoff the beam at the trochoidal deflector while keeping the rest of the experimentrunning as normal. In both cases negligible contributions to N+
D were found.The count rate N+
D always contained a contribution Nγ from random coin-cidences from photons being detected by the ion detector. These photons wereemitted by the deuterium source. Steps were taken to reduce this backgroundby coating the entire interaction region in light absorbing carbon and by keepingthe RF power low as mentioned in the previous section. The photon backgroundcould however not be fully eliminated. The TOF spectra showed the photonbackground to be flat i.e. random. The value of Nγ could therefore be found byeither monitoring regions in the TOF spectrum away from any ion peaks or byperforming measurements at energies below E+
Ps.At each energy an ion yield, Y , was calculated as
Y =N+
D − Nγ
n+, (4.3)

82 CHAPTER 4. IONISATION OF ATOMIC DEUTERIUM
where n+ is the positron beam intensity as measured with the NaI detector.Experimental conditions were kept as stable as possible during all runs, yetsmall variations were observed in the absolute magnitude of the yields betweendifferent runs. This was probably due to, for example, small variations in thetarget density or drifts in the ion detection system. Therefore the differentyields were scaled to each other before being suitably binned into the finaldata. The absolute normalisation of the measured σ+
tot was obtained throughnormalisation to data for σ+
I for electron impact by Shah et al. [16] at energiesabove 200 eV. At those energies one would expect σ+
Ps to have fallen to zeroas also found by Zhou et al. [12]. One would therefore expect σ+
I for positronsand electrons to be equal as discussed in section 2.1.1.
4.3 Results and discussion
The present results for the three cross sections σ+tot, σ+
I and σ+Ps for atomic
deuterium are presented in figures 4.2, 4.3 and 4.4 respectively. Included in allthe figures are the results by Hofmann et al. [10]. In figure 4.3 is also presentedthe σ+
I by Jones et al. [5] while in figure 4.4 the σ+Ps by Zhou et al. [12] is shown
as well. Finally in figures 4.2 and 4.3 the electron impact data for σ+I by Shah
et al. [16], used for normalisation of our data, has been included.A multitude of theoretical calculations have also been included in all three
figures. One of these is the pseudo-state close-coupling (CC) calculation byKernoghan et al. [17]. This calculation employs a 33-state approximation con-sisting of the 1s, 2s and 2p eigenstates of both positronium and hydrogen and 27hydrogen pseudo-states for n = 3–9. This work is an improvement of a previous18-state calculation by Kernoghan et al. [23]. The new calculation is superior tothe old one in that the larger basis makes the results free of the pseudo-structureobserved in the 18-state calculation. Furthermore by using only single-centrepseudo-states double counting between contributions coming from positroniumand hydrogen states is avoided. A second CC calculation included in the figuresis the one by Mitroy [18,19] using a large L2 basis. It consists of a 21-statecalculation (CC(13,8)) below E+
I and a 31-state calculation (CC(28,3)) aboveE+
I . In figure 4.3 it is therefore only the CC(28,3) results that are included forσ+
I . In the notation of Mitroy, the calculation by Kernoghan et al. would bedenoted CC(30,3). The third theoretical calculation shown in all three figures isthe hidden crossing theory (HCT) by Janev and Solov’ev [20]. This calculationallows for the formation of the quasi-bound molecular ion PsH+. This resultsin a non-zero σ+
tot (σ+Ps) even below E+
Ps. Finally in figure 4.4 two other calcu-lations have been included. These are the 6-state CC R-matrix calculation byHiggins and Burke [21] and the hyperspherical coupled-channel calculation byIgarashi and Toshima [22]. The collection of theoretical calculations presentedhere is by no means complete. Other calculations which either agree or disagree

4.3. RESULTS AND DISCUSSION 83
Figure 4.2: Single ionisation of atomic hydrogen (deuterium). Positron impact:(•) σ+
tot present results, ( ) σ+tot by Hofmann et al. [10], ( ) σ+
tot CC(30,3) cal-culation by Kernoghan et al. [17], ( ) σ+
tot CC(13,8) and CC(28,3) calculationsby Mitroy [18,19], ( ) σ+
tot HCT calculation by Janev and Solov’ev [20]. Electronimpact: ( ) σ+
I by Shah et al. [16]. The two vertical lines indicate E+Ps and E+
I
respectively.
with those above (e.g. [24–26] and [3,4] respectively) could have been included.However in order not to make the figures too crowded these have been left out.
In figure 4.2 one observes the present results to be in agreement with thoseby Hofmann et al. at the highest energies, as both sets merge with the electrondata. However below ∼70 eV the σ+
tot by Hofmann et al. falls increasingly belowthe present results and finally reach a maximum value which is only around 60%of that of the present results. The two CC calculations by Kernoghan et al. andMitroy are in very good agreement with each other and also with the presentresults. Only around the maximum do a few points show a minor, if any at all,deviation from the theories. The HCT calculation shows good agreement withinthe narrow energy range it covers. The only deviation of the HCT calculationfrom the CC results is seen at energies below E+
Ps due to the molecular effectdiscussed before.

84 CHAPTER 4. IONISATION OF ATOMIC DEUTERIUM
Figure 4.3: Direct single ionisation of atomic hydrogen (deuterium). Positron im-pact: (•) σ+
I present results, (◦) σ+I by Jones et al. [5], ( ) σ+
I by Hofmann et al.[10], ( ) σ+
I CC(30,3) calculation by Kernoghan et al. [17], ( ) σ+I CC(28,3)
calculation by Mitroy [19], ( ) σ+I HCT calculation by Janev and Solov’ev [20],
( ) smooth curve fitted through the present data and those by Jones et al. Elec-tron impact: ( ) σ+
I by Shah et al. [16]. The two vertical lines indicate E+Ps and
E+I respectively.
In figure 4.3 one observes that the few points measured for σ+I in the present
experiment exhibit an overall good agreement with the previous results by Joneset al. and Hofmann et al. This is an important verification of our experimentaltechnique. Good agreement is also found with theory. A small exception couldbe the present results and those by Hofmann et al. being slightly lower thantheory and the results by Jones et al. between threshold and 40 eV. Includedin figure 4.3 is a smooth curve fitted through the present results and those byJones et al. This curve provided the estimate of σ+
I that has been subtractedfrom the result for σ+
tot in figure 4.2 in order to deduce the present σ+Ps shown
in figure 4.4.In figure 4.4 one observes the present results for σ+
Ps to be in good agreementwith those by Zhou et al. The present data seem slightly higher in absolutemagnitude at energies between 10 and 40 eV. However remembering that Zhou

4.3. RESULTS AND DISCUSSION 85
Figure 4.4: Positronium formation in single ionisation of atomic hydrogen (deu-terium) by positron impact. (•) σ+
Ps present results, (◦) σ+Ps by Zhou et al. [12],
( ) σ+Ps by Hofmann et al. [10], ( ) σ+
Ps CC(30,3) calculation by Kernoghan et al.[17], ( ) σ+
Ps CC(13,8) and CC(28,3) calculations by Mitroy [18,19], ( ) σ+Ps
HCT calculation by Janev and Solov’ev [20], ( ) σ+Ps calculation by Higgins and
Burke [21], ( ) σ+Ps calculation by Igarashi and Toshima [22]. The two vertical
lines indicate E+Ps and E+
I respectively.
et al. did not provide an upper limit on their results (see discussion in section4.1), but rather their best estimate of σ+
Ps, the agreement is considered good.From our observations in figures 4.2 and 4.3 it is not surprising to find thatthe σ+
Ps by Hofmann et al. falls significantly below the present results. Goodagreement is found with the CC and HCT calculations. The small deviationobserved at around the maximum in σ+
tot in figure 4.2 is inherited by σ+Ps. The
calculation by Higgins and Burke as well as that by Igarashi and Toshima seemto be a little bit low at energies above E+
I as compared to both the experimentaldata and the other calculations. Finally one remarks that the σ+
Ps by Zhouet al. at energies around E+
Ps seems to follow the HCT calculation by Janevand Solov’ev. This could be an indication of the formation of the quasi-boundmolecular ion PsH+ as suggested by Janev and Solov’ev.

86 REFERENCES
In conclusion the disagreement that existed between the previous measure-ments of the ionisation cross sections of atomic hydrogen by positron impactnow seems to have been resolved. As suggested already in section 4.1 it is themeasurements of σ+
tot (and σ+Ps) by the Bielefeld-Brookhaven group that appear
to be flawed.Before concluding this chapter it should be noted that the results presented
here are also a most excellent example of cross sections behaving in accordancewith the standard picture of single ionisation as discussed in section 2.1.1. Forexample in figure 4.3 one observes that the positron cross section rises abovethe electron one at intermediate energies and down to around 25 eV where across-over takes place. It is also noted that the positronium channel is clearlythe dominant channel at low energies, with σ+
Ps (and σ+tot) exhibiting a sharp
rise within the gap between E+Ps and E+
I (the Ore gap).
References
[1] J. Slevin and W. Stirling, Rev. Sci. Instrum. 52, 1780 (1981).
[2] G. Spicher, B. Olsson, W. Raith, G. Sinapius, and W. Sperber, Phys. Rev.Lett. 64, 1019 (1990).
[3] P. Acacia, R. I. Campeanu, M. Horbatsch, R. P. McEachran, and A. D.Stauffer, Phys. Lett. A 179, 205 (1993).
[4] P. Acacia, R. I. Campeanu, M. Horbatsch, R. P. McEachran, and A. D.Stauffer, Hyperfine Interact. 89, 95 (1994).
[5] G. O. Jones, M. Charlton, J. Slevin, G. Laricchia, A. Kover, M. R. Poulsen,and S. Nic Chormaic, J. Phys. B: At. Mol. Opt. Phys. 26, L483 (1993).
[6] M. Weber, A. Hofmann, W. Raith, W. Sperber, F. Jacobsen, and K. G.Lynn, Hyperfine Interact. 89, 221 (1994).
[7] T. S. Stein, W. E. Kauppila, C. K. Kwan, and S. Zhou, Hyperfine Interact.89, 461 (1994).
[8] S. Zhou, W. E. Kauppila, C. K. Kwan, and T. S. Stein, Phys. Rev. Lett.72, 1443 (1994).
[9] H. Knudsen, U. Mikkelsen, K. Paludan, K. Kirsebom, S. P. Møller, E.Uggerhøj, J. Slevin, M. Charlton, and E. Morenzoni, Phys. Rev. Lett. 74,4627 (1995).
[10] A. Hofmann, T. Falke, W. Raith, M. Weber, D. P. Becker, and K. G. Lynn,J. Phys. B: At. Mol. Opt. Phys. 30, 3297 (1997), and references within.

REFERENCES 87
[11] W. Sperber, D. Becker, K. G. Lynn, W. Raith, A. Schwab, G. Sinapius, G.Spicher, and M. Weber, Phys. Rev. Lett. 68, 3690 (1992).
[12] S. Zhou, H. Li, W. E. Kauppila, C. K. Kwan, and T. S. Stein, Phys. Rev.A 55, 361 (1997).
[13] P. Ashley, J. Moxom, and G. Laricchia, Phys. Rev. Lett. 77, 1250 (1996).
[14] J. Moxom, P. Ashley, and G. Laricchia, Can. J. Phys. 74, 367 (1996).
[15] V. Kara, K. Paludan, J. Moxom, P. Ashley, and G. Laricchia, J. Phys. B:At. Mol. Opt. Phys. 30, 3933 (1997).
[16] M. B. Shah, D. S. Elliott, and H. B. Gilbody, J. Phys. B: At. Mol. Phys.20, 3501 (1987).
[17] A. A. Kernoghan, D. J. R. Robinson, M. T. McAlinden, and H. R. J.Walters, J. Phys. B: At. Mol. Opt. Phys. 29, 2089 (1996).
[18] J. Mitroy, Aust. J. Phys. 48, 645 (1995).
[19] J. Mitroy, J. Phys. B: At. Mol. Opt. Phys. 29, L263 (1996).
[20] R. K. Janev and E. A. Solov’ev, in Photonic, Electronic and Atomic Colli-sions, Proc. of XX ICPEAC, edited by F. Aumayr and H. Winter (WorldScientific, Singapore, 1998), p. 393.
[21] K. Higgins and P. G. Burke, J. Phys. B: At. Mol. Opt. Phys. 26, 4269(1993).
[22] A. Igarashi and N. Toshima, Phys. Rev. A 50, 232 (1994).
[23] A. A. Kernoghan, M. T. McAlinden, and H. R. J. Walters, J. Phys. B: At.Mol. Opt. Phys. 28, 1079 (1995).
[24] C. J. Brown and J. W. Humberston, J. Phys. B: At. Mol. Phys. 18, L401(1985).
[25] T. T. Gien, J. Phys. B: At. Mol. Opt. Phys. 30, L23 (1997).
[26] S. Kar and P. Mandal, J. Phys. B: At. Mol. Opt. Phys. 33, L165 (2000).

.

Chapter 5
Ionisation of molecules
5.1 Introduction
In the previous chapters of this thesis we have investigated ionisation of atomictargets. As mentioned in section 1.1, very few experimental studies exist ofexcitation of atoms by positron impact, due to experimental difficulties. Asan alternative one can turn to study ionisation of simple molecules instead. Inthe interaction of a charged particle with a molecule, the target can be left inan excited (electronic) state that may lead to dissociation of the molecule intocharged fragments. This kind of process can be studied by the same means asused to study ionisation of atoms. The aim of the present experiments has beento study positronium formation in molecules through measurements of totalionisation cross sections. The molecules that have been studied are N2, CO,CO2 and CH4.
By direct non-dissociative (single) ionisation of a general molecule, AB, bypositron impact, we mean the process
e+ + AB → AB+ + e− + e+. (5.1)
Changing our notation slightly as compared to that of the previous chapters,the cross section corresponding to (5.1) is denoted σ(AB+)I and its thresholdenergy E(AB+)I. Similarly we have a non-dissociative ionisation channel withpositronium formation:
e+ + AB → AB+ + Ps, (5.2)
with the partial cross section and threshold energy denoted σ(AB+)Ps andE(AB+)Ps respectively. As usual E(AB+)Ps lies 6.8 eV below E(AB+)I and akind of molecular Ore gap exists between them. Also, as always, both (5.1) and
89

90 CHAPTER 5. IONISATION OF MOLECULES
(5.2) contribute to the total non-dissociative ionisation cross section, σ(AB+)tot,which is equal to the sum of σ(AB+)Ps and σ(AB+)I.
In the dissociation of a molecule several different processes can occur. Indirect dissociative ionisation of the molecule AB, some of the processes leadingto the production of an A+ ion could be
e+ + AB → A+ + B + e− + e+, (5.3)e+ + AB → A+ + B− + e+, (5.4)
where both A and B may represent fragments consisting of one or several atoms.The cross section corresponding to the sum of all such processes resulting in anA+ ion is denoted σ(A+)I and the appearance potential E(A+)I. The energyE(A+)I corresponds to the lowest value among the threshold energies of all thedirect ionisation processes yielding an A+ ion. The process (5.4) cannot occurfor all molecules as the negative ion fragment, B−, does not exist. This is thecase for example for N2. As before there is also a positronium formation channelin dissociative ionisation that lead to the production of an A+ ion:
e+ + AB → A+ + B + Ps. (5.5)
The corresponding cross section is denoted σ(A+)Ps. The appearance potentialis denoted E(A+)Ps. Formally E(A+)Ps lies 6.8 eV below the threshold energyof the process (5.3) which is not always equal to E(A+)I. However for our gasesit is only for the production of C+ ions from CO2 that there is a significantdifference (of ∼3.6 eV) between E(C+)I and the threshold energy of (5.3). Thisreduces the gap between E(C+)Ps and E(C+)I to merely 3.2 eV.1 The totaldissociative ionisation cross section, σ(A+)tot, is equal to the sum of σ(A+)Ps
and σ(A+)I and contains contributions from all the processes yielding an A+
ion. Apart from the processes (5.3)–(5.5) one can envision additional processesof the type
e+ + AB → A+ + B+ + 2e− + e+, (5.6)e+ + AB → A+ + B+ + e− + Ps, (5.7)
in which two (or even more) positively charged fragments are produced. As willbe discussed in section 5.2.3, these may cause problems due to the experimentaltechnique used in our experiment. However it will be shown that we do notneed to consider these processes any further. Furthermore we do not pay anyspecial attention to processes resulting in more ‘exotic’ reaction products, likee.g. Ps− or PsH, in this chapter.
The first comparative studies of particle/antiparticle impact ionisation anddissociation of small molecules were performed by Hvelplund et al. [2] and Knud-sen et al. [3] using protons and antiprotons. They found that much of what was
1All values used for E(A+)Ps and E(A+)I are from Frandsen [1] and references within.

5.2. EXPERIMENTAL TECHNIQUE 91
known from ionisation of atoms could be transfered to the molecular case. Notsurprisingly, non-dissociative ionisation behaves in the same way as single ion-isation of a noble gas, as discussed in section 2.1.1. Dissociative ionisation onthe other hand shares features in common with double ionisation of a noblegas. Particularly the interference model discussed in section 2.1.2 can be usedin a qualitative way for the molecular case as well. As illustrated above, severaldifferent processes may lead to the production of an A+ ion. Some of thesemight even represent several different processes involving excitation into differ-ent electronic dissociative states leading to the same reaction products. Theseprocesses can either be the result of one or multiple projectile interactions withthe target electrons. The picture is not quite as clear as in high-energy doubleionisation of a noble gas, nonetheless similar behaviour is observed. Interfer-ence of the different processes gives rise to a difference between the dissociativeionisation cross sections of positive and negative projectiles. In the presentstudy we are also interested in whether or not some of the observed behaviourof positronium formation in double ionisation of the noble gases is present indissociative ionisation as well.
The amount of previous work on positron impact ionisation of molecules islimited. Most is concerned with non-dissociative ionisation of H2, e.g. [4–7]. Ofthese some are relevant as precursors to the atomic hydrogen experiments dis-cussed in chapter 4, rather than as molecular experiments. In Arhus, Frandsenperformed a systematic study of direct non-dissociative and dissociative ionisa-tion by positron impact of the molecules N2, CO, CO2 and CH4 for his master’sthesis [1]. However apart from a preliminary report [8], these results remainedunpublished at the time. They have now been published together with thepresent results in two papers by Bluhme et al. [II,V]. It is however beyond thescope of this thesis to discuss how these direct ionisation data were obtained.They will only be used for comparison with the present results in section 5.3. Inmore recent studies Moxom et al. [9,10] have measured the total non-dissociativeand dissociative cross sections for CH3F and CH3Cl. Furthermore Kwan et al.[11] have studied total positronium formation in a few different molecules. Fi-nally it should be mentioned that there exists a range of beam attenuationexperiments, as e.g. [12,13], measuring the total scattering cross section for dif-ferent molecules by positron impact. These are however not relevant to use forcomparison in this chapter.
5.2 Experimental technique
The experimental technique for measuring the total non-dissociative and disso-ciative ionisation cross sections for N2, CO, CO2 and CH4 by positron impactwas very similar to the technique used in the mixed gas experiments on thenoble gases discussed in chapter 2. The mixed gas technique was used for the

92 CHAPTER 5. IONISATION OF MOLECULES
molecular targets before it was used on the noble gases as these molecular mea-surements were performed between the pure gas and mixed gas experimentsfrom chapter 2. As the technique is virtually the same we will not discuss it inany detail but rather refer to section 2.2. There are however a few differencesthat need to be discussed here.
5.2.1 Experimental equipment
The experiments were performed using the Arhus electrostatic slow positronbeam line shown in figure 2.5. The only changes made in order to run themolecular targets were in the pulsing system. The positron pulse was reducedfrom 1 µs to 100 ns. As the repetition time was maintained at ∼10 µs this meanta reduction of the effective beam intensity by a factor of 100 as compared to aDC beam. However this reduction was necessary. In dissociative ionisation theion fragments can be created having kinetic energies of several eV. Unlike thenoble gases, in which the ions have thermal energies, it is important to extractthe molecular ion fragments as quickly as possible after their creation beforethey can drift out of the interaction region. For the same reason the extractionfield was applied only 50 ns after the passage of the positrons. This meantthat at the most it would take 150 ns from the creation of an ion until it wasextracted. By varying the delay between the positron pulse and the onset of theextraction field, it was found that as long as this total time was below ∼200 ns,full extraction of all ion fragments was attained.
The ion fragments were identified by time-of-flight (TOF). For N2 this givesrise to a problem. In N2 one can create a N2+
2 ion through non-dissociativedouble ionisation. As this ion has the same M/Q value as the N+ ion created indissociative ionisation, the two can not be separated by TOF. The ratio of N2+
2
to N+ ions created from N2 by positron impact has never been measured. How-ever Ha�las and Adamczyk [14] measured the ratio σ(N2+
2 )/σ(N+) for electronimpact ionisation using heteroisotropic N2 (14N15N). They found the ratio tohave a maximum value of ∼13% at 150 eV. Similarly one could make compari-son with the ratio σ(CO2+)/(σ(C+)+σ(O+)) for CO. Using the proton data byKnudsen et al. [3] this yields a value of 2–6%, while the electron impact data byTian and Vidal [15] gives a value of less than 2%. As we can not discern the N+
and N2+2 ions in our experiment, we have to say that whenever in the remainder
of this chapter we discuss N+, we mean the sum of N+ and N2+2 . However we
expect the contribution from N2+2 to the sum to be less than ∼10%.
Finally it should be mentioned that the ground potential (Vf.gnd) of theresistive chain during these experiments sometimes was floated to a positivevoltage, allowing measurements with positron impact energies all the way upto 2 keV.
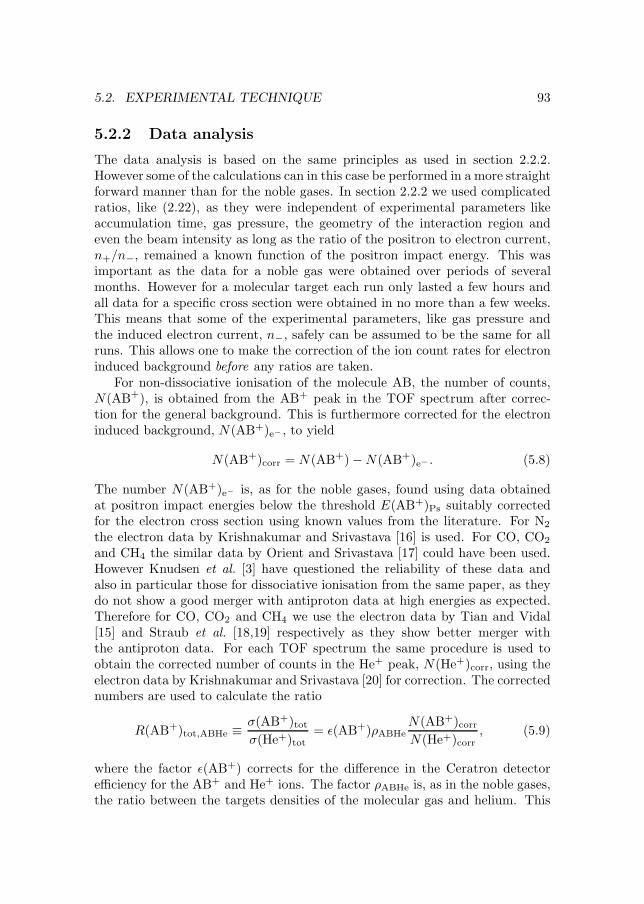
5.2. EXPERIMENTAL TECHNIQUE 93
5.2.2 Data analysis
The data analysis is based on the same principles as used in section 2.2.2.However some of the calculations can in this case be performed in a more straightforward manner than for the noble gases. In section 2.2.2 we used complicatedratios, like (2.22), as they were independent of experimental parameters likeaccumulation time, gas pressure, the geometry of the interaction region andeven the beam intensity as long as the ratio of the positron to electron current,n+/n−, remained a known function of the positron impact energy. This wasimportant as the data for a noble gas were obtained over periods of severalmonths. However for a molecular target each run only lasted a few hours andall data for a specific cross section were obtained in no more than a few weeks.This means that some of the experimental parameters, like gas pressure andthe induced electron current, n−, safely can be assumed to be the same for allruns. This allows one to make the correction of the ion count rates for electroninduced background before any ratios are taken.
For non-dissociative ionisation of the molecule AB, the number of counts,N(AB+), is obtained from the AB+ peak in the TOF spectrum after correc-tion for the general background. This is furthermore corrected for the electroninduced background, N(AB+)e− , to yield
N(AB+)corr = N(AB+) − N(AB+)e− . (5.8)
The number N(AB+)e− is, as for the noble gases, found using data obtainedat positron impact energies below the threshold E(AB+)Ps suitably correctedfor the electron cross section using known values from the literature. For N2
the electron data by Krishnakumar and Srivastava [16] is used. For CO, CO2
and CH4 the similar data by Orient and Srivastava [17] could have been used.However Knudsen et al. [3] have questioned the reliability of these data andalso in particular those for dissociative ionisation from the same paper, as theydo not show a good merger with antiproton data at high energies as expected.Therefore for CO, CO2 and CH4 we use the electron data by Tian and Vidal[15] and Straub et al. [18,19] respectively as they show better merger withthe antiproton data. For each TOF spectrum the same procedure is used toobtain the corrected number of counts in the He+ peak, N(He+)corr, using theelectron data by Krishnakumar and Srivastava [20] for correction. The correctednumbers are used to calculate the ratio
R(AB+)tot,ABHe ≡ σ(AB+)totσ(He+)tot
= ε(AB+)ρABHeN(AB+)corrN(He+)corr
, (5.9)
where the factor ε(AB+) corrects for the difference in the Ceratron detectorefficiency for the AB+ and He+ ions. The factor ρABHe is, as in the noble gases,the ratio between the targets densities of the molecular gas and helium. This

94 CHAPTER 5. IONISATION OF MOLECULES
arises from the 30% molecular gas and 70% helium mixture in the gas bottleused and the difference in diffusion velocity of the two gases out of the gascell (see discussion in section 2.2.2). Unlike in single ionisation of the heavynoble gases, the entire factor of ε(AB+)ρABHe is not determined through directnormalisation of our data to electron cross sections. Instead we rely upon thedetector efficiencies found by Andersen et al. [21] for calculating ε(AB+). Thesewere also used by Frandsen [1] in obtaining the σ(AB+)I with which we are goingto make comparison in section 5.3. The final absolute cross section, σ(AB+)tot,is deduced from the ratio R(AB+)tot,ABHe by multiplication with the knowntotal single ionisation cross section for helium, σ(He+)tot, shown in figure 2.3.A few of the points measured in our experiments were obtained at positronimpact energies below the threshold energy of helium, E(He+)Ps. As thesepoints cannot be normalised using σ(He+)tot, a different method is used. Wehad found the positron intensity, n+, to be constant below ∼50 eV (see section2.2.1). The near-threshold points can therefore be normalised by comparingthe molecular ion count rate, N(AB+)corr, of these points to the count rate ofa point at slightly higher energy (E = 20–30 eV), where we expect the deducedcross section to be reliable. This procedure induces some extra experimentalerror for the near-threshold points.
For dissociative ionisation the procedure for obtaining σ(A+)tot is the sameas above for finding σ(AB+)tot. In all the calculations the ion AB+ is justreplaced by A+, yielding
R(A+)tot,ABHe ≡ σ(A+)totσ(He+)tot
= ε(A+)ρABHeN(A+)corrN(He+)corr
. (5.10)
The factor ρABHe stays the same as before as it only concerns the target densitiesand not the ions.
In section 5.3.2 we present our results for dissociative ionisation of N2, COand CO2. No dissociative cross sections are presented for CH4. Several ionfragments such as CH+
3 , CH+2 and H+ were easily observed in the TOF spectra.
However due to the small mass difference the CH+3 and CH+
2 peaks overlappedwith each other and the non-dissociative CH+
4 peak. Therefore in order to de-duce the ion count rates a fitting procedure had to be employed. Unfortunatelyit was found that the resulting count rates, N(CH+
3 ) and N(CH+2 ), were heavily
dependent on the details of the fit. The reliability of the resulting cross sec-tions would therefore be questionable. The variations in N(CH+
3 ) and N(CH+2 )
also influenced the non-dissociative count rate, N(CH+4 ). However as these
variations were found to be within the statistical uncertainty on N(CH+4 ), we
proceeded to deduce σ(CH+4 )tot, which we consider reliable within the accumu-
lated experimental uncertainty. For the H+ ion fragment the extraction of thecount rates from the TOF spectra caused no problem. Yet the resulting crosssection looked spurious, particularly at energies above 200 eV, where σ(H+)tot
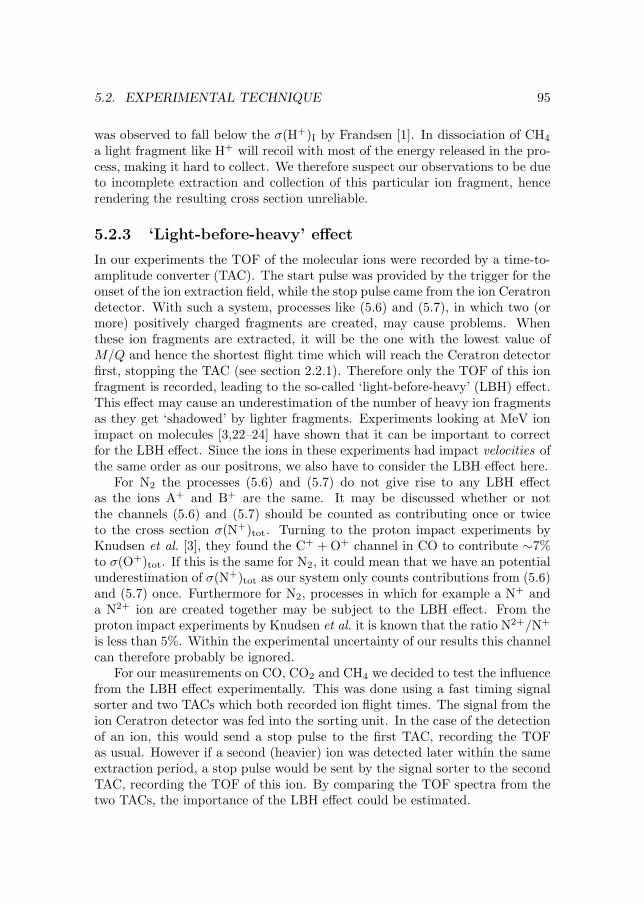
5.2. EXPERIMENTAL TECHNIQUE 95
was observed to fall below the σ(H+)I by Frandsen [1]. In dissociation of CH4
a light fragment like H+ will recoil with most of the energy released in the pro-cess, making it hard to collect. We therefore suspect our observations to be dueto incomplete extraction and collection of this particular ion fragment, hencerendering the resulting cross section unreliable.
5.2.3 ‘Light-before-heavy’ effect
In our experiments the TOF of the molecular ions were recorded by a time-to-amplitude converter (TAC). The start pulse was provided by the trigger for theonset of the ion extraction field, while the stop pulse came from the ion Ceratrondetector. With such a system, processes like (5.6) and (5.7), in which two (ormore) positively charged fragments are created, may cause problems. Whenthese ion fragments are extracted, it will be the one with the lowest value ofM/Q and hence the shortest flight time which will reach the Ceratron detectorfirst, stopping the TAC (see section 2.2.1). Therefore only the TOF of this ionfragment is recorded, leading to the so-called ‘light-before-heavy’ (LBH) effect.This effect may cause an underestimation of the number of heavy ion fragmentsas they get ‘shadowed’ by lighter fragments. Experiments looking at MeV ionimpact on molecules [3,22–24] have shown that it can be important to correctfor the LBH effect. Since the ions in these experiments had impact velocities ofthe same order as our positrons, we also have to consider the LBH effect here.
For N2 the processes (5.6) and (5.7) do not give rise to any LBH effectas the ions A+ and B+ are the same. It may be discussed whether or notthe channels (5.6) and (5.7) should be counted as contributing once or twiceto the cross section σ(N+)tot. Turning to the proton impact experiments byKnudsen et al. [3], they found the C+ + O+ channel in CO to contribute ∼7%to σ(O+)tot. If this is the same for N2, it could mean that we have an potentialunderestimation of σ(N+)tot as our system only counts contributions from (5.6)and (5.7) once. Furthermore for N2, processes in which for example a N+ anda N2+ ion are created together may be subject to the LBH effect. From theproton impact experiments by Knudsen et al. it is known that the ratio N2+/N+
is less than 5%. Within the experimental uncertainty of our results this channelcan therefore probably be ignored.
For our measurements on CO, CO2 and CH4 we decided to test the influencefrom the LBH effect experimentally. This was done using a fast timing signalsorter and two TACs which both recorded ion flight times. The signal from theion Ceratron detector was fed into the sorting unit. In the case of the detectionof an ion, this would send a stop pulse to the first TAC, recording the TOFas usual. However if a second (heavier) ion was detected later within the sameextraction period, a stop pulse would be sent by the signal sorter to the secondTAC, recording the TOF of this ion. By comparing the TOF spectra from thetwo TACs, the importance of the LBH effect could be estimated.

96 CHAPTER 5. IONISATION OF MOLECULES
The results of this investigation were similar for all three gases. The TOFspectra of the second TAC always seemed to be a weak reminiscence of the‘real’ TOF spectra as recorded by the first TAC. Firstly the low number oftotal counts indicated that there was no significant influence from the LBHeffect in our experiments. This is contrary to what was observed in the ex-periments using MeV ion impact mentioned above. We believe this can onlybe due to the fundamental difference between the projectile energies used inthose experiments and in ours. Secondly the fact that the TOF spectra of thesecond TAC were mainly dominated by a non-dissociative peak made us sus-pect that these spectra were all together due to another effect than LBH. Innon-dissociative ionisation there is no LBH effect as only one ion fragment iscreated. The observed TOF spectra could therefore be explained by ‘after puls-ing’ of the Ceratron detector, which generates a ‘false’ secondary pulse rapidlyafter the detection of an ion. Such effect has been observed to be due to ionback-streaming within the Ceratron detector when used at high pressure. Inour experiments these secondary pulses could at times even be observed directlyin the signal from the Ceratron using an oscilloscope.
In conclusion we can ignore the LBH effect in our results for CO, CO2 andCH4. This also serves as a good indication that the effect can safely be ignoredin N2 as well.
5.3 Results and discussion
In sections 5.3.1 and 5.3.2 respectively are presented the present results for thetotal non-dissociative and dissociative ionisation cross sections of N2, CO, CO2
and CH4 by positron impact. Error bars represent the accumulated experi-mental uncertainty from counting statistics, subtraction of the electron inducedbackground and the normalisation to an absolute scale. This includes the un-certainty in the cross section σ(He+)tot from figure 2.3 used for this purpose.
5.3.1 Non-dissociative ionisation
The present results for the total non-dissociative ionisation cross sections of N2,CO, CO2 and CH4 are presented in figures 5.1–5.4 respectively. Included inall of the figures are the cross sections for direct non-dissociative ionisation byFrandsen [1]. Also plotted in the figures are the electron impact data used for thebackground correction. These are by Krishnakumar and Srivastava [16], Tianand Vidal [15], and Straub et al. [18,19] respectively. Furthermore is includeda second set of electron data in each figure, namely those by Straub et al. [25]for N2 and those by Orient and Srivastava [17] for the remaining three gases.
The cross sections for the four gases generally exhibit the same behaviour.At high energies the present results are observed to merge with the direct ion-

5.3. RESULTS AND DISCUSSION 97
Figure 5.1: Non-dissociative ionisation of N2. Positron impact: (•) σ(N+2 )tot present
results, (◦) σ(N+2 )I by Frandsen [1]. Electron impact: ( ) σ(N+
2 )I by Krishnaku-mar and Srivastava [16], ( ) σ(N+
2 )I by Straub et al. [25]. The two vertical linesindicate E(N+
2 )Ps and E(N+2 )I respectively.
isation data by Frandsen, as expected since positronium formation should notcontribute to the total non-dissociative ionisation cross section at these ener-gies. Both the total and the direct cross sections are seen to merge with theelectron data at these energies. Particularly good merger is observed with theelectron impact cross sections by Srivastava and co-workers. This is howeverindirectly due to the normalisations used. The direct ionisation data by Frand-sen are normalised directly to these electron data. The present results on theother hand are normalised through the helium data in figure 2.3, which in turnare normalised to the electron impact helium data by Krishnakumar and Sri-vastava [20]. This yields consistent normalisations of all the cross sections. Asin single ionisation of the noble gases this is based on the assumption of thevalidity of the first Born approximation. Support for its validity is found in theobservation that the shapes of the cross sections agree as well at these energies.
Going down in energy one observes in all four figures σ(AB+)tot to startrising above σ(AB+)I for positron impact at around 100–200 eV, as positroniumformation begins to make a significant contribution to the total non-dissociative

98 CHAPTER 5. IONISATION OF MOLECULES
Figure 5.2: Non-dissociative ionisation of CO. Positron impact: (•) σ(CO+)totpresent results, (◦) σ(CO+)I by Frandsen [1]. Electron impact: ( ) σ(CO+)Iby Orient and Srivastava [17], ( ) σ(CO+)I by Tian and Vidal [15]. The twovertical lines indicate E(CO+)Ps and E(CO+)I respectively.
ionisation cross section. The significance of the contribution grows larger as onegoes to even lower energies. At around the maximum of the total cross section,the positronium formation contributes from 40 to 85%, depending on the targetgas, to σ(AB+)tot. Even as the direct ionisation cross section falls to zero atE(AB+)I the total ionisation cross section has a significant value at E(AB+)Ias compared to its maximum value. The total cross section falls to zero atE(AB+)Ps. From the present data it is not quite clear whether the final decentof σ(AB+)tot proceeds by a sharp or slow decrease. Nevertheless it is clear forall four gases that positronium formation is significant within the gap betweenE(AB+)Ps and E(AB+)I.
The behaviour described above is completely analogous to that observed insection 2.3.1 for single ionisation of the noble gases. Our results for the totalnon-dissociative ionisation cross section of molecules are thereby in accordancewith the standard picture of single ionisation, as discussed in section 2.1.1. Asmentioned in section 5.1, this is also what was concluded from the antiprotonexperiments by Hvelplund et al. [2] and Knudsen et al. [3]. One also notes that

5.3. RESULTS AND DISCUSSION 99
Figure 5.3: Non-dissociative ionisation of CO2. Positron impact: (•) σ(CO+2 )tot
present results, (◦) σ(CO+2 )I by Frandsen [1]. Electron impact: ( ) σ(CO+
2 )I byOrient and Srivastava [17], ( ) σ(CO+
2 )I by Straub et al. [18]. The two verticallines indicate E(CO+
2 )Ps and E(CO+2 )I respectively.
the behaviour of the direct ionisation data by Frandsen fits this picture, byσ(AB+)I for positron impact being larger than σ(AB+)I for electron impact atintermediate energies. Furthermore one observes a possible cross-over at lowerenergies as expected (see discussion in section 2.1.1). This is best observed inthe cross sections for CH4 in figure 5.4.
5.3.2 Dissociative ionisation
The present results for the total dissociative ionisation cross sections of N2, COand CO2 are presented in figures 5.5–5.7 respectively. As discussed in section5.2.2, no results are presented for dissociative ionisation of CH4. For N2 wepresent the cross section for the ion fragment N+ (and N2+
2 , see section 5.2.1),for CO the cross sections for the ion fragments O+ and C+, while for CO2
we present cross sections for the ion fragments CO+, O+ and C+. Severalother ion fragments were at times observed for some of the gases. However thecounting statistics were too poor for the cross sections of these fragments to

100 CHAPTER 5. IONISATION OF MOLECULES
Figure 5.4: Non-dissociative ionisation of CH4. Positron impact: (•) σ(CH+4 )tot
present results, (◦) σ(CH+4 )I by Frandsen [1]. Electron impact: ( ) σ(CH+
4 )I byOrient and Srivastava [17], ( ) σ(CH+
4 )I by Straub et al. [19]. The two verticallines indicate E(CH+
4 )Ps and E(CH+4 )I respectively.
be deduced. Corresponding to figures 5.1–5.3, in figures 5.5–5.7 we include thedirect dissociative ionisation data for positron impact by Frandsen [1] and for therespective gases the electron impact data by Tian and Vidal [15], Krishnakumarand Srivastava [16], Orient and Srivastava [17] and Straub et al. [18,25].
One starts by noting that in figure 5.6 for CO and in particular in figure5.7 for CO2 there is a discrepancy between the electron impact data by Orientand Srivastava and those by Tian and Vidal and Straub et al. respectively.Of these experiments it is only the latter two that demonstrate full collectionof all ion fragments. The data by Tian and Vidal and Straub et al. shouldtherefore be considered the most reliable. The observed difference could beexplained by an incomplete ion collection in the experiment by Orient andSrivastava, as their data are lower than those of the other two experiments.This is also supported by the observations by Knudsen et al. [3] as discussedin section 5.2.2. It is the large recoil energies with which the ion fragments arecreated in dissociative ionisation that makes them hard to collect. Similarly themeasurement of electron impact dissociative ionisation of N2 by Krishnakumar
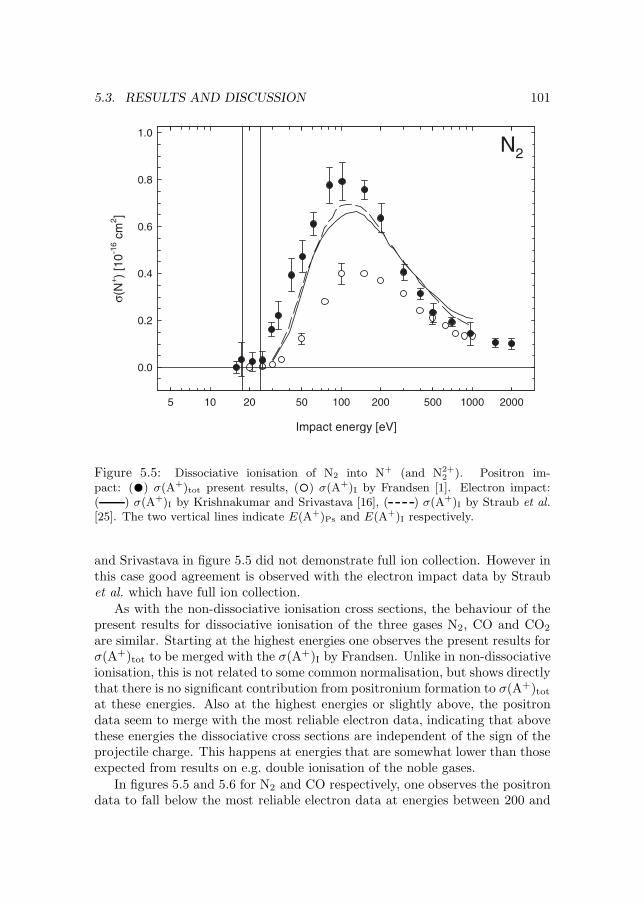
5.3. RESULTS AND DISCUSSION 101
Figure 5.5: Dissociative ionisation of N2 into N+ (and N2+2 ). Positron im-
pact: (•) σ(A+)tot present results, (◦) σ(A+)I by Frandsen [1]. Electron impact:( ) σ(A+)I by Krishnakumar and Srivastava [16], ( ) σ(A+)I by Straub et al.[25]. The two vertical lines indicate E(A+)Ps and E(A+)I respectively.
and Srivastava in figure 5.5 did not demonstrate full ion collection. However inthis case good agreement is observed with the electron impact data by Straubet al. which have full ion collection.
As with the non-dissociative ionisation cross sections, the behaviour of thepresent results for dissociative ionisation of the three gases N2, CO and CO2
are similar. Starting at the highest energies one observes the present results forσ(A+)tot to be merged with the σ(A+)I by Frandsen. Unlike in non-dissociativeionisation, this is not related to some common normalisation, but shows directlythat there is no significant contribution from positronium formation to σ(A+)totat these energies. Also at the highest energies or slightly above, the positrondata seem to merge with the most reliable electron data, indicating that abovethese energies the dissociative cross sections are independent of the sign of theprojectile charge. This happens at energies that are somewhat lower than thoseexpected from results on e.g. double ionisation of the noble gases.
In figures 5.5 and 5.6 for N2 and CO respectively, one observes the positrondata to fall below the most reliable electron data at energies between 200 and
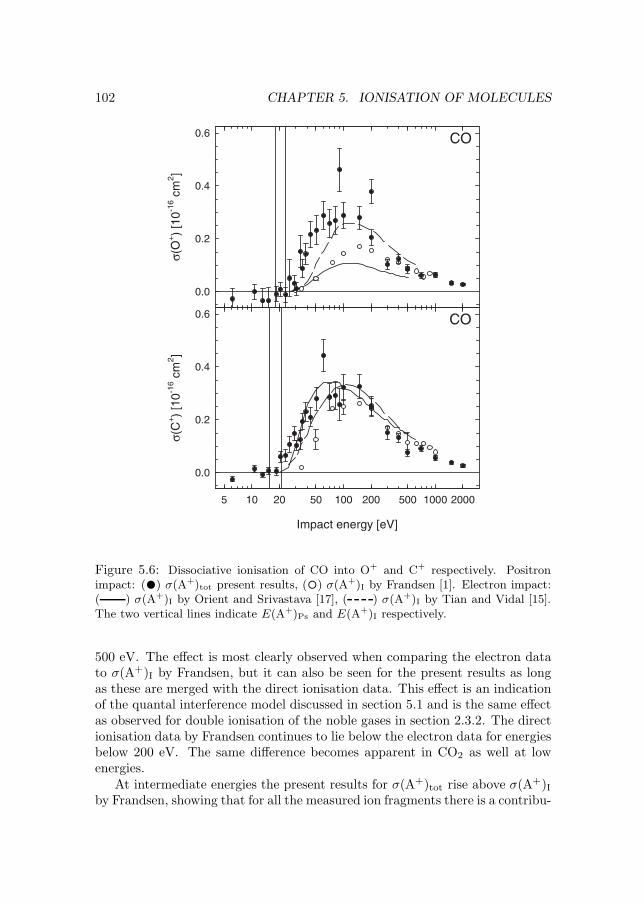
102 CHAPTER 5. IONISATION OF MOLECULES
Figure 5.6: Dissociative ionisation of CO into O+ and C+ respectively. Positronimpact: (•) σ(A+)tot present results, (◦) σ(A+)I by Frandsen [1]. Electron impact:( ) σ(A+)I by Orient and Srivastava [17], ( ) σ(A+)I by Tian and Vidal [15].The two vertical lines indicate E(A+)Ps and E(A+)I respectively.
500 eV. The effect is most clearly observed when comparing the electron datato σ(A+)I by Frandsen, but it can also be seen for the present results as longas these are merged with the direct ionisation data. This effect is an indicationof the quantal interference model discussed in section 5.1 and is the same effectas observed for double ionisation of the noble gases in section 2.3.2. The directionisation data by Frandsen continues to lie below the electron data for energiesbelow 200 eV. The same difference becomes apparent in CO2 as well at lowenergies.
At intermediate energies the present results for σ(A+)tot rise above σ(A+)Iby Frandsen, showing that for all the measured ion fragments there is a contribu-

5.3. RESULTS AND DISCUSSION 103
Figure 5.7: Dissociative ionisation of CO2 into CO+, O+ and C+ respectively. Pos-itron impact: (•) σ(A+)tot present results, (◦) σ(A+)I by Frandsen [1]. Electronimpact: ( ) σ(A+)I by Orient and Srivastava [17], ( ) σ(A+)I by Straub et al.[18]. The two vertical lines indicate E(A+)Ps and E(A+)I respectively.

104 CHAPTER 5. IONISATION OF MOLECULES
tion from dissociative ionisation with positronium formation. The significanceof the contribution varies from a clear one in σ(N+)tot for N2 to nearly none inσ(C+)tot for CO2.
Near threshold and in the gap between E(A+)Ps and E(A+)I one sees thatσ(A+)tot for all fragments falls to zero within the entire gap. This shows thatthere is virtually no contribution from positronium formation to dissociativeionisation at these near-threshold energies. Exceptions are found for a few frag-ments, like for example C+ from CO or O+ from CO2, where single data pointswithin the gap or the general trend of σ(A+)tot above E(A+)I could indicate apossible small contribution. Nevertheless there is clearly a suppression of pos-itronium formation within the gap as compared to non-dissociative ionisation.This behaviour is the same as observed in double ionisation of the light noblegases helium and neon in section 2.3.2. On the other hand the contributionfrom the positronium channel at intermediate energies, as found above, is moresimilar to that seen in double ionisation of the heavy noble gases. With respectto positronium formation the present results for dissociative ionisation thereforeseem to form a kind of intermediate case.
The observed suppression of positronium formation at near-threshold ener-gies makes one speculate whether or not this could somehow be explained bythe recapture model proposed by Humberston and Van Reeth [26] for the noblegases (see discussion in section 2.3.2). Looking at a process like the dissociativepositronium formation process (5.5) it might be true that it shares two-electronfeatures in common with double ionisation of e.g. helium. However the ion frag-ment created in this process is still only singly charged. Any recapture processwould therefore be more like a recapture process in single ionisation of a noblegas, where there is no observable suppression. It is therefore not quite clearhow, if at all, the ideas of the recapture model by Humberston and Van Reethcould be applied to the molecular case [27].
Qualitatively one can however make one observation on the behaviour of thepositronium formation channel. Looking at figure 5.7 for CO2 one notes that theleast significant contribution from the positronium channel is found in σ(C+)tot.Since the carbon atom sits in the middle of the linear triatomic CO2 molecule,both oxygen atoms have to be stripped away in order to create a C+ ion. Thismakes the production of a C+ ion from CO2 a more ‘violent’ dissociation thane.g. production of a CO+ ion, in that more molecular bonds have to be broken.The small contribution from positronium formation to σ(C+)tot in CO2 couldtherefore be related to the observed lack of positronium formation in doubleionisation of helium and neon, since double ionisation of these two gases arecharacterised by being ‘violent’ as well, i.e. by having the highest thresholdenergies among the noble gases. Further studies on either the molecular targetsdiscussed in this chapter or on other gases, might help quantify some of theseconsiderations.

REFERENCES 105
References
[1] N. P. Frandsen, Master’s thesis, University of Aarhus, 1993.
[2] P. Hvelplund, H. Knudsen, U. Mikkelsen, E. Morenzoni, S. P. Møller, E.Uggerhøj, and T. Worm, J. Phys. B: At. Mol. Opt. Phys. 27, 925 (1994).
[3] H. Knudsen, U. Mikkelsen, K. Paludan, K. Kirsebom, S. P. Møller, E.Uggerhøj, J. Slevin, M. Charlton, and E. Morenzoni, J. Phys. B: At. Mol.Opt. Phys. 28, 3569 (1995).
[4] D. Fromme, G. Kruse, W. Raith, and G. Sinapius, J. Phys. B: At. Mol.Opt. Phys. 21, L261 (1988).
[5] F. M. Jacobsen, N. P. Frandsen, H. Knudsen, and U. Mikkelsen, J. Phys.B: At. Mol. Opt. Phys. 28, 4675 (1995).
[6] P. Ashley, J. Moxom, and G. Laricchia, Phys. Rev. Lett. 77, 1250 (1996).
[7] J. Moxom, P. Ashley, and G. Laricchia, Can. J. Phys. 74, 367 (1996).
[8] M. R. Poulsen, N. P. Frandsen, and H. Knudsen, Hyperfine Interact. 89,73 (1994).
[9] J. Moxom, J. Xu, G. Laricchia, L. D. Hulett, D. M. Schrader, Y. Kobayashi,B. Somieski, and T. A. Lewis, Nucl. Instr. and Meth. B 143, 112 (1998).
[10] J. Moxom, D. M. Schrader, G. Laricchia, L. D. Hulett, and J. Xu, Appl.Surf. Sci. 149, 244 (1999).
[11] C. K. Kwan, W. E. Kauppila, S. Nazaran, D. Przybyla, N. Scahill, andT. S. Stein, Nucl. Instr. and Meth. B 143, 61 (1998).
[12] O. Sueoka, H. Takaki, A. Hamada, H. Sato, and M. Kimura, Chem. Phys.Lett. 288, 124 (1998).
[13] O. Sueoka, A. Hamada, M. Kimura, H. Tanaka, and M. Kitajima, J. Chem.Phys. 111, 245 (1999).
[14] St. Ha�las and B. Adamczyk, Int. J. Mass. Spec. Ion Phys. 10, 157 (1972–73).
[15] C. Tian and C. R. Vidal, J. Phys. B: At. Mol. Opt. Phys. 31, 895 (1998).
[16] E. Krishnakumar and S. K. Srivastava, J. Phys. B: At. Mol. Opt. Phys.23, 1893 (1990).
[17] O. J. Orient and S. K. Srivastava, J. Phys. B: At. Mol. Phys. 20, 3923(1987).

106 REFERENCES
[18] H. C. Straub, B. G. Lindsay, K. A. Smith, and R. F. Stebbings, J. Chem.Phys. 105, 4015 (1996).
[19] H. C. Straub, D. Lin, B. G. Lindsay, K. A. Smith, and R. F. Stebbings, J.Chem. Phys. 106, 4430 (1997).
[20] E. Krishnakumar and S. K. Srivastava, J. Phys. B: At. Mol. Opt. Phys.21, 1055 (1988).
[21] L. H. Andersen, P. Hvelplund, H. Knudsen, S. P. Møller, A. H. Sørensen,K. Elsener, K.-G. Rensfelt, and E. Uggerhøj, Phys. Rev. A 36, 3612 (1987).
[22] I. Ben-Itzhak, S. G. Ginther, and K. D. Carnes, Phys. Rev. A 47, 2827(1993).
[23] I. Ben-Itzhak, K. D. Carnes, S. G. Ginther, D. T. Johnson, P. J. Norris,and O. L. Weaver, Phys. Rev. A 47, 3748 (1993).
[24] U. Mikkelsen, Master’s thesis, University of Aarhus, 1994.
[25] H. C. Straub, P. Renault, B. G. Lindsay, K. A. Smith, and R. F. Stebbings,Phys. Rev. A 54, 2146 (1996).
[26] J. W. Humberston and P. Van Reeth, J. Phys. B: At. Mol. Opt. Phys. 33,L97 (2000).
[27] J. W. Humberston, private communication.

Chapter 6
Summary
The purpose of the experiments presented in this thesis has been to study the to-tal ionisation cross section of atoms and molecules by positron impact. Throughthese measurements information about positronium formation has been ob-tained. This has been done both directly through near-threshold measurementsand through comparison of the present total ionisation cross sections with knowncross sections for direct ionisation.
In chapter 2 measurements of the total single ionisation cross section of ar-gon, krypton and xenon and measurements of the total double ionisation crosssection of helium, neon, argon, krypton and xenon are presented. It has beenfound that while positronium formation is significant in single ionisation at bothnear-threshold and intermediate energies this not true for double ionisation. Inhelium and neon a suppression of double ionisation with positronium formationhas been observed at all energies. In argon, krypton and xenon a small contribu-tion from positronium formation has been found at both low and intermediateenergies. However even in these three heavy gases it is clear from the thresholdbehaviour of the cross sections that positronium formation is not as significanta channel at near-threshold energies in double ionisation as in single ionisation.
In chapter 3 Wannier theory and the semiempirical Rost-Pattard parame-terisation are discussed. As the present experiments on the noble gases haveprovided the first near-threshold data for double ionisation of atoms by posi-tron impact, a modified Rost-Pattard model have been developed to describethis case. It has successfully been applied to our data for double ionisation ofhelium and neon, showing that this kind of model can be extended from singleto double ionisation.
In chapter 4 measurements of both the direct and total single ionisationcross sections of atomic deuterium are presented, settling the dispute existingwithin the literature between previous measurements of these cross sections.
107

108 CHAPTER 6. SUMMARY
Comparison has been made with the most recent theoretical calculations andgood agreement has been found.
Finally in chapter 5 measurements of the total non-dissociative single ionisa-tion cross section of the molecules N2, CO, CO2 and CH4 are presented. For thefirst three there are also presented the total dissociative ionisation cross sectionsfor fragmentation into several different types of ion fragments. It has been foundthat the non-dissociative ionisation cross sections exhibit a behaviour which issimilar to that observed for single ionisation of the noble gases in chapter 2. Thedissociative ionisation cross sections on the other hand have a behaviour whichis closer to that observed in double ionisation of the noble gases. With respectto positronium formation the dissociative cross sections exhibited a suppressionof this channel at near-threshold energies, but at the same time also exhibiteda clear contribution at intermediate energies. The behaviour of the dissociativeionisation cross sections can therefore best be classified as somewhere betweenthe double ionisation cross sections of the light noble gases, helium and neon,and those of the three heavy noble gases.
Prior to the present studies it was believed that the contribution to the to-tal ionisation cross section from positronium formation would exhibit a similarbehaviour irrespective of the target and the degree of ionisation. This picturewas mainly based on observations of single ionisation. The present studies ofsingle ionisation of atoms and non-dissociative single ionisation of moleculesin chapters 2, 4 and 5 confirm this picture. However with the present resultsfor double ionisation of the noble gases and for dissociative ionisation of thesmall molecules, a far more complex behaviour of ionisation with positroniumformation has been uncovered. Particularly the behaviour observed in doubleionisation of helium and neon seems unique even compared to that of boththe heavy noble gases and dissociative ionisation of the molecules. This couldindicate an importance for positronium formation of the strong correlation be-tween target electrons prior to the collision as in helium and neon. In chapter2 the observed behaviour of the near-threshold cross sections of the noble gasesis discussed in terms of the recapture model by Humberston and Van Reeth.While this model concerns a post-collisional mechanism for the suppression ofpositronium formation in double ionisation, it does not deal with the actual ini-tial positronium formation. The present results show that such considerationscould be very important in order to explain the observed behaviour. A completeunderstanding of positronium formation in multi-electron ionisation processeshas therefore not yet been reached.
As a conclusion of this thesis are given a few brief remarks on some of thefuture research within the field of atomic collisions with positrons that wouldhelp clarify some of the results presented within this thesis. First of all, muchof our discussion of positronium formation in double ionisation has been basedon comparisons between direct and total ionisation cross sections. For a more

109
quantitative discussion than the one presented here, there is a need for betterdata for direct ionisation, particularly at near-threshold energies. Despite thatthese will be elaborate and time consuming to measure, they can be obtainedwith the positron beam intensities available today.
Secondly one could wish for more theoretical investigations into some ofthe phenomena observed. Apart from those presented in chapter 4, there is ageneral lack of calculations for ionisation processes, particularly for those thatare more complex. For example numerical calculations of positronium formationin double ionisation would be desirable. Today there already exist coupledstate calculations of positronium formation in single ionisation of e.g. helium.Expanding these calculations to double ionisation is a question of including theappropriate states in the calculation and is hence a question of computationalpower. As a start one could maybe limit the calculations to within the secondOre gap, where the number of extra states to be included is more limited. Onecan only hope that advances in algorithms and computer power will make suchcalculations feasible in the near future. Also more investigations into modelslike the Rost-Pattard model are needed, as this seems to point toward some sortof common underlying ionisation mechanism.
Thirdly with respect to our molecular studies there is a multitude of othersmall molecules, like e.g. O2, C2H2 and CF4, that could be interesting to investi-gate. One could also try to measure the total non-dissociative double ionisationcross section of e.g. CO and CO2 in order to get a better understanding of howthe present results for non-dissociative and dissociative ionisation of moleculesfit in with respect to our noble gas data.
Finally one can only hope that advances in positron beam intensities and inthe experimental technique in general will help in the future to produce betterand more easily obtainable results.

.

Dansk resume
Denne afhandling er en præsentation af resultaterne af et 4-arigt forskningsar-bejde udført ved Institut for Fysik og Astronomi ved Arhus Universitet. Nogleaf resultaterne er ogsa opnaet under et ophold ved University College London iEngland. Det overordnede emne for det udførte arbejde har været eksperimentelatomfysik, nærmere bestemt atomare kollisioner med positroner.
‘Atomfysik’ star for mange almindelige mennesker som indbegrebet af mo-derne fysik. Af fysikere betragtes atomfysik som værende den gren inden forfysikken, der har sit væsentligste udspring i Niels Bohrs atommodel fra 1913.Det Bohr gjorde, var at lave en teoretisk beskrivelse af det simple brintatom.I brint kredser en enkelt elektron rundt om en atomkerne bestaende af kun enproton. Bohrs fortjeneste var, at han postulerede, at elektronen kun kan bevægesig rundt om protonen i nogle helt bestemte ‘energitilstande’. I dag vil man sige,at det Bohr gjorde, var at beskrive brintatomets ‘struktur’. Bohrs atommodelblev udgangspunkt for det, vi i dag kalder kvantemekanik. Kvantemekanikkener den teori, der bruges til at beskrive atomers struktur. Sideløbende medudviklingen af teorien for atomer har det ogsa været vigtigt at lave eksperi-mentelle undersøgelser af atomernes struktur. Der har altid i fysikken væretet nært samspil imellem teori og eksperiment. Selv Bohrs teori var inspireretaf eksperimentelle observationer af det lys, atomer kan udsende. I dag brugeseksperimenter til enten at teste teoretiske forudsigelser eller til at give inspira-tion til nye retninger og muligheder inden for teorien, som burde udforskes.
En af de mader man med eksperimenter kan undersøge atomers struktur, ervia atomare kollisioner. I atomare kollisioner skyder man partikler pa atomer ogobserverer, hvordan de spredes. Disse partikler kan være enten elektroner, pro-toner, andre atomer osv. Maden hvorpa sadanne projektiler spredes, afhængeraf strukturen af det atom, man skyder dem pa. Man har dog ogsa fundet, atspredningen afhænger af hvilken slags partikel, man bruger som projektil. Sam-menligner man f.eks. spredning af elektroner og protoner, ser man en forskel.Dette skyldes bl.a., at elektronen har negativ ladning, mens protonen er posi-tivt ladet, samt at protonen vejer 1836 gange mere end elektronen. Spredningen
111

112 DANSK RESUME
afhænger altsa af samspillet imellem projektilets egenskaber og atomets struk-tur. At forsta dette samspil er af stor interesse for atomfysikken.
Traditionelt har man i eksperimenter med atomare kollisioner ofte brugtelektroner eller protoner som projektiler, da disse fra natures hand er let tilgæn-gelige. Sammenligner man spredning af elektroner og protoner, er der dog detproblem, at man ikke helt kan sige om den forskel, man observerer, skyldes,at de to projektiler har forskellig ladning, eller om den skyldes deres forskelligemasse. For at afklare dette spørgsmal har eksperimentalfysikere søgt at brugeandre og mere ‘eksotiske’ projektiler. Et sadan projektil er positronen.
Positronen er elektronens antipartikel. Hvad en antipartikel og mere genereltantistof præcist er, skal vi ikke komme ind pa her, men blot nævne at antistofikke findes i ret store mængder i universet omkring os. Hvorfor det er sadan, eret af fysikkens store ubesvarede spørgsmal. Det er dog heldigt, at det er sadan,da antistof kan annihilere med almindeligt stof. Det betyder, at hvis en posi-tron støder direkte ind i en elektron, vil de begge forsvinde i et slags lysglimt.Store mængder antistof i universet kunne derfor være ret sa ubehageligt. Derfindes dog radioaktive kilder, der udsender sma mængder af positroner. Sadannekilder er ofte hovedkomponenten i de eksperimentelle opstillinger, der brugestil at lave atomare kollisioner med positroner. Fordi positronen er elektro-nens antipartikel, har den som projektil de smarte egenskaber, at den vejer detsamme som en elektron, men har en ladning med modsat fortegn, dvs. at dener positiv. Sammenligner man derfor spredning af elektroner med spredningaf positroner, kan en evt. forskel kun skyldes forskellen i ladning. Af tekniskearsager har det kun rigtigt været muligt at lave denne slags kollisionsforsøg medpositroner siden starten af 1970’erne. Siden da har man dog lært en masse omspredningsmekanismer fra disse forsøg. En del af arbejdet præsenteret i denneafhandling vedrører den slags undersøgelser med sammenligning af positronersspredning med bl.a. elektroners og protoners spredning.
Tingene er dog ikke altid sa simple som beskrevet ovenfor. Fra atomare kolli-sioner ved man, at nogle projektiler har nogle ganske særlige spredningsmekanis-mer. For eksempel har elektroner det, der pa engelsk kaldes ‘exchange’, hvilketkan oversættes med ‘ombytning’ eller ‘udveksling’. Ved denne spredningsmeka-nisme bytter elektronen, som er projektil, plads med en elektron i atomet. Daelektronerne er ens, kan man ikke umiddelbart se, om denne ombytning findersted eller ej. Med protoner som projektil kan der ske det, der kaldes ‘ind-fangning’. Ved denne mekanisme stjæler protonen en elektron fra det atom,man skyder pa, og danner et brintatom. Atomet, der nu mangler en elektron,siges at være blevet enkelt ioniseret. Protonen kunne ogsa have enkelt ioniseretatomet ved blot at sla en elektron af uden at indfange den. Disse to mekanis-mer kan dog skelnes fra hinanden. Nar man studerer atomare kollisioner, erdet vigtigt at være opmærksom pa sadanne særlige mekanismer som f.eks. ind-fangning. Især i teoretiske beregninger skal man ofte huske at tage hensyn til

113
dem. Eksperimentelt kan man tit tage forbehold, der gør, at man enten kanundga disse mekanismer eller ligefrem vælge direkte at studere dem.
Positronen har den samme positive ladning som protonen. Derfor har posi-tronen ogsa den samme indfangningsmekanisme som protonen. Nar en positronindfanger en elektron, danner de et slags pseudoatom kaldet positronium. I po-sitronium er der ingen atomkerne som f.eks. i brint. I stedet kredser positronenog elektronen nærmest om hinanden. Positronium er meget ustabilt og leverhøjst i ca. en 10 milliontedel af et sekund. Det er fordi positronen og elektronenfør eller siden opdager, at de er hinandens antipartikler og annihilerer med hi-nanden. Som med protoner bliver atomet enkelt ioniseret af denne mekanisme.Skønt positronium atomet hurtigt forsvinder, kan man godt med eksperimentermale, hvor vigtig indfangning er ved ionisering i kollisioner af positroner medatomer. Den centrale del af denne afhandling handler om malinger af positro-nens indfangningsmekanisme ved ionisering.
Ved enkelt ionisering af et atom er den vigtigste betingelse for at indfangningkan finde sted, at det positivt ladede projektil og den løsrevne elektron flyverbort fra kollisionen sammen i cirka samme retning og med omtrent den sammefart. Dette betyder, at indfangning især sker, nar projektilet kommer ind modatomet med lav hastighed1, da elektronen sa har nemmere ved at ‘følge med’.Det betyder ogsa, at indfangning er relativt mere vigtig i enkelt ionisering medpositroner end med protoner. Det er fordi protonen er sa tung, at den kunafbøjes ganske lidt i en kollision. Det er derfor op til en løsreven elektron atindrette sig efter protonen for at indfangning kan finde sted. Da positronen er1836 gange lettere end protonen, kan den afbøjes langt mere. Det gør det relativtmere sandsynligt for at positronen og en løsreven elektron ender med at følgesad. Alt dette har været kendt relativt længe bade teoretisk og eksperimentelt.Nogle af resultaterne fra denne afhandling bekræfter ogsa, at det forholder sigsadan.
Et af de vigtigste spørgsmal, der er undersøgt i denne afhandling, er dog,hvordan det forholder sig med indfangning, hvis man dobbelt ioniserer atomet istedet, dvs. slar to elektroner af under en kollision. Før resultaterne fra denneafhandling blev kendt, troede man at indfangning ville betyde lige sa megeti dobbelt ionisering med positroner som i enkelt ionisering. For det første erder to elektroner at vælge imellem, og for det andet er dobbelt ionisering enmere ‘voldsom’ kollision end enkelt ionisering, sa positronen kan stadig afbøjesmindst lige sa meget som før. Vores resultater har vist, at det ikke forholdersig sadan.
Fra et eksperiment, hvori vi har set pa kollisioner af positroner med det sim-pleste to-elektron atom, nemlig ædelgassen helium, har vi fundet, at indfang-ning ikke kan finde sted ved dobbelt ionisering. Det samme gælder i ædelgassen
1Lav hastighed betyder i denne sammenhæng en hastighed sammenlignelig med den, elek-tronerne har i atomet, dvs. i størrelsesorden af ca. 1% af lysets hastighed.

114 DANSK RESUME
neon. For de tre tungere ædelgasser argon, krypton og xenon har vi fundet, atnogen indfangning finder sted. Dog ved de laveste projektilhastigheder finderder mindre indfangning sted end umiddelbart forventet. Disse resultater be-tragtes som højst overraskende. Der findes endnu ikke nogen fuld teoretiskforklaring til dette fænomen. Det eneste forslag hidtil er en mekanisme, hvoriden tilbageblevne ion efter ioniseringen af atomet selv udfører en slags omvendtindfangning af elektronen i positronium pseudoatomet. Resultatet bliver dervedikke en dobbelt ionisering med indfangning men en enkelt ionisering uden ind-fangning. Denne mekanisme skulle sa være særlig favorabel i helium og neon,hvor vi overhovedet ingen dobbelt ionisering med indfangning ser. Om denneteori er korrekt, eller om tingene forholder sig anderledes, er dog stadig uvist.
Den forskning, der er udført til denne afhandling, hører ind under det mankalder grundforskning. Det betyder, bl.a. at resultaterne ikke har nogen umid-delbar teknologisk anvendelse. De studerede systemer bestaende af f.eks. enatomkerne, to elektroner og en positron, kan virke meget simple. Det er dogigennem forstaelsen af sadanne systemer, at man kan gøre sig hab om en bedreforstaelse af mere generelle problemer i atomfysikken. Vores resultater har vist,at inden for den del af atomfysikken, der har med atomare kollisioner at gøre,er der stadig simple mekanismer, vi endnu ikke forstar fuldt ud. Forhabentligvil kommende forskning bibringe en forklaring til de observerede fænomener, ogdermed give os en bedre forstaelse af atomare kollisioner og atomer generelt.

List of Figures
1.1 Advantage of moderation . . . . . . . . . . . . . . . . . . . . . . 8
2.1 Capture in double ionisation of helium by proton impact . . . . . 192.2 Single ionisation of helium [keV/amu] . . . . . . . . . . . . . . . 212.3 Single ionisation of helium by positron impact . . . . . . . . . . . 222.4 Ratio R
(2)I for helium [keV/amu] . . . . . . . . . . . . . . . . . . 27
2.5 Schematic of the Arhus electrostatic beam line and gas cell . . . 312.6 Time-of-flight MCA spectrum . . . . . . . . . . . . . . . . . . . . 342.7 Single ionisation of neon by positron impact . . . . . . . . . . . . 382.8 Single ionisation of argon . . . . . . . . . . . . . . . . . . . . . . 412.9 Single ionisation of krypton . . . . . . . . . . . . . . . . . . . . . 422.10 Single ionisation of xenon . . . . . . . . . . . . . . . . . . . . . . 432.11 Double ionisation of helium . . . . . . . . . . . . . . . . . . . . . 442.12 Double ionisation of neon . . . . . . . . . . . . . . . . . . . . . . 452.13 Double ionisation of argon . . . . . . . . . . . . . . . . . . . . . . 462.14 Double ionisation of krypton . . . . . . . . . . . . . . . . . . . . 472.15 Double ionisation of xenon . . . . . . . . . . . . . . . . . . . . . . 482.16 Threshold behaviour of σ2+
tot for Ne, Ar, Kr and Xe . . . . . . . . 512.17 Double ionisation of argon [keV/amu] . . . . . . . . . . . . . . . 53
3.1 Four-particle break-up configuration of e+ on H− . . . . . . . . . 623.2 Rost-Pattard plot of σ+
I for hydrogen (helium) . . . . . . . . . . 653.3 MRP plot of σ2+
tot for helium and neon . . . . . . . . . . . . . . . 683.4 MRP plot of σ2+
tot for argon and krypton . . . . . . . . . . . . . . 70
4.1 Schematic of UCL experiment . . . . . . . . . . . . . . . . . . . . 794.2 Total single ionisation of atomic hydrogen . . . . . . . . . . . . . 834.3 Direct single ionisation of atomic hydrogen . . . . . . . . . . . . 844.4 Positronium formation in atomic hydrogen . . . . . . . . . . . . . 85
5.1 Non-dissociative ionisation of N2 . . . . . . . . . . . . . . . . . . 975.2 Non-dissociative ionisation of CO . . . . . . . . . . . . . . . . . . 98
115

116 LIST OF FIGURES
5.3 Non-dissociative ionisation of CO2 . . . . . . . . . . . . . . . . . 995.4 Non-dissociative ionisation of CH4 . . . . . . . . . . . . . . . . . 1005.5 Dissociative ionisation of N2 . . . . . . . . . . . . . . . . . . . . . 1015.6 Dissociative ionisation of CO . . . . . . . . . . . . . . . . . . . . 1025.7 Dissociative ionisation of CO2 . . . . . . . . . . . . . . . . . . . . 103