ion torrent torrentsuite guide version 3.4.1
DESCRIPTION
Guide including analysis and instructions.TRANSCRIPT
USER DOCUMENTATION
Torrent Suite 3.4.1
Revision Date December 2012
Version 3.4.1
- Page 2 - Copyright © 2012 Life Technologies Corporation
For Research Use Only. Not intended for any animal or human therapeutic or diagnostic use.
Torrent Suite User Documentation
Welcome to the Torrent Suite User Documentation Home Page.
Contents
Quickstart
Torrent Browser User Interface Guide
Torrent Browser Analysis Report Guide
Use Cases
Technical Notes and Whitepapers
Version 3.4.1
- Page 3 - Copyright © 2012 Life Technologies Corporation
For Research Use Only. Not intended for any animal or human therapeutic or diagnostic use.
Quickstart
Quickstart
What's Covered Here?
This guide gives you an overview of concepts and methods involved in working with Ion Torrent analysis data.™
The covers the Torrent Browser tabs and how you use templates and planned runs to control yourIntroductionsequencing runs.
A high-level view of the run data flow, should give you a point of reference for understanding theOn Dataflow,different stages of an analysis run.
Learn how to start and monitor a run by reading .Start a Run
Learn the basics of how to access and interpret the reports generated by a run, in .View Runs and Reports
Finally, in you can find suggestions for additional reading that gives you more in-depth information aboutWhat Next,the concepts you have just learned.
Prerequisites
These instructions assume that you have already set up your Torrent Server and can access Torrent Browser.Detailed information about setting up your server is found in the .Torrent Server Administration Guide
To manually run an analysis, you must also have a run defined in the run list with experiment data uploaded fromthe PGM™ or sequencer to the Torrent Server.Proton™
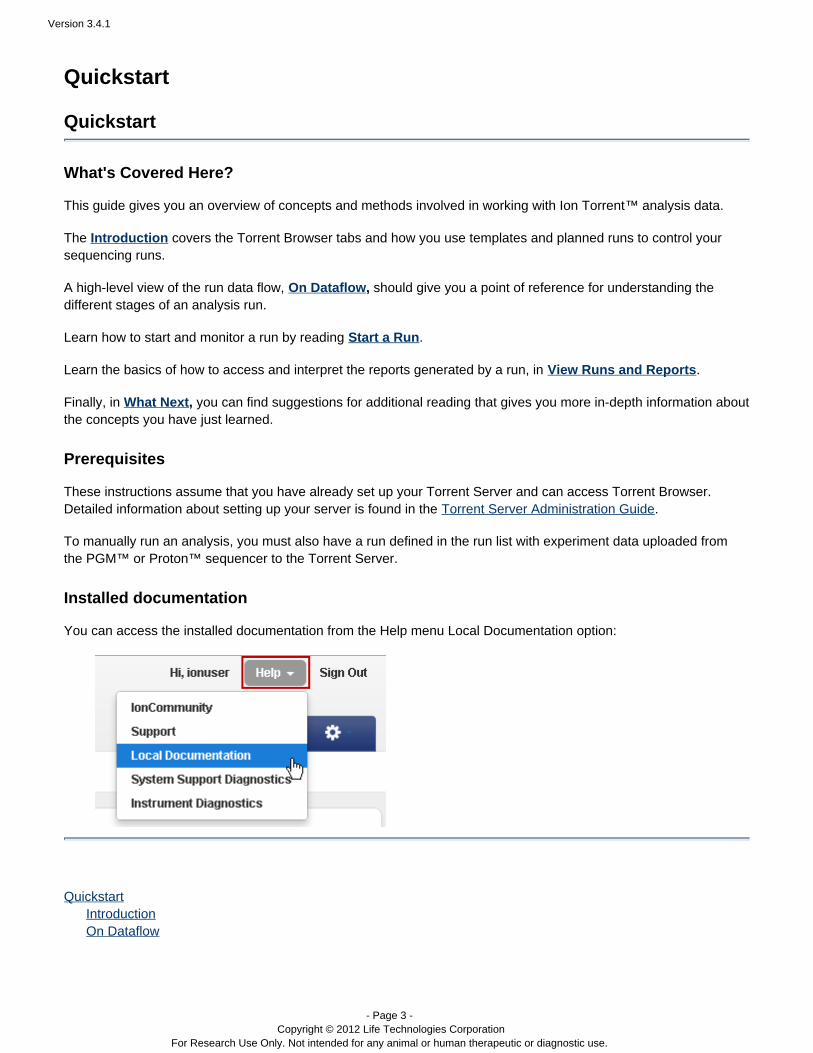
Installed documentation
You can access the installed documentation from the Help menu Local Documentation option:
Quickstart Introduction On Dataflow
Version 3.4.1
- Page 4 - Copyright © 2012 Life Technologies Corporation
For Research Use Only. Not intended for any animal or human therapeutic or diagnostic use.
Start a Run View Runs and ReportsWhat Next
Introduction
Quickstart
Introduction
Torrent Suite provides an integrated environment to manage your sequencing instrument runs and the resultingsequencing data.
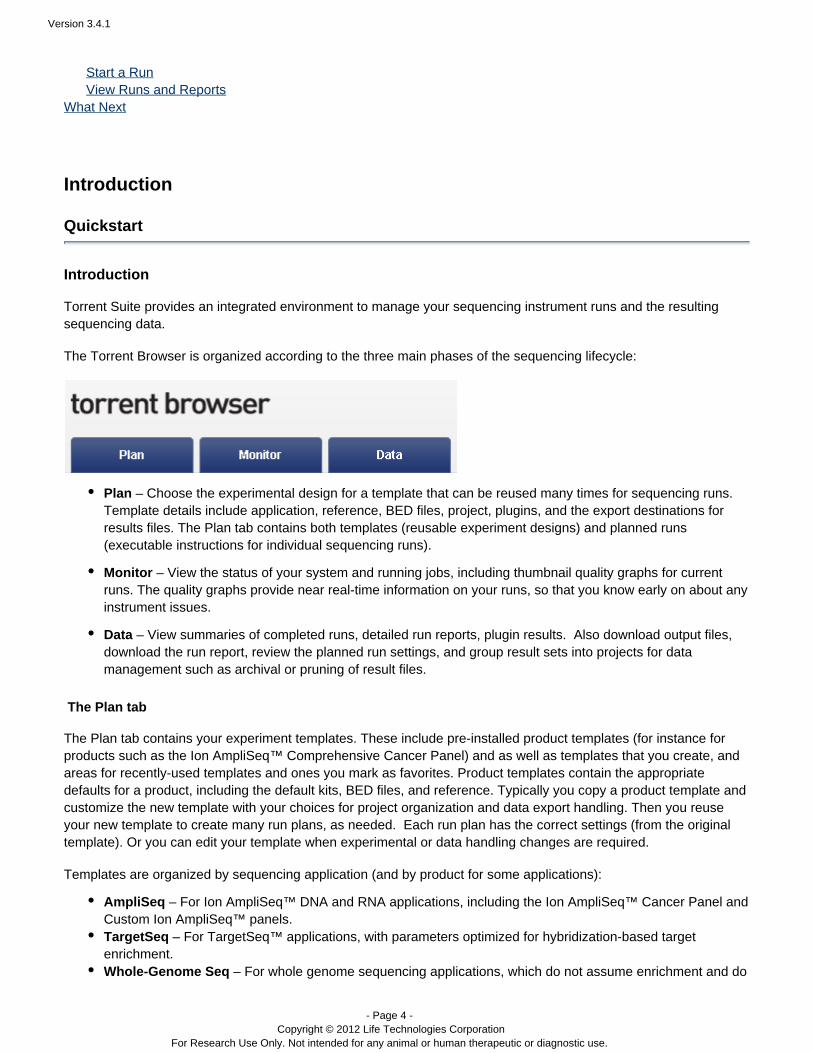
The Torrent Browser is organized according to the three main phases of the sequencing lifecycle:
Plan – Choose the experimental design for a template that can be reused many times for sequencing runs.Template details include application, reference, BED files, project, plugins, and the export destinations forresults files. The Plan tab contains both templates (reusable experiment designs) and planned runs(executable instructions for individual sequencing runs).
Monitor – View the status of your system and running jobs, including thumbnail quality graphs for currentruns. The quality graphs provide near real-time information on your runs, so that you know early on about anyinstrument issues.
Data – View summaries of completed runs, detailed run reports, plugin results. Also download output files,download the run report, review the planned run settings, and group result sets into projects for datamanagement such as archival or pruning of result files.
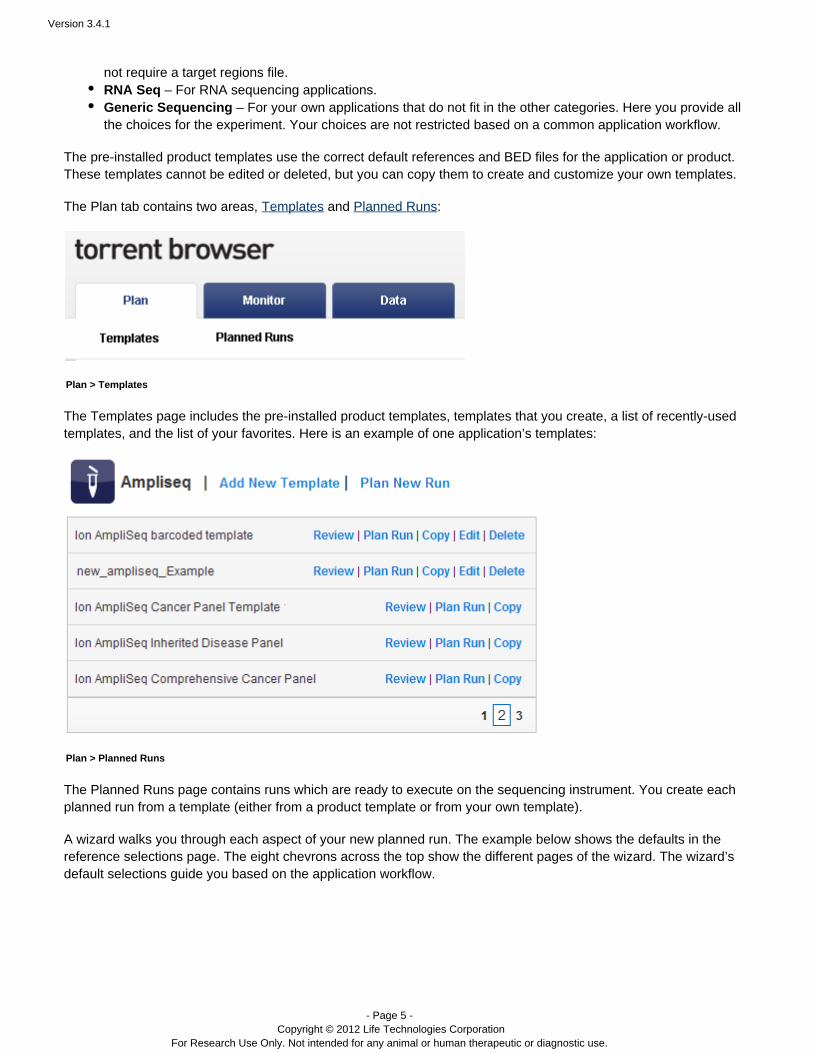
The Plan tab
The Plan tab contains your experiment templates. These include pre-installed product templates (for instance forproducts such as the Ion AmpliSeq Comprehensive Cancer Panel) and as well as templates that you create, and™areas for recently-used templates and ones you mark as favorites. Product templates contain the appropriatedefaults for a product, including the default kits, BED files, and reference. Typically you copy a product template andcustomize the new template with your choices for project organization and data export handling. Then you reuseyour new template to create many run plans, as needed. Each run plan has the correct settings (from the originaltemplate). Or you can edit your template when experimental or data handling changes are required.
Templates are organized by sequencing application (and by product for some applications):
AmpliSeq – For Ion AmpliSeq™ DNA and RNA applications, including the Ion AmpliSeq™ Cancer Panel andCustom Ion AmpliSeq™ panels.TargetSeq – For TargetSeq applications, with parameters optimized for hybridization-based target™enrichment.Whole-Genome Seq – For whole genome sequencing applications, which do not assume enrichment and do
Version 3.4.1
- Page 5 - Copyright © 2012 Life Technologies Corporation
For Research Use Only. Not intended for any animal or human therapeutic or diagnostic use.
not require a target regions file.RNA Seq – For RNA sequencing applications.Generic Sequencing – For your own applications that do not fit in the other categories. Here you provide allthe choices for the experiment. Your choices are not restricted based on a common application workflow.
The pre-installed product templates use the correct default references and BED files for the application or product.These templates cannot be edited or deleted, but you can copy them to create and customize your own templates.
The Plan tab contains two areas, and :Templates Planned Runs
Plan > Templates
The Templates page includes the pre-installed product templates, templates that you create, a list of recently-usedtemplates, and the list of your favorites. Here is an example of one application’s templates:
Plan > Planned Runs
The Planned Runs page contains runs which are ready to execute on the sequencing instrument. You create eachplanned run from a template (either from a product template or from your own template).
A wizard walks you through each aspect of your new planned run. The example below shows the defaults in thereference selections page. The eight chevrons across the top show the different pages of the wizard. The wizard’sdefault selections guide you based on the application workflow.

Version 3.4.1
- Page 6 - Copyright © 2012 Life Technologies Corporation
For Research Use Only. Not intended for any animal or human therapeutic or diagnostic use.
Each Planned Run contains complete instructions for its sample, from sequencing on instrument to export of theresults files to other analysis systems, such as to Ion Reporter Software.™
Here is an example planned runs listing:
A planned run is ready to execute on the sequencing instrument and is executed by entering its 5-digit run code onthe instrument. From the run code, all the plan run’s settings are available to the instrument and to the Torrent Suitesoftware. All of your selections, from the original template and the planned run that you save, are known to theTorrent system and software. The system carries out your instructions, from sequencing through to data export.
The Monitor tab
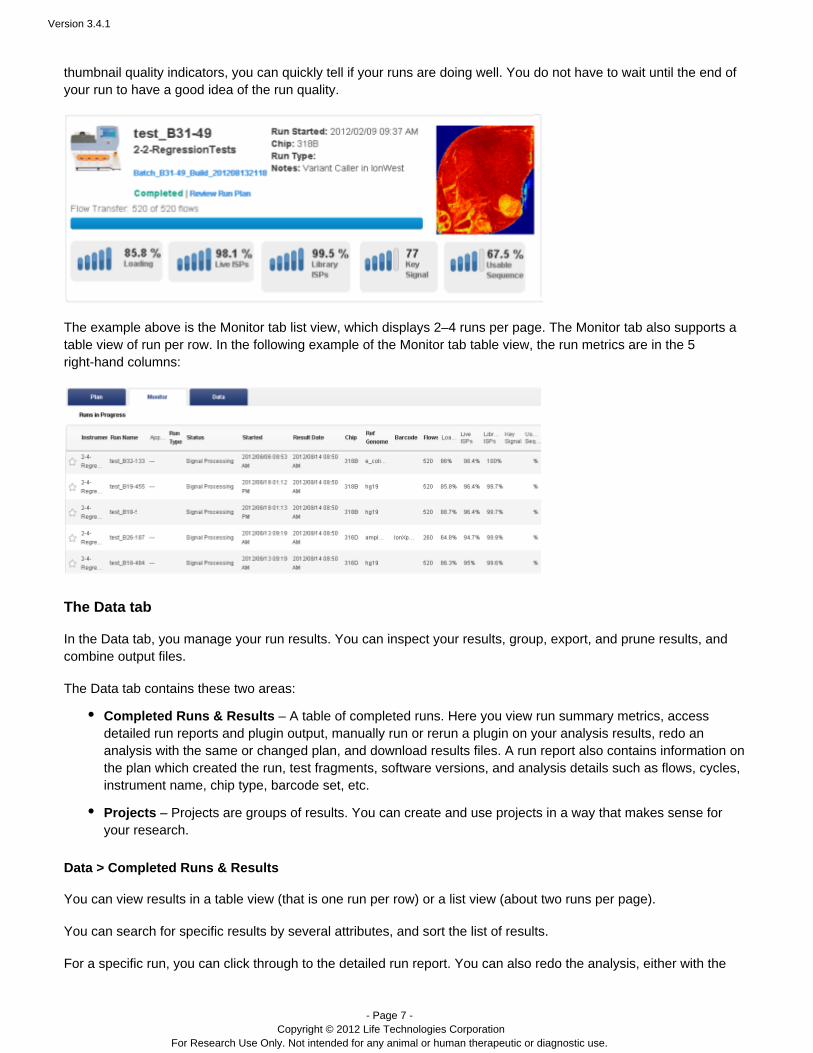
In the Monitor tab you can inspect your in-progress runs, including preliminary run metrics such as bead loadingpercentage, Ion Sphere Partical (ISP) percentages, key signal, and usable sequence percentage. With the™
Version 3.4.1
- Page 7 - Copyright © 2012 Life Technologies Corporation
For Research Use Only. Not intended for any animal or human therapeutic or diagnostic use.
thumbnail quality indicators, you can quickly tell if your runs are doing well. You do not have to wait until the end ofyour run to have a good idea of the run quality.
The example above is the Monitor tab list view, which displays 2–4 runs per page. The Monitor tab also supports atable view of run per row. In the following example of the Monitor tab table view, the run metrics are in the 5right-hand columns:
The Data tab
In the Data tab, you manage your run results. You can inspect your results, group, export, and prune results, andcombine output files.
The Data tab contains these two areas:
Completed Runs & Results – A table of completed runs. Here you view run summary metrics, accessdetailed run reports and plugin output, manually run or rerun a plugin on your analysis results, redo ananalysis with the same or changed plan, and download results files. A run report also contains information onthe plan which created the run, test fragments, software versions, and analysis details such as flows, cycles,instrument name, chip type, barcode set, etc.
Projects – Projects are groups of results. You can create and use projects in a way that makes sense foryour research.
Data > Completed Runs & Results
You can view results in a table view (that is one run per row) or a list view (about two runs per page).
You can search for specific results by several attributes, and sort the list of results.
For a specific run, you can click through to the detailed run report. You can also redo the analysis, either with the
Version 3.4.1
- Page 8 - Copyright © 2012 Life Technologies Corporation
For Research Use Only. Not intended for any animal or human therapeutic or diagnostic use.
same run instructions or with changed run instructions. (Run instructions include reference, barcode, sample name,run type, library key, notes, etc.)
Data > Projects
Projects are simply groups of runs. You create and use these groups in a way that makes sense for your research.Projects are useful to hold runs, for instance, for the same laboratory project or runs that you will later handle in thesame way (for data export or archival). But you can use projects as you wish. Projects are intended to be aconvenience, so that ou do not have to repeatedly search through therelated runs are grouped together. Ycompleted runs table to find related runs.
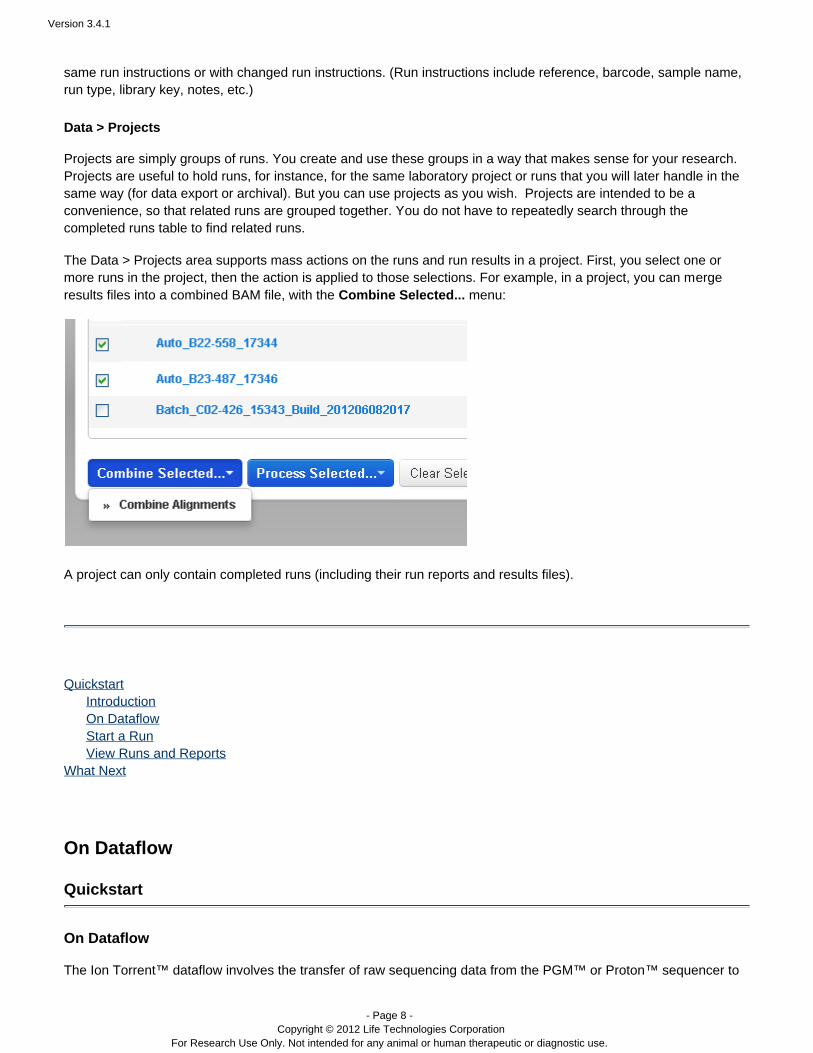
The Data > Projects area supports mass actions on the runs and run results in a project. First, you select one ormore runs in the project, then the action is applied to those selections. For example, in a project, you can mergeresults files into a combined BAM file, with the menu:Combine Selected...
A project can only contain completed runs (including their run reports and results files).
Quickstart Introduction On Dataflow Start a Run View Runs and ReportsWhat Next
On Dataflow
Quickstart
On Dataflow
The Ion Torrent dataflow involves the transfer of raw sequencing data from the PGM™ or Proton sequencer to™ ™
Version 3.4.1
- Page 9 - Copyright © 2012 Life Technologies Corporation
For Research Use Only. Not intended for any animal or human therapeutic or diagnostic use.
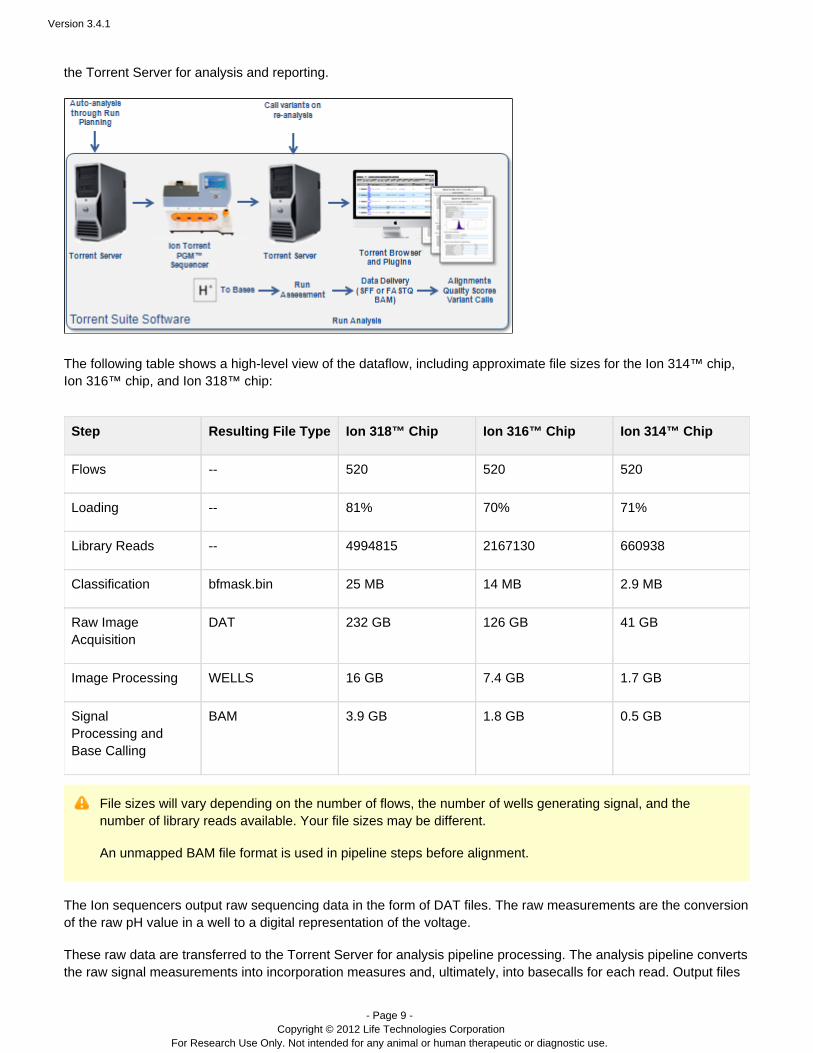
the Torrent Server for analysis and reporting.
The following table shows a high-level view of the dataflow, including approximate file sizes for the Ion 314™ chip,Ion 316™ chip, and Ion 318™ chip:
Step Resulting File Type Ion 318™ Chip Ion 316™ Chip Ion 314™ Chip
Flows -- 520 520 520
Loading -- 81% 70% 71%
Library Reads -- 4994815 2167130 660938
Classification bfmask.bin 25 MB 14 MB 2.9 MB
Raw ImageAcquisition
DAT 232 GB 126 GB 41 GB
Image Processing WELLS 16 GB 7.4 GB 1.7 GB
SignalProcessing andBase Calling
BAM 3.9 GB 1.8 GB 0.5 GB
File sizes will vary depending on the number of flows, the number of wells generating signal, and thenumber of library reads available. Your file sizes may be different.
An unmapped BAM file format is used in pipeline steps before alignment.
The Ion sequencers output raw sequencing data in the form of DAT files. The raw measurements are the conversionof the raw pH value in a well to a digital representation of the voltage.
These raw data are transferred to the Torrent Server for analysis pipeline processing. The analysis pipeline convertsthe raw signal measurements into incorporation measures and, ultimately, into basecalls for each read. Output files
Version 3.4.1
- Page 10 - Copyright © 2012 Life Technologies Corporation
For Research Use Only. Not intended for any animal or human therapeutic or diagnostic use.
1.
2.
3.
4.
at different pipeline stages include WELLS and other file formats. See for aTechnical Note - Analysis Pipelinedetailed description of analysis pipeline processing. See forTechnical Note - Transition from SFF to BAM formatmore information on file formats.
The Torrent Browser provides a web interface for viewing processing results, showing metrics and graphs.
From Ion Torrent™ Sequencer to Analysis Files
This section describes the data flow steps from a PGM sequencing instrument to the analysis results files. The™steps for Proton ™ sequencing data are similar.
During a PGM™ sequencer run one acquisition ( ) file is generated for each nucleotideacq_<flowNumber>.dat
flow. The acquisition file contains the raw signals measured in the chip wells. One data acquisition file is created foreach nucleotide flow.
Acquisition files are temporarily stored on the PGM™ sequencer hard drive(s).
Dataflow Steps
Data are generated on the PGM™ sequencer as files with one file per flow.acq_<flowNumber>.dat
The files are transferred to the Torrent Server using a standard computer networkacq_<flowNumber>.dat
cable. On the server, data transfer is controlled by the Crawler service. After the data associated with the initial flows of the PGM™ sequencer are available on the Torrent Server,analysis pipeline processing of the data begins. The first processing step compiles data from the many acq_
files into one file, for a given run.<flowNumber>.dat 1.wells
Basecalling is performed on the file data, producing an unmapped BAM file.1.wells
Transfer Data to the Torrent Server
Data are automatically transferred from the PGM™ or Proton sequencer to the Torrent Server.™
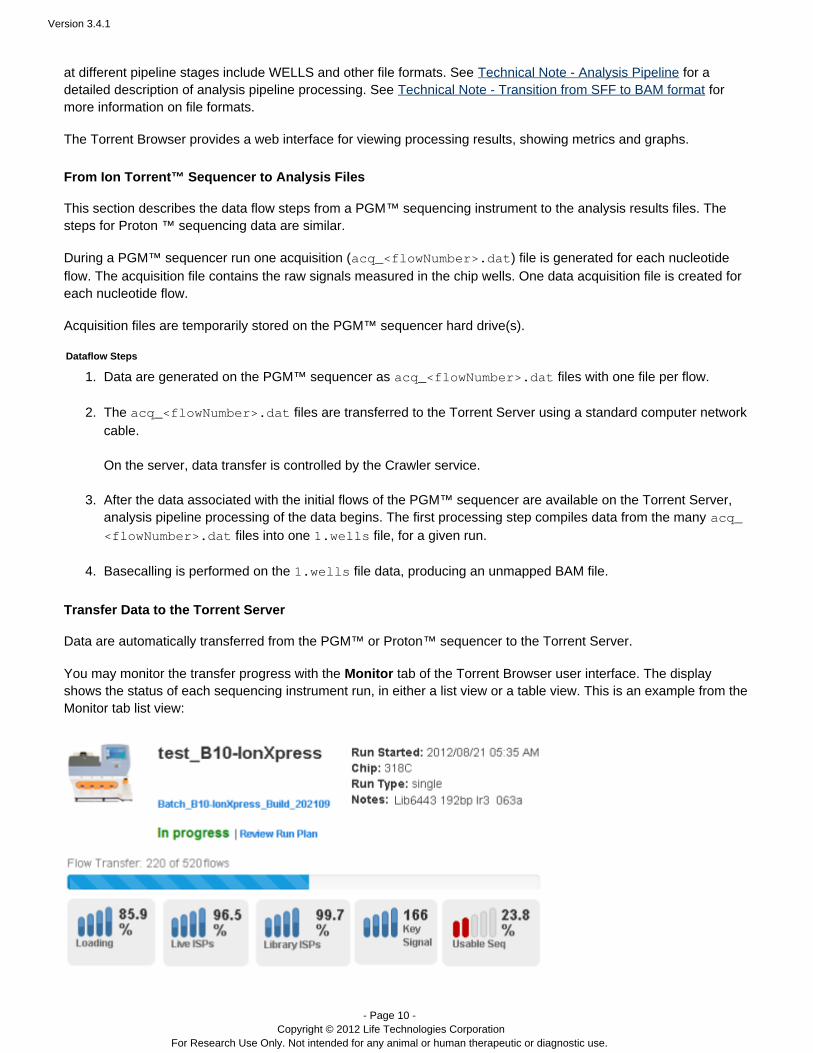
You may monitor the transfer progress with the tab of the Torrent Browser user interface. The displayMonitor shows the status of each sequencing instrument run, in either a list view or a table view. This is an example from theMonitor tab list view:
Version 3.4.1
- Page 11 - Copyright © 2012 Life Technologies Corporation
For Research Use Only. Not intended for any animal or human therapeutic or diagnostic use.
1.
The total number of flows and the number transferred are shown. The progress bar also shows the transfer status.Preliminary run metrics that fall below your thresholds appear in red in the thumbnail graphs
Ideally, the PGM™ sequencer and Torrent Server are directly connected using a Category 6 cable, tohandle the large data transfer. A direct connection provides the easiest setup and fastest data transferoptions, and transfer performance varies greatly because of network infrastructure differences. Pleaseconsult the PGM™ sequencer site preparation guide for more detailed instructions on connecting thePGM™ sequencer to the Torrent Server.
Quickstart Introduction On Dataflow Start a Run View Runs and ReportsWhat Next
Quickstart TOC
Quickstart Introduction On Dataflow Start a Run View Runs and ReportsWhat Next
Start a Run
Quickstart
Start a Run
Torrent Browser provides a User Interface for planning and managing runs, viewing reports, and data managementof your result sets.
Access the run management interface
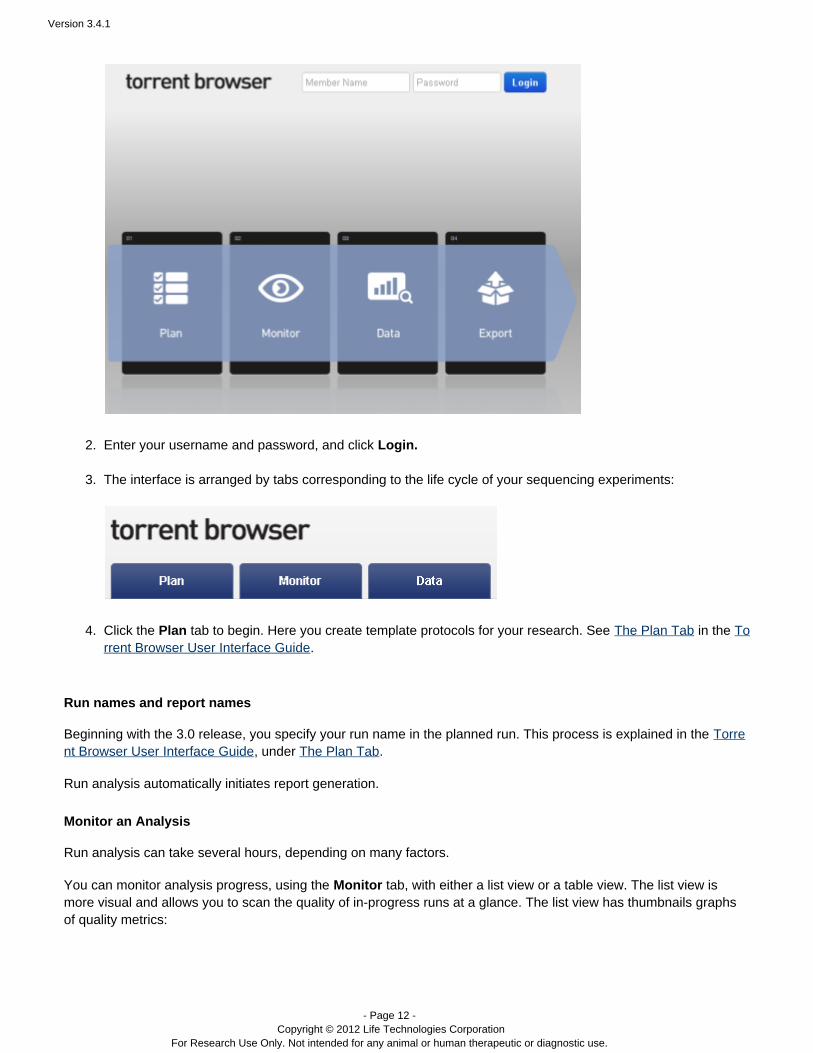
When you access your Torrent Server, Torrent Browser displays the start page shown in the following figure:
Version 3.4.1
- Page 12 - Copyright © 2012 Life Technologies Corporation
For Research Use Only. Not intended for any animal or human therapeutic or diagnostic use.
1.
2.
3.
4.
Enter your username and password, and click Login. The interface is arranged by tabs corresponding to the life cycle of your sequencing experiments:
Click the Plan tab to begin. Here you create template protocols for your research. See The Plan Tab in the Torrent Browser User Interface Guide.
Run names and report names
Beginning with the 3.0 release, you specify your run name in the planned run. This process is explained in the Torre, under .nt Browser User Interface Guide The Plan Tab
Run analysis automatically initiates report generation.
Monitor an Analysis
Run analysis can take several hours, depending on many factors.
You can monitor analysis progress, using the tab, with either a list view or a table view. The list view isMonitor more visual and allows you to scan the quality of in-progress runs at a glance. The list view has thumbnails graphsof quality metrics:

Version 3.4.1
- Page 13 - Copyright © 2012 Life Technologies Corporation
For Research Use Only. Not intended for any animal or human therapeutic or diagnostic use.
These metrics are described in the following table:
Metric Description
Loading The percentage of wells (out of all potentiallyloaded with addressable wells on the chip) an Ion
.Sphere™ Particle (ISP)
Live ISPs The percentage of wells (out of total wells) that containan ISP with a signal of sufficient strength andcomposition to be associated with the library or TestFragment key.
Library ISPs The percentage of Live ISPs (out of all Live ISPs) thathave a key signal identical to the library key signal.
Key Signal Strength of the signal associated with the keysequence.
Usable Sequence
In your templates, you can adjust the thresholds for loading, key signal, and usable sequence. If a run falls belowyour threshold for a metric, the thumbnail is shown in red instead of blue:
The list view also has a loading density image for each run. In these images, red indicates good loading. Yellow ispassable, and green and blue show very poor loading.
Run plugins
Version 3.4.1
- Page 14 - Copyright © 2012 Life Technologies Corporation
For Research Use Only. Not intended for any animal or human therapeutic or diagnostic use.
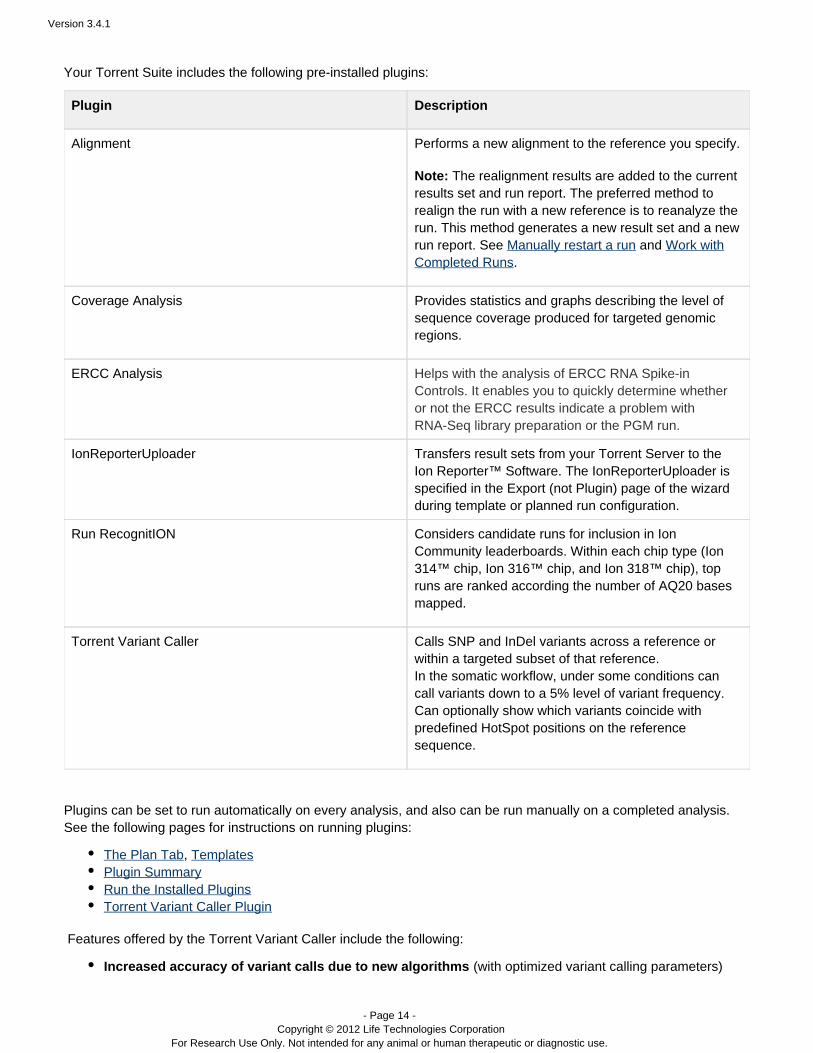
Your Torrent Suite includes the following pre-installed plugins:
Plugin Description
Alignment Performs a new alignment to the reference you specify.
Note: The realignment results are added to the currentresults set and run report. The preferred method torealign the run with a new reference is to reanalyze therun. This method generates a new result set and a newrun report. See and Manually restart a run Work with
.Completed Runs
Coverage Analysis Provides statistics and graphs describing the level ofsequence coverage produced for targeted genomicregions.
ERCC Analysis Helps with the analysis of ERCC RNA Spike-inControls. It enables you to quickly determine whetheror not the ERCC results indicate a problem withRNA-Seq library preparation or the PGM run.
IonReporterUploader Transfers result sets from your Torrent Server to theIon Reporter Software. The IonReporterUploader is™specified in the Export (not Plugin) page of the wizardduring template or planned run configuration.
Run RecognitION Considers candidate runs for inclusion in IonCommunity leaderboards. Within each chip type (Ion314™ chip, Ion 316™ chip, and Ion 318™ chip), topruns are ranked according the number of AQ20 basesmapped.
Torrent Variant Caller Calls SNP and InDel variants across a reference orwithin a targeted subset of that reference. In the somatic workflow, under some conditions cancall variants down to a 5% level of variant frequency. Can optionally show which variants coincide withpredefined HotSpot positions on the referencesequence.
Plugins can be set to run automatically on every analysis, and also can be run manually on a completed analysis.See the following pages for instructions on running plugins:
The Plan Tab, TemplatesPlugin SummaryRun the Installed PluginsTorrent Variant Caller Plugin
Features offered by the Torrent Variant Caller include the following:
Increased accuracy of variant calls due to new algorithms (with optimized variant calling parameters)
Version 3.4.1
- Page 15 - Copyright © 2012 Life Technologies Corporation
For Research Use Only. Not intended for any animal or human therapeutic or diagnostic use.
1.
2.
Ability to analyze standard and custom panels by uploading a BED fileBED files for standard panels are available, and you can upload custom BED files which are provided withour custom-designed products.
A single, efficient standard UI for multiple analysis typesStreamline your workflow by running multiple analysis types from a single plugin.
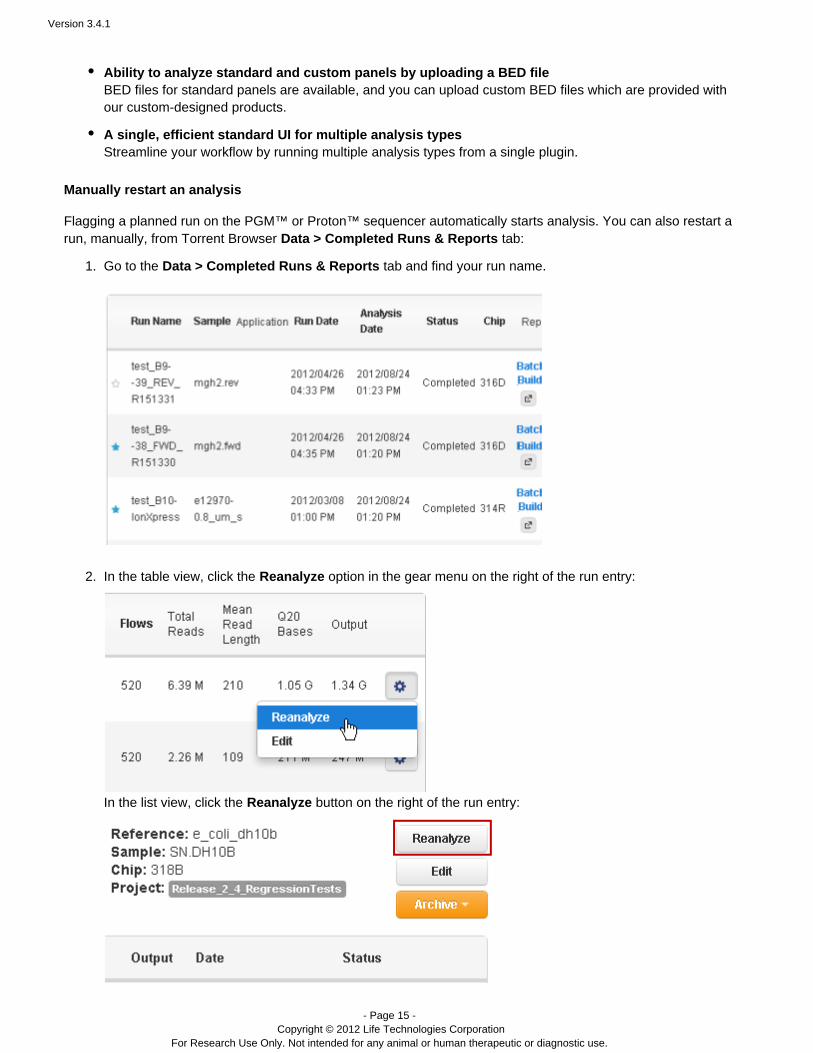
Manually restart an analysis
Flagging a planned run on the PGM™ or Proton™ sequencer automatically starts analysis. You can also restart arun, manually, from Torrent Browser tab:Data > Completed Runs & Reports
Go to the tab and find your run name.Data > Completed Runs & Reports
In the table view, click the option in the gear menu on the right of the run entry:Reanalyze
In the list view, click the button on the right of the run entry:Reanalyze
Version 3.4.1
- Page 16 - Copyright © 2012 Life Technologies Corporation
For Research Use Only. Not intended for any animal or human therapeutic or diagnostic use.
2.
3.
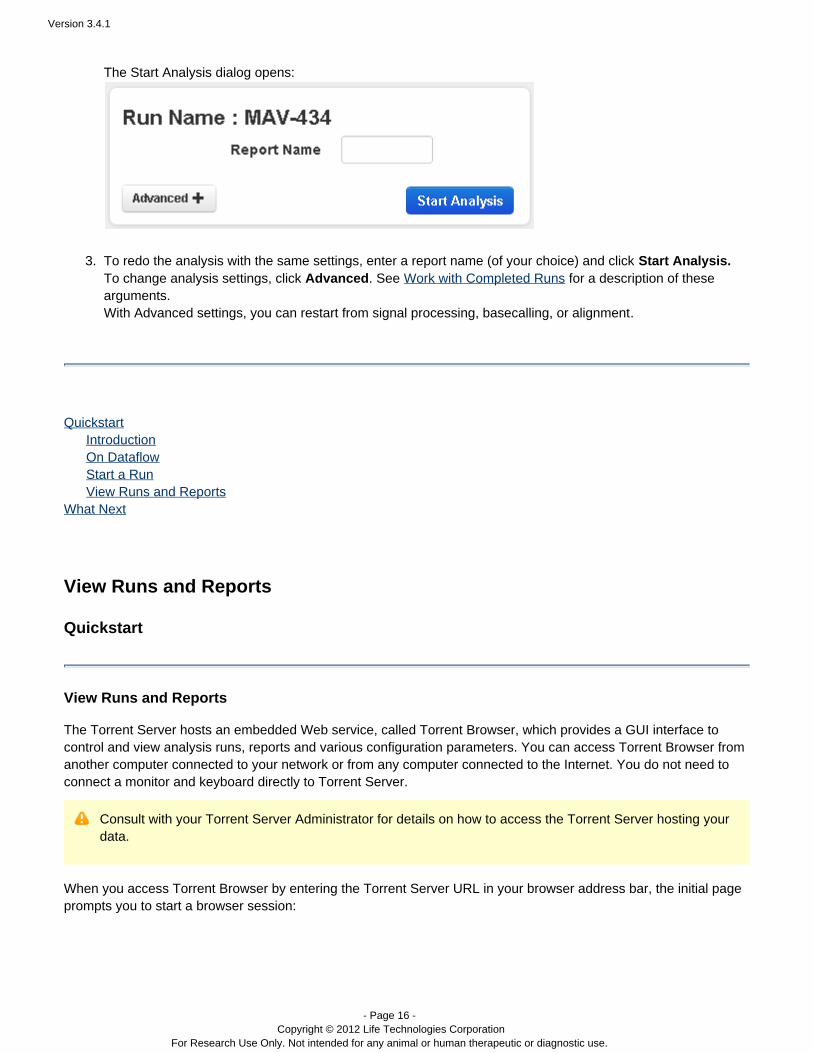
The Start Analysis dialog opens:
To redo the analysis with the same settings, enter a report name (of your choice) and click Start Analysis.To change analysis settings, click . See for a description of theseAdvanced Work with Completed Runsarguments.With Advanced settings, you can restart from signal processing, basecalling, or alignment.
Quickstart Introduction On Dataflow Start a Run View Runs and ReportsWhat Next
View Runs and Reports
Quickstart
View Runs and Reports
The Torrent Server hosts an embedded Web service, called Torrent Browser, which provides a GUI interface tocontrol and view analysis runs, reports and various configuration parameters. You can access Torrent Browser fromanother computer connected to your network or from any computer connected to the Internet. You do not need toconnect a monitor and keyboard directly to Torrent Server.
Consult with your Torrent Server Administrator for details on how to access the Torrent Server hosting yourdata.
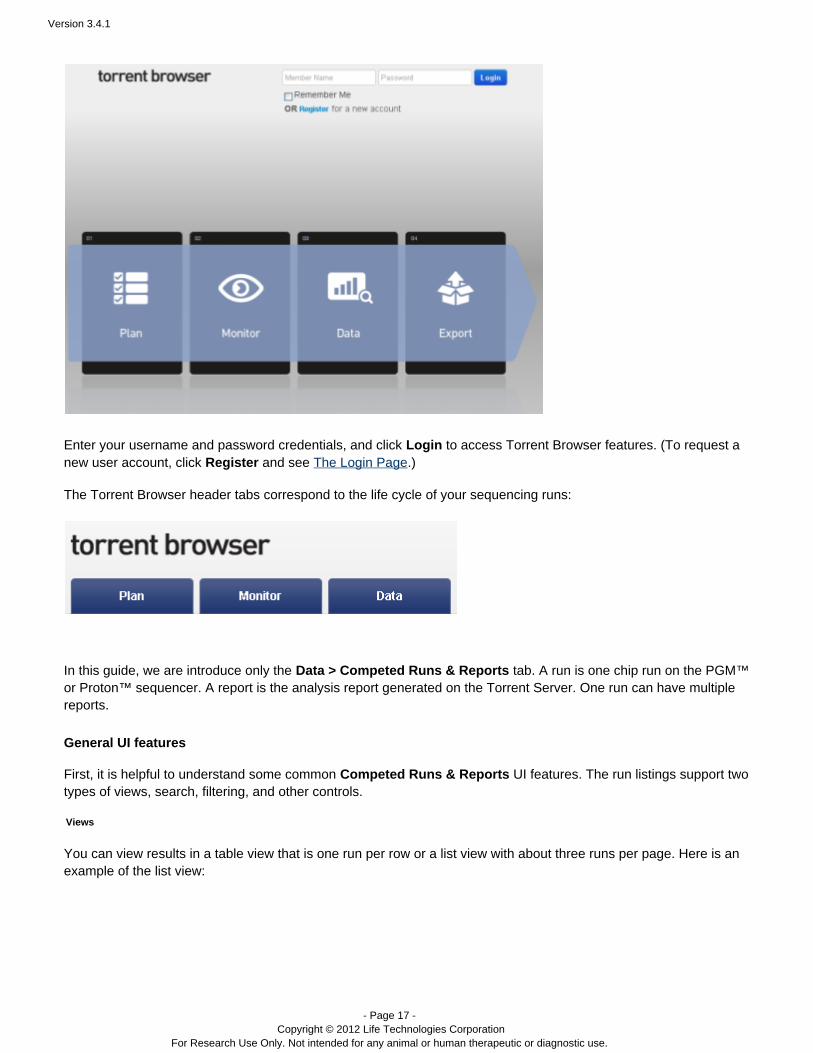
When you access Torrent Browser by entering the Torrent Server URL in your browser address bar, the initial pageprompts you to start a browser session:
Version 3.4.1
- Page 17 - Copyright © 2012 Life Technologies Corporation
For Research Use Only. Not intended for any animal or human therapeutic or diagnostic use.
Enter your username and password credentials, and click to access Torrent Browser features. (To request aLoginnew user account, click and see .)Register The Login Page
The Torrent Browser header tabs correspond to the life cycle of your sequencing runs:
In this guide, we are introduce only the tab. A is one chip run on the PGM™Data > Competed Runs & Reports runor Proton sequencer. A is the analysis report generated on the Torrent Server. One run can have multiple™ reportreports.
General UI features
First, it is helpful to understand some common UI features. The run listings support twoCompeted Runs & Reportstypes of views, search, filtering, and other controls.
Views
You can view results in a table view that is one run per row or a list view with about three runs per page. Here is anexample of the list view:

Version 3.4.1
- Page 18 - Copyright © 2012 Life Technologies Corporation
For Research Use Only. Not intended for any animal or human therapeutic or diagnostic use.
Here is an example of the table view:
Version 3.4.1
- Page 19 - Copyright © 2012 Life Technologies Corporation
For Research Use Only. Not intended for any animal or human therapeutic or diagnostic use.
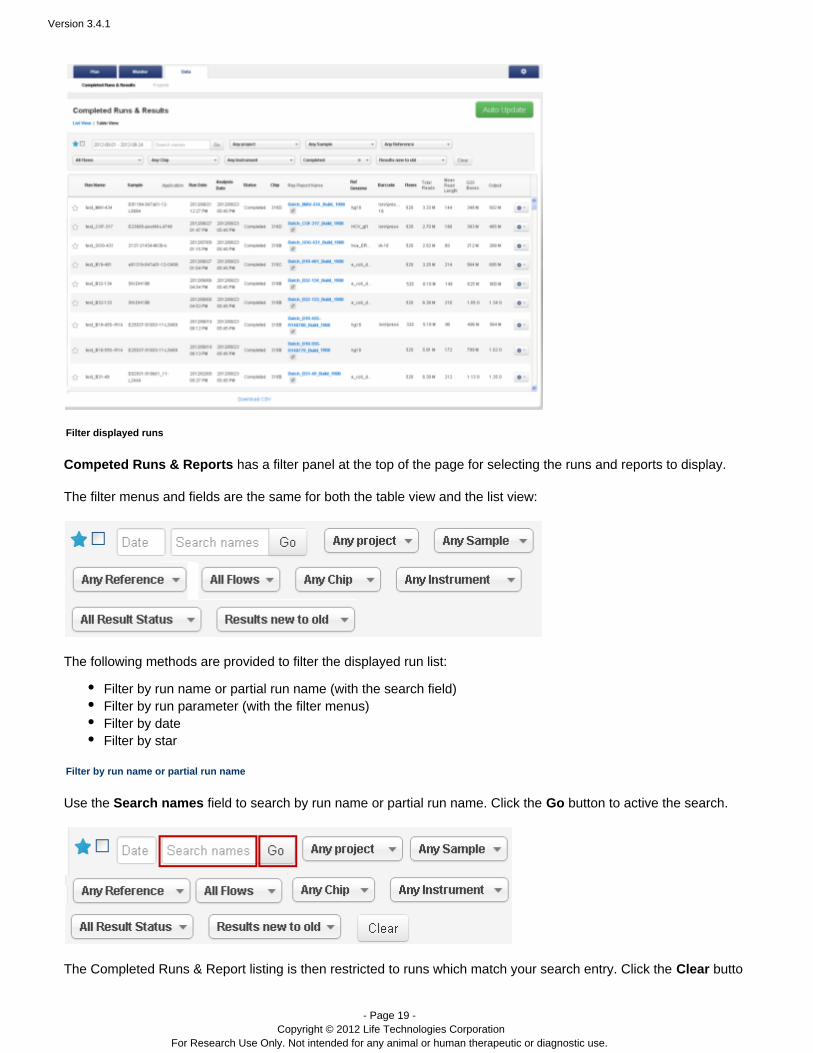
Filter displayed runs
Competed Runs & Reports has a filter panel at the top of the page for selecting the runs and reports to display.
The filter menus and fields are the same for both the table view and the list view:
The following methods are provided to filter the displayed run list:
Filter by run name or partial run name (with the search field)Filter by run parameter (with the filter menus)Filter by dateFilter by star
Filter by run name or partial run name
Use the field to search by run name or partial run name. Click the button to active the search.Search names Go
The Completed Runs & Report listing is then restricted to runs which match your search entry. Click the buttoClear
Version 3.4.1
- Page 20 - Copyright © 2012 Life Technologies Corporation
For Research Use Only. Not intended for any animal or human therapeutic or diagnostic use.
n to cancel the search and restore all results. The button also cancels the effect of the filter menus.Clear
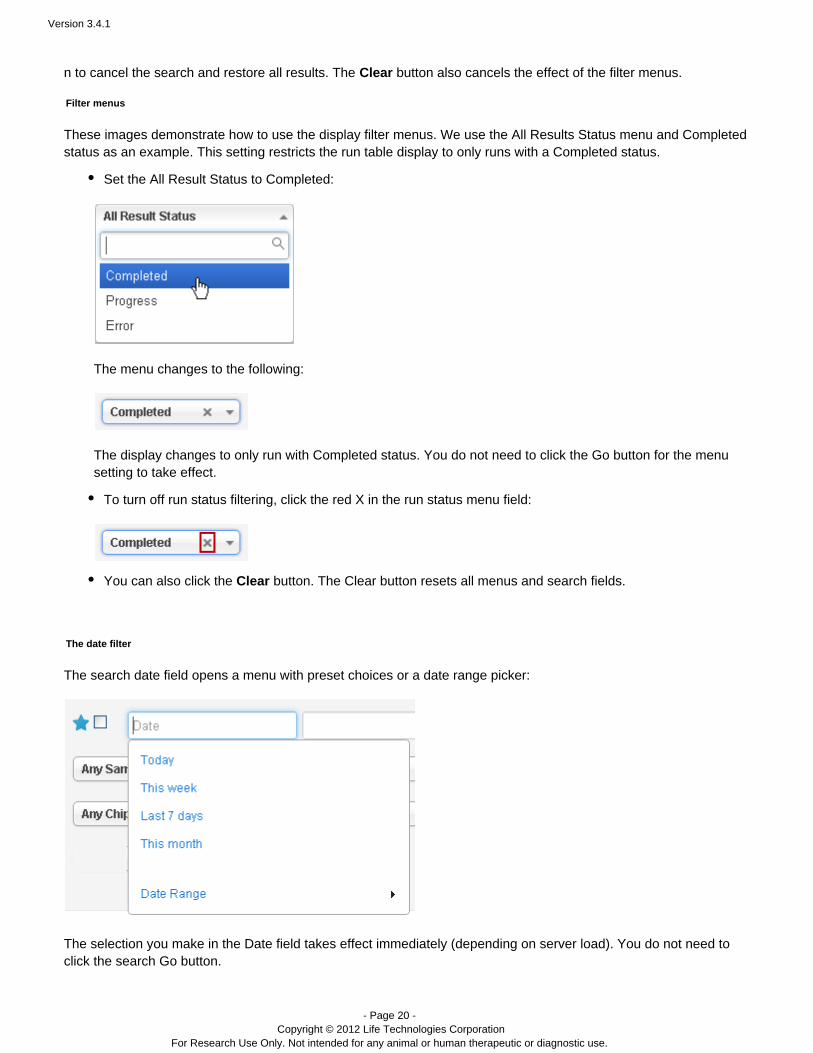
Filter menus
These images demonstrate how to use the display filter menus. We use the All Results Status menu and Completedstatus as an example. This setting restricts the run table display to only runs with a Completed status.
Set the All Result Status to Completed:
The menu changes to the following:
The display changes to only run with Completed status. You do not need to click the Go button for the menusetting to take effect.
To turn off run status filtering, click the red X in the run status menu field:
You can also click the button. The Clear button resets all menus and search fields.Clear
The date filter
The search date field opens a menu with preset choices or a date range picker:
The selection you make in the Date field takes effect immediately (depending on server load). You do not need toclick the search Go button.
Version 3.4.1
- Page 21 - Copyright © 2012 Life Technologies Corporation
For Research Use Only. Not intended for any animal or human therapeutic or diagnostic use.
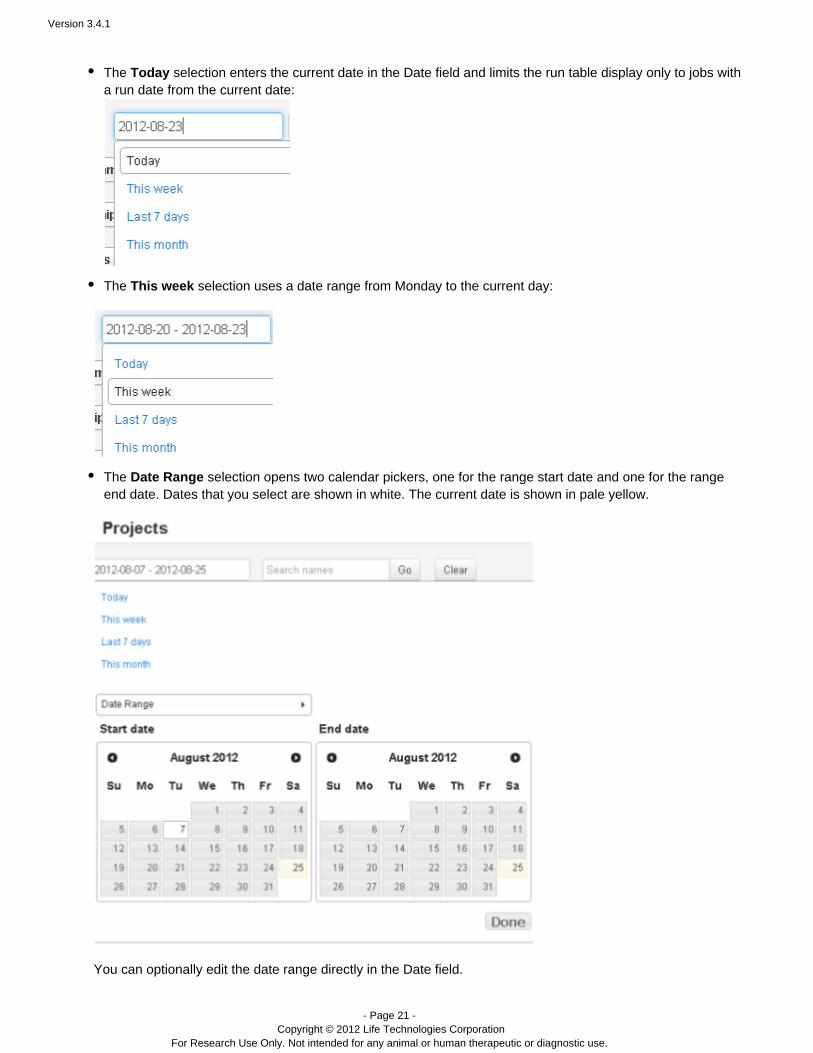
The selection enters the current date in the Date field and limits the run table display only to jobs withTodaya run date from the current date:
The selection uses a date range from Monday to the current day:This week
The selection opens two calendar pickers, one for the range start date and one for the rangeDate Rangeend date. Dates that you select are shown in white. The current date is shown in pale yellow.
You can optionally edit the date range directly in the Date field.
Version 3.4.1
- Page 22 - Copyright © 2012 Life Technologies Corporation
For Research Use Only. Not intended for any animal or human therapeutic or diagnostic use.
The starred runs filter
Click the checkbox next to the search area blue star to restrict display only to runs that you (or others) have
starred. You star a run by clicking the star next to its run name: . The start turns blue when clicked.
Sort
In the run table (table view only), click any header in bold to sort the table by that column. Click a second time toreverse the sort.
Other UI controls
This section describes other UI controls on the Completed Runs & Reports page:
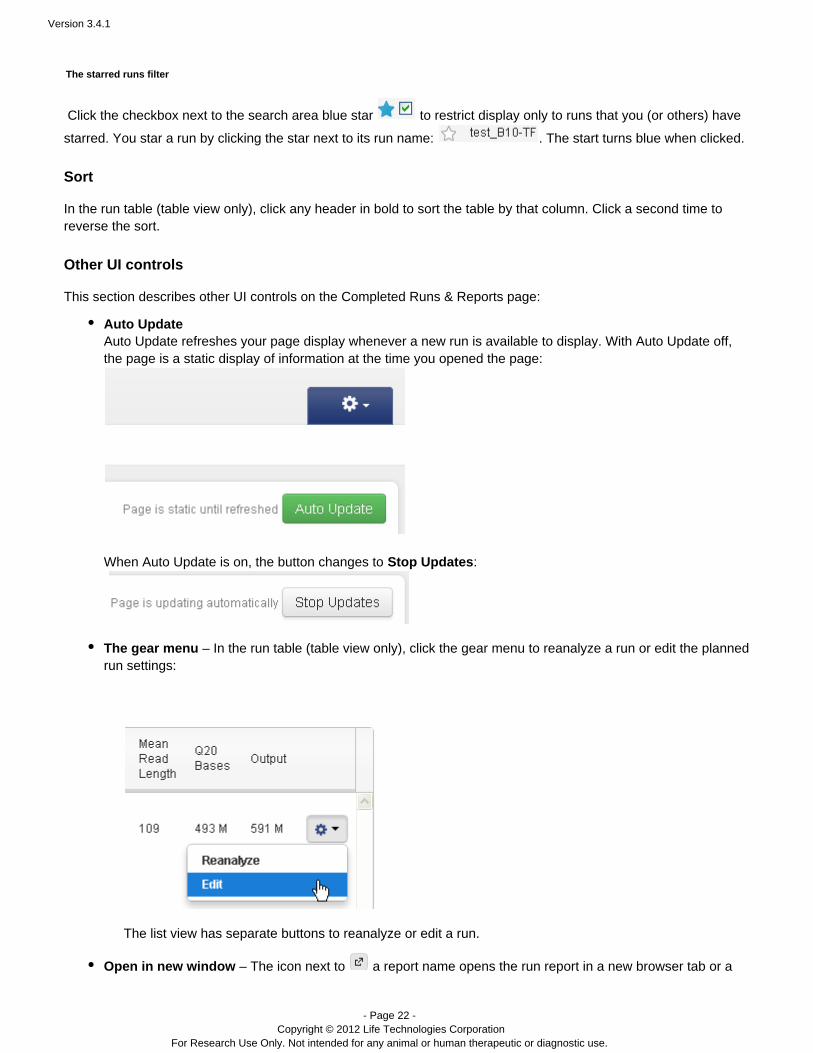
Auto UpdateAuto Update refreshes your page display whenever a new run is available to display. With Auto Update off,the page is a static display of information at the time you opened the page:
When Auto Update is on, the button changes to :Stop Updates
The gear menu – In the run table (table view only), click the gear menu to reanalyze a run or edit the plannedrun settings:
The list view has separate buttons to reanalyze or edit a run.
Open in new window – The icon next to a report name opens the run report in a new browser tab or a
Version 3.4.1
- Page 23 - Copyright © 2012 Life Technologies Corporation
For Research Use Only. Not intended for any animal or human therapeutic or diagnostic use.
1.
2.
new window.
Other UI controls are available, such as for archival. See for a completeCompleted Runs and Reports Tabdescription of the page.
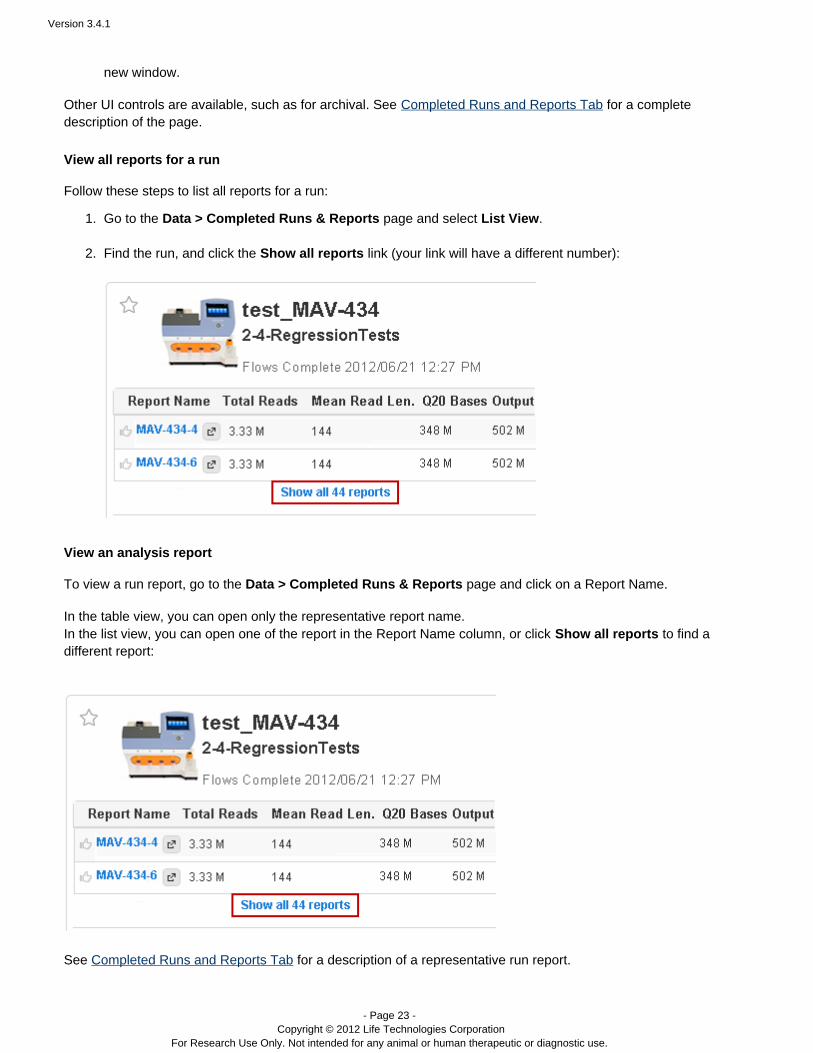
View all reports for a run
Follow these steps to list all reports for a run:
Go to the page and select .Data > Completed Runs & Reports List View
Find the run, and click the link (your link will have a different number):Show all reports
View an analysis report
To view a run report, go to the Data > Completed Runs & Reports page and click on a Report Name.
In the table view, you can open only the representative report name.In the list view, you can open one of the report in the Report Name column, or click to find aShow all reportsdifferent report:
See for a description of a representative run report.Completed Runs and Reports Tab
Version 3.4.1
- Page 24 - Copyright © 2012 Life Technologies Corporation
For Research Use Only. Not intended for any animal or human therapeutic or diagnostic use.
See for a description of a run report's contents.Torrent Browser Analysis Report Guide
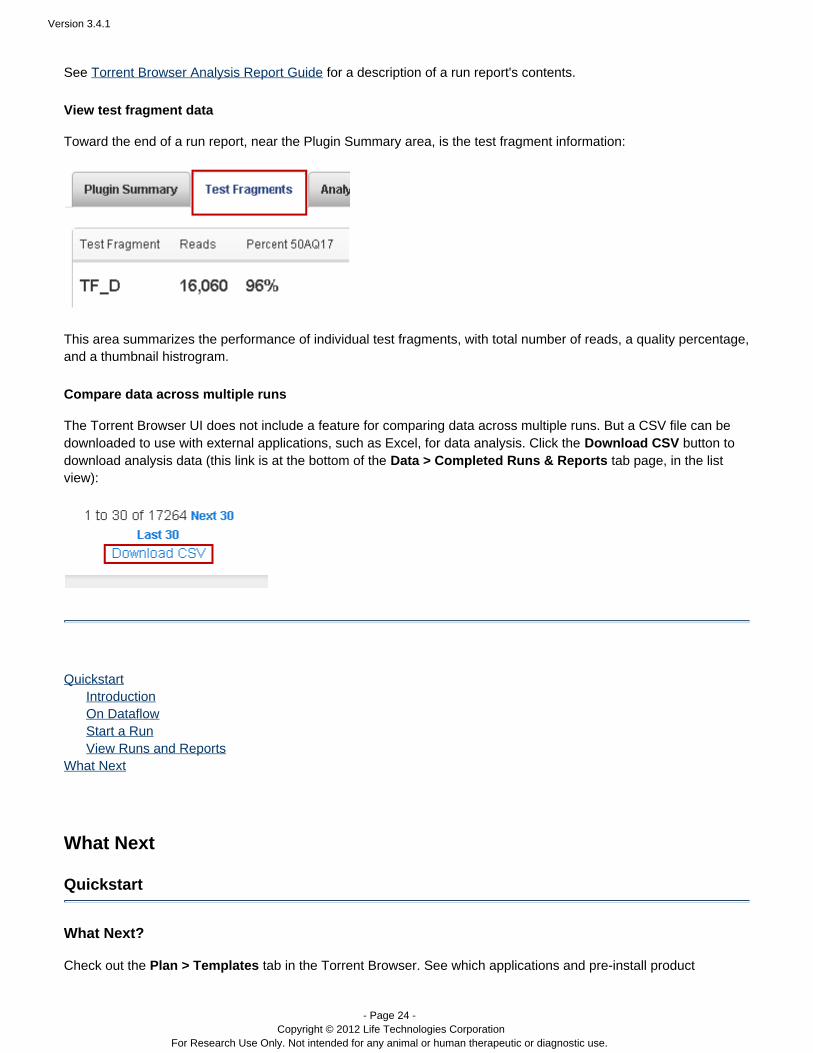
View test fragment data
Toward the end of a run report, near the Plugin Summary area, is the test fragment information:
This area summarizes the performance of individual test fragments, with total number of reads, a quality percentage,and a thumbnail histrogram.
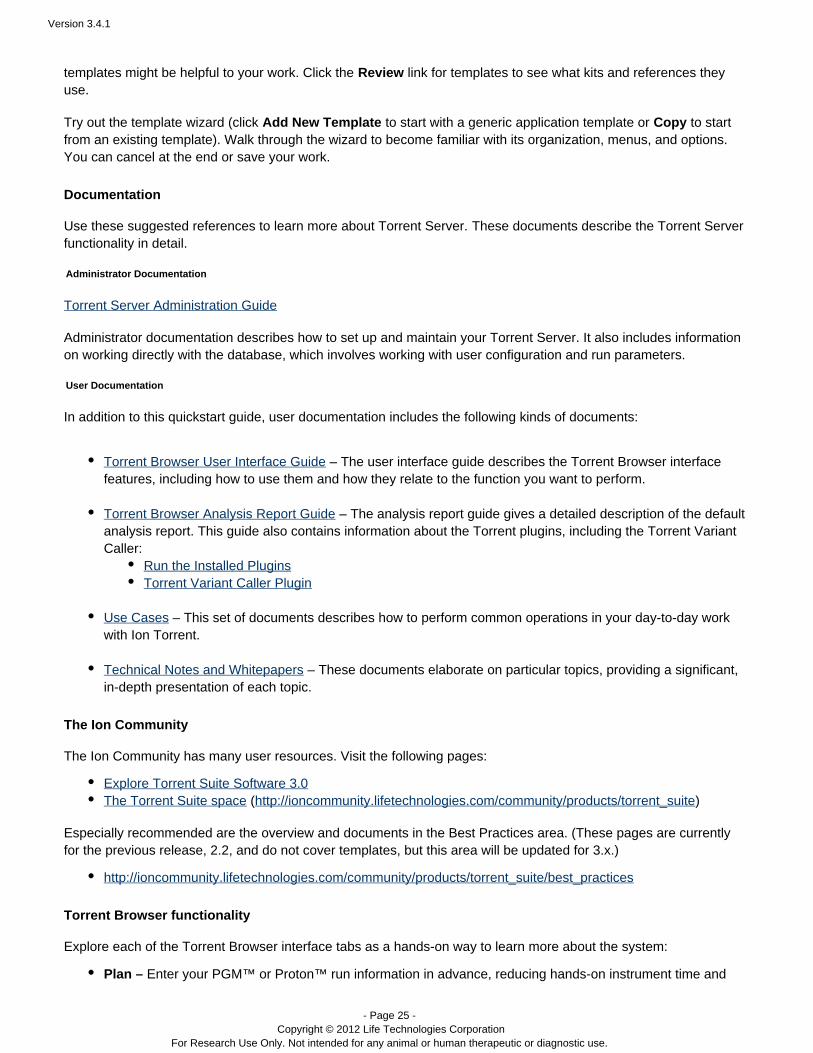
Compare data across multiple runs
The Torrent Browser UI does not include a feature for comparing data across multiple runs. But a CSV file can bedownloaded to use with external applications, such as Excel, for data analysis. Click the button toDownload CSVdownload analysis data (this link is at the bottom of the tab page, in the listData > Completed Runs & Reportsview):
Quickstart Introduction On Dataflow Start a Run View Runs and ReportsWhat Next
What Next
Quickstart
What Next?
Check out the tab in the Torrent Browser. See which applications and pre-install productPlan > Templates
Version 3.4.1
- Page 25 - Copyright © 2012 Life Technologies Corporation
For Research Use Only. Not intended for any animal or human therapeutic or diagnostic use.
templates might be helpful to your work. Click the link for templates to see what kits and references theyReviewuse.
Try out the template wizard (click to start with a generic application template or to startAdd New Template Copyfrom an existing template). Walk through the wizard to become familiar with its organization, menus, and options.You can cancel at the end or save your work.
Documentation
Use these suggested references to learn more about Torrent Server. These documents describe the Torrent Serverfunctionality in detail.
Administrator Documentation
Torrent Server Administration Guide
Administrator documentation describes how to set up and maintain your Torrent Server. It also includes informationon working directly with the database, which involves working with user configuration and run parameters.
User Documentation
In addition to this quickstart guide, user documentation includes the following kinds of documents:
Torrent Browser User Interface Guide – The user interface guide describes the Torrent Browser interfacefeatures, including how to use them and how they relate to the function you want to perform. Torrent Browser Analysis Report Guide – The analysis report guide gives a detailed description of the defaultanalysis report. This guide also contains information about the Torrent plugins, including the Torrent VariantCaller:
Run the Installed Plugins Torrent Variant Caller Plugin
Use Cases This set of documents describes how to perform common operations in your day-to-day work– with Ion Torrent. Technical Notes and Whitepapers – These documents elaborate on particular topics, providing a significant,in-depth presentation of each topic.
The Ion Community
The Ion Community has many user resources. Visit the following pages:
Explore Torrent Suite Software 3.0The Torrent Suite space ( )http://ioncommunity.lifetechnologies.com/community/products/torrent_suite
Especially recommended are the overview and documents in the Best Practices area. (These pages are currentlyfor the previous release, 2.2, and do not cover templates, but this area will be updated for 3.x.)
http://ioncommunity.lifetechnologies.com/community/products/torrent_suite/best_practices
Torrent Browser functionality
Explore each of the Torrent Browser interface tabs as a hands-on way to learn more about the system:
Plan – Enter your PGM™ or Proton™ run information in advance, reducing hands-on instrument time and
Version 3.4.1
- Page 26 - Copyright © 2012 Life Technologies Corporation
For Research Use Only. Not intended for any animal or human therapeutic or diagnostic use.
allowing an opportunity to print and review your run information.
Under Plan are two tabs, Templates and Planned Runs:
Templates – Reusable experiment designs. Design details include the application, laboratory kits,reference, BED files, project, and the export destinations for results files. Your templates serve as adigital version of your protocol – from these you create planned runs as necessary.
Planned Runs – Executable instructions for individual sequencing runs. You create a planned runfrom one of your templates (or from a pre-installed template).
Monitor – View the progress of your instrument runs in real time.
Data – Search and review all of your instrument runs or drill down to see your run reports.
Completed Runs & Reports – Access a run report, download a result set, launch a plugin on acompleted run.
Projects – Group your result sets into projects for convenient access and data management. Exportresult sets to other systems for further analysis. Archive or prune results sets.
Quickstart Introduction On Dataflow Start a Run View Runs and ReportsWhat Next
Version 3.4.1
- Page 27 - Copyright © 2012 Life Technologies Corporation
For Research Use Only. Not intended for any animal or human therapeutic or diagnostic use.
Torrent Browser User Interface Guide
Torrent Browser User Interface Guide
Introduction
Torrent Browser, the main Torrent Suite software user interface, provides access to the following tasks:
Design your research protocols in the form of experiment templates.Plan future runs to be executed on your Ion sequencing instruments.Monitor the progress and preliminary quality of your current instrument runs.View a Detailed Report for a specific run.View summary statistics from several analyses.Find a specific run or report, using filter or search criteria.Restart an analysis from a completed run.Run or rerun a plugin on the analysis results from a completed run.Group your analyses into projects for more convenient data management.Configure various Torrent Suite software parameters to control archiving, reporting, and other administrativefunctions.
You can also access support and licensing information at the bottom of the main page:
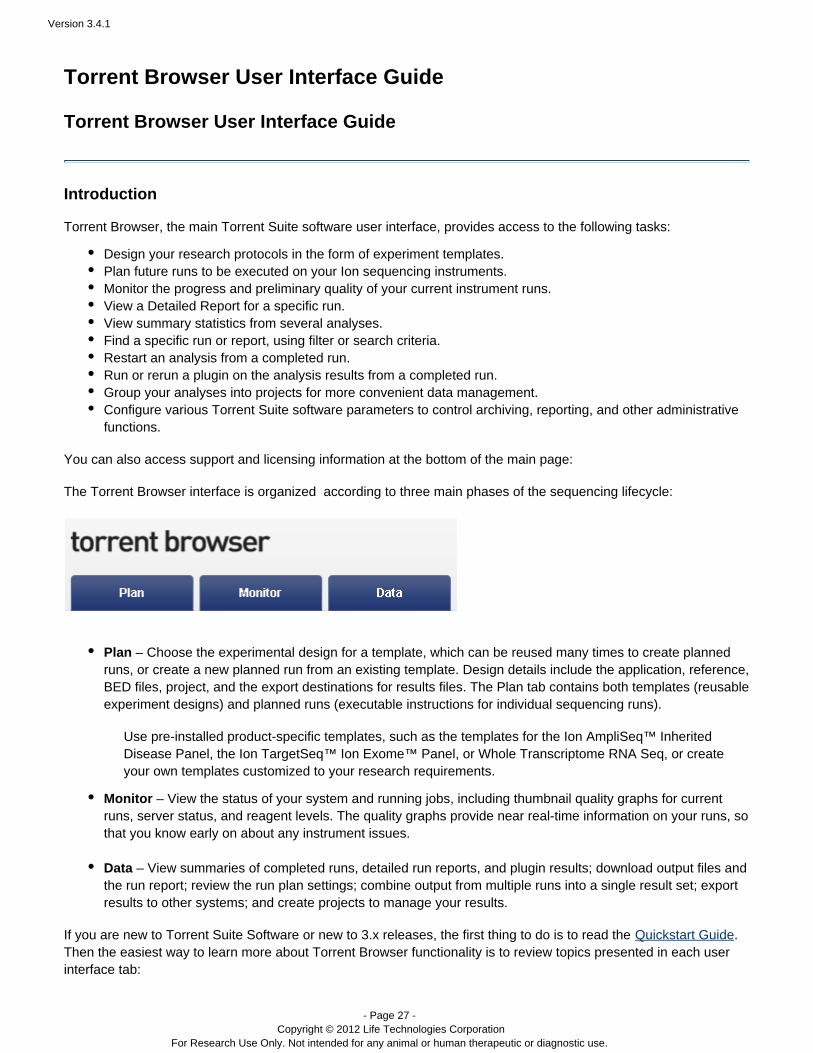
The Torrent Browser interface is organized according to three main phases of the sequencing lifecycle:
Plan – Choose the experimental design for a template, which can be reused many times to create plannedruns, or create a new planned run from an existing template. Design details include the application, reference,BED files, project, and the export destinations for results files. The Plan tab contains both templates (reusableexperiment designs) and planned runs (executable instructions for individual sequencing runs).
Use pre-installed product-specific templates, such as the templates for the Ion AmpliSeq™ InheritedDisease Panel, the Ion TargetSeq Ion Exome™ Panel, or Whole Transcriptome RNA Seq, or create™your own templates customized to your research requirements.
Monitor – View the status of your system and running jobs, including thumbnail quality graphs for currentruns, server status, and reagent levels. The quality graphs provide near real-time information on your runs, sothat you know early on about any instrument issues. Data – View summaries of completed runs, detailed run reports, and plugin results; download output files andthe run report; review the run plan settings; combine output from multiple runs into a single result set; exportresults to other systems; and create projects to manage your results.
If you are new to Torrent Suite Software or new to 3.x releases, the first thing to do is to read the .Quickstart GuideThen the easiest way to learn more about Torrent Browser functionality is to review topics presented in each userinterface tab:

Version 3.4.1
- Page 28 - Copyright © 2012 Life Technologies Corporation
For Research Use Only. Not intended for any animal or human therapeutic or diagnostic use.
The Plan TabThe Monitor TabThe Data Tab
Contents
Torrent Browser User Interface Guide
The Login Page
The Plan Tab
Templates
Planned Runs
Template and Planned Run Wizard
Create Multiple Run Plans
Create a Template from AmpliSeq Designer
The Monitor Tab
The Data Tab
Completed Runs and Reports Tab
Work with Completed Runs
The Projects Tab
The Projects Listing Page
Project Result Sets Page
CSV Metric File Format
The Admin Menu
Login Page
Torrent Browser User Interface Guide
The Torrent Browser Login Page
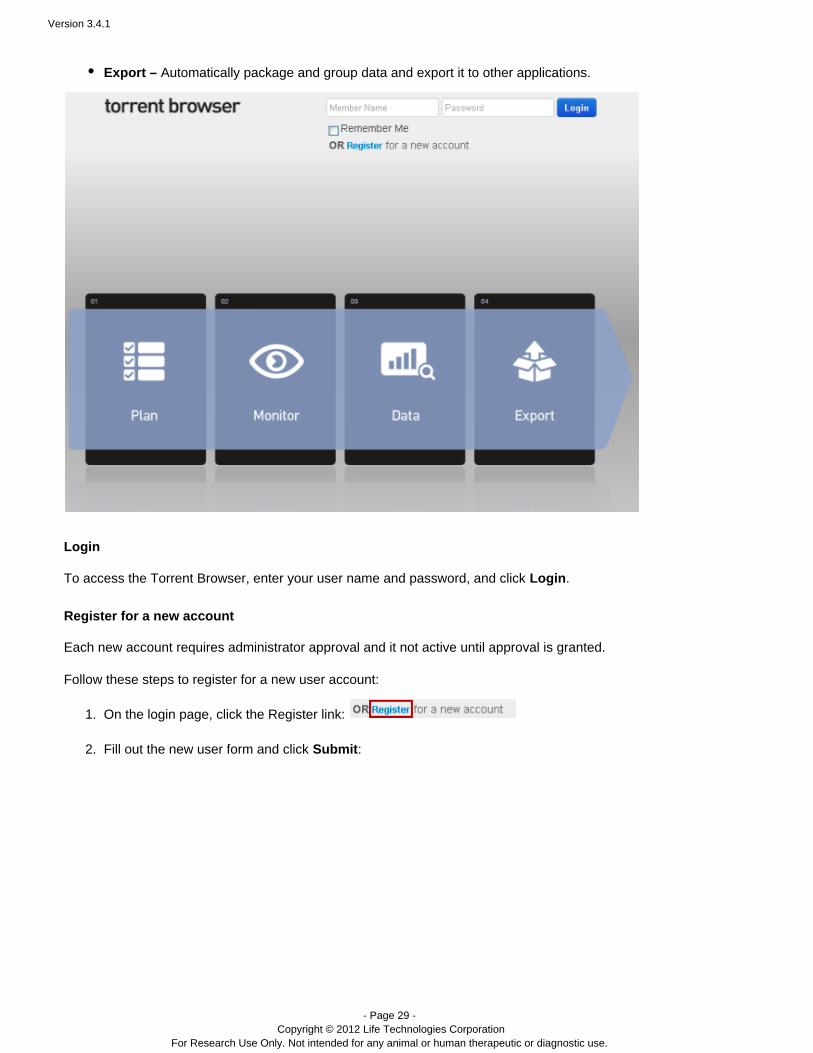
The login page shows the main phases of your use of the Torrent Browser:
Plan – Create new run templates and plan sequencing instrument runs. You can use Ion torrent templates orcreate new uses that match your own protocols.
Monitor – View the progress of the sequencing instrument in real time and assess the run metrics as theyare gathered.
Data – Search and review across all of your runs and drill down to see your data in the run report. View yourrun results grouped into projects.
Version 3.4.1
- Page 29 - Copyright © 2012 Life Technologies Corporation
For Research Use Only. Not intended for any animal or human therapeutic or diagnostic use.
1.
2.
Export – Automatically package and group data and export it to other applications.
Login
To access the Torrent Browser, enter your user name and password, and click .Login
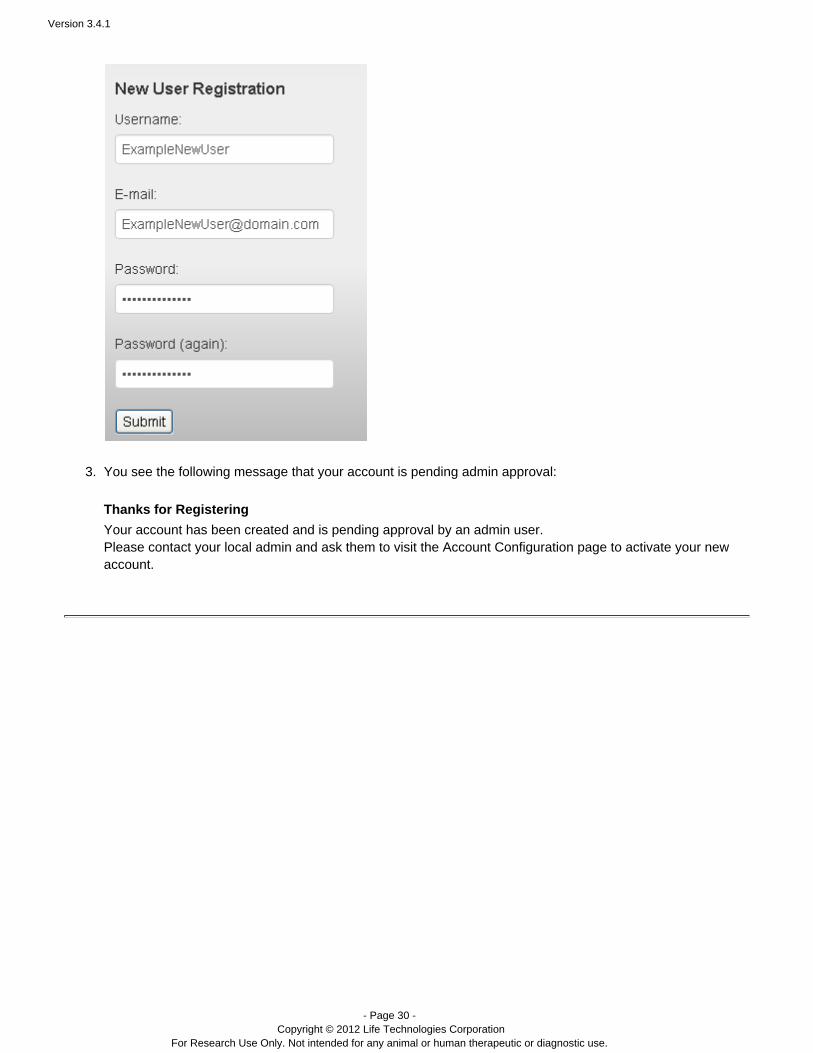
Register for a new account
Each new account requires administrator approval and it not active until approval is granted.
Follow these steps to register for a new user account:
On the login page, click the Register link:
Fill out the new user form and click :Submit
Version 3.4.1
- Page 30 - Copyright © 2012 Life Technologies Corporation
For Research Use Only. Not intended for any animal or human therapeutic or diagnostic use.
2.
3. You see the following message that your account is pending admin approval:
Thanks for Registering
Your account has been created and is pending approval by an admin user.Please contact your local admin and ask them to visit the Account Configuration page to activate your newaccount.
Version 3.4.1
- Page 31 - Copyright © 2012 Life Technologies Corporation
For Research Use Only. Not intended for any animal or human therapeutic or diagnostic use.
1. 2.
3. 4. 5. 6.
Contents
Torrent Browser User Interface Guide
The Login Page
The Plan Tab
Templates
Planned Runs
Template and Planned Run Wizard
Create Multiple Run Plans
Create a Template from AmpliSeq Designer
The Monitor Tab
The Data Tab
Completed Runs and Reports Tab
Work with Completed Runs
The Projects Tab
The Projects Listing Page
Project Result Sets Page
CSV Metric File Format
The Admin Menu
Plan Tab
Torrent Browser User Interface Guide
Plan Tab
The tab gives you control over your sequencing experiments. Plan You use a plan template, in the Plan > Templateto create a digital protocol with specifications for almost your entire experiment, from sample preparationtab,
through sequencing, data analysis, and data export to other systems for additional analysis. From the template, youcreate one or more planned runs, which execute directly on your Ion PGM or Ion Proton sequencing instrument.™ ™
These steps describe how templates and planned runs fit into your Ion PGM™ or Ion Proton™ sequencingworkflow:
Your decide on your sequencing application and sequencing product (such as an Ion AmpliSeq™ panel).You select a pre-installed template with defaults for your application and sequencing product, or you createyour own template from scratch. You customize your template.You copy the template to a new planned run, adding the name of the tissue sample to be sequenced. The Torrent Browser assigns your new planned a run code. You enter the run code directly on the Ion sequencing instrument to initiate the sequencing. The planned run automates the process from sequencing through data analysis and data handling.
Version 3.4.1
- Page 32 - Copyright © 2012 Life Technologies Corporation
For Research Use Only. Not intended for any animal or human therapeutic or diagnostic use.
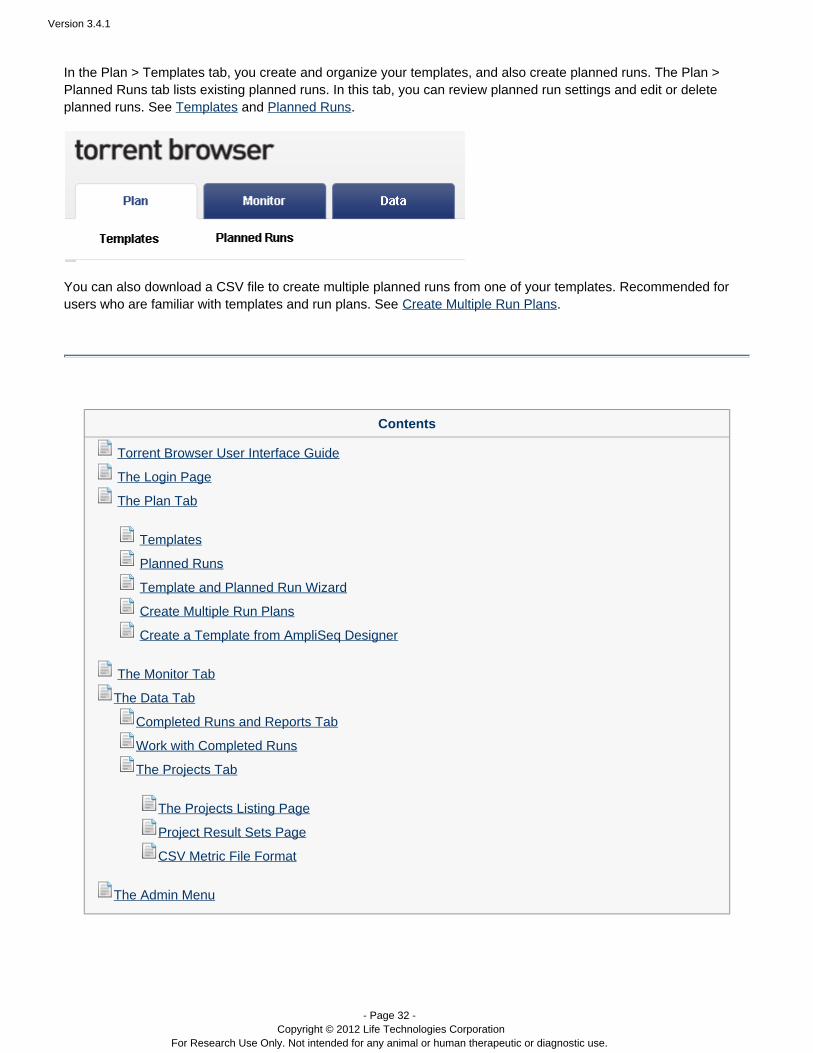
In the Plan > Templates tab, you create and organize your templates, and also create planned runs. The Plan >Planned Runs tab lists existing planned runs. In this tab, you can review planned run settings and edit or deleteplanned runs. See Templates and Planned Runs.
You can also download a CSV file to create multiple planned runs from one of your templates. Recommended forusers who are familiar with templates and run plans. See .Create Multiple Run Plans
Contents
Torrent Browser User Interface Guide
The Login Page
The Plan Tab
Templates
Planned Runs
Template and Planned Run Wizard
Create Multiple Run Plans
Create a Template from AmpliSeq Designer
The Monitor Tab
The Data Tab
Completed Runs and Reports Tab
Work with Completed Runs
The Projects Tab
The Projects Listing Page
Project Result Sets Page
CSV Metric File Format
The Admin Menu

Version 3.4.1
- Page 33 - Copyright © 2012 Life Technologies Corporation
For Research Use Only. Not intended for any animal or human therapeutic or diagnostic use.
1. 2.
3. 4. 5. 6.
Templates
Torrent Browser User Interface Guide
Templates
The following describe a template:
A canned set of instructions for both your sequencing run and your post-sequencing data analysis.A digital protocol with specifications for almost your entire experiment, from sample preparation throughsequencing, data analysis, and data export to other systems for additional analysis. (A plan template ismissing only the sample name, from your experiment information.)A sample planned run that you can copy to quickly create actual planned runs with known defaults andsettings.A reusable set of laboratory, sequencing, data analysis, and data management instructions.
These steps describe how a plan template fits into your Ion PGM or Ion Proton sequencing workflow:™ ™
Your decide on your sequencing application and sequencing product (such as an Ion AmpliSeq panel).™You select a pre-installed template with defaults for your application and sequencing product, or you createyour own template from scratch. You customize your template.You copy the template to a new planned run, adding the name of the tissue sample to be sequenced. The Torrent Browser assigns your new plan a run code. You enter the run code directly on the Ion sequencing instrument to initiate the sequencing. The planned run automates the process from sequencing through data analysis and data handling.
You use a template to create multiple repeatable planned runs on demand. With the planned run wizard, you cancreate a new planned run with only a few clicks and the entry of the sample name. With the Plan Multiple feature,you download a CSV and customize it to create multiple planned runs without using the planned run wizard. (See Pl
.)an Multiple
Plan templates play an important role in enabling rapid throughput across your sequencing instrument. Templatesalso help reduce the chance of error, by listing the reagent kits used on the instrument.
The Plan tab > Templates page contains your experiment templates. These include pre-installed product templates(for instance for products such as the ) and as well as templates that you create, andIon AmpliSeq™ Cancer Panelareas for recently-used templates and ones you mark as favorites. Product templates contain the appropriatedefaults for a product, including the default kits, BED files, and reference.
OverviewTypical usePlan > Template page organizationWizardOverrides
ExamplesExample templateExample application group
Template wizard powerApplication type and run typeKits
Version 3.4.1
- Page 34 - Copyright © 2012 Life Technologies Corporation
For Research Use Only. Not intended for any animal or human therapeutic or diagnostic use.
Monitoring metricsReferences and regions filesPluginsProjectsExportSample name and run name
The template wizardCreate your own templatePlan Multiple
ow do I H execute on the sequencing instrument?What is the point?
Where are we?
Overview
Typical use
Typically you copy a product template and customize the new template with your choices for project organizationand data export handling. Then you reuse your new template to create many planned runs, as needed. Each runplan has the correct settings (from the original template). Or you can edit your template when experimental or datahandling changes are required.
A planned run both executes on your Ion sequencing instrument and also automates your decisions forpost-sequencing data analysis and data management.
Plan > Template page organization
Templates are organized by sequencing application (and by product for some applications):
AmpliSeq DNA and RNA – Ion AmpliSeq™ applications, including the Ion AmpliSeq™ ComprehensiveCancer Panel and Custom Ion AmpliSeq™ panels.TargetSeq – Ion TargetSeq products and other targeted resequencing applications, with parameters™optimized for hybridization-based target enrichment.Whole-Genome Seq – Whole genome sequencing applications, which do not assume enrichment and do notrequire a target regions file.RNA Seq – RNA sequencing applications.Generic Sequencing – Your own applications that do not fit in the other categories. With a generic sequenci
template, you provide the settings for the experiment. Your choices are not restricted based on the logic ofng an application workflow, and it is theoretically possible to create a flawed template.
The template page also has groups for recently-used templates and for templates that you mark as your favorites.
You can also create a template from your AmpliSeq Designer run. See Create a Template from AmpliSeq Designer.
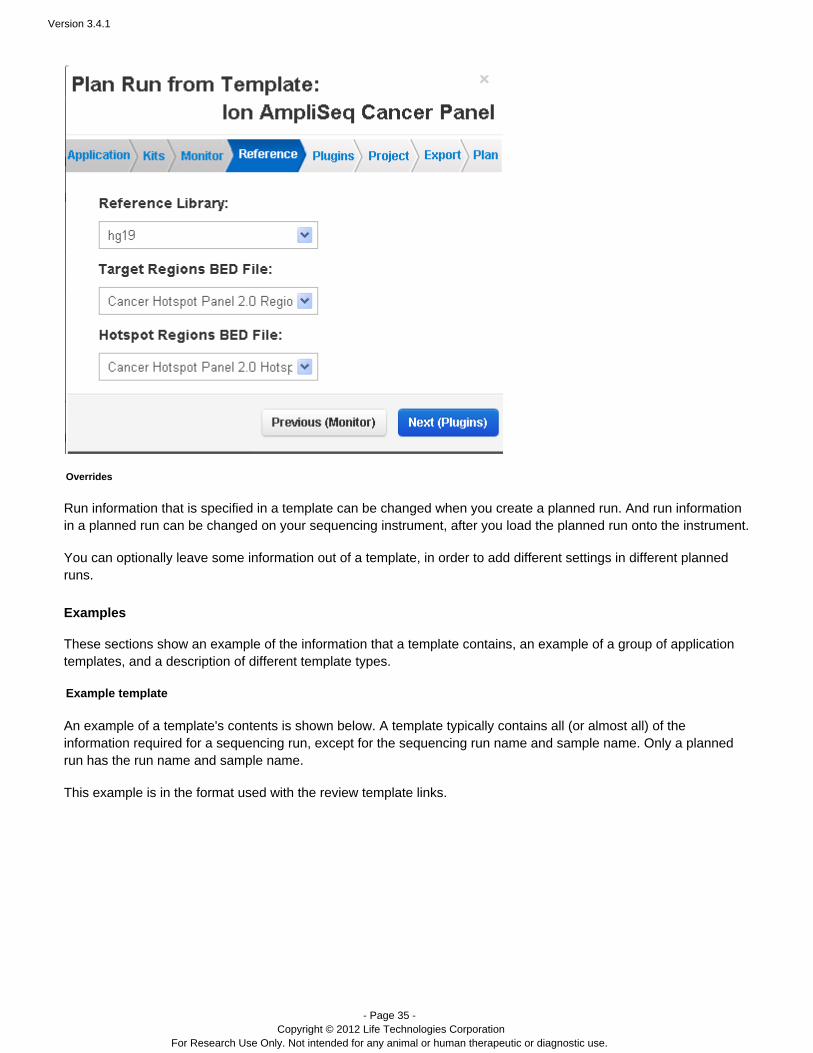
Wizard
When you create a new template or a planned run (from a template), the template wizard walks you through eachaspect of your new template or planned run, using pre-populated defaults based on the application template orproduct template you choose. The example below shows the defaults in the reference selections page. The eightchevrons across the top show the different pages of the wizard.
Version 3.4.1
- Page 35 - Copyright © 2012 Life Technologies Corporation
For Research Use Only. Not intended for any animal or human therapeutic or diagnostic use.
Overrides
Run information that is specified in a template can be changed when you create a planned run. And run informationin a planned run can be changed on your sequencing instrument, after you load the planned run onto the instrument.
You can optionally leave some information out of a template, in order to add different settings in different plannedruns.
Examples
These sections show an example of the information that a template contains, an example of a group of applicationtemplates, and a description of different template types.
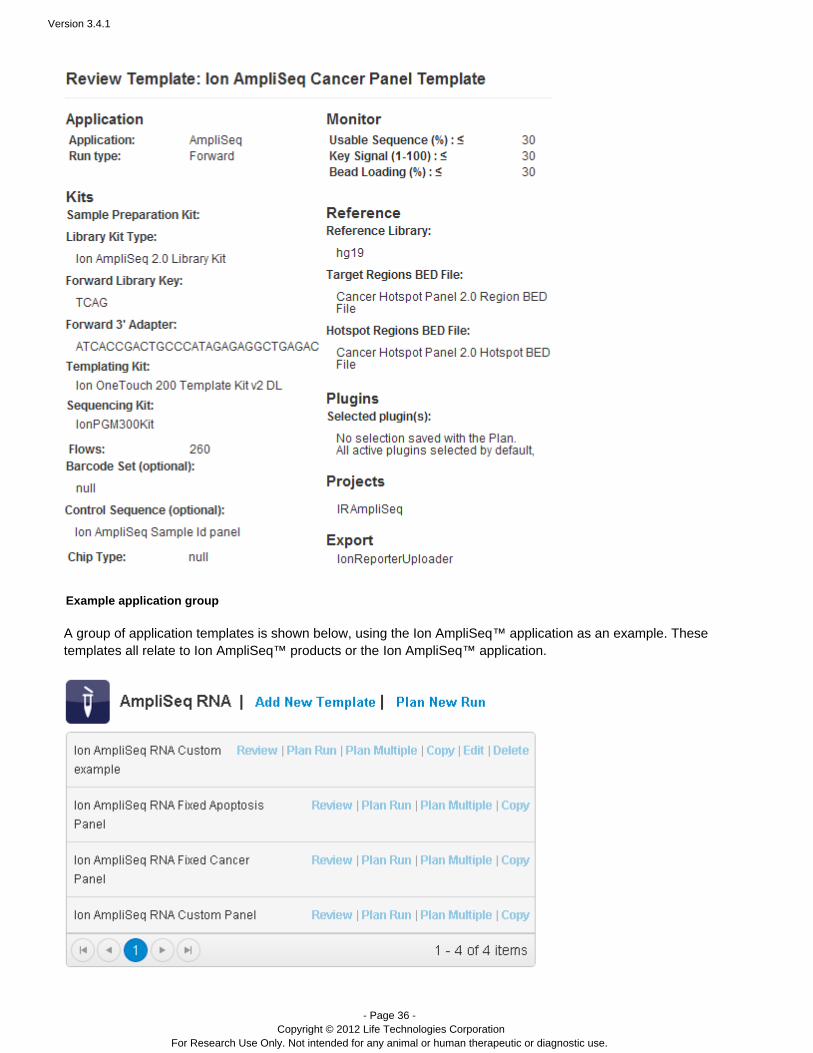
Example template
An example of a template's contents is shown below. A template typically contains all (or almost all) of theinformation required for a sequencing run, except for the sequencing run name and sample name. Only a plannedrun has the run name and sample name.
This example is in the format used with the review template links.
Version 3.4.1
- Page 36 - Copyright © 2012 Life Technologies Corporation
For Research Use Only. Not intended for any animal or human therapeutic or diagnostic use.
Example application group
A group of application templates is shown below, using the Ion AmpliSeq application as an . These™ exampletemplates all relate to Ion AmpliSeq™ products or the application.Ion AmpliSeq™
Version 3.4.1
- Page 37 - Copyright © 2012 Life Technologies Corporation
For Research Use Only. Not intended for any animal or human therapeutic or diagnostic use.
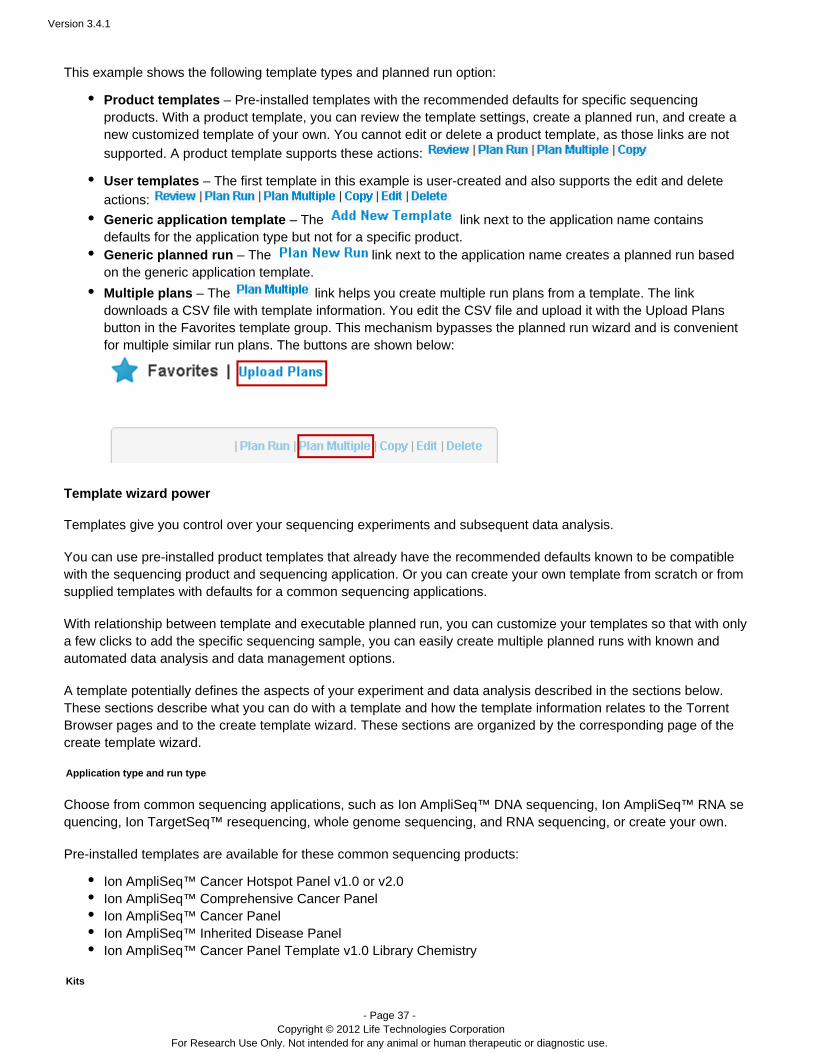
This example shows the following template types and planned run option:
Product templates – Pre-installed templates with the recommended defaults for specific sequencingproducts. With a product template, you can review the template settings, create a planned run, and create anew customized template of your own. You cannot edit or delete a product template, as those links are notsupported. A product template supports these actions:
User templates – The first template in this example is user-created and also supports the edit and deleteactions:
Generic application template – The link next to the application name containsdefaults for the application type but not for a specific product.Generic planned run – The link next to the application name creates a planned run basedon the generic application template.
Multiple plans – The link helps you create multiple run plans from a template. The linkdownloads a CSV file with template information. You edit the CSV file and upload it with the Upload Plansbutton in the Favorites template group. This mechanism bypasses the planned run wizard and is convenientfor multiple similar run plans. The buttons are shown below:
Template wizard power
Templates give you control over your sequencing experiments and subsequent data analysis.
You can use pre-installed product templates that already have the recommended defaults known to be compatiblewith the sequencing product and application. Or you can create your own template from scratch or fromsequencing supplied templates with defaults for a common sequencing applications.
With relationship between template and executable planned run, you can customize your templates so that with onlya few clicks to add the specific sequencing sample, you can easily create multiple planned runs with known andautomated data analysis and data management options.
A template potentially defines the aspects of your experiment and data analysis described in the sections below.These sections describe what you can do with a template and how the template information relates to the TorrentBrowser pages and to the create template wizard. are organized by the corresponding page of theThese sections create template wizard.
Application type and run type
Choose from common sequencing applications, such as Ion AmpliSeq™ DNA sequencing, Ion AmpliSeq™ RNA seor create your own.Ion TargetSeq resequencing, whole genome quencing, ™ sequencing, and RNA sequencing,
Pre-installed templates are available for these common sequencing products:
Ion AmpliSeq Cancer Hotspot Panel v1.0 or v2.0™Ion AmpliSeq Comprehensive Cancer Panel™Ion AmpliSeq™ Cancer PanelIon AmpliSeq™ Inherited Disease PanelIon AmpliSeq Cancer Panel Template v1.0 Library Chemistry™
Kits
Version 3.4.1
- Page 38 - Copyright © 2012 Life Technologies Corporation
For Research Use Only. Not intended for any animal or human therapeutic or diagnostic use.
A template can contain the following information about laboratory kits and other sequencing parameters:
( ) Optional Sample preparation kitLibrary kit type, including also the forward library key and the forward 3' adapterTemplating kit typeSequence kitNumber of flows(Optional) Barcode set(Optional) Control sequence(Optional) Chip type
Note: The value entered for number of flows represents the maximum possible for a run using a planned run basedon this template. Instrument conditions such as the availability of consumables might cause fewer flows to becompleted.
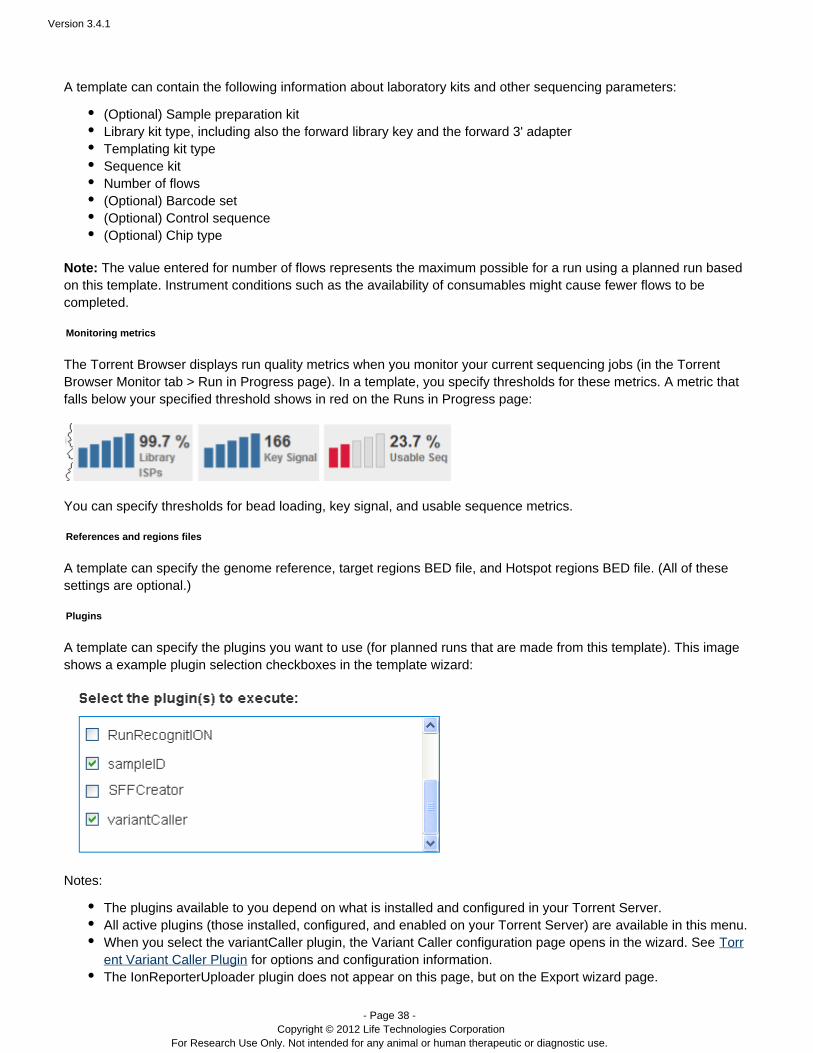
Monitoring metrics
The Torrent Browser displays run quality metrics when you monitor your current sequencing jobs (in the TorrentBrowser Monitor tab > Run in Progress page). In a template, you specify thresholds for these metrics. A metric thatfalls below your specified threshold shows in red on the Runs in Progress page:
You can specify thresholds for bead loading, key signal, and usable sequence metrics.
References and regions files
A template can specify the genome reference, target regions BED file, and Hotspot regions BED file. (All of thesesettings are optional.)
Plugins
A template can specify the plugins you want to use (for planned runs that are made from this template). This imageshows a example plugin selection checkboxes in the template wizard:
Notes:
The plugins available to you depend on what is installed and configured in your Torrent Server.All active plugins (those installed, configured, and enabled on your Torrent Server) are available in this menu.When you select the variantCaller plugin, the Variant Caller configuration page opens in the wizard. See Torr
for options and configuration information.ent Variant Caller PluginThe IonReporterUploader plugin does not appear on this page, but on the Export wizard page.
Version 3.4.1
- Page 39 - Copyright © 2012 Life Technologies Corporation
For Research Use Only. Not intended for any animal or human therapeutic or diagnostic use.
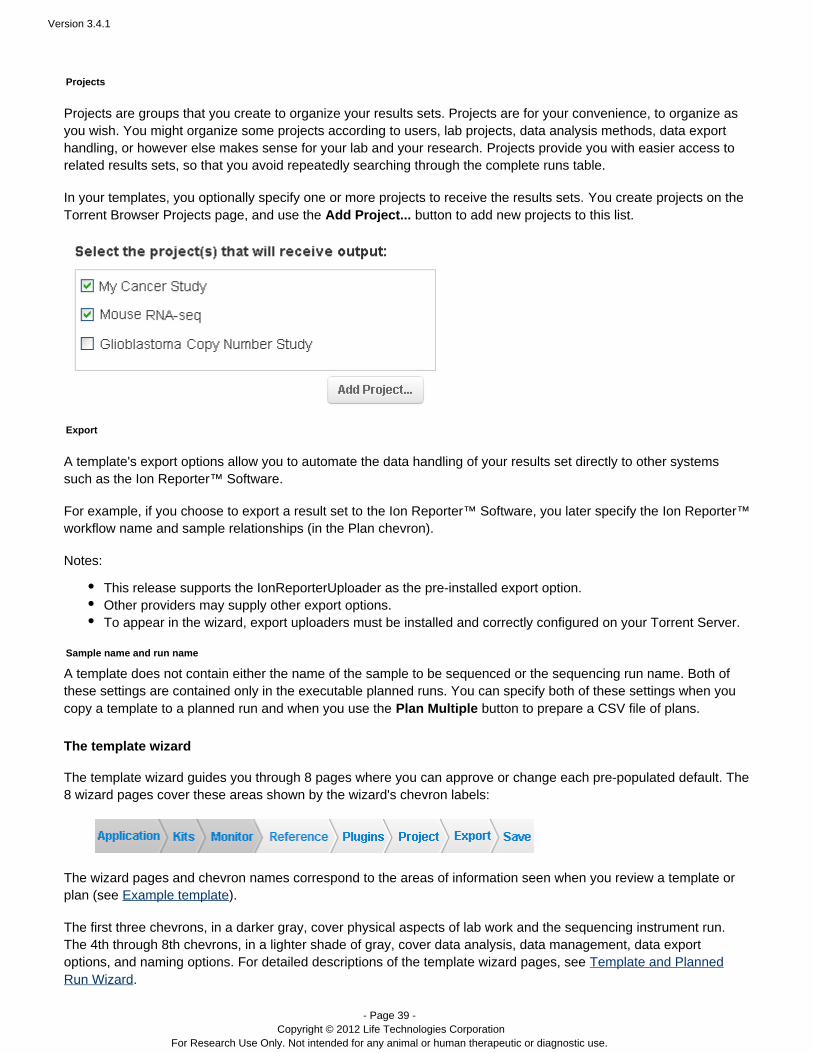
Projects
Projects are groups that you create to organize your results sets. Projects are for your convenience, to organize asyou wish. You might organize some projects according to users, lab projects, data analysis methods, data export
Projects provide you with easier access tohandling, or however else makes sense for your lab and your research. related results sets, so that you avoid repeatedly searching through the complete runs table.
In your templates, you optionally specify one or more projects to receive the results sets. You create projects on theTorrent Browser Projects page, and use the button to add new projects to this list.Add Project...
Export
A template's export options allow you to automate the data handling of your results set directly to other systemssuch as the Ion Reporter Software.™
For example, if you choose to export a result set to the Ion Reporter™ Software, you later specify the Ion Reporter™workflow name and sample relationships (in the Plan chevron).
Notes:
This release supports the IonReporterUploader as the pre-installed export option.Other providers may supply other export options.To appear in the wizard, export uploaders must be installed and correctly configured on your Torrent Server.
Sample name and run name
A template does not contain either the name of the sample to be sequenced or the sequencing run name. Both ofthese settings are contained only in the executable planned runs. You can specify both of these settings when youcopy a template to a planned run and when you use the button to prepare a CSV file of plans.Plan Multiple
The template wizard
The template wizard guides you through 8 pages where you can approve or change each pre-populated default. The8 wizard pages cover these areas shown by the wizard's chevron labels:
The wizard pages and chevron names correspond to the areas of information seen when you review a template orplan (see Example template).
The first three chevrons, in a darker gray, cover physical aspects of lab work and the sequencing instrument run.The 4th through 8th chevrons, in a lighter shade of gray, cover data analysis, data management, data exportoptions, and naming options. For detailed descriptions of the template wizard pages, see Template and Planned
.Run Wizard
Version 3.4.1
- Page 40 - Copyright © 2012 Life Technologies Corporation
For Research Use Only. Not intended for any animal or human therapeutic or diagnostic use.
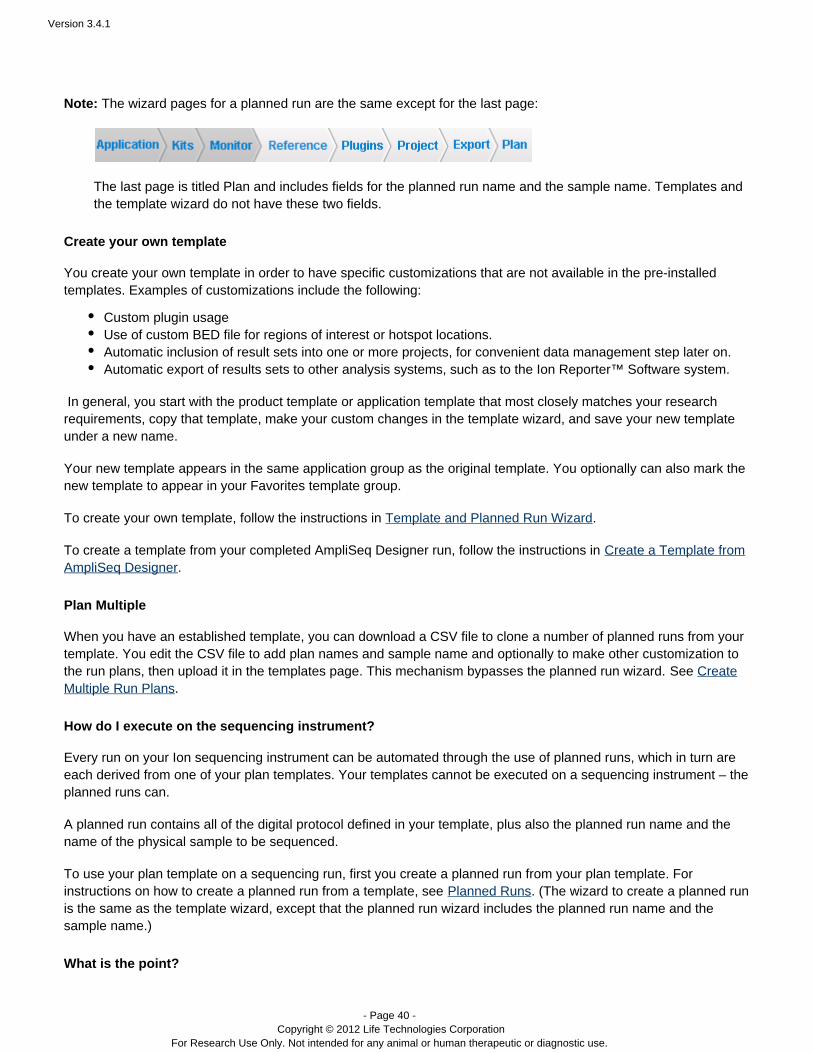
Note: The wizard pages for a planned run are the same except for the last page:
The last page is titled Plan and includes fields for the planned run name and the sample name. Templates andthe template wizard do not have these two fields.
Create your own template
You create your own template in order to have specific customizations that are not available in the pre-installedtemplates. Examples of customizations include the following:
Custom plugin usageUse of custom BED file for regions of interest or hotspot locations.Automatic inclusion of result sets into one or more projects, for convenient data management step later on.Automatic export of results sets to other analysis systems, such as to the Ion Reporter™ Software system.
In general, you start with the product template or application template that most closely matches your researchrequirements, copy that template, make your custom changes in the template wizard, and save your new templateunder a new name.
Your new template appears in the same application group as the original template. You optionally can also mark thenew template to appear in your Favorites template group.
To ollow the instructions in . create your own template, f Template and Planned Run Wizard
To create a template from your completed AmpliSeq Designer run, follow the instructions in Create a Template from.AmpliSeq Designer
Plan Multiple
When you have an established template, you can download a CSV file to clone a number of planned runs from yourtemplate. You edit the CSV file to add plan names and sample name and optionally to make other customization tothe run plans, then upload it in the templates page. This mechanism bypasses the planned run wizard. See Create
.Multiple Run Plans
How do I execute on the sequencing instrument?
Every run on your Ion sequencing instrument can be automated through the use of planned runs, which in turn areeach derived from one of your plan templates. Your templates cannot be executed on a sequencing instrument – theplanned runs can.
A planned run contains all of the digital protocol defined in your template, plus also the planned run name and thename of the physical sample to be sequenced.
To use your plan template on a sequencing run, first you create a planned run from your plan template. Forinstructions on how to create a planned run from a template, see . (The wizard to create a planned runPlanned Runsis the same as the template wizard, except that the planned run wizard includes the planned run name and thesample name.)
What is the point?

Version 3.4.1
- Page 41 - Copyright © 2012 Life Technologies Corporation
For Research Use Only. Not intended for any animal or human therapeutic or diagnostic use.
The main points of the Plan > Templates page:
A template is a reusable digital protocol for your sequencing experiments. You use a template to create a planned run that both executes on your sequencing instrument and automatesyour decisions for post-instrument data analysis and data management.The Torrent Suite Software provides pre-installed plan templates with the correct defaults for Ion sequencingproducts and also for sequencing applications. You can use the pre-installed product templates or customizeyour own templates.A planned run contains the template's protocol, plus the experiment run name and sample name (that youadd in the planned run).To create planned runs, you use the Plan Run link to open planned run wizard for a single run plan, or usethe Plan Multiple link to bypass the wizard.
Where are we?
The page is used during the phase in bold:Plan > Templates
Application, product > > planned run > instrument run > monitor > results > run report > other datatemplateanalysis and data management
Contents
Torrent Browser User Interface Guide
The Login Page
The Plan Tab
Templates
Planned Runs
Template and Planned Run Wizard
Create Multiple Run Plans
Create a Template from AmpliSeq Designer
The Monitor Tab
The Data Tab
Completed Runs and Reports Tab
Work with Completed Runs
The Projects Tab
The Projects Listing Page
Project Result Sets Page
CSV Metric File Format
The Admin Menu
Version 3.4.1
- Page 42 - Copyright © 2012 Life Technologies Corporation
For Research Use Only. Not intended for any animal or human therapeutic or diagnostic use.
Planned Runs
Torrent Browser User Interface Guide
Planned Runs
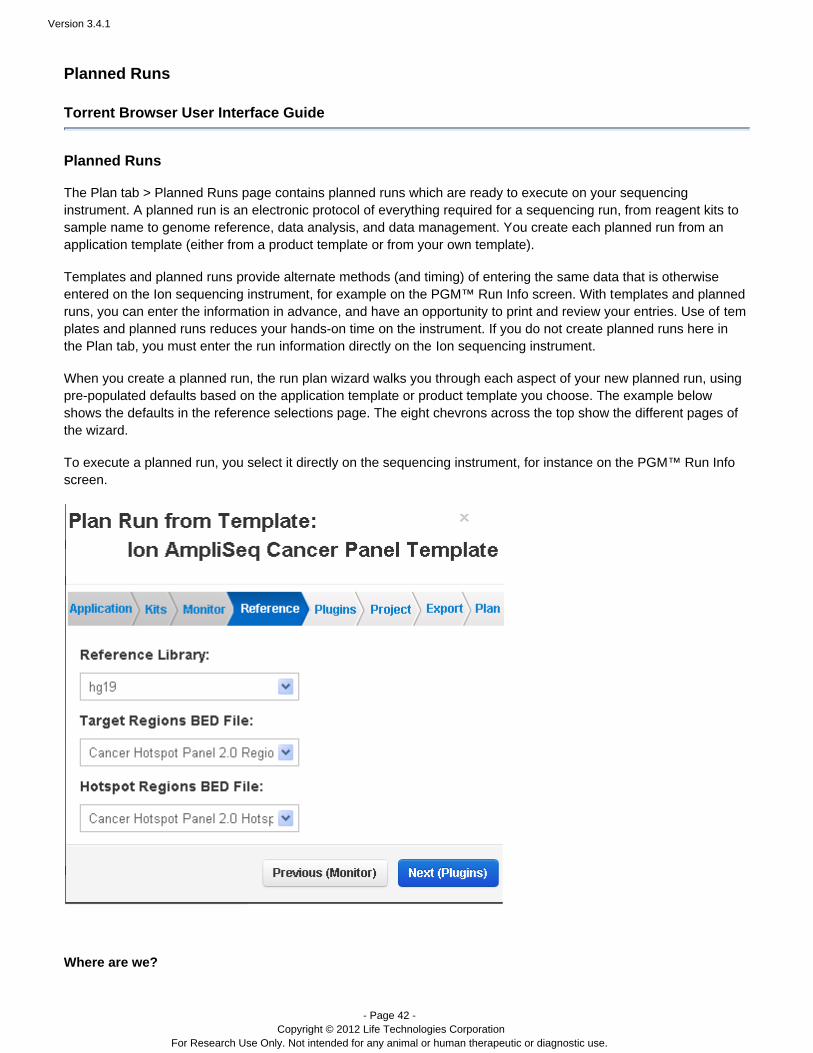
The Plan tab > Planned Runs page contains planned runs which are ready to execute on your sequencinginstrument. A planned run is an electronic protocol of everything required for a sequencing run, from reagent kits tosample name to genome reference, data analysis, and data management. You create each planned run from anapplication template (either from a product template or from your own template).
Templates and planned runs provide alternate methods (and timing) of entering the same data that is otherwiseentered on the Ion sequencing instrument, for example on the PGM™ Run Info screen. With templates and plannedruns, you can enter the information in advance, and have an opportunity to print and review your entries. Use of templates and planned runs reduces your hands-on time on the instrument. If you do not create planned runs here inthe Plan tab, you must enter the run information directly on the .Ion sequencing instrument
When you create a planned run, the run plan wizard walks you through each aspect of your new planned run, usingpre-populated defaults based on the application template or product template you choose. The example belowshows the defaults in the reference selections page. The eight chevrons across the top show the different pages ofthe wizard.
To execute a planned run, you select it directly on the sequencing instrument, for instance on the PGM™ Run Infoscreen.
Where are we?

Version 3.4.1
- Page 43 - Copyright © 2012 Life Technologies Corporation
For Research Use Only. Not intended for any animal or human therapeutic or diagnostic use.
This page describes steps involved with the highlighted phase of your sequencing workflow:
Application or product > template > > instrument run > monitor > results > run report > export,planned rundata analysis, data management
Run planning workflowCreate a run planExecute a run plan on your sequencer
Example Planned Runs page
The following is an example of a Planned Runs page with several planned runs.
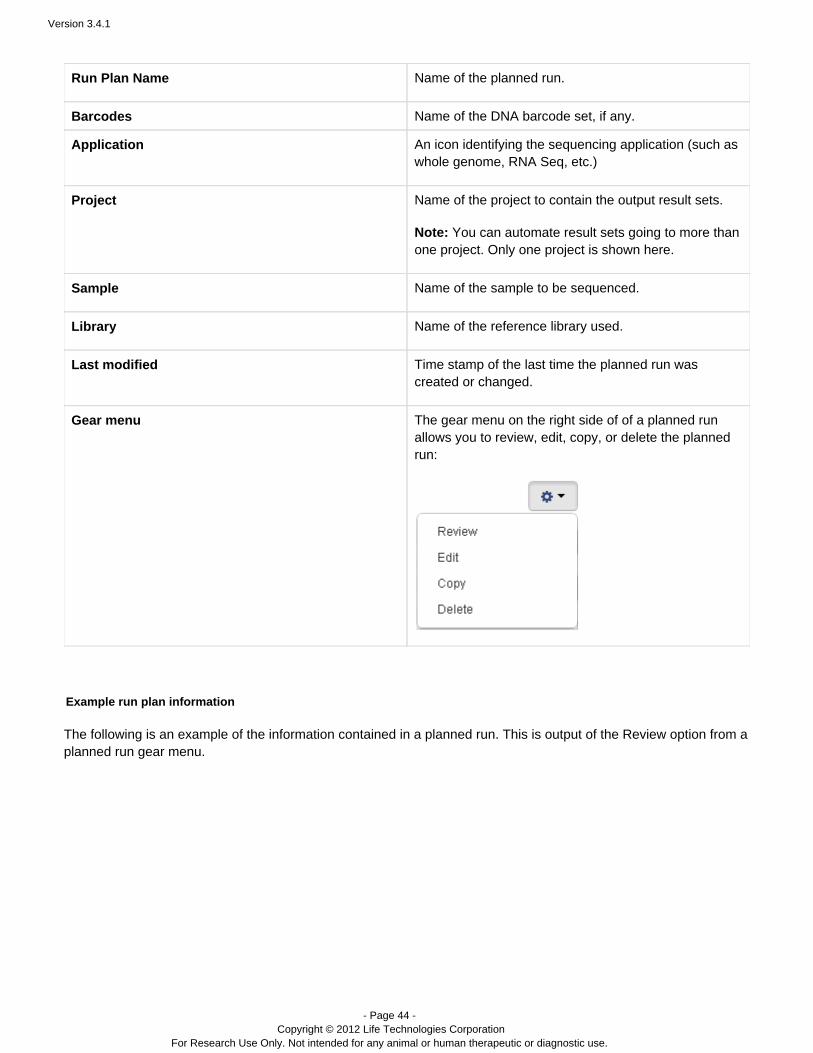
The following table describes the Planned Runs page contents.
Column heading Description
Run Code A short code identifying the planned run.
Version 3.4.1
- Page 44 - Copyright © 2012 Life Technologies Corporation
For Research Use Only. Not intended for any animal or human therapeutic or diagnostic use.
Run Plan Name Name of the planned run.
Barcodes Name of the DNA barcode set, if any.
Application An icon identifying the sequencing application (such aswhole genome, RNA Seq, etc.)
Project Name of the project to contain the output result sets.
Note: You can automate result sets going to more thanone project. Only one project is shown here.
Sample Name of the sample to be sequenced.
Library Name of the reference library used.
Last modified Time stamp of the last time the planned run wascreated or changed.
Gear menu The gear menu on the right side of of a planned runallows you to review, edit, copy, or delete the plannedrun:
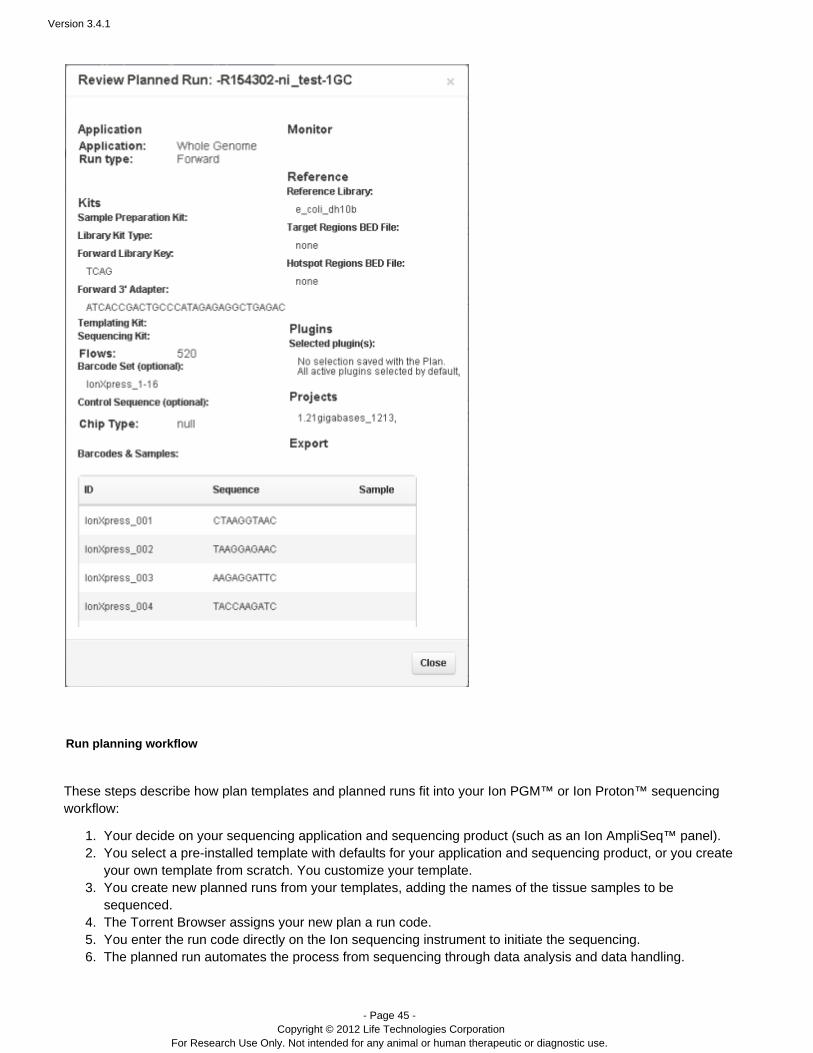
Example run plan information
The following is an example of the information contained in a planned run. This is output of the Review option from aplanned run gear menu.
Version 3.4.1
- Page 45 - Copyright © 2012 Life Technologies Corporation
For Research Use Only. Not intended for any animal or human therapeutic or diagnostic use.
1. 2.
3.
4. 5. 6.
Run planning workflow
These steps describe how plan templates and planned runs fit into your Ion PGM™ or Ion Proton™ sequencingworkflow:
Your decide on your sequencing application and sequencing product (such as an Ion AmpliSeq™ panel).You select a pre-installed template with defaults for your application and sequencing product, or you createyour own template from scratch. You customize your template.You create new planned runs from your templates, adding the names of the tissue samples to besequenced. The Torrent Browser assigns your new plan a run code. You enter the run code directly on the Ion sequencing instrument to initiate the sequencing. The planned run automates the process from sequencing through data analysis and data handling.
Version 3.4.1
- Page 46 - Copyright © 2012 Life Technologies Corporation
For Research Use Only. Not intended for any animal or human therapeutic or diagnostic use.
1. 2.
3. a.
b.
4.
5.
Plan templates and planned runs allow you to enter run information via the Torrent Browser rather than directly onthe Ion sequencer. The use of templates and planned runs reduces the chance of error and wasted runs, reducessetup time on the sequencing instrument, and increases instrument throughput.
On the Ion Torrent sequencer, information for a planned run is applied to the current Run Info screen by entering™the run's short code or by selecting the run from a menu of runs. You can optionallyplanned planned planned overwrite (change) planned run information directly on the Ion sequencer.
Create a run plan
To create a planned run, first you create a plan template, which can be reused over and over to create planned runswith known, optimized settings (see ). this section describes using a wizard which walks you through theTemplatessteps to create a planned run from your plan template. To instead bypass the wizard and create multiple run planswith a CSV file, see .Create Multiple Run Plans
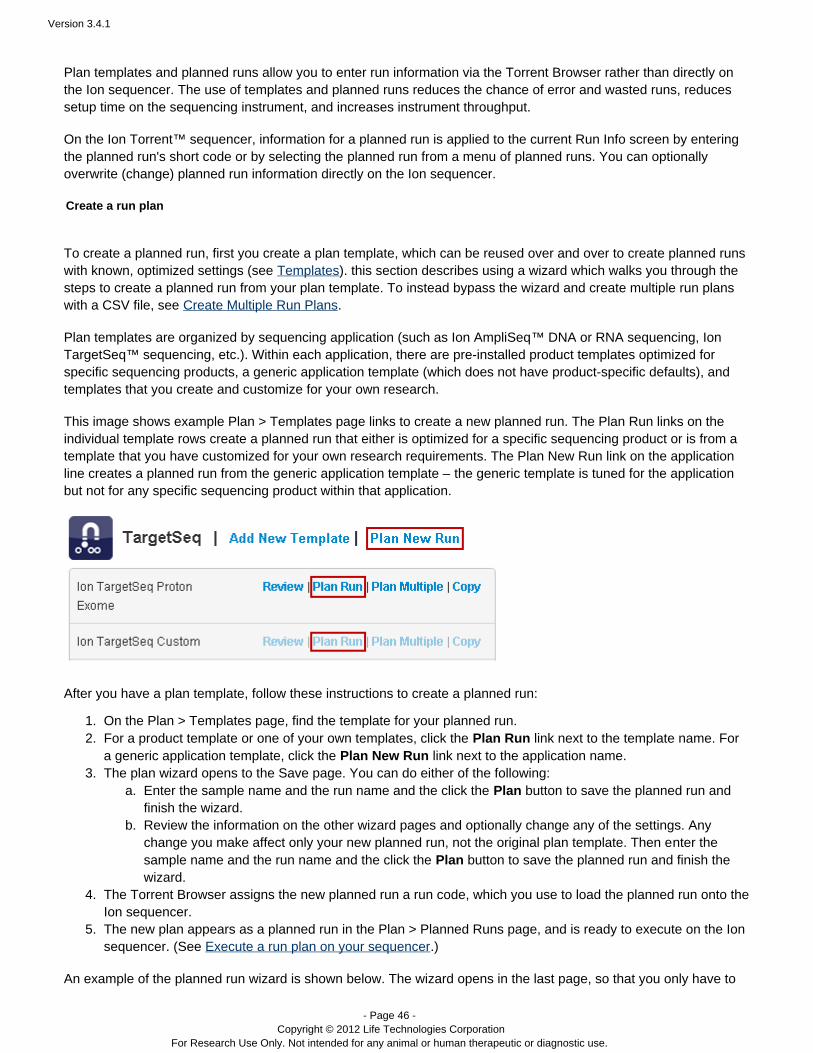
Plan templates are organized by sequencing application (such as Ion AmpliSeq DNA or RNA sequencing, ™ IonTargetSeq™ sequencing, etc.). Within each application, there are pre-installed product templates optimized forspecific sequencing products, a generic application template (which does not have product-specific defaults), andtemplates that you create and customize for your own research.
This image shows example Plan > Templates page links to create a new planned run. The Plan Run links on theindividual template rows create a planned run that either is optimized for a specific sequencing product or is from atemplate that you have customized for your own research requirements. The Plan New Run link on the applicationline creates a planned run from the generic application template – template is tuned for the applicationthe genericbut not for any specific sequencing product within that application.
After you have a ollow these instructions to create a planned run: plan template, f
On the Plan > Templates page, find the template for your planned run.For a product template or one of your own templates, click the link next to the template name. ForPlan Runa generic application template, click the link next to the application name.Plan New RunThe plan wizard opens to the Save page. You can do either of the following:
Enter the sample name and the run name and the click the button to save the planned run andPlanfinish the wizard.Review the information on the other wizard pages and optionally change any of the settings. Anychange you make affect only your new planned run, not the original plan template. Then enter thesample name and the run name and the click the Plan button to save the planned run and finish thewizard.
The Torrent Browser assigns the new planned run a run code, which you use to load the planned run onto theIon sequencer.The new plan appears as a planned run in the Plan > Planned Runs page, and is ready to execute on the Ionsequencer. (See .)Execute a run plan on your sequencer
An example of the planned run wizard is shown below. The wizard opens in the last page, so that you only have to

Version 3.4.1
- Page 47 - Copyright © 2012 Life Technologies Corporation
For Research Use Only. Not intended for any animal or human therapeutic or diagnostic use.
add the sequencing sample names and click the button to save and create your new planned run. YouPlan Runcan optionally review the run plan from this page or click the chevrons on the top of the page to visit the other wizardpages.
See for a detailed explanation of the plan wizard.Template and Planned Run Wizard
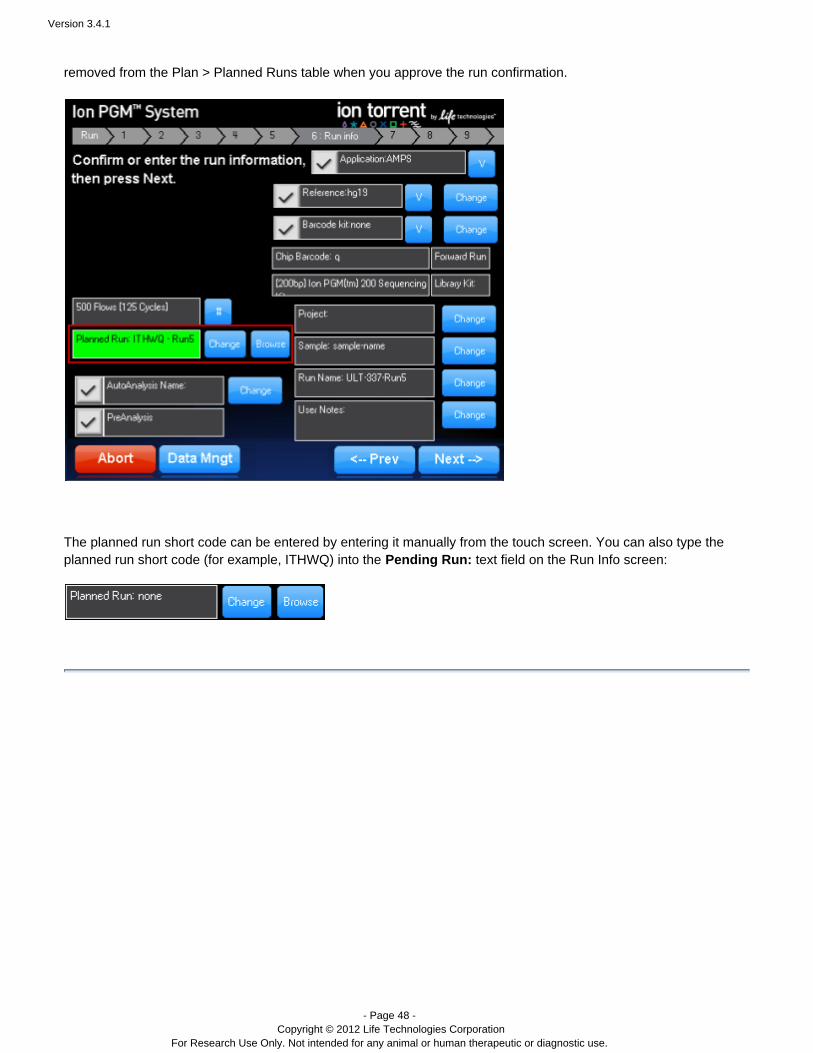
Execute a run plan on your sequencer
A planned run created on the Torrent Server is executed on the sequencer by selecting it from theIon Torrent™sequencer's Run Info screen. With the browse button you can select a run from a list of pending runsplannedpreviously created on the Torrent Server. The change button allows you to select a run via its run code. planned
The pending run information is populated into the Run Info screen. You can optionally change run information onthe Run Info screen. When ready, click to start your Ion run. Your run isNext --> Torrent sequencing™ planned
Version 3.4.1
- Page 48 - Copyright © 2012 Life Technologies Corporation
For Research Use Only. Not intended for any animal or human therapeutic or diagnostic use.
removed from the Plan > Planned Runs table when you approve the run confirmation.
The planned run short code can be entered by entering it manually from the touch screen. You can also type theplanned run short code (for example, ITHWQ) into the text field on the Run Info screen:Pending Run:
Version 3.4.1
- Page 49 - Copyright © 2012 Life Technologies Corporation
For Research Use Only. Not intended for any animal or human therapeutic or diagnostic use.
Contents
Torrent Browser User Interface Guide
The Login Page
The Plan Tab
Templates
Planned Runs
Template and Planned Run Wizard
Create Multiple Run Plans
Create a Template from AmpliSeq Designer
The Monitor Tab
The Data Tab
Completed Runs and Reports Tab
Work with Completed Runs
The Projects Tab
The Projects Listing Page
Project Result Sets Page
CSV Metric File Format
The Admin Menu
Template and Planned Run Wizard
Torrent Browser User Interface Guide
The Template and Planned Run Wizard
When you create a new template or a new planned run, a wizard guides you through the process. You can begin bycopying one of the pre-installed product templates, and then the wizard is populated with defaults that arecompatible with that product.
The same wizard supports both new templates and new planned runs.
The template wizard guides you through 8 pages where you can approve or change each pre-populated default. The8 wizard pages cover these areas shown by the wizard's chevrons:
The wizard pages and chevron names correspond to the areas of information seen when you review a template orplan (see ).Example template and planned run information
Version 3.4.1
- Page 50 - Copyright © 2012 Life Technologies Corporation
For Research Use Only. Not intended for any animal or human therapeutic or diagnostic use.
The first three chevrons, in a darker gray, cover physical aspects of lab work and the sequencing instrument run.The 4th through 8th chevrons, in a lighter shade of gray, cover data analysis, data management, data exportoptions, and naming options. You can navigate to a wizard page by clicking on its chevron.
Example template and planned run informationDifferences between templates and planned runsStart the wizardWizard pages
ApplicationKitsMonitorReferencePluginsProjectExportTemplate Save page and the planned run Plan page
Example template and planned run information
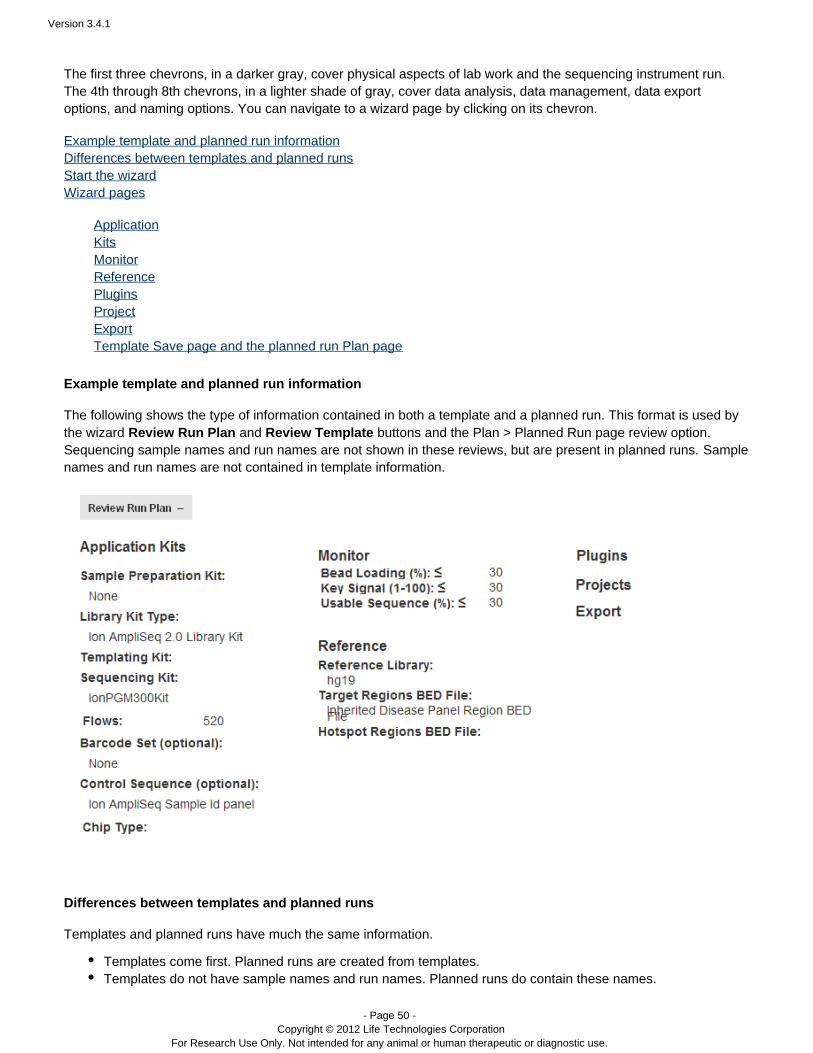
The following shows the type of information contained in both a template and a planned run. This format is used bythe wizard and buttons and the Plan > Planned Run page review option.Review Run Plan Review Template Sequencing sample names and run names are not shown in these reviews, but are present in planned runs. Samplenames and run names contained in template information.are not
Differences between templates and planned runs
Templates and planned runs have much the same information.
Templates come first. Planned runs are created from templates.Templates do not have sample names and run names. Planned runs do contain these names.
Version 3.4.1
- Page 51 - Copyright © 2012 Life Technologies Corporation
For Research Use Only. Not intended for any animal or human therapeutic or diagnostic use.
Planned runs are executable on the sequencing instrument, because they contain sample names and runnames.A template is a sample planned run. From a template, you can create many planned runs. Each resultingplanned run is already customized for your research and can quickly be created from your template – you addonly the sample name and the run name.The planned run wizard opens in the last page, so that if you accept all the template settings, all you need dois supply are the run name and sample names and save the new planned run.The last page of the wizard is different for templates and planned runs. The planned run last page requires the run name and sample names. (Templates do not contain this information.)
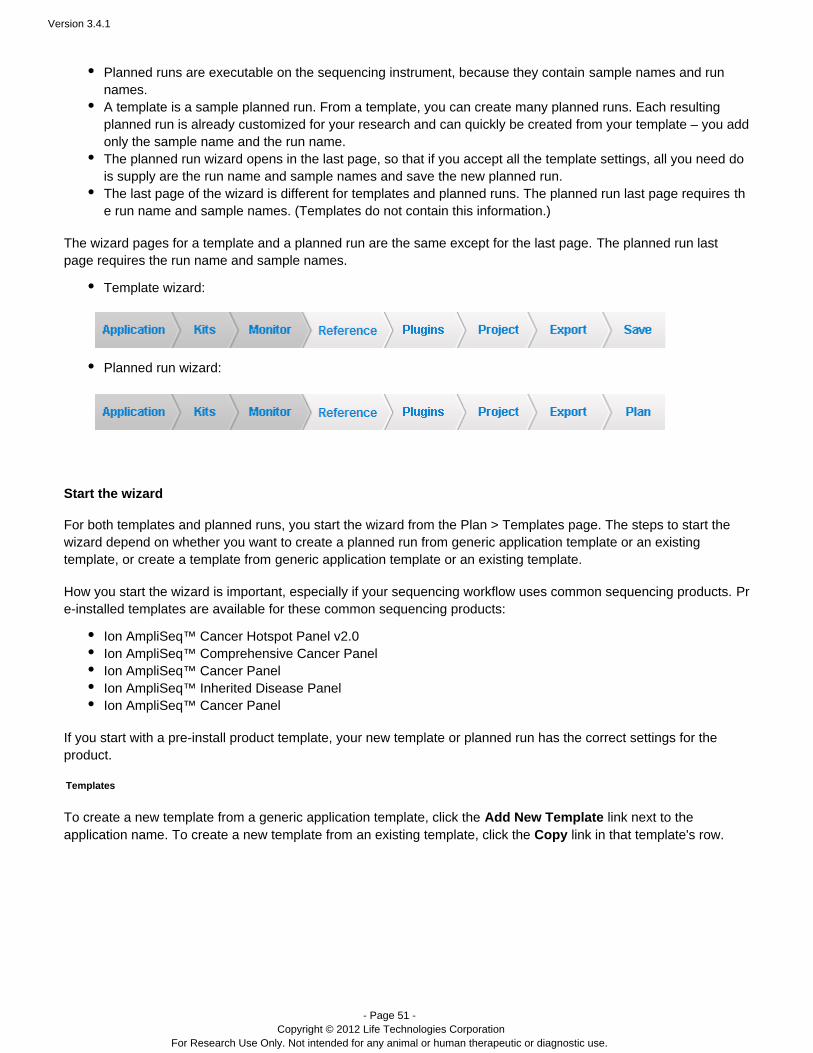
The wizard pages for a template and a planned run are the same except for the last page. The planned run lastpage requires the run name and sample names.
Template wizard:
Planned run wizard:
Start the wizard
For both templates and planned runs, you start the wizard from the Plan > Templates page. The steps to start thewizard depend on whether you want to create a planned run from generic application template or an existingtemplate, or create a template from generic application template or an existing template.
How you start the wizard is important, especially if your sequencing workflow uses common sequencing products. Pre-installed templates are available for these common sequencing products:
Ion AmpliSeq™ Cancer Hotspot Panel v2.0Ion AmpliSeq™ Comprehensive Cancer PanelIon AmpliSeq™ Cancer PanelIon AmpliSeq™ Inherited Disease PanelIon AmpliSeq™ Cancer Panel
If you start with a pre-install product template, your new template or planned run has the correct settings for theproduct.
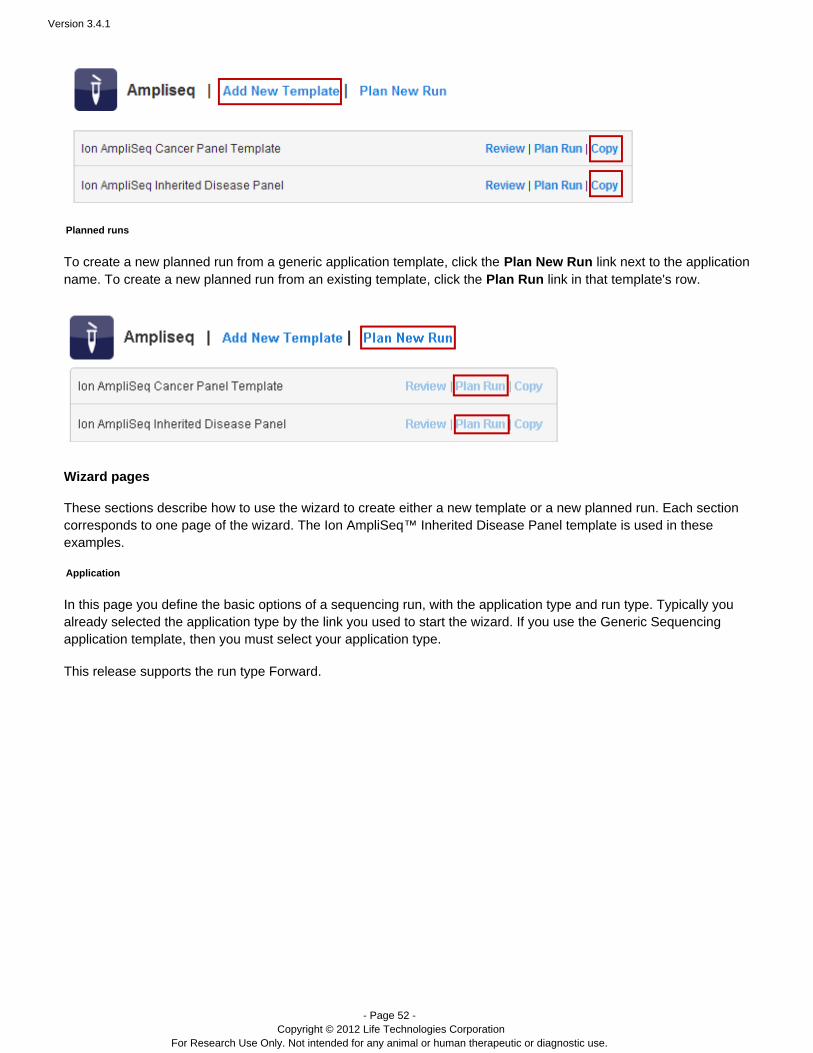
Templates
To create a new template from a generic application template, click the link next to theAdd New Templateapplication name. To create a new template from template, click the an existing Copy link in that template's row.
Version 3.4.1
- Page 52 - Copyright © 2012 Life Technologies Corporation
For Research Use Only. Not intended for any animal or human therapeutic or diagnostic use.
Planned runs
To create a new planned run from a generic application template, click the link next to the applicationPlan New Run name. To create a new from an existing template, click the link in that template's row.planned run Plan Run
Wizard pages
These sections describe how to use the wizard to create either a new template or a new planned run. Each sectioncorresponds to one page of the wizard. The Ion AmpliSeq Inherited Disease Panel template is used in these™examples.
Application
In this page you define the basic options of a sequencing run, with the application type and run type. Typically youalready selected the application type by the link you used to start the wizard. If you use the Generic Sequencingapplication template, then you must select your application type.
This release the run type Forward.supports

Version 3.4.1
- Page 53 - Copyright © 2012 Life Technologies Corporation
For Research Use Only. Not intended for any animal or human therapeutic or diagnostic use.
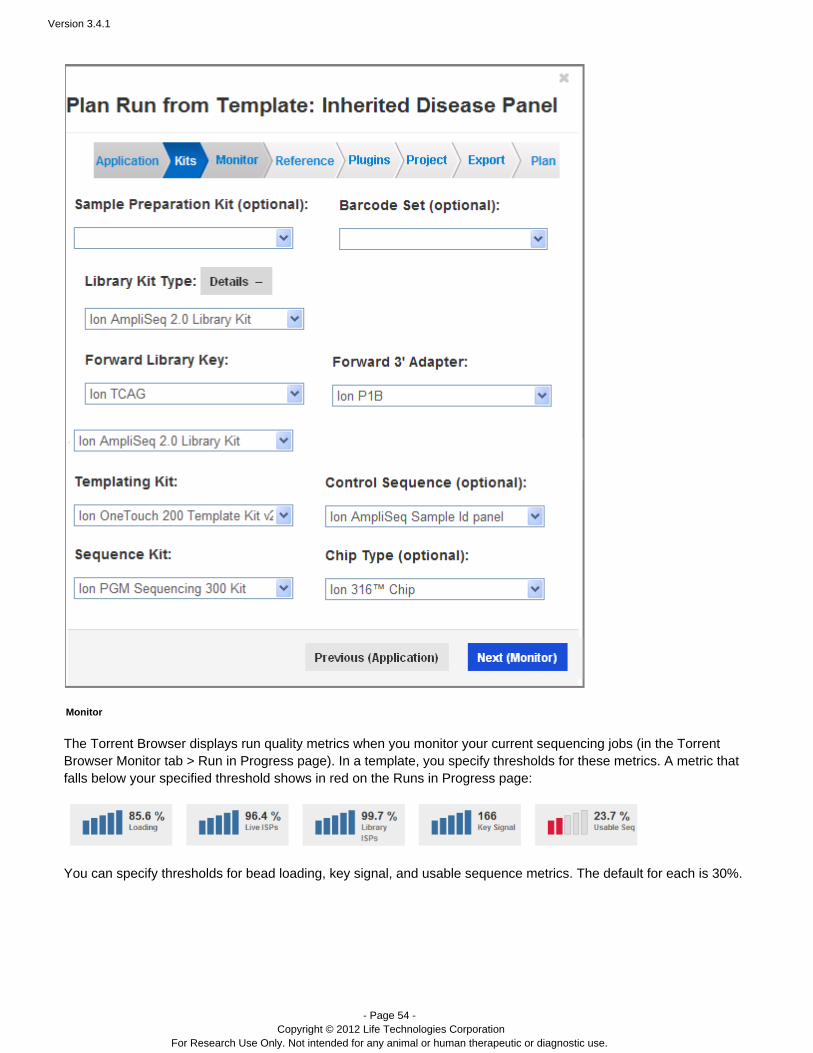
Kits
On the Kits wizard page, enter the following information about laboratory kits and other sequencing parameters:
( ) Sample preparation kitOptionalLibrary kit type, including the forward library key and the forward 3' adapterTemplating kit typeSequence kitNumber of flowsBarcode set – for barcoded runs RequiredControl sequence – Required for RNA runs( ) Chip typeOptional
Note: The value entered for number of flows represents the maximum possible for a run using a planned run basedon this template. Instrument conditions such as the availability of consumables might cause fewer flows to becompleted.
Version 3.4.1
- Page 54 - Copyright © 2012 Life Technologies Corporation
For Research Use Only. Not intended for any animal or human therapeutic or diagnostic use.
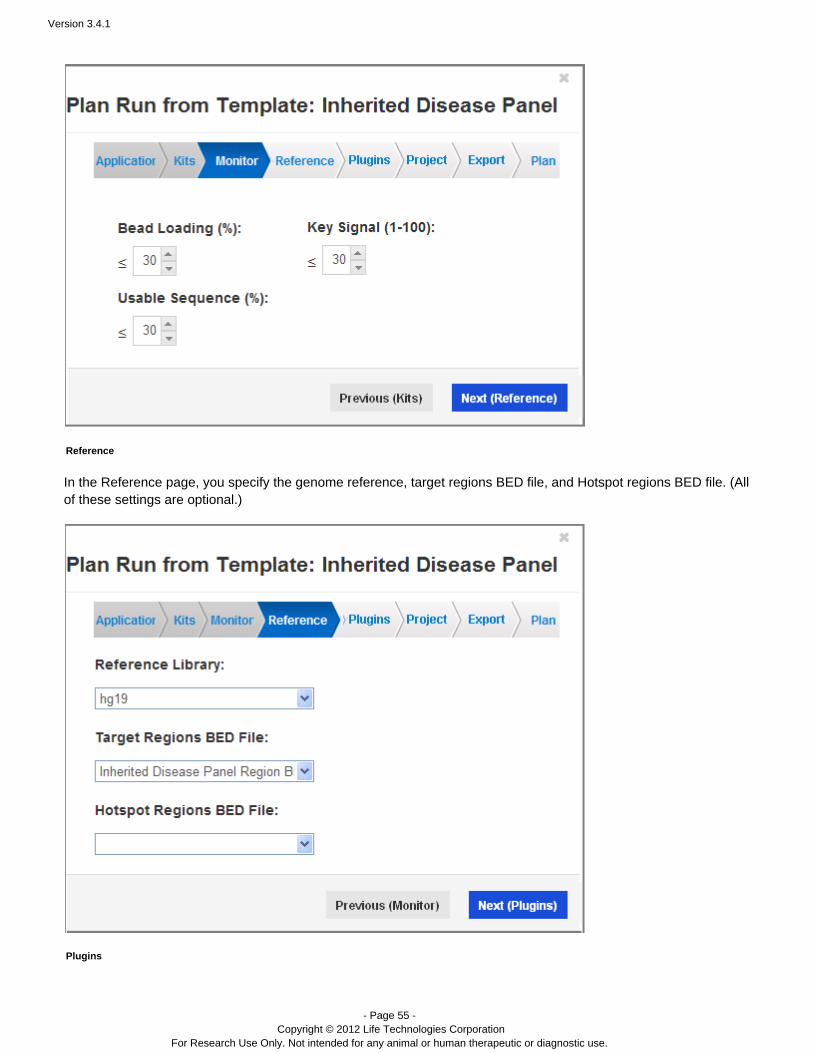
Monitor
The Torrent Browser displays run quality metrics when you monitor your current sequencing jobs (in the TorrentBrowser Monitor tab > Run in Progress page). In a template, you specify thresholds for these metrics. A metric thatfalls below your specified threshold shows in red on the Runs in Progress page:
You can specify thresholds for bead loading, key signal, and usable sequence metrics. The default for each is 30%.
Version 3.4.1
- Page 55 - Copyright © 2012 Life Technologies Corporation
For Research Use Only. Not intended for any animal or human therapeutic or diagnostic use.
Reference
In the Reference page, you specify the genome reference, target regions BED file, and Hotspot regions BED file. (Allof these settings are optional.)
Plugins
Version 3.4.1
- Page 56 - Copyright © 2012 Life Technologies Corporation
For Research Use Only. Not intended for any animal or human therapeutic or diagnostic use.
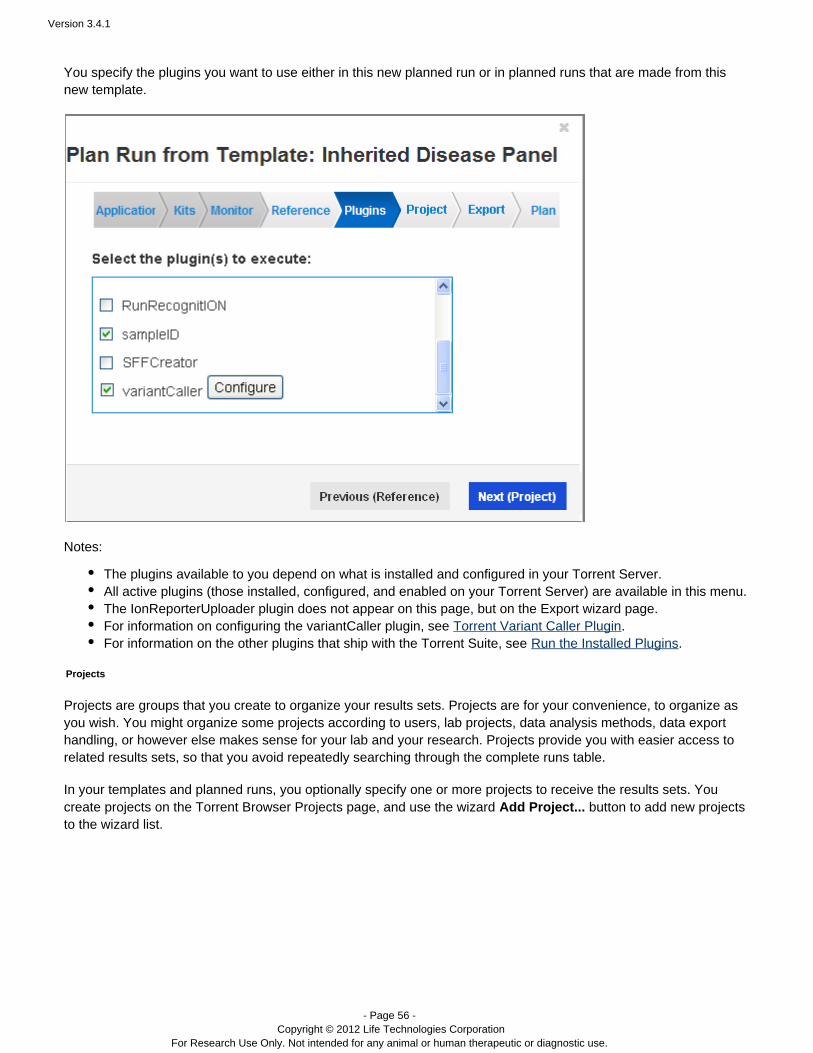
You specify the plugins you want to use either in this new planned run or in planned runs that are made from thisnew template.
Notes:
The plugins available to you depend on what is installed and configured in your Torrent Server.All active plugins (those installed, configured, and enabled on your Torrent Server) are available in this menu.The IonReporterUploader plugin does not appear on this page, but on the Export wizard page.For information on configuring the variantCaller plugin, see .Torrent Variant Caller PluginFor information on the other plugins that ship with the Torrent Suite, see .Run the Installed Plugins
Projects
Projects are groups that you create to organize your results sets. Projects are for your convenience, to organize asyou wish. You might organize some projects according to users, lab projects, data analysis methods, data exporthandling, or however else makes sense for your lab and your research. Projects provide you with easier access torelated results sets, so that you avoid repeatedly searching through the complete runs table.
In your templates and planned runs, you optionally specify one or more projects to receive the results sets. Youcreate projects on the Torrent Browser Projects page, and use the wizard button to add new projectsAdd Project...to the wizard list.
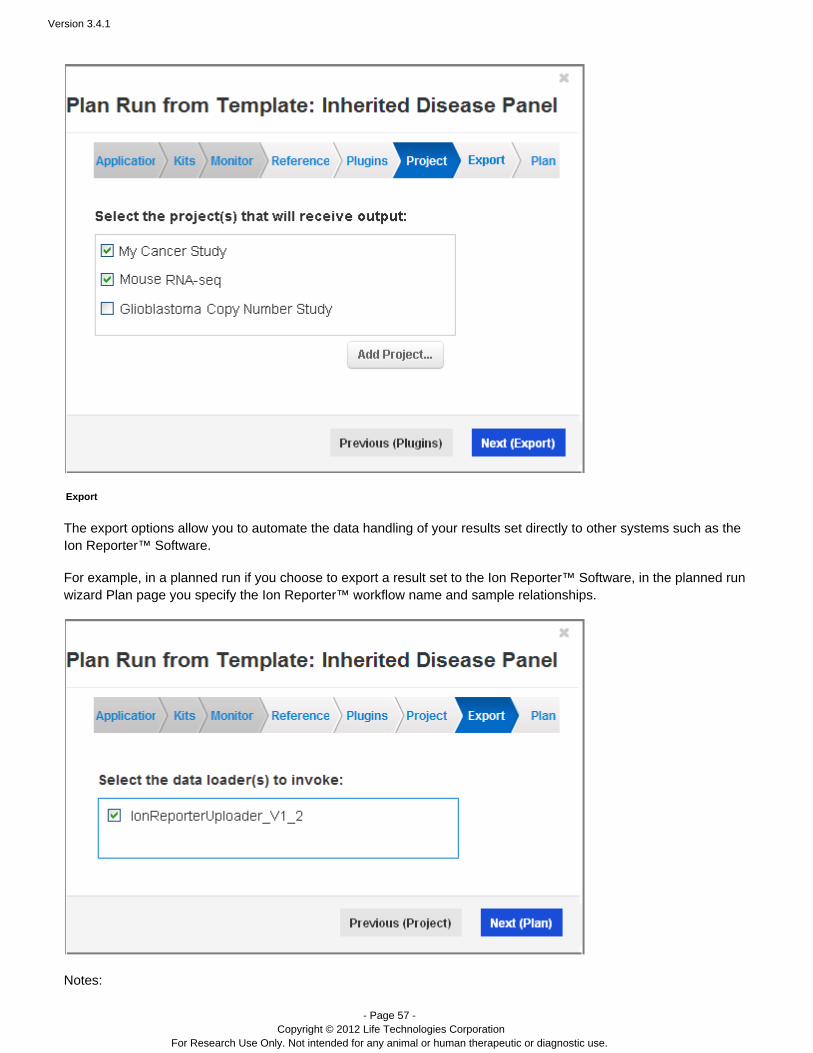
Version 3.4.1
- Page 57 - Copyright © 2012 Life Technologies Corporation
For Research Use Only. Not intended for any animal or human therapeutic or diagnostic use.
Export
The export options allow you to automate the data handling of your results set directly to other systems such as theIon Reporter™ Software.
For example, in a planned run if you choose to export a result set to the Ion Reporter™ Software, in the planned runwizard Plan page you specify the Ion Reporter™ workflow name and sample relationships.
Notes:
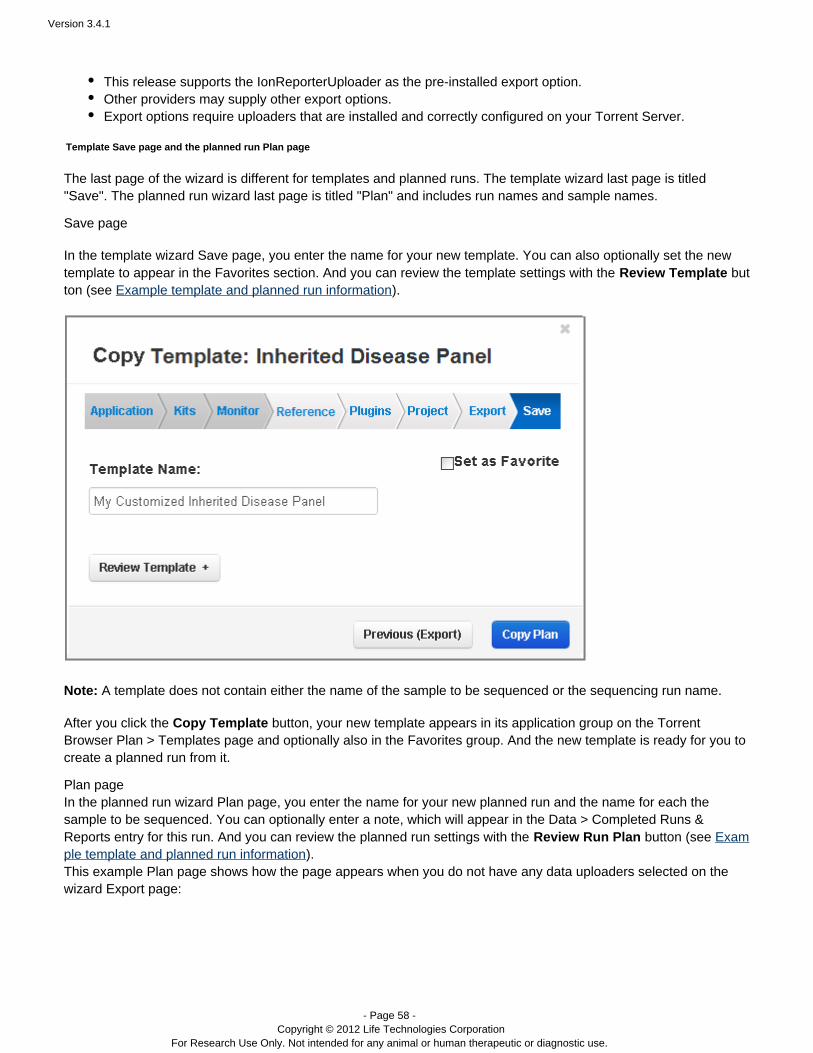
Version 3.4.1
- Page 58 - Copyright © 2012 Life Technologies Corporation
For Research Use Only. Not intended for any animal or human therapeutic or diagnostic use.
This release supports the IonReporterUploader as the pre-installed export option.Other providers may supply other export options.Export options require uploaders that are installed and correctly configured on your Torrent Server.
Template Save page and the planned run Plan page
The last page of the wizard is different for templates and planned runs. The template wizard last page is titled"Save". The planned run wizard last page is titled "Plan" and includes run names and sample names.
Save page
In the template wizard Save page, you enter the name for your new template. You can also optionally set the newtemplate to appear in the Favorites section. And you can review the template settings with the Review Template but
(see ).ton Example template and planned run information
Note: A template does not contain either the name of the sample to be sequenced or the sequencing run name.
After you click the button, your new template appears in its application group on the TorrentCopy TemplateBrowser Plan > Templates page and optionally also in the Favorites group. And the new template is ready for you tocreate a planned run from it.
Plan pageIn the planned run wizard Plan page, you enter the name for your new planned run and the name for each thesample to be sequenced. You can optionally enter a note, which will appear in the Data > Completed Runs &Reports entry for this run. And you can review the planned run settings with the (see Review Run Plan button Example template and planned run information).This example Plan page shows how the page appears when you do not have any data uploaders selected on thewizard Export page:
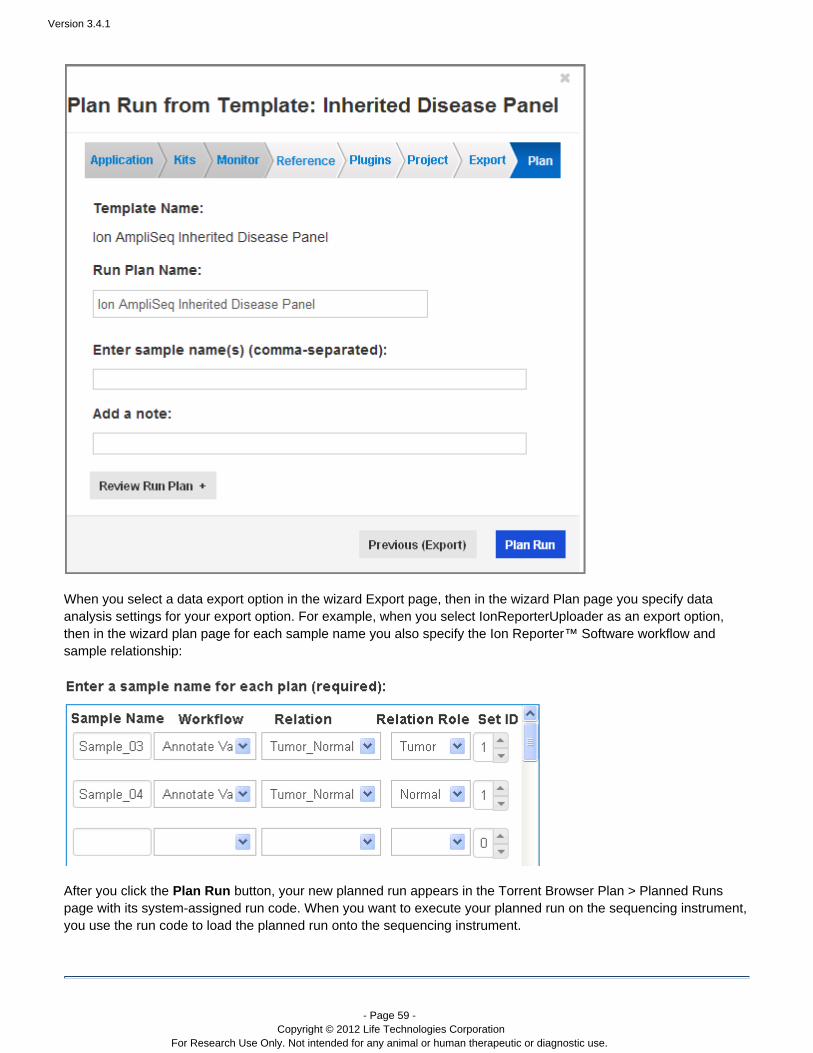
Version 3.4.1
- Page 59 - Copyright © 2012 Life Technologies Corporation
For Research Use Only. Not intended for any animal or human therapeutic or diagnostic use.
When you select a data export option in the wizard Export page, then in the wizard Plan page you specify dataanalysis settings for your export option. For example, when you select IonReporterUploader as an export option,then in the wizard plan page for each sample name you also specify the Ion Reporter Software workflow and™sample relationship:
After you click the Plan Run button, your new planned run appears in the Torrent Browser Plan > Planned Runspage with its system-assigned run code. When you want to execute your planned run on the sequencing instrument,you use the run code to load the planned run onto the sequencing instrument.
Version 3.4.1
- Page 60 - Copyright © 2012 Life Technologies Corporation
For Research Use Only. Not intended for any animal or human therapeutic or diagnostic use.
1.
2.
3.
Contents
Torrent Browser User Interface Guide
The Login Page
The Plan Tab
Templates
Planned Runs
Template and Planned Run Wizard
Create Multiple Run Plans
Create a Template from AmpliSeq Designer
The Monitor Tab
The Data Tab
Completed Runs and Reports Tab
Work with Completed Runs
The Projects Tab
The Projects Listing Page
Project Result Sets Page
CSV Metric File Format
The Admin Menu
Create Multiple Run Plans
Torrent Browser User Interface Guide
Create Multiple Run Plans
The button for a template creates a CSV file with information for multiple run plans. Each data line inPlan Multiple the CSV file is a separate run plan.
Follow these steps to use the feature: Plan Multiple
Select the template to create run plans from. Click the button for that template: Plan Multiple
In the popup, specify how many run plans you want created from the template and click the button Download. The CSV file is downloaded to your local machine. An example file name is CSV for batch planning batch
. The naming pattern is . .Planning_2013_01_15_12_53_42.csv batchPlanning_timestamp csv
You edit the CSV file (on your local machine). For each plan, fill in the Run Name and Sample Name columns:
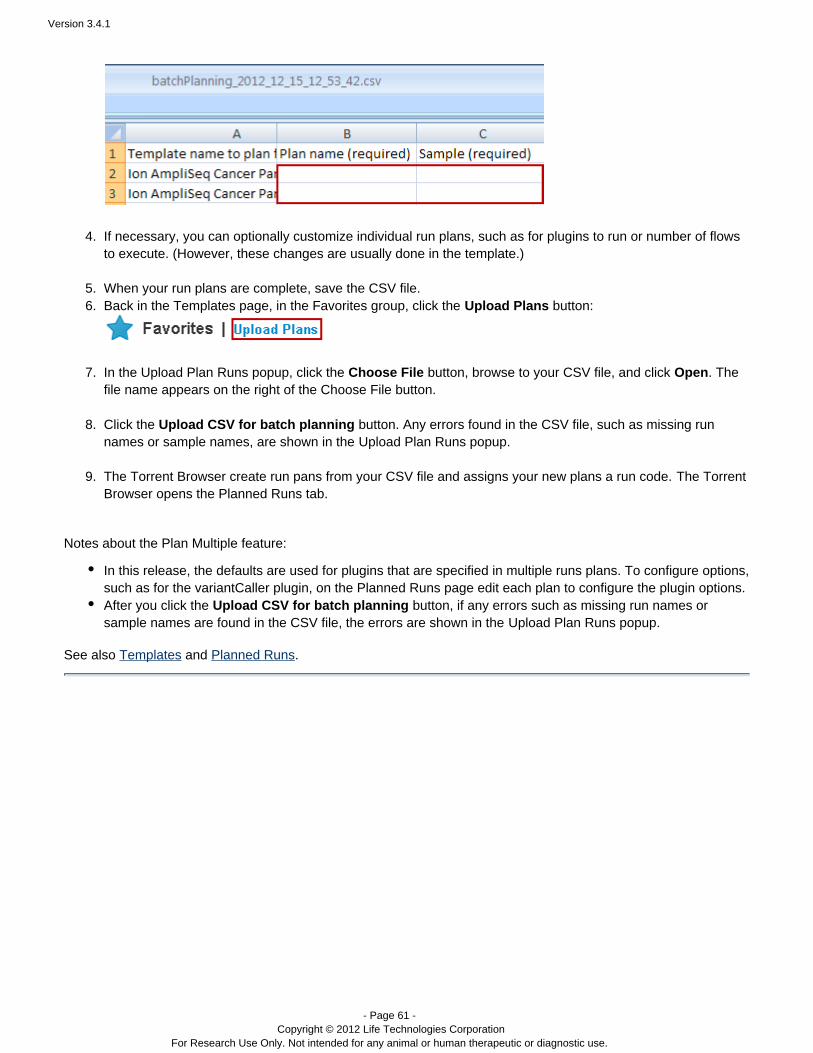
Version 3.4.1
- Page 61 - Copyright © 2012 Life Technologies Corporation
For Research Use Only. Not intended for any animal or human therapeutic or diagnostic use.
3.
4.
5. 6.
7.
8.
9.
If necessary, you can optionally customize individual run plans, such as for plugins to run or number of flowsto execute. (However, these changes are usually done in the template.)
When your run plans are complete, save the CSV file.Back in the Templates page, in the Favorites group, click the button: Upload Plans
In the Upload Plan s popup, click the button, browse to your CSV file, and click . TheRun Choose File Openfile name appears on the right of the Choose File button.
Click the button. Any errors found in the CSV file, such as missing runUpload CSV for batch planningnames or sample names, are shown in the Upload Plan Runs popup.
The Torrent Browser create run pans from your CSV file and assigns your new plans a run code. The TorrentBrowser opens the Planned Runs tab.
Notes about the Plan Multiple feature:
In this release, the defaults are used for plugins that are specified in multiple runs plans. To configure options,such as for the variantCaller plugin, on the Planned Runs page edit each plan to configure the plugin options.After you click the Upload CSV for batch planning button, if any errors such as missing run names or
are found in the CSV file, the errors are shown in the sample names Upload Plan Runs popup.
See also and .Templates Planned Runs

Version 3.4.1
- Page 62 - Copyright © 2012 Life Technologies Corporation
For Research Use Only. Not intended for any animal or human therapeutic or diagnostic use.
Contents
Torrent Browser User Interface Guide
The Login Page
The Plan Tab
Templates
Planned Runs
Template and Planned Run Wizard
Create Multiple Run Plans
Create a Template from AmpliSeq Designer
The Monitor Tab
The Data Tab
Completed Runs and Reports Tab
Work with Completed Runs
The Projects Tab
The Projects Listing Page
Project Result Sets Page
CSV Metric File Format
The Admin Menu
Create a Template from AmpliSeq Designer
Torrent Browser User Interface Guide
Create a Template from AmpliSeq Designer
This page describes how to download results from a completed AmpliSeq Designer run and import your results intothe Torrent Browser to use as a template.
On your Results Ready page in the AmpliSeq Designer, you click the download results button. Then in the TorrentBrowser, import the zipped results file to the hg19 reference. The Torrent Browser creates a new template in theAmpliSeq DNA template group, using your results file from the .AmpliSeq Designer
Download your AmpliSeq Designer resultsImport the AmpliSeq Designer results file in the Torrent Browser References tabUse the new template in the AmpliSeq DNA template group
Download your AmpliSeq Designer results

Version 3.4.1
- Page 63 - Copyright © 2012 Life Technologies Corporation
For Research Use Only. Not intended for any animal or human therapeutic or diagnostic use.
1.
2.
1.
2.
The first step is to download you AmpliSeq Designer results to your local machine:
In the Results Ready page for your design and click the buttAmpliSeq Designer, open the Download resultson:
In the Download Results popup, click the button. The results zip file, which is named for yourDownload Nowdesign ID, is downloaded to your local machine.The also describes the contents of the zip file.Download Results popup
Import the AmpliSeq Designer results file in the Torrent Browser References tab
This step imports your AmpliSeq Designer results into the Torrent Browser.
In your Torrent Browser, select the gear menu option to go to the References tab: References
In the Reference Sequences table, click the entry for hg19:
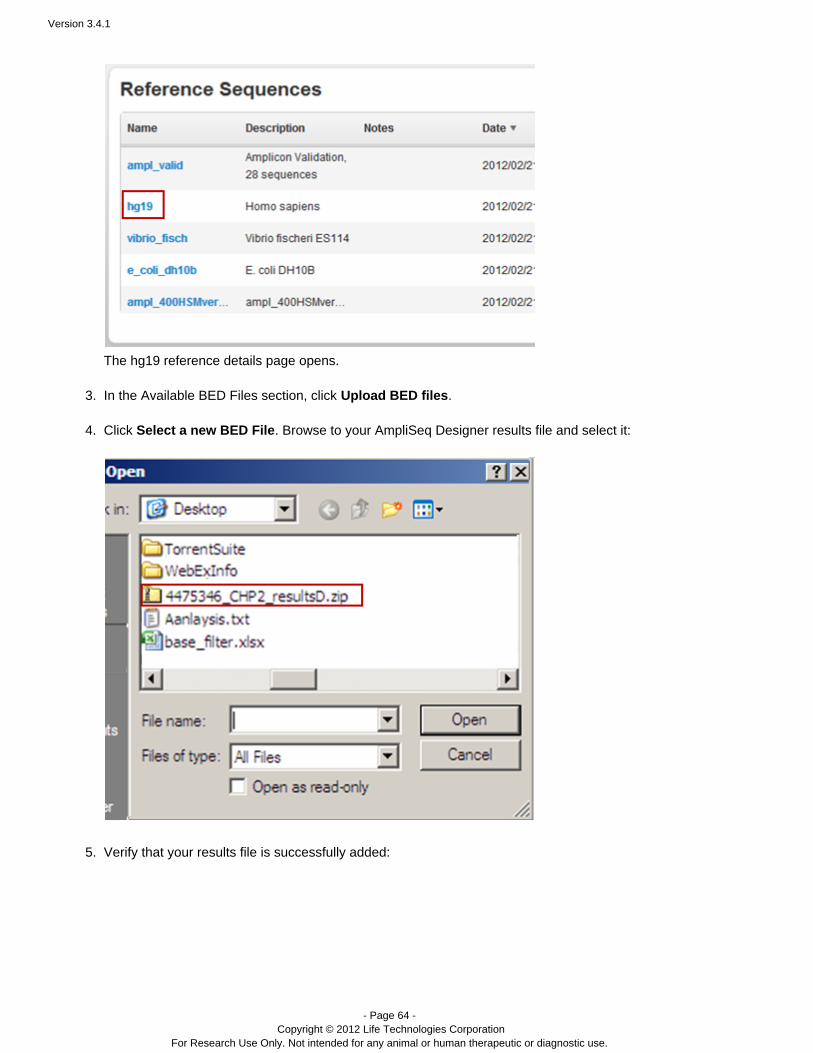
Version 3.4.1
- Page 64 - Copyright © 2012 Life Technologies Corporation
For Research Use Only. Not intended for any animal or human therapeutic or diagnostic use.
2.
3.
4.
5.
The hg19 reference details page opens.
In the Available BED Files section, click . Upload BED files
Click . Browse to your AmpliSeq Designer results file and select it:Select a new BED File
Verify that your results file is successfully added:
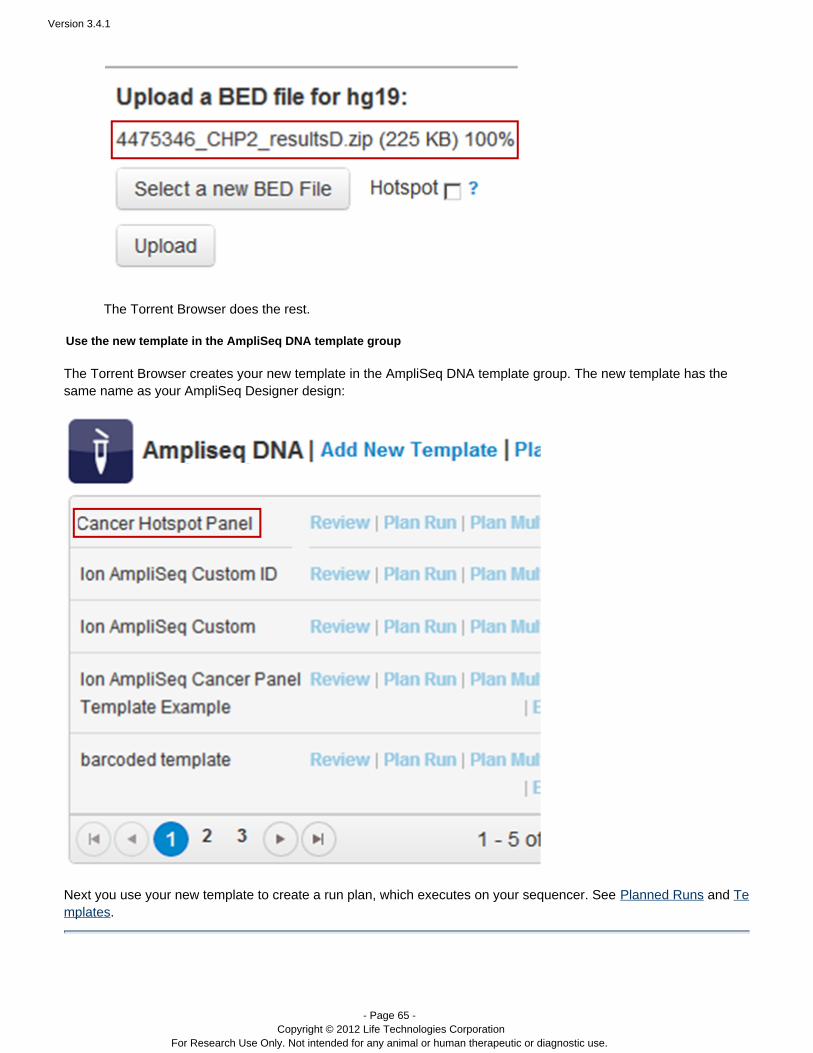
Version 3.4.1
- Page 65 - Copyright © 2012 Life Technologies Corporation
For Research Use Only. Not intended for any animal or human therapeutic or diagnostic use.
5.
The Torrent Browser does the rest.
Use the new template in the AmpliSeq DNA template group
The Torrent Browser creates your new template in the AmpliSeq DNA template group. The new template has thesame name as your AmpliSeq Designer design:
Next you use your new template to create a run plan, which executes on your sequencer. See and Planned Runs Te.mplates
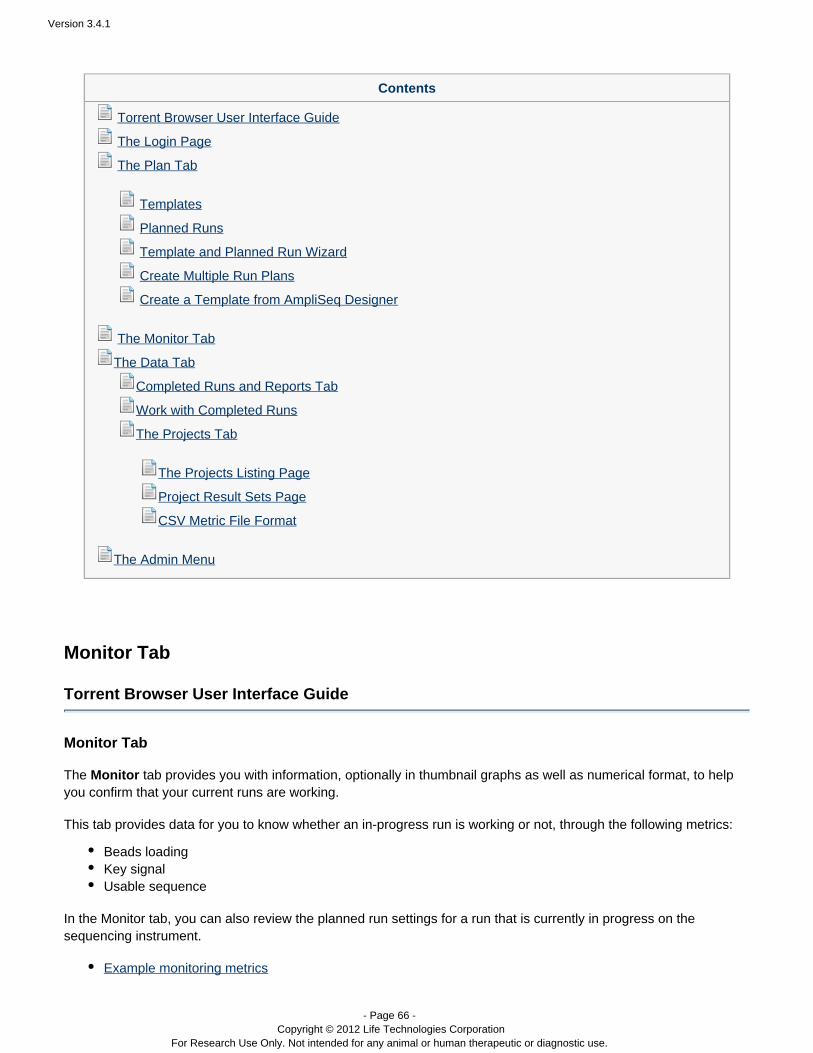
Version 3.4.1
- Page 66 - Copyright © 2012 Life Technologies Corporation
For Research Use Only. Not intended for any animal or human therapeutic or diagnostic use.
Contents
Torrent Browser User Interface Guide
The Login Page
The Plan Tab
Templates
Planned Runs
Template and Planned Run Wizard
Create Multiple Run Plans
Create a Template from AmpliSeq Designer
The Monitor Tab
The Data Tab
Completed Runs and Reports Tab
Work with Completed Runs
The Projects Tab
The Projects Listing Page
Project Result Sets Page
CSV Metric File Format
The Admin Menu
Monitor Tab
Torrent Browser User Interface Guide
Monitor Tab
The tab provides you with information, optionally in thumbnail graphs as well as numerical format, to helpMonitoryou confirm that your current runs are working.
This tab provides data for you to know whether an in-progress run is working or not, through the following metrics:
Beads loadingKey signalUsable sequence
In the Monitor tab, you can also review the planned run settings for a run that is currently in progress on thesequencing instrument.
Example monitoring metrics

Version 3.4.1
- Page 67 - Copyright © 2012 Life Technologies Corporation
For Research Use Only. Not intended for any animal or human therapeutic or diagnostic use.
ViewsAuto UpdateReview the planned run settings
Example monitoring metrics
An example entry in the Monitor > Runs in Progress is shown below:
With the Monitor tab List View you can see at a glance if any run quality metrics fall below the thresholds that youdefine in your template (see ). Any metrics below threshold are shown in red in the thumbnail graphs.Templates
Other information shown in Run in Progress entries are:
The Sequencing run nameRun information: started date, chip type, run type, and run notesA link to the run reportRun status: In progress, completed, or terminatedA link to the run plan for this sequencing runThe number of flows transferredA flow transfer progress bar
Views
The Monitor > Runs in Progress page supports a list view and a table view. An example list view entry is shown in E. The list view display 3 or 4 runs per page. The table view, shown below, displays 1 run per row.xample
When you use the table view, you can sort the table by any of the columns in bold type. Click a column header tosort the table, and click the header a second time to reverse the sort.
Auto Update
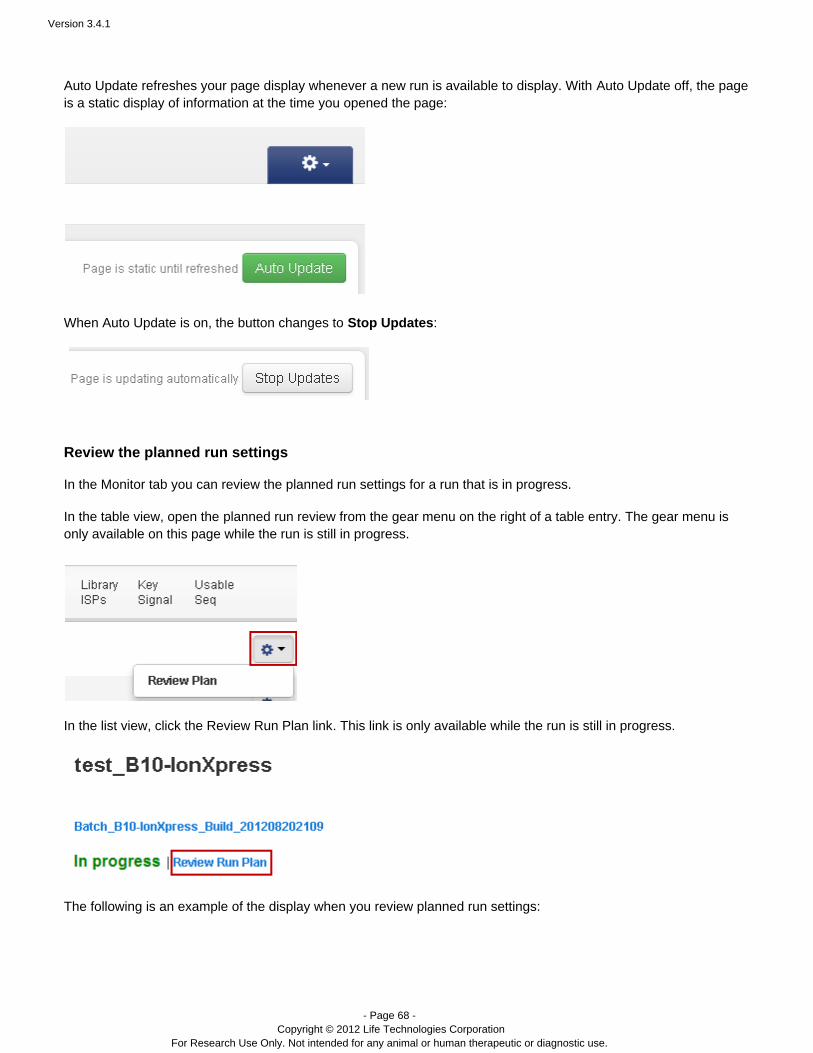
Version 3.4.1
- Page 68 - Copyright © 2012 Life Technologies Corporation
For Research Use Only. Not intended for any animal or human therapeutic or diagnostic use.
Auto Update refreshes your page display whenever a new run is available to display. With Update off, the pageAutois a static display of information at the time you opened the page:
When Auto Update is on, the button changes to :Stop Updates
Review the planned run settings
In the Monitor tab you can review the planned run settings for a run that is in progress.
In the table view, open the planned run review from the gear menu on the right of a table entry. The gear menu isonly available on this page while the run is still in progress.
In the list view, click the Review Run Plan link. This link is only available while the run is still in progress.
The following is an example of the display when you review planned run settings:
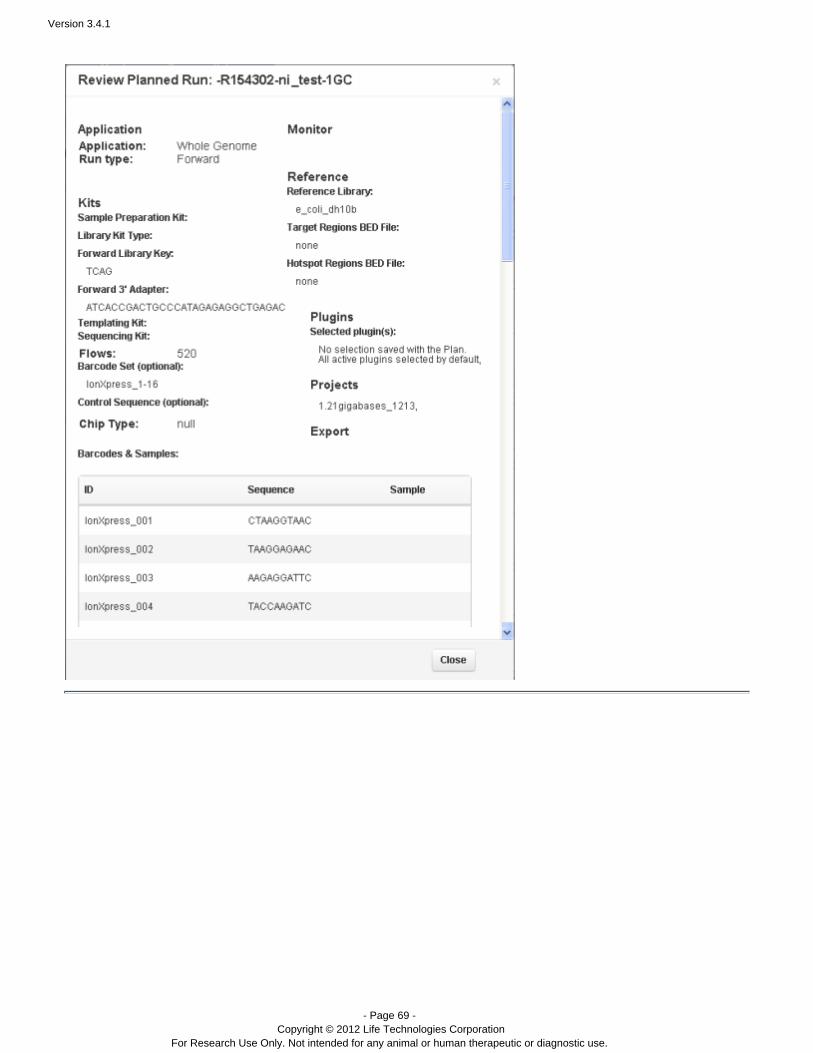
Version 3.4.1
- Page 69 - Copyright © 2012 Life Technologies Corporation
For Research Use Only. Not intended for any animal or human therapeutic or diagnostic use.
Version 3.4.1
- Page 70 - Copyright © 2012 Life Technologies Corporation
For Research Use Only. Not intended for any animal or human therapeutic or diagnostic use.
Contents
Torrent Browser User Interface Guide
The Login Page
The Plan Tab
Templates
Planned Runs
Template and Planned Run Wizard
Create Multiple Run Plans
Create a Template from AmpliSeq Designer
The Monitor Tab
The Data Tab
Completed Runs and Reports Tab
Work with Completed Runs
The Projects Tab
The Projects Listing Page
Project Result Sets Page
CSV Metric File Format
The Admin Menu
Data Tab
Torrent Browser User Interface Guide
Data Tab
With the tab, you inspect run results and also control your data analysis and data management tasks.Data
In the tab, you review completed runs and run reports. Use this tab to search,Data > Completed Runs & Resultsfilter, and sort the Ion PGM™ and Ion Proton™ sequencer runs to display. You can also resubmit a run with thesame or changed run parameters.
For an overview, including UI controls, see .Completed Runs and Reports TabFor run report details, see Torrent Browser Analysis Report Guide.
Normally you use a template to specify data management tasks to be automatically completed. (In this release, aIn the tab, ytemplate supports automation of your export and project selections.) Data > Projects ou can manually
perform the following data management tasks. See .Projects Tab
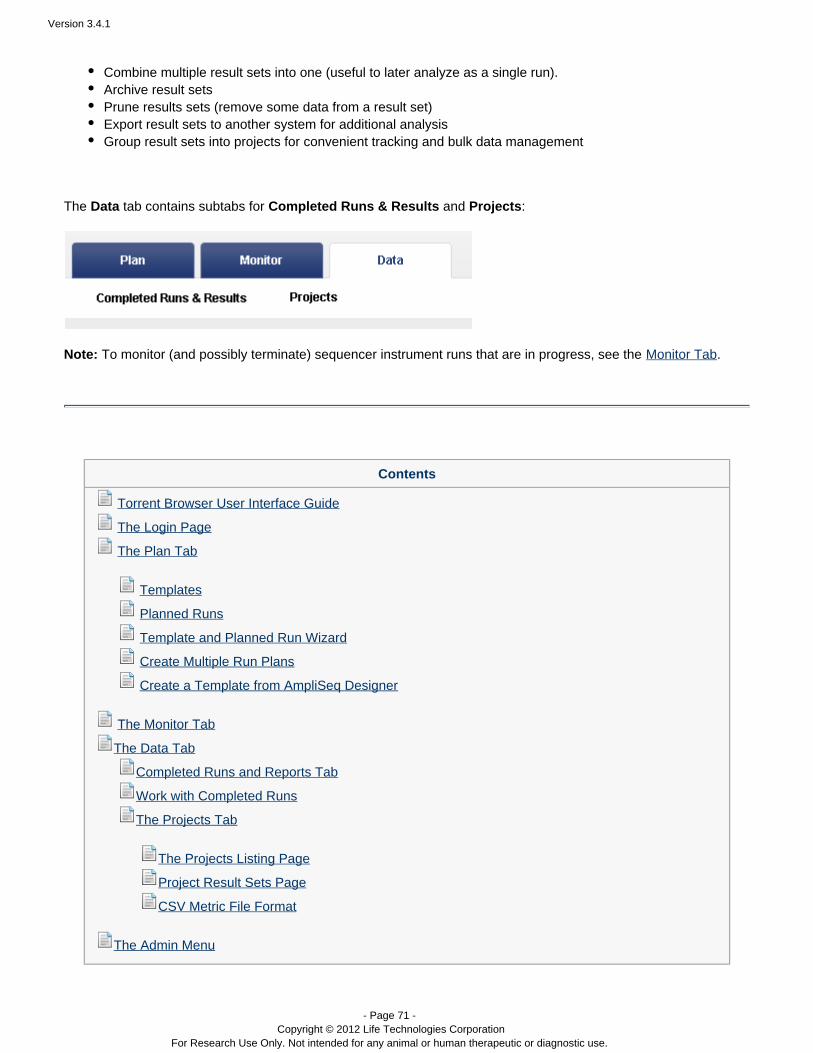
Version 3.4.1
- Page 71 - Copyright © 2012 Life Technologies Corporation
For Research Use Only. Not intended for any animal or human therapeutic or diagnostic use.
Combine multiple result sets into one (useful to later analyze as a single run).Archive result setsPrune results sets (remove some data from a result set)Export result sets to another system for additional analysisGroup result sets into projects for convenient tracking and bulk data management
The tab contains subtabs for Data and :Completed Runs & Results Projects
Note: To monitor (and possibly terminate) sequencer instrument runs that are in progress, see the .Monitor Tab
Contents
Torrent Browser User Interface Guide
The Login Page
The Plan Tab
Templates
Planned Runs
Template and Planned Run Wizard
Create Multiple Run Plans
Create a Template from AmpliSeq Designer
The Monitor Tab
The Data Tab
Completed Runs and Reports Tab
Work with Completed Runs
The Projects Tab
The Projects Listing Page
Project Result Sets Page
CSV Metric File Format
The Admin Menu
Version 3.4.1
- Page 72 - Copyright © 2012 Life Technologies Corporation
For Research Use Only. Not intended for any animal or human therapeutic or diagnostic use.
Completed Runs and Reports Tab
Torrent Browser User Interface Guide
Completed Runs and Reports Tab
Use this tab to to search, filter, and sort your sequencing instrument runs to be displayed. You can also edit a runplan, reanalyze a run, and manually run a plugin.
You can view the run information in a table view that contains one run per row or a list view that displays about threeruns per page.
You access a detailed run report by clicking on the report name. Or click on the Open in a new window icon ne (See the a report name to open the run report in a new browser tab or a new window.xt to browser Torrent Browser
for a description of run reports).Analysis Report Guide
The page is divided into three areas:Completed Runs & Reports
The top panel provides menus and fields to filter the run display.The middle panel displays a list of runs that matched the run filtering specification. Two view styles areavailable: table and list.The bottom panel displays the current page number, with links to navigate between the previous and nextpages (if present) and a link to download a CSV file of the run information to your local machine.
ViewsSearch for a runFilter the displayed data
Filter menusThe date filterThe starred runs filter
SortReport Data Management
ExportArchivePruneToggle ExemptionView Log
Other UI controlsRepresentative run report
CSV metrics file
What is the point?Where are we?
Views
You can view results in a table view that is one run per row or a list view with about three runs per page. Here is anexample of the list view:
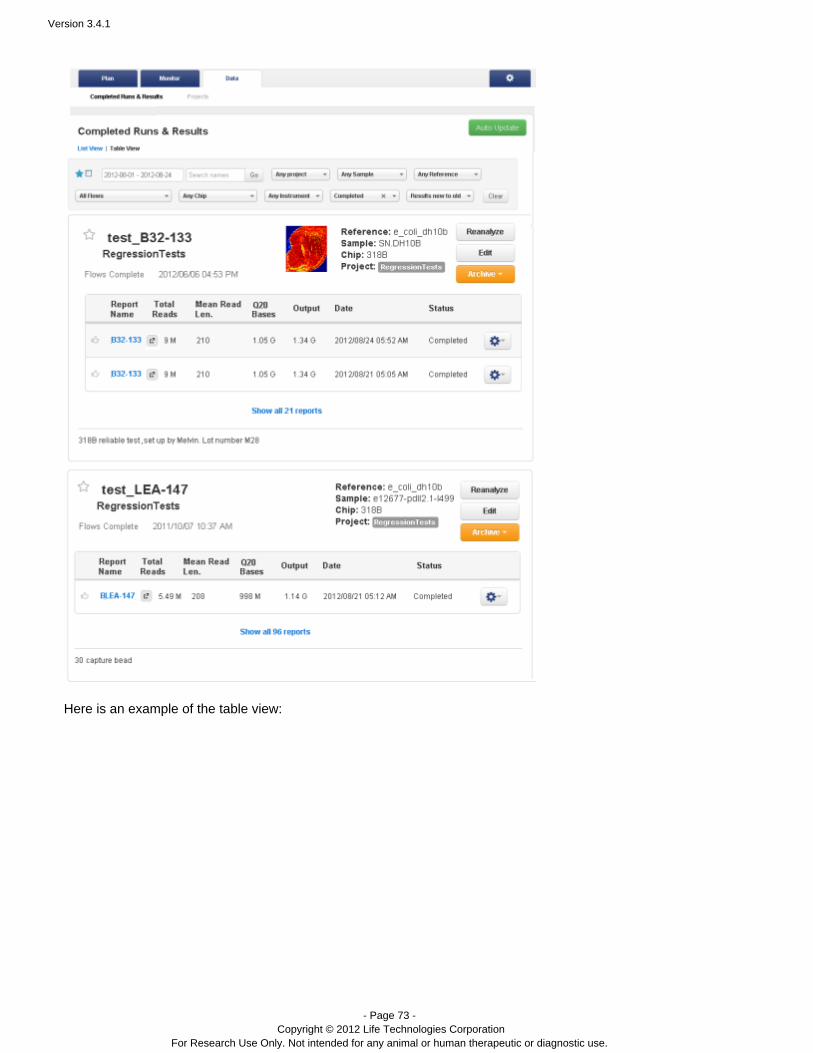
Version 3.4.1
- Page 73 - Copyright © 2012 Life Technologies Corporation
For Research Use Only. Not intended for any animal or human therapeutic or diagnostic use.
Here is an example of the table view:
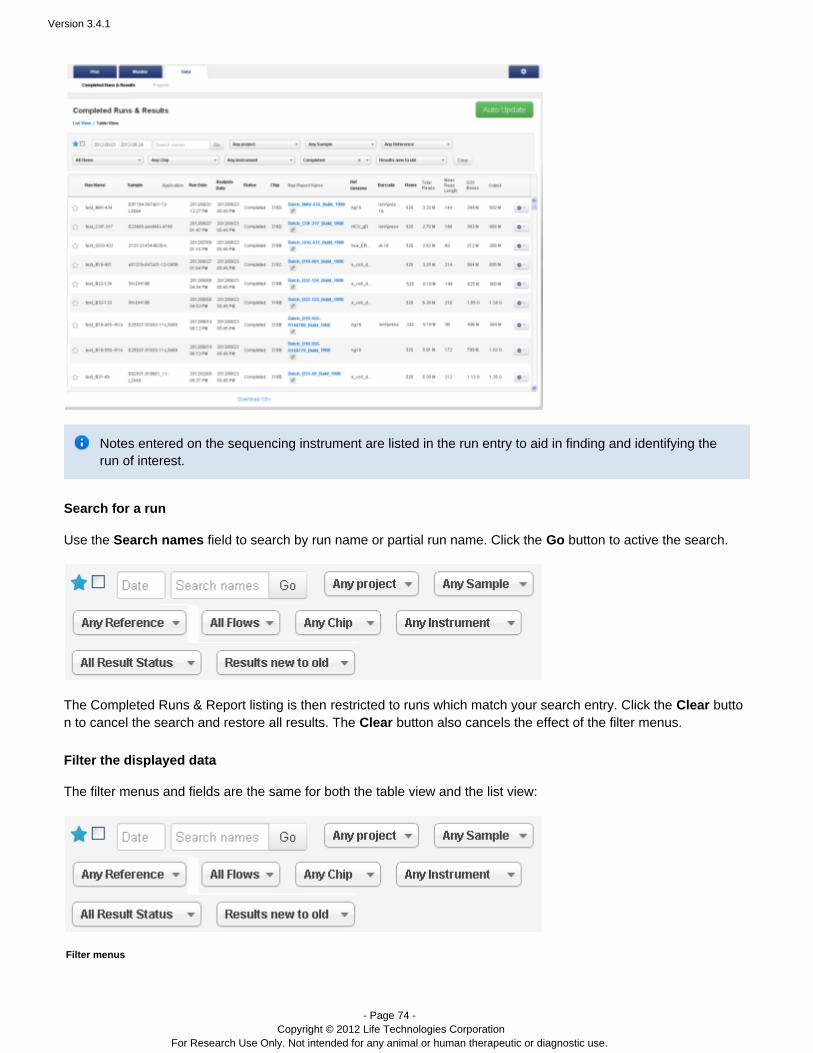
Version 3.4.1
- Page 74 - Copyright © 2012 Life Technologies Corporation
For Research Use Only. Not intended for any animal or human therapeutic or diagnostic use.
Notes entered on the sequencing instrument are listed in the run entry to aid in finding and identifying therun of interest.
Search for a run
Use the field to search by run name or partial run name. Click the button to active the search.Search names Go
The Completed Runs & Report listing is then restricted to runs which match your search entry. Click the buttoClearn to cancel the search and restore all results. The button also cancels the effect of the filter menus.Clear
Filter the displayed data
The filter menus and fields are the same for both the table view and the list view:
Filter menus
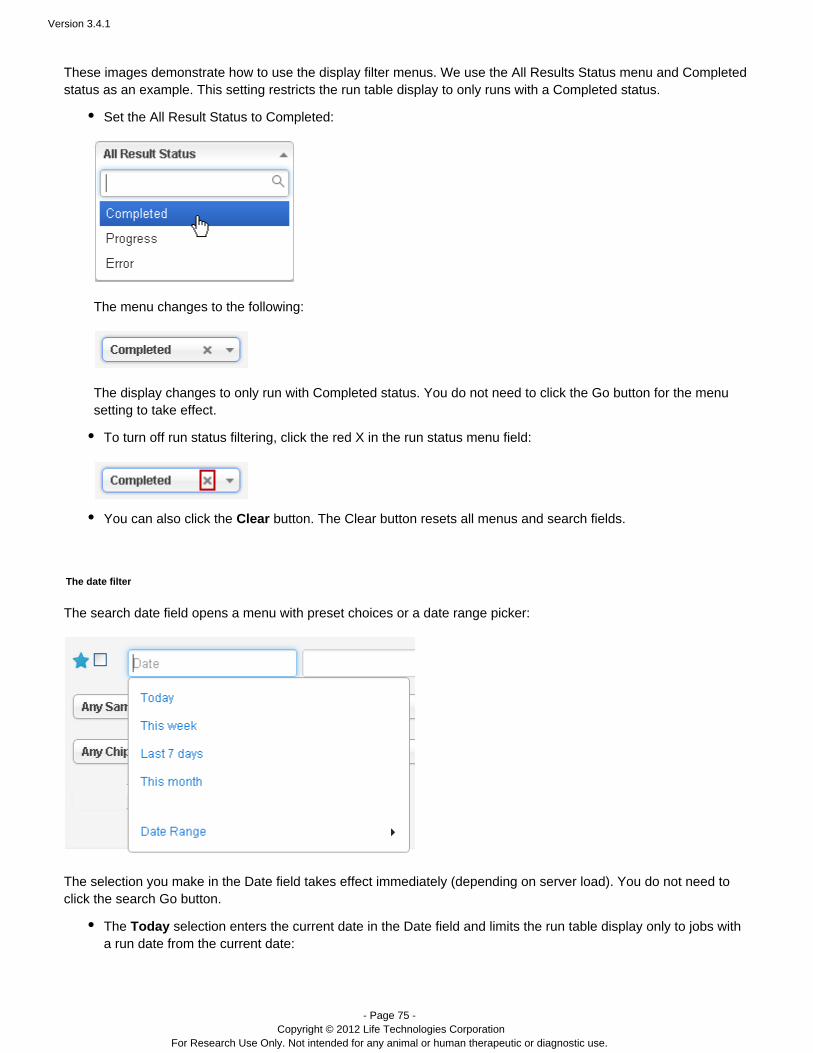
Version 3.4.1
- Page 75 - Copyright © 2012 Life Technologies Corporation
For Research Use Only. Not intended for any animal or human therapeutic or diagnostic use.
These images demonstrate how to use the display filter menus. We use the All Results Status menu and Completedstatus as an example. This setting restricts the run table display to only runs with a Completed status.
Set the All Result Status to Completed:
The menu changes to the following:
The display changes to only run with Completed status. You do not need to click the Go button for the menusetting to take effect.
To turn off run status filtering, click the red X in the run status menu field:
You can also click the button. The Clear button resets all menus and search fields.Clear
The date filter
The search date field opens a menu with preset choices or a date range picker:
The selection you make in the Date field takes effect immediately (depending on server load). You do not need toclick the search Go button.
The selection enters the current date in the Date field and limits the run table display only to jobs withTodaya run date from the current date:
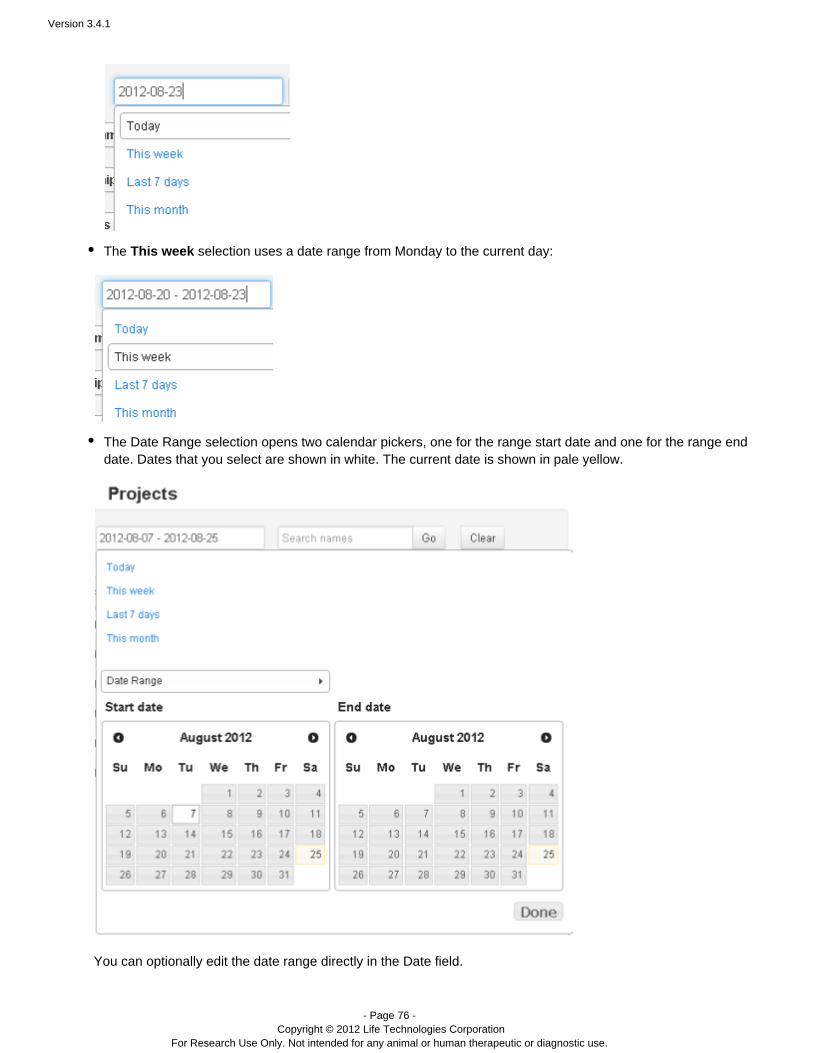
Version 3.4.1
- Page 76 - Copyright © 2012 Life Technologies Corporation
For Research Use Only. Not intended for any animal or human therapeutic or diagnostic use.
The selection uses a date range from Monday to the current day:This week
The Date Range selection opens two calendar pickers, one for the range start date and one for the range enddate. Dates that you select are shown in white. The current date is shown in pale yellow.
You can optionally edit the date range directly in the Date field.
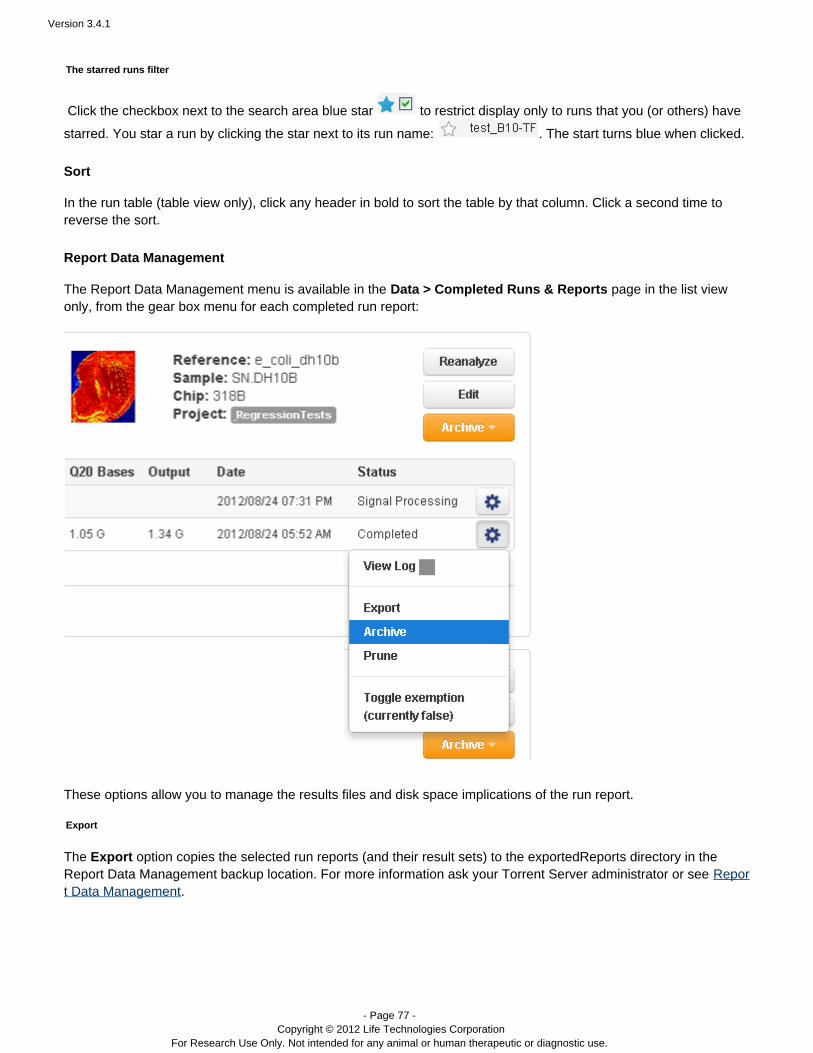
Version 3.4.1
- Page 77 - Copyright © 2012 Life Technologies Corporation
For Research Use Only. Not intended for any animal or human therapeutic or diagnostic use.
The starred runs filter
Click the checkbox next to the search area blue star to restrict display only to runs that you (or others) have
starred. You star a run by clicking the star next to its run name: . The start turns blue when clicked.
Sort
In the run table (table view only), click any header in bold to sort the table by that column. Click a second time toreverse the sort.
Report Data Management
The Report Data Management menu is available in the Data > Completed Runs & Reports page in the list viewonly, from the gear box menu for each completed run report:
These options allow you to manage the results files and disk space implications of the run report.
Export
The option copies the selected run reports (and their result sets) to the exportedReports directory in theExportReport Data Management backup location. For more information ask your Torrent Server administrator or see Repor
.t Data Management
Version 3.4.1
- Page 78 - Copyright © 2012 Life Technologies Corporation
For Research Use Only. Not intended for any animal or human therapeutic or diagnostic use.
This Export option is not related to the automatic export that is configured in a template. The templateexport option sends your result set to another software system, while the Report Data Management Exportoption copies the result set and complete run report to a locally mounted file system.
Archive
The button option eventually moves the selected run reports (and their result sets) toProcess Selected... Archivethe archivedReports directory in the Report Data Management backup location. The Archive option first does thefollowing:
Creates a customer support archive.Creates a PDF of the run report.
The Archive option leaves the customer support archive and the run report PDF in the run report directory. Otherreport files and result files are deleted from the run reports directory after the copy to the archivedReports directory.
Run reports and results files that are archived can be accessed and viewed on the archive file system, butthere is no support for accessing, viewing, or managing archived run reports and result files through theTorrent Browser.
For example, once a report is archived with the Report Data Management option, the Torrent Browsercannot access that report to use with Combine Alignment or other actions.
The gold Archive button specifies an ionArchive service setting and is not related to the Report DataManagement Archive option. The ionArchive service is activated when free disk space thresholds arereached.
Prune
The option removes files from the selected result set. Your Torrent Server administrator configures whichPrunefiles are deleted by the Prune option.
Recovery of files deleted by the Prune option is not supported.
Toggle Exemption
Your Torrent Server administrator can configure an automatic prune or archival action. Setting the exemption toggleto trues mean the automatic action cannot act on this run report or its results files.
View Log
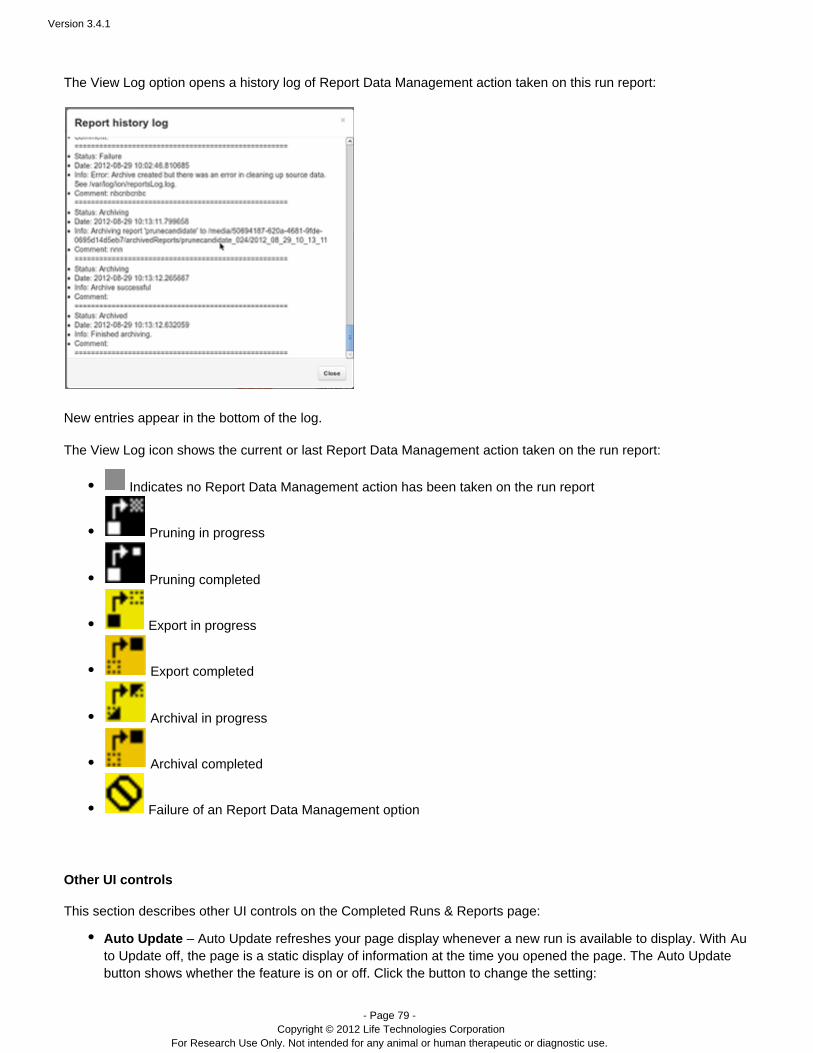
Version 3.4.1
- Page 79 - Copyright © 2012 Life Technologies Corporation
For Research Use Only. Not intended for any animal or human therapeutic or diagnostic use.
The View Log option opens a history log of Report Data Management action taken on this run report:
New entries appear in the bottom of the log.
The View Log icon shows the current action taken on the run report:or last Report Data Management
Indicates no action has been taken on the run reportReport Data Management
Pruning in progress
Pruning completed
Export in progress
Export completed
Archival in progress
Archival completed
Failure of an Report Data Management option
Other UI controls
This section describes other UI controls on the Completed Runs & Reports page:
Auto Update – Auto Update refreshes your page display whenever a new run is available to display. With AuUpdate off, the page is a static display of information at the time you opened the page. The Updateto Auto
button shows whether the feature is on or off. Click the button to change the setting:
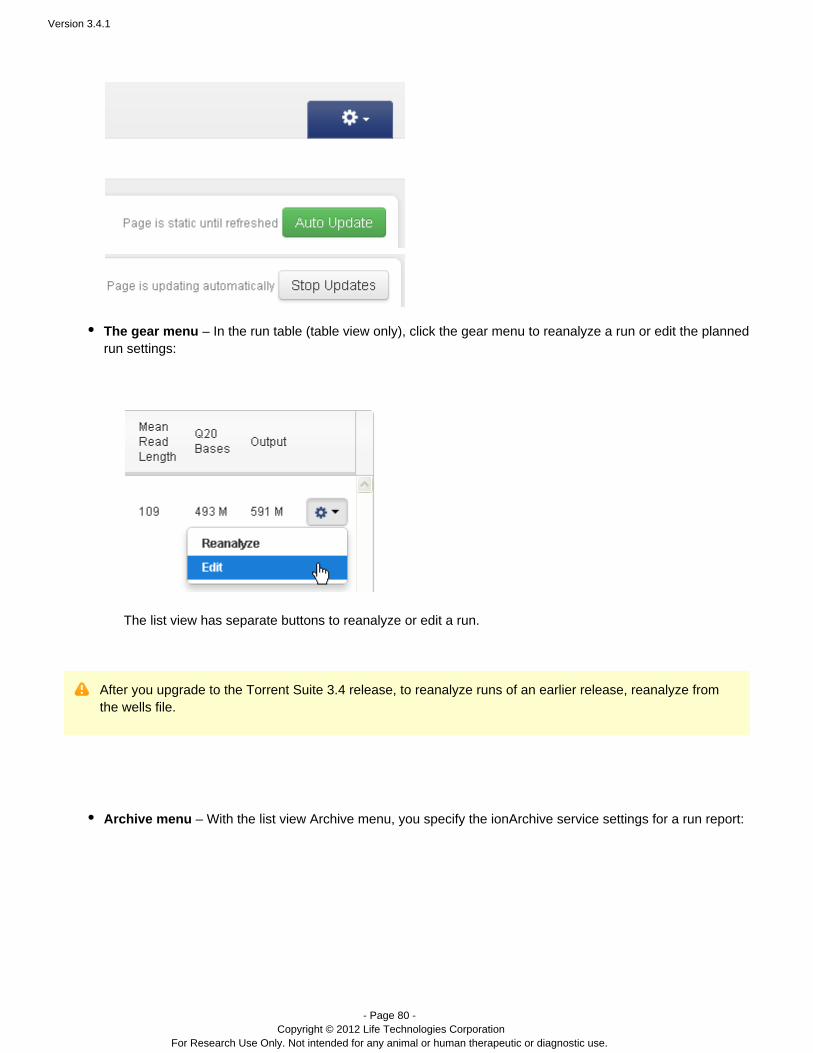
Version 3.4.1
- Page 80 - Copyright © 2012 Life Technologies Corporation
For Research Use Only. Not intended for any animal or human therapeutic or diagnostic use.
The gear menu – In the run table (table view only), click the gear menu to reanalyze a run or edit the plannedrun settings:
The list view has separate buttons to reanalyze or edit a run.
After you upgrade to the Torrent Suite 3.4 release, to reanalyze runs of an earlier release, reanalyze fromthe wells file.
Archive menu – With the l iew Archive menu, you specify the ionArchive service settings for a run report:ist v
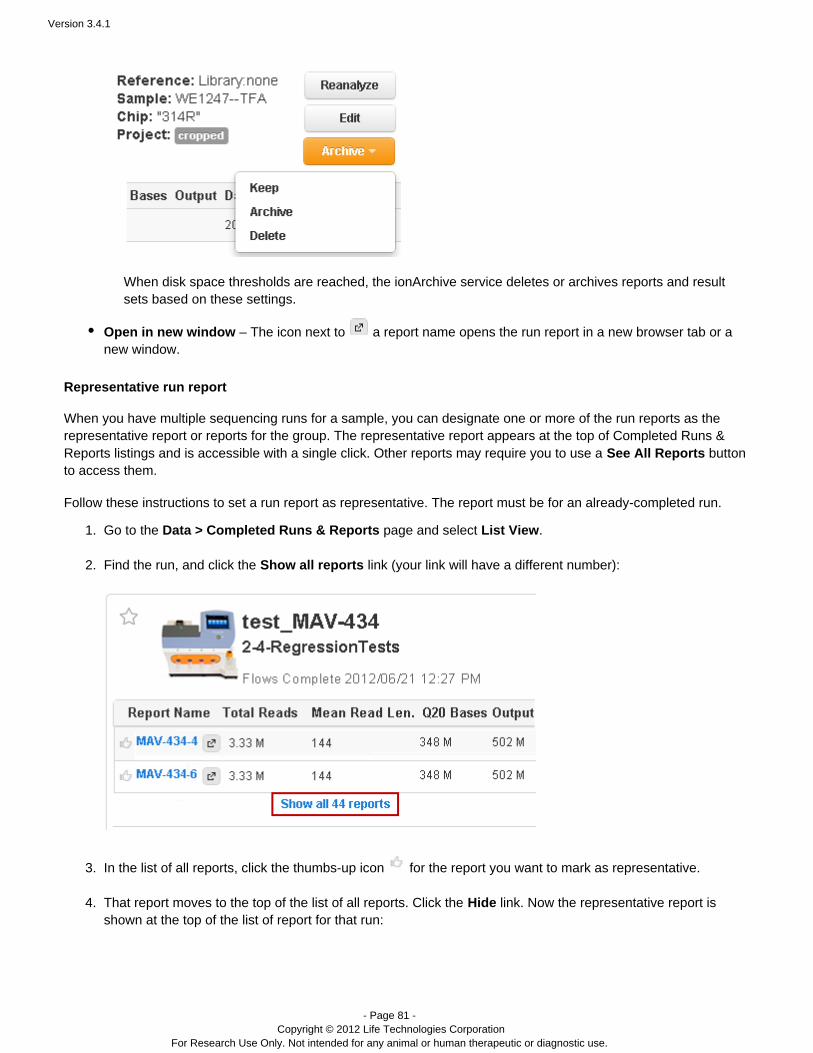
Version 3.4.1
- Page 81 - Copyright © 2012 Life Technologies Corporation
For Research Use Only. Not intended for any animal or human therapeutic or diagnostic use.
1.
2.
3.
4.
When disk space thresholds are reached, the ionArchive service deletes or archives reports and resultsets based on these settings.
Open in new window – The icon next to a report name opens the run report in a new browser tab or anew window.
Representative run report
When you have multiple sequencing runs for a sample, you can designate one or more of the run reports as therepresentative report or reports for the group. The representative report appears at the top of Completed Runs &Reports listings and is accessible with a single click. Other reports may require you to use a buttonSee All Reportsto access them.
Follow these instructions to set a run report as representative. The report must be for an already-completed run.
Go to the Data > Completed Runs & Reports page and select .List View
Find the run, and click the link (your link will have a different number):Show all reports
In the list of all reports, click the thumbs-up icon for the report you want to mark as representative.
That report moves to the top of the list of all reports. Click the link. Now the representative report isHideshown at the top of the list of report for that run:
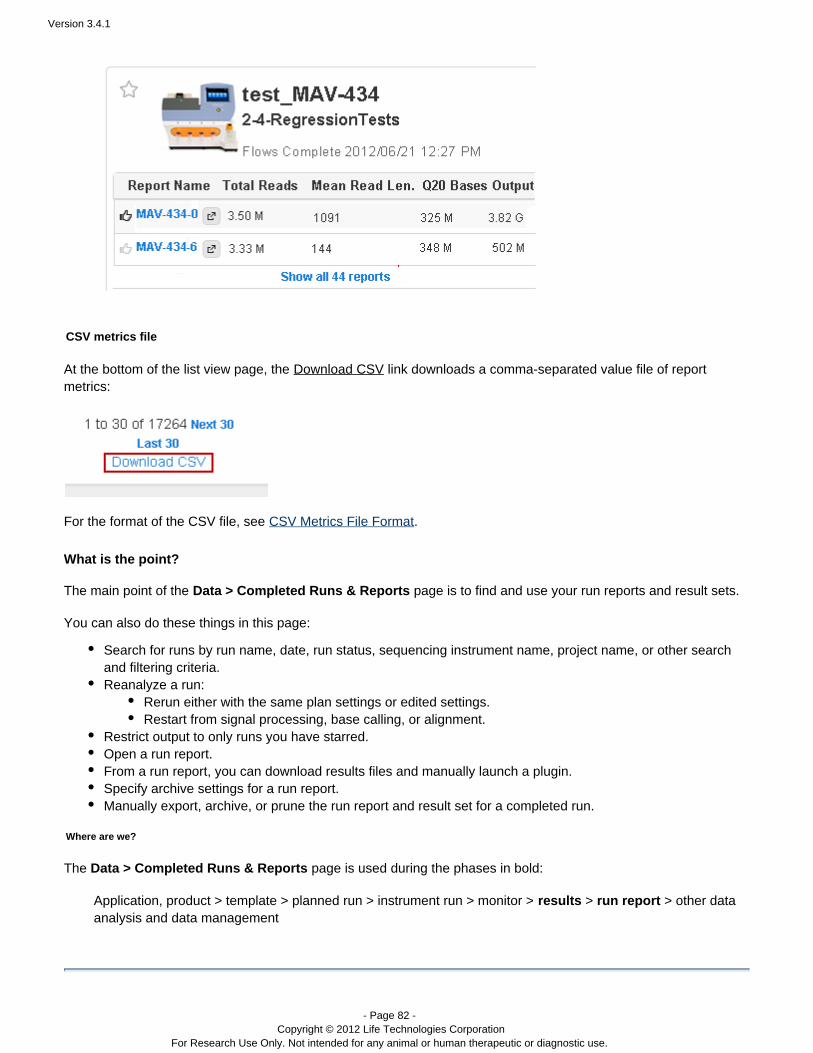
Version 3.4.1
- Page 82 - Copyright © 2012 Life Technologies Corporation
For Research Use Only. Not intended for any animal or human therapeutic or diagnostic use.
4.
CSV metrics file
At the bottom of the list view page, the link downloads a comma-separated value file of reportDownload CSVmetrics:
For the format of the CSV file, see .CSV Metrics File Format
What is the point?
The main point of the page is to find and use your run reports and result sets.Data > Completed Runs & Reports
You can also do these things in this page:
Search for runs by run name, date, run status, sequencing instrument name, project name, or other searchand filtering criteria.Reanalyze a run:
Rerun either with the same plan settings or edited settings.Restart from signal processing, base calling, or alignment.
Restrict output to only runs you have starred.Open a run report. From a run report, you can download results files and manually launch a plugin.Specify archive settings for a run report.Manually export, archive, or prune the run report and result set for a completed run.
Where are we?
The page is used during the phases in bold:Data > Completed Runs & Reports
Application, product > template > planned run > instrument run > monitor > > > other dataresults run reportanalysis and data management
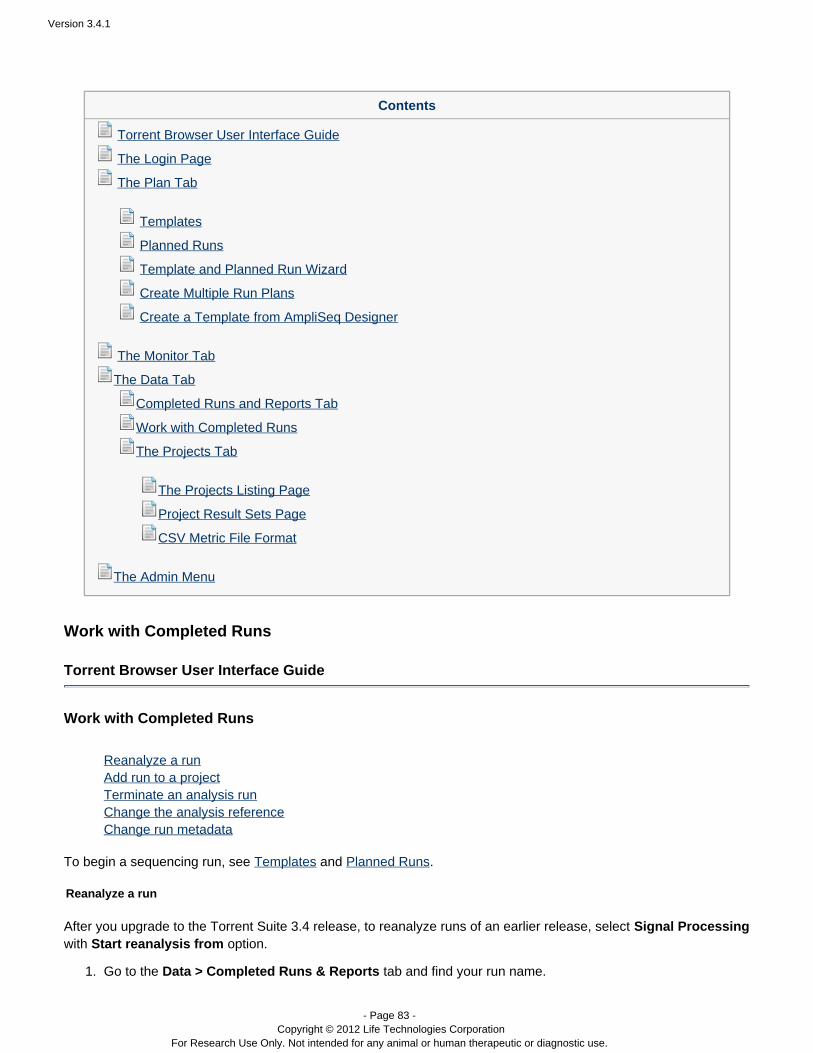
Version 3.4.1
- Page 83 - Copyright © 2012 Life Technologies Corporation
For Research Use Only. Not intended for any animal or human therapeutic or diagnostic use.
1.
Contents
Torrent Browser User Interface Guide
The Login Page
The Plan Tab
Templates
Planned Runs
Template and Planned Run Wizard
Create Multiple Run Plans
Create a Template from AmpliSeq Designer
The Monitor Tab
The Data Tab
Completed Runs and Reports Tab
Work with Completed Runs
The Projects Tab
The Projects Listing Page
Project Result Sets Page
CSV Metric File Format
The Admin Menu
Work with Completed Runs
Torrent Browser User Interface Guide
Work with Completed Runs
Reanalyze a runAdd run to a projectTerminate an analysis runChange the analysis referenceChange run metadata
To begin a sequencing run, see and .Templates Planned Runs
Reanalyze a run
After you upgrade to the Torrent Suite 3.4 release, to reanalyze runs of an earlier release, select Signal Processingwith option.Start reanalysis from
Go to the tab and find your run name.Data > Completed Runs & Reports

Version 3.4.1
- Page 84 - Copyright © 2012 Life Technologies Corporation
For Research Use Only. Not intended for any animal or human therapeutic or diagnostic use.
1.
In the table view, click the option in the gear menu on the right of the run entry:Reanalyze
In the list view, click the button on the right of the run entry:Reanalyze
The main run analysis dialog opens:
To rerun the analysis , fill in the report name and click .with the same settings Start AnalysisTo rerun the analysis click the button to display the additional run with changed settings, Advancedparameter options:
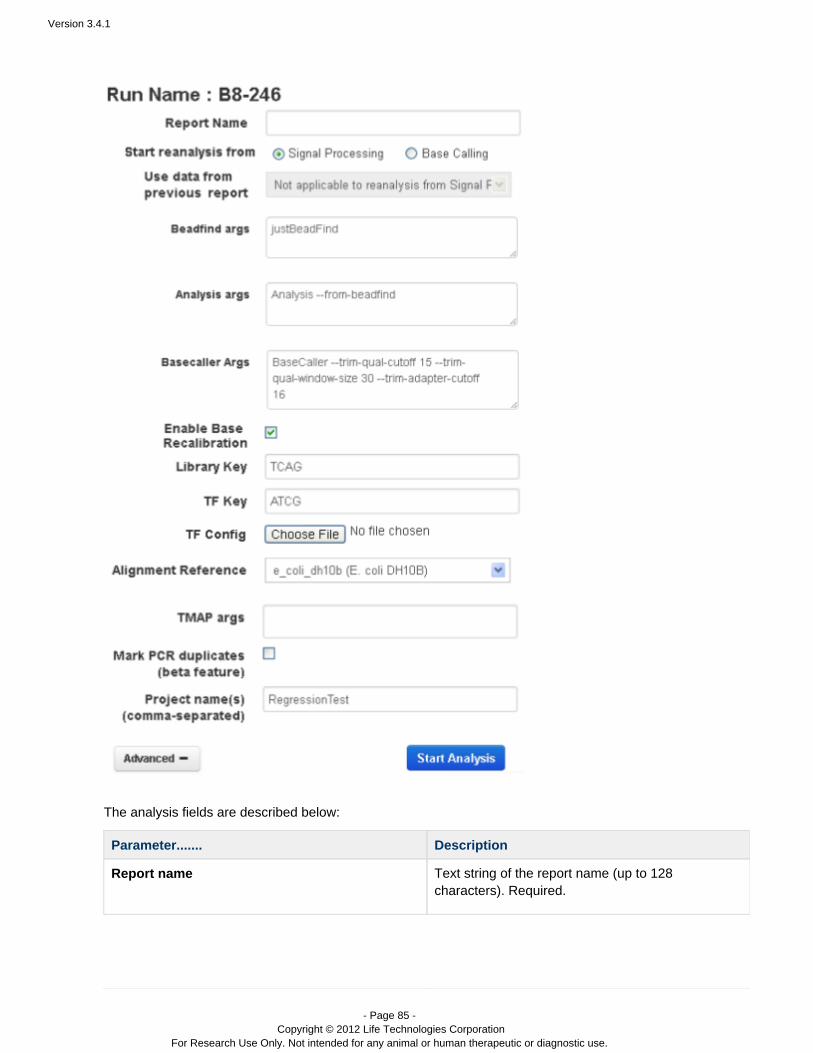
Version 3.4.1
- Page 85 - Copyright © 2012 Life Technologies Corporation
For Research Use Only. Not intended for any animal or human therapeutic or diagnostic use.
1.
The analysis fields are described below:
Parameter....... Description
Report name Text string of the report name (up to 128characters). Required.
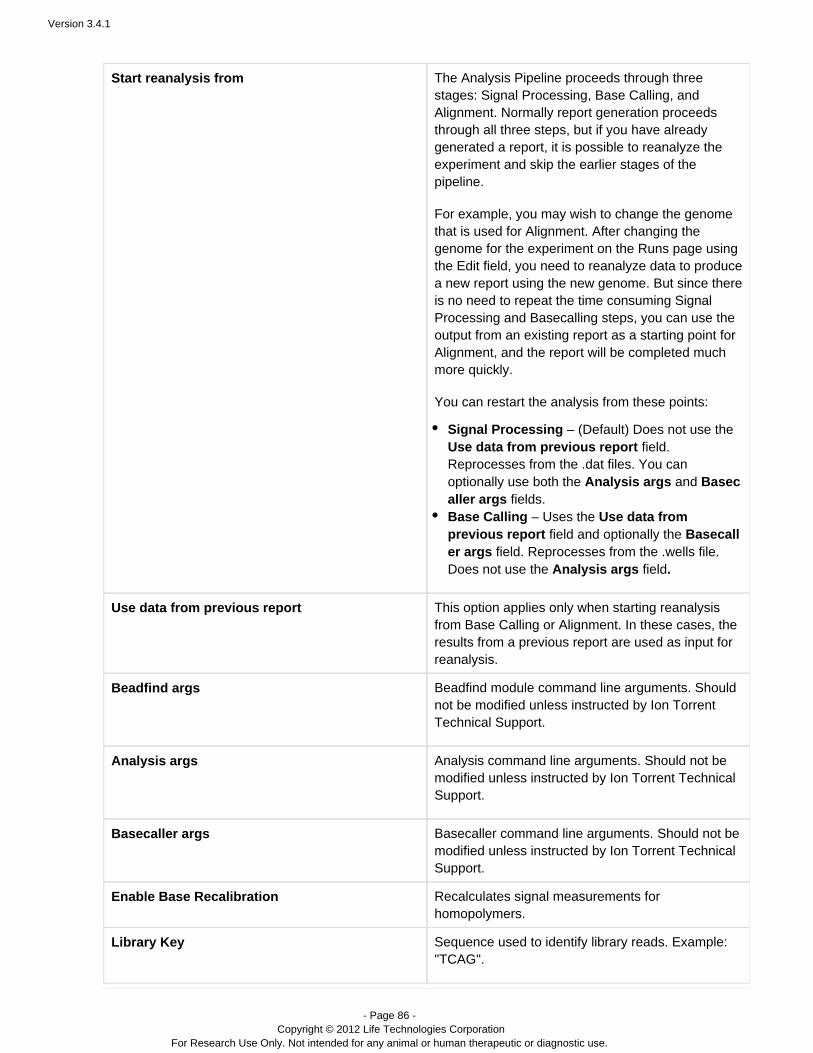
Version 3.4.1
- Page 86 - Copyright © 2012 Life Technologies Corporation
For Research Use Only. Not intended for any animal or human therapeutic or diagnostic use.
1.
Start reanalysis from The Analysis Pipeline proceeds through threestages: Signal Processing, Base Calling, andAlignment. Normally report generation proceedsthrough all three steps, but if you have alreadygenerated a report, it is possible to reanalyze theexperiment and skip the earlier stages of thepipeline.
For example, you may wish to change the genomethat is used for Alignment. After changing thegenome for the experiment on the Runs page usingthe Edit field, you need to reanalyze data to producea new report using the new genome. But since thereis no need to repeat the time consuming SignalProcessing and Basecalling steps, you can use theoutput from an existing report as a starting point forAlignment, and the report will be completed muchmore quickly.
You can restart the analysis from these points:
Signal Processing – (Default) Does not use the field.Use data from previous report
Reprocesses from the .dat files. You canoptionally use both the andAnalysis args Basec
fields.aller argsBase Calling – Uses the Use data fromprevious report field and optionally the Basecaller args field. Reprocesses from the .wells file.Does not use fieldthe Analysis args .
Use data from previous report This option applies only when starting reanalysisfrom Base Calling or Alignment. In these cases, theresults from a previous report are used as input forreanalysis.
Beadfind args Beadfind module command line arguments. Shouldnot be modified unless instructed by Ion TorrentTechnical Support.
Analysis args Analysis command line arguments. Should not bemodified unless instructed by Ion Torrent TechnicalSupport.
Basecaller args Basecaller command line arguments. Should not bemodified unless instructed by Ion Torrent TechnicalSupport.
Enable Base Recalibration Recalculates signal measurements forhomopolymers.
Library Key Sequence used to identify library reads. Example:"TCAG".
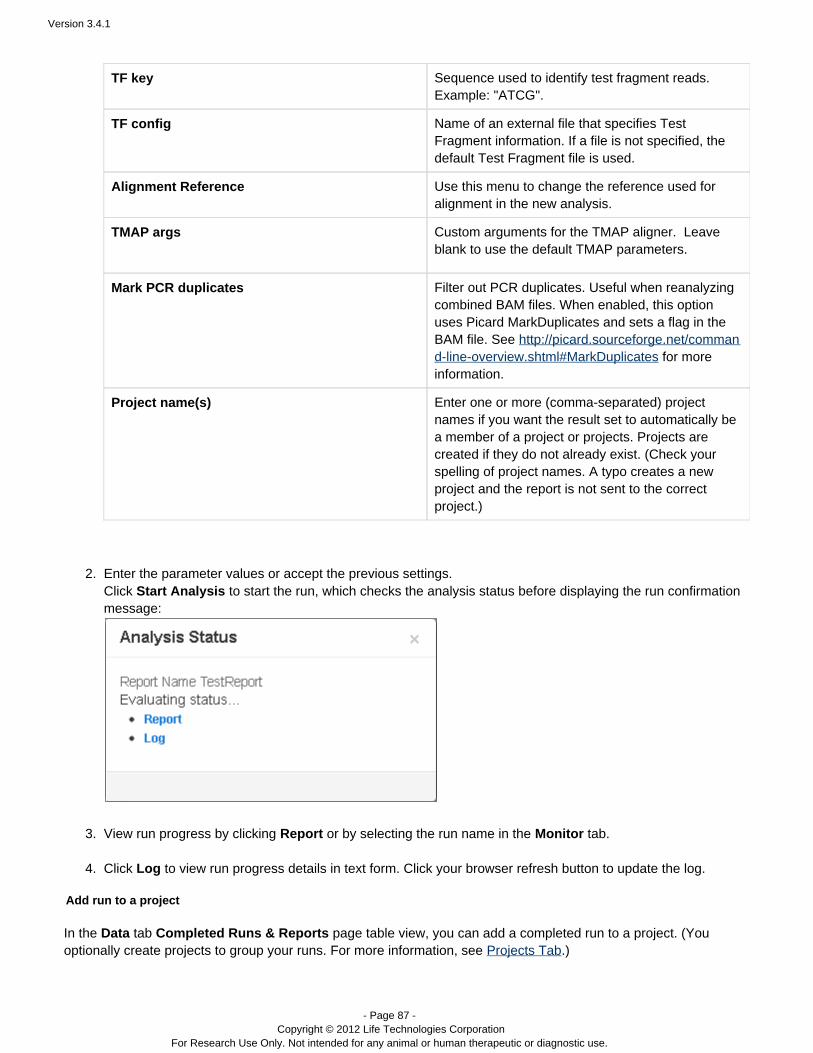
Version 3.4.1
- Page 87 - Copyright © 2012 Life Technologies Corporation
For Research Use Only. Not intended for any animal or human therapeutic or diagnostic use.
1.
2.
3.
4.
TF key Sequence used to identify test fragment reads.Example: "ATCG".
TF config Name of an external file that specifies TestFragment information. If a file is not specified, thedefault Test Fragment file is used.
Alignment Reference Use this menu to change the reference used foralignment in the new analysis.
TMAP args Custom arguments for the TMAP aligner. Leaveblank to use the default TMAP parameters.
Mark PCR duplicates Filter out PCR duplicates. Useful when reanalyzingcombined BAM files. When enabled, this optionuses Picard MarkDuplicates and sets a flag in theBAM file. See http://picard.sourceforge.net/comman
for mored-line-overview.shtml#MarkDuplicatesinformation.
Project name(s) Enter one or more (comma-separated) projectnames if you want the result set to automatically bea member of a project or projects. Projects arecreated if they do not already exist. (Check yourspelling of project names. A typo creates a newproject and the report is not sent to the correctproject.)
Enter the parameter values or accept the previous settings.Click to start the run, which checks the analysis status before displaying the run confirmationStart Analysismessage:
View run progress by clicking or by selecting the run name in the tab.Report Monitor
Click to view run progress details in text form. Click your browser refresh button to update the log.Log
Add run to a project
In the tab page table view, you can add a completed run to a project. (YouData Completed Runs & Reportsoptionally create projects to group your runs. For more information, see Projects Tab.)
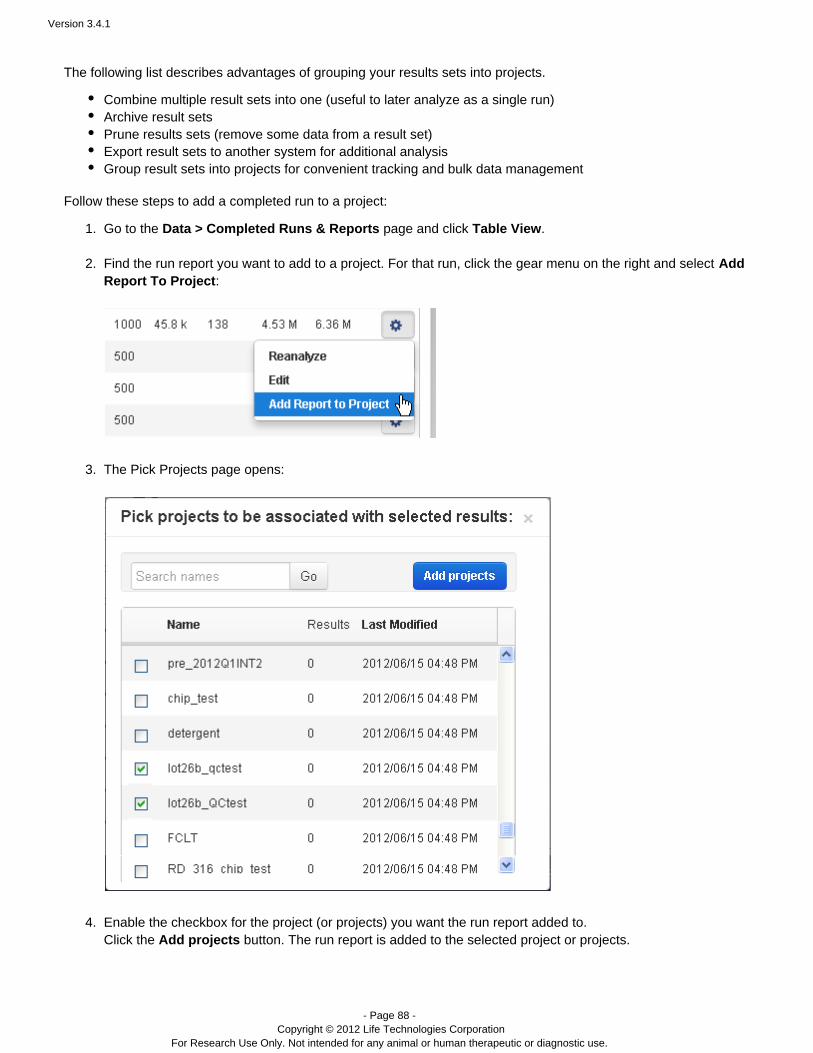
Version 3.4.1
- Page 88 - Copyright © 2012 Life Technologies Corporation
For Research Use Only. Not intended for any animal or human therapeutic or diagnostic use.
1.
2.
3.
4.
The following list describes advantages of grouping your results sets into projects.
Combine multiple result sets into one (useful to later analyze as a single run)Archive result setsPrune results sets (remove some data from a result set)Export result sets to another system for additional analysisGroup result sets into projects for convenient tracking and bulk data management
Follow these steps to add a completed run to a project:
Go to the page and click .Data > Completed Runs & Reports Table View
Find the run report you want to add to a project. For that run, click the gear menu on the right and select Add:Report To Project
The Pick Projects page opens:
Enable the checkbox for the project (or projects) you want the run report added to.Click the button. The run report is added to the selected project or projects.Add projects

Version 3.4.1
- Page 89 - Copyright © 2012 Life Technologies Corporation
For Research Use Only. Not intended for any animal or human therapeutic or diagnostic use.
1.
2.
3.
Terminate an analysis run
To terminate a run that has not yet completed, go to the option in the Admin menu and click toServices Terminatethe right of the run name. (See also: , under )Terminate an Analysis Run Use Cases
Change the analysis reference
Use the following procedure to change the reference for an analysis:
Follow the instructions in to open the Reanalyze a run run analysis dialog advanced options.
Use the Alignment Reference menu to select the new reference:
Follow the instructions in Reanalyze a run to save your selection and to redo the analysis.
Change run metadata
The Completed Runs & Reports edit option allows you to change the metadata for a run, for example, to add a noteor to correct the following run metadata:
Sample nameApplication type (run type)Reference nameDNA barcode set (index)Library kitSequencing kit Chip identifying barcodeLibrary key3' adapter
You must restart or re-analyze your run for these changes to take effect.
When you change the metadata, you change the information in the run database. Because the analysispipeline is initialized with the run database information at the time that an analysis starts, changingmetadata does not affect an analysis that is in progress.
For a running analysis, you must terminate the run and start analysis manually.For a completed analysis, you must re-analyze the run.
Points to know about changing metadata:
The run report (in the tab) always shows the metadata in effect for the run. If yourCompleted Runs & Reports

Version 3.4.1
- Page 90 - Copyright © 2012 Life Technologies Corporation
For Research Use Only. Not intended for any animal or human therapeutic or diagnostic use.
changes are not shown in the run report, the changes were not in place at the time the report was generated.If you add or change an entry in the Notes field, that note does not appear in the run report unless you restartor re-analyze the run (even though the note does not affect the analysis results).
The Edit Run page
The Edit options open the Edit Run page:
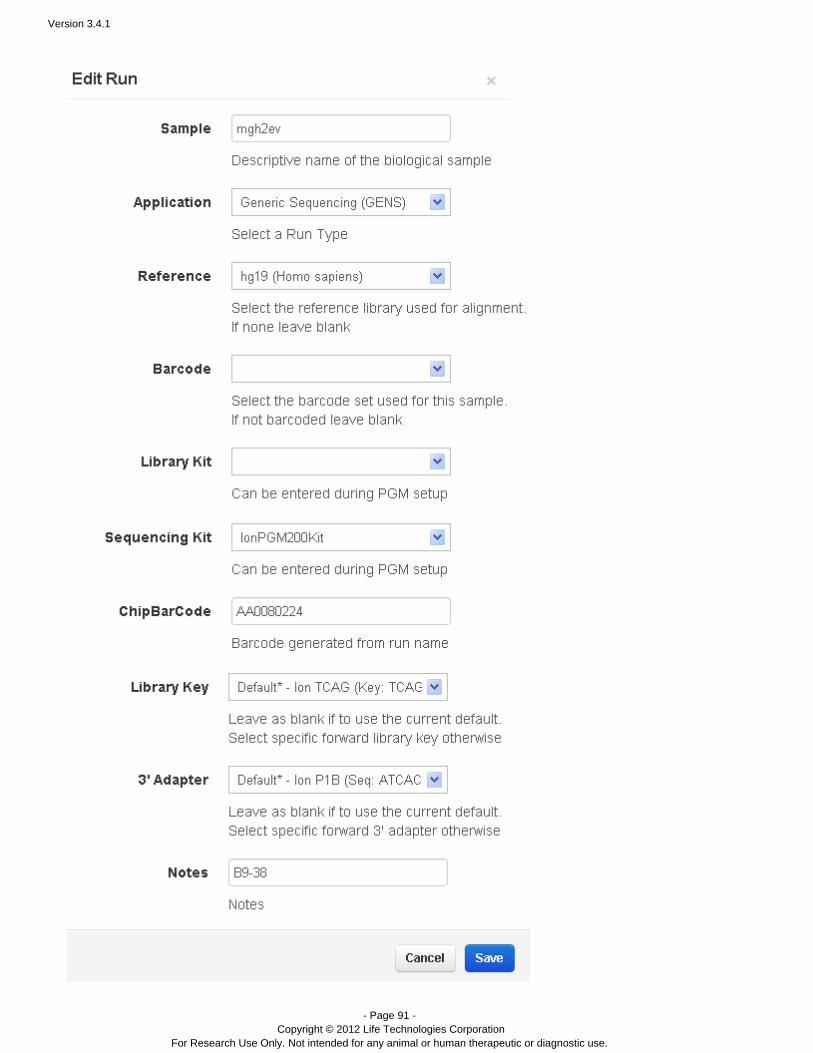
Version 3.4.1
- Page 91 - Copyright © 2012 Life Technologies Corporation
For Research Use Only. Not intended for any animal or human therapeutic or diagnostic use.
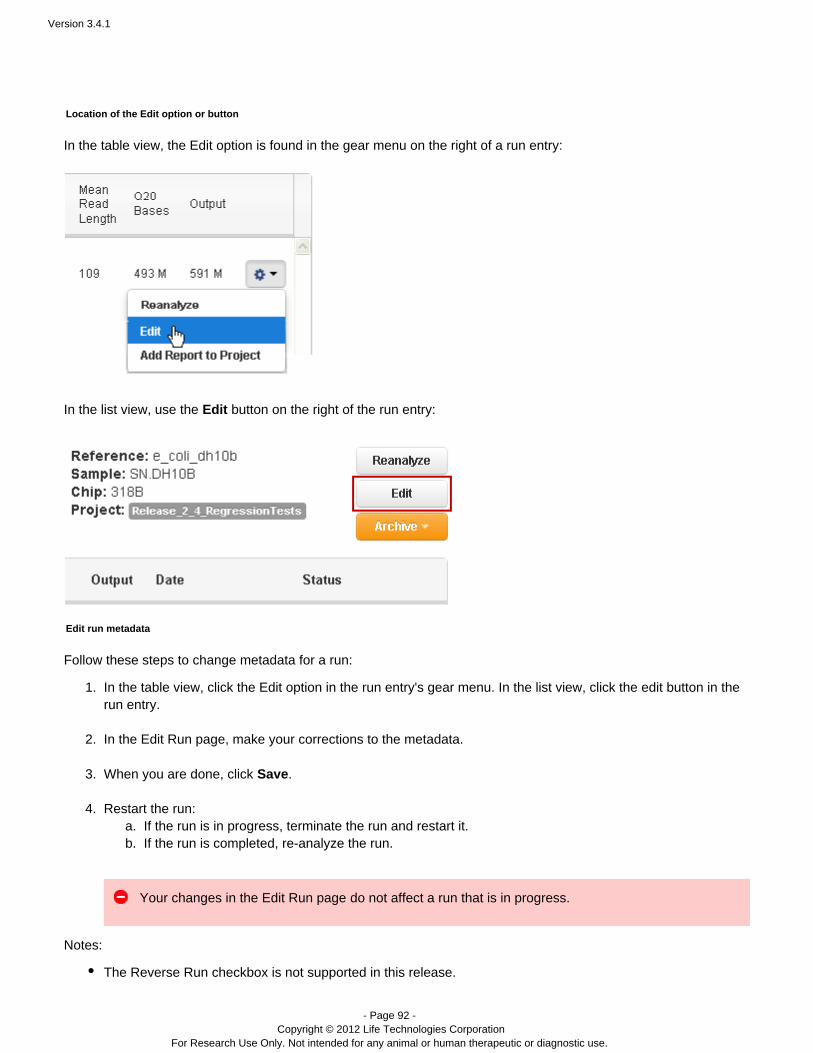
Version 3.4.1
- Page 92 - Copyright © 2012 Life Technologies Corporation
For Research Use Only. Not intended for any animal or human therapeutic or diagnostic use.
1.
2.
3.
4. a. b.
Location of the Edit option or button
In the table view, the Edit option is found in the gear menu on the right of a run entry:
In the list view, use the button on the right of the run entry:Edit
Edit run metadata
Follow these steps to change metadata for a run:
In the table view, click the Edit option in the run entry's gear menu. In the list view, click the edit button in therun entry. In the Edit Run page, make your corrections to the metadata. When you are done, click .Save Restart the run:
If the run is in progress, terminate the run and restart it.If the run is completed, re-analyze the run.
Your changes i do not affect a run that is in progress.n the Edit Run page
Notes:
The Reverse Run checkbox is not supported in this release.
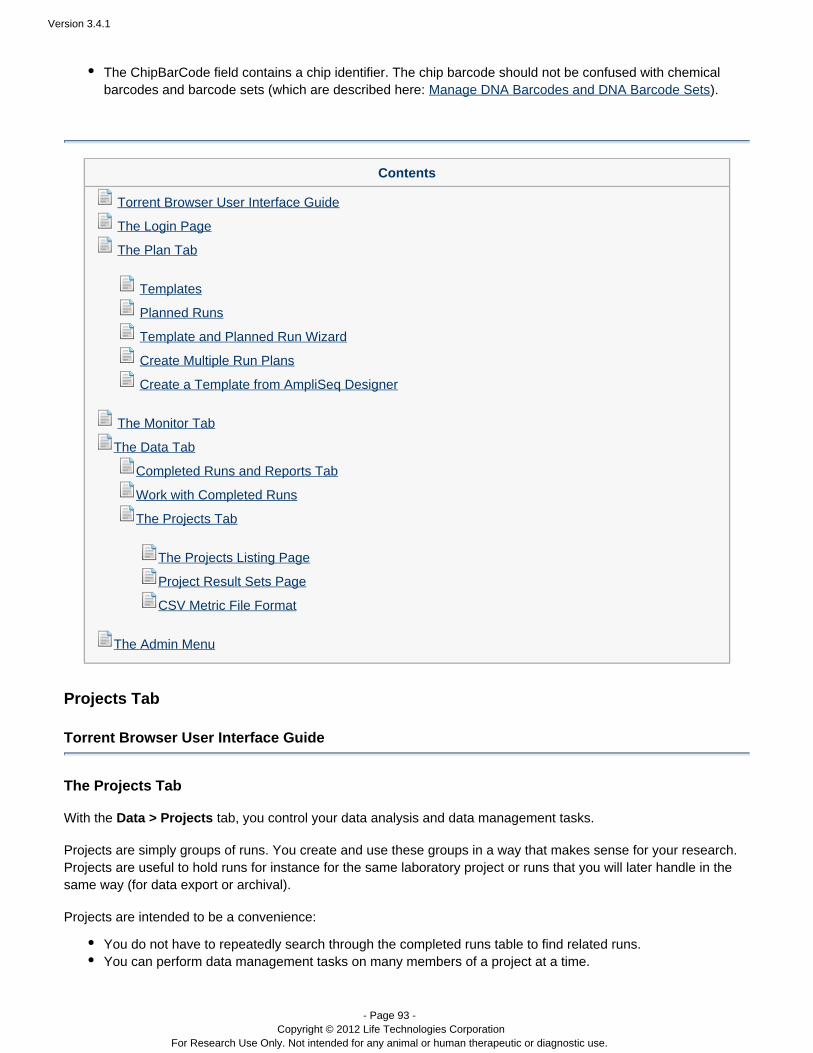
Version 3.4.1
- Page 93 - Copyright © 2012 Life Technologies Corporation
For Research Use Only. Not intended for any animal or human therapeutic or diagnostic use.
The ChipBarCode field contains a chip identifier. The chip barcode should not be confused with chemicalbarcodes and barcode sets (which are described here: ).Manage DNA Barcodes and DNA Barcode Sets
Contents
Torrent Browser User Interface Guide
The Login Page
The Plan Tab
Templates
Planned Runs
Template and Planned Run Wizard
Create Multiple Run Plans
Create a Template from AmpliSeq Designer
The Monitor Tab
The Data Tab
Completed Runs and Reports Tab
Work with Completed Runs
The Projects Tab
The Projects Listing Page
Project Result Sets Page
CSV Metric File Format
The Admin Menu
Projects Tab
Torrent Browser User Interface Guide
The Projects Tab
With the tab, you control your data analysis and data management tasks.Data > Projects
Projects are simply groups of runs. You create and use these groups in a way that makes sense for your research.Projects are useful to hold runs for instance for the same laboratory project or runs that you will later handle in thesame way (for data export or archival).
Projects are intended to be a convenience:
You do not have to repeatedly search through the completed runs table to find related runs.You can perform data management tasks on many members of a project at a time.
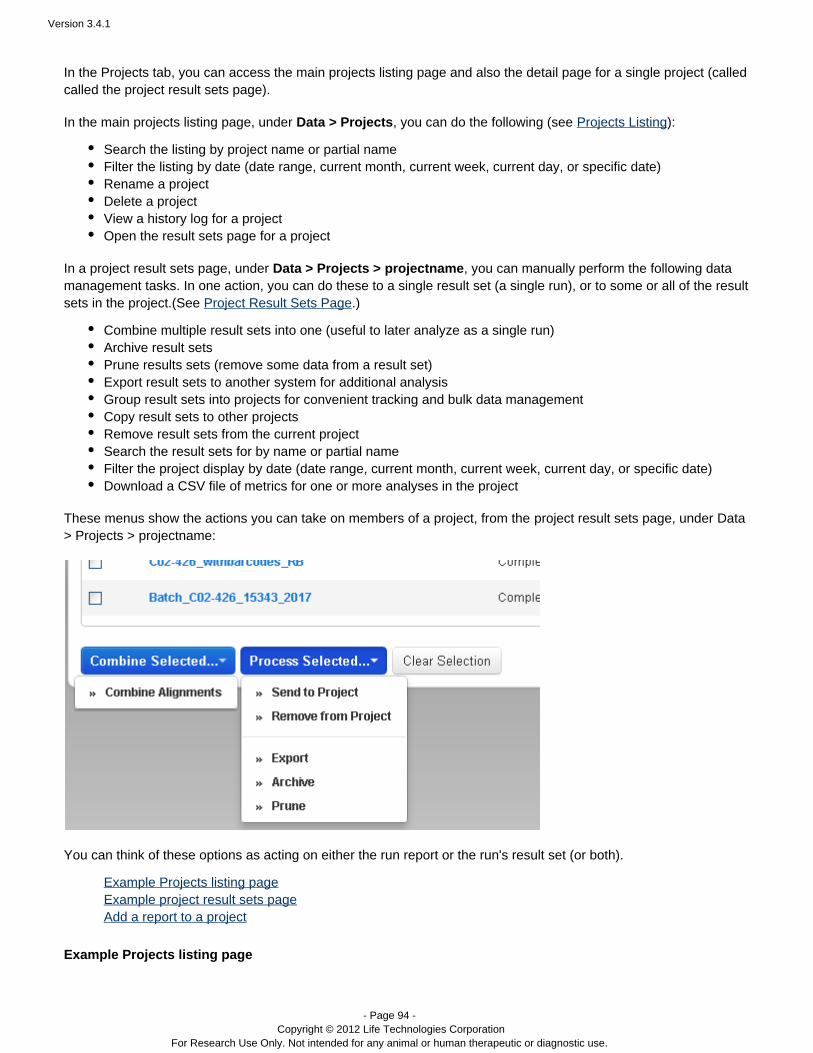
Version 3.4.1
- Page 94 - Copyright © 2012 Life Technologies Corporation
For Research Use Only. Not intended for any animal or human therapeutic or diagnostic use.
In the Projects tab, you can access the main projects listing page and also the detail page for a single project (calledcalled the project result sets page).
In the main projects listing page, under , you can do the following (see ):Data > Projects Projects Listing
Search the listing by project name or partial nameFilter the listing by date (date range, current month, current week, current day, or specific date)Rename a projectDelete a projectView a history log for a projectOpen the result sets page for a project
In a , yproject result sets page, under Data > Projects > projectname ou can manually perform the following datamanagement tasks. In one action, you can do these to a single result set (a single run), or to some or all of the resultsets in the project.(See .)Project Result Sets Page
Combine multiple result sets into one (useful to later analyze as a single run)Archive result setsPrune results sets (remove some data from a result set)Export result sets to another system for additional analysisGroup result sets into projects for convenient tracking and bulk data managementCopy result sets to other projectsRemove result sets from the current projectSearch the result sets for by name or partial nameFilter the project display by date (date range, current month, current week, current day, or specific date)Download a CSV file of metrics for one or more analyses in the project
These menus show the actions you can take on members of a project, from the project result sets page, under Data:> Projects > projectname
You can think of these options as acting on either the run report or the run's result set (or both).
Example Projects listing pageExample project result sets pageAdd a report to a project
Example Projects listing page
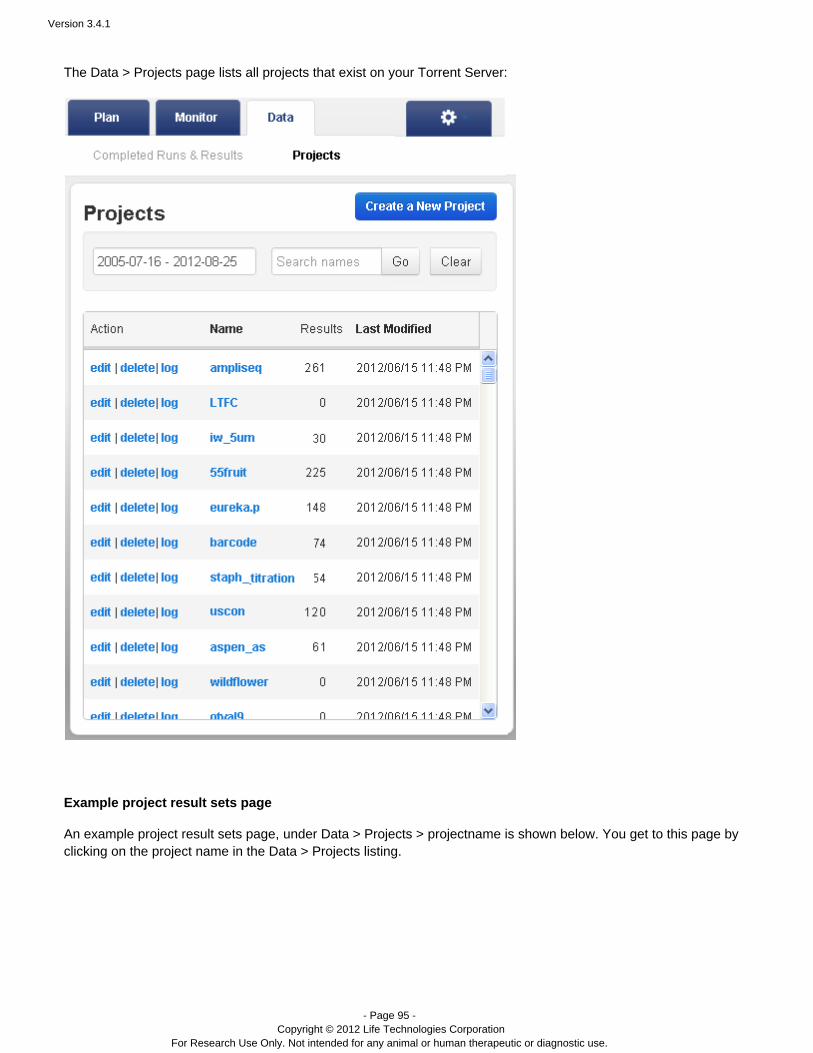
Version 3.4.1
- Page 95 - Copyright © 2012 Life Technologies Corporation
For Research Use Only. Not intended for any animal or human therapeutic or diagnostic use.
The Data > Projects page lists all projects that exist on your Torrent Server:
Example project result sets page
An example project result sets page, is shown below. You get to this page byunder Data > Projects > projectnameclicking on the project name in the Data > Projects listing.
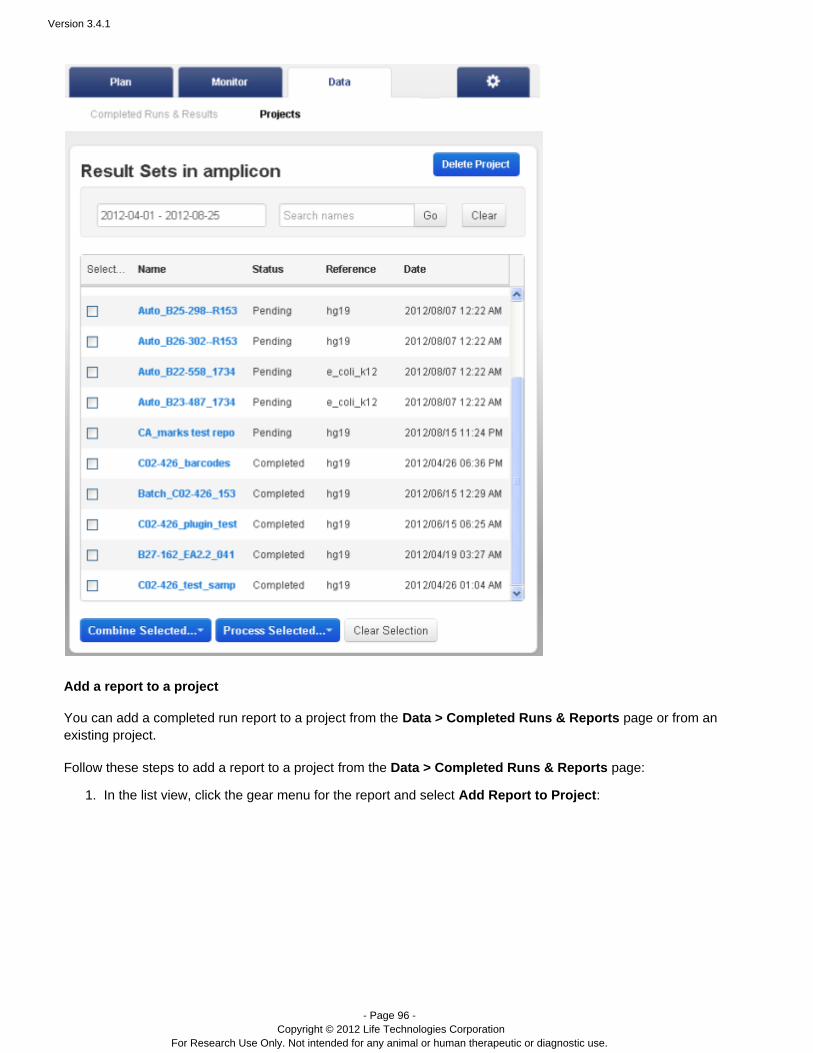
Version 3.4.1
- Page 96 - Copyright © 2012 Life Technologies Corporation
For Research Use Only. Not intended for any animal or human therapeutic or diagnostic use.
1.
Add a report to a project
You can add a completed run report to a project from the page or from anData > Completed Runs & Reportsexisting project.
Follow these steps to add a report to a project from the Data > Completed Runs & Reports page:
In the list view, click the gear menu for the report and select :Add Report to Project
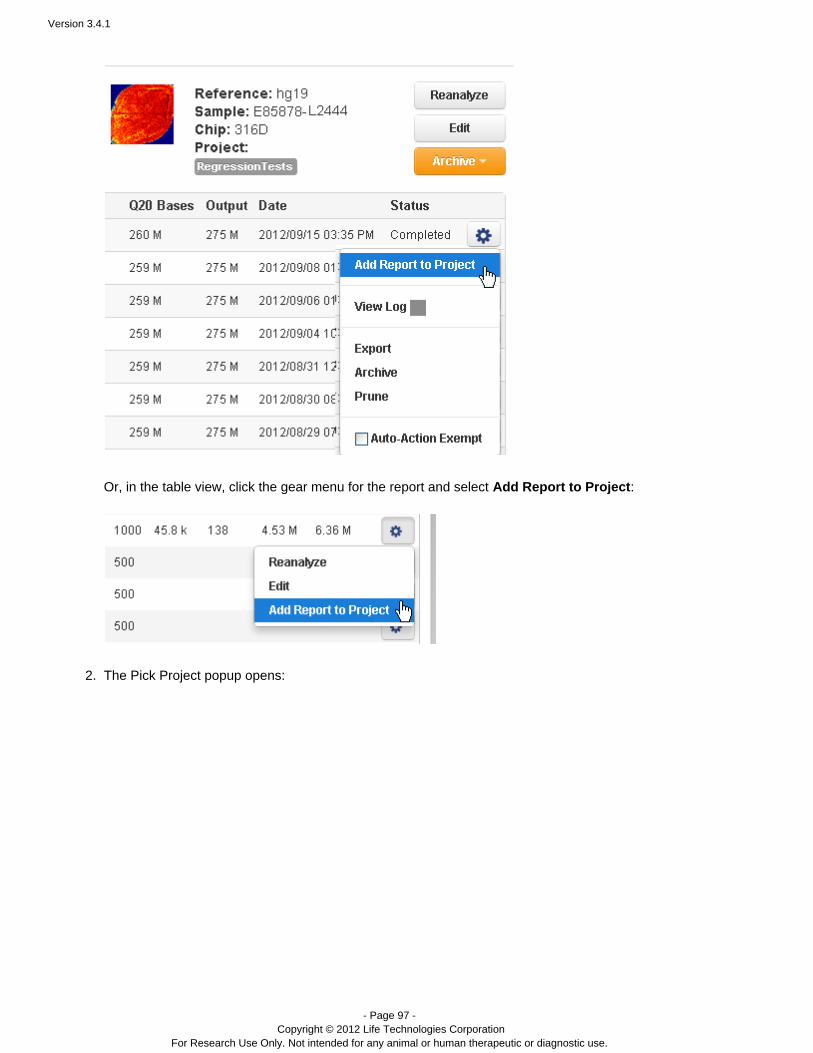
Version 3.4.1
- Page 97 - Copyright © 2012 Life Technologies Corporation
For Research Use Only. Not intended for any animal or human therapeutic or diagnostic use.
1.
2.
Or, in the table view, click the gear menu for the report and select :Add Report to Project
The Pick Project popup opens:
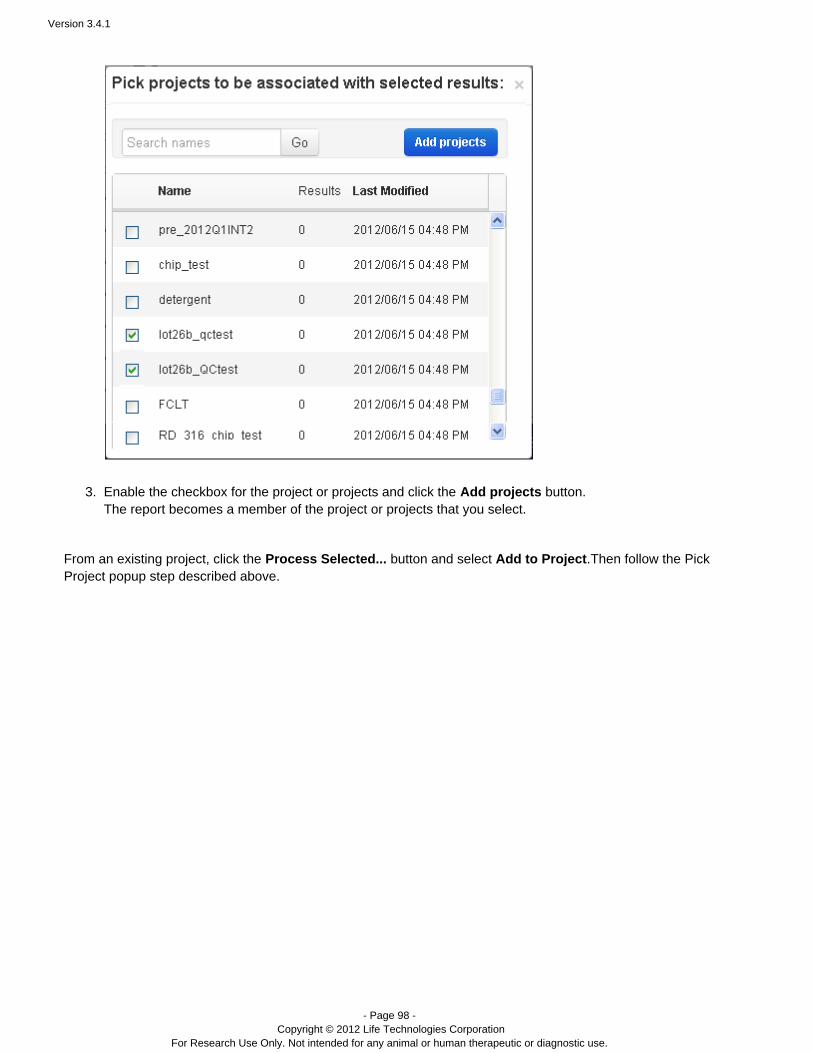
Version 3.4.1
- Page 98 - Copyright © 2012 Life Technologies Corporation
For Research Use Only. Not intended for any animal or human therapeutic or diagnostic use.
2.
3. Enable the checkbox for the project or projects and click the button. Add projectsThe report becomes a member of the project or projects that you select.
From an existing project, click the button and select .Then follow the Process Selected... Add to Project PickProject popup step described above.
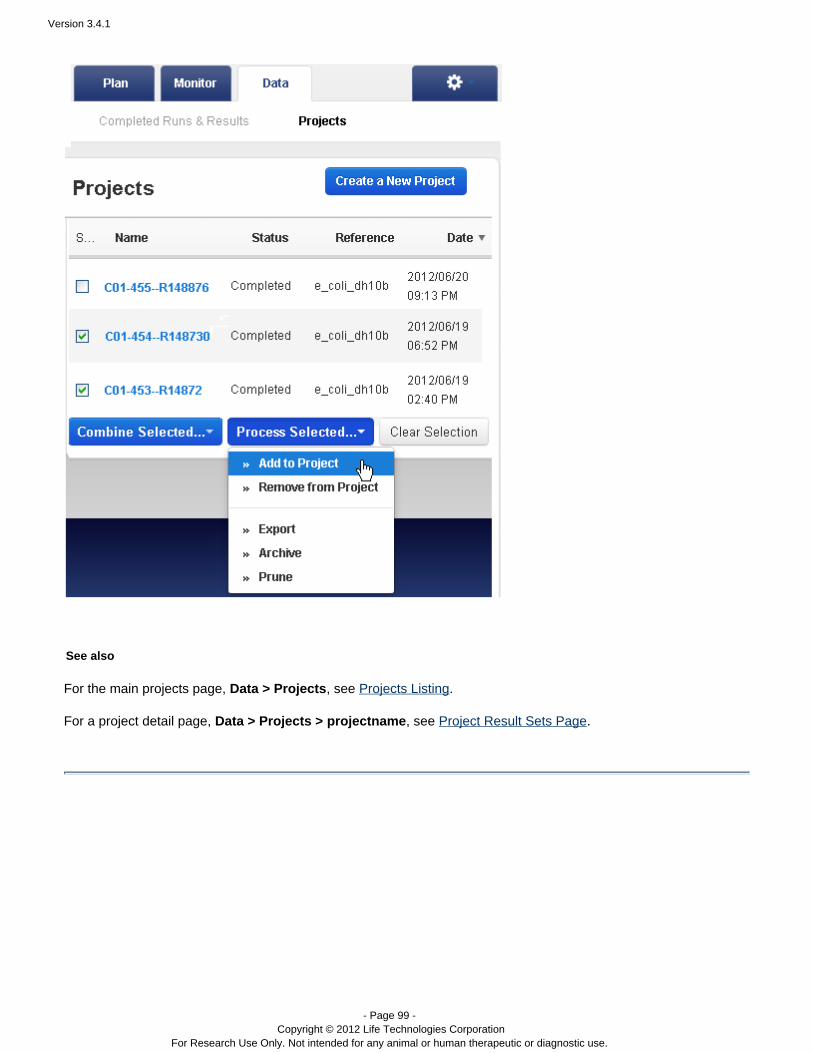
Version 3.4.1
- Page 99 - Copyright © 2012 Life Technologies Corporation
For Research Use Only. Not intended for any animal or human therapeutic or diagnostic use.
See also
For the main projects page, , see .Data > Projects Projects Listing
For a project detail page, , sData > Projects > projectname ee Project Result Sets Page.

Version 3.4.1
- Page 100 - Copyright © 2012 Life Technologies Corporation
For Research Use Only. Not intended for any animal or human therapeutic or diagnostic use.
Contents
Torrent Browser User Interface Guide
The Login Page
The Plan Tab
Templates
Planned Runs
Template and Planned Run Wizard
Create Multiple Run Plans
Create a Template from AmpliSeq Designer
The Monitor Tab
The Data Tab
Completed Runs and Reports Tab
Work with Completed Runs
The Projects Tab
The Projects Listing Page
Project Result Sets Page
CSV Metric File Format
The Admin Menu
Projects Listing
Torrent Browser User Interface Guide
The Projects Listing Page
The page On the project listing page, you can doData > Projects lists all projects that exist on your Torrent Server. the following:
Open the result sets page for a project (click on the project name)

Version 3.4.1
- Page 101 - Copyright © 2012 Life Technologies Corporation
For Research Use Only. Not intended for any animal or human therapeutic or diagnostic use.
Create a new empty projectRename a projectDelete a projectView a history log for a projectSearch the listing by a project name or partial nameFilter the listing by date (date range, current month, current week, current day, or specific date)Sort the projects listing by Name or Last Modified
See also for a description of a single project.Project Result Sets page
Example Projects listing pageOpen project detailsRename a projectDelete a projectView project historySortSearchFilter by date
Example project result sets page
Example Projects listing page
The Data > Projects page lists all projects that exist on your Torrent Server:
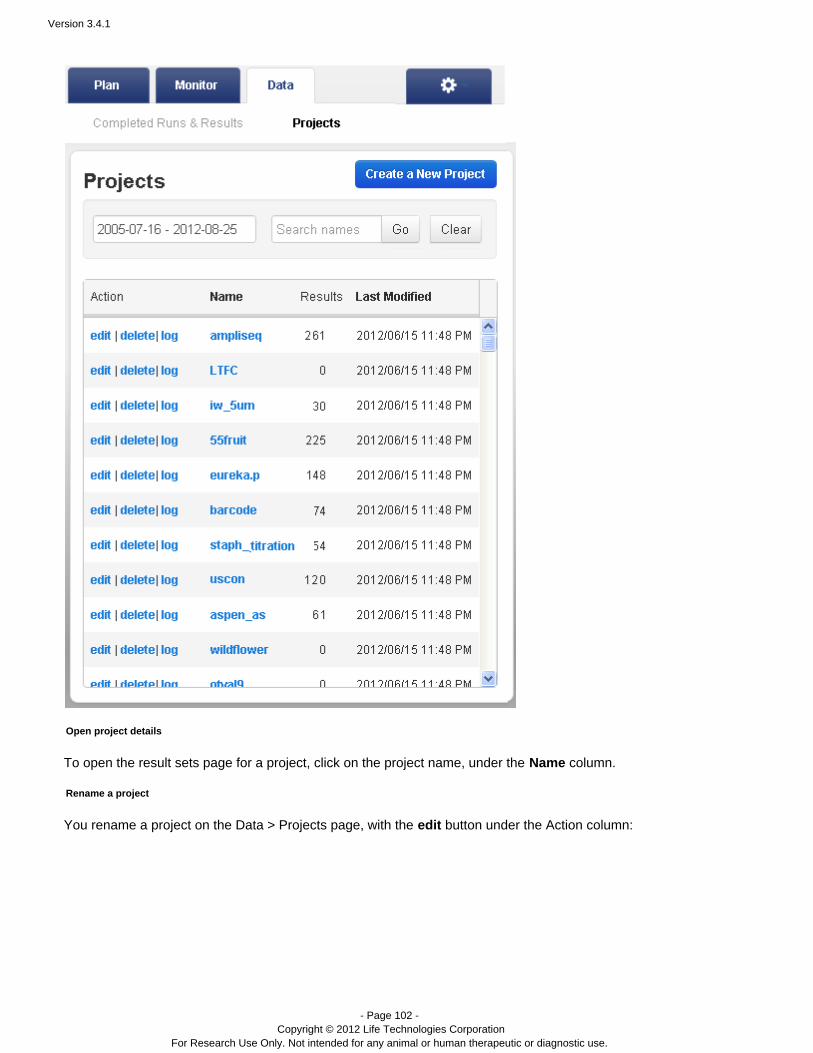
Version 3.4.1
- Page 102 - Copyright © 2012 Life Technologies Corporation
For Research Use Only. Not intended for any animal or human therapeutic or diagnostic use.
Open project details
To open the result sets page for a project, click on the project name, under the column.Name
Rename a project
You rename a project on the Data > Projects page, with the edit button under the Action column:

Version 3.4.1
- Page 103 - Copyright © 2012 Life Technologies Corporation
For Research Use Only. Not intended for any animal or human therapeutic or diagnostic use.
A dialog opens for you to enter the new name:
You cannot use the name of a project that already exists. However, case differences matter: you can have both aproject named "ExampleProject" and one named "exampleProject".
Delete a project
You delete a project from the either the project's details page or the Data > Projects page.
On the , Data > Projects page use the button under the Action column:delete
On a use the button:project's details page, Delete Project

Version 3.4.1
- Page 104 - Copyright © 2012 Life Technologies Corporation
For Research Use Only. Not intended for any animal or human therapeutic or diagnostic use.
A confirmation dialog appears:
Be sure before you press the button. There is no undo.Yes, Delete
Deleting a project does not delete the run reports that were members of the project.
View project history
On the Data > Projects page, use the button under the Action column to open the history log for that project.Log
Sort
Sort the projects listing by the Name or Last Modified columns. Click a column heading in bold type to sort the
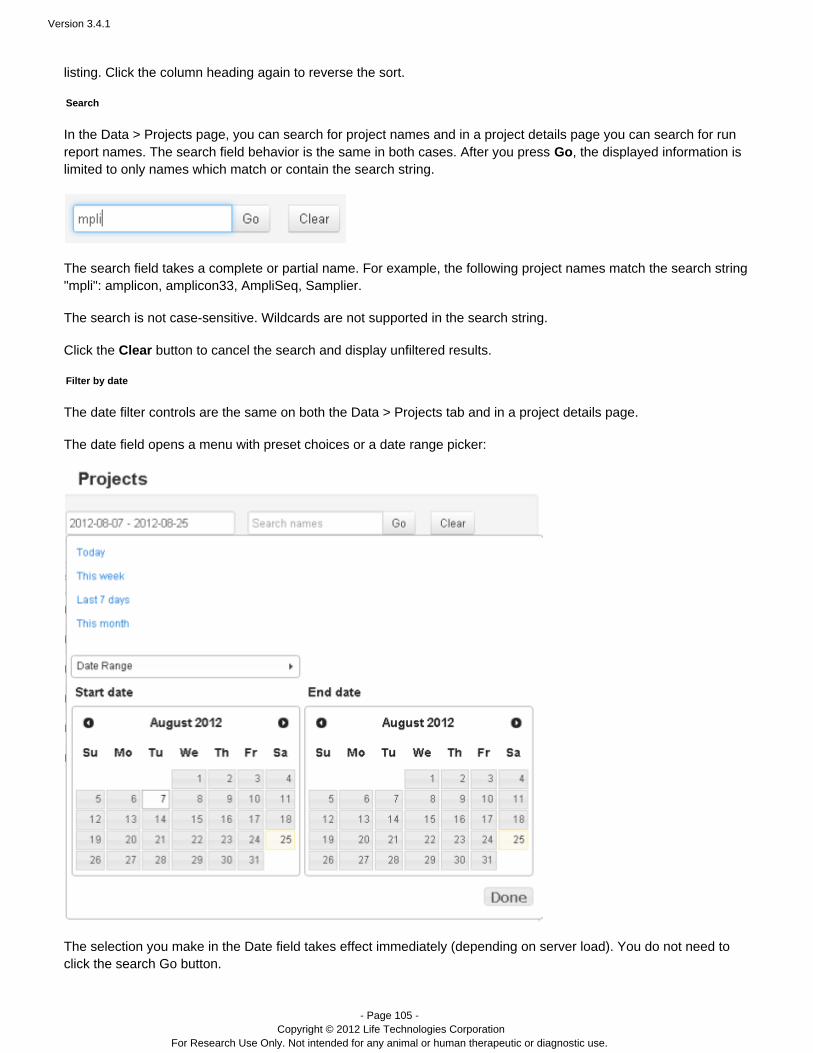
Version 3.4.1
- Page 105 - Copyright © 2012 Life Technologies Corporation
For Research Use Only. Not intended for any animal or human therapeutic or diagnostic use.
listing. Click the column heading again to reverse the sort.
Search
In the Data > Projects page, you can search for project names and in a project details page you can search for runreport names. The search field behavior is the same in both cases. After you press , the displayed information isGolimited to only names which match or contain the search string.
The search field takes a complete or partial name. For example, the following project names match the search string"mpli": amplicon, amplicon33, AmpliSeq, Samplier.
The search is not case-sensitive. Wildcards are not supported in the search string.
Click the button to cancel the search and display unfiltered results.Clear
Filter by date
The date filter controls are the same on both the Data > Projects tab and in a project details page.
The date field opens a menu with preset choices or a date range picker:
The selection you make in the Date field takes effect immediately (depending on server load). You do not need toclick the search Go button.
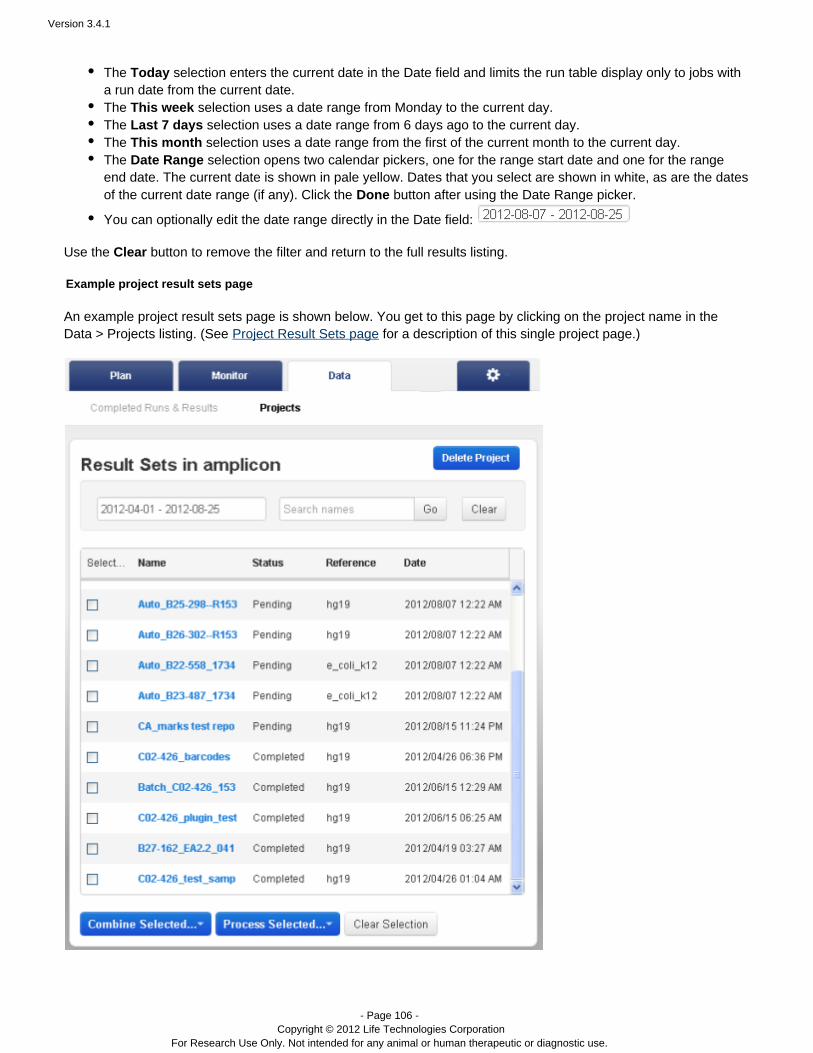
Version 3.4.1
- Page 106 - Copyright © 2012 Life Technologies Corporation
For Research Use Only. Not intended for any animal or human therapeutic or diagnostic use.
The selection enters the current date in the Date field and limits the run table display only to jobs withTodaya run date from the current date.The selection uses a date range from Monday to the current day.This weekThe selection uses a date range from 6 days ago to the current day.Last 7 daysThe selection uses a date range from the first of the current month to the current day.This month The selection opens two calendar pickers, one for the range start date and one for the rangeDate Rangeend date. The current date is shown in pale yellow. Dates that you select are shown in white, as are the datesof the current date range (if any). Click the button after using the Date Range picker.Done
You can optionally edit the date range directly in the Date field:
Use the Clear button to remove the filter and return to the full results listing.
Example project result sets page
An example project result sets page is shown below. You get to this page by clicking on the project name in theData > Projects listing. (See Project Result Sets page for a description of this single project page.)

Version 3.4.1
- Page 107 - Copyright © 2012 Life Technologies Corporation
For Research Use Only. Not intended for any animal or human therapeutic or diagnostic use.
Contents
Torrent Browser User Interface Guide
The Login Page
The Plan Tab
Templates
Planned Runs
Template and Planned Run Wizard
Create Multiple Run Plans
Create a Template from AmpliSeq Designer
The Monitor Tab
The Data Tab
Completed Runs and Reports Tab
Work with Completed Runs
The Projects Tab
The Projects Listing Page
Project Result Sets Page
CSV Metric File Format
The Admin Menu
Project Result Sets Page
Version 3.4.1
- Page 108 - Copyright © 2012 Life Technologies Corporation
For Research Use Only. Not intended for any animal or human therapeutic or diagnostic use.
Torrent Browser User Interface Guide
A Project Result Sets Page
The project details page lists the result sets for a single project. You reach this page by clicking on the project namein the tab.Data > Projects
Projects are simply groups of runs that you create and use in a way that makes sense for your lab environment andyour research.
In a project's detail page, you can manually perform these data management tasks:
Combine multiple result sets into one (useful to later analyze as a single run).Archive result setsPrune results sets (remove some data from a result set)Export result sets to another system for additional analysisGroup result sets into projects for convenient tracking and bulk data managementDownload a CSV file of metrics for one or more analyses in the project
Example project result sets pageDownload a CSV file of metricsProject menus and actions
Actions on members of a projectCombine AlignmentsAdd to ProjectRemove from ProjectExportArchivePrune
SearchFilter by dateSortDelete a project
For instead a description of run report contents, see the .Torrent Browser Analysis Report Guide
Example project result sets page
An example project result sets page is shown below. You reach this page by clicking on the project name in theData > Projects listing.
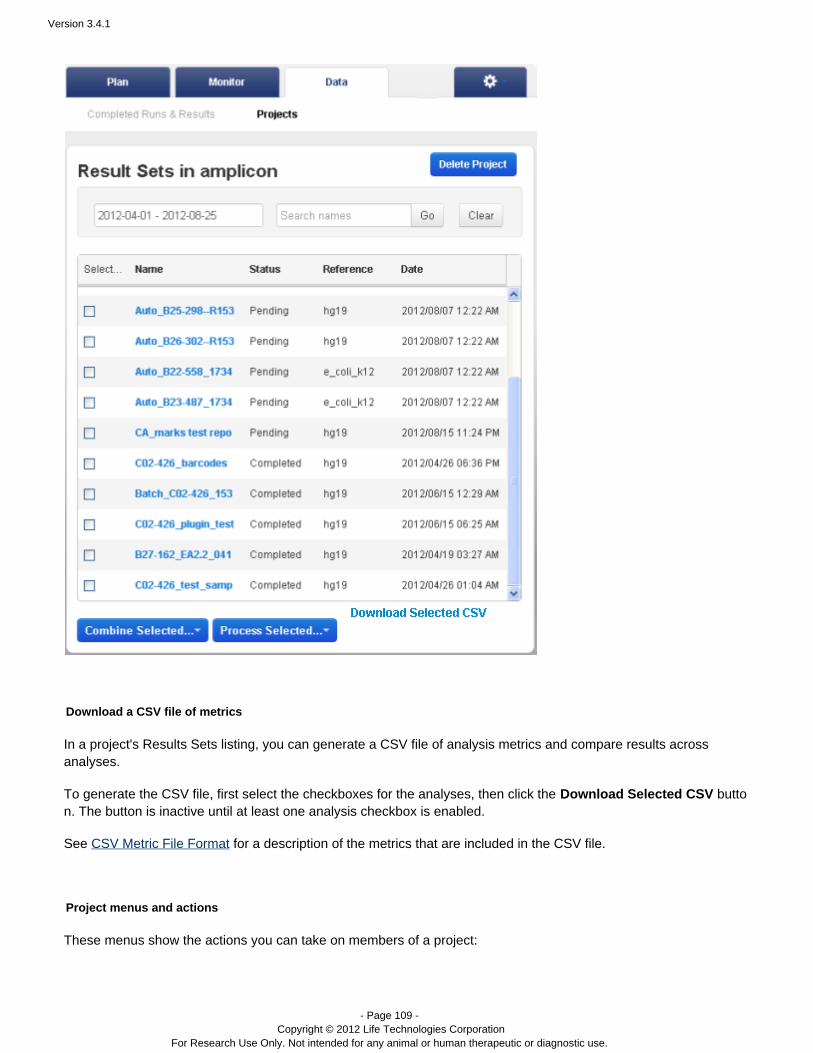
Version 3.4.1
- Page 109 - Copyright © 2012 Life Technologies Corporation
For Research Use Only. Not intended for any animal or human therapeutic or diagnostic use.
Download a CSV file of metrics
In a project's Results Sets listing, you can generate a CSV file of analysis metrics and compare results acrossanalyses.
To generate the CSV file, first select the checkboxes for the analyses, then click the buttoDownload Selected CSVn. The button is inactive until at least one analysis checkbox is enabled.
See for a description of the metrics that are included in the CSV file.CSV Metric File Format
Project menus and actions
These menus show the actions you can take on members of a project:
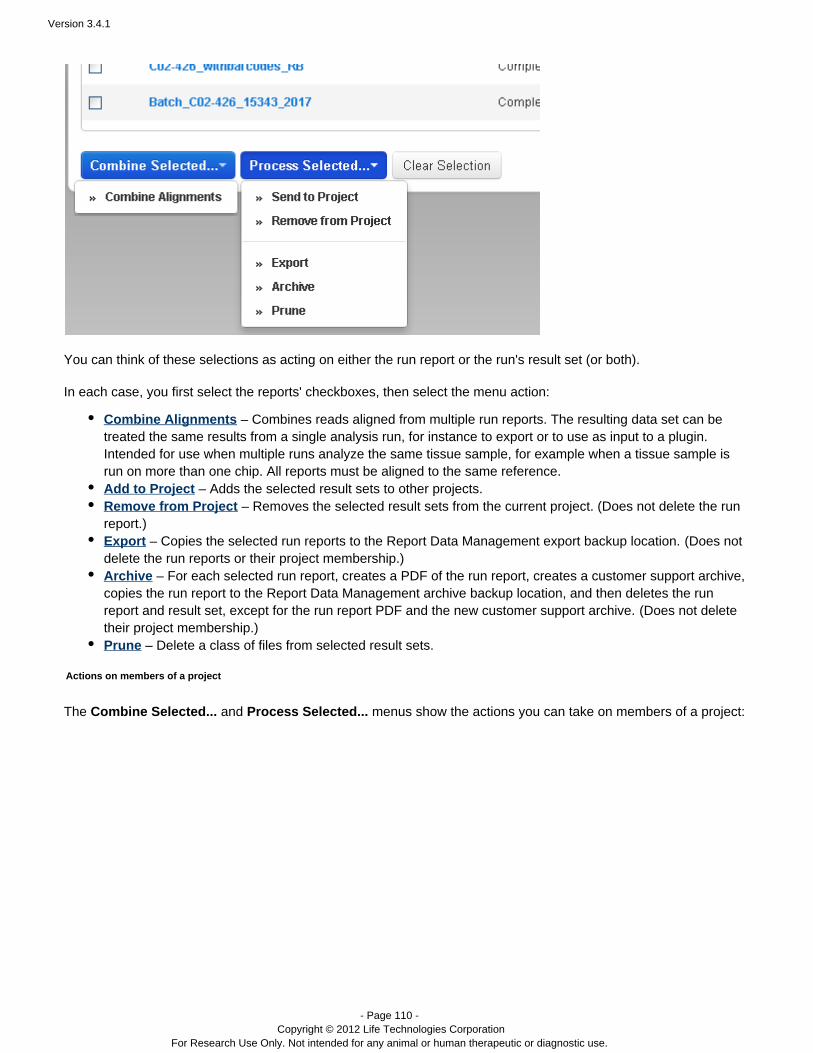
Version 3.4.1
- Page 110 - Copyright © 2012 Life Technologies Corporation
For Research Use Only. Not intended for any animal or human therapeutic or diagnostic use.
You can think of these selections as acting on either the run report or the run's result set (or both).
In each case, you first select the reports' checkboxes, then select the menu action:
Combine Alignments – Combines reads aligned from multiple run reports. The resulting data set can betreated the same results from a single analysis run, for instance to export or to use as input to a plugin.Intended for use when multiple runs analyze the same tissue sample, for example when a tissue sample isrun on more than one chip. All reports must be aligned to the same reference.Add to Project – Adds the selected result sets to other projects.
Remove from Project – Removes the selected result sets from the current project. (Does not delete the runreport.)Export – Copies the selected run reports to the Report Data Management export backup location. (Does notdelete the run reports or their project membership.)Archive – For each selected run report, creates a PDF of the run report, creates a customer support archive,copies the run report to the Report Data Management archive backup location, and then deletes the runreport and result set, except for the run report PDF and the new customer support archive. (Does not deletetheir project membership.)Prune – Delete a class of files from selected result sets.
Actions on members of a project
The and menus show the actions you can take on members of a project:Combine Selected... Process Selected...
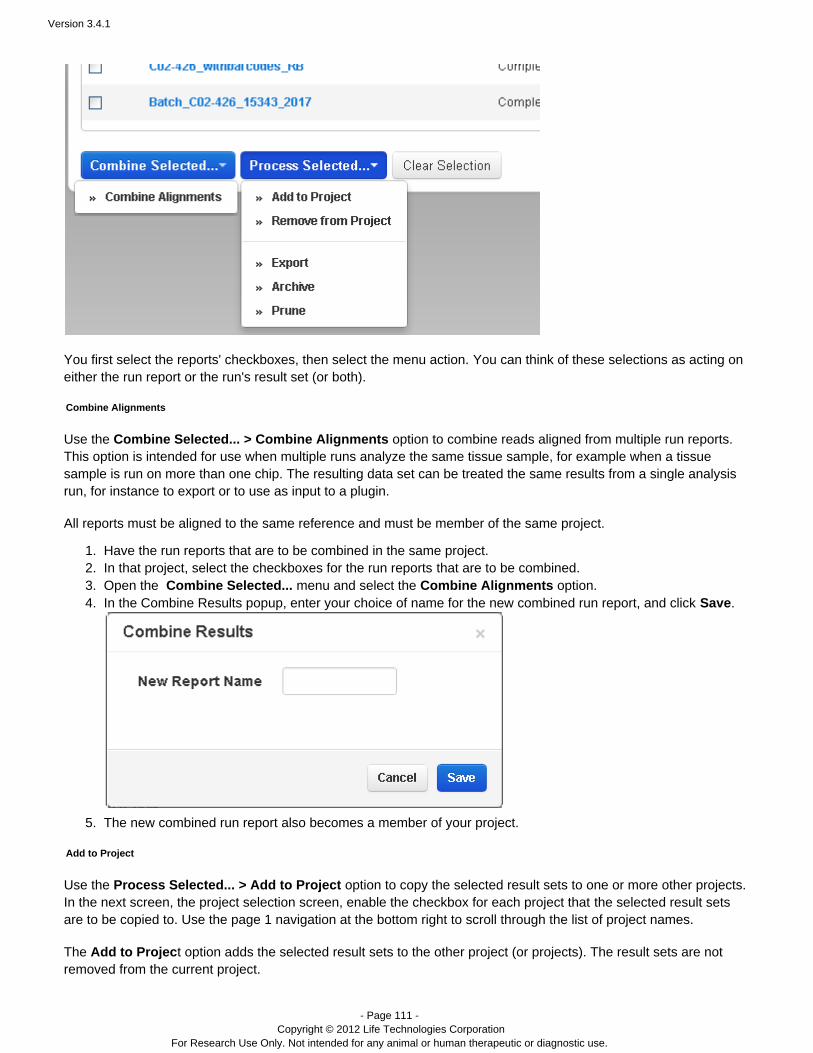
Version 3.4.1
- Page 111 - Copyright © 2012 Life Technologies Corporation
For Research Use Only. Not intended for any animal or human therapeutic or diagnostic use.
1. 2. 3. 4.
5.
You first select the reports' checkboxes, then select the menu action. You can think of these selections as acting oneither the run report or the run's result set (or both).
Combine Alignments
Use the combine reads aligned from multiple run reports.Combine Selected... option to > Combine AlignmentsThis option is intended for use when multiple runs analyze the same tissue sample, for example when a tissuesample is run on more than one chip. The resulting data set can be treated the same results from a single analysisrun, for instance to export or to use as input to a plugin.
All reports must be aligned to the same reference and must be member of the same project.
Have the run reports that are to be combined in the same project.In that project, select the checkboxes for the run reports that are to be combined.Open the Combine Selected... menu and select the option.Combine AlignmentsIn the Combine Results popup, enter your choice of name for the new combined run report, and click .Save
The new combined run report also becomes a member of your project.
Add to Project
Use the to copy the selected result sets to one or more other projects.Process Selected... option> Add to ProjectIn the next screen, the project selection screen, enable the checkbox for each project that the selected result setsare to be copied to. Use the page 1 navigation at the bottom right to scroll through the list of project names.
The dds the selected result sets to the other project (or projects). The result sets are notAdd to Project option aremoved from the current project.

Version 3.4.1
- Page 112 - Copyright © 2012 Life Technologies Corporation
For Research Use Only. Not intended for any animal or human therapeutic or diagnostic use.
Remove from Project
Use the Process Selected... option> Remove from Project to removes the selected result sets from the currentproject. Be careful when using this option – it does not give you a confirmation screen before removing the projects.
This option does not delete the selected run reports and their result sets – it only removes them from the currentproject.
Export
The option copies the selected run reports (and their result sets) to the exportedReports directory in theExportReport Data Management backup location. For more information ask your Torrent Server administrator or see Repor
.t Data Management
This Export option is not related to the automatic export that is configured in a template. The templateexport option sends your result set to another software system, while the Report Data Management Exportoption copies the result set and complete run report to a locally mounted file system.
Archive
The button option eventually moves the selected run reports (and their result sets) toProcess Selected... Archivethe Report Data Management backup location. The Archive option first does thearchivedReports directory in the following:
Creates a customer support archive.Creates a PDF of the run report.
The Archive option leaves the customer support archive and the run report PDF in the run report directory. Otherreport files and result files are deleted from the run reports directory after the copy to the archivedReports directory.
The gold Archive button specifies an ionArchive service setting and is not related to the Report Data The ionArchive service is activated when free disk space thresholds areManagement Archive option.
reached.
Prune
The option removes files from the selected result sets. Your Prune Torrent Server administrator configures whichfiles are deleted by the Prune option.
Recovery of files deleted by the Prune option is not supported.
For more information ask your Torrent Server administrator or see .Report Data Management
Search
In the Data > Projects page, you can search for project names and in a project details page you can search for runreport names. The search field behavior is the same in both cases. After you press , the displayed information isGolimited to only names which match or contain the search string.
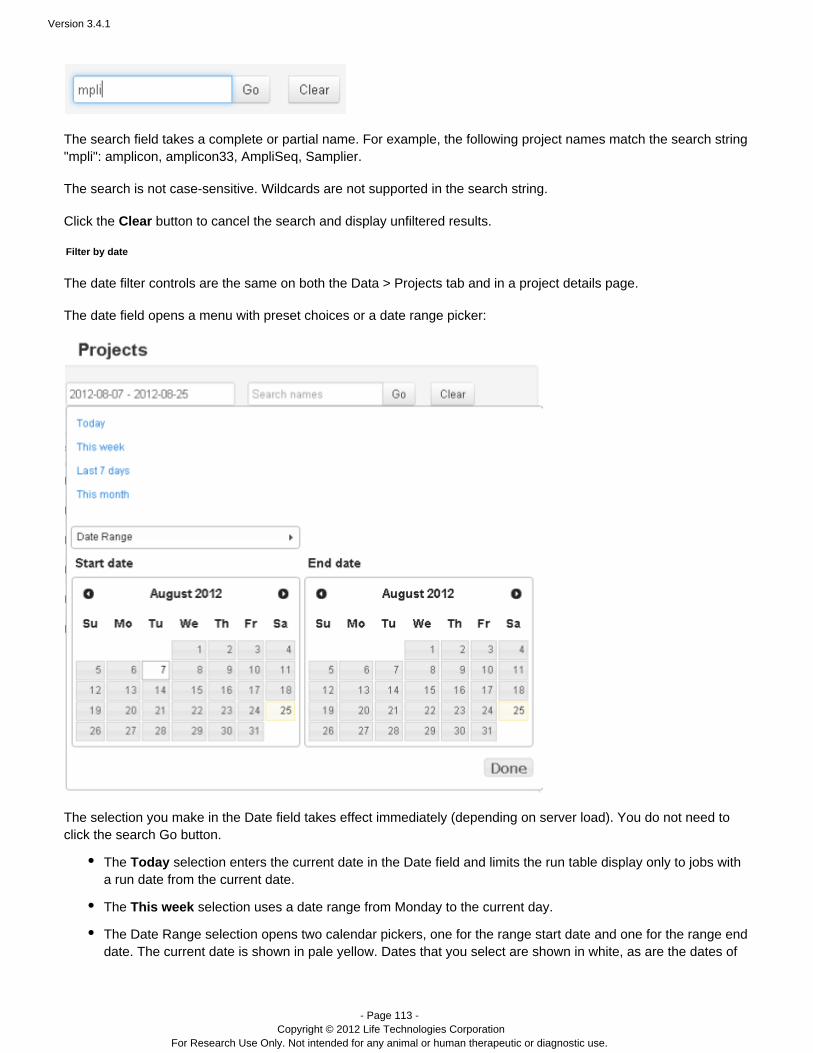
Version 3.4.1
- Page 113 - Copyright © 2012 Life Technologies Corporation
For Research Use Only. Not intended for any animal or human therapeutic or diagnostic use.
The search field takes a complete or partial name. For example, the following project names match the search string"mpli": amplicon, amplicon33, AmpliSeq, Samplier.
The search is not case-sensitive. Wildcards are not supported in the search string.
Click the button to cancel the search and display unfiltered results.Clear
Filter by date
The date filter controls are the same on both the Data > Projects tab and in a project details page.
The date field opens a menu with preset choices or a date range picker:
The selection you make in the Date field takes effect immediately (depending on server load). You do not need toclick the search Go button.
The selection enters the current date in the Date field and limits the run table display only to jobs withTodaya run date from the current date.
The selection uses a date range from Monday to the current day.This week
The Date Range selection opens two calendar pickers, one for the range start date and one for the range enddate. The current date is shown in pale yellow. Dates that you select are shown in white, as are the dates of
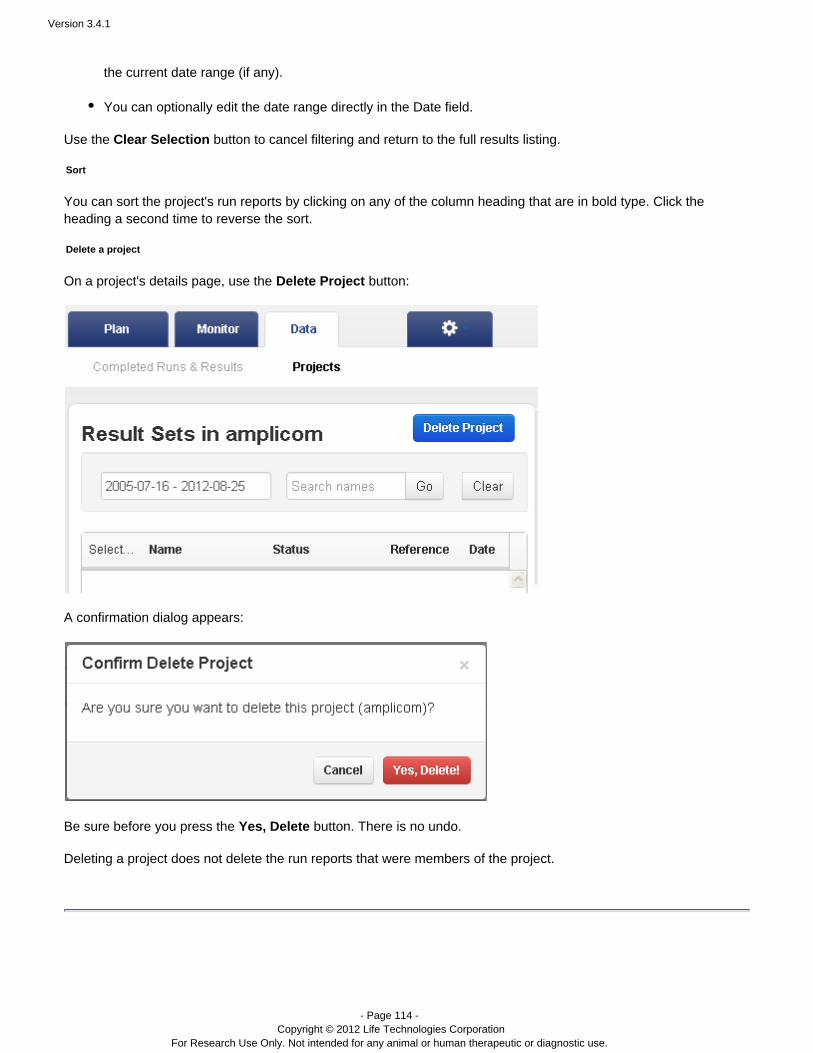
Version 3.4.1
- Page 114 - Copyright © 2012 Life Technologies Corporation
For Research Use Only. Not intended for any animal or human therapeutic or diagnostic use.
the current date range (if any).
You can optionally edit the date range directly in the Date field.
Use the Clear Selection button to cancel filtering and return to the full results listing.
Sort
You can sort the project's run reports by clicking on any of the column heading that are in bold type. Click theheading a second time to reverse the sort.
Delete a project
On a project's details page, use the button:Delete Project
A confirmation dialog appears:
Be sure before you press the button. There is no undo.Yes, Delete
Deleting a project does not delete the run reports that were members of the project.
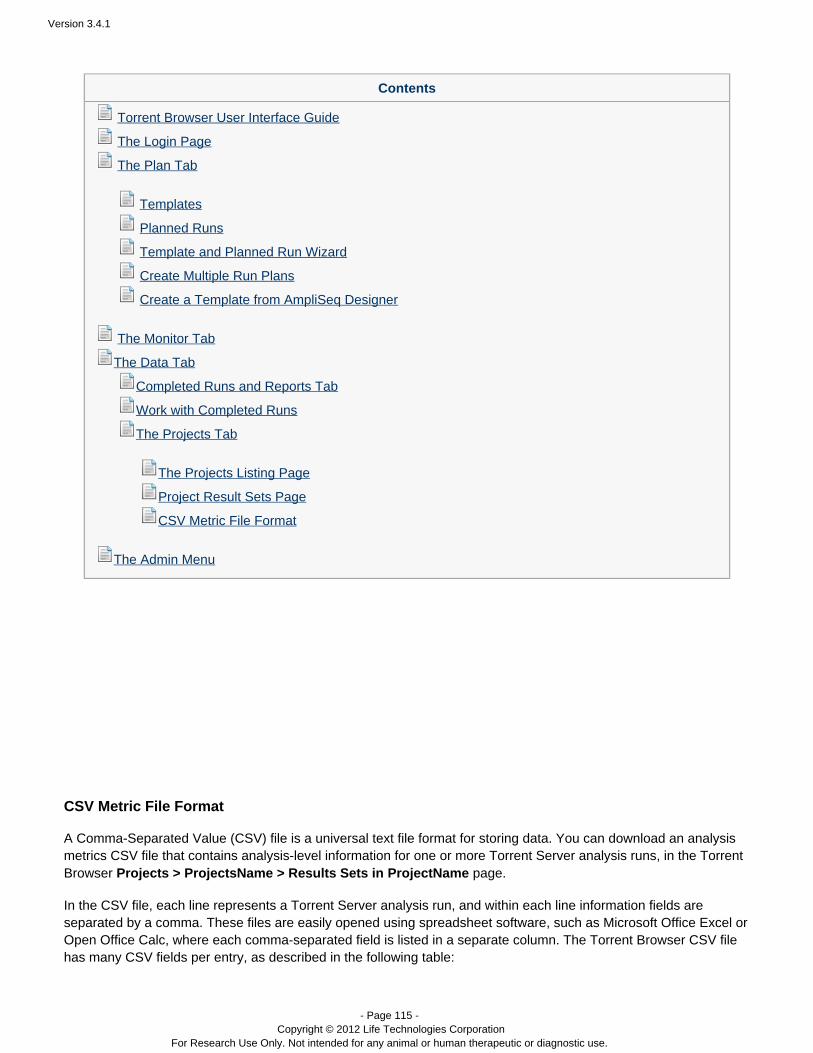
Version 3.4.1
- Page 115 - Copyright © 2012 Life Technologies Corporation
For Research Use Only. Not intended for any animal or human therapeutic or diagnostic use.
Contents
Torrent Browser User Interface Guide
The Login Page
The Plan Tab
Templates
Planned Runs
Template and Planned Run Wizard
Create Multiple Run Plans
Create a Template from AmpliSeq Designer
The Monitor Tab
The Data Tab
Completed Runs and Reports Tab
Work with Completed Runs
The Projects Tab
The Projects Listing Page
Project Result Sets Page
CSV Metric File Format
The Admin Menu
CSV Metric File Format
A Comma-Separated Value (CSV) file is a universal text file format for storing data. You can download an analysismetrics CSV file that contains analysis-level information for one or more Torrent Server analysis runs, in the TorrentBrowser page.Projects > > Results Sets in ProjectsName ProjectName
In the CSV file, each line represents a Torrent Server analysis run, and within each line information fields areseparated by a comma. These files are easily opened using spreadsheet software, such as Microsoft Office Excel orOpen Office Calc, where each comma-separated field is listed in a separate column. The Torrent Browser CSV filehas many CSV fields per entry, as described in the following table:
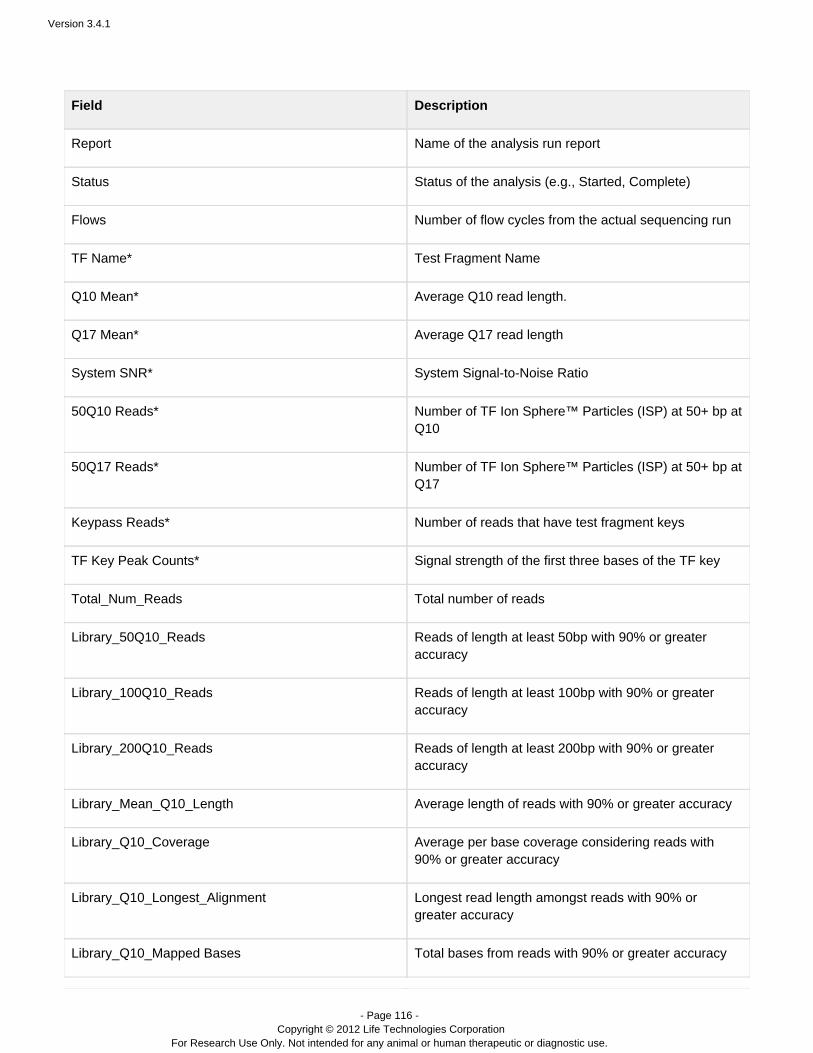
Version 3.4.1
- Page 116 - Copyright © 2012 Life Technologies Corporation
For Research Use Only. Not intended for any animal or human therapeutic or diagnostic use.
Field Description
Report Name of the analysis run report
Status Status of the analysis (e.g., Started, Complete)
Flows Number of flow cycles from the actual sequencing run
TF Name* Test Fragment Name
Q10 Mean* Average Q10 read length.
Q17 Mean* Average Q17 read length
System SNR* System Signal-to-Noise Ratio
50Q10 Reads* Number of TF Ion Sphere™ Particles (ISP) at 50+ bp atQ10
50Q17 Reads* Number of TF Ion Sphere™ Particles (ISP) at 50+ bp atQ17
Keypass Reads* Number of reads that have test fragment keys
TF Key Peak Counts* Signal strength of the first three bases of the TF key
Total_Num_Reads Total number of reads
Library_50Q10_Reads Reads of length at least 50bp with 90% or greateraccuracy
Library_100Q10_Reads Reads of length at least 100bp with 90% or greateraccuracy
Library_200Q10_Reads Reads of length at least 200bp with 90% or greateraccuracy
Library_Mean_Q10_Length Average length of reads with 90% or greater accuracy
Library_Q10_Coverage Average per base coverage considering reads with90% or greater accuracy
Library_Q10_Longest_Alignment Longest read length amongst reads with 90% orgreater accuracy
Library_Q10_Mapped Bases Total bases from reads with 90% or greater accuracy

Version 3.4.1
- Page 117 - Copyright © 2012 Life Technologies Corporation
For Research Use Only. Not intended for any animal or human therapeutic or diagnostic use.
Library_Q10_Alignments Number of alignments from reads with 90% or greateraccuracy
Library_50Q17_Reads Reads of length at least 50bp with 98% or greateraccuracy
Library_100Q17_Reads Reads of length at least 100bp with 98% or greateraccuracy
Library_200Q17_Reads Reads of length at least 200bp with 98% or greateraccuracy
Library_Mean_Q17_Length Average length of reads with 98% or greater accuracy
Library_Q17_Coverage Average per base coverage considering reads with98% or greater accuracy
Library_Q17_Longest_Alignment Longest read length amongst reads with 98% orgreater accuracy
Library_Q17_Mapped Bases Total bases from reads with 98% or greater accuracy
Library_Q17_Alignments Number of alignments from reads with 98% or greateraccuracy
Library_50Q20_Reads Reads of length at least 50bp with 99% or greateraccuracy
Library_100Q20_Reads Reads of length at least 100bp with 99% or greateraccuracy
Library_200Q20_Reads Reads of length at least 200bp with 99% or greateraccuracy
Library_Mean_Q20_Length Average length of reads with 99% or greater accuracy
Library_Q20_Coverage Average per base coverage considering reads with99% or greater accuracy
Library_Q20_Longest_Alignment Longest read length amongst reads with 99% orgreater accuracy
Library_Q20_Mapped_Bases Total bases from reads with 99% or greater accuracy
Library_Q20_Alignments Number of alignments from reads with 99% or greateraccuracy
Library_Key_Peak_Counts Signal strength of the first three bases of the library key

Version 3.4.1
- Page 118 - Copyright © 2012 Life Technologies Corporation
For Research Use Only. Not intended for any animal or human therapeutic or diagnostic use.
Library_50Q47_Reads Number of perfect reads of length at least 50bp
Library_100Q47_Reads Number of perfect reads of length at least 100bp
Library_200Q47_Reads Number of perfect reads of length at least 200bp
Library_Mean_Q47_Length Average length of perfect reads
Library_Q47_Coverage Average per base coverage considering only perfectreads
Library_Q47_Longest_Alignment Longest reads length amongst perfect reads
Library_Q47_Mapped_Bases Total bases from perfect reads
Library_Q47_Alignments Number of alignments from perfect reads
Library_CF CAFIE metric: Carry forward
Library_IE CAFIE metric: Incomplete extension
Library_DR CAFIE metric: Signal/polymerase loss (droop)
Library_SNR System Signal-to-Noise Ratio
Sample Name of the sample
Library Name of the reference genome
Notes Any additional user-provided notes
Run Name Long name of the analysis run
PGM Name Name of the PGM™ or Proton™ instrument where thesample was sequenced
Run Date Date the sample was sequenced
Run Directory Location of the raw DAT files on the Torrent Server
Num_Washouts NA
Num_Dud_Washouts NA
Num_Washout_Ambigous NA
Num_Washout_Live NA
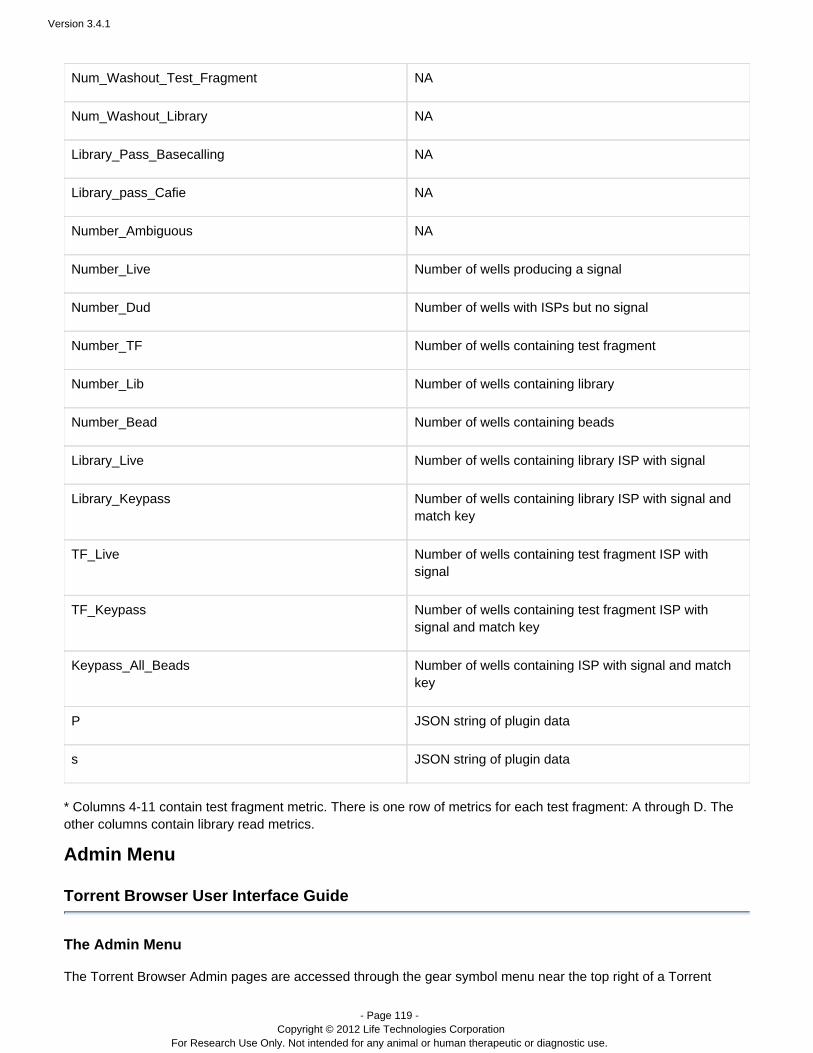
Version 3.4.1
- Page 119 - Copyright © 2012 Life Technologies Corporation
For Research Use Only. Not intended for any animal or human therapeutic or diagnostic use.
Num_Washout_Test_Fragment NA
Num_Washout_Library NA
Library_Pass_Basecalling NA
Library_pass_Cafie NA
Number_Ambiguous NA
Number_Live Number of wells producing a signal
Number_Dud Number of wells with ISPs but no signal
Number_TF Number of wells containing test fragment
Number_Lib Number of wells containing library
Number_Bead Number of wells containing beads
Library_Live Number of wells containing library ISP with signal
Library_Keypass Number of wells containing library ISP with signal andmatch key
TF_Live Number of wells containing test fragment ISP withsignal
TF_Keypass Number of wells containing test fragment ISP withsignal and match key
Keypass_All_Beads Number of wells containing ISP with signal and matchkey
P JSON string of plugin data
s JSON string of plugin data
* Columns 4-11 contain test fragment metric. There is one row of metrics for each test fragment: A through D. Theother columns contain library read metrics.
Admin Menu
Torrent Browser User Interface Guide
The Admin Menu
The Torrent Browser Admin pages are accessed through the gear symbol menu near the top right of a Torrent
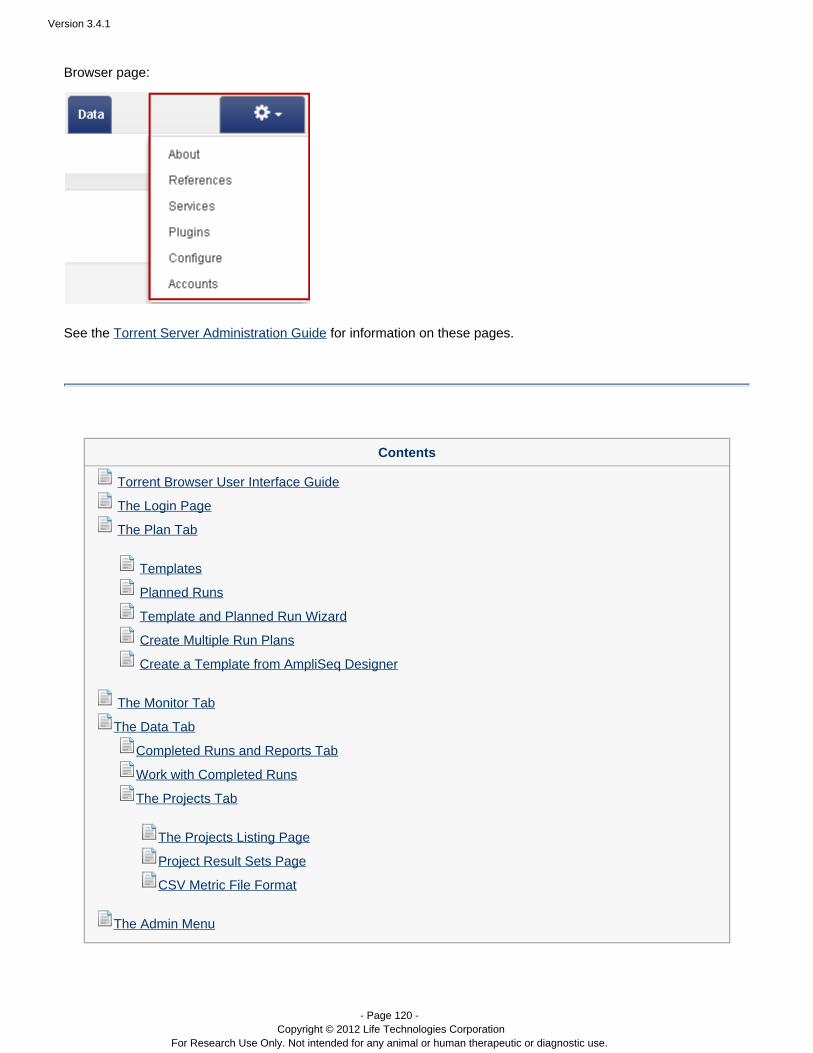
Version 3.4.1
- Page 120 - Copyright © 2012 Life Technologies Corporation
For Research Use Only. Not intended for any animal or human therapeutic or diagnostic use.
Browser page:
See the for information on these pages.Torrent Server Administration Guide
Contents
Torrent Browser User Interface Guide
The Login Page
The Plan Tab
Templates
Planned Runs
Template and Planned Run Wizard
Create Multiple Run Plans
Create a Template from AmpliSeq Designer
The Monitor Tab
The Data Tab
Completed Runs and Reports Tab
Work with Completed Runs
The Projects Tab
The Projects Listing Page
Project Result Sets Page
CSV Metric File Format
The Admin Menu

Version 3.4.1
- Page 121 - Copyright © 2012 Life Technologies Corporation
For Research Use Only. Not intended for any animal or human therapeutic or diagnostic use.
UI Table Of Contents
Contents
Torrent Browser User Interface Guide
The Login Page
The Plan Tab
Templates
Planned Runs
Template and Planned Run Wizard
Create Multiple Run Plans
Create a Template from AmpliSeq Designer
The Monitor Tab
The Data Tab
Completed Runs and Reports Tab
Work with Completed Runs
The Projects Tab
The Projects Listing Page
Project Result Sets Page
CSV Metric File Format
The Admin Menu
Version 3.4.1
- Page 122 - Copyright © 2012 Life Technologies Corporation
For Research Use Only. Not intended for any animal or human therapeutic or diagnostic use.
Torrent Browser Analysis Report Guide
Torrent Browser Analysis Report Guide
Introduction
A Torrent Browser run report contains statistics and quality metrics for your run. From a run report you can do thefollowing:
Review pre-alignment metrics such as bead loading, Ion Sphere™ Particle (ISP) density, total number ofreads, filtering numbers, and mean read lengthReview alignment metrics such as total aligned bases, average coverage, and mean raw accuracyDownload the result setManually run a plugin on the run resultsReview the planned run settingsReview the test fragments used with this run and test fragment quality metricsReview analysis information and Torrent Suite software versionsReview the analysis logGenerate a zip file for technical support
See to handle runs generated with version of Torrent Suite earlier than 3.0.Old report analysis
A run report is divided into the following main areas (see the example run report below):
Report header – Buttons to download the run report or summary as in PDF format, a button to review theplanned run settings for the run, a menu to change to a different result set for the same sample, and a navigation bar, for instance to jump to the Output Files section.Barcode Summary – For barcoded runs, a barcode summary table appears at the top of the run report.Unaligned – Metrics taken before alignment, including bead loading, ISP density and other metrics, read andfiltering metrics, and read lengthAligned Metrics on the aligned reads– Plugin Previews – Summary output of completed plugins (when supported by the plugin)Output Files – Download buttons for both pre-aligned reads and aligned reads filesPlugin Summary – Links to plugin reports and a button to select another plugin to run (on a completedanalysis)
– A button which displays information about the Test Fragments performance of each test fragment includedin the experimentAnalysis Details – A button which displays a set of information about the sequencing run environment (rundate, sample name, chip type, instrument name, barcode set, etc.)Support – A button which displays a link to the report log and a link to generate information for technicalsupport
– A button which displays the version of Torrent Suite software and its modules Software Version
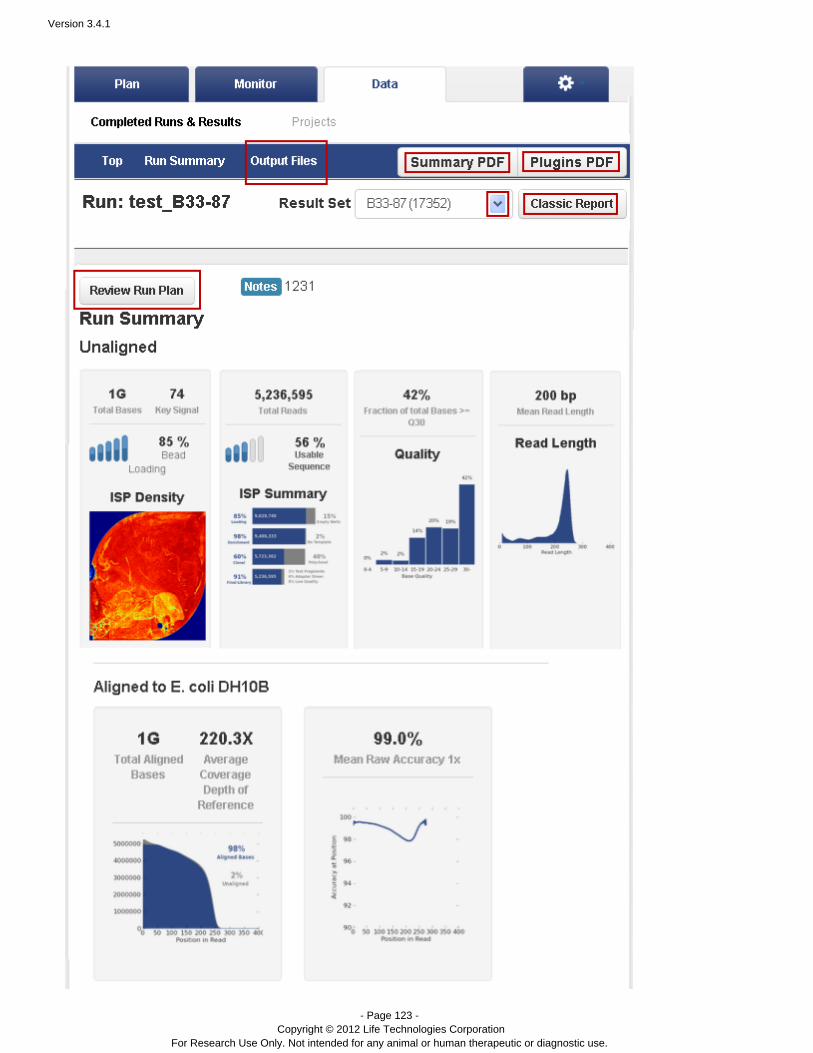
Version 3.4.1
- Page 123 - Copyright © 2012 Life Technologies Corporation
For Research Use Only. Not intended for any animal or human therapeutic or diagnostic use.

Version 3.4.1
- Page 124 - Copyright © 2012 Life Technologies Corporation
For Research Use Only. Not intended for any animal or human therapeutic or diagnostic use.
Report header
The run report header contains the following:
A navigation bar to jump to other areas of the report, such as the Output Files sectionSummary PDF and buttons to download the run report summary or the plugin results in PDF Plugins PDFformatA button to view the run report in the Torrent Suite 2.x formatClassic ReportA menu to view the run report of a different result set for the same sampleResult SetA button to view the planned run information for this runReview Run PlanA Notes field which lists notes added to the run

Version 3.4.1
- Page 125 - Copyright © 2012 Life Technologies Corporation
For Research Use Only. Not intended for any animal or human therapeutic or diagnostic use.
Old report analysis
The Torrent Browser cannot display run reports from earlier versions of the Torrent Suite software in the new runreport format.
To work with results generated with an earlier version of Torrent Suite software, you have these options:
Re-analyze the run to generate a new report – Opens the Data > Completed Runs & Reports >Reanalyze page. Typically you click button to re-analyze with the same settings. The Start Analysis Adv
page is also available to change the analysis settings. After you re-analyze the run, you then haveancedall 3.x features available in the new run report.View the pre-3.0 report – Open the run report in the old pre-3.0 style. Many 3.x features are notavailable in the old style run report.View this report log – Open the text log for this run.
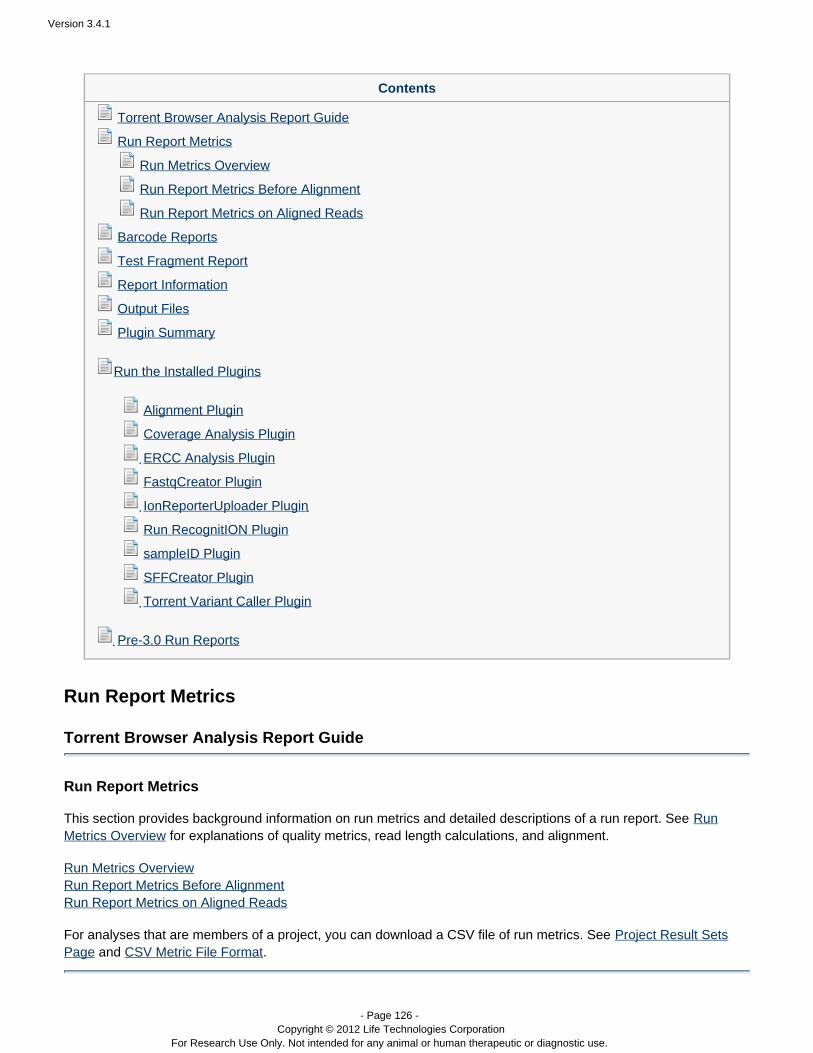
Version 3.4.1
- Page 126 - Copyright © 2012 Life Technologies Corporation
For Research Use Only. Not intended for any animal or human therapeutic or diagnostic use.
Contents
Torrent Browser Analysis Report Guide
Run Report Metrics
Run Metrics Overview
Run Report Metrics Before Alignment
Run Report Metrics on Aligned Reads
Barcode Reports
Test Fragment Report
Report Information
Output Files
Plugin Summary
Run the Installed Plugins
Alignment Plugin
Coverage Analysis Plugin
ERCC Analysis Plugin
FastqCreator Plugin
IonReporterUploader Plugin
Run RecognitION Plugin
sampleID Plugin
SFFCreator Plugin
Torrent Variant Caller Plugin
Pre-3.0 Run Reports
Run Report Metrics
Torrent Browser Analysis Report Guide
Run Report Metrics
This section provides background information on run metrics and detailed descriptions of a run report. See Runfor explanations of quality metrics, read length calculations, and alignment.Metrics Overview
Run Metrics OverviewRun Report Metrics Before AlignmentRun Report Metrics on Aligned Reads
For analyses that are members of a project, you can download a CSV file of run metrics. See Project Result Sets and .Page CSV Metric File Format
Version 3.4.1
- Page 127 - Copyright © 2012 Life Technologies Corporation
For Research Use Only. Not intended for any animal or human therapeutic or diagnostic use.
Contents
Torrent Browser Analysis Report Guide
Run Report Metrics
Run Metrics Overview
Run Report Metrics Before Alignment
Run Report Metrics on Aligned Reads
Barcode Reports
Test Fragment Report
Report Information
Output Files
Plugin Summary
Run the Installed Plugins
Alignment Plugin
Coverage Analysis Plugin
ERCC Analysis Plugin
FastqCreator Plugin
IonReporterUploader Plugin
Run RecognitION Plugin
sampleID Plugin
SFFCreator Plugin
Torrent Variant Caller Plugin
Pre-3.0 Run Reports
Run Metrics Overview
Torrent Browser Analysis Report Guide
Run Metrics Overview
This page provides background information on quality metrics, read lengths, and alignment. These concepts arerequired to understand your run report.
The Torrent Browser Analysis Report gives performance metrics for reads whose initial bases match the library key.
These reads are generated from the input library, not from the positive control Test Fragments.
Performance is measured based on either predicted quality or quality as measured following alignment. Q20 andAQ20 are explained as examples of predicted quality and quality following alignment.
Version 3.4.1
- Page 128 - Copyright © 2012 Life Technologies Corporation
For Research Use Only. Not intended for any animal or human therapeutic or diagnostic use.
1. 2. 3.
Predicted Quality (Q20)Quality Following Alignment (AQ20)
Predicted Quality (Q20)
The number of called bases with a predicted quality of Q20 is reported. The predicted quality values are reported onthe Phred scale, defined as (error probability). Q20, therefore, corresponds to a predicted error rate of-10×log10
one percent.
Refer to for a more complete description of Phred values.http://en.wikipedia.org/wiki/Phred_quality_score
Quality Following Alignment (AQ20)
Alignment of reads can be a useful process to assess the quality of the sequencing reaction and the quality of theunderlying library where an accurate reference is available. Reads are aligned to a reference genome. Anydiscrepancy in alignment to a reference (whether biological or technical, meaning a real variant or a sequencingerror) is listed as a mismatch. Alignment performance metrics are reported depending on how many misalignedbases are permitted. Torrent Suite reports alignment performance at two quality levels:
AQ20Perfect
How Is Aligned Read Length Calculated?
The aligned length of a read at a given accuracy threshold is defined as the greatest position in the read at whichthe accuracy in the bases up to and including the position meets the accuracy threshold. So for example the AQ20length is the greatest length at which the error rate is 1% or less. The "perfect" length is simply the longest perfectlyaligned segment. For all of these calculations the alignment is constrained to start from position 1 in the read - inother words, no 5' clipping is permitted.
The underlying assumption is that the reference to which the read is aligned represents the true sequence thatshould have been seen. Suitable caution should be taken when interpreting AQ20 values in situations where thesample sequenced has substantial differences relative to the reference used, such as working with alignments to arough draft genome or with samples that are expected to have high mutation rates relative to the reference used. Inthese situations the AQ20 lengths might be short even when sequencing quality is excellent.
Specifically, the AQ20 length is computed as follows:
Every base in the read is classified as being correct or incorrect according to the alignment to the reference.At every position in the read the total error rate is computed up to and including that position.The greatest position at which the error rate is one percent or less is identified and that position defines theAQ20 length.
For example, if a 100bp read consists of 80 perfect bases followed by 2 errors followed by 18 more perfect bases,the total error rate at position 80 is zero percent. At position 81 the total error rate is 1.2% (1/81), at position 82 theerror rate is 2.4%, continuing up to position 100 where it is two percent (2/100). The greatest length at which theerror rate is one percent or less is 80 and the greatest length at which the error rate is two percent or less is 100, sothe AQ20 lengths are 80 and 100 bases, respectively.
How Is Alignment Performed?
Within Torrent Browser, the objective is to provide you with a view on alignment that helps determine run and libraryquality.
Version 3.4.1
- Page 129 - Copyright © 2012 Life Technologies Corporation
For Research Use Only. Not intended for any animal or human therapeutic or diagnostic use.
There are many alignment algorithms available within the marketplace and you are encouraged toconsult with a bioinformatician for the most appropriate alignment algorithm for your downstream analysisneeds. Alignment algorithms are also embedded in many of the commercial software tools availablewithin the Ion Torrent Web store. You are also encouraged to experiment with these tools.
Alignment within Torrent Browser is performed using TMAP. TMAP is currently an unpublished alignment algorithm,created by the authors of the BFAST algorithm. Please, contact Ion Torrent Technical Support for more informationabout TMAP.
Technical Note - Analysis PipelineTechnical Note - TMAP Alignment
Although TMAP is unpublished and a reference is not currently available, the precursor to TMAP,BFAST, is based on the ideas in the following publications:
Homer N, Merriman B, Nelson SF.BFAST: An alignment tool for large scale genome resequencing.PMID: 19907642PLoS ONE. 2009 4(11): e7767. http://dx.doi.org/10.1371/journal.pone.0007767
Homer N, Merriman B, Nelson SF.Local alignment of two-base encoded DNA sequence.BMC Bioinformatics. 2009 Jun 9;10(1):175.PMID: 19508732 http://dx.doi.org/10.1186/1471-2105-10-175
Which Reads Are Used in the Alignment Process?
The alignment stage involves aligning reads produced by the pipeline to a reference genome and extracting metricsfrom those alignments. By default, Torrent Suite aligns all reads to the genome, however there may be situations,particularly with large genomes, where the alignment takes longer than the user is willing to wait. So for suchcircumstances the Torrent Suite also has the capability to define on a per-reference basis the maximum number ofreads that should be aligned from a run. For more detail on how to enable and specify this reference-specific limitsee the Adding a Reference Sequence section of .Working with Reference Sequences
When the number of reads in a run exceeds a genome-specific maximum, a random sample of reads is taken andresults are extrapolated to the full run. By sampling a quickly-aligned subset of reads and extrapolating the valuesto the full run, the software gives you enough information to be able to judge the quality of the sample, library andsequencing run for quality assessment purposes.
The outputs of the alignment process is a BAM file. The BAM file includes an alignment of all reads, including theunmapped, with exactly one mapping per read. When a read maps to multiple locations, the mapping with the bestmapping score is used. If more than one such mapping exists, a random mapping is used and given a mappingquality of zero.
Version 3.4.1
- Page 130 - Copyright © 2012 Life Technologies Corporation
For Research Use Only. Not intended for any animal or human therapeutic or diagnostic use.
Contents
Torrent Browser Analysis Report Guide
Run Report Metrics
Run Metrics Overview
Run Report Metrics Before Alignment
Run Report Metrics on Aligned Reads
Barcode Reports
Test Fragment Report
Report Information
Output Files
Plugin Summary
Run the Installed Plugins
Alignment Plugin
Coverage Analysis Plugin
ERCC Analysis Plugin
FastqCreator Plugin
IonReporterUploader Plugin
Run RecognitION Plugin
sampleID Plugin
SFFCreator Plugin
Torrent Variant Caller Plugin
Pre-3.0 Run Reports
Run Report Metrics Before Alignment
Torrent Browser Analysis Report Guide
Run Report Metrics Before Alignment
The Unaligned area in the Run Summary section provides before-alignment metrics. There are three sections in theUnaligned area:
ISP DensityISP SummaryRead Length
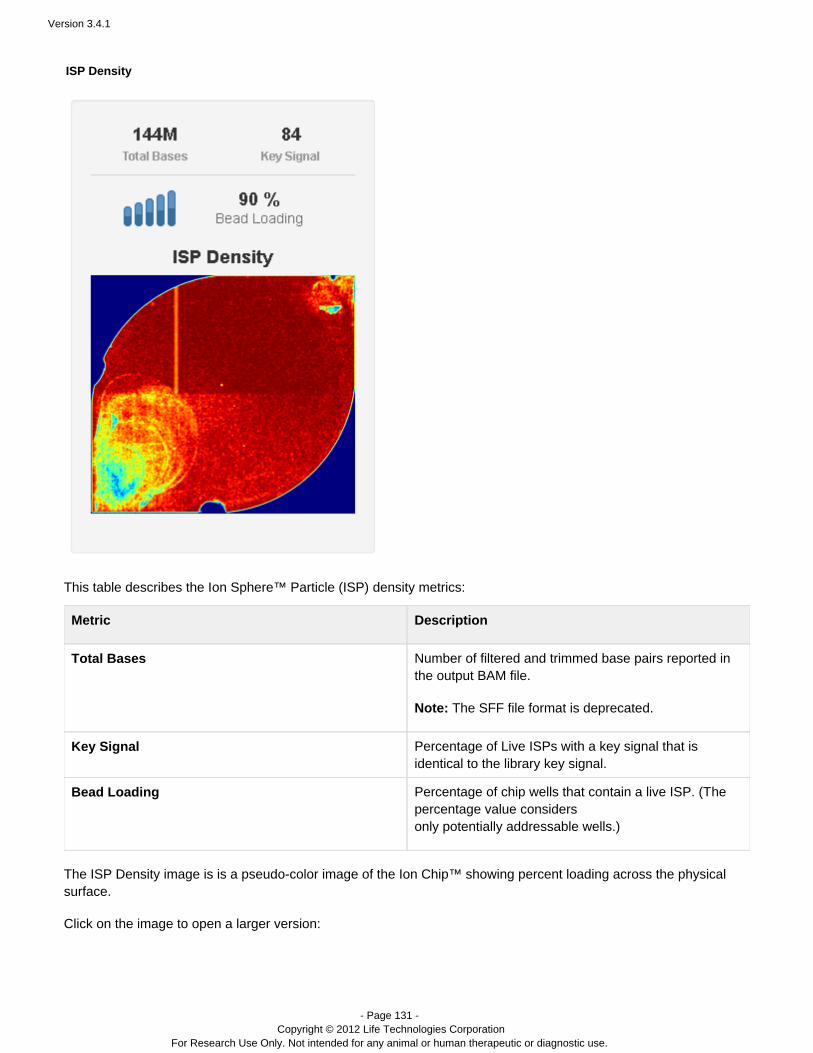
Version 3.4.1
- Page 131 - Copyright © 2012 Life Technologies Corporation
For Research Use Only. Not intended for any animal or human therapeutic or diagnostic use.
ISP Density
This table describes the I density metrics:on Sphere™ Particle (ISP)
Metric Description
Total Bases Number of filtered and trimmed base pairs reported inthe output BAM file.
Note: The SFF file format is deprecated.
Key Signal Percentage of Live ISPs with a key signal that isidentical to the library key signal.
Bead Loading Percentage of chip wells that contain a live ISP. (Thepercentage value considersonly potentially addressable wells.)
The ISP Density image is is a pseudo-color image of the Ion Chip™ showing percent loading across the physicalsurface.
Click on the image to open a larger version:
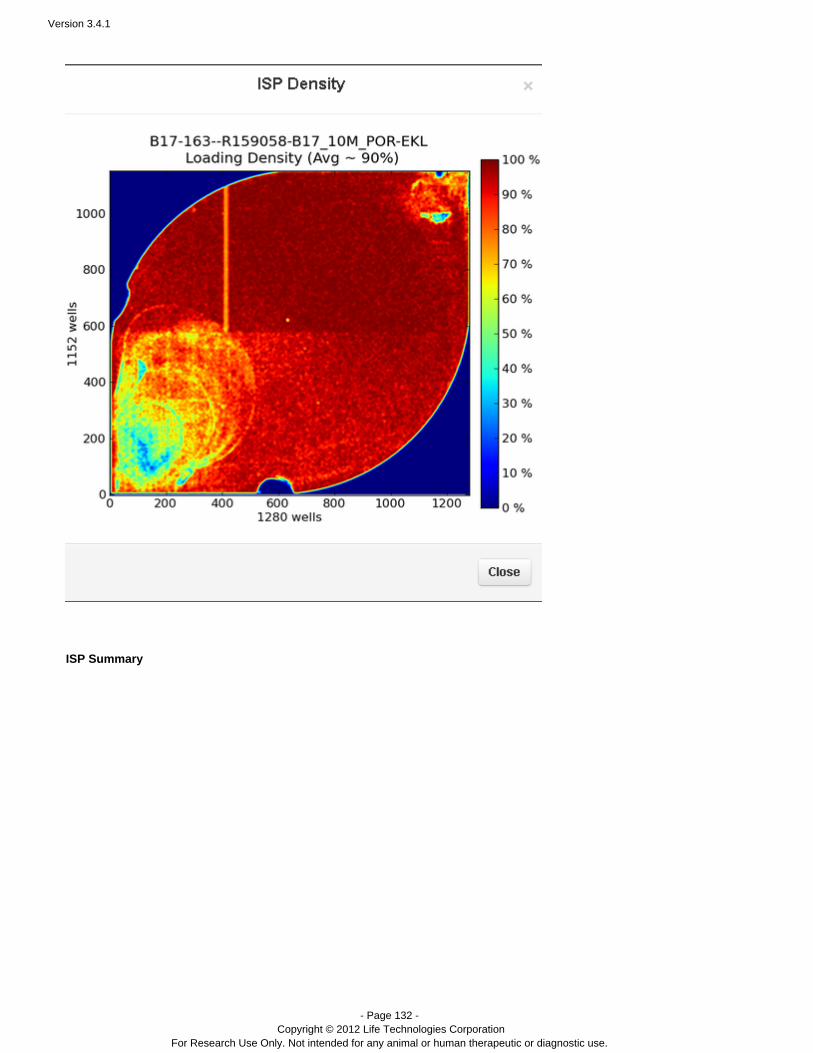
Version 3.4.1
- Page 132 - Copyright © 2012 Life Technologies Corporation
For Research Use Only. Not intended for any animal or human therapeutic or diagnostic use.
ISP Summary
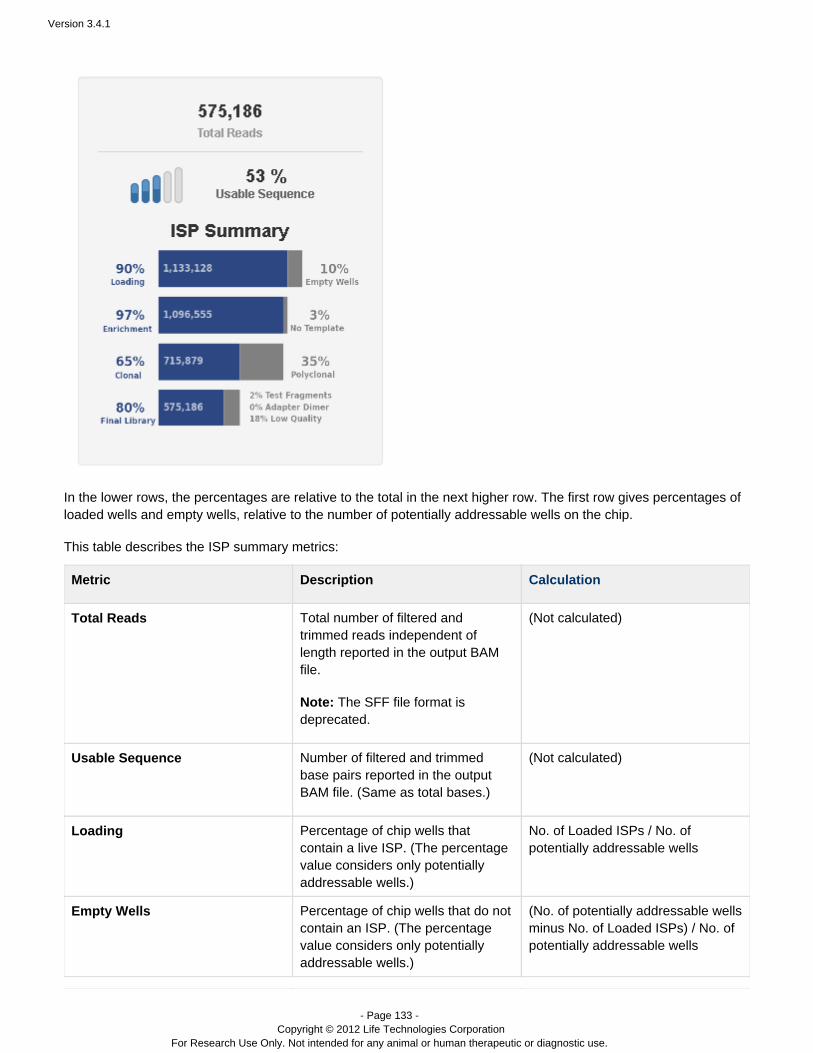
Version 3.4.1
- Page 133 - Copyright © 2012 Life Technologies Corporation
For Research Use Only. Not intended for any animal or human therapeutic or diagnostic use.
In the lower rows, the percentages are relative to the total in the next higher row. The first row gives percentages ofloaded wells and empty wells, relative to the number of potentially addressable wells on the chip.
This table describes the ISP summary metrics:
Metric Description Calculation
Total Reads Total number of filtered andtrimmed reads independent oflength reported in the output BAMfile.
Note: The SFF file format isdeprecated.
(Not calculated)
Usable Sequence Number of filtered and trimmedbase pairs reported in the outputBAM file. (Same as total bases.)
(Not calculated)
Loading Percentage of chip wells thatcontain a live ISP. (The percentagevalue considers only potentiallyaddressable wells.)
No. of Loaded ISPs / No. ofpotentially addressable wells
Empty Wells Percentage of chip wells that do notcontain an ISP. (The percentagevalue considers only potentiallyaddressable wells.)
(No. of potentially addressable wellsminus No. of Loaded ISPs) / No. ofpotentially addressable wells
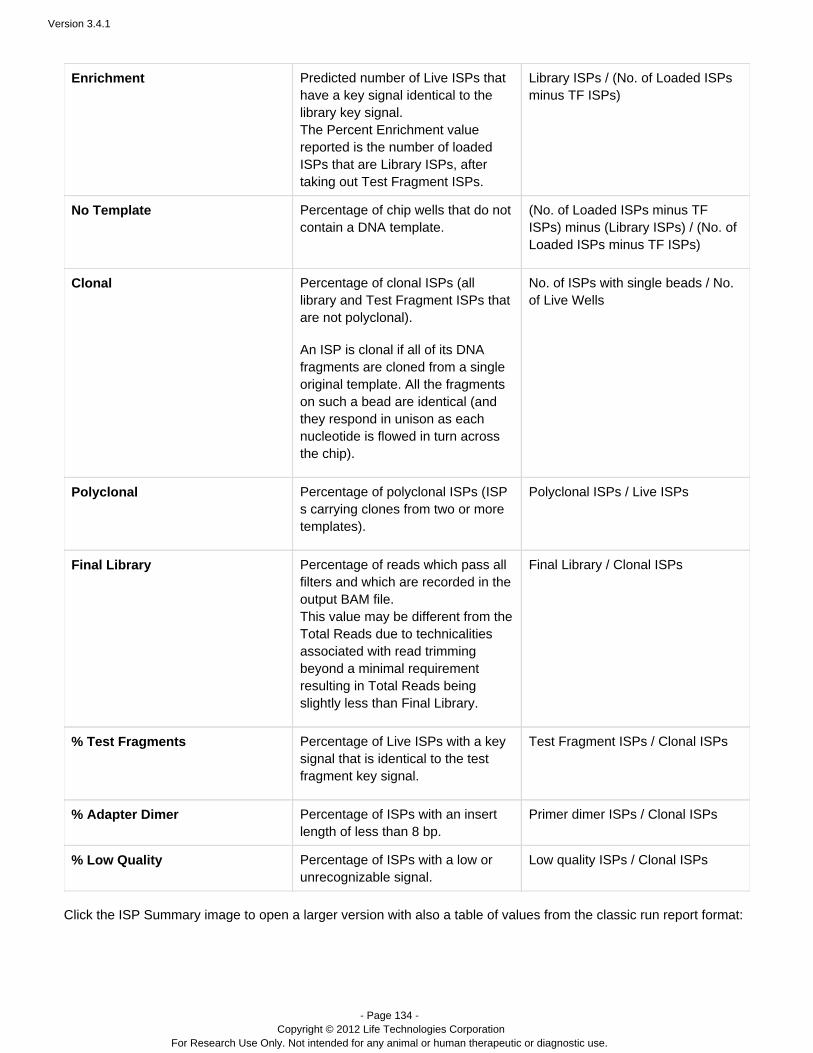
Version 3.4.1
- Page 134 - Copyright © 2012 Life Technologies Corporation
For Research Use Only. Not intended for any animal or human therapeutic or diagnostic use.
Enrichment Predicted number of Live ISPs that have a key signal identical to thelibrary key signal.The Percent Enrichment valuereported is the number of loadedISPs that are Library ISPs, aftertaking out Test Fragment ISPs.
Library ISPs / (No. of Loaded ISPsminus TF ISPs)
No Template Percentage of chip wells that do notcontain a DNA template.
(No. of Loaded ISPs minus TFISPs) minus (Library ISPs) / (No. ofLoaded ISPs minus TF ISPs)
Clonal Percentage of clonal ISPs (alllibrary and Test Fragment ISPs thatare not polyclonal).
An ISP is clonal if all of its DNAfragments are cloned from a singleoriginal template. All the fragmentson such a bead are identical (andthey respond in unison as eachnucleotide is flowed in turn acrossthe chip).
No. of ISPs with single beads / No.of Live Wells
Polyclonal Percentage of polyclonal ISPs (ISPs carrying clones from two or moretemplates).
Polyclonal ISPs / Live ISPs
Final Library Percentage of reads which pass allfilters and which are recorded in theoutput BAM file.This value may be different from theTotal Reads due to technicalitiesassociated with read trimmingbeyond a minimal requirementresulting in Total Reads beingslightly less than Final Library.
Final Library / Clonal ISPs
% Test Fragments Percentage of Live ISPs with a keysignal that is identical to the testfragment key signal.
Test Fragment ISPs / Clonal ISPs
% Adapter Dimer Percentage of ISPs with an insertlength of less than 8 bp.
Primer dimer ISPs / Clonal ISPs
% Low Quality Percentage of ISPs with a low orunrecognizable signal.
Low quality ISPs / Clonal ISPs
Click the ISP Summary image to open a larger version with also a table of values from the classic run report format:
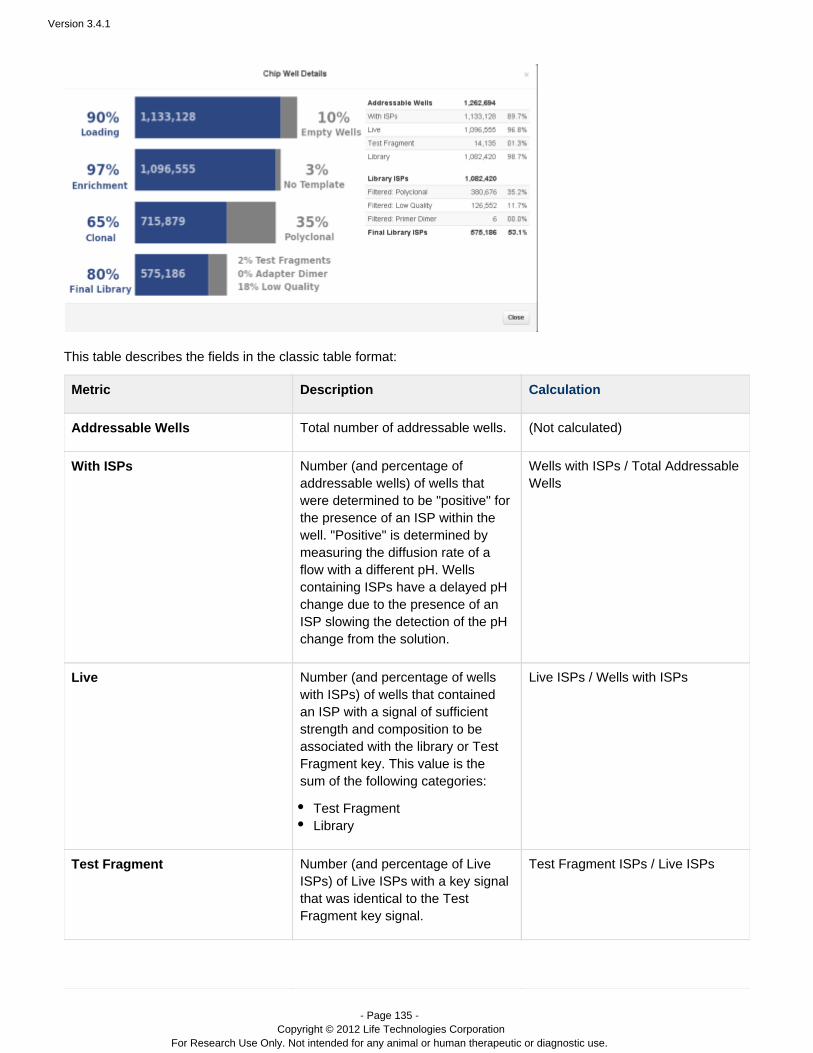
Version 3.4.1
- Page 135 - Copyright © 2012 Life Technologies Corporation
For Research Use Only. Not intended for any animal or human therapeutic or diagnostic use.
This table describes the fields in the classic table format:
Metric Description Calculation
Addressable Wells Total number of addressable wells. (Not calculated)
With ISPs Number (and percentage ofaddressable wells) of wells thatwere determined to be "positive" forthe presence of an ISP within thewell. "Positive" is determined bymeasuring the diffusion rate of aflow with a different pH. Wellscontaining ISPs have a delayed pHchange due to the presence of anISP slowing the detection of the pHchange from the solution.
Wells with ISPs / Total AddressableWells
Live Number (and percentage of wellswith ISPs) of wells that containedan ISP with a signal of sufficientstrength and composition to beassociated with the library or TestFragment key. This value is thesum of the following categories:
Test FragmentLibrary
Live ISPs / Wells with ISPs
Test Fragment Number (and percentage of LiveISPs) of Live ISPs with a key signalthat was identical to the TestFragment key signal.
Test Fragment ISPs / Live ISPs

Version 3.4.1
- Page 136 - Copyright © 2012 Life Technologies Corporation
For Research Use Only. Not intended for any animal or human therapeutic or diagnostic use.
Library Number (and percentage of LiveISPs) of Live ISPs with a key signalthat was identical to the library keysignal.
Library ISPs / Live ISPs
Library ISPs Predicted number of Live ISPs thathave a key signal identical to thelibrary key signal (the same valueas shown in the well informationtable on the right).
Library ISPs
Filtered: Polyclonal ISPs carrying clones from two ormore templates.
Polyclonal ISPs / Library ISPs
Filtered: Low quality Low or unrecognizable signal. Low quality ISPs / Library ISPs
Filtered: Primer dimer Insert length of less than 8 bp. Primer dimer ISPs / Library ISPs
Final Library ISPs Number (and percentage of LibraryISPs) of reads passing all filters,which are recorded in the outputBAM file.
This value may be different fromthe locatedTotal number of readsin the Library Summary Section dueto technicalities associated withread trimming beyond a minimalrequirement resulting in Total
being slightly lessnumber of readsthan .Final Library Reads
Final Library / Library ISPs
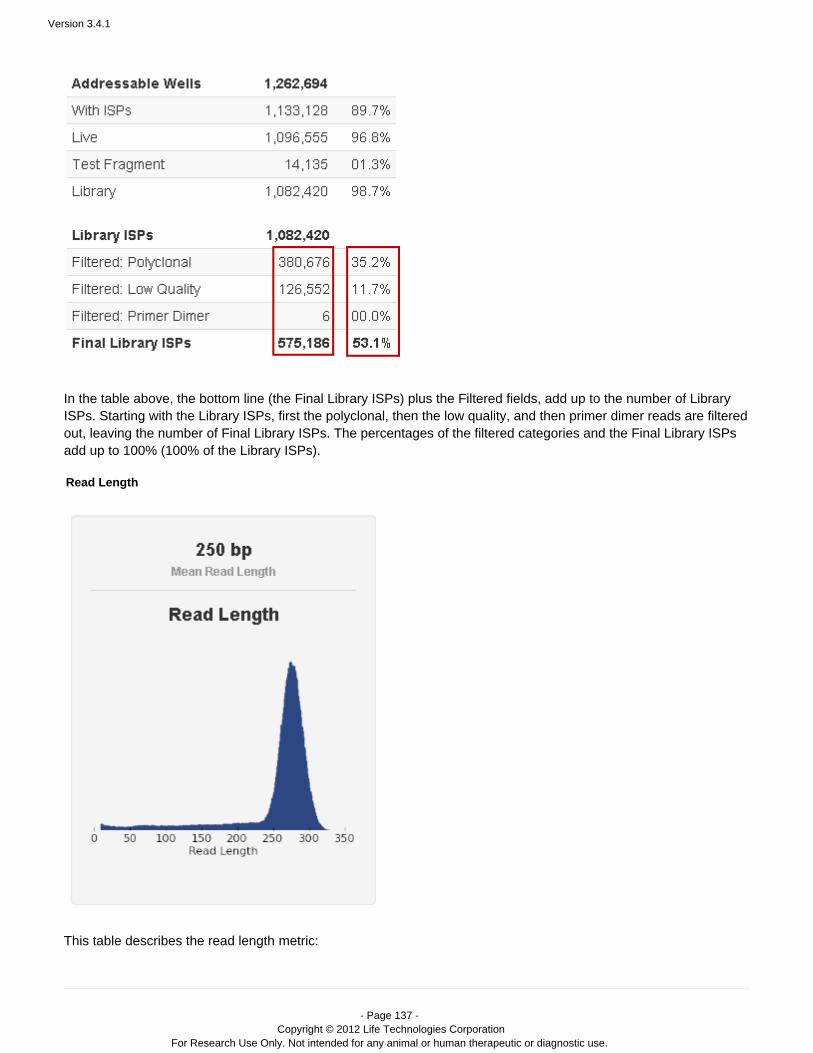
Version 3.4.1
- Page 137 - Copyright © 2012 Life Technologies Corporation
For Research Use Only. Not intended for any animal or human therapeutic or diagnostic use.
In the table above, the bottom line (the Final Library ISPs) plus the Filtered fields, add up to the number of LibraryISPs. Starting with the Library ISPs, first the polyclonal, then the low quality, and then primer dimer reads are filteredout, leaving the number of Final Library ISPs. The percentages of the filtered categories and the Final Library ISPsadd up to 100% (100% of the Library ISPs).
Read Length
This table describes the read length metric:
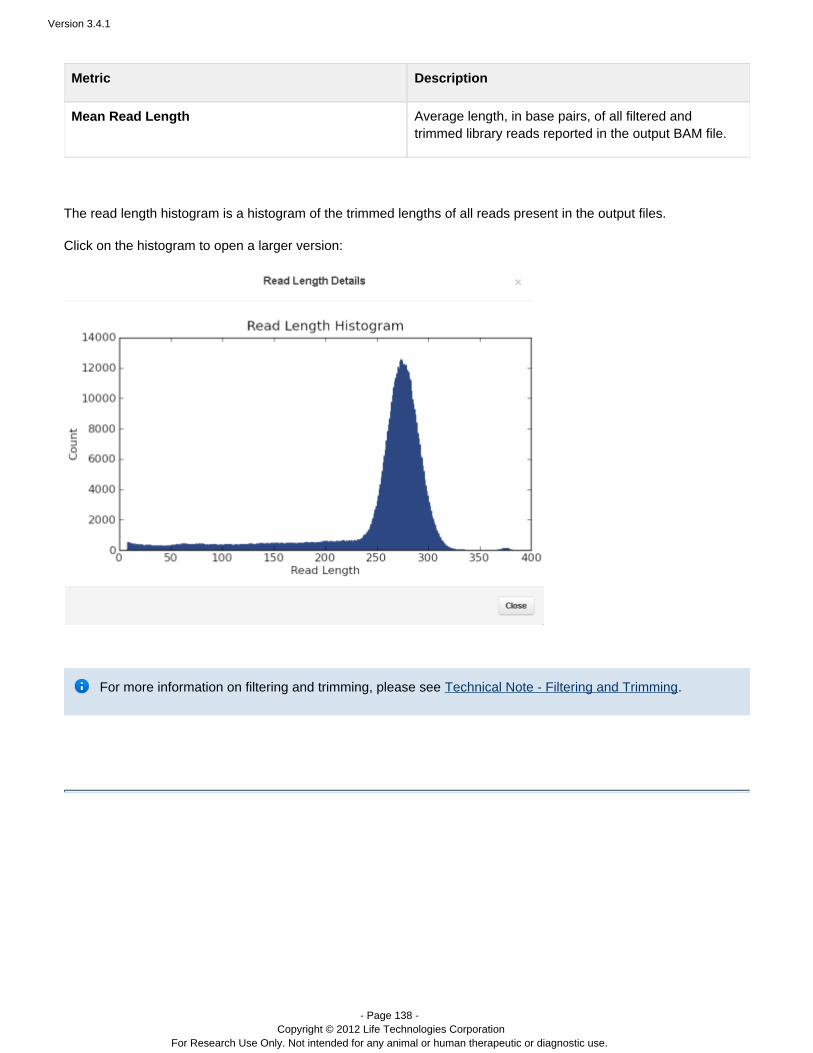
Version 3.4.1
- Page 138 - Copyright © 2012 Life Technologies Corporation
For Research Use Only. Not intended for any animal or human therapeutic or diagnostic use.
Metric Description
Mean Read Length Average length, in base pairs, of all filtered andtrimmed library reads reported in the output BAM file.
The read length histogram is a histogram of the trimmed lengths of all reads present in the output files.
Click on the histogram to open a larger version:
For more information on filtering and trimming, please see .Technical Note - Filtering and Trimming

Version 3.4.1
- Page 139 - Copyright © 2012 Life Technologies Corporation
For Research Use Only. Not intended for any animal or human therapeutic or diagnostic use.
Contents
Torrent Browser Analysis Report Guide
Run Report Metrics
Run Metrics Overview
Run Report Metrics Before Alignment
Run Report Metrics on Aligned Reads
Barcode Reports
Test Fragment Report
Report Information
Output Files
Plugin Summary
Run the Installed Plugins
Alignment Plugin
Coverage Analysis Plugin
ERCC Analysis Plugin
FastqCreator Plugin
IonReporterUploader Plugin
Run RecognitION Plugin
sampleID Plugin
SFFCreator Plugin
Torrent Variant Caller Plugin
Pre-3.0 Run Reports
Run Report Metrics on Aligned Reads
Torrent Browser Analysis Report Guide
Run Report Metrics on Aligned Reads
This section of a run report provides metrics on aligned reads:
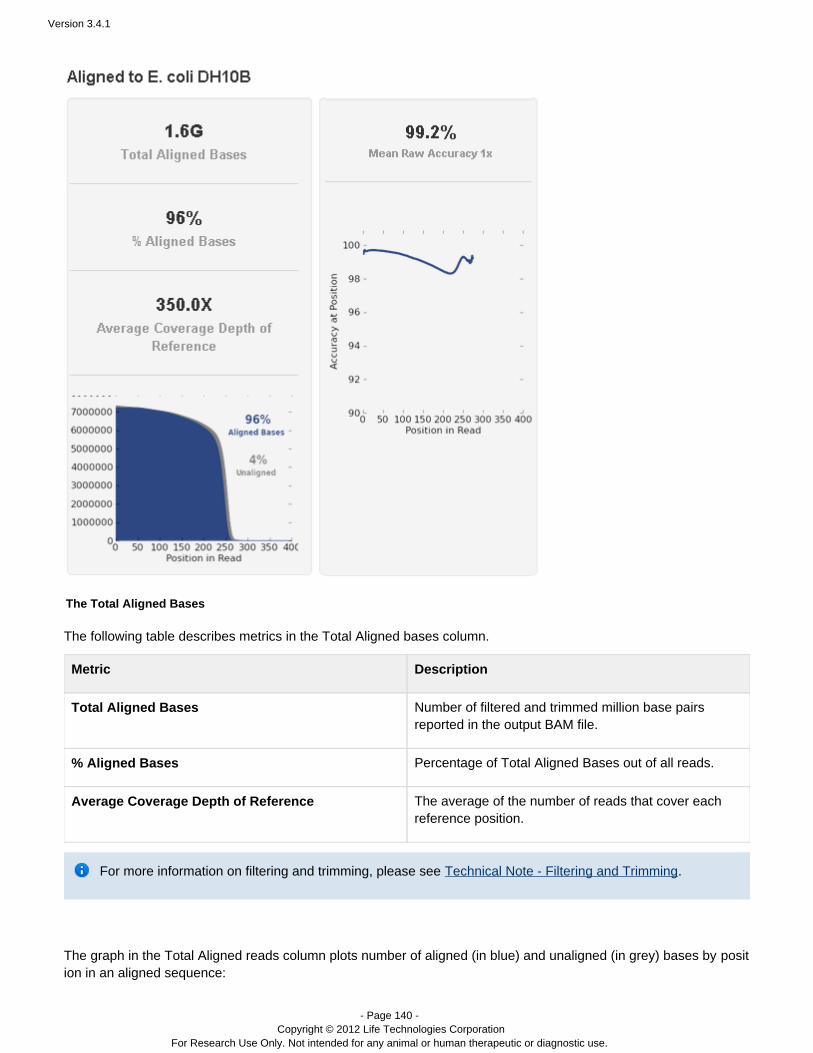
Version 3.4.1
- Page 140 - Copyright © 2012 Life Technologies Corporation
For Research Use Only. Not intended for any animal or human therapeutic or diagnostic use.
The Total Aligned Bases
The following table describes metrics in the Total Aligned bases column.
Metric Description
Total Aligned Bases Number of filtered and trimmed million base pairsreported in the output BAM file.
% Aligned Bases Percentage of Total Aligned Bases out of all reads.
Average Coverage Depth of Reference The average of the number of reads that cover eachreference position.
For more information on filtering and trimming, please see .Technical Note - Filtering and Trimming
The graph in the Total Aligned reads column plots number of aligned (in blue) and unaligned (in grey) bases by position in an aligned sequence:
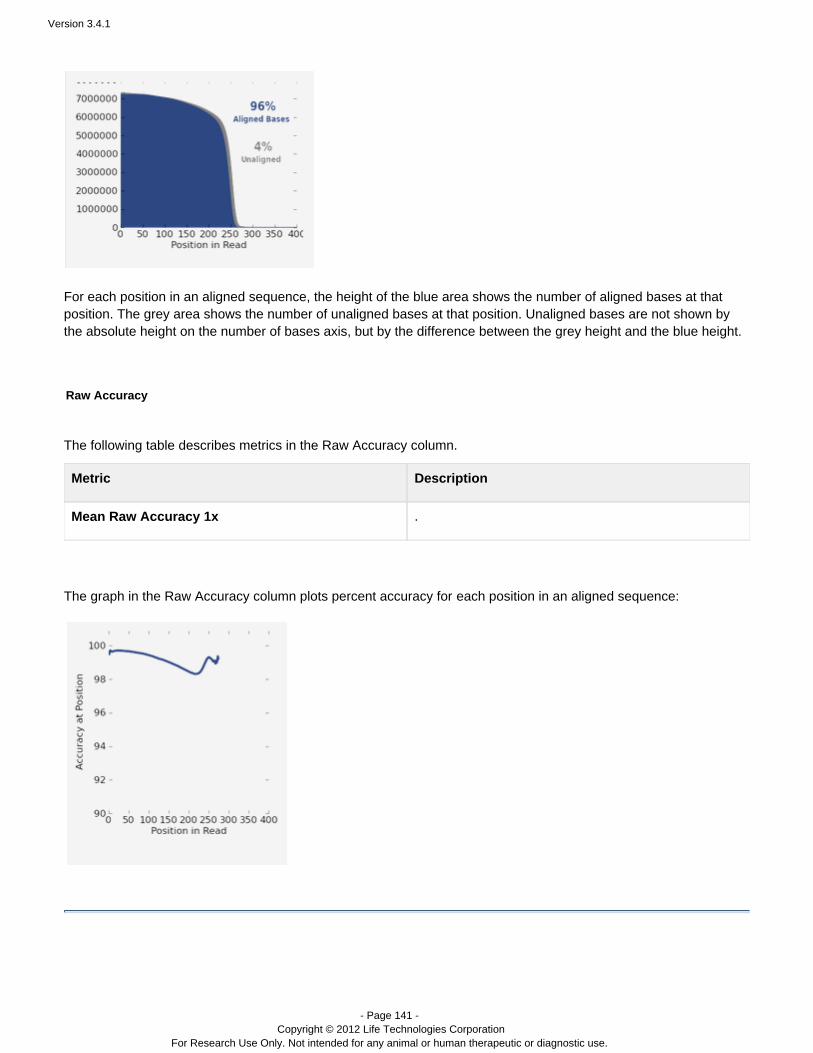
Version 3.4.1
- Page 141 - Copyright © 2012 Life Technologies Corporation
For Research Use Only. Not intended for any animal or human therapeutic or diagnostic use.
For each position in an aligned sequence, the height of the blue area shows the number of aligned bases at thatposition. The grey area shows the number of unaligned bases at that position. Unaligned bases are not shown bythe absolute height on the number of bases axis, but by the difference between the grey height and the blue height.
Raw Accuracy
The following table describes metrics in the Raw Accuracy column.
Metric Description
Mean Raw Accuracy 1x .
The graph in the Raw Accuracy column plots percent accuracy for each position in an aligned sequence:
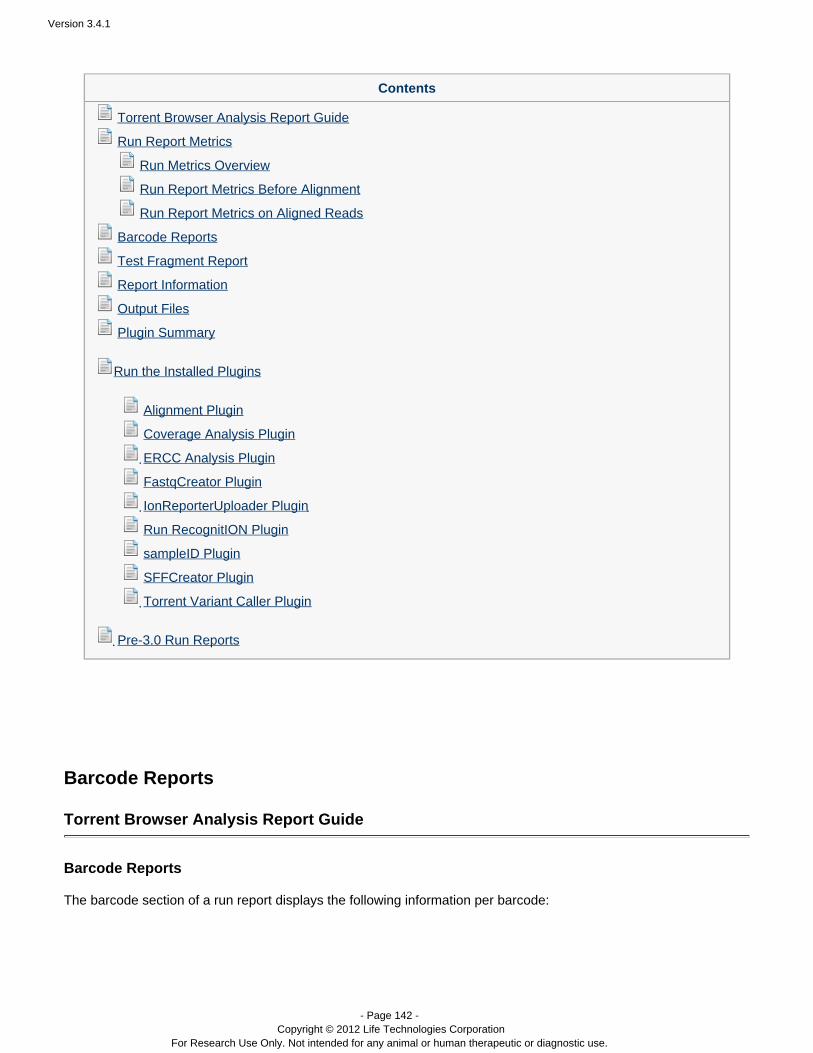
Version 3.4.1
- Page 142 - Copyright © 2012 Life Technologies Corporation
For Research Use Only. Not intended for any animal or human therapeutic or diagnostic use.
Contents
Torrent Browser Analysis Report Guide
Run Report Metrics
Run Metrics Overview
Run Report Metrics Before Alignment
Run Report Metrics on Aligned Reads
Barcode Reports
Test Fragment Report
Report Information
Output Files
Plugin Summary
Run the Installed Plugins
Alignment Plugin
Coverage Analysis Plugin
ERCC Analysis Plugin
FastqCreator Plugin
IonReporterUploader Plugin
Run RecognitION Plugin
sampleID Plugin
SFFCreator Plugin
Torrent Variant Caller Plugin
Pre-3.0 Run Reports
Barcode Reports
Torrent Browser Analysis Report Guide
Barcode Reports
The barcode section of a run report displays the following information per barcode:
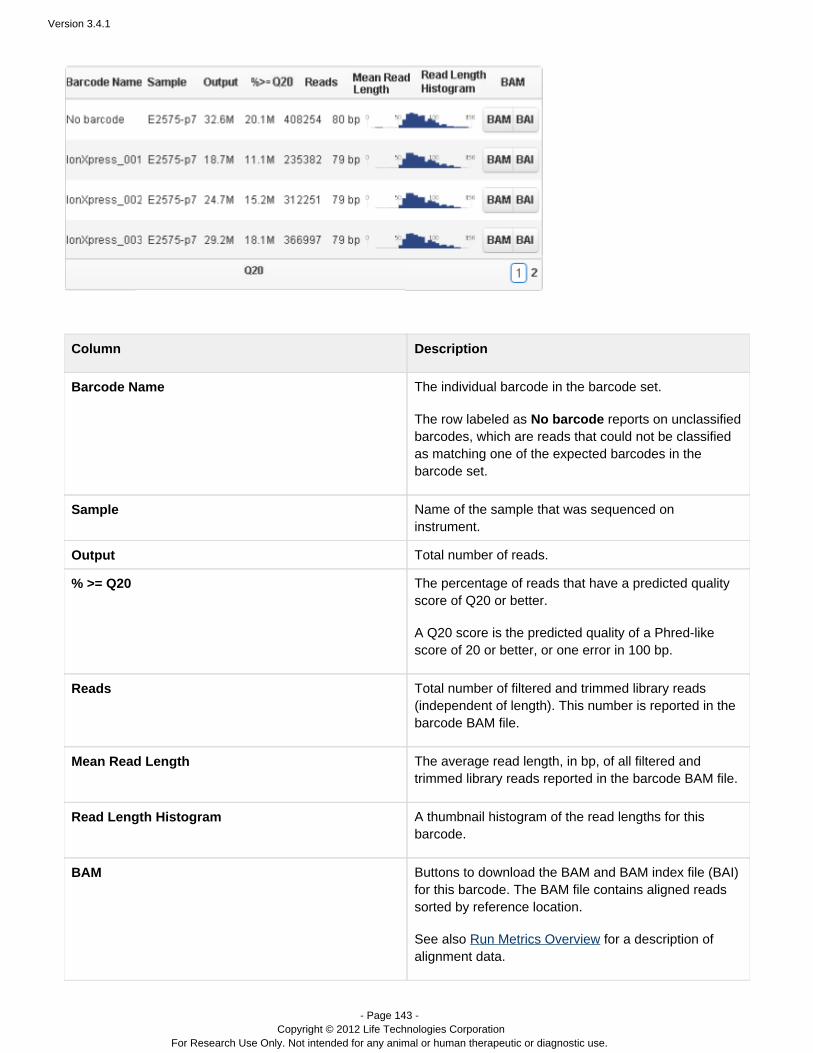
Version 3.4.1
- Page 143 - Copyright © 2012 Life Technologies Corporation
For Research Use Only. Not intended for any animal or human therapeutic or diagnostic use.
Column Description
Barcode Name The individual barcode in the barcode set.
The row labeled as No barcode reports on unclassifiedbarcodes, which are reads that could not be classifiedas matching one of the expected barcodes in thebarcode set.
Sample Name of the sample that was sequenced oninstrument.
Output Total number of reads.
% >= Q20 The percentage of reads that have a predicted qualityscore of Q20 or better.
A Q20 score is the predicted quality of a Phred-likescore of 20 or better, or one error in 100 bp.
Reads Total number of filtered and trimmed library reads(independent of length). This number is reported in thebarcode BAM file.
Mean Read Length The average read length, in bp, of all filtered andtrimmed library reads reported in the barcode BAM file.
Read Length Histogram A thumbnail histogram of the read lengths for thisbarcode.
BAM Buttons to download the BAM and BAM index file (BAI)for this barcode. The BAM file contains aligned readssorted by reference location.
See also for a description ofRun Metrics Overviewalignment data.
Version 3.4.1
- Page 144 - Copyright © 2012 Life Technologies Corporation
For Research Use Only. Not intended for any animal or human therapeutic or diagnostic use.
The number of barcodes shown in the barcode section varies according to the barcode set used in your run and onthe barcodes actually present in the sample. Only data for barcodes present in the run are displayed in the runreport.
Contents
Torrent Browser Analysis Report Guide
Run Report Metrics
Run Metrics Overview
Run Report Metrics Before Alignment
Run Report Metrics on Aligned Reads
Barcode Reports
Test Fragment Report
Report Information
Output Files
Plugin Summary
Run the Installed Plugins
Alignment Plugin
Coverage Analysis Plugin
ERCC Analysis Plugin
FastqCreator Plugin
IonReporterUploader Plugin
Run RecognitION Plugin
sampleID Plugin
SFFCreator Plugin
Torrent Variant Caller Plugin
Pre-3.0 Run Reports
Output Files
Torrent Browser Analysis Report Guide
Output Files
These links permit you to directly download the data and report files. Some files are compressed, using the for.zip
mat, to provide data integrity and to reduce download time.
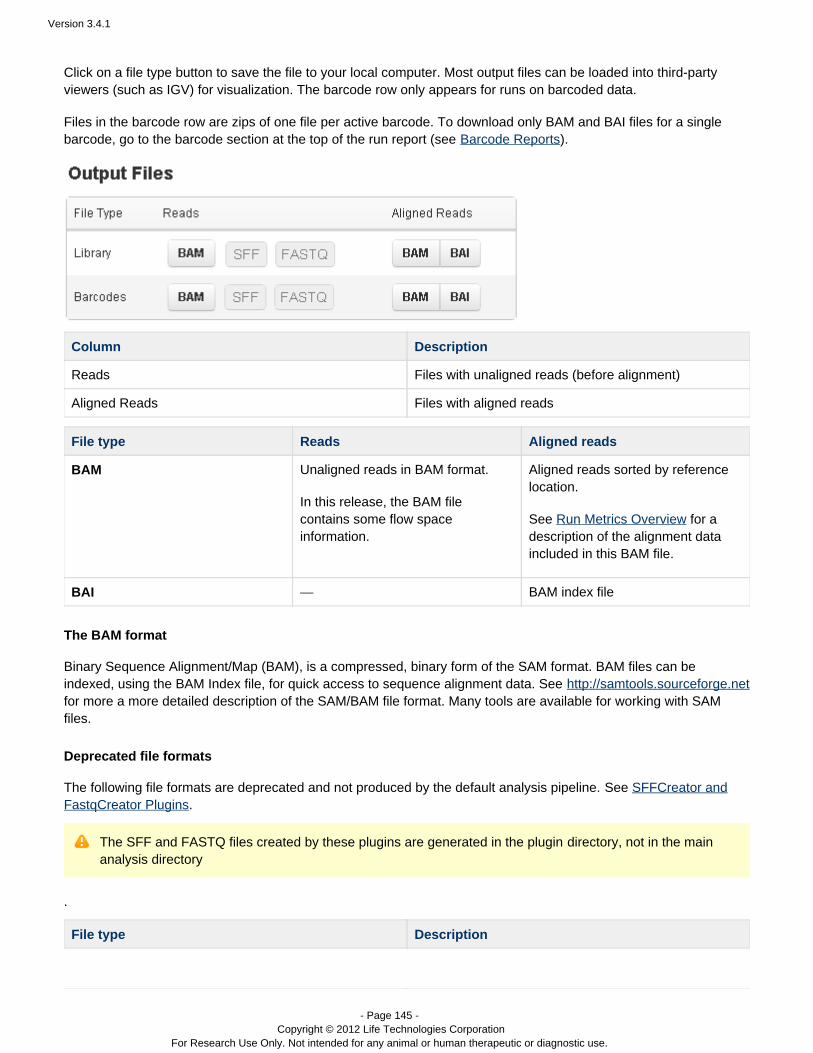
Version 3.4.1
- Page 145 - Copyright © 2012 Life Technologies Corporation
For Research Use Only. Not intended for any animal or human therapeutic or diagnostic use.
Click on a file type button to save the file to your local computer. Most output files can be loaded into third-partyviewers (such as IGV) for visualization. The barcode row only appears for runs on barcoded data.
Files in the barcode row are zips of one file per active barcode. To download only BAM and BAI files for a singlebarcode, go to the barcode section at the top of the run report (see ).Barcode Reports
Column Description
Reads Files with unaligned reads (before alignment)
Aligned Reads Files with aligned reads
File type Reads Aligned reads
BAM Unaligned reads in BAM format.
In this release, the BAM filecontains some flow spaceinformation.
Aligned reads sorted by referencelocation.
See Run Metrics Overview for adescription of the alignment dataincluded in this BAM file.
BAI — BAM index file
The BAM format
Binary Sequence Alignment/Map (BAM), is a compressed, binary form of the SAM format. BAM files can beindexed, using the BAM Index file, for quick access to sequence alignment data. See http://samtools.sourceforge.netfor more a more detailed description of the SAM/BAM file format. Many tools are available for working with SAMfiles.
Deprecated file formats
The following file formats are deprecated and not produced by the default analysis pipeline. See SFFCreator andFastqCreator Plugins.
The SFF and FASTQ files created by these plugins are generated in the plugin , not in the maindirectoryanalysis directory
.
File type Description

Version 3.4.1
- Page 146 - Copyright © 2012 Life Technologies Corporation
For Research Use Only. Not intended for any animal or human therapeutic or diagnostic use.
SFF Compressed (.zip) Standard Flowgram Format (SFF)-formatted file that contains "flow space" data. The bases called in a run are stored in two formats:SFF and FASTQ. Both files contain the nucleotide callsand associated quality values, the SFF files,additionally, contain signal values in flow space and amapping between sequence and flow spaces.
The data are organized on a per flow basis, andcontain information about nucleotide flows that both didand did not result in base incorporation. (See Technical
.)Note - Filtering and Trimming
Note: The SFF file format is deprecated and notproduced by the default pipeline.
FASTQ Compressed (.zip) FASTQ-formatted file containingdata organized in a per-base basis, including qualityscores. The reads contained in the file are unalignedreads. (See .)Technical Note - Filtering and Trimming
Note: The FASTQ file format is deprecated and notproduced by the default pipeline.
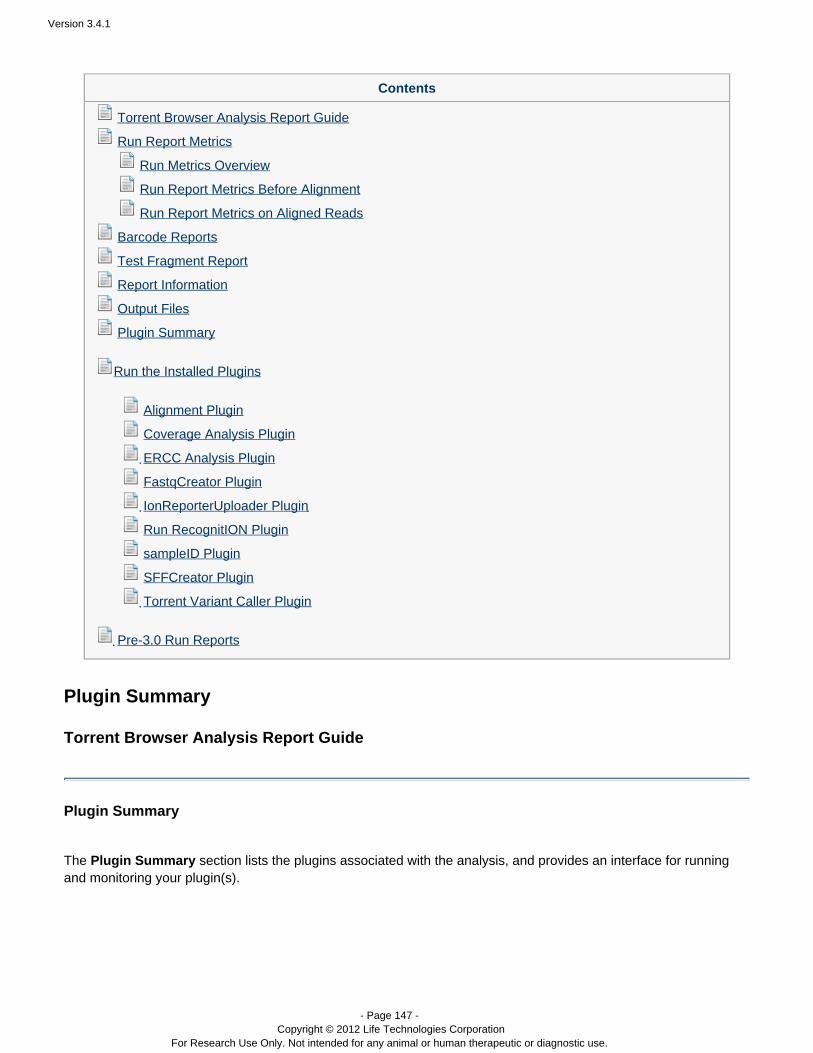
Version 3.4.1
- Page 147 - Copyright © 2012 Life Technologies Corporation
For Research Use Only. Not intended for any animal or human therapeutic or diagnostic use.
Contents
Torrent Browser Analysis Report Guide
Run Report Metrics
Run Metrics Overview
Run Report Metrics Before Alignment
Run Report Metrics on Aligned Reads
Barcode Reports
Test Fragment Report
Report Information
Output Files
Plugin Summary
Run the Installed Plugins
Alignment Plugin
Coverage Analysis Plugin
ERCC Analysis Plugin
FastqCreator Plugin
IonReporterUploader Plugin
Run RecognitION Plugin
sampleID Plugin
SFFCreator Plugin
Torrent Variant Caller Plugin
Pre-3.0 Run Reports
Plugin Summary
Torrent Browser Analysis Report Guide
Plugin Summary
The section lists the plugins associated with the analysis, and provides an interface for runningPlugin Summaryand monitoring your plugin(s).
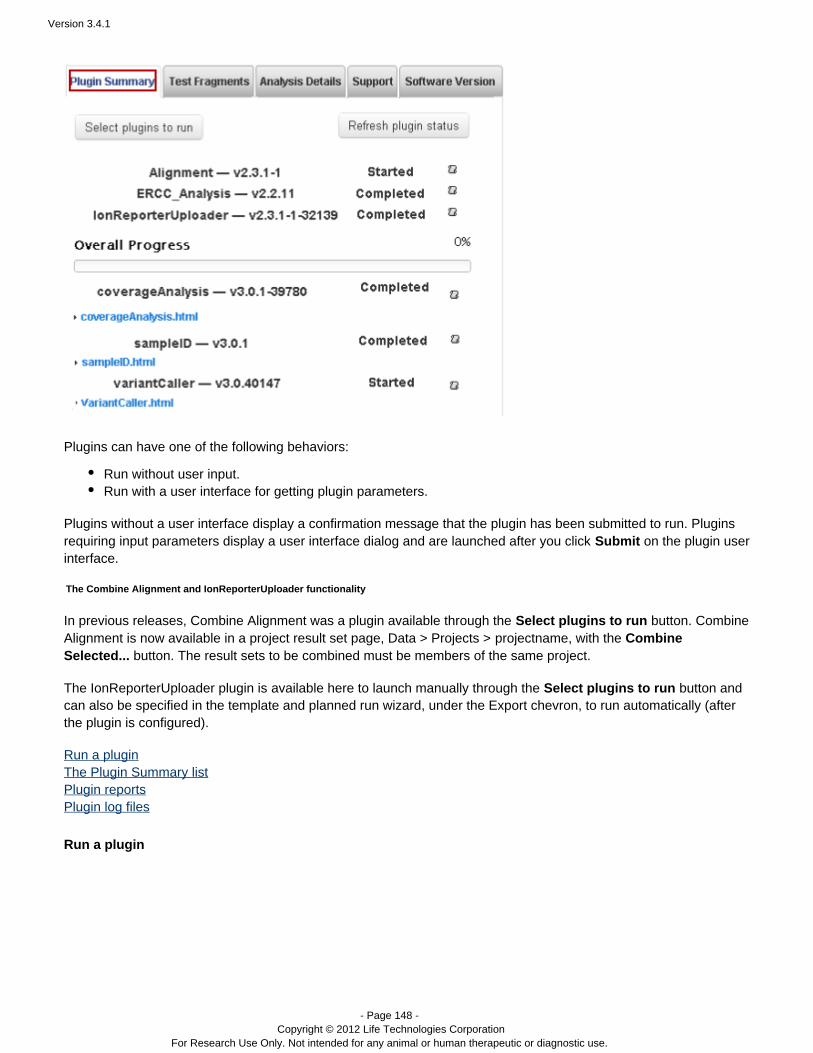
Version 3.4.1
- Page 148 - Copyright © 2012 Life Technologies Corporation
For Research Use Only. Not intended for any animal or human therapeutic or diagnostic use.
Plugins can have one of the following behaviors:
Run without user input.Run with a user interface for getting plugin parameters.
Plugins without a user interface display a confirmation message that the plugin has been submitted to run. Pluginsrequiring input parameters display a user interface dialog and are launched after you click on the plugin userSubmit interface.
The Combine Alignment and IonReporterUploader functionality
In previous releases, Combine Alignment was a plugin available through the button. Select plugins to run CombineAlignment is now available in a project result set page, Data > Projects > , with the projectname Combine
button. The result sets to be combined must be members of the same project.Selected...
The IonReporterUploader plugin is available here to launch manually through the Select plugins to run button andcan also be specified in the template and planned run wizard, under the Export chevron, to run automatically (afterthe plugin is configured).
Run a pluginThe Plugin Summary listPlugin reportsPlugin log files
Run a plugin
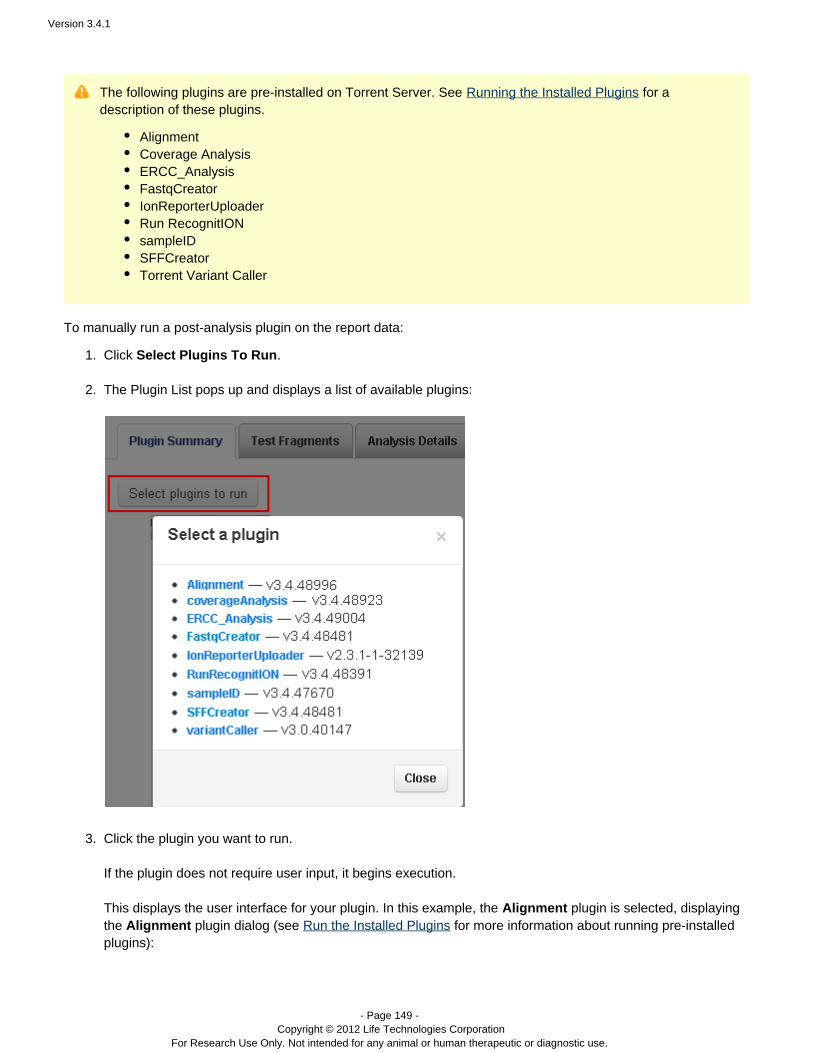
Version 3.4.1
- Page 149 - Copyright © 2012 Life Technologies Corporation
For Research Use Only. Not intended for any animal or human therapeutic or diagnostic use.
1.
2.
3.
The following plugins are pre-installed on Torrent Server. See for aRunning the Installed Pluginsdescription of these plugins.
AlignmentCoverage AnalysisERCC_AnalysisFastqCreatorIonReporterUploaderRun RecognitIONsampleIDSFFCreatorTorrent Variant Caller
To manually run a post-analysis plugin on the report data:
Click .Select Plugins To Run The Plugin List pops up and displays a list of available plugins:
Click the plugin you want to run. If the plugin does not require user input, it begins execution. This displays the user interface for your plugin. In this example, the plugin is selected, displayingAlignmentthe plugin dialog (see for more information about running pre-installedAlignment Run the Installed Pluginsplugins):
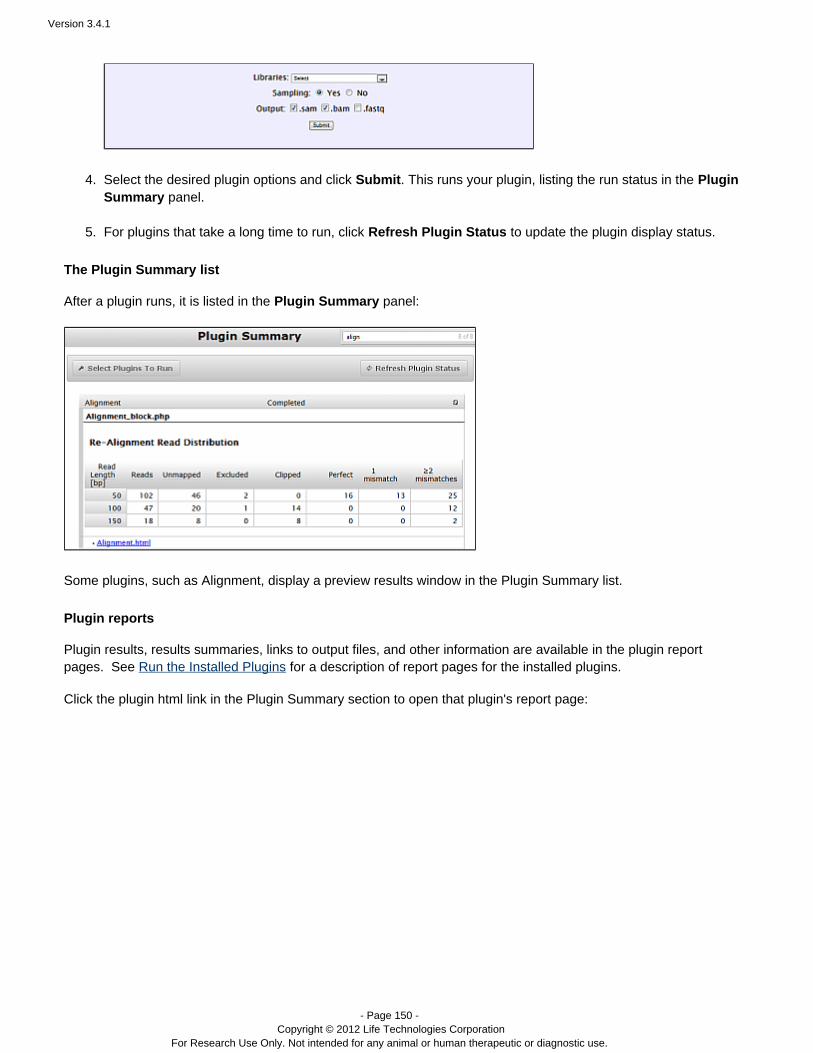
Version 3.4.1
- Page 150 - Copyright © 2012 Life Technologies Corporation
For Research Use Only. Not intended for any animal or human therapeutic or diagnostic use.
3.
4.
5.
Select the desired plugin options and click . This runs your plugin, listing the run status in the Submit Plugin
panel.Summary For plugins that take a long time to run, click to update the plugin display status.Refresh Plugin Status
The Plugin Summary list
After a plugin runs, it is listed in the panel:Plugin Summary
Some plugins, such as Alignment, display a preview results window in the Plugin Summary list.
Plugin reports
Plugin results, results summaries, links to output files, and other information are available in the plugin reportpages. See for a description of report pages for the installed plugins.Run the Installed Plugins
Click the plugin html link in the Plugin Summary section to open that plugin's report page:
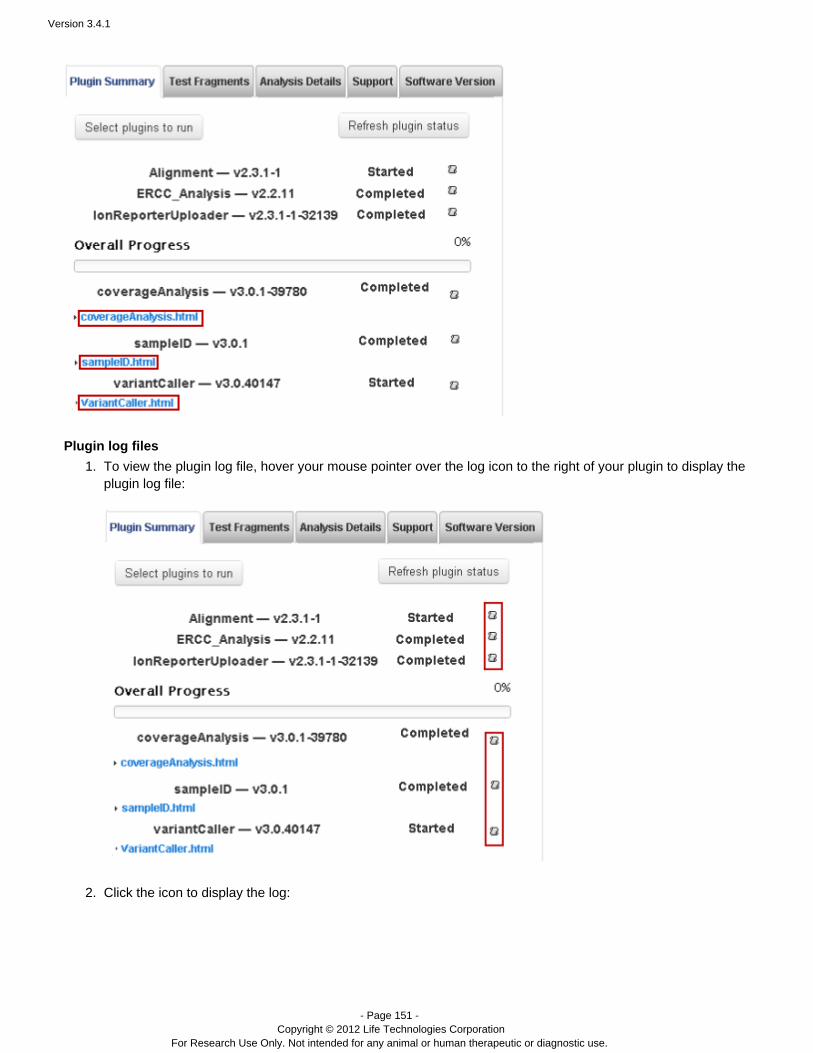
Version 3.4.1
- Page 151 - Copyright © 2012 Life Technologies Corporation
For Research Use Only. Not intended for any animal or human therapeutic or diagnostic use.
1.
2.
Plugin log files
To view the plugin log file, hover your mouse pointer over the log icon to the right of your plugin to display theplugin log file:
Click the icon to display the log:

Version 3.4.1
- Page 152 - Copyright © 2012 Life Technologies Corporation
For Research Use Only. Not intended for any animal or human therapeutic or diagnostic use.
2.
3. Click to exit the display.Close
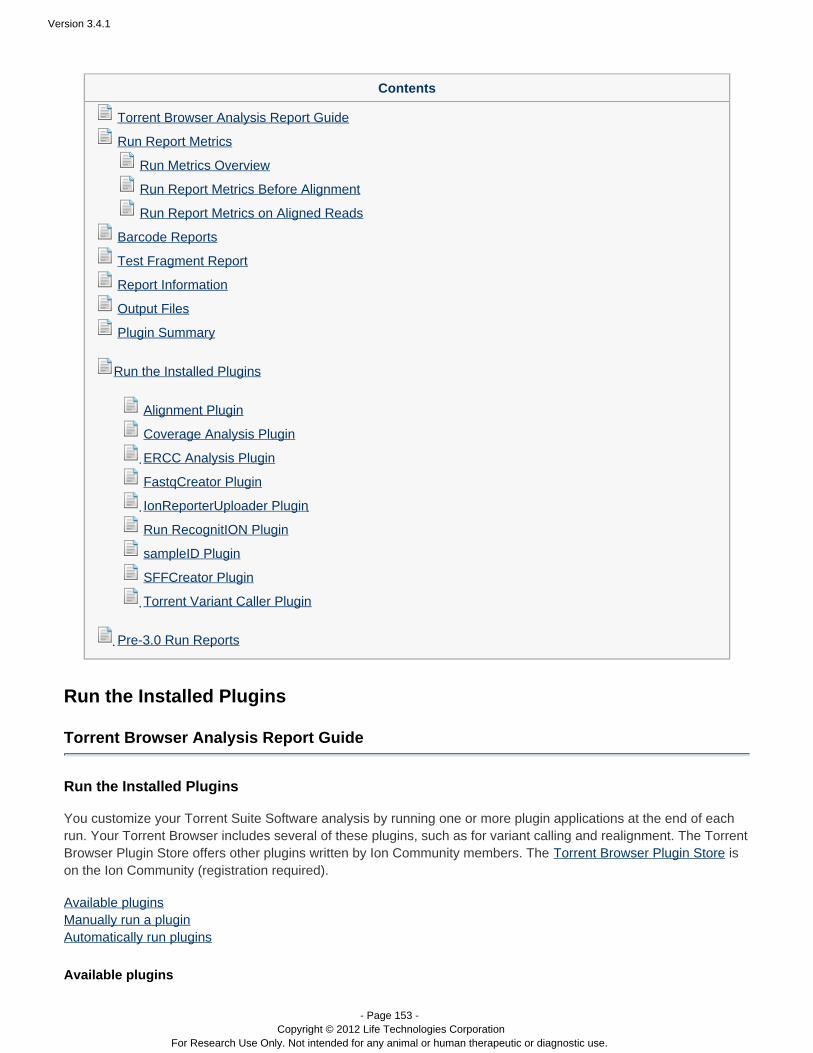
Version 3.4.1
- Page 153 - Copyright © 2012 Life Technologies Corporation
For Research Use Only. Not intended for any animal or human therapeutic or diagnostic use.
Contents
Torrent Browser Analysis Report Guide
Run Report Metrics
Run Metrics Overview
Run Report Metrics Before Alignment
Run Report Metrics on Aligned Reads
Barcode Reports
Test Fragment Report
Report Information
Output Files
Plugin Summary
Run the Installed Plugins
Alignment Plugin
Coverage Analysis Plugin
ERCC Analysis Plugin
FastqCreator Plugin
IonReporterUploader Plugin
Run RecognitION Plugin
sampleID Plugin
SFFCreator Plugin
Torrent Variant Caller Plugin
Pre-3.0 Run Reports
Run the Installed Plugins
Torrent Browser Analysis Report Guide
Run the Installed Plugins
You customize your analysis by running one or more plugin applications at the end of eachTorrent Suite Softwarerun. Your Torrent Browser includes several of these plugins, such as for variant calling and realignment. The TorrentBrowser Plugin Store offers other plugins written by Ion Community members. The isTorrent Browser Plugin Storeon the Ion Community (registration required).
Available plugins Manually run a pluginAutomatically run plugins
Available plugins
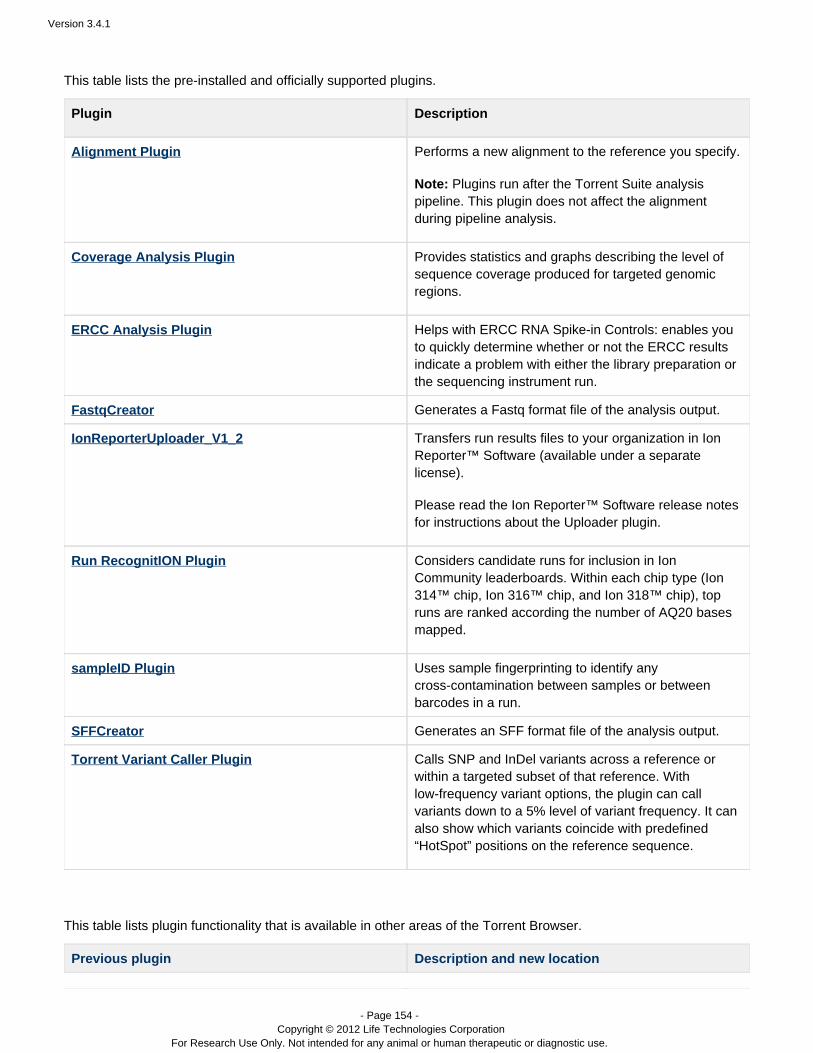
Version 3.4.1
- Page 154 - Copyright © 2012 Life Technologies Corporation
For Research Use Only. Not intended for any animal or human therapeutic or diagnostic use.
This table lists the pre-installed and officially supported plugins.
Plugin Description
Alignment Plugin Performs a new alignment to the reference you specify.
Note: Plugins run after the Torrent Suite analysispipeline. This plugin does not affect the alignmentduring pipeline analysis.
Coverage Analysis Plugin Provides statistics and graphs describing the level ofsequence coverage produced for targeted genomicregions.
ERCC Analysis Plugin Helps with ERCC RNA Spike-in Controls: enables youto quickly determine whether or not the ERCC resultsindicate a problem with either the library preparation orthe sequencing instrument run.
FastqCreator Generates a Fastq format file of the analysis output.
IonReporterUploader_V1_2 Transfers run results files to your organization in IonReporter™ Software (available under a separatelicense).
Please read the Ion Reporter™ Software release notesfor instructions about the Uploader plugin.
Run RecognitION Plugin Considers candidate runs for inclusion in IonCommunity leaderboards. Within each chip type (Ion314™ chip, Ion 316™ chip, and Ion 318™ chip), topruns are ranked according the number of AQ20 basesmapped.
sampleID Plugin Uses sample fingerprinting to identify anycross-contamination between samples or betweenbarcodes in a run.
SFFCreator Generates an SFF format file of the analysis output.
Torrent Variant Caller Plugin Calls SNP and InDel variants across a reference orwithin a targeted subset of that reference. Withlow-frequency variant options, the plugin can callvariants down to a 5% level of variant frequency. It canalso show which variants coincide with predefined“HotSpot” positions on the reference sequence.
This table lists plugin functionality that is available in other areas of the Torrent Browser.
Previous plugin Description and new location

Version 3.4.1
- Page 155 - Copyright © 2012 Life Technologies Corporation
For Research Use Only. Not intended for any animal or human therapeutic or diagnostic use.
1. 2.
3.
IonReporterUploader_V1_2 Transfers run results files to Ion Reporter™ Software(access is available under a separate license).
The IonReporterUploader_V1_2 is selected before asequencing run in the > , > Plan Templates Plan Planne
, and pages. d Run wizard
combineAlignment Combines reads aligned to the specified reference frommultiple run reports. Intended for use when multipleruns analyze the same tissue sample, for examplewhen a tissue sample is run on more than one chip.
You invoke combineAlignment from the project page(see Projects). The runs you combined must bemembers of the same project.
Manually run a plugin
You manually run a plugin in the run report of a completed analysis run, with the button. OnlySelect plugins to runenabled plugins are listed. Follow these steps to manually run a plugin:
Go to the tab, then click the link for your completed analysis run.Data > Completed Runs & Reports In the run report, scroll down to Plugin Summary tab.
The Plugin Summary also lists any plugins that executed on your run (not shown in this example). Click to see the list of available on your Torrent Server. See fSelect plugins to run plugins Available Pluginsor the pre-installed plugins. Your server may have additional plugins or other versions installed.
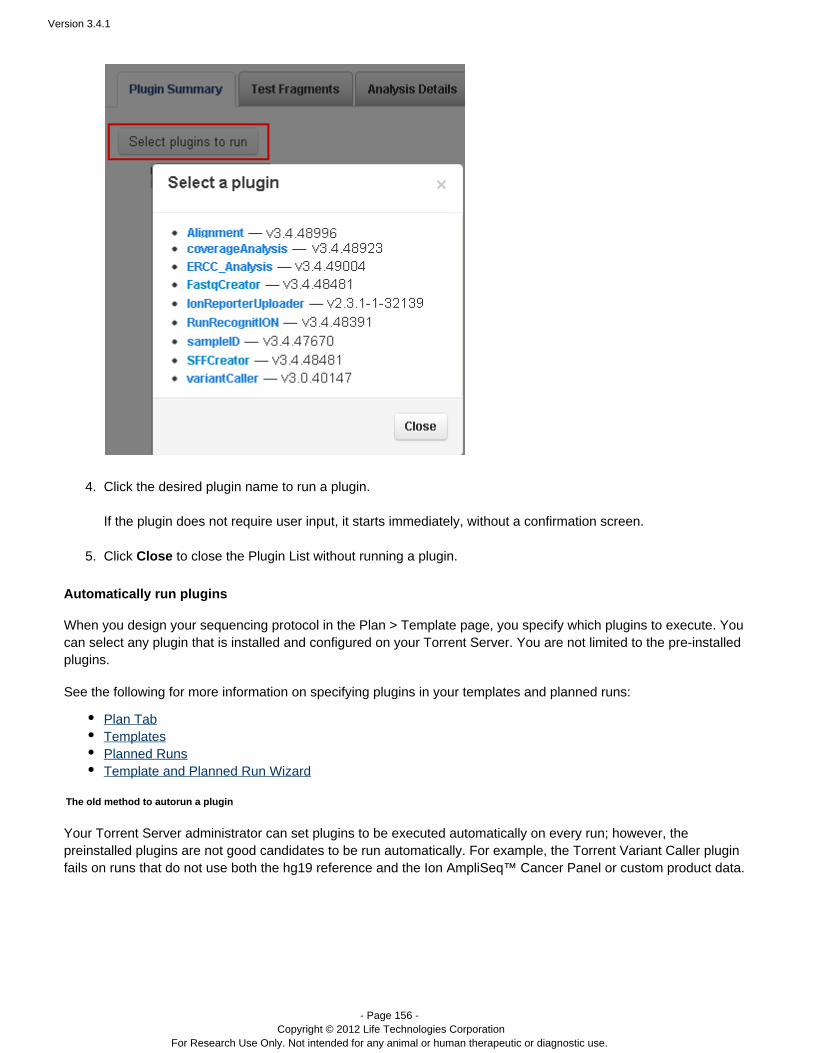
Version 3.4.1
- Page 156 - Copyright © 2012 Life Technologies Corporation
For Research Use Only. Not intended for any animal or human therapeutic or diagnostic use.
3.
4.
5.
Click the desired plugin name to run a plugin. If the plugin does not require user input, it starts immediately, without a confirmation screen. Click to close the Plugin List without running a plugin.Close
Automatically run plugins
When you design your sequencing protocol in the Plan > Template page, you specify which plugins to execute. Youcan select any plugin that is installed and configured on your Torrent Server. You are not limited to the pre-installedplugins.
See the following for more information on specifying plugins in your templates and planned runs:
Plan TabTemplatesPlanned RunsTemplate and Planned Run Wizard
The old method to autorun a plugin
Your Torrent Server administrator can set plugins to be executed automatically on every run; however, thepreinstalled plugins are not good candidates to be run automatically. For example, the Torrent Variant Caller pluginfails on runs that do not use both the hg19 reference and the Ion AmpliSeq™ Cancer Panel or custom product data.
Version 3.4.1
- Page 157 - Copyright © 2012 Life Technologies Corporation
For Research Use Only. Not intended for any animal or human therapeutic or diagnostic use.
The Alignment and RunRecognitION plugins cannot be be executed automatically because they requiremanual user input before every run.
For Ion Reporter users, enabling Autorun with the IonReporterUploader plugin could cause you extra™expense, by transferring unnecessary results to the Ion Reporter server. (The Plan tab allows you to turn™off the plugin for a template and for a planned run.)
Contents
Torrent Browser Analysis Report Guide
Run Report Metrics
Run Metrics Overview
Run Report Metrics Before Alignment
Run Report Metrics on Aligned Reads
Barcode Reports
Test Fragment Report
Report Information
Output Files
Plugin Summary
Run the Installed Plugins
Alignment Plugin
Coverage Analysis Plugin
ERCC Analysis Plugin
FastqCreator Plugin
IonReporterUploader Plugin
Run RecognitION Plugin
sampleID Plugin
SFFCreator Plugin
Torrent Variant Caller Plugin
Pre-3.0 Run Reports
Alignment Plugin
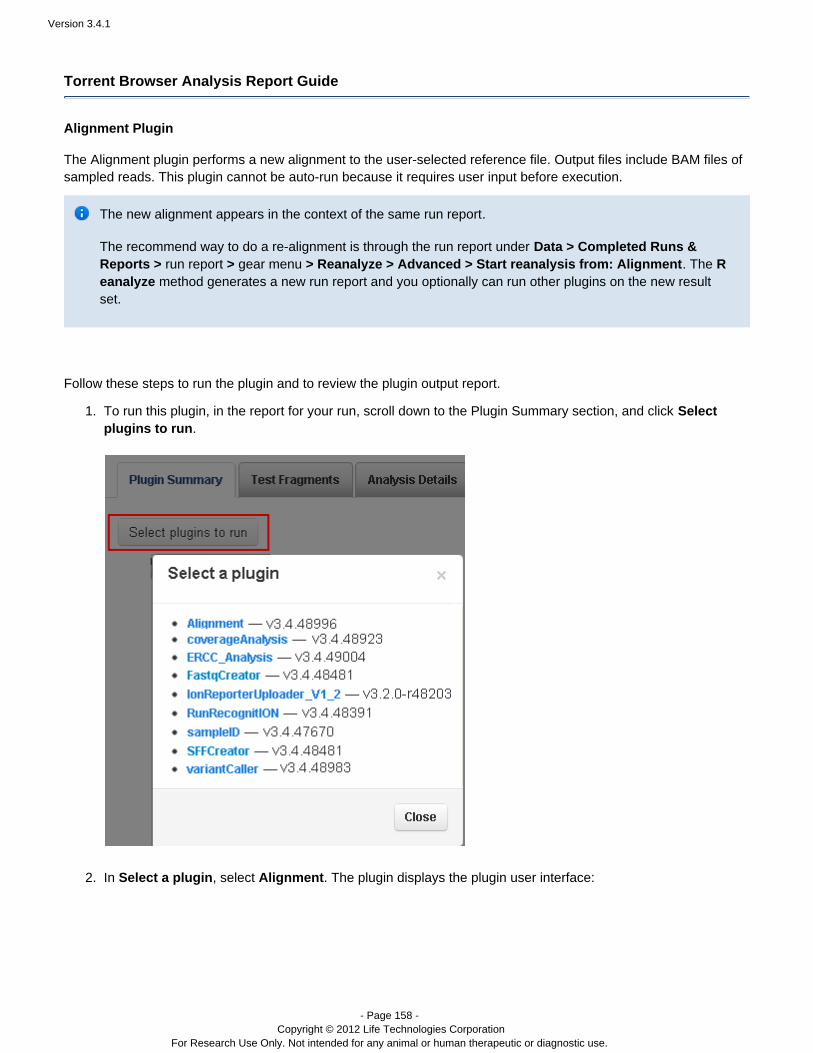
Version 3.4.1
- Page 158 - Copyright © 2012 Life Technologies Corporation
For Research Use Only. Not intended for any animal or human therapeutic or diagnostic use.
1.
2.
Torrent Browser Analysis Report Guide
Alignment Plugin
The Alignment plugin performs a new alignment to the user-selected reference file. Output files include BAM files ofsampled reads. This plugin cannot be auto-run because it requires user input before execution.
The new alignment appears .in the context of the same run report
The recommend way to do a re-alignment is through the run report under Data > Completed Runs & . The Reports > run report > gear menu > Reanalyze > Advanced > Start reanalysis from: Alignment Rmethod generates a new run report and you optionally can run other plugins on the new resulteanalyze
set.
Follow these steps to run the plugin and to review the plugin output report.
To run this plugin, in the report for your run, scroll down to the Plugin Summary section, and click Select.plugins to run
In , select . The plugin displays the plugin user interface:Select a plugin Alignment

Version 3.4.1
- Page 159 - Copyright © 2012 Life Technologies Corporation
For Research Use Only. Not intended for any animal or human therapeutic or diagnostic use.
2.
3.
4.
5.
6.
From the drop-down list, select the desired library.Libraries
Select the desired option.Sampling
Click the checkbox for each of the desired plugin output formats: and ..sam .bam
Click to run the plugin with the specified parameters.Submit
The interface provides feedback that the plugin has started:
On completion, the displays a minimal output preview in the plugin list of the paAlignment Plugin Summarynel:
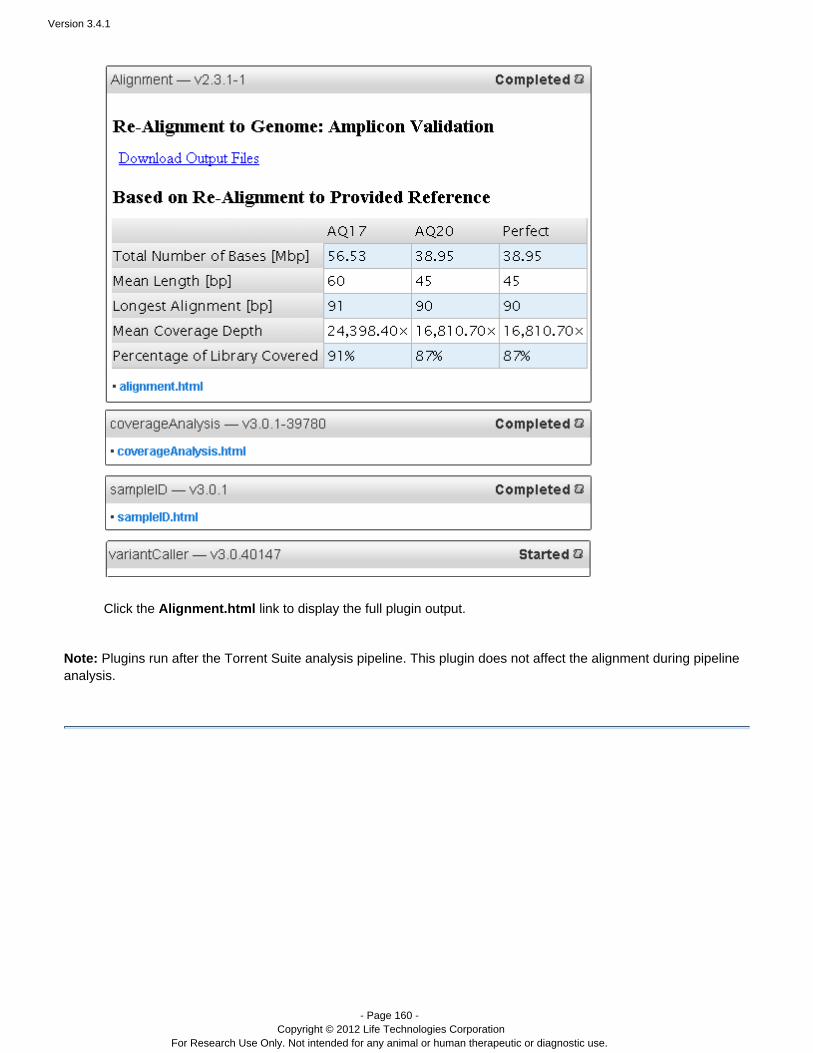
Version 3.4.1
- Page 160 - Copyright © 2012 Life Technologies Corporation
For Research Use Only. Not intended for any animal or human therapeutic or diagnostic use.
6.
Click the link to display the full plugin output.Alignment.html
Plugins run after the Torrent Suite analysis pipeline. This plugin does not affect the alignment during pipelineNote:analysis.
Version 3.4.1
- Page 161 - Copyright © 2012 Life Technologies Corporation
For Research Use Only. Not intended for any animal or human therapeutic or diagnostic use.
Contents
Torrent Browser Analysis Report Guide
Run Report Metrics
Run Metrics Overview
Run Report Metrics Before Alignment
Run Report Metrics on Aligned Reads
Barcode Reports
Test Fragment Report
Report Information
Output Files
Plugin Summary
Run the Installed Plugins
Alignment Plugin
Coverage Analysis Plugin
ERCC Analysis Plugin
FastqCreator Plugin
IonReporterUploader Plugin
Run RecognitION Plugin
sampleID Plugin
SFFCreator Plugin
Torrent Variant Caller Plugin
Pre-3.0 Run Reports
Coverage Analysis Plugin
Torrent Browser Analysis Report Guide
Coverage Analysis Plugin
The Coverage Analysis plugin provides statistics and graphs describing the level of sequence coverage producedfor targeted genomic regions.
You can run the Coverage Analysis plugin automatically or manually.
To run the Coverage Analysis plugin automatically, you select Coverage Analysis plugin during template setup.Refer to the and pages section of the for informationPlan Tab Templates Torrent Browser User Interface Guideabout how to set up a template and create a planned run.

Version 3.4.1
- Page 162 - Copyright © 2012 Life Technologies Corporation
For Research Use Only. Not intended for any animal or human therapeutic or diagnostic use.
To run the Coverage Analysis plugin manually, perform the following steps:
1. In the Torrent Browser, select a run report by clicking a run link, then clicking a report from the dropdown area.The run report opens.
2. On the run report page, scroll about halfway down the screen to the Plugin Summary area. Click Select plugins. The popup appears:to run Select a plugin
3. Select . The Coverage Analysis Plugin interface appears.coverageAnalysis
Version 3.4.1
- Page 163 - Copyright © 2012 Life Technologies Corporation
For Research Use Only. Not intended for any animal or human therapeutic or diagnostic use.
4. Select a library type.
5. If you have one and would like to use it, select a targeted regions file.
6. If you would like to pad the target by a number of bases, enter the desired number. If you do not enter anumber, the default of 0 is used.
7. If you would like the option to examine unique starts, select the checkbox.
8. When you are satisfied with your selections, click .Submit
The analysis runs and a group of output reports is created.
The following sections of this document describe the output reports generated by the Coverage Analysis plugin.
Coverage Analysis Plugin Output
The Coverage Analysis Plugin output is a report called the Coverage Analysis Report. This report includes statisticsabout all reads, and the following information in graphical form:
Target CoverageBinned Target CoverageTarget Coverage by ChromosomeIndividual Target CoverageOn/Off Target Read AlignmentNormalized Target Coverage
In addition, from the bottom of the Coverage Analysis Report, you can download a BAM file or its related BAM indexfile.
All Reads
The All Reads section of the Coverage Analysis Report provides statistics about all reads. The items in this reportare described in the table below.
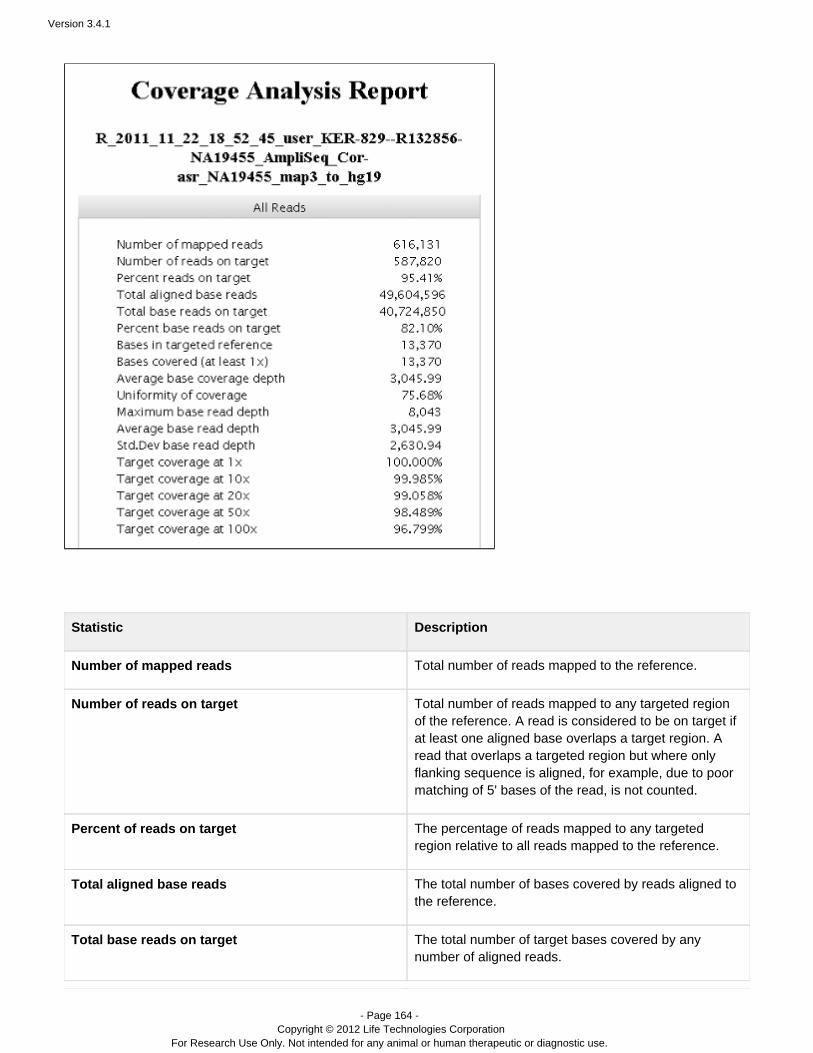
Version 3.4.1
- Page 164 - Copyright © 2012 Life Technologies Corporation
For Research Use Only. Not intended for any animal or human therapeutic or diagnostic use.
Statistic Description
Number of mapped reads Total number of reads mapped to the reference.
Number of reads on target Total number of reads mapped to any targeted regionof the reference. A read is considered to be on target ifat least one aligned base overlaps a target region. Aread that overlaps a targeted region but where onlyflanking sequence is aligned, for example, due to poormatching of 5' bases of the read, is not counted.
Percent of reads on target The percentage of reads mapped to any targetedregion relative to all reads mapped to the reference.
Total aligned base reads The total number of bases covered by reads aligned tothe reference.
Total base reads on target The total number of target bases covered by anynumber of aligned reads.

Version 3.4.1
- Page 165 - Copyright © 2012 Life Technologies Corporation
For Research Use Only. Not intended for any animal or human therapeutic or diagnostic use.
Percent base reads on target The percent of all bases covered by reads aligned tothe reference that covered bases in target regions.
Bases in targeted reference The total number of bases in all target regions of thereference.
Bases covered (at least 1x) The total number of target bases that had at least oneread aligned over the proximal sequence. Only thealigned parts of each read are considered. Forexample, unaligned (soft-cut) bases at the 5' ends ofmapped reads are not considered. Covered targetreference bases may include sample DNA read basemismatches, but does not include read base deletionsin the read, nor insertions between reference bases.
Average base coverage depth The average number of reads of all targeted referencebases...
Uniformity of coverage The percentage of all target bases covered by at least0.2x the average base coverage depth.
Maximum base read depth The maximum number of times any single target basewas read.
Average base read depth The average number of reads of all targeted referencebases that were read at least once.
Std.Dev base read depth The standard deviation (root variance) of the readdepts of all targeted reference bases that were read atleast once.
Target coverage at 1x The percentage of target bases covered by at least oneread.
Target coverage at 10x The percentage of target bases covered by at least tenreads.
Target coverage at 20x The percentage of target bases covered by at least 20reads.
Target coverage at 50x The percentage of target bases covered by at least 50reads.
Target coverage at 100x The percentage of target bases covered by at least 100reads.
Target Coverage Graph
In the Target Coverage graph, target base coverage is plotted against read depth, where read depth is the numberof times a particular base is read and coverage is the number of counts of bases read at that read depth. This plot
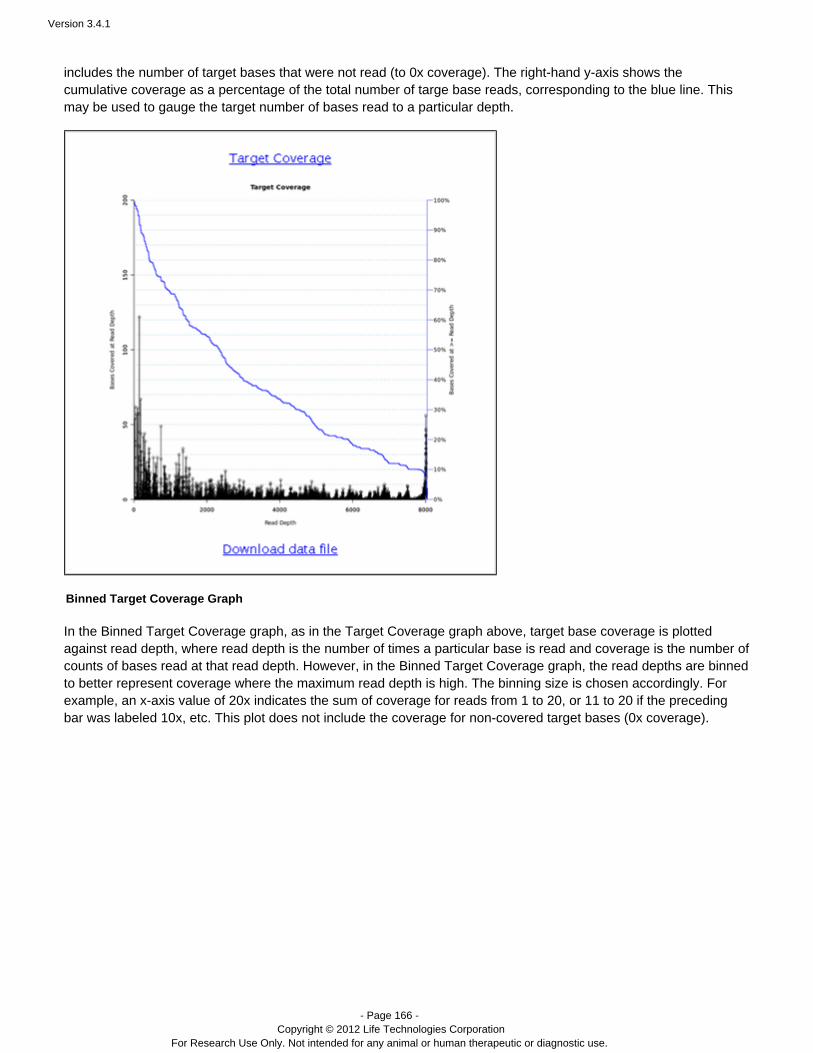
Version 3.4.1
- Page 166 - Copyright © 2012 Life Technologies Corporation
For Research Use Only. Not intended for any animal or human therapeutic or diagnostic use.
includes the number of target bases that were not read (to 0x coverage). The right-hand y-axis shows thecumulative coverage as a percentage of the total number of targe base reads, corresponding to the blue line. Thismay be used to gauge the target number of bases read to a particular depth.
Binned Target Coverage Graph
In the Binned Target Coverage graph, as in the Target Coverage graph above, target base coverage is plottedagainst read depth, where read depth is the number of times a particular base is read and coverage is the number ofcounts of bases read at that read depth. However, in the Binned Target Coverage graph, the read depths are binnedto better represent coverage where the maximum read depth is high. The binning size is chosen accordingly. Forexample, an x-axis value of 20x indicates the sum of coverage for reads from 1 to 20, or 11 to 20 if the precedingbar was labeled 10x, etc. This plot does not include the coverage for non-covered target bases (0x coverage).
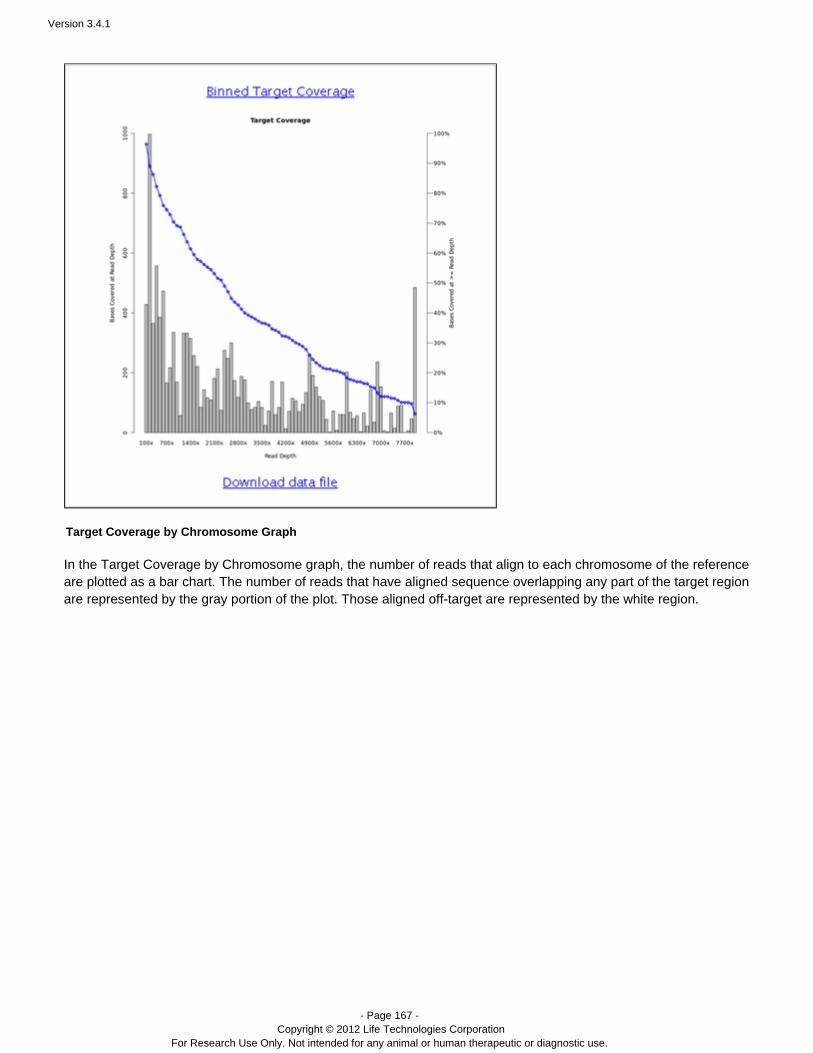
Version 3.4.1
- Page 167 - Copyright © 2012 Life Technologies Corporation
For Research Use Only. Not intended for any animal or human therapeutic or diagnostic use.
Target Coverage by Chromosome Graph
In the Target Coverage by Chromosome graph, the number of reads that align to each chromosome of the referenceare plotted as a bar chart. The number of reads that have aligned sequence overlapping any part of the target regionare represented by the gray portion of the plot. Those aligned off-target are represented by the white region.
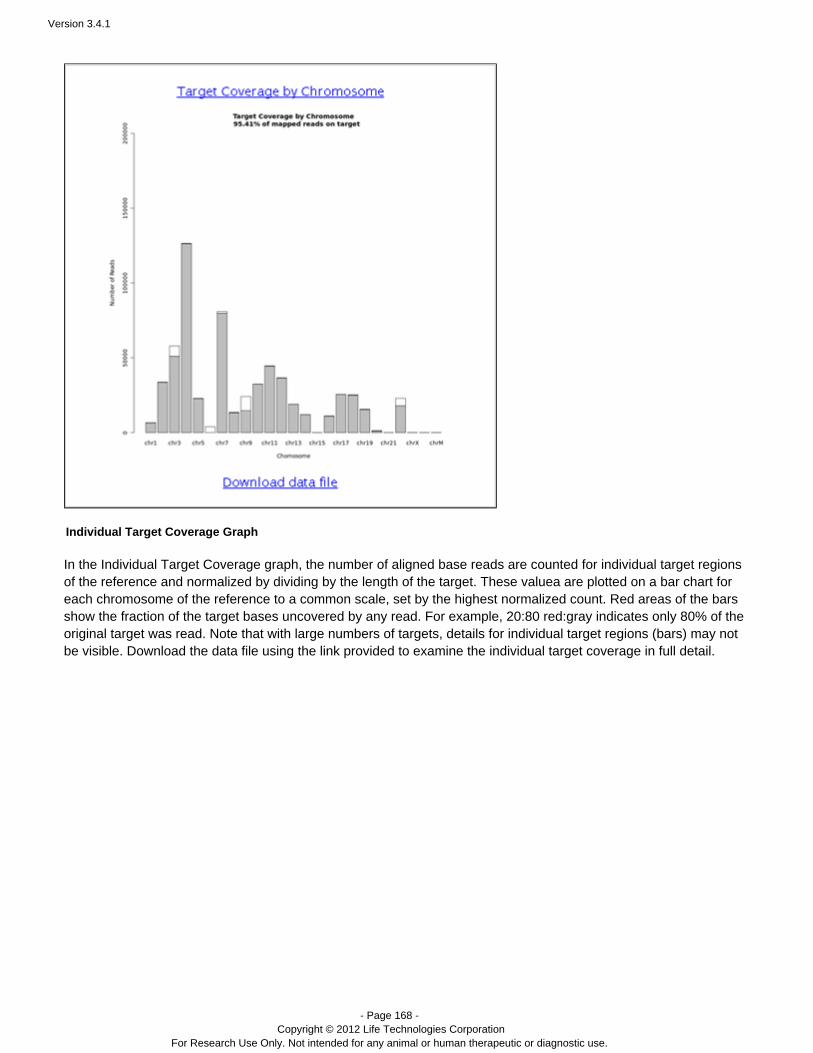
Version 3.4.1
- Page 168 - Copyright © 2012 Life Technologies Corporation
For Research Use Only. Not intended for any animal or human therapeutic or diagnostic use.
Individual Target Coverage Graph
In the Individual Target Coverage graph, the number of aligned base reads are counted for individual target regionsof the reference and normalized by dividing by the length of the target. These valuea are plotted on a bar chart foreach chromosome of the reference to a common scale, set by the highest normalized count. Red areas of the barsshow the fraction of the target bases uncovered by any read. For example, 20:80 red:gray indicates only 80% of theoriginal target was read. Note that with large numbers of targets, details for individual target regions (bars) may notbe visible. Download the data file using the link provided to examine the individual target coverage in full detail.
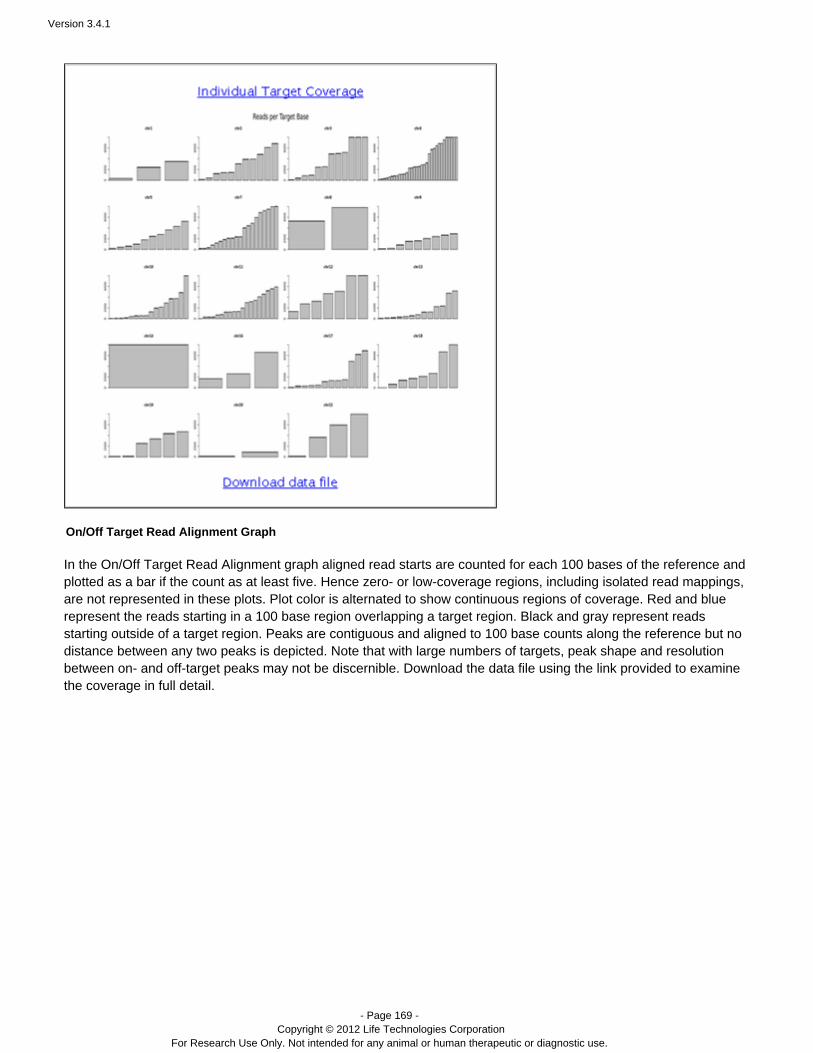
Version 3.4.1
- Page 169 - Copyright © 2012 Life Technologies Corporation
For Research Use Only. Not intended for any animal or human therapeutic or diagnostic use.
On/Off Target Read Alignment Graph
In the On/Off Target Read Alignment graph aligned read starts are counted for each 100 bases of the reference andplotted as a bar if the count as at least five. Hence zero- or low-coverage regions, including isolated read mappings,are not represented in these plots. Plot color is alternated to show continuous regions of coverage. Red and bluerepresent the reads starting in a 100 base region overlapping a target region. Black and gray represent readsstarting outside of a target region. Peaks are contiguous and aligned to 100 base counts along the reference but nodistance between any two peaks is depicted. Note that with large numbers of targets, peak shape and resolutionbetween on- and off-target peaks may not be discernible. Download the data file using the link provided to examinethe coverage in full detail.
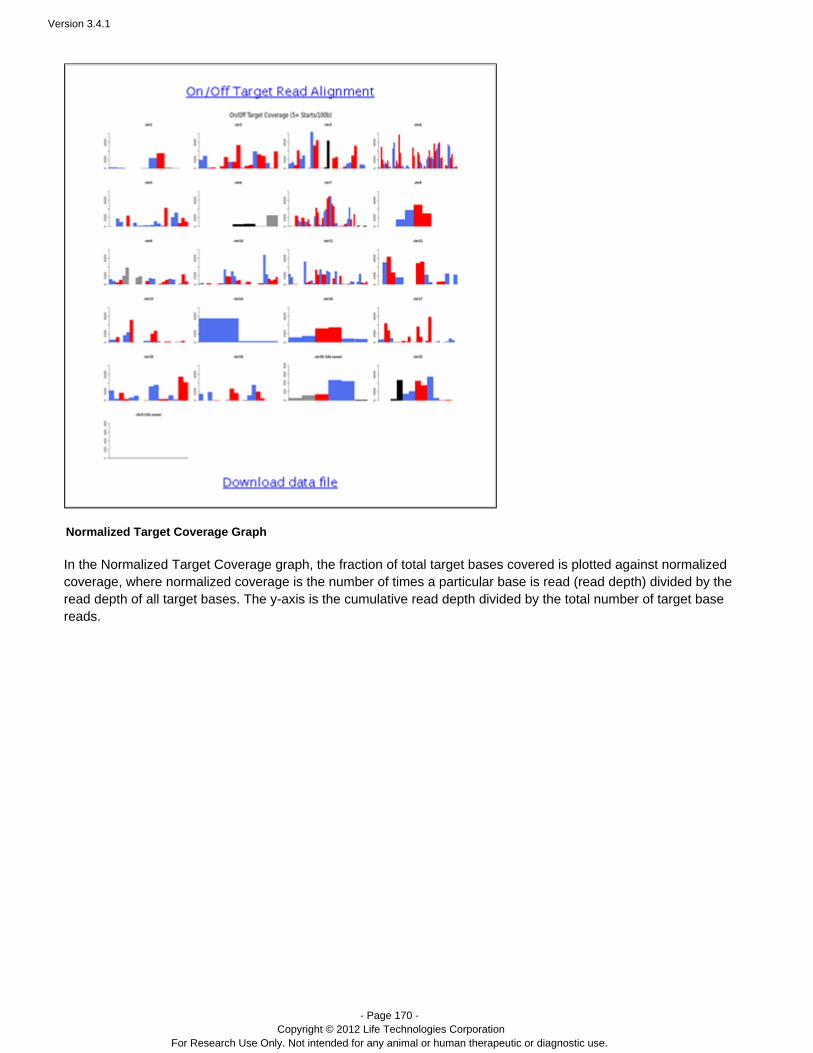
Version 3.4.1
- Page 170 - Copyright © 2012 Life Technologies Corporation
For Research Use Only. Not intended for any animal or human therapeutic or diagnostic use.
Normalized Target Coverage Graph
In the Normalized Target Coverage graph, the fraction of total target bases covered is plotted against normalizedcoverage, where normalized coverage is the number of times a particular base is read (read depth) divided by theread depth of all target bases. The y-axis is the cumulative read depth divided by the total number of target basereads.
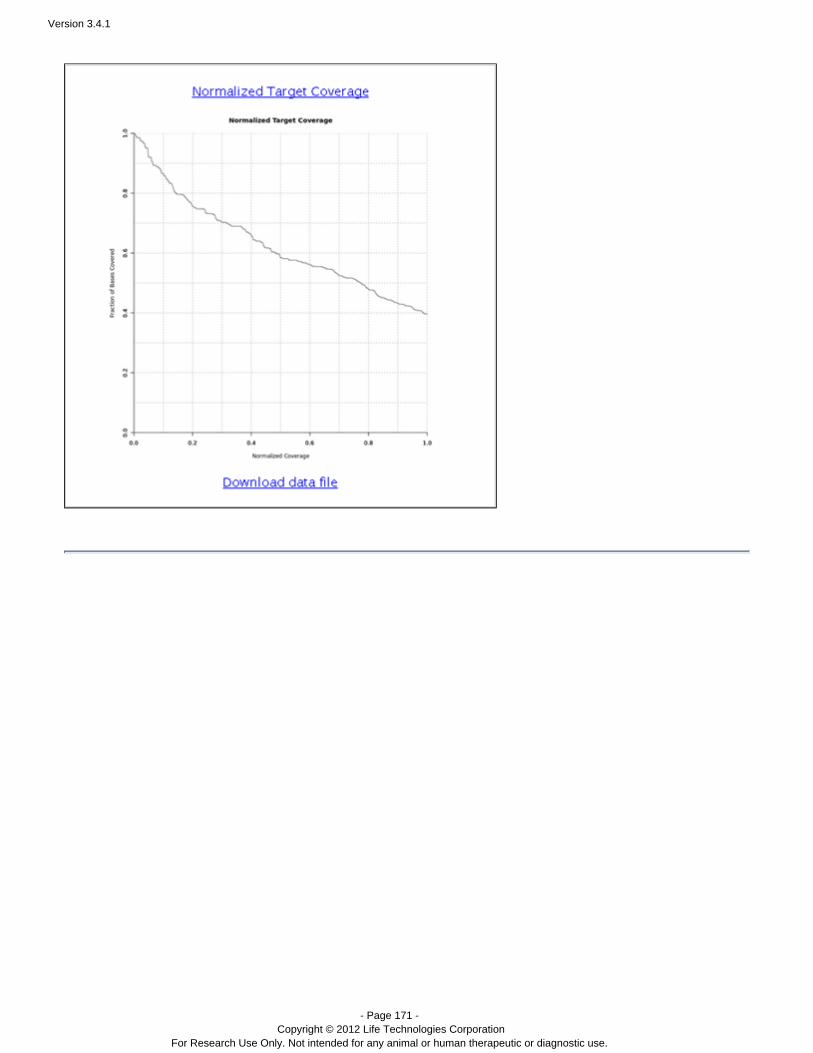
Version 3.4.1
- Page 171 - Copyright © 2012 Life Technologies Corporation
For Research Use Only. Not intended for any animal or human therapeutic or diagnostic use.
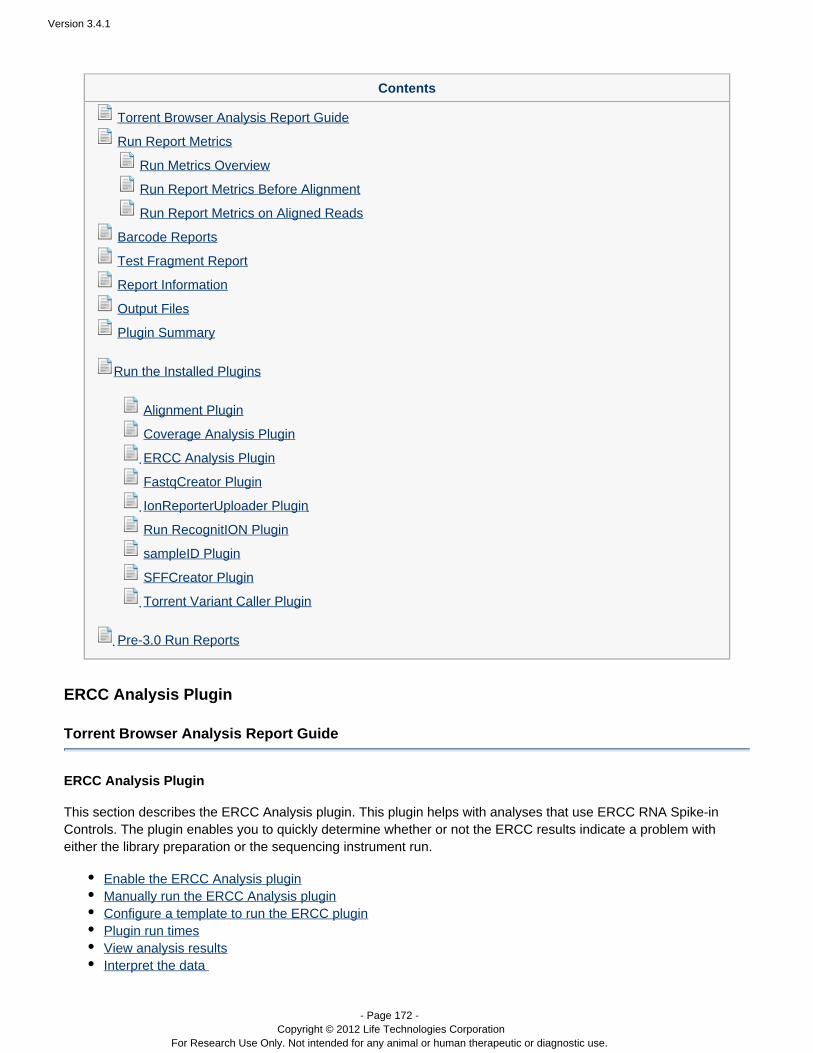
Version 3.4.1
- Page 172 - Copyright © 2012 Life Technologies Corporation
For Research Use Only. Not intended for any animal or human therapeutic or diagnostic use.
Contents
Torrent Browser Analysis Report Guide
Run Report Metrics
Run Metrics Overview
Run Report Metrics Before Alignment
Run Report Metrics on Aligned Reads
Barcode Reports
Test Fragment Report
Report Information
Output Files
Plugin Summary
Run the Installed Plugins
Alignment Plugin
Coverage Analysis Plugin
ERCC Analysis Plugin
FastqCreator Plugin
IonReporterUploader Plugin
Run RecognitION Plugin
sampleID Plugin
SFFCreator Plugin
Torrent Variant Caller Plugin
Pre-3.0 Run Reports
ERCC Analysis Plugin
Torrent Browser Analysis Report Guide
ERCC Analysis Plugin
This section describes the ERCC Analysis plugin. This plugin helps with analyses that use ERCC RNA Spike-inControls. The plugin enables you to quickly determine whether or not the ERCC results indicate a problem witheither the library preparation or the sequencing instrument run.
Enable the ERCC Analysis pluginManually run the ERCC Analysis pluginConfigure a template to run the ERCC pluginPlugin run timesView analysis resultsInterpret the data
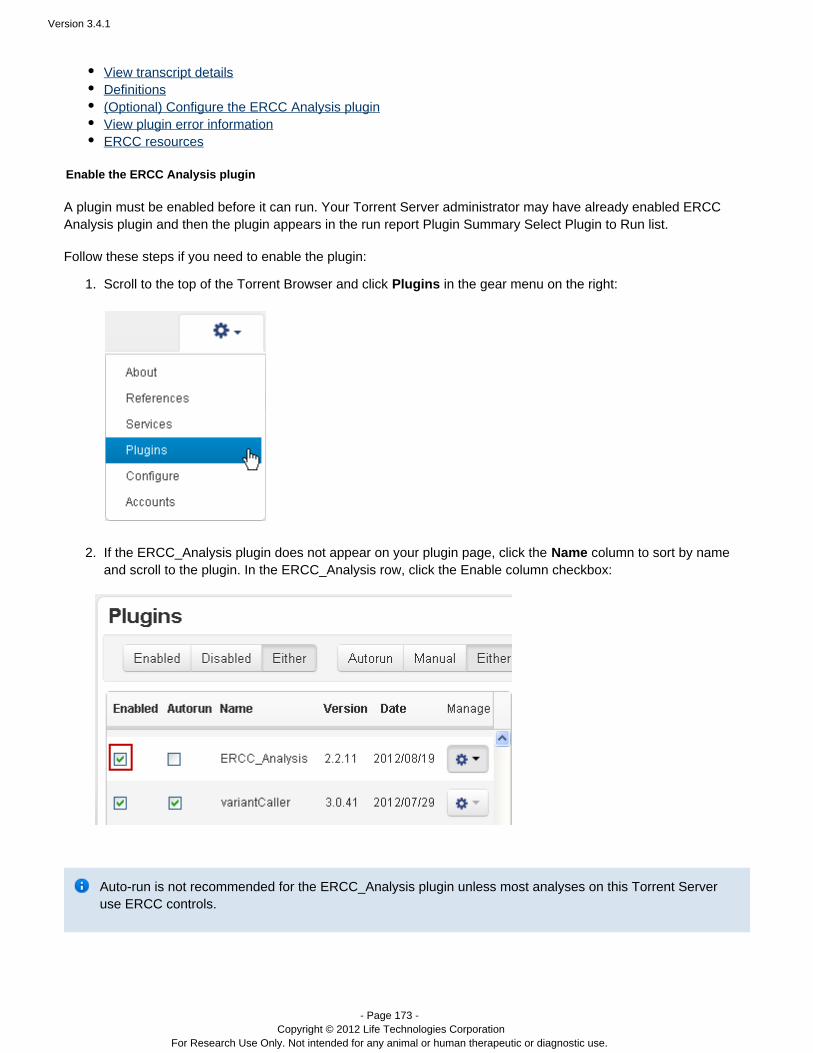
Version 3.4.1
- Page 173 - Copyright © 2012 Life Technologies Corporation
For Research Use Only. Not intended for any animal or human therapeutic or diagnostic use.
1.
2.
View transcript detailsDefinitions( ) Configure the ERCC Optional Analysis pluginView plugin error informationERCC resources
Enable the ERCC Analysis plugin
A plugin must be enabled before it can run. Your Torrent Server administrator may have already enabled ERCCAnalysis plugin and then the plugin appears in the run report Plugin Summary Select Plugin to Run list.
Follow these steps if you need to enable the plugin:
Scroll to the top of the Torrent Browser and click in the gear menu on the right:Plugins
If the ERCC_Analysis plugin does not appear on your plugin page, click the column to sort by nameNameand scroll to the plugin. In the ERCC_Analysis row, click the Enable column checkbox:
Auto-run is not recommended for the ERCC_Analysis plugin unless most analyses on this Torrent Serveruse ERCC controls.

Version 3.4.1
- Page 174 - Copyright © 2012 Life Technologies Corporation
For Research Use Only. Not intended for any animal or human therapeutic or diagnostic use.
1.
2.
3.
4.
5.
Manually run the ERCC Analysis plugin
Follow these steps to manually launch the ERCC_Analysis plugin. You can use the default minimum R-squaredvalue or enter you own value.
Open the run report for the analysis. Scroll down to the Plugin Summary section.
Click to open the plugin list:Select plugin to run
Click . (The version number on your system might be different from the version shown here.)ERCC_Analysis
A popup window with a minimum acceptable R-squared value appears. You can use the default value orenter your own value. The value should be in the range from 0 to 1.
Click to start the plugin.Submit
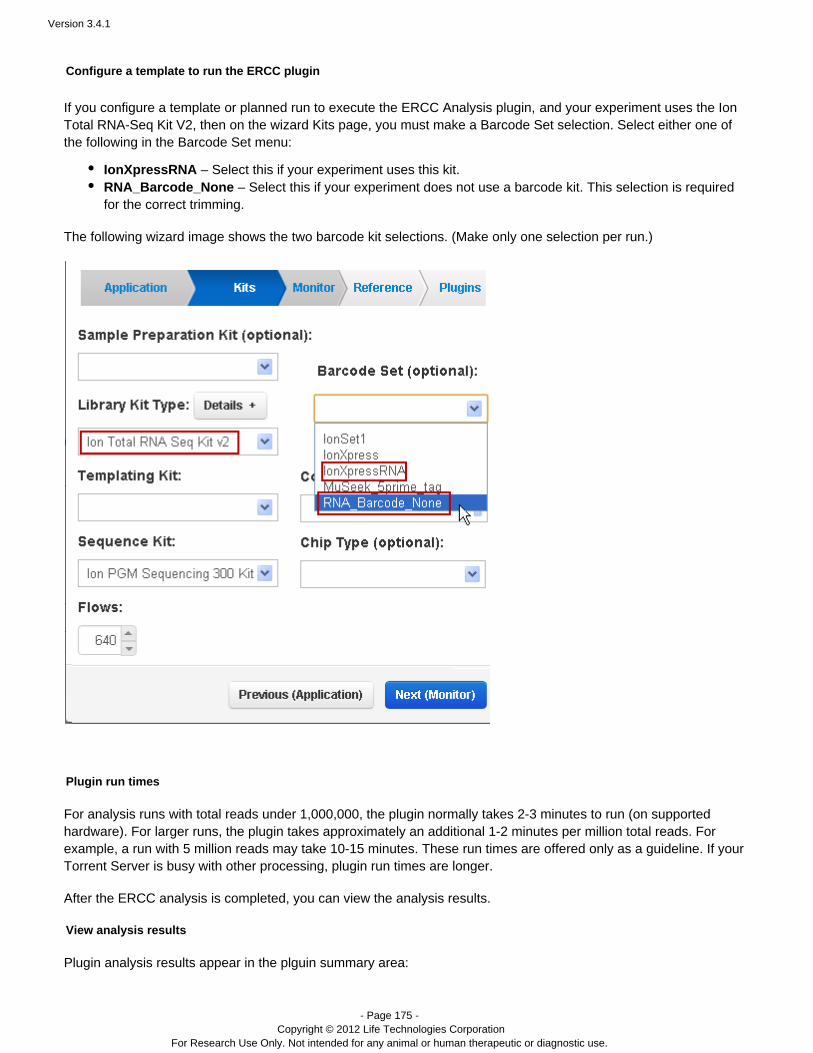
Version 3.4.1
- Page 175 - Copyright © 2012 Life Technologies Corporation
For Research Use Only. Not intended for any animal or human therapeutic or diagnostic use.
Configure a template to run the ERCC plugin
If you configure a template or planned run to execute the ERCC Analysis plugin, your experiment uses the IonandTotal RNA-Seq Kit V2, then on the wizard Kits page, you must make a Barcode Set selection. Select either one ofthe following in the Barcode Set menu:
IonXpressRNA – Select this if your experiment uses this kit. RNA_Barcode_None – Select this if your experiment does not use a barcode kit. This selection is required for the correct trimming.
The following wizard image shows the two barcode kit selections. (Make only one selection per run.)
Plugin run times
For analysis runs with total reads under 1,000,000, the plugin normally takes 2-3 minutes to run (on supportedhardware). For larger runs, the plugin takes approximately an additional 1-2 minutes per million total reads. Forexample, a run with 5 million reads may take 10-15 minutes. These run times are offered only as a guideline. If yourTorrent Server is busy with other processing, plugin run times are longer.
After the ERCC analysis is completed, you can view the analysis results.
View analysis results
Plugin analysis results appear in the plguin summary area:
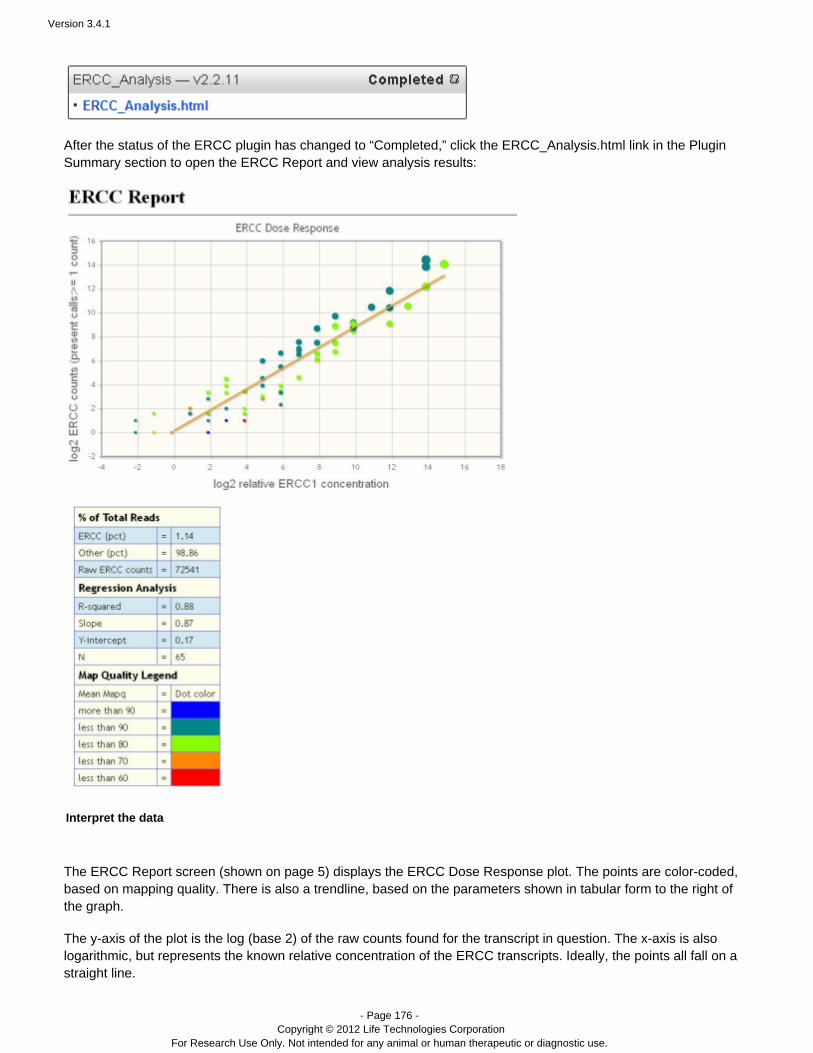
Version 3.4.1
- Page 176 - Copyright © 2012 Life Technologies Corporation
For Research Use Only. Not intended for any animal or human therapeutic or diagnostic use.
After the status of the ERCC plugin has changed to “Completed,” click the ERCC_Analysis.html link in the PluginSummary section to open the ERCC Report and view analysis results:
Interpret the data
The ERCC Report screen (shown on page 5) displays the ERCC Dose Response plot. The points are color-coded,based on mapping quality. There is also a trendline, based on the parameters shown in tabular form to the right ofthe graph.
The y-axis of the plot is the log (base 2) of the raw counts found for the transcript in question. The x-axis is alsologarithmic, but represents the known relative concentration of the ERCC transcripts. Ideally, the points all fall on astraight line.
Version 3.4.1
- Page 177 - Copyright © 2012 Life Technologies Corporation
For Research Use Only. Not intended for any animal or human therapeutic or diagnostic use.
More realistically, in the good case, the raw counts and relative concentration should at least correlate with a highR-squared (for example, 0.9 or higher). The table to the right of the plot (shown on page 5) shows the R-squaredvalue found for this plot, as well as the Slope, Y-intercept, and N (number of transcripts found) values. Althoughthere are 92 transcripts in the ERCC mix, it is not expected that all 92 will be detected. The number of transcriptsdetected depends on the sequencing depth.
View transcript details
If you want to look at the details regarding a particular transcript, there are two methods you can use:
Hover your mouse-cursor over a point on the ERCC Dose Response plot to display a popup window thatshows details about that transcript (the name, reads, and coverage plots).
If several points are very close together on the plot and it is difficult to hover over the point you are interestedin, you can zoom in on the plot to more easily distinguish points:
Use your mouse to draw a box around the point of interest and magnify it.To zoom out to the full view of the ERCC Dose Response plot, either doubleclick the plot, or click the
button.Reset Zoom
Scroll to the particular transcript, and click the [+] next to the transcript name.
This method shows the same information, plus a few additional pieces. See Definitions if the meaning of anyof these pieces is unclear.
Definitions
This section defines terms used in the plugin output.
Coverage Depth – The minimum and maximum number of reads covering bases in the transcript. Ifcoverage is 100%, the minimum value will be > 0.
Coverage – The number of base positions covered by at least one read.
Start Sites – The number of base positions that are the start site for a read.
Unique Start Sites – The number of start sites that have only one read starting at the site.
Coverage CV – Coefficient of Variation for coverage = average coverage / stddev coverage for the entiretranscript.
( ) Configure the ERCC Analysis pluginOptional
You can optionally change the R-squared value to set a default value for the summary report screen:
1. If the window showing the minimum acceptable R-squared value is open, close it. Then scroll to the top ofthe Torrent Browser and click in the gear menu on the top right:Plugins
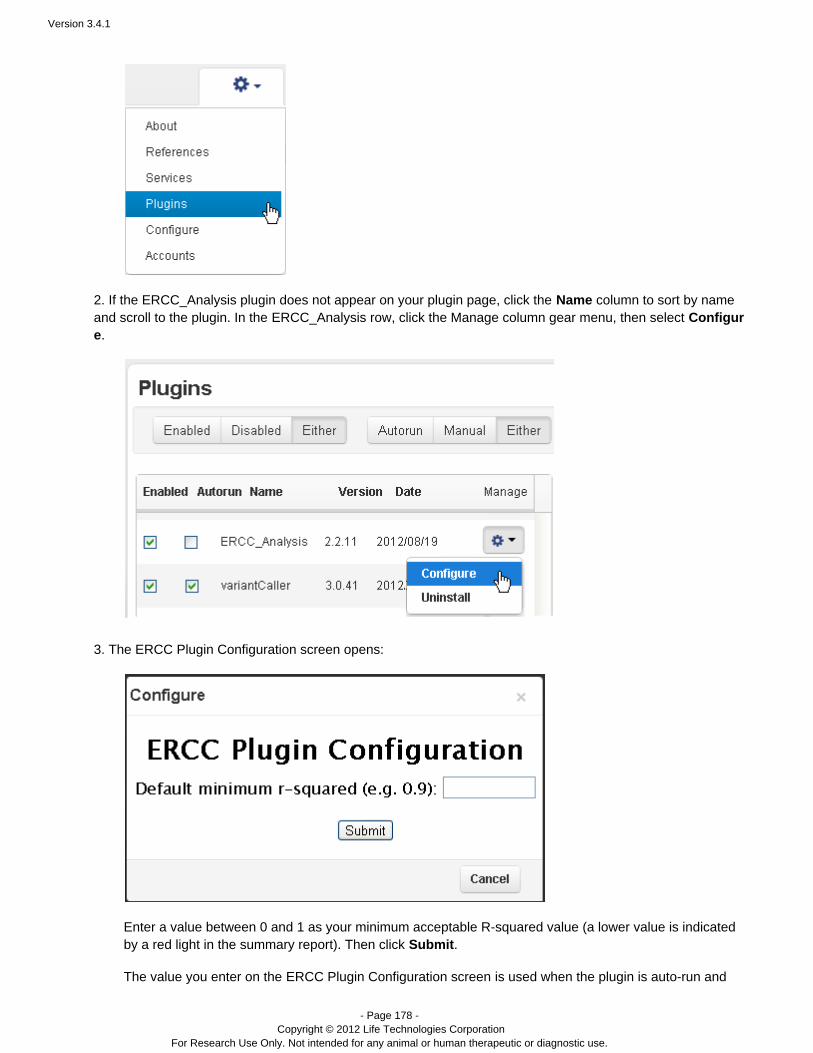
Version 3.4.1
- Page 178 - Copyright © 2012 Life Technologies Corporation
For Research Use Only. Not intended for any animal or human therapeutic or diagnostic use.
2. If the ERCC_Analysis plugin does not appear on your plugin page, click the column to sort by nameNameand scroll to the plugin. In the row, click the Manage column gear menu, then select ERCC_Analysis Configur
.e
3. The ERCC Plugin Configuration screen opens:
Enter a value between 0 and 1 as your minimum acceptable R-squared value (a lower value is indicatedby a red light in the summary report). Then click .Submit
The value you enter on the is used when the plugin is auto-run andERCC Plugin Configuration screen
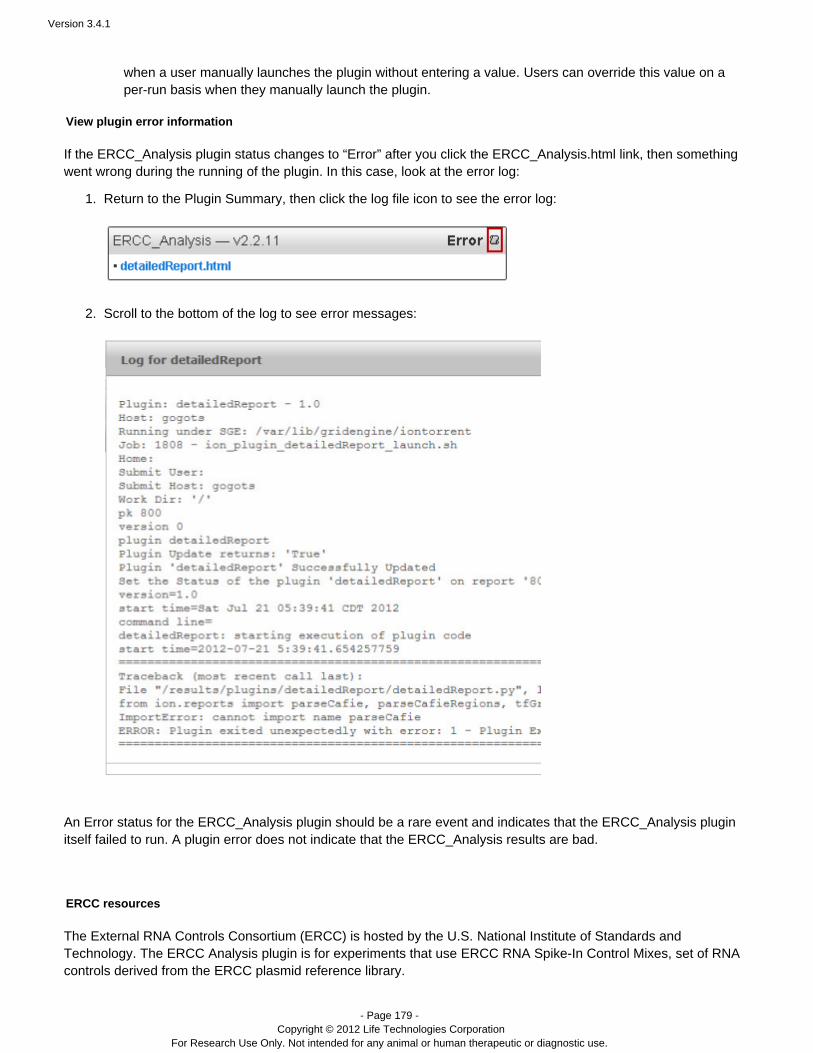
Version 3.4.1
- Page 179 - Copyright © 2012 Life Technologies Corporation
For Research Use Only. Not intended for any animal or human therapeutic or diagnostic use.
1.
2.
when a user Users canmanually launches the plugin without entering a value. override this value on aper-run basis when they manually launch the plugin.
View plugin error information
If the ERCC_Analysis plugin status changes to “Error” after you click the ERCC_Analysis.html link, then somethingwent wrong during the running of the plugin. In this case, look at the error log:
Return to the Plugin Summary, then click the log file icon to see the error log:
Scroll to the bottom of the log to see error messages:
An Error status for the ERCC_Analysis plugin should be a rare event and indicates that the ERCC_Analysis pluginitself failed to run. A plugin error does not indicate that the ERCC_Analysis results are bad.
ERCC resources
The External RNA Controls Consortium (ERCC) is hosted by the U.S. National Institute of Standards andTechnology. The plugin is for experiments that use ERCC Analysis ERCC RNA Spike-In Control Mixes, set of RNAcontrols derived from the ERCC plasmid reference library.
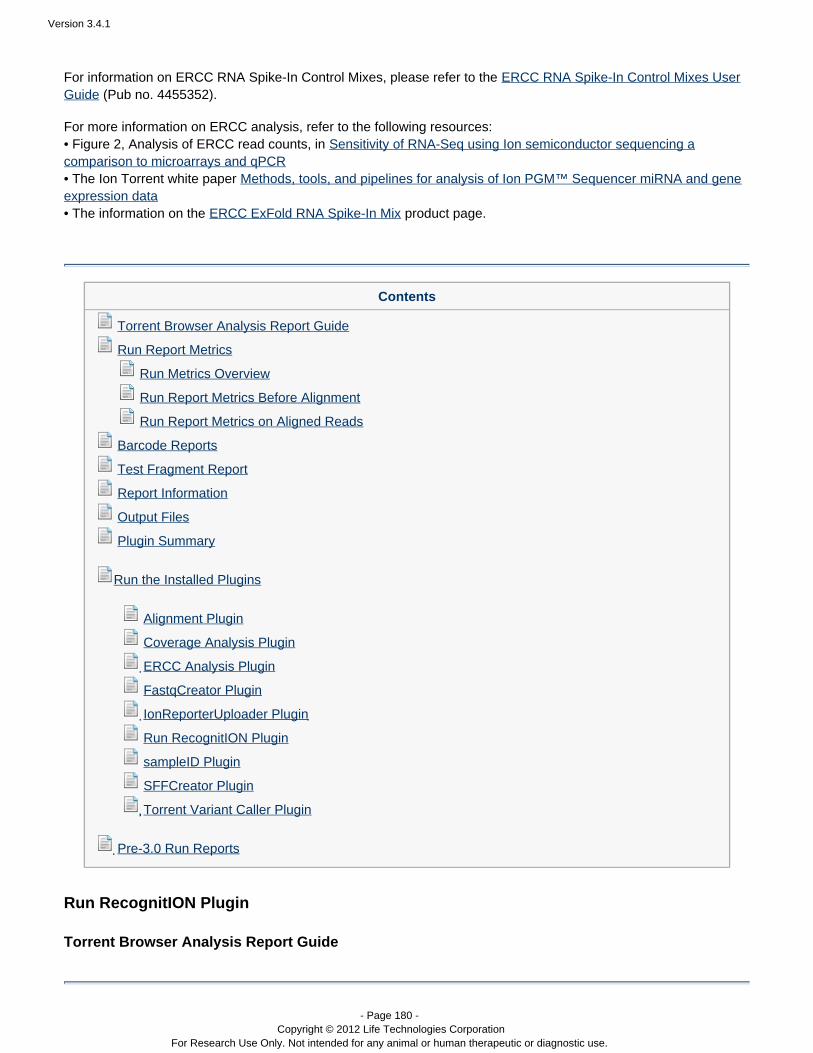
Version 3.4.1
- Page 180 - Copyright © 2012 Life Technologies Corporation
For Research Use Only. Not intended for any animal or human therapeutic or diagnostic use.
For information on ERCC RNA Spike-In Control Mixes, please refer to the ERCC RNA Spike-In Control Mixes User (Pub no. 4455352).Guide
For more information on ERCC analysis, refer to the following resources:• Figure 2, Analysis of ERCC read counts, in Sensitivity of RNA-Seq using Ion semiconductor sequencing acomparison to microarrays and qPCR• The Ion Torrent white paper Methods, tools, and pipelines for analysis of Ion PGM™ Sequencer miRNA and geneexpression data• The information on the product page.ERCC ExFold RNA Spike-In Mix
Contents
Torrent Browser Analysis Report Guide
Run Report Metrics
Run Metrics Overview
Run Report Metrics Before Alignment
Run Report Metrics on Aligned Reads
Barcode Reports
Test Fragment Report
Report Information
Output Files
Plugin Summary
Run the Installed Plugins
Alignment Plugin
Coverage Analysis Plugin
ERCC Analysis Plugin
FastqCreator Plugin
IonReporterUploader Plugin
Run RecognitION Plugin
sampleID Plugin
SFFCreator Plugin
Torrent Variant Caller Plugin
Pre-3.0 Run Reports
Run RecognitION Plugin
Torrent Browser Analysis Report Guide
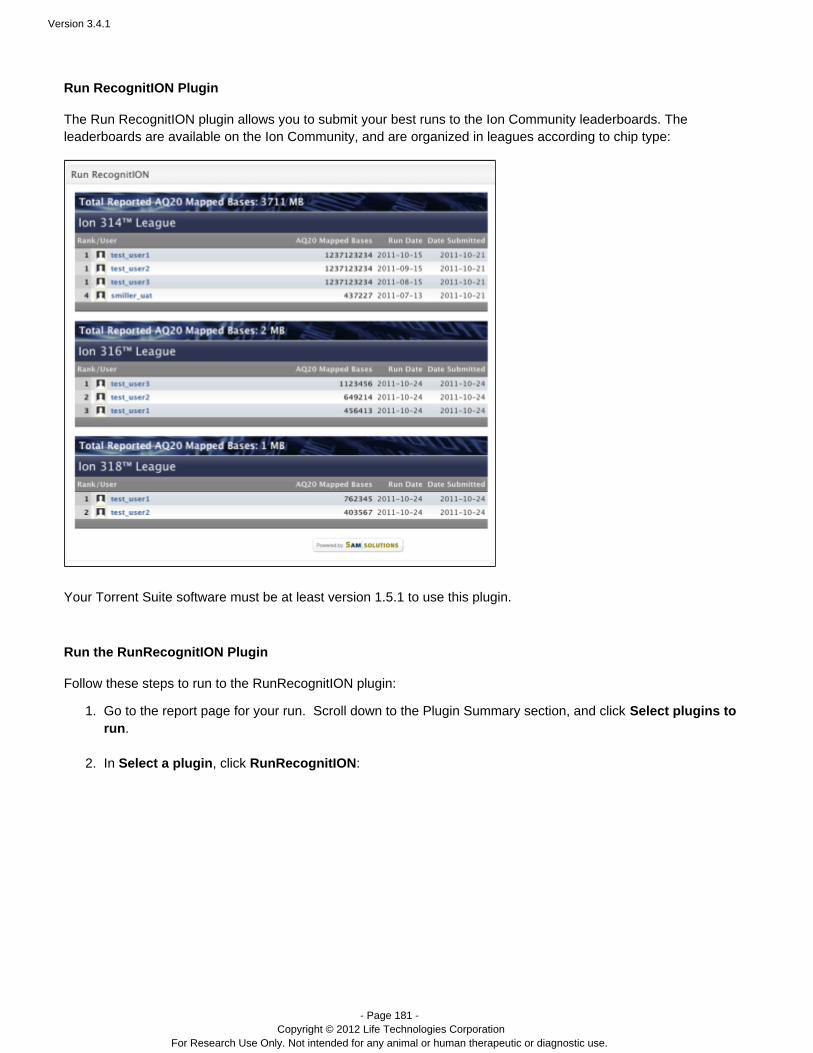
Version 3.4.1
- Page 181 - Copyright © 2012 Life Technologies Corporation
For Research Use Only. Not intended for any animal or human therapeutic or diagnostic use.
1.
2.
Run RecognitION Plugin
The Run RecognitION plugin allows you to submit your best runs to the Ion Community leaderboards. Theleaderboards are available on the Ion Community, and are organized in leagues according to chip type:
Your Torrent Suite software must be at least version 1.5.1 to use this plugin.
Run the RunRecognitION Plugin
Follow these steps to run to the RunRecognitION plugin:
Go to the report page for your run. Scroll down to the Plugin Summary section, and click Select plugins to.run
In , click :Select a plugin RunRecognitION
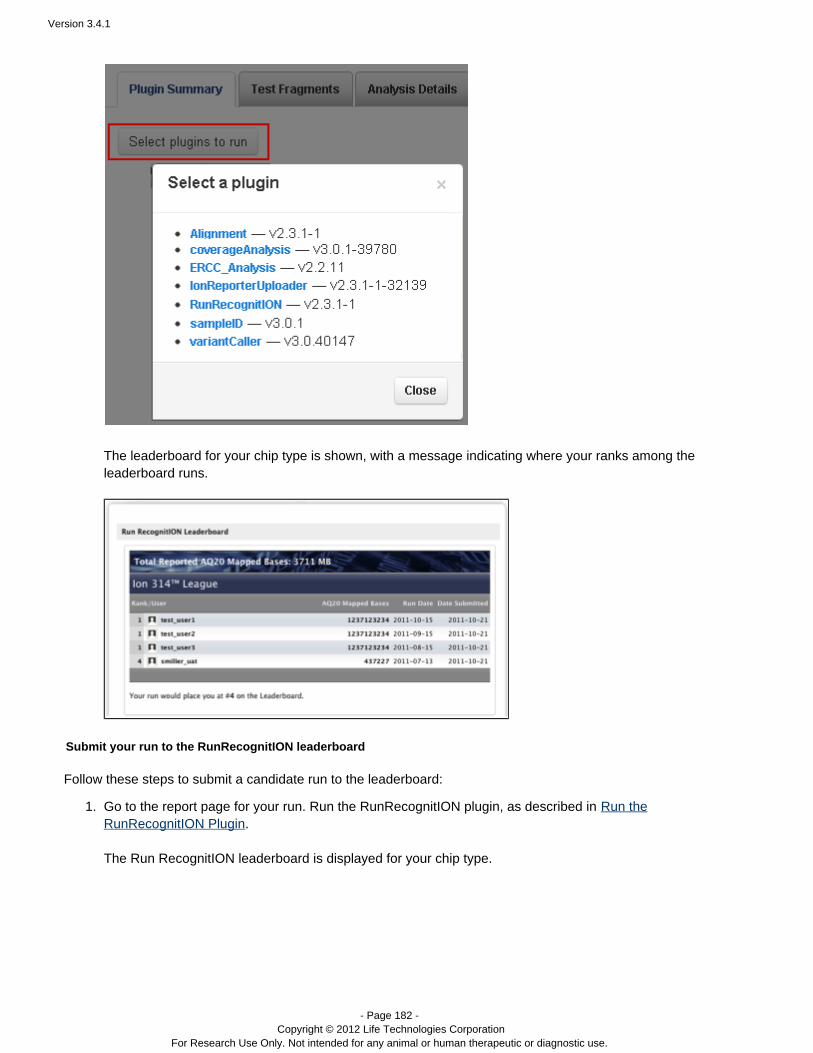
Version 3.4.1
- Page 182 - Copyright © 2012 Life Technologies Corporation
For Research Use Only. Not intended for any animal or human therapeutic or diagnostic use.
2.
1.
The leaderboard for your chip type is shown, with a message indicating where your ranks among theleaderboard runs.
Submit your run to the RunRecognitION leaderboard
Follow these steps to submit a candidate run to the leaderboard:
Go to the report page for your run. Run the RunRecognitION plugin, as described in Run the.RunRecognitION Plugin
The Run RecognitION leaderboard is displayed for your chip type.

Version 3.4.1
- Page 183 - Copyright © 2012 Life Technologies Corporation
For Research Use Only. Not intended for any animal or human therapeutic or diagnostic use.
1.
2.
3.
1.
2.
Scroll to the Ion Community Login section below the leaderboard. If you do not have an Ion Communityaccount, click to register. Enter your community user name and password.create an account Optionally enter the any of this information about your run:
Your site nameThe reference genome used in this runThe application type for this run
Below the information fields, click and carefully read that information. Click theTerms and Conditionscheckbox " ".I agree to the Terms and Conditions Click at the bottom of the page. If your run qualifies, it is added to the leaderboard:Submit

Version 3.4.1
- Page 184 - Copyright © 2012 Life Technologies Corporation
For Research Use Only. Not intended for any animal or human therapeutic or diagnostic use.
2.
What Information About Me Does RunRecognitION Make Public?
If your run is published to the leaderboard, your Ion Community user name and avatar are visible to other membersof the community.

Version 3.4.1
- Page 185 - Copyright © 2012 Life Technologies Corporation
For Research Use Only. Not intended for any animal or human therapeutic or diagnostic use.
Contents
Torrent Browser Analysis Report Guide
Run Report Metrics
Run Metrics Overview
Run Report Metrics Before Alignment
Run Report Metrics on Aligned Reads
Barcode Reports
Test Fragment Report
Report Information
Output Files
Plugin Summary
Run the Installed Plugins
Alignment Plugin
Coverage Analysis Plugin
ERCC Analysis Plugin
FastqCreator Plugin
IonReporterUploader Plugin
Run RecognitION Plugin
sampleID Plugin
SFFCreator Plugin
Torrent Variant Caller Plugin
Pre-3.0 Run Reports
Run the IonReporterUploader Plugin
Torrent Browser Analysis Report Guide
Run the IonReporterUploader_V1_2 plugin
The IonReporterUploader_V1_2 plugin transfer results files directly from a Torrent Server analysis to your IonReporter™ Software organization (available under a separate license).
You include the Uploader plugin settings in the run plan that you use for your sequencing run. The run plan thenlaunches the plugin automatically when the PGM or Proton sequencer analysis completes.™ ™
There is a one-time configuration of the plugin in both the Ion Reporter™ UI and the Torrent Browser,Software before the plugin can be used.
The version 1.2 plugin has a limitation with these requirements:

Version 3.4.1
- Page 186 - Copyright © 2012 Life Technologies Corporation
For Research Use Only. Not intended for any animal or human therapeutic or diagnostic use.
The plugin only works an completed Torrent Suite analyses that have a run plan with the following:IonReporterUploader_V1_2 selected in the run plan wizard Export chevron,The Ion Reporter Software sample name(s), workflow(s), and sample relationships properly defined™in the Plan chevron,And, for barcoded runs, the correct barcode kit selected ion the Kits chevron.
Manually launches of the plugin (on a completed run report) also depend on the run plan.
Ion Reporter™ 1.2Software
To transfer to Ion Reporter™ 1.2, you must use the plugin named IonReporterUploader_V1_2.Software
You can download and install the plugin from the on the Ion Community.Torrent Browser Plugin Store
Transfer limitations
The following limitations apply to the Uploader plugin:
The Uploader plugin transfers results files for a completed run plan that executed on the Torrent Serverwhere the plugin is configured. (In addition, each run must have the IonReporterUploader plugin enabled andconfigured in its run plan.)You cannot copy results file from a different Torrent Server and have the plugin transfer those files.Only files appearing in the File Links section of a run report are transferred.You cannot add supplemental files to the results files of a run, in order to have the plugin transfer those files.For barcoded runs:
For automatic runs with barcoded data, the Uploader plugin only transfers samples if the barcode kitselection in the run plan wizard is correct. If you correct or add the barcode kit selection on thesequencing instrument, the Uploader plugin still uses the old run plan information and the results filetransfer fails.For manual launches of the plugin on barcoded data, the Uploader plugin uses the barcode kitselection that you make on the sequencing instrument.
Add the IonReporterUploader_V1_2 plugin to a run plan
To set a run plan to automatically transfer files (after the completion of the PGM analysis), use the Export and™Plan chevrons in the Torrent Browser run plan wizard.
For barcoded data, also select the correct barcode kit in the Kits chevron. When you select a barcode kit, the Planchevron creates a sample name field for each barcode.
You define a run pan in the Torrent Browser Plan tab before your sequencing run. The following sections describehow to enable and configure the IonReporterUploader_V1_2 plugin in the run plan wizard.
The Kits chevron
If your sequencing run uses a barcode kit, select that kit in the Kits chevron:
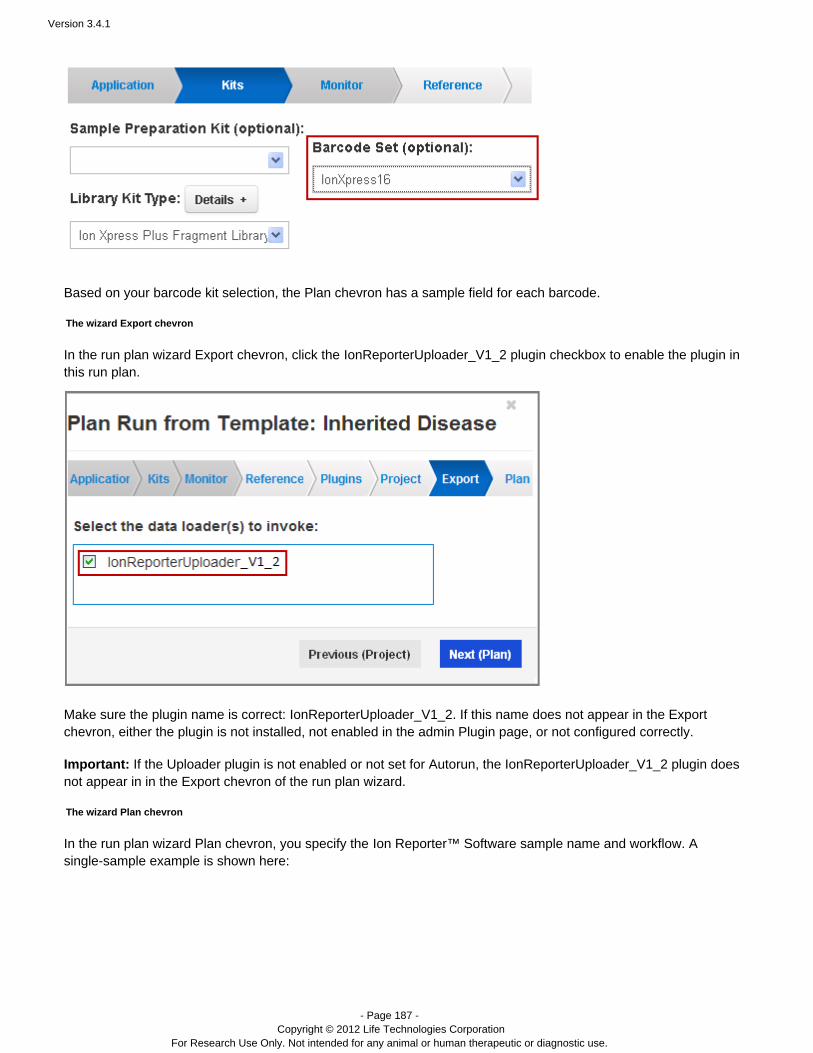
Version 3.4.1
- Page 187 - Copyright © 2012 Life Technologies Corporation
For Research Use Only. Not intended for any animal or human therapeutic or diagnostic use.
Based on your barcode kit selection, the Plan chevron has a sample field for each barcode.
The wizard Export chevron
In the run plan wizard Export chevron, click the plugin checkbox to enable the plugin inIonReporterUploader_V1_2this run plan.
Make sure the plugin name is correct: . If this name does not appear in the ExportIonReporterUploader_V1_2chevron, either the plugin is not installed, not enabled in the admin Plugin page, or not configured correctly.
Important: If the Uploader plugin is not enabled or not set for Autorun, the IonReporterUploader_V1_2 plugin doesnot appear in in the Export chevron of the run plan wizard.
The wizard Plan chevron
In the run plan wizard Plan chevron, you specify the e sample name and workflow. AIon Reporter™ Softwarsingle-sample example is shown here:
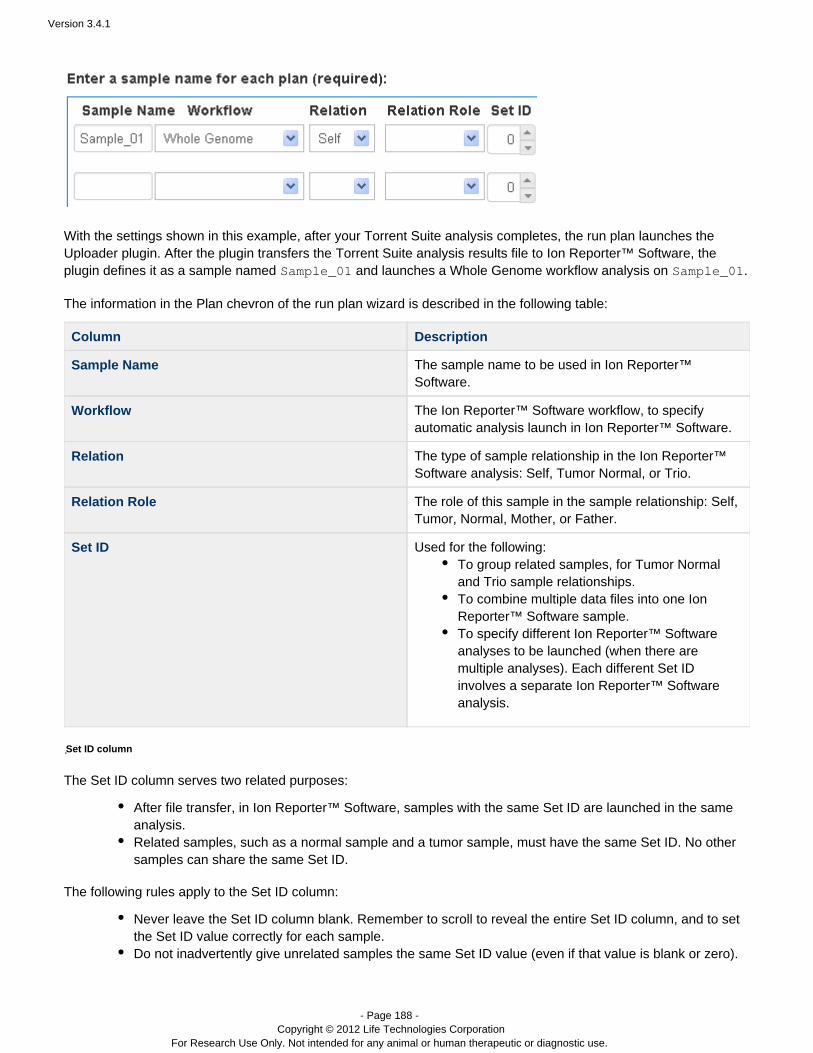
Version 3.4.1
- Page 188 - Copyright © 2012 Life Technologies Corporation
For Research Use Only. Not intended for any animal or human therapeutic or diagnostic use.
With the settings shown in this example, after your Torrent Suite analysis completes, the run plan launches theUploader plugin. After the plugin transfers the results file to , theTorrent Suite analysis eIon Reporter™ Softwarplugin defines it as a sample named and launches a Whole Genome workflow analysis on .Sample_01 Sample_01
The information in the Plan chevron of the run plan wizard is described in the following table:
Column Description
Sample Name The sample name to be used in Ion Reporter™Software.
Workflow The Ion Reporter™ Software workflow, to specifyautomatic analysis launch in Ion Reporter™ Software.
Relation The type of sample relationship in the Ion Reporter™Software analysis: Self, Tumor Normal, or Trio.
Relation Role The role of this sample in the sample relationship: Self,Tumor, Normal, Mother, or Father.
Set ID Used for the following:To group related samples, for Tumor Normaland Trio sample relationships.To combine multiple data files into one IonReporter™ Software sample.To specify different Ion Reporter™ Softwareanalyses to be launched (when there aremultiple analyses). Each different Set IDinvolves a separate Ion Reporter™ Softwareanalysis.
Set ID column
The Set ID column serves two related purposes:
After file transfer, in Ion Reporter™ Software, samples with the same Set ID are launched in the sameanalysis.Related samples, such as a normal sample and a tumor sample, must have the same Set ID. No othersamples can share the same Set ID.
The following rules apply to the Set ID column:
Never leave the Set ID column blank. Remember to scroll to reveal the entire Set ID column, and to setthe Set ID value correctly for each sample.Do not inadvertently give unrelated samples the same Set ID value (even if that value is blank or zero).

Version 3.4.1
- Page 189 - Copyright © 2012 Life Technologies Corporation
For Research Use Only. Not intended for any animal or human therapeutic or diagnostic use.
Run plan IDs
When you configure a run plan with the IonReporterUploader and your experiment involves multiple samples of non-data, the Torrent Suite Software creates a separate plan run for each sample. This splitting happensbarcoded
because (with non-barcoded data) each sample involves a separate run on the sequencing instrument.
In this case, each plan ID includes the sample name. The resulting plans appear in the Plan tab Planned Runspage, and each plan has its own Run Code and run plan name.
Warning: Extra care is needed when selecting one of these plan's Run Code on the sequencing instrument. Theplan names are similar, and the correct plan must be chosen for each physical sample.
Note: This splitting does not happen with barcoded data, because the barcoded data is sequenced in oneinstrument run (and only requires one run plan).
Related samples
The following example shows how to specify related samples:
This example specifies the following:
The Torrent Suite analysis results will be transferred to Ion Reporter™ Software and defined as twosamples.Sample_03 is the tumor sample in a Tumor_Normal relationship and is the related normalSample_04
sample. Both samples have the same Set ID, which identifies them as related.The sample will be analyzed with the Annotate Variants workflow in Ion Reporter™ Software. Thisanalysis is launched automatically after the file transfer and sample definition.
Related samples must have the same value in the Set ID column.
A sample with multiple data files
To create a single Ion Reporter™ Software sample that contains multiple results files from your Torrent Server, giveeach Torrent Suite sample file the same Ion Reporter™ Software sample name:
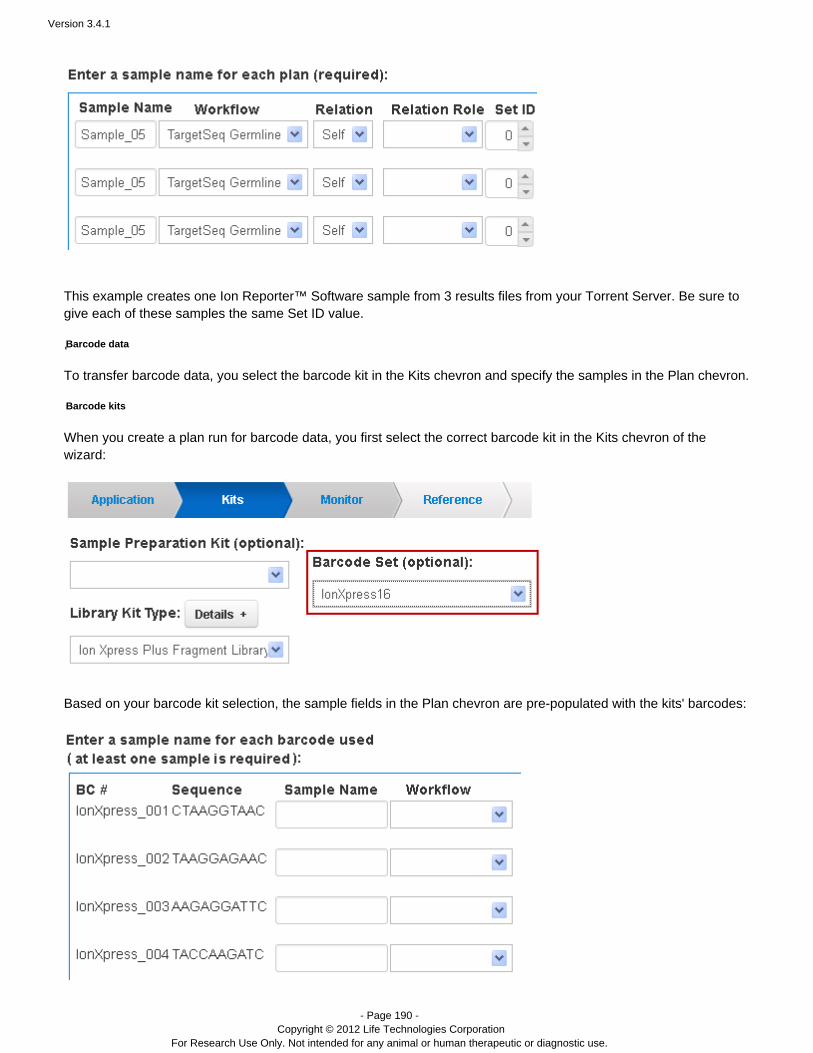
Version 3.4.1
- Page 190 - Copyright © 2012 Life Technologies Corporation
For Research Use Only. Not intended for any animal or human therapeutic or diagnostic use.
This example creates one Ion Reporter™ Software sample from 3 results files from your Torrent Server. Be sure togive each of these samples the Set ID value.same
Barcode data
To transfer barcode data, you select the barcode kit in the Kits chevron and specify the samples in the Plan chevron.
Barcode kits
When you create a plan run for barcode data, you first select the correct barcode kit in the Kits chevron of thewizard:
Based on your barcode kit selection, the sample fields in the Plan chevron are pre-populated with the kits' barcodes:

Version 3.4.1
- Page 191 - Copyright © 2012 Life Technologies Corporation
For Research Use Only. Not intended for any animal or human therapeutic or diagnostic use.
Barcoded samples
When you select your barcode kit in the wizard Kits chevron, the barcodes are pre-populated in the Plan chevron, asshown in this example (the sequence column and part of the barcode number column are not shown):
This example specifies the following:
The Torrent Suite analysis results will be transferred to Ion Reporter™ Software and defined as severalsamples.SampleBC_01 is the normal sample in a Tumor_Normal relationship and is the relatedSampleBC_02
tumor sample. Both samples have the same Set ID, which identifies them as related.The samples and will be analyzed with the TargetSeq Somatic workflowSampleBC_01 SampleBC_02
in Ion Reporter™ Software.Sample will be analyzed with the Whole Genome workflow (in a separate Ion Reporter™SampleBC_03
Software analysis).SampleBC_04 is the tumor sample in a Tumor_Normal relationship and will be analyzed with theAnnotate Variants workflow (in a separate Ion Reporter™ Software analysis). (The related normalsample is not shown.)Each different Set ID represents a different analysis in Ion Reporter™ Software.
For any barcode that is not used in your Torrent Suite analysis, leave that barcode's row blank in the Plan chevronsample table.
A transfer of multiple unrelated data files
When you transfer multiple files, each sample is launched in a separate Ion Reporter™ Software analysisunrelated(the barcode sequence column is not shown):

Version 3.4.1
- Page 192 - Copyright © 2012 Life Technologies Corporation
For Research Use Only. Not intended for any animal or human therapeutic or diagnostic use.
1.
Be sure to give each of these samples a Set ID value.unique
Results files for barcoded PGM™ and Proton™ runs
For barcoded runs, all barcoded results files are transferred, except for results files with a file size of zero.
The plugin logs warnings for these files:
Files with a file size of zeroMissing files
The plugin log file is found on the Torrent Browser Completed Runs & Reports tab, in the run report for which theplugin was run, in the Plugin Summary section. The link opens the Uploader plugin log.Detailed Information
Note: Results files for unused barcodes are transferred, if the results file size is not zero.
A barcode mismatch
A barcode mismatch occurs when the run's results files do not match the Uploader plugin's barcode information. Forautomatic plugin runs, the plugin reads metadata information only from the run plan. For a manual launch of theplugin, the plugin also reads the barcode selection made on instrument.
Plugin log files
The plugin log files are found on the Torrent Browser Completed Runs & Reports tab Plugin Summary section, inthe run report for which the plugin was run. The icon opens the system log for the plugin run. The Detailed
link opens the Uploader plugin log.Information
If the link is not present, use this workaround to open the plugin log file:Detailed Information
Click on the icon for the IonReporterUploader_V1_2 plugin (or right click to open the log in a new browsertab).The system log file opens in your browser, with a URL that ends in a string such as this:

Version 3.4.1
- Page 193 - Copyright © 2012 Life Technologies Corporation
For Research Use Only. Not intended for any animal or human therapeutic or diagnostic use.
1.
2.
plugin_out/IonReporterUploader_V1_2_out/drmaa_stdout.txt
Change to and click :drmaa_stdout.txt log.txt Enter plugin_out/IonReporterUploader_V1_2_out/log.txt
The plugin log file opens in your browser.
Manual launch of the Uploader plugin
In this release, the only supported launch option is . With the Upload and Define Samples Upload and Define option, your results files are transferred to Ion Reporter™ Software and also defined as samples in IonSamples
Reporter™ Software. (Before the 1.2.2 release, the Upload Only option did not define the samples after transfer.)
Please also note the following:
Use only IonReporterUploader_V1_2. Other versions of IonReporterUploader plugins are not compatible withIon Reporter™ Software 1.2.
If IonReporterUploader_V1_2 does not appear in the Select Plugin to Run list, it is not either enabled orconfigured on your Torrent Server.
The plugin log file (in the Torrent Browser Plugin Summary area) contains information about the location thedata files are transferred to in Ion Reporter™ Software.
Only for a manual launch of the plugin, the plugin reads the barcode kit selection made on the sequencinginstrument. (All other information is read from the run plan.)
For Torrent Suite analyses that do not have the Uploader plugin configured in a run plan, sample file namesin Ion Reporter™ Software are created using the Torrent Suite analysis name. With barcoded runs, thebarcode name is also added to the sample name.
Transfer files for a Genetic Disease Screening workflow
In this release, when you transfer files for analysis with a Genetic Disease Screening (GDS) workflow in IonReporter™ Software, the required gender information is not included with the sample metadata. Because the genderof the proband is not known, variants cannot be assigned the categories HasMaleMaternalX and HasUnknownX.
As a workaround, after the files are transferred, go to the Sample > Sample Management screen in the IonReporter™ Console and edit each GDS sample to specify the gender attribute.
Note: You cannot edit samples that have been launched in an analysis. Instead, define new samples from the rawdata files, and add the correct gender metadata to the new samples.
Credit balances
Each Ion Reporter™ Software organization has a number of credits. The credit balances for your organizationappear in the Home tab Dashboard, in the lower right corner.
Credits are deducted when samples are defined in Ion Reporter™ Software. A sample is defined during these twocases:
By the Uploader plugin, after a successful transfer of results files from your Torrent ServerBy an Ion Reporter™ Software user in the UI, on the Sample > Define Samples page (when the user clicks S
)ave
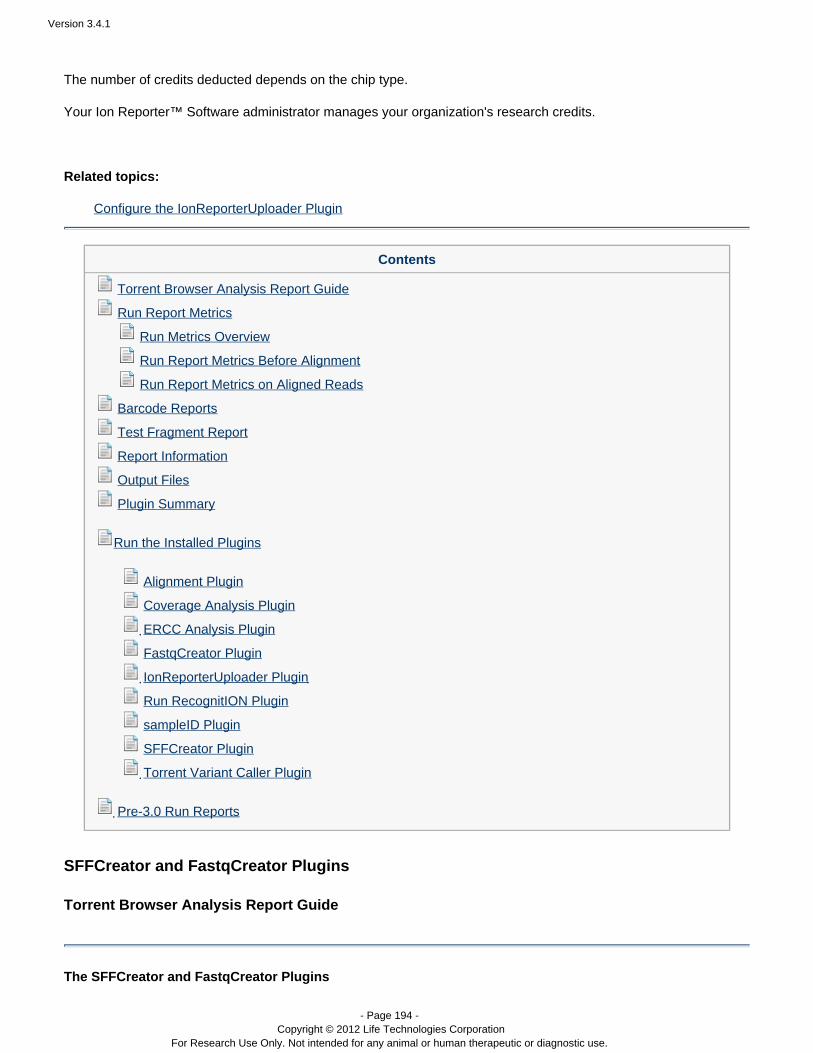
Version 3.4.1
- Page 194 - Copyright © 2012 Life Technologies Corporation
For Research Use Only. Not intended for any animal or human therapeutic or diagnostic use.
The number of credits deducted depends on the chip type.
Your Ion Reporter™ Software administrator manages your organization's research credits.
Related topics:
Configure the IonReporterUploader Plugin
Contents
Torrent Browser Analysis Report Guide
Run Report Metrics
Run Metrics Overview
Run Report Metrics Before Alignment
Run Report Metrics on Aligned Reads
Barcode Reports
Test Fragment Report
Report Information
Output Files
Plugin Summary
Run the Installed Plugins
Alignment Plugin
Coverage Analysis Plugin
ERCC Analysis Plugin
FastqCreator Plugin
IonReporterUploader Plugin
Run RecognitION Plugin
sampleID Plugin
SFFCreator Plugin
Torrent Variant Caller Plugin
Pre-3.0 Run Reports
SFFCreator and FastqCreator Plugins
Torrent Browser Analysis Report Guide
The SFFCreator and FastqCreator Plugins
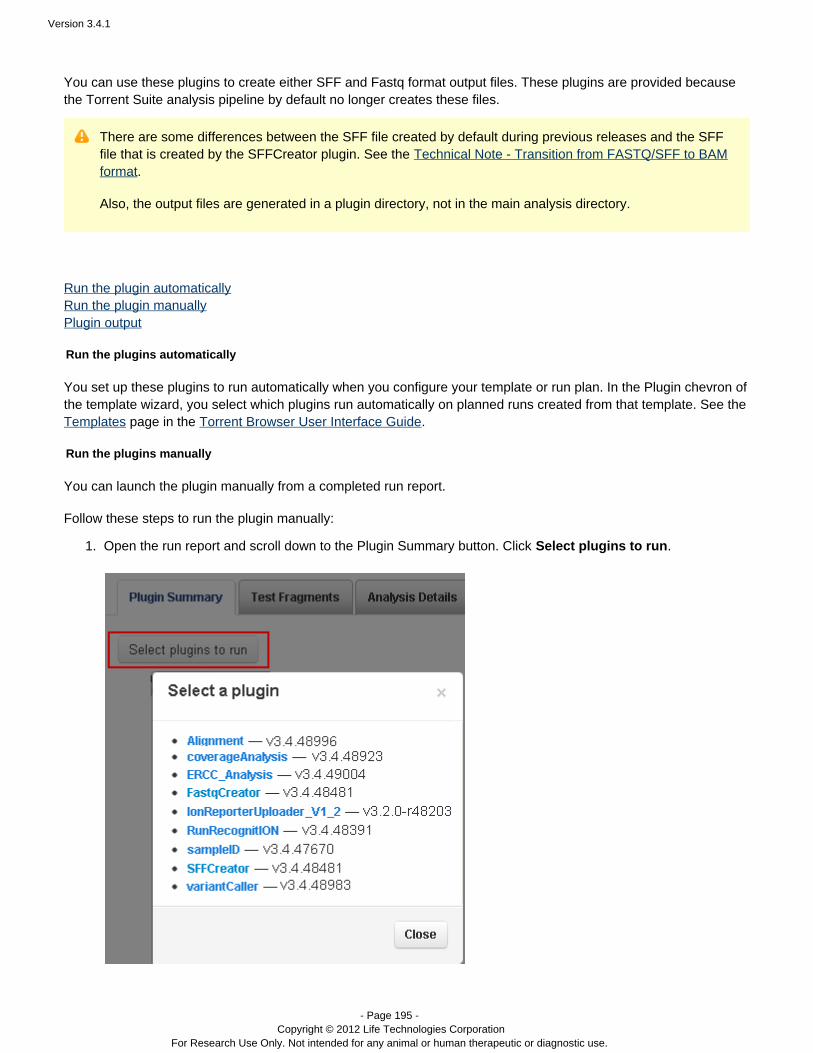
Version 3.4.1
- Page 195 - Copyright © 2012 Life Technologies Corporation
For Research Use Only. Not intended for any animal or human therapeutic or diagnostic use.
1.
2.
You can use these plugins to create either SFF and Fastq format output files. These plugins are provided becausethe Torrent Suite analysis pipeline by default no longer creates these files.
There are some differences between the SFF file created by default during previous releases and the SFFfile that is created by the SFFCreator plugin. See the Technical Note - Transition from FASTQ/SFF to BAM
.format
Also, the output files are generated in a plugin directory, not in the main analysis directory.
Run the plugin automaticallyRun the plugin manuallyPlugin output
Run the plugins automatically
You set up these plugins to run automatically when you configure your template or run plan. In the Plugin chevron ofthe template wizard, you select which plugins run automatically on planned runs created from that template. See the
page in the .Templates Torrent Browser User Interface Guide
Run the plugins manually
You can launch the plugin manually from a completed run report.
Follow these steps to run the plugin manually:
Open the run report and scroll down to the Plugin Summary button. Click . Select plugins to run
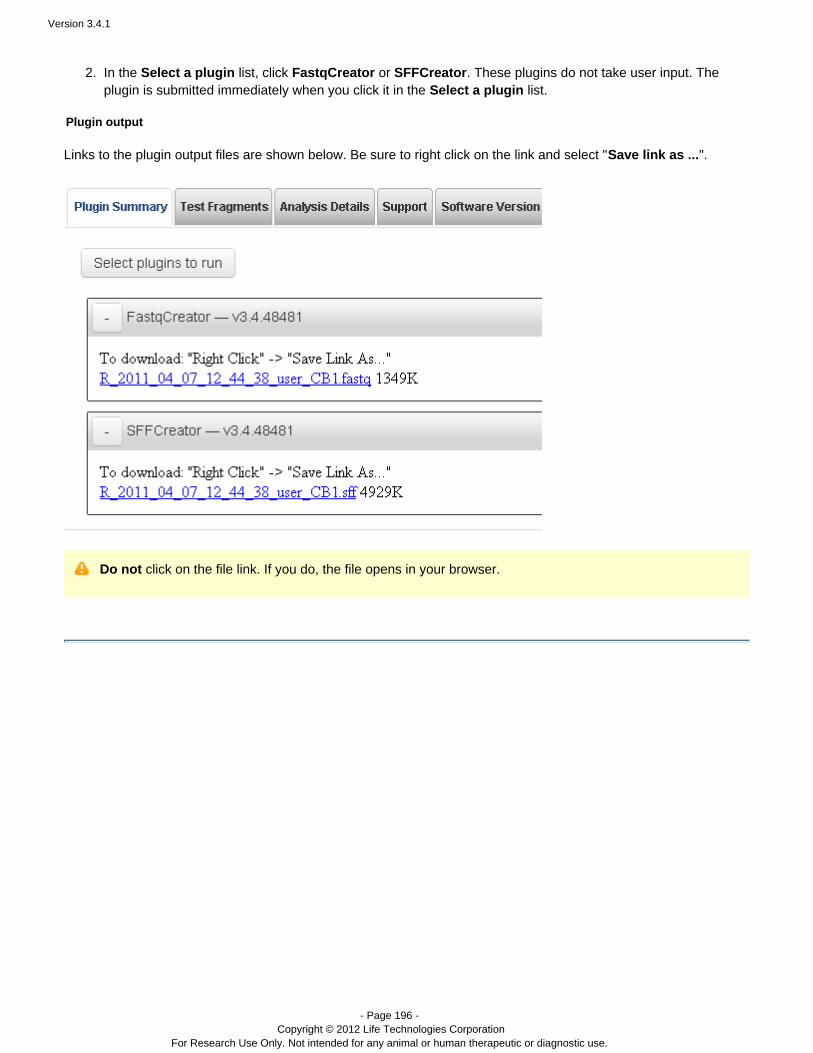
Version 3.4.1
- Page 196 - Copyright © 2012 Life Technologies Corporation
For Research Use Only. Not intended for any animal or human therapeutic or diagnostic use.
1.
2. In the list, click or . These plugins do not take user input. The Select a plugin FastqCreator SFFCreatorplugin is submitted immediately when you click it in the list.Select a plugin
Plugin output
Links to the plugin output files are shown below. Be sure to right click on the link and select " ".Save link as ...
Do not click on the file link. If you do, the file opens in your browser.
Version 3.4.1
- Page 197 - Copyright © 2012 Life Technologies Corporation
For Research Use Only. Not intended for any animal or human therapeutic or diagnostic use.
Contents
Torrent Browser Analysis Report Guide
Run Report Metrics
Run Metrics Overview
Run Report Metrics Before Alignment
Run Report Metrics on Aligned Reads
Barcode Reports
Test Fragment Report
Report Information
Output Files
Plugin Summary
Run the Installed Plugins
Alignment Plugin
Coverage Analysis Plugin
ERCC Analysis Plugin
FastqCreator Plugin
IonReporterUploader Plugin
Run RecognitION Plugin
sampleID Plugin
SFFCreator Plugin
Torrent Variant Caller Plugin
Pre-3.0 Run Reports
The SampleID Plugin
Torrent Browser Analysis Report Guide
The SampleID Plugin
Ion AmpliSeq™ Sample ID Panel is a human SNP genotyping panel enabling accurate sample verification forincreased confidence in sample data management. The plugin is comprised of nine primer pairs that can becombined with any Ion AmpliSeq Ready-to-Use or Custom Panel for the generation of a unique ID duringpost-sequencing analysis of research samples.
The Ion AmpliSeq™ Sample ID Panel can be used in combination with any Ion AmpliSeq™ Ready-to-Use orCustom Panel using the Ion AmpliSeq™ Designer 1.2 or greater. This plugin is compatible with the Ion Xpress™barcodes set.

Version 3.4.1
- Page 198 - Copyright © 2012 Life Technologies Corporation
For Research Use Only. Not intended for any animal or human therapeutic or diagnostic use.
1.
Plugin outputRun the SampleID plugin automaticallyRun the SampleID plugin manuallyOn-target metrics
Plugin output
Example plugin output is shown below:
Use the Sample ID column to verify sample fingerprints.
Click on a barcode ID to open the detail report:
With the detail report, you can review the IUPAC SNP calls and click a link in the TaqMan Assay ID column to®
order the corresponding TaqMan Assay.®
Run the SampleID plugin automatically
You set up the plugin to run automatically when you configure your template. In the Plugin chevron of the templatewizard, you select which plugins run automatically on planned runs created from that template. See the pTemplatesage in the .Torrent Browser User Interface Guide
Run the SampleID plugin manually
You can launch the plugin manually from a completed run report.
Follow these steps to run the plugin manually:
Open the run report and scroll down to the Plugin Summary button. Click . Select plugins to run
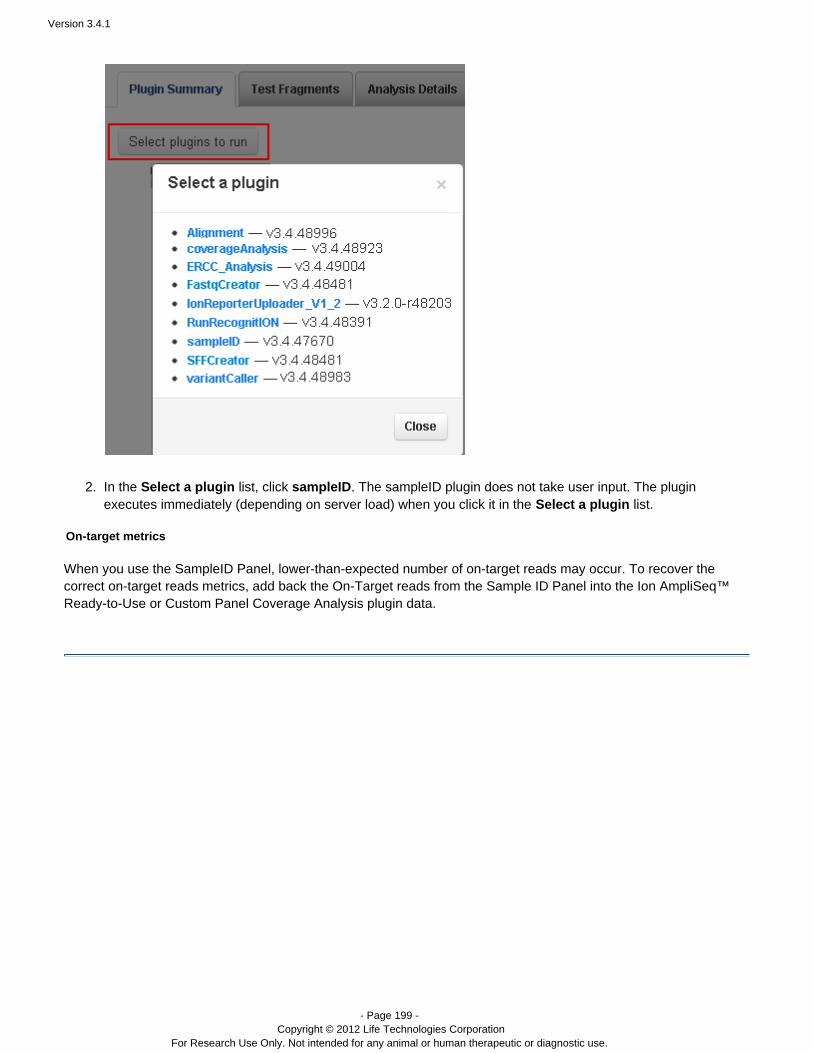
Version 3.4.1
- Page 199 - Copyright © 2012 Life Technologies Corporation
For Research Use Only. Not intended for any animal or human therapeutic or diagnostic use.
1.
2. In the list, click . The sampleID plugin does not take user input. The plugin Select a plugin sampleIDexecutes immediately (depending on server load) when you click it in the list.Select a plugin
On-target metrics
When you use the SampleID Panel, lower-than-expected number of on-target reads may occur. To recover thecorrect on-target reads metrics, add back the On-Target reads from the Sample ID Panel into the Ion AmpliSeq™Ready-to-Use or Custom Panel Coverage Analysis plugin data.
Version 3.4.1
- Page 200 - Copyright © 2012 Life Technologies Corporation
For Research Use Only. Not intended for any animal or human therapeutic or diagnostic use.
Contents
Torrent Browser Analysis Report Guide
Run Report Metrics
Run Metrics Overview
Run Report Metrics Before Alignment
Run Report Metrics on Aligned Reads
Barcode Reports
Test Fragment Report
Report Information
Output Files
Plugin Summary
Run the Installed Plugins
Alignment Plugin
Coverage Analysis Plugin
ERCC Analysis Plugin
FastqCreator Plugin
IonReporterUploader Plugin
Run RecognitION Plugin
sampleID Plugin
SFFCreator Plugin
Torrent Variant Caller Plugin
Pre-3.0 Run Reports
Torrent Variant Caller Plugin
Torrent Browser Analysis Report Guide (v3.x)
Introduction
The Torrent Variant Caller (TVC) plugin calls SNP and indel variants in a sample across a reference or within atargeted subset of that reference.
Using the Torrent Variant Caller plugin, you can perform six possible analysis types by selecting one of three librarytypes (Whole Genome, Ion AmpliSeq, Ion TargetSeq) and one of two variant frequencies (Germ-line or Somatic). In addition, if you have Target Region and/or HotSpot Region files in BED format, you can upload them and selectthem from the dropdown menu, and they will be applied to your analysis.
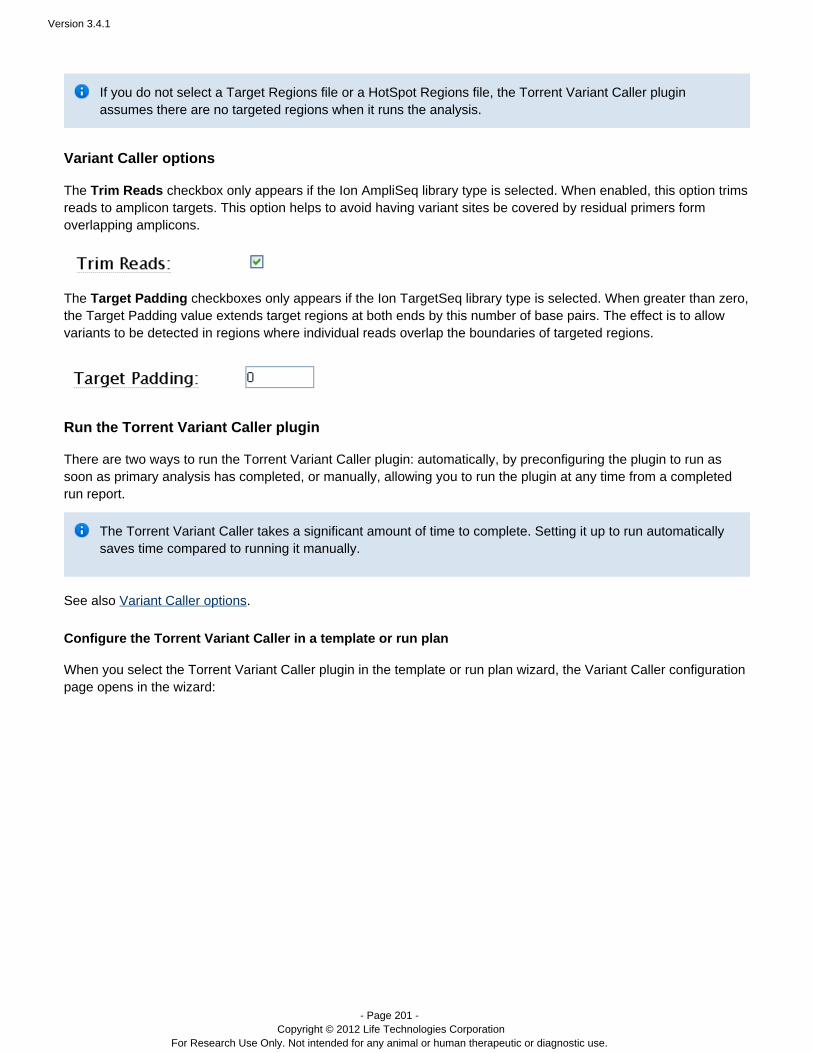
Version 3.4.1
- Page 201 - Copyright © 2012 Life Technologies Corporation
For Research Use Only. Not intended for any animal or human therapeutic or diagnostic use.
If you do not select a Target Regions file or a HotSpot Regions file, the Torrent Variant Caller pluginassumes there are no targeted regions when it runs the analysis.
Variant Caller options
The checkbox only appears if the Ion AmpliSeq library type is selected. When enabled, this option trimsTrim Readsreads to amplicon targets. This option helps to avoid having variant sites be covered by residual primers formoverlapping amplicons.
The checkboxes only appears if the Ion TargetSeq library type is selected. When greater than zero,Target Paddingthe Target Padding value extends target regions at both ends by this number of base pairs. The effect is to allowvariants to be detected in regions where individual reads overlap the boundaries of targeted regions.
Run the Torrent Variant Caller plugin
There are two ways to run the Torrent Variant Caller plugin: automatically, by preconfiguring the plugin to run assoon as primary analysis has completed, or manually, allowing you to run the plugin at any time from a completedrun report.
The Torrent Variant Caller takes a significant amount of time to complete. Setting it up to run automaticallysaves time compared to running it manually.
See also Variant Caller options.
Configure the Torrent Variant Caller in a template or run plan
When you select the Torrent Variant Caller plugin in the template or run plan wizard, the Variant Caller configurationpage opens in the wizard:

Version 3.4.1
- Page 202 - Copyright © 2012 Life Technologies Corporation
For Research Use Only. Not intended for any animal or human therapeutic or diagnostic use.
1.
2.
3.
If the link does not appear, try disabling popup blockers and adblockers on your Advanced Settings +browser.
Select the library type. Some Variant Caller options appear only for specific library types. See also VariantCaller options.
Variant Caller plugin parameters are available in the Advanced Settings.
Changes to parameters can dramatically affect the behavior and sensitivity of the Variant Caller.Note:Parameter changes are not recommended if you are new to the Variant Caller plugin.
Be sure to click the button before you click .Save Plugin Settings Next
You can return to the Variant Caller configuration page by clicking the button next to variantCaller in theConfigureplugin selection list.
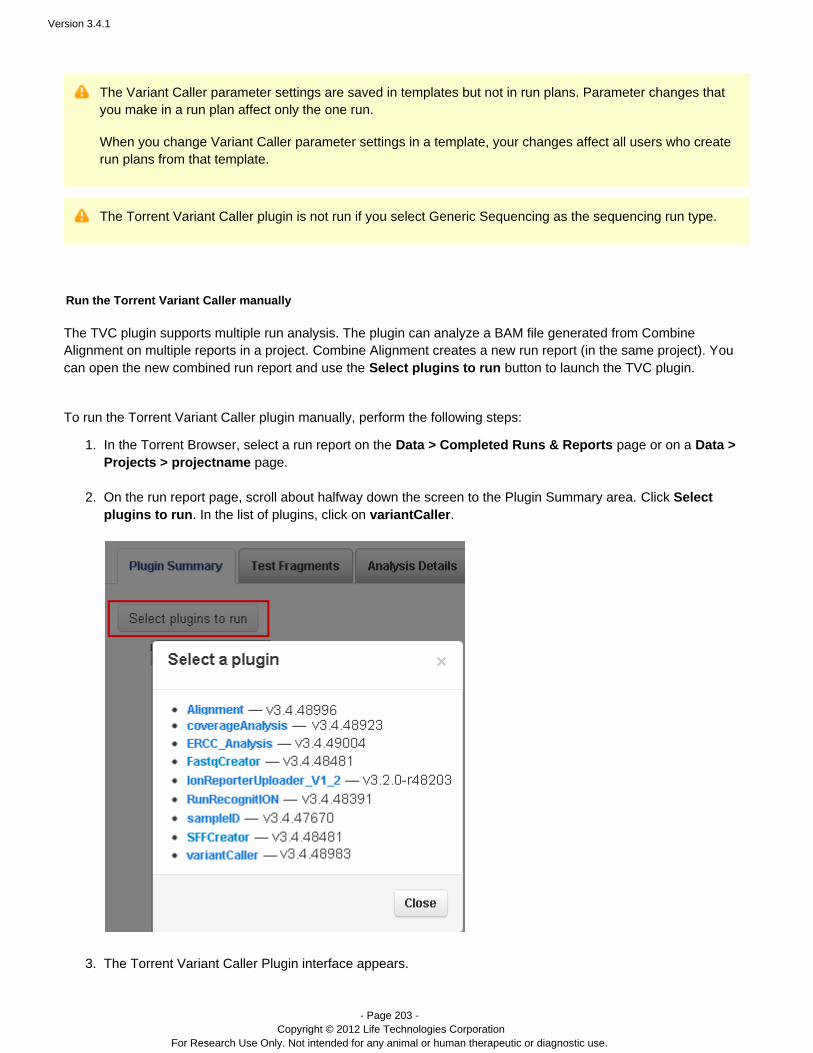
Version 3.4.1
- Page 203 - Copyright © 2012 Life Technologies Corporation
For Research Use Only. Not intended for any animal or human therapeutic or diagnostic use.
1.
2.
3.
The Variant Caller parameter settings are saved in templates but not in run plans. Parameter changes thatyou make in a run plan affect only the one run.
When you change Variant Caller parameter settings in a template, your changes affect all users who createrun plans from that template.
The Torrent Variant Caller plugin is not run if you select Generic Sequencing as the sequencing run type.
Run the Torrent Variant Caller manually
The TVC plugin supports multiple run analysis. The plugin can analyze a BAM file generated from CombineAlignment on multiple reports in a project. Combine Alignment creates a new run report (in the same project). Youcan open the new combined run report and use the Select plugins to run button to launch the TVC plugin.
To run the Torrent Variant Caller plugin manually, perform the following steps:
In the Torrent Browser, select a run report on the page or on a Data > Completed Runs & Reports Data >page.Projects > projectname
On the run report page, scroll about halfway down the screen to the Plugin Summary area. Click Selectplugins to run. In the list of plugins, click on variantCaller.
The Torrent Variant Caller Plugin interface appears.
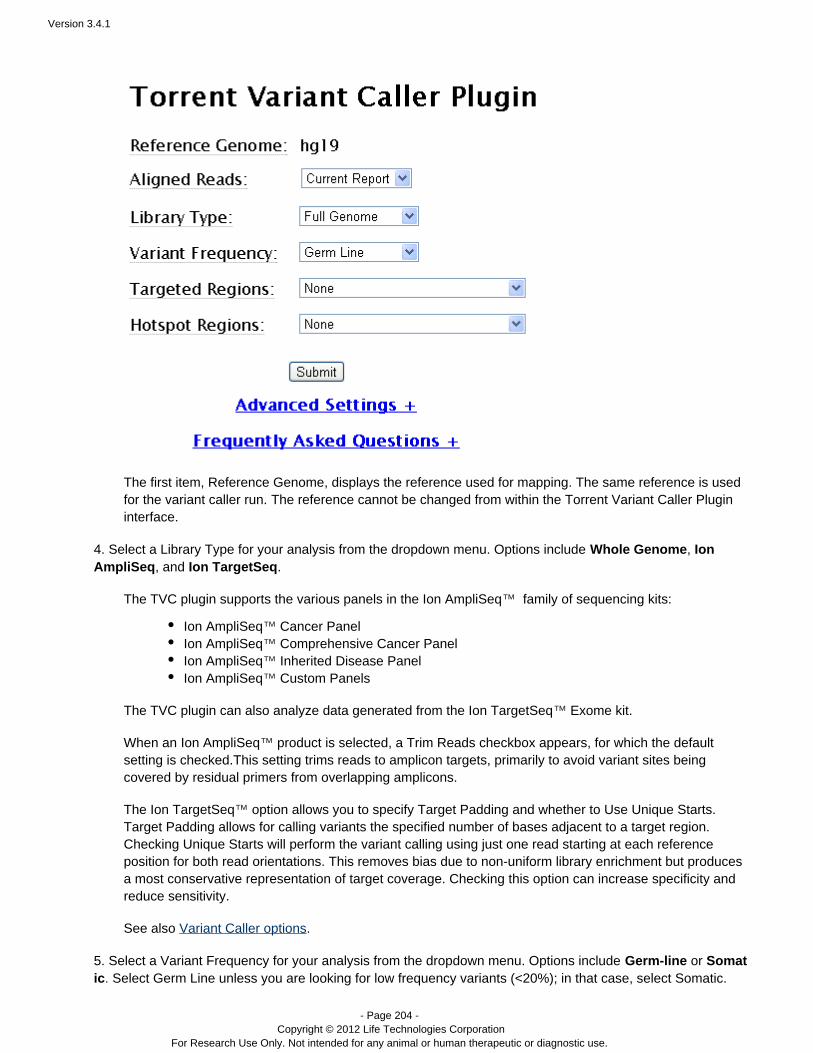
Version 3.4.1
- Page 204 - Copyright © 2012 Life Technologies Corporation
For Research Use Only. Not intended for any animal or human therapeutic or diagnostic use.
The first item, Reference Genome, displays the reference used for mapping. The same reference is usedfor the variant caller run. The reference cannot be changed from within the Torrent Variant Caller Plugininterface.
4. Select a Library Type for your analysis from the dropdown menu. Options include , Whole Genome Ion, and .AmpliSeq Ion TargetSeq
The TVC plugin supports the various panels in the Ion AmpliSeq family of sequencing kits:™
Ion AmpliSeq Cancer Panel™Ion AmpliSeq™ Comprehensive Cancer PanelIon AmpliSeq™ Inherited Disease PanelIon AmpliSeq™ Custom Panels
The TVC plugin can also analyze data generated from the Ion TargetSeq Exome kit.™
When an is selected, a Trim Reads checkbox appears, for which the defaultIon AmpliSeq™ productsetting is checked.This setting trims reads to amplicon targets, primarily to avoid variant sites beingcovered by residual primers from overlapping amplicons.
The Ion TargetSeq allows you to specify Target Padding and whether to Use Unique Starts.™ optionTarget Padding allows for calling variants the specified number of bases adjacent to a target region.Checking Unique Starts will perform the variant calling using just one read starting at each referenceposition for both read orientations. This removes bias due to non-uniform library enrichment but producesa most conservative representation of target coverage. Checking this option can increase specificity andreduce sensitivity.
See also Variant Caller options.
5. Select a Variant Frequency for your analysis from the dropdown menu. Options include or Germ-line Somatic. Select Germ Line unless you are looking for low frequency variants (<20%); in that case, select Somatic.
Version 3.4.1
- Page 205 - Copyright © 2012 Life Technologies Corporation
For Research Use Only. Not intended for any animal or human therapeutic or diagnostic use.
6. If they are needed for your analysis, select Targeted Regions or Hotspot Regions BED files by doing one ofthe following:
If the Target Regions file and/or Hotspot regions files you want to use already appear in the dropdownmenu, select them.If you want to use a Target Regions or Hotspot Regions file that is not already included as an option inthe dropdown menu, use the BED file uploader on a reference page to upload the BED file. Once youhave uploaded a new BED file, it appears in the dropdown menu, and you can select it for use in youranalysis.
If you do not select a Target Regions file or a Hotspot Regions file, the Torrent Variant Callerplugin assumes there are no targeted regions when it runs the analysis.
BED files provided by Life Technologies can be downloaded from the Ion Community. Use the BED fileuploader to include these files as options in the dropdown menu.
For more information about BED files, see .Work with BED Files
7. When you are satisfied with your selections, click . The analysis runs and a group of output reports isSubmitcreated.
Torrent Variant Caller plugin output
The Torrent Variant Caller plugin output includes the following details reports:
Barcode Coverage and Variants ReportVariant Caller ReportVariant Calls SummaryVariant CallsAllele Coverage for All Bases in HotSpot Regions
In addition, there is a File Links section, which is a list of output files generated by the Torrent Variant Caller Plugin.The plugin output files can be loaded into the Broad Institute's IGV or other third-party tools for further visualizationor analysis.
Variant Caller results for analyses with a very large number of variants (such as exome or genome analyses) arebest viewed in Chrome or Firefox rather than Internet Explorer, because Internet Explorer runs Javascript moreslowly than other browsers, especially on large datasets. The workaround for using Internet Explorer is to confirmcontinuing to run the scripts as many times as prompted until the results load.
You can hide report sections by clicking the collapse icon for a section, in hts header bar:
Barcode Coverage and Variants Report
The Barcode Coverage and Variants Report is a table that provides a summary list of reports per barcode. For eachbarcode, various types of data are displayed that can help you evaluate the quality of your run.
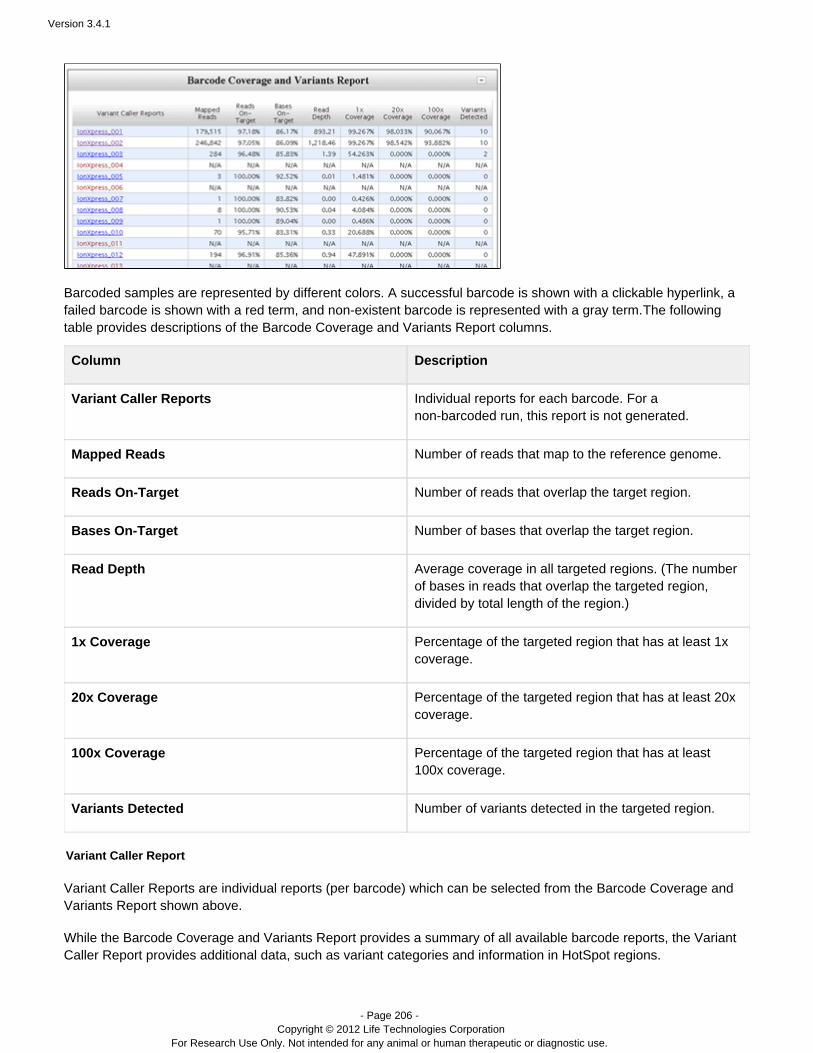
Version 3.4.1
- Page 206 - Copyright © 2012 Life Technologies Corporation
For Research Use Only. Not intended for any animal or human therapeutic or diagnostic use.
Barcoded samples are represented by different colors. A successful barcode is shown with a clickable hyperlink, afailed barcode is shown with a red term, and non-existent barcode is represented with a gray term.The followingtable provides descriptions of the Barcode Coverage and Variants Report columns.
Column Description
Variant Caller Reports Individual reports for each barcode. For anon-barcoded run, this report is not generated.
Mapped Reads Number of reads that map to the reference genome.
Reads On-Target Number of reads that overlap the target region.
Bases On-Target Number of bases that overlap the target region.
Read Depth Average coverage in all targeted regions. (The numberof bases in reads that overlap the targeted region,divided by total length of the region.)
1x Coverage Percentage of the targeted region that has at least 1xcoverage.
20x Coverage Percentage of the targeted region that has at least 20xcoverage.
100x Coverage Percentage of the targeted region that has at least100x coverage.
Variants Detected Number of variants detected in the targeted region.
Variant Caller Report
Variant Caller Reports are individual reports (per barcode) which can be selected from the Barcode Coverage andVariants Report shown above.
While the Barcode Coverage and Variants Report provides a summary of all available barcode reports, the VariantCaller Report provides additional data, such as variant categories and information in HotSpot regions.
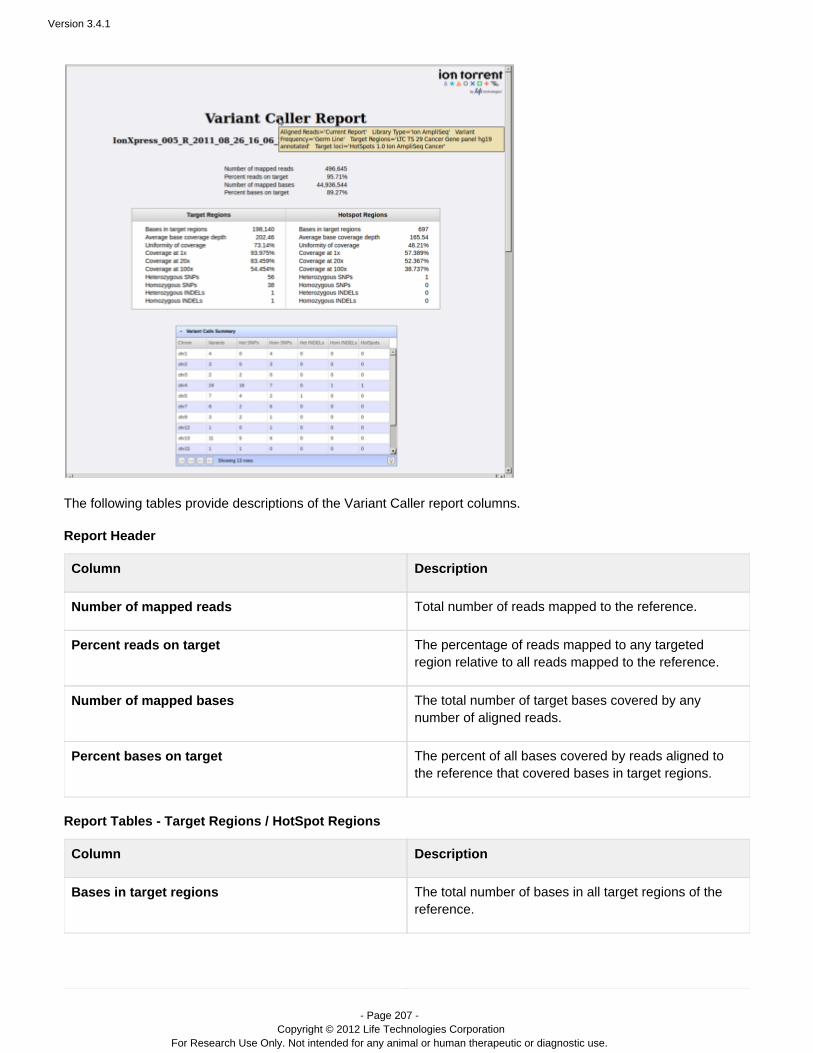
Version 3.4.1
- Page 207 - Copyright © 2012 Life Technologies Corporation
For Research Use Only. Not intended for any animal or human therapeutic or diagnostic use.
The following tables provide descriptions of the Variant Caller report columns.
Report Header
Column Description
Number of mapped reads Total number of reads mapped to the reference.
Percent reads on target The percentage of reads mapped to any targetedregion relative to all reads mapped to the reference.
Number of mapped bases The total number of target bases covered by anynumber of aligned reads.
Percent bases on target The percent of all bases covered by reads aligned tothe reference that covered bases in target regions.
Report Tables - Target Regions / HotSpot Regions
Column Description
Bases in target regions The total number of bases in all target regions of thereference.

Version 3.4.1
- Page 208 - Copyright © 2012 Life Technologies Corporation
For Research Use Only. Not intended for any animal or human therapeutic or diagnostic use.
Average base coverage depth The average number of reads of all targeted referencebases. This is the total number of base reads on targetdivided by the number of targeted bases, and thereforeincludes any bases that had no coverage.
Uniformity of coverage The percentage of target bases covered by at least0.2x the average base coverage depth.
Coverage at 1x The percentage of target bases covered by at least 1read.
Coverage at 20x The percentage of target bases covered by at least 20reads.
Coverage at 100x The percentage of target bases covered by at least 100reads.
Heterozygous SNPs Number of called heterozygous SNPs in target regionsor loci.
Homozygous SNPs Number of called homozygous SNPs in target regionsor loci.
Heterozygous INDELs Number of called heterozygous INDELs in targetregions or loci.
Homozygous INDELs Number of called homozygous INDELs in targetregions or loci.
Heterozygous SNPs and INDELs differ from the reference in only one copy of the chromosome, whilehomozygous SNPs and INDELs differ from the reference in both copies of the chromosome.
Variant Calls Summary table
The Variant Calls Summary table shows the number of variants per chromosome. In this table, you can select thenumber of entries to display, filter the table based on search terms, or export the table for use with other third-partydata analysis tools.
You can use this report monitor the quality of your run on a per-chromosome basis. For example, if onechromosome has an unexpected number of variants, this might indicate an issue with the run.
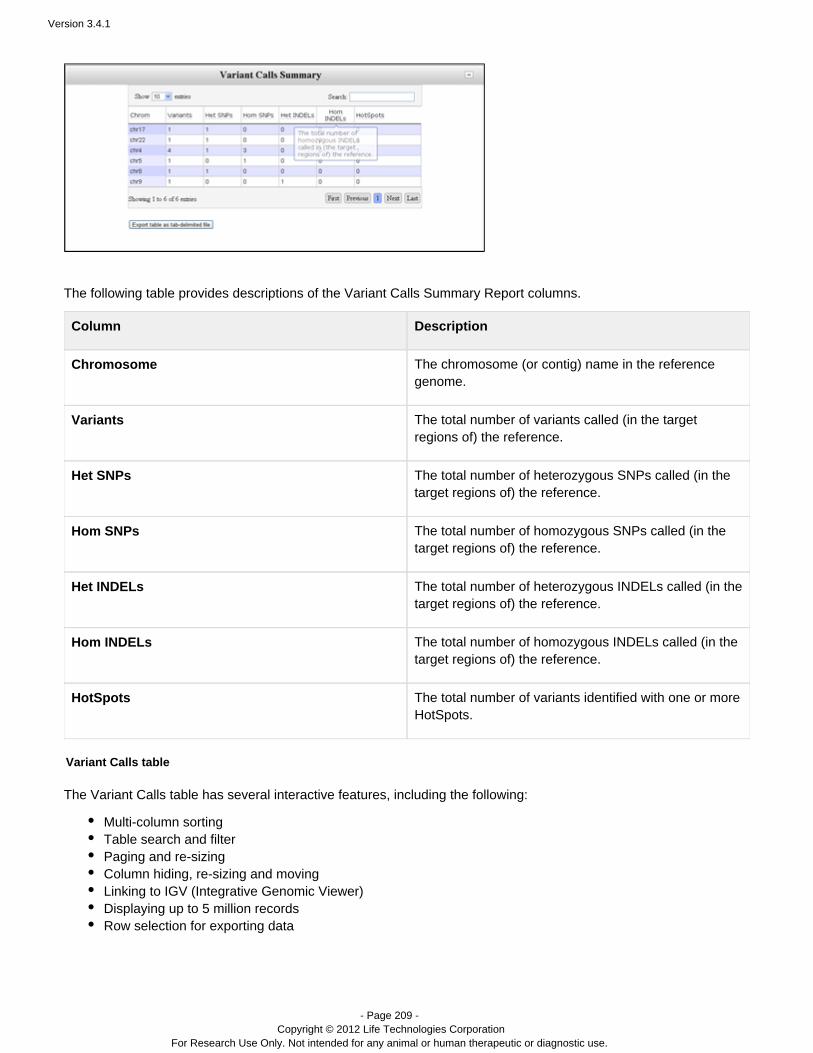
Version 3.4.1
- Page 209 - Copyright © 2012 Life Technologies Corporation
For Research Use Only. Not intended for any animal or human therapeutic or diagnostic use.
The following table provides descriptions of the Variant Calls Summary Report columns.
Column Description
Chromosome The chromosome (or contig) name in the referencegenome.
Variants The total number of variants called (in the targetregions of) the reference.
Het SNPs The total number of heterozygous SNPs called (in thetarget regions of) the reference.
Hom SNPs The total number of homozygous SNPs called (in thetarget regions of) the reference.
Het INDELs The total number of heterozygous INDELs called (in thetarget regions of) the reference.
Hom INDELs The total number of homozygous INDELs called (in thetarget regions of) the reference.
HotSpots The total number of variants identified with one or moreHotSpots.
Variant Calls table
The Variant Calls table has several interactive features, including the following:
Multi-column sortingTable search and filterPaging and re-sizingColumn hiding, re-sizing and movingLinking to IGV (Integrative Genomic Viewer)Displaying up to 5 million recordsRow selection for exporting data
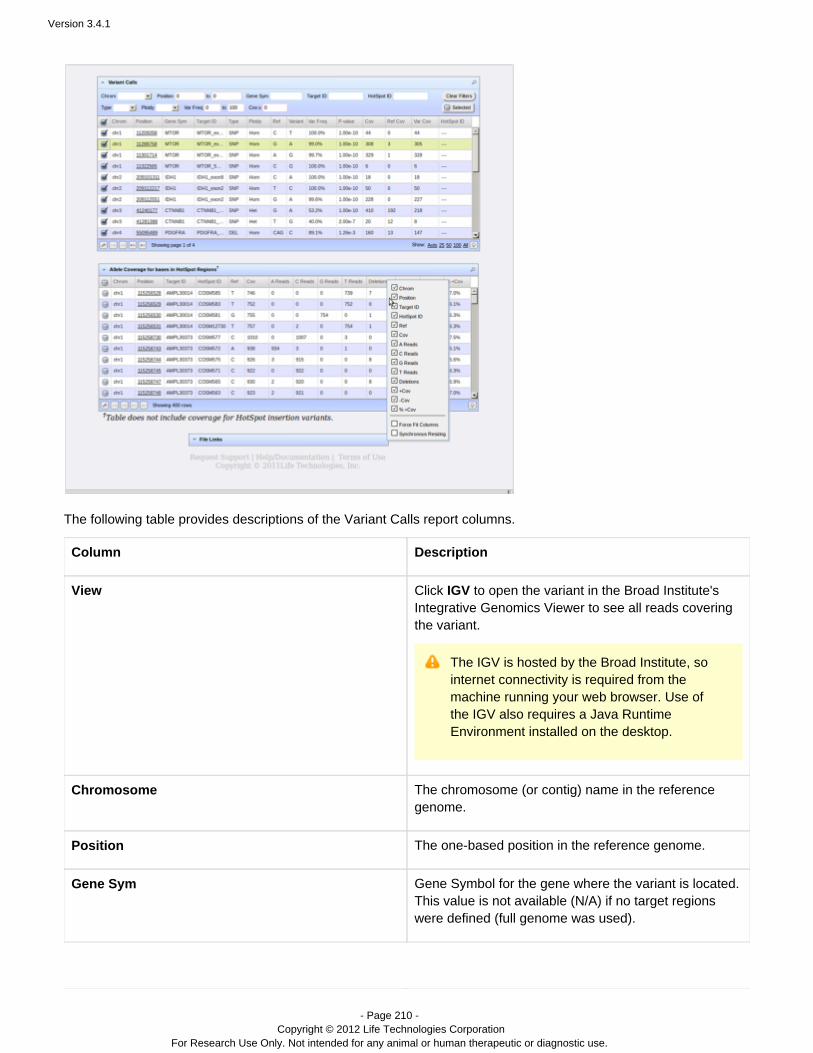
Version 3.4.1
- Page 210 - Copyright © 2012 Life Technologies Corporation
For Research Use Only. Not intended for any animal or human therapeutic or diagnostic use.
The following table provides descriptions of the Variant Calls report columns.
Column Description
View Click to open the variant in the Broad Institute'sIGVIntegrative Genomics Viewer to see all reads coveringthe variant.
The IGV is hosted by the Broad Institute, sointernet connectivity is required from themachine running your web browser. Use ofthe IGV also requires a Java RuntimeEnvironment installed on the desktop.
Chromosome The chromosome (or contig) name in the referencegenome.
Position The one-based position in the reference genome.
Gene Sym Gene Symbol for the gene where the variant is located.This value is not available (N/A) if no target regionswere defined (full genome was used).
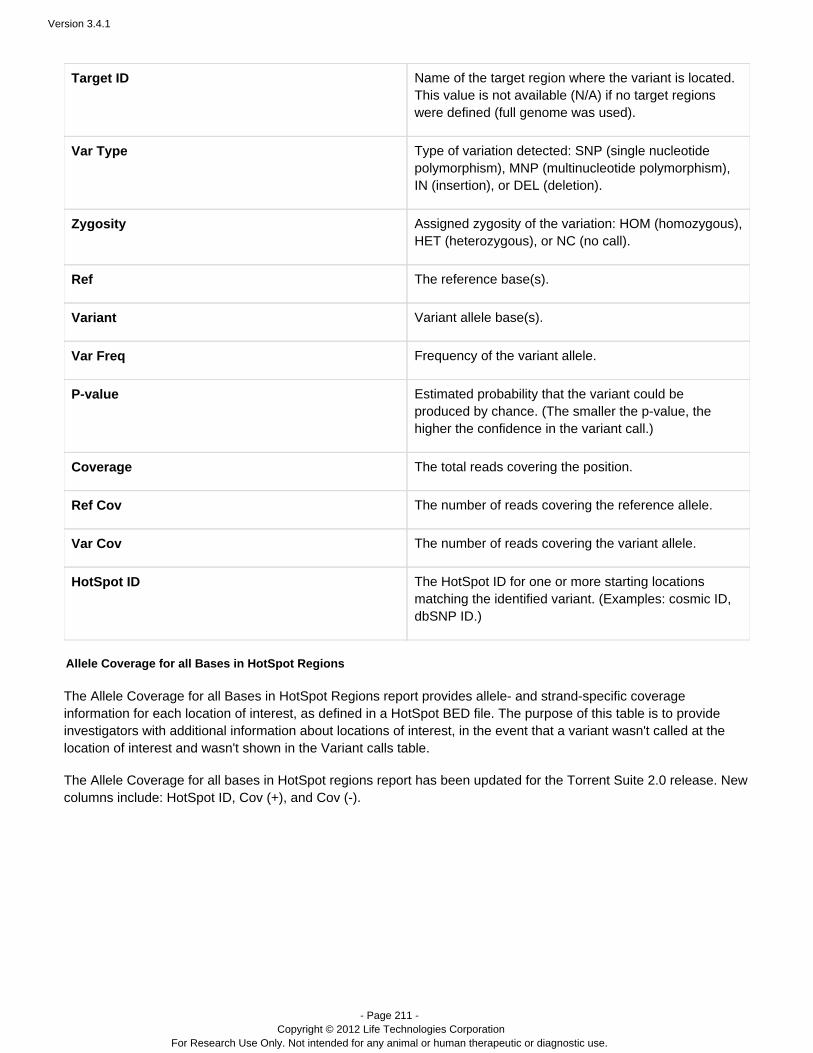
Version 3.4.1
- Page 211 - Copyright © 2012 Life Technologies Corporation
For Research Use Only. Not intended for any animal or human therapeutic or diagnostic use.
Target ID Name of the target region where the variant is located.This value is not available (N/A) if no target regionswere defined (full genome was used).
Var Type Type of variation detected: SNP (single nucleotidepolymorphism), MNP (multinucleotide polymorphism),IN (insertion), or DEL (deletion).
Zygosity Assigned zygosity of the variation: HOM (homozygous),HET (heterozygous), or NC (no call).
Ref The reference base(s).
Variant Variant allele base(s).
Var Freq Frequency of the variant allele.
P-value Estimated probability that the variant could beproduced by chance. (The smaller the p-value, thehigher the confidence in the variant call.)
Coverage The total reads covering the position.
Ref Cov The number of reads covering the reference allele.
Var Cov The number of reads covering the variant allele.
HotSpot ID The HotSpot ID for one or more starting locationsmatching the identified variant. (Examples: cosmic ID,dbSNP ID.)
Allele Coverage for all Bases in HotSpot Regions
The Allele Coverage for all Bases in HotSpot Regions report provides allele- and strand-specific coverageinformation for each location of interest, as defined in a HotSpot BED file. The purpose of this table is to provideinvestigators with additional information about locations of interest, in the event that a variant wasn't called at thelocation of interest and wasn't shown in the Variant calls table.
The Allele Coverage for all bases in HotSpot regions report has been updated for the Torrent Suite 2.0 release. Newcolumns include: HotSpot ID, Cov (+), and Cov (-).
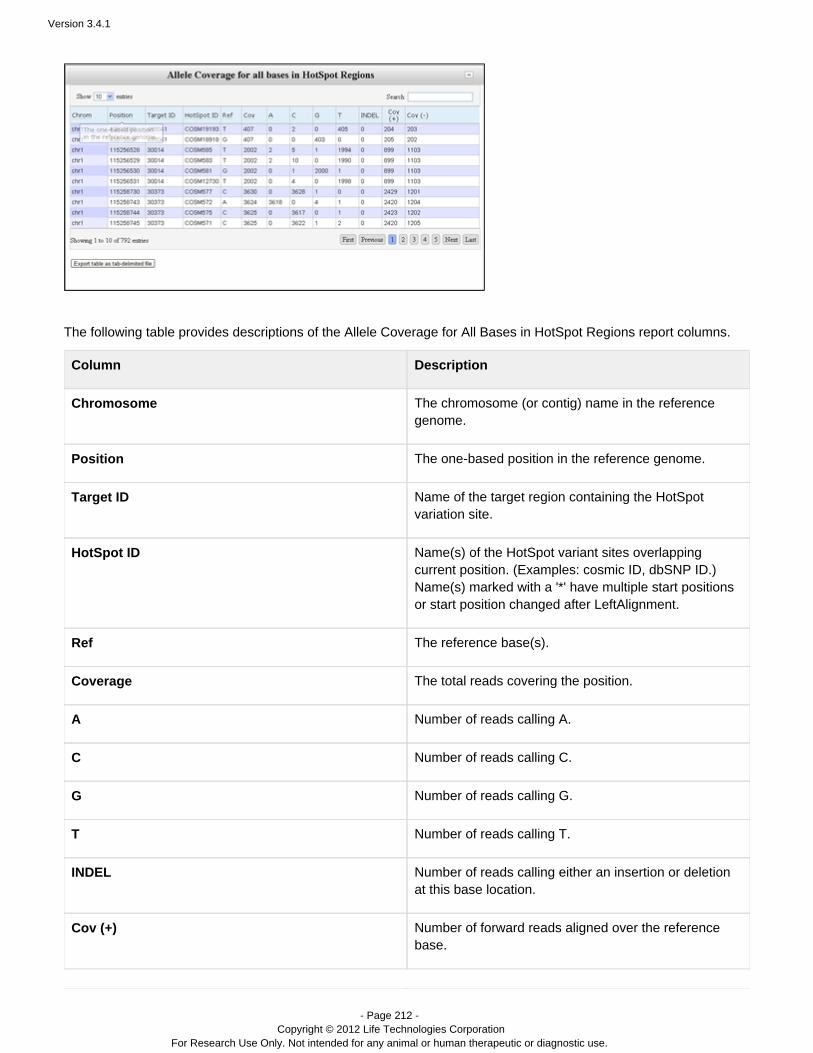
Version 3.4.1
- Page 212 - Copyright © 2012 Life Technologies Corporation
For Research Use Only. Not intended for any animal or human therapeutic or diagnostic use.
The following table provides descriptions of the Allele Coverage for All Bases in HotSpot Regions report columns.
Column Description
Chromosome The chromosome (or contig) name in the referencegenome.
Position The one-based position in the reference genome.
Target ID Name of the target region containing the HotSpotvariation site.
HotSpot ID Name of the HotSpot variant site(s) s overlapping. (Examples: cosmic ID, dbSNP ID.) current position
Name(s) marked with a '*' have multiple start positionsor start position changed after LeftAlignment.
Ref The reference base(s).
Coverage The total reads covering the position.
A Number of reads calling A.
C Number of reads calling C.
G Number of reads calling G.
T Number of reads calling T.
INDEL Number of reads calling either an insertion or deletionat this base location.
Cov (+) Number of forward reads aligned over the referencebase.
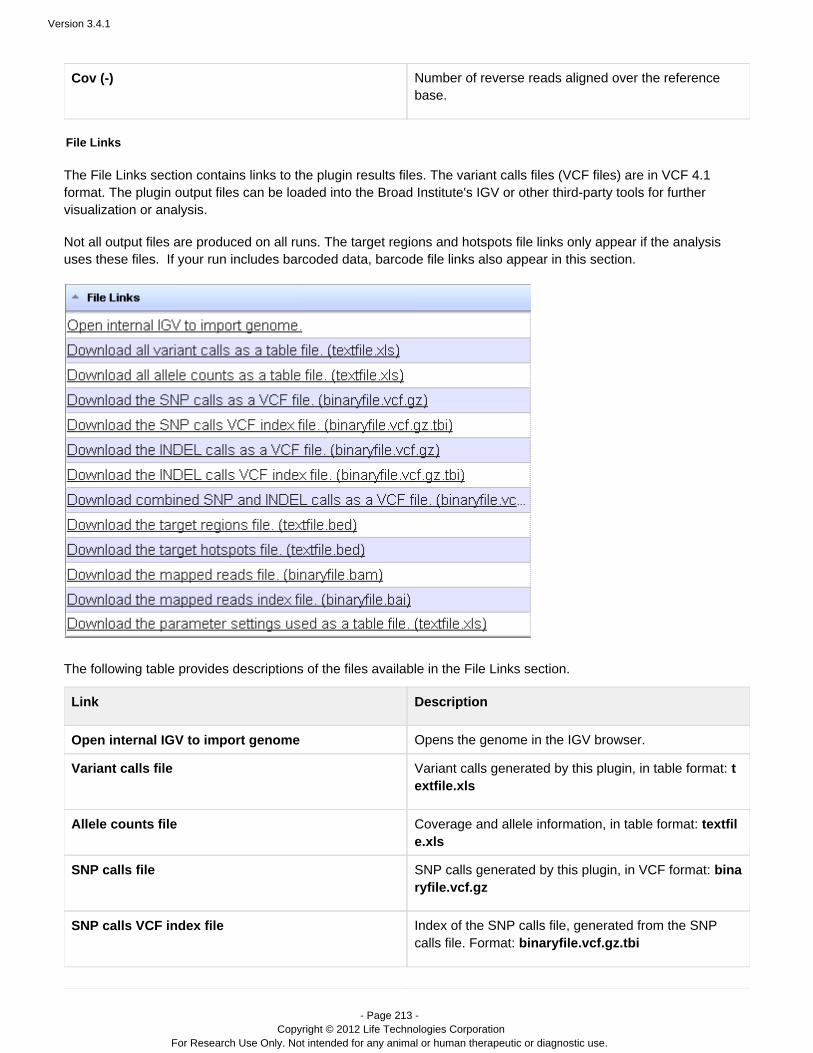
Version 3.4.1
- Page 213 - Copyright © 2012 Life Technologies Corporation
For Research Use Only. Not intended for any animal or human therapeutic or diagnostic use.
Cov (-) Number of reverse reads aligned over the referencebase.
File Links
The File Links section contains links to the plugin results files. The variant calls files (VCF files) are in VCF 4.1format. The plugin output files can be loaded into the Broad Institute's IGV or other third-party tools for furthervisualization or analysis.
Not all output files are produced on all runs. The target regions and hotspots file links only appear if the analysisuses these files. If your run includes barcoded data, barcode file links also appear in this section.
The following table provides descriptions of the files available in the File Links section.
Link Description
Open internal IGV to import genome Opens the genome in the IGV browser.
Variant calls file Variant calls generated by this plugin, in table format: textfile.xls
Allele counts file Coverage and allele information, in table format: textfile.xls
SNP calls file SNP calls generated by this plugin, in VCF format: binaryfile.vcf.gz
SNP calls VCF index file Index of the SNP calls file, generated from the SNPcalls file. Format: binaryfile.vcf.gz.tbi

Version 3.4.1
- Page 214 - Copyright © 2012 Life Technologies Corporation
For Research Use Only. Not intended for any animal or human therapeutic or diagnostic use.
INDEL calls file INDEL calls generated by this plugin, in VCF format: binaryfile.vcf.gz
INDEL calls VCF index file Index of the INDEL calls file, generated from the INDELcalls file. Format: binaryfile.vcf.gz.tbi
Target regions file Target regions file generated by this plugin, in BEDformat: textfile.bed
Target hotspots file Target HotSpots file generated by this plugin, in BEDformat: textfile.bed
Mapped reads file Mapped reads file generated by this plugin, in BAMformat: binaryfile.bam
Mapped reads index file Index of the mapped reads file, generated from themapped reads file. Format: binaryfile.bai
Parameter settings file A listing the Torrent Variant Caller parameter settings,in table format: textfile.xls
TaqMan Assay Search®
After running the TVC plugin, you can select variants from a report table and submit a search against the TaqMan ®
Assay Search webpage. When the search is submitted, you can choose which Assay database to search.TaqMan®
A new browser window appears with the search results. If assays are available for the selected variant,TaqMan®
you can immediately order the assay directly from the landing page. You must be connected to the internet toaccess this feature.
To initiate a search, simply select variants from the TVC plugin report and click on the tool icon. A pop-up window
allows you to submit variants for TaqMan assay design.®
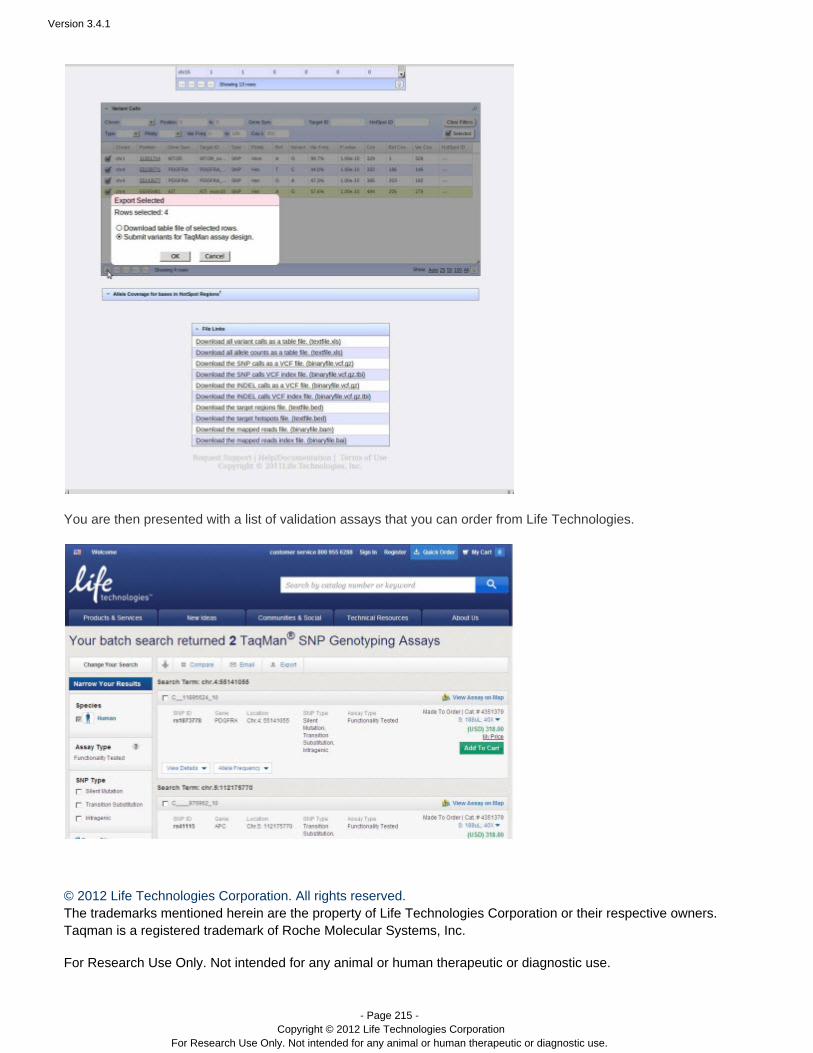
Version 3.4.1
- Page 215 - Copyright © 2012 Life Technologies Corporation
For Research Use Only. Not intended for any animal or human therapeutic or diagnostic use.
You are then presented with a list of validation assays that you can order from Life Technologies.
© 2012 Life Technologies Corporation. All rights reserved.The trademarks mentioned herein are the property of Life Technologies Corporation or their respective owners.Taqman is a registered trademark of Roche Molecular Systems, Inc.
For Research Use Only. Not intended for any animal or human therapeutic or diagnostic use.
Version 3.4.1
- Page 216 - Copyright © 2012 Life Technologies Corporation
For Research Use Only. Not intended for any animal or human therapeutic or diagnostic use.
Contents
Torrent Browser Analysis Report Guide
Run Report Metrics
Run Metrics Overview
Run Report Metrics Before Alignment
Run Report Metrics on Aligned Reads
Barcode Reports
Test Fragment Report
Report Information
Output Files
Plugin Summary
Run the Installed Plugins
Alignment Plugin
Coverage Analysis Plugin
ERCC Analysis Plugin
FastqCreator Plugin
IonReporterUploader Plugin
Run RecognitION Plugin
sampleID Plugin
SFFCreator Plugin
Torrent Variant Caller Plugin
Pre-3.0 Run Reports
Test Fragment Report
Torrent Browser Analysis Report Guide
Test Fragment Report
The section of the Analysis Report provides information about the performance of eachTest Fragment SummaryTest Fragment included in the experiment.
Test Fragments are used during analysis to predict the CF/IE/DR values for each Test Fragment,regionally. Analysis results for a Test Fragment are displayed when there are at least 1000 high-quality TestFragments, where there is an 85% match against the appropriate template in the Test Fragment list. This includesCF/IE/DR estimates and performance calculations.
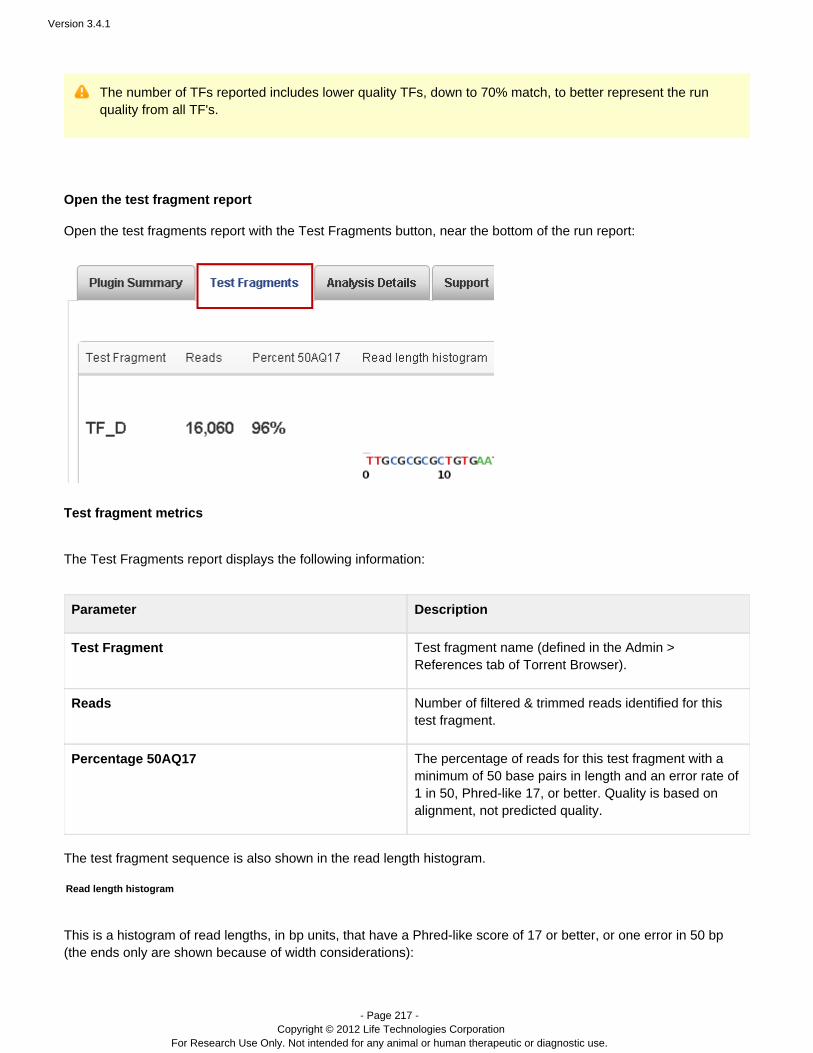
Version 3.4.1
- Page 217 - Copyright © 2012 Life Technologies Corporation
For Research Use Only. Not intended for any animal or human therapeutic or diagnostic use.
The number of TFs reported includes lower quality TFs, down to 70% match, to better represent the runquality from all TF's.
Open the test fragment report
Open the test fragments report with the Test Fragments button, near the bottom of the run report:
Test fragment metrics
The Test Fragments report displays the following information:
Parameter Description
Test Fragment Test fragment name (defined in the Admin >References tab of Torrent Browser).
Reads Number of filtered & trimmed reads identified for thistest fragment.
Percentage 50AQ17 The percentage of reads for this with atest fragmentminimum of 50 base pairs in length and an error rate of1 in 50, Phred-like 17, or better. Quality is based onalignment, not predicted quality.
The test fragment sequence is also shown in the read length histogram.
Read length histogram
This is a histogram of read lengths, in units, that have a Phred-like score of 17 or better, or one error in 50 bpbp(the ends only are shown because of width considerations):
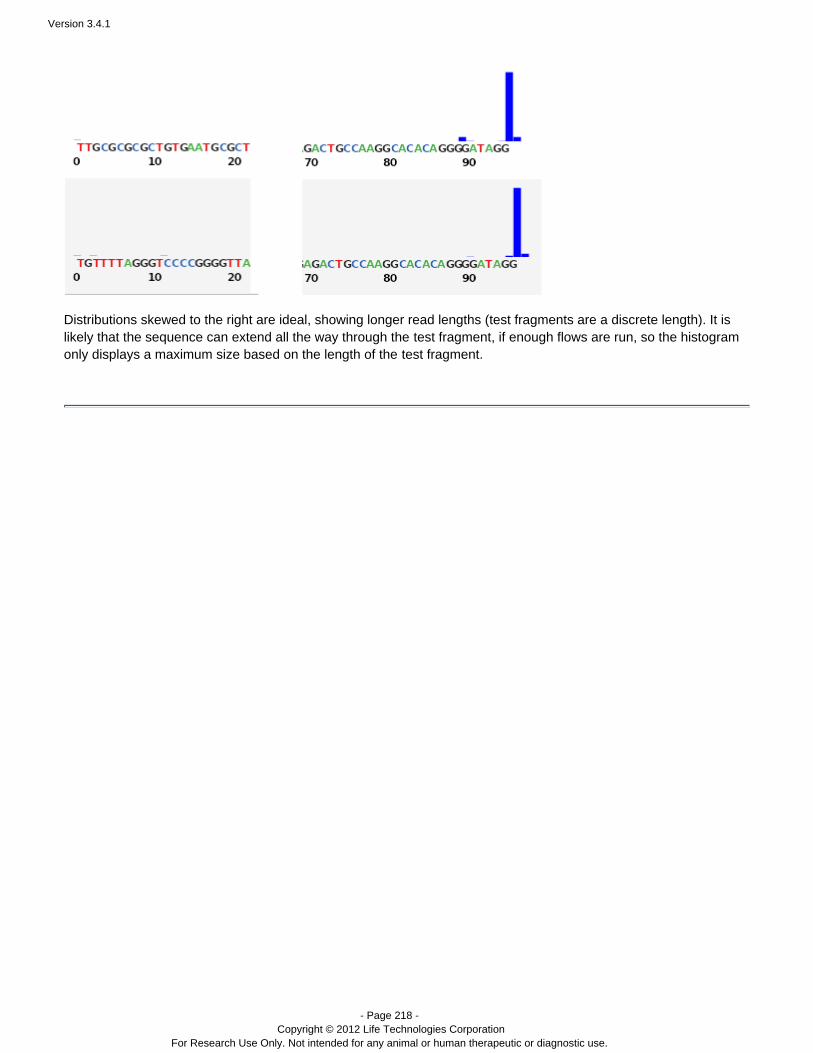
Version 3.4.1
- Page 218 - Copyright © 2012 Life Technologies Corporation
For Research Use Only. Not intended for any animal or human therapeutic or diagnostic use.
Distributions skewed to the right are ideal, showing longer read lengths (test fragments are a discrete length). It islikely that the sequence can extend all the way through the , if enough flows are run, so the histogramtest fragmentonly displays a maximum size based on the length of the .test fragment
Version 3.4.1
- Page 219 - Copyright © 2012 Life Technologies Corporation
For Research Use Only. Not intended for any animal or human therapeutic or diagnostic use.
Contents
Torrent Browser Analysis Report Guide
Run Report Metrics
Run Metrics Overview
Run Report Metrics Before Alignment
Run Report Metrics on Aligned Reads
Barcode Reports
Test Fragment Report
Report Information
Output Files
Plugin Summary
Run the Installed Plugins
Alignment Plugin
Coverage Analysis Plugin
ERCC Analysis Plugin
FastqCreator Plugin
IonReporterUploader Plugin
Run RecognitION Plugin
sampleID Plugin
SFFCreator Plugin
Torrent Variant Caller Plugin
Pre-3.0 Run Reports
Report Information
Torrent Browser Analysis Report Guide
Report Information
This section describes the following run report buttons:
Analysis DetailsSoftware VersionSupport
Analysis Details
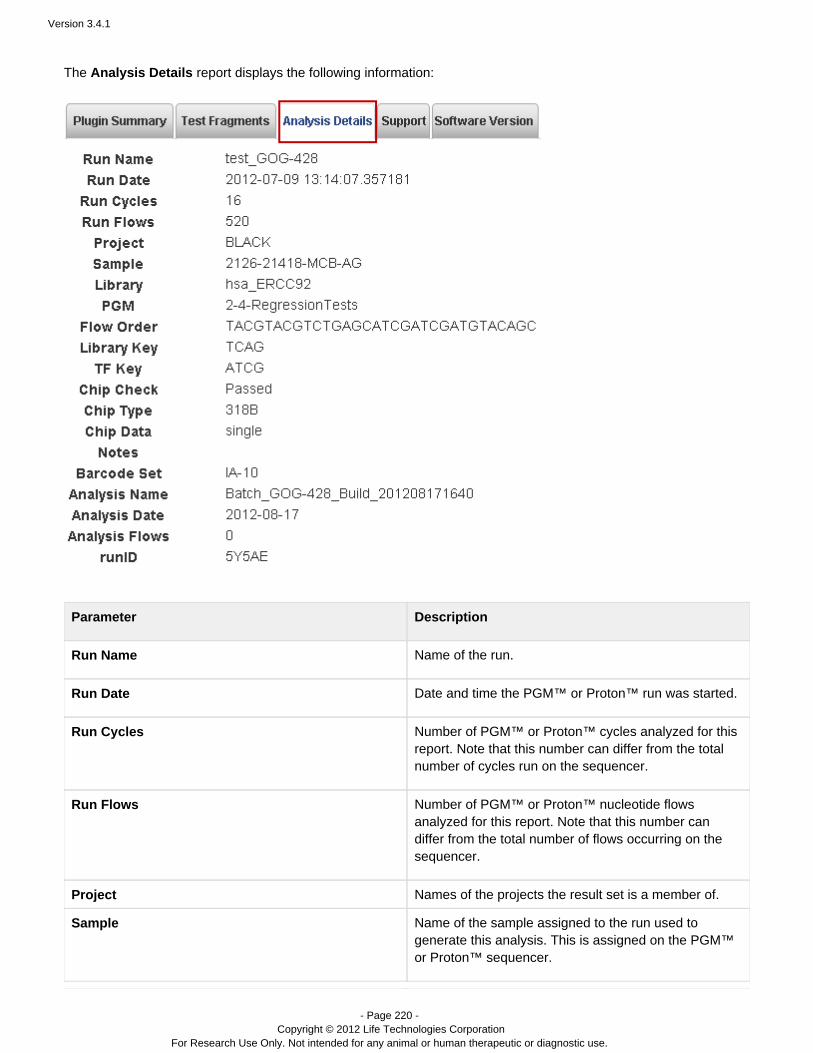
Version 3.4.1
- Page 220 - Copyright © 2012 Life Technologies Corporation
For Research Use Only. Not intended for any animal or human therapeutic or diagnostic use.
The report displays the following information:Analysis Details
Parameter Description
Run Name Name of the run.
Run Date Date and time the PGM™ run was started.or Proton™
Run Cycles Number of PGM™ cycles analyzed for thisor Proton™ report. Note that this number can differ from the totalnumber of cycles run on the sequencer.
Run Flows Number of PGM™ nucleotide flowsor Proton™ analyzed for this report. Note that this number candiffer from the total number of flows occurring on thesequencer.
Project Names of the projects the result set is a member of.
Sample Name of the sample assigned to the run used togenerate this analysis. This is assigned on the PGM™
sequencer.or Proton™
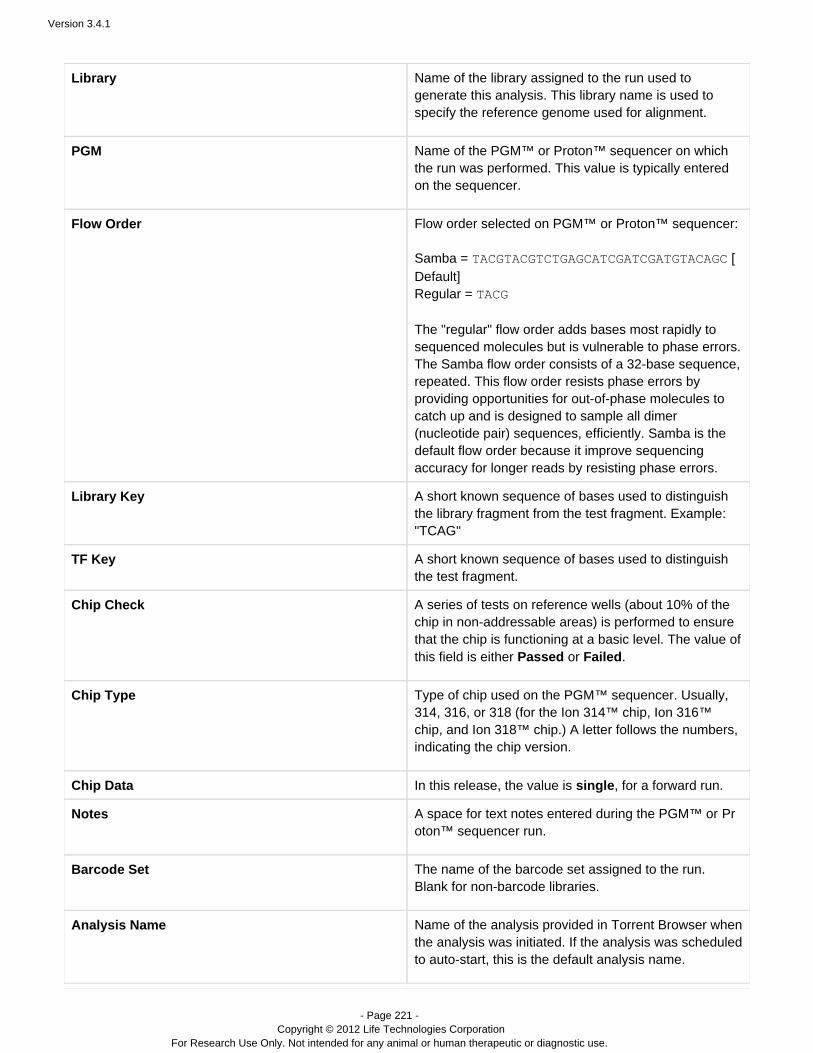
Version 3.4.1
- Page 221 - Copyright © 2012 Life Technologies Corporation
For Research Use Only. Not intended for any animal or human therapeutic or diagnostic use.
Library Name of the library assigned to the run used togenerate this analysis. This library name is used tospecify the reference genome used for alignment.
PGM Name of the PGM™ or Proton™ sequencer on whichthe run was performed. This value is typically enteredon the sequencer.
Flow Order Flow order selected on PGM™ sequencer: or Proton™ Samba = TACGTACGTCTGAGCATCGATCGATGTACAGC [Default] Regular = TACG The "regular" flow order adds bases most rapidly tosequenced molecules but is vulnerable to phase errors.The Samba flow order consists of a 32-base sequence,repeated. This flow order resists phase errors byproviding opportunities for out-of-phase molecules tocatch up and is designed to sample all dimer(nucleotide pair) sequences, efficiently. Samba is thedefault flow order because it improve sequencingaccuracy for longer reads by resisting phase errors.
Library Key A short known sequence of bases used to distinguishthe library fragment from the test fragment. Example:"TCAG"
TF Key A short known sequence of bases used to distinguishthe test fragment.
Chip Check A series of tests on reference wells (about 10% of thechip in non-addressable areas) is performed to ensurethat the chip is functioning at a basic level. The value ofthis field is either or .Passed Failed
Chip Type Type of chip used on the PGM . Usually,™ sequencer314, 316, or 318 (for the Ion 314™ chip, Ion 316™chip, and Ion 318™ chip.) A letter follows the numbers,indicating the chip version.
Chip Data In this release, the value is , for a forward run.single
Notes A space for text notes entered during the PGM™ or Prsequencer run.oton™
Barcode Set The name of the barcode set assigned to the run. Blank for non-barcode libraries.
Analysis Name Name of the analysis provided in Torrent Browser whenthe analysis was initiated. If the analysis was scheduledto auto-start, this is the default analysis name.

Version 3.4.1
- Page 222 - Copyright © 2012 Life Technologies Corporation
For Research Use Only. Not intended for any animal or human therapeutic or diagnostic use.
Analysis Date Date the analysis was performed.
Analysis Flows Number of PGM™ nucleotide flows or Proton™analyzed for this report. Note that this number candiffer from the total number of flows occurring on thePGM™ sequencer. or Proton™
runID The run code that the Torrent Browser assigned to theplanned run for this analysis.
Software Version
The report display includes version information for the Torrent Suite Software and its modulesSoftware Versioninstalled on your Torrent Server.
The version numbers shown in the example may be different from your current version of the softwaredepending on the age of the analysis. See the About tab in the Torrent Browser for a complete list ofmodules and version on your server. See the Torrent Suite Release Notes for the package versions in aspecific release.
Parameter Description
Torrent Suite Version of Torrent Suite software used to generate theanalysis.
Datacollect Version of the Datacollect package.
Graphics Version of the Graphics package
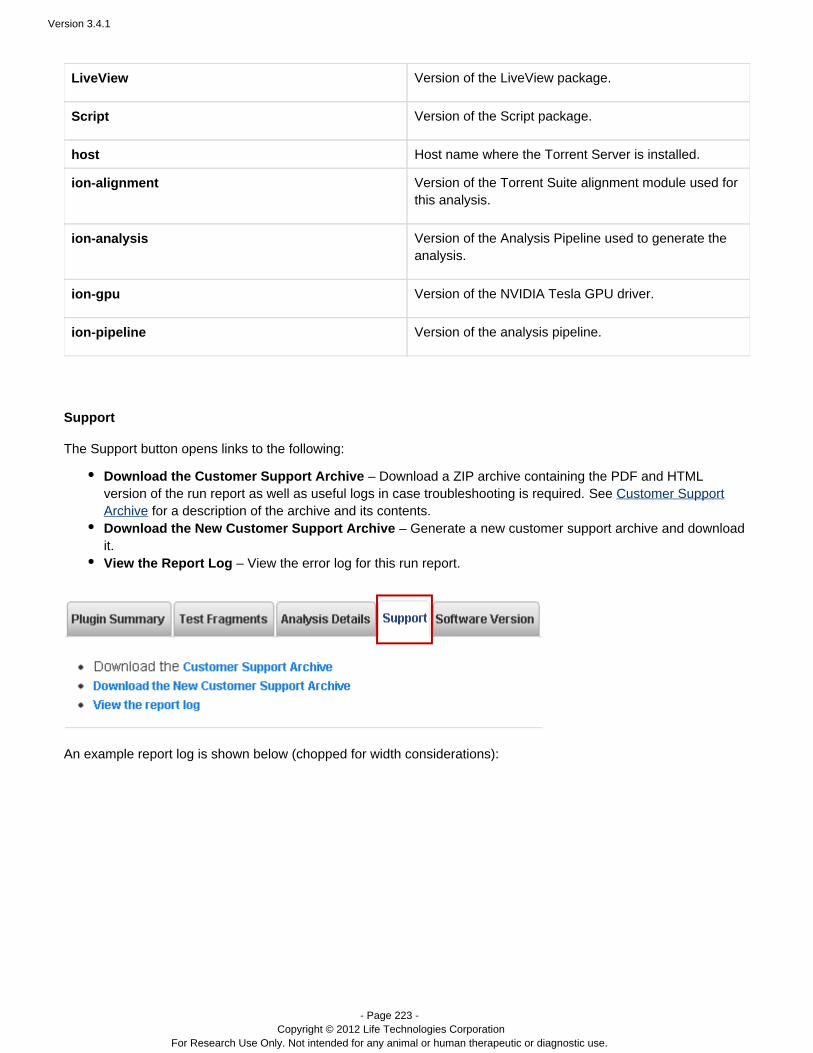
Version 3.4.1
- Page 223 - Copyright © 2012 Life Technologies Corporation
For Research Use Only. Not intended for any animal or human therapeutic or diagnostic use.
LiveView Version of the LiveView package.
Script Version of the Script package.
host Host name where the Torrent Server is installed.
ion-alignment Version of the Torrent Suite alignment module used forthis analysis.
ion-analysis Version of the Analysis Pipeline used to generate theanalysis.
ion-gpu Version of the NVIDIA Tesla GPU driver.
ion-pipeline Version of the analysis pipeline.
Support
The Support button opens links to the following:
Download the Customer Support Archive – Download a ZIP archive containing the PDF and HTMLversion of the run report as well as useful logs in case troubleshooting is required. See Customer SupportArchive for a description of the archive and its contents.Download the New Customer Support Archive – Generate a new customer support archive and downloadit.View the Report Log – View the error log for this run report.
An example report log is shown below (chopped for width considerations):

Version 3.4.1
- Page 224 - Copyright © 2012 Life Technologies Corporation
For Research Use Only. Not intended for any animal or human therapeutic or diagnostic use.
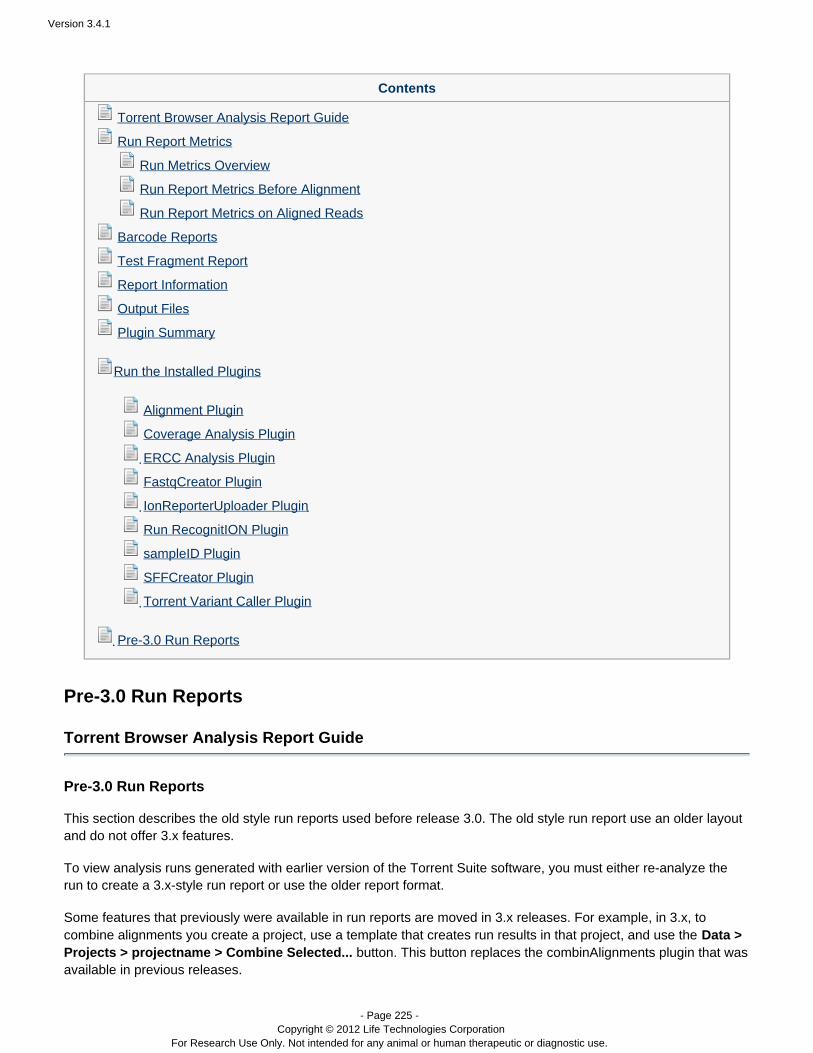
Version 3.4.1
- Page 225 - Copyright © 2012 Life Technologies Corporation
For Research Use Only. Not intended for any animal or human therapeutic or diagnostic use.
Contents
Torrent Browser Analysis Report Guide
Run Report Metrics
Run Metrics Overview
Run Report Metrics Before Alignment
Run Report Metrics on Aligned Reads
Barcode Reports
Test Fragment Report
Report Information
Output Files
Plugin Summary
Run the Installed Plugins
Alignment Plugin
Coverage Analysis Plugin
ERCC Analysis Plugin
FastqCreator Plugin
IonReporterUploader Plugin
Run RecognitION Plugin
sampleID Plugin
SFFCreator Plugin
Torrent Variant Caller Plugin
Pre-3.0 Run Reports
Pre-3.0 Run Reports
Torrent Browser Analysis Report Guide
Pre-3.0 Run Reports
This section describes the old style run reports used before release 3.0. The old style run report use an older layoutand do not offer 3.x features.
To view analysis runs generated with earlier version of the Torrent Suite software, you must either re-analyze therun to create a 3.x-style run report or use the older report format.
Some features that previously were available in run reports are moved in 3.x releases. For example, in 3.x, tocombine alignments you create a project, use a template that creates run results in that project, and use the Data >
button. This button replaces the combinAlignments plugin that wasProjects > > Combine Selected...projectnameavailable in previous releases.
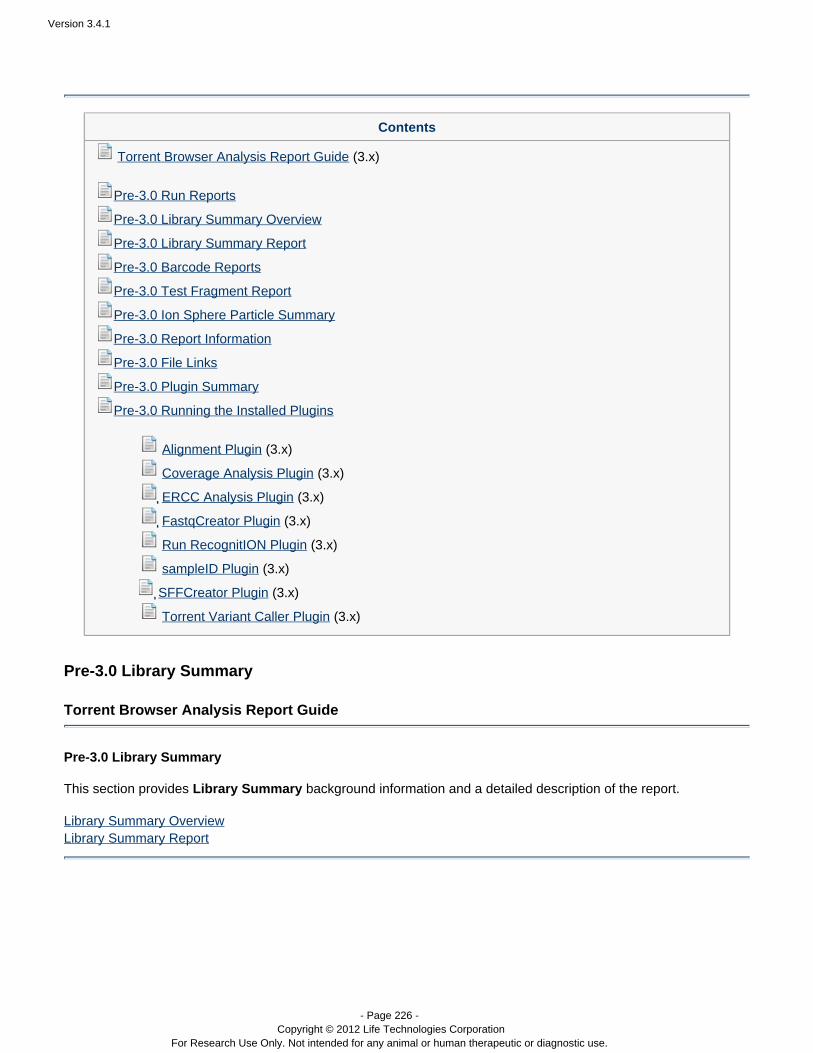
Version 3.4.1
- Page 226 - Copyright © 2012 Life Technologies Corporation
For Research Use Only. Not intended for any animal or human therapeutic or diagnostic use.
Contents
(3.x)Torrent Browser Analysis Report Guide
Pre-3.0 Run Reports
Pre-3.0 Library Summary Overview
Pre-3.0 Library Summary Report
Pre-3.0 Barcode Reports
Pre-3.0 Test Fragment Report
Pre-3.0 Ion Sphere Particle Summary
Pre-3.0 Report Information
Pre-3.0 File Links
Pre-3.0 Plugin Summary
Pre-3.0 Running the Installed Plugins
(3.x) Alignment Plugin
(3.x) Coverage Analysis Plugin
(3.x)ERCC Analysis Plugin
FastqCreator Plugin (3.x)
(3.x)Run RecognitION Plugin
(3.x)sampleID Plugin
SFFCreator Plugin (3.x)
(3.x)Torrent Variant Caller Plugin
Pre-3.0 Library Summary
Torrent Browser Analysis Report Guide
Pre-3.0 Library Summary
This section provides background information and a detailed description of the report.Library Summary
Library Summary OverviewLibrary Summary Report
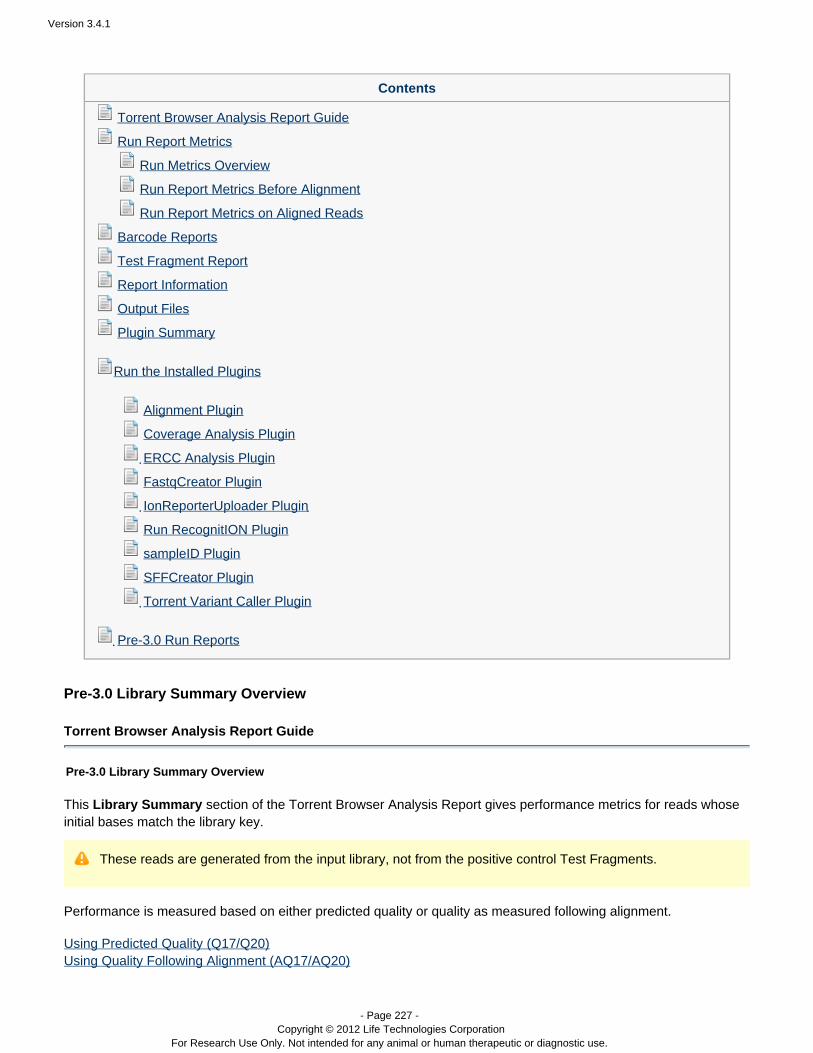
Version 3.4.1
- Page 227 - Copyright © 2012 Life Technologies Corporation
For Research Use Only. Not intended for any animal or human therapeutic or diagnostic use.
Contents
Torrent Browser Analysis Report Guide
Run Report Metrics
Run Metrics Overview
Run Report Metrics Before Alignment
Run Report Metrics on Aligned Reads
Barcode Reports
Test Fragment Report
Report Information
Output Files
Plugin Summary
Run the Installed Plugins
Alignment Plugin
Coverage Analysis Plugin
ERCC Analysis Plugin
FastqCreator Plugin
IonReporterUploader Plugin
Run RecognitION Plugin
sampleID Plugin
SFFCreator Plugin
Torrent Variant Caller Plugin
Pre-3.0 Run Reports
Pre-3.0 Library Summary Overview
Torrent Browser Analysis Report Guide
Pre-3.0 Library Summary Overview
This section of the Torrent Browser Analysis Report gives performance metrics for reads whoseLibrary Summaryinitial bases match the library key.
These reads are generated from the input library, not from the positive control Test Fragments.
Performance is measured based on either predicted quality or quality as measured following alignment.
Using Predicted Quality (Q17/Q20)Using Quality Following Alignment (AQ17/AQ20)
Version 3.4.1
- Page 228 - Copyright © 2012 Life Technologies Corporation
For Research Use Only. Not intended for any animal or human therapeutic or diagnostic use.
1. 2. 3.
Using Predicted Quality (Q17/Q20)
The number of called bases with a predicted quality of Q17 or Q20 is reported. The predicted quality values arereported on the Phred scale, defined as (error probability). Q20, therefore, corresponds to a predicted-10×log10
error rate of one percent and Q17 corresponds to a predicted error rate of two percent.
Refer to for a more complete description of Phred values.http://en.wikipedia.org/wiki/Phred_quality_score
Using Quality Following Alignment (AQ17/AQ20)
Alignment of reads can be a useful process to assess the quality of the sequencing reaction and the quality of theunderlying library where an accurate reference is available. Reads are aligned to a reference genome. Anydiscrepancy in alignment to a reference (whether biological or technical, meaning a real variant or a sequencingerror) is listed as a mismatch. Alignment performance metrics are reported depending on how many misalignedbases are permitted. Torrent Suite reports alignment performance at three quality levels:
AQ17AQ20Perfect
How Is Aligned Read Length Calculated?
The aligned length of a read at a given accuracy threshold is defined as the greatest position in the read at whichthe accuracy in the bases up to and including the position meets the accuracy threshold. So for example the AQ17length of a read is the greatest length at which the read error rate is 2% or less, and the AQ20 length is the greatestlength at which the error rate is 1% or less. The "perfect" length is simply the longest perfectly aligned segment. For all of these calculations the alignment is constrained to start from position 1 in the read - in other words, no 5'clipping is permitted.
The underlying assumption is that the reference to which the read is aligned represents the true sequence thatshould have been seen. Suitable caution should be taken when interpreting AQ17 values in situations where thesample sequenced has substantial differences relative to the reference used, such as working with alignments to arough draft genome or with samples that are expected to have high mutation rates relative to the reference used. Inthese situations the AQ17 lengths might be short even when sequencing quality is excellent.
Specifically, the AQ20 length is computed as follows:
Every base in the read is classified as being correct or incorrect according to the alignment to the reference.At every position in the read the total error rate is computed up to and including that position.The greatest position at which the error rate is one percent or less is identified and that position defines theAQ20 length.
For example, if a 100bp read consists of 80 perfect bases followed by 2 errors followed by 18 more perfect bases,the total error rate at position 80 is zero percent. At position 81 the total error rate is 1.2% (1/81), at position 82 theerror rate is 2.4%, continuing up to position 100 where it is two percent (2/100). The greatest length at which theerror rate is one percent or less is 80 and the greatest length at which the error rate is two percent or less is 100, sothe AQ20 and AQ17 lengths are 80 and 100 bases, respectively.
How Is Alignment Performed?
Within Torrent Browser, the objective is to provide you with a view on alignment that helps determine run and libraryquality.
Version 3.4.1
- Page 229 - Copyright © 2012 Life Technologies Corporation
For Research Use Only. Not intended for any animal or human therapeutic or diagnostic use.
There are many alignment algorithms available within the marketplace and you are encouraged toconsult with a bioinformatician for the most appropriate alignment algorithm for your downstream analysisneeds. Alignment algorithms are also embedded in many of the commercial software tools availablewithin the Ion Torrent Web store. You are also encouraged to experiment with these tools.
Alignment within Torrent Browser is performed using TMAP. TMAP is currently an unpublished alignment algorithm,created by the authors of the BFAST algorithm. Please, contact Ion Torrent Technical Support for more informationabout TMAP.
Technical Note - Analysis PipelineTechnical Note - TMAP Alignment
Although TMAP is unpublished and a reference is not currently available, the precursor to TMAP,BFAST, is based on the ideas in the following publications:
Homer N, Merriman B, Nelson SF.BFAST: An alignment tool for large scale genome resequencing.PMID: 19907642PLoS ONE. 2009 4(11): e7767. http://dx.doi.org/10.1371/journal.pone.0007767
Homer N, Merriman B, Nelson SF.Local alignment of two-base encoded DNA sequence.BMC Bioinformatics. 2009 Jun 9;10(1):175.PMID: 19508732 http://dx.doi.org/10.1186/1471-2105-10-175
Which Reads Are Used in the Alignment Process?
The alignment stage involves aligning reads produced by the pipeline to a reference genome and extracting metricsfrom those alignments. By default, Torrent Suite aligns all reads to the genome, however there may be situations,particularly with large genomes, where the alignment takes longer than the user is willing to wait. So for suchcircumstances the Torrent Suite also has the capability to define on a per-reference basis the maximum number ofreads that should be aligned from a run. For more detail on how to enable and specify this reference-specific limitsee the Adding a Reference Sequence section of .Working with Reference Sequences
When the number of reads in a run exceeds a genome-specific maximum, a random sample of reads is taken andresults are extrapolated to the full run. By sampling a quickly-aligned subset of reads and extrapolating the valuesto the full run, the software gives you enough information to be able to judge the quality of the sample, library andsequencing run for quality assessment purposes.
The outputs of the alignment process is a BAM file. The BAM file includes an alignment of all reads, including theunmapped, with exactly one mapping per read. When a read maps to multiple locations, the mapping with the bestmapping score is used. If more than one such mapping exists, a random mapping is used and given a mappingquality of zero.
Version 3.4.1
- Page 230 - Copyright © 2012 Life Technologies Corporation
For Research Use Only. Not intended for any animal or human therapeutic or diagnostic use.
Contents
(3.x)Torrent Browser Analysis Report Guide
Pre-3.0 Run Reports
Pre-3.0 Library Summary Overview
Pre-3.0 Library Summary Report
Pre-3.0 Barcode Reports
Pre-3.0 Test Fragment Report
Pre-3.0 Ion Sphere Particle Summary
Pre-3.0 Report Information
Pre-3.0 File Links
Pre-3.0 Plugin Summary
Pre-3.0 Running the Installed Plugins
(3.x) Alignment Plugin
(3.x) Coverage Analysis Plugin
(3.x)ERCC Analysis Plugin
FastqCreator Plugin (3.x)
(3.x)Run RecognitION Plugin
(3.x)sampleID Plugin
SFFCreator Plugin (3.x)
(3.x)Torrent Variant Caller Plugin
Pre-3.0 Library Summary Report
Torrent Browser Analysis Report Guide
Pre-3.0 Library Summary Report
Performance, based on either predicted quality or quality as measured following alignment, is provided in the Librar section of the Detailed Report. This section of the report contains the following information:y Summary
Based on Predicted Per-Base Quality Scores - Independent of Alignment
The section gives performanceBased on Predicted Per-Base Quality Scores - Independent of Alignmentmeasurements based on predicted quality:
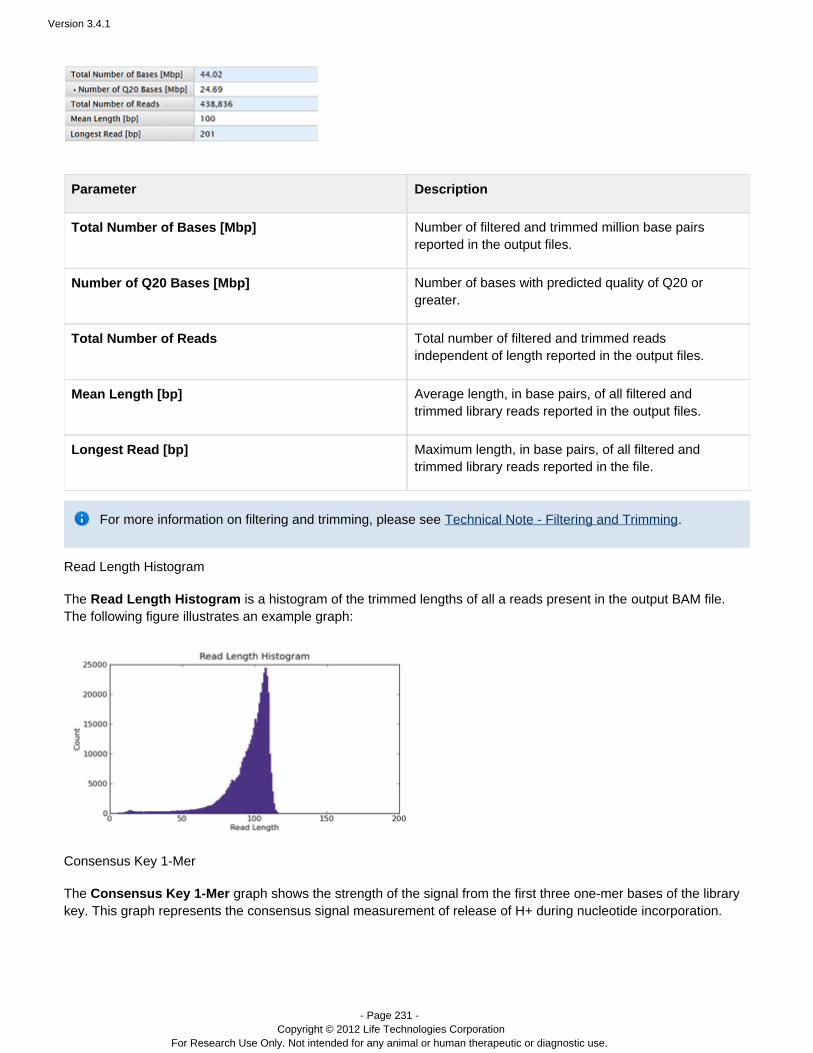
Version 3.4.1
- Page 231 - Copyright © 2012 Life Technologies Corporation
For Research Use Only. Not intended for any animal or human therapeutic or diagnostic use.
Parameter Description
Total Number of Bases [Mbp] Number of filtered and trimmed million base pairsreported in the output files.
Number of Q20 Bases [Mbp] Number of bases with predicted quality of Q20 orgreater.
Total Number of Reads Total number of filtered and trimmed readsindependent of length reported in the files.output
Mean Length [bp] Average length, in base pairs, of all filtered andtrimmed library reads reported in the files.output
Longest Read [bp] Maximum length, in base pairs, of all filtered andtrimmed library reads reported in the file.
For more information on filtering and trimming, please see .Technical Note - Filtering and Trimming
Read Length Histogram
The is a histogram of the trimmed lengths of all a reads present in the file.Read Length Histogram output BAMThe following figure illustrates an example graph:
Consensus Key 1-Mer
The graph shows the strength of the signal from the first three one-mer bases of the libraryConsensus Key 1-Merkey. This graph represents the consensus signal measurement of release of H+ during nucleotide incorporation.
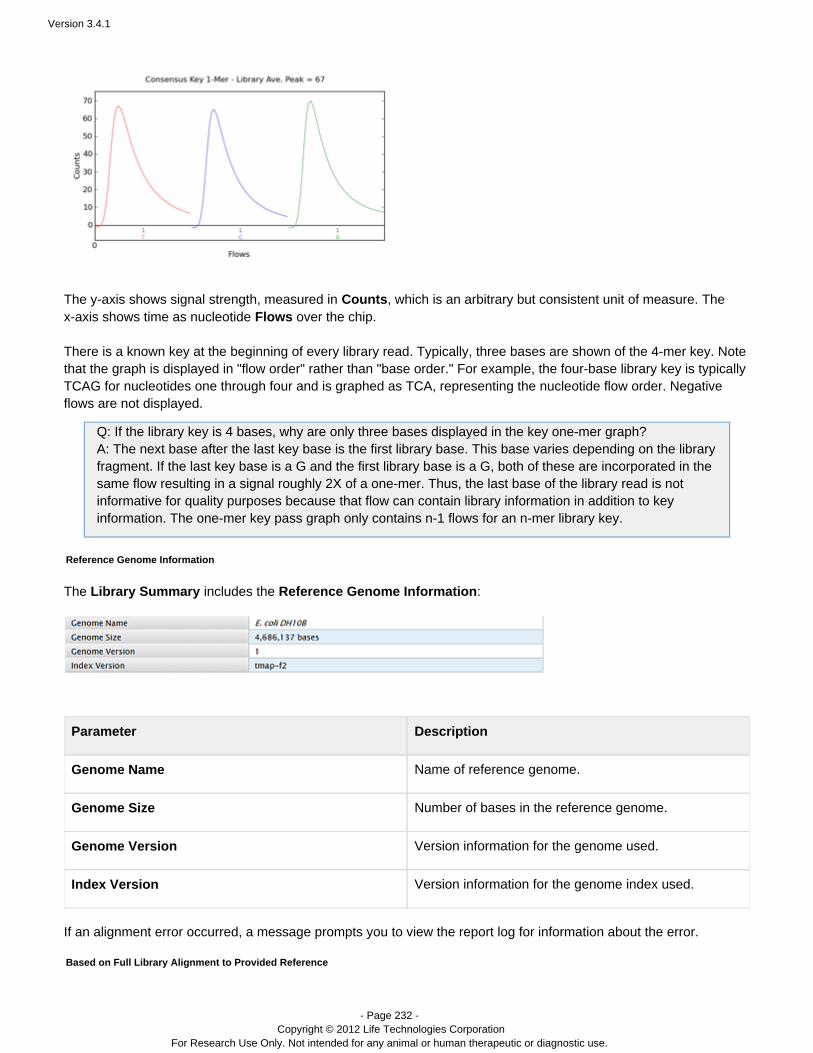
Version 3.4.1
- Page 232 - Copyright © 2012 Life Technologies Corporation
For Research Use Only. Not intended for any animal or human therapeutic or diagnostic use.
The y-axis shows signal strength, measured in , which is an arbitrary but consistent unit of measure. TheCountsx-axis shows time as nucleotide over the chip.Flows There is a known key at the beginning of every library read. Typically, three bases are shown of the 4-mer key. Notethat the graph is displayed in "flow order" rather than "base order." For example, the four-base library key is typicallyTCAG for nucleotides one through four and is graphed as TCA, representing the nucleotide flow order. Negativeflows are not displayed.
Q: If the library key is 4 bases, why are only three bases displayed in the key one-mer graph?A: The next base after the last key base is the first library base. This base varies depending on the libraryfragment. If the last key base is a G and the first library base is a G, both of these are incorporated in thesame flow resulting in a signal roughly 2X of a one-mer. Thus, the last base of the library read is notinformative for quality purposes because that flow can contain library information in addition to keyinformation. The one-mer key pass graph only contains n-1 flows for an n-mer library key.
Reference Genome Information
The includes the :Library Summary Reference Genome Information
Parameter Description
Genome Name Name of reference genome.
Genome Size Number of bases in the reference genome.
Genome Version Version information for the genome used.
Index Version Version information for the genome index used.
If an alignment error occurred, a message prompts you to view the report log for information about the error.
Based on Full Library Alignment to Provided Reference
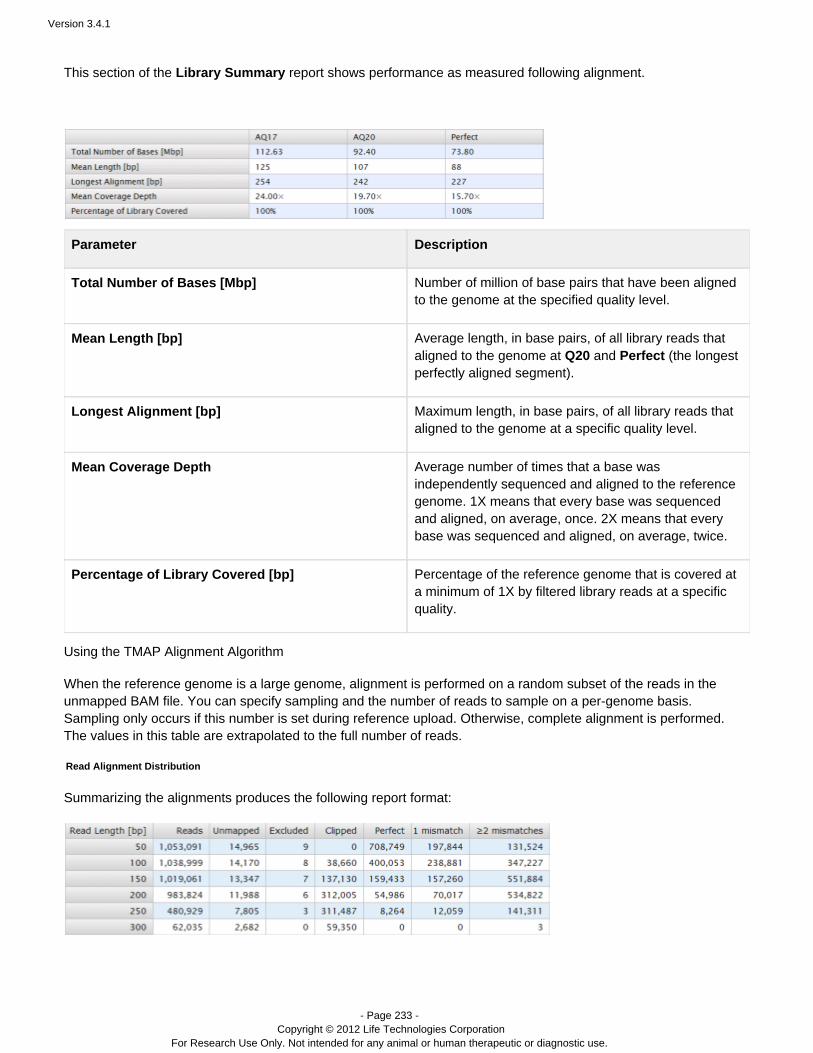
Version 3.4.1
- Page 233 - Copyright © 2012 Life Technologies Corporation
For Research Use Only. Not intended for any animal or human therapeutic or diagnostic use.
This section of the report shows performance as measured following alignment.Library Summary
Parameter Description
Total Number of Bases [Mbp] Number of million of base pairs that have been alignedto the genome at the specified quality level.
Mean Length [bp] Average length, in base pairs, of all library reads thataligned to the genome at and (the longestQ20 Perfectperfectly aligned segment).
Longest Alignment [bp] Maximum length, in base pairs, of all library reads thataligned to the genome at a specific quality level.
Mean Coverage Depth Average number of times that a base wasindependently sequenced and aligned to the referencegenome. 1X means that every base was sequencedand aligned, on average, once. 2X means that everybase was sequenced and aligned, on average, twice.
Percentage of Library Covered [bp] Percentage of the reference genome that is covered ata minimum of 1X by filtered library reads at a specificquality.
Using the TMAP Alignment Algorithm
When the reference genome is a large genome, alignment is performed on a random subset of the reads in theunmapped BAM file. You can specify sampling and the number of reads to sample on a per-genome basis.Sampling only occurs if this number is set during reference upload. Otherwise, complete alignment is performed.The values in this table are extrapolated to the full number of reads.
Read Alignment Distribution
Summarizing the alignments produces the following report format:

Version 3.4.1
- Page 234 - Copyright © 2012 Life Technologies Corporation
For Research Use Only. Not intended for any animal or human therapeutic or diagnostic use.
The number of rows displayed varies depending on the read length.
Each column shows data based on alignment of the sample.
Column Description
Read Length [bp] The number of bases in each read considered for therow in the table.
Reads Number of reads with at least bases.Read Length
Unmapped Number of reads that TMAP could not map.
Excluded Number of reads mapped but not having 90% accuracyin first 50 bases.
Clipped Number of reads mapped and with accuracy of greaterthan 90% in first 50 bases, but with align length lessthan the threshold.Read Length
Perfect Number of aligned reads with zero mismatches in thefirst bases.Read Length
1 mismatch Number of aligned reads with one mismatch in the first bases.Read Length
2 mismatches Number of aligned reads with two or more mismatchesin the first bases.Read Length
SAM/BAM files for reports with sampled data only include alignment information for the sampled subset.
Version 3.4.1
- Page 235 - Copyright © 2012 Life Technologies Corporation
For Research Use Only. Not intended for any animal or human therapeutic or diagnostic use.
Contents
(3.x)Torrent Browser Analysis Report Guide
Pre-3.0 Run Reports
Pre-3.0 Library Summary Overview
Pre-3.0 Library Summary Report
Pre-3.0 Barcode Reports
Pre-3.0 Test Fragment Report
Pre-3.0 Ion Sphere Particle Summary
Pre-3.0 Report Information
Pre-3.0 File Links
Pre-3.0 Plugin Summary
Pre-3.0 Running the Installed Plugins
(3.x) Alignment Plugin
(3.x) Coverage Analysis Plugin
(3.x)ERCC Analysis Plugin
FastqCreator Plugin (3.x)
(3.x)Run RecognitION Plugin
(3.x)sampleID Plugin
SFFCreator Plugin (3.x)
(3.x)Torrent Variant Caller Plugin
Pre-3.0 Barcode Reports
Torrent Browser Analysis Report Guide
Pre-3.0 Barcode Reports
The Barcode Reports section displays histograms for the following metrics per barcode:
Chart Description
Total number of reads Total number of filtered and trimmed readsindependent of length. This number is reported in thebarcode unmapped BAM file.
AQ20 Bases Number of base pairs of sequence from reads withaligned quality score of AQ20 or better.

Version 3.4.1
- Page 236 - Copyright © 2012 Life Technologies Corporation
For Research Use Only. Not intended for any animal or human therapeutic or diagnostic use.
Mean AQ20 read length An AQ20 read length is the length, in units, that afterbpalignment has a Phred-like score of 20 or better, or oneerror in 100 bp. This histogram charts the mean ofthese AQ20 read lengths per barcode.
AQ20 Reads The number of reads with an aligned quality score ofAQ20 or better.

Version 3.4.1
- Page 237 - Copyright © 2012 Life Technologies Corporation
For Research Use Only. Not intended for any animal or human therapeutic or diagnostic use.
The number of barcodes shown in the reports varies according to the barcode set used in your run and on thebarcodes actually present in the sample. Only data for barcodes present in the run are displayed in the chart.
Each bar is labeled with the barcode ID. Data labeled as barcode ID X reports the number of unclassified barcodes:reads which could not be classified as matching one of the expected barcodes in the barcode set.
Version 3.4.1
- Page 238 - Copyright © 2012 Life Technologies Corporation
For Research Use Only. Not intended for any animal or human therapeutic or diagnostic use.
Contents
(3.x)Torrent Browser Analysis Report Guide
Pre-3.0 Run Reports
Pre-3.0 Library Summary Overview
Pre-3.0 Library Summary Report
Pre-3.0 Barcode Reports
Pre-3.0 Test Fragment Report
Pre-3.0 Ion Sphere Particle Summary
Pre-3.0 Report Information
Pre-3.0 File Links
Pre-3.0 Plugin Summary
Pre-3.0 Running the Installed Plugins
(3.x) Alignment Plugin
(3.x) Coverage Analysis Plugin
(3.x)ERCC Analysis Plugin
FastqCreator Plugin (3.x)
(3.x)Run RecognitION Plugin
(3.x)sampleID Plugin
SFFCreator Plugin (3.x)
(3.x)Torrent Variant Caller Plugin
Pre-3.0 Test Fragment Report
Torrent Browser Analysis Report Guide
Pre-3.0 Test Fragment Report
The section of the Analysis Report provides information about the performance of eachTest Fragment SummaryTest Fragment included in the experiment.
The report has a heading for each Test Fragment, in the form .Test Fragment - <TestFragmentName>
Test Fragments are used during analysis to predict the CF/IE/DR values for each Test Fragment,regionally. Analysis results for a Test Fragment are displayed when there are at least 1000 high-quality TestFragments, where there is an 85% match against the appropriate template in the Test Fragment list. This includesCF/IE/DR estimates and performance calculations.
The number of TFs reported includes lower quality TFs, down to 70% match, to better represent the runquality from all TF's.

Version 3.4.1
- Page 239 - Copyright © 2012 Life Technologies Corporation
For Research Use Only. Not intended for any animal or human therapeutic or diagnostic use.
Test Fragment Summary
The part of the displays the following information:Test Fragment Summary Test Fragment Report
Test Fragment List
Consensus Key 1-Mer
The Consensus Key 1-Mer graph shows the strength of the signal from the first three one-mer bases of the TestFragment key. This graph represents the consensus signal measurement of release of H+ during nucleotideincorporation.
The y-axis shows signal strength, measured in Counts, which is an arbitrary but consistent unit of measure. Thex-axis shows time as nucleotide Flows over the chip.
There is a known key at the beginning of every read. Typically, three bases are shown of the 4-mer key. Note thatthe graph is displayed in "flow order" rather than "base order." For example, the four-base Test Fragment key istypically ATCG for nucleotides one through four and is graphed as ATC, representing the nucleotide flow order.Negative flows are not displayed.
Quality Metrics
The part of the displays the following information:Quality Metrics Test Fragment Report
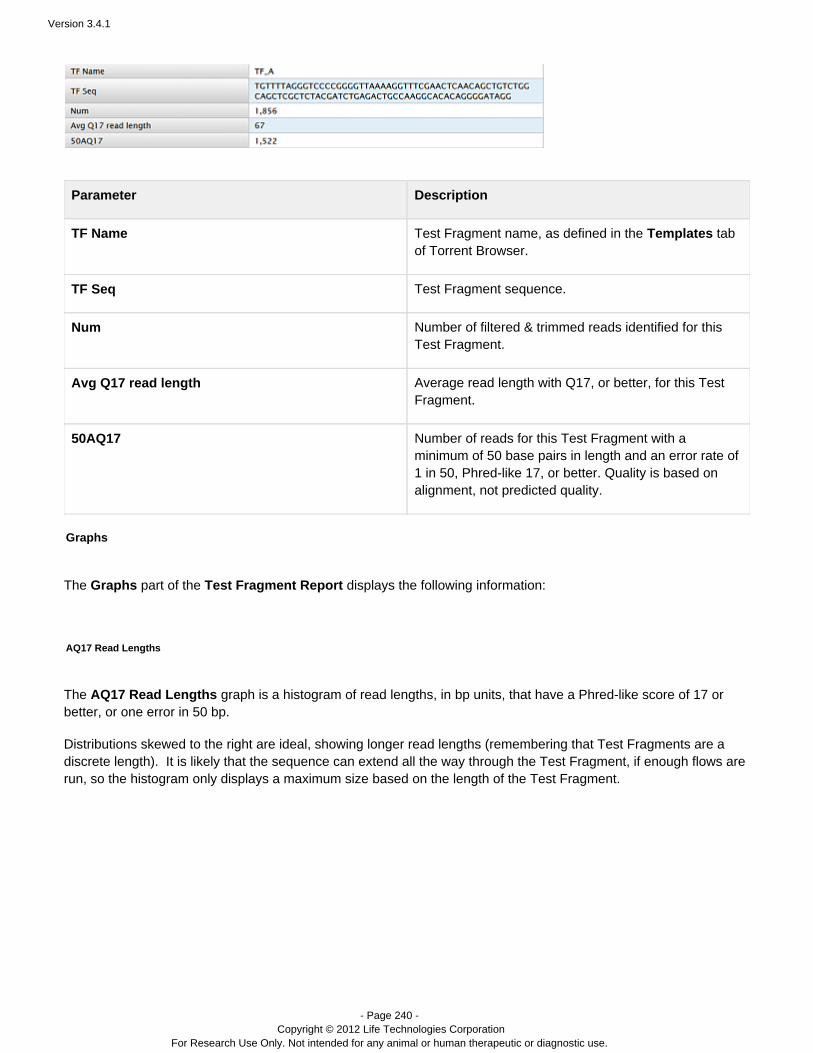
Version 3.4.1
- Page 240 - Copyright © 2012 Life Technologies Corporation
For Research Use Only. Not intended for any animal or human therapeutic or diagnostic use.
Parameter Description
TF Name Test Fragment name, as defined in the tabTemplatesof Torrent Browser.
TF Seq Test Fragment sequence.
Num Number of filtered & trimmed reads identified for thisTest Fragment.
Avg Q17 read length Average read length with Q17, or better, for this TestFragment.
50AQ17 Number of reads for this Test Fragment with aminimum of 50 base pairs in length and an error rate of1 in 50, Phred-like 17, or better. Quality is based onalignment, not predicted quality.
Graphs
The part of the displays the following information:Graphs Test Fragment Report
AQ17 Read Lengths
The graph is a histogram of read lengths, in units, that have a Phred-like score of 17 orAQ17 Read Lengths bpbetter, or one error in 50 bp.
Distributions skewed to the right are ideal, showing longer read lengths (remembering that Test Fragments are adiscrete length). It is likely that the sequence can extend all the way through the Test Fragment, if enough flows arerun, so the histogram only displays a maximum size based on the length of the Test Fragment.
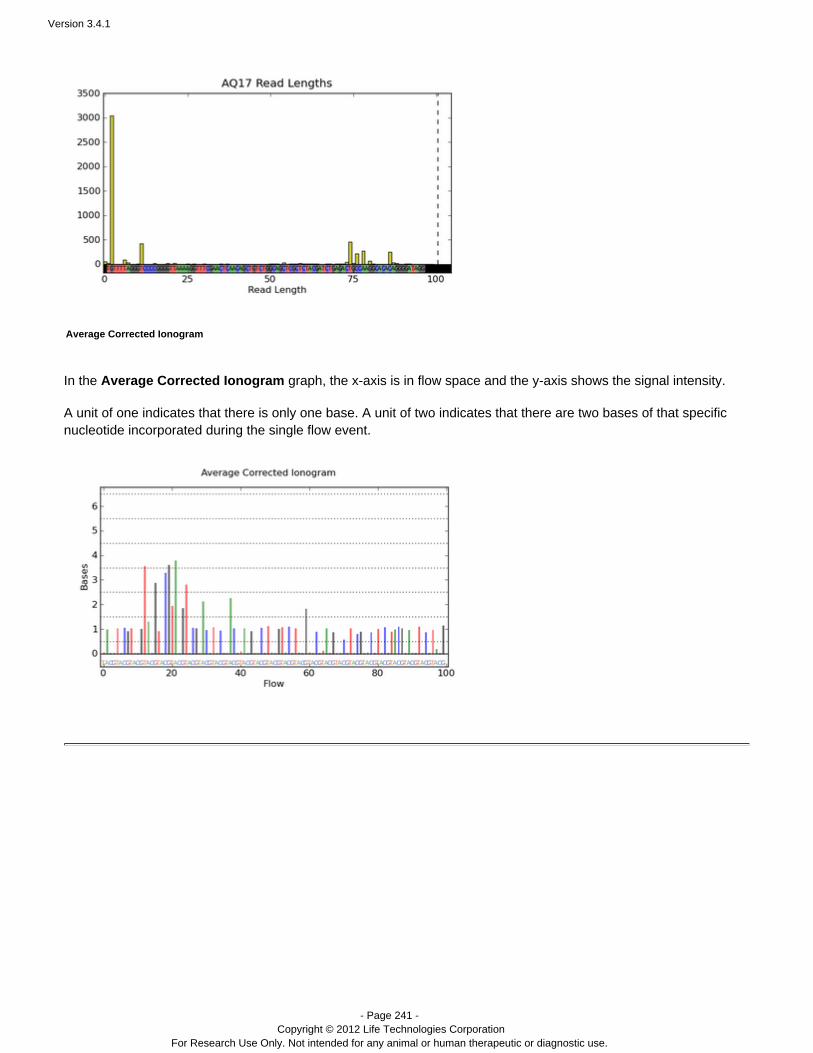
Version 3.4.1
- Page 241 - Copyright © 2012 Life Technologies Corporation
For Research Use Only. Not intended for any animal or human therapeutic or diagnostic use.
Average Corrected Ionogram
In the graph, the x-axis is in flow space and the y-axis shows the signal intensity.Average Corrected Ionogram
A unit of one indicates that there is only one base. A unit of two indicates that there are two bases of that specificnucleotide incorporated during the single flow event.

Version 3.4.1
- Page 242 - Copyright © 2012 Life Technologies Corporation
For Research Use Only. Not intended for any animal or human therapeutic or diagnostic use.
Contents
(3.x)Torrent Browser Analysis Report Guide
Pre-3.0 Run Reports
Pre-3.0 Library Summary Overview
Pre-3.0 Library Summary Report
Pre-3.0 Barcode Reports
Pre-3.0 Test Fragment Report
Pre-3.0 Ion Sphere Particle Summary
Pre-3.0 Report Information
Pre-3.0 File Links
Pre-3.0 Plugin Summary
Pre-3.0 Running the Installed Plugins
(3.x) Alignment Plugin
(3.x) Coverage Analysis Plugin
(3.x)ERCC Analysis Plugin
FastqCreator Plugin (3.x)
(3.x)Run RecognitION Plugin
(3.x)sampleID Plugin
SFFCreator Plugin (3.x)
(3.x)Torrent Variant Caller Plugin
Pre-3.0 Ion Sphere Particle Summary
Torrent Browser Analysis Report Guide
Pre-3.0 Ion Sphere™ Particle (ISP) Summary
The section of the Analysis Report gives summary statisticsIon Sphere™ Particle (ISP) Identification Summaryof Ion Sphere™ Particle performance:
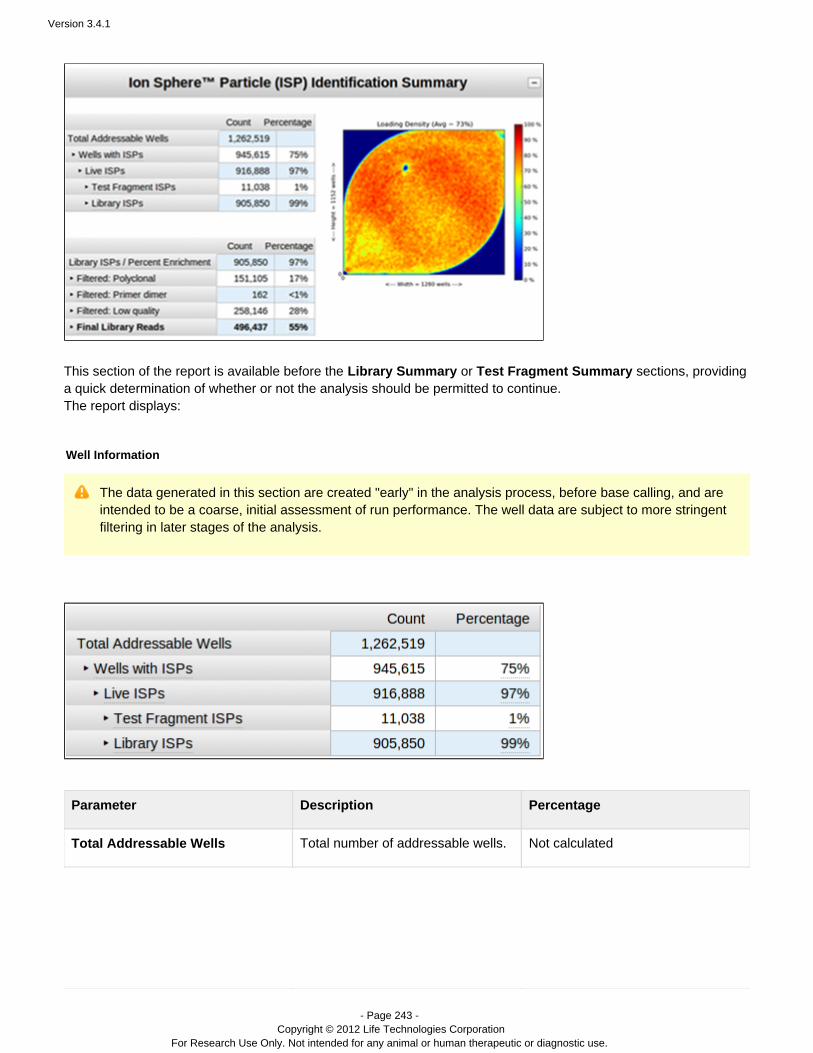
Version 3.4.1
- Page 243 - Copyright © 2012 Life Technologies Corporation
For Research Use Only. Not intended for any animal or human therapeutic or diagnostic use.
This section of the report is available before the or sections, providingLibrary Summary Test Fragment Summarya quick determination of whether or not the analysis should be permitted to continue.The report displays:
Well Information
The data generated in this section are created "early" in the analysis process, before base calling, and areintended to be a coarse, initial assessment of run performance. The well data are subject to more stringentfiltering in later stages of the analysis.
Parameter Description Percentage
Total Addressable Wells Total number of addressable wells. Not calculated
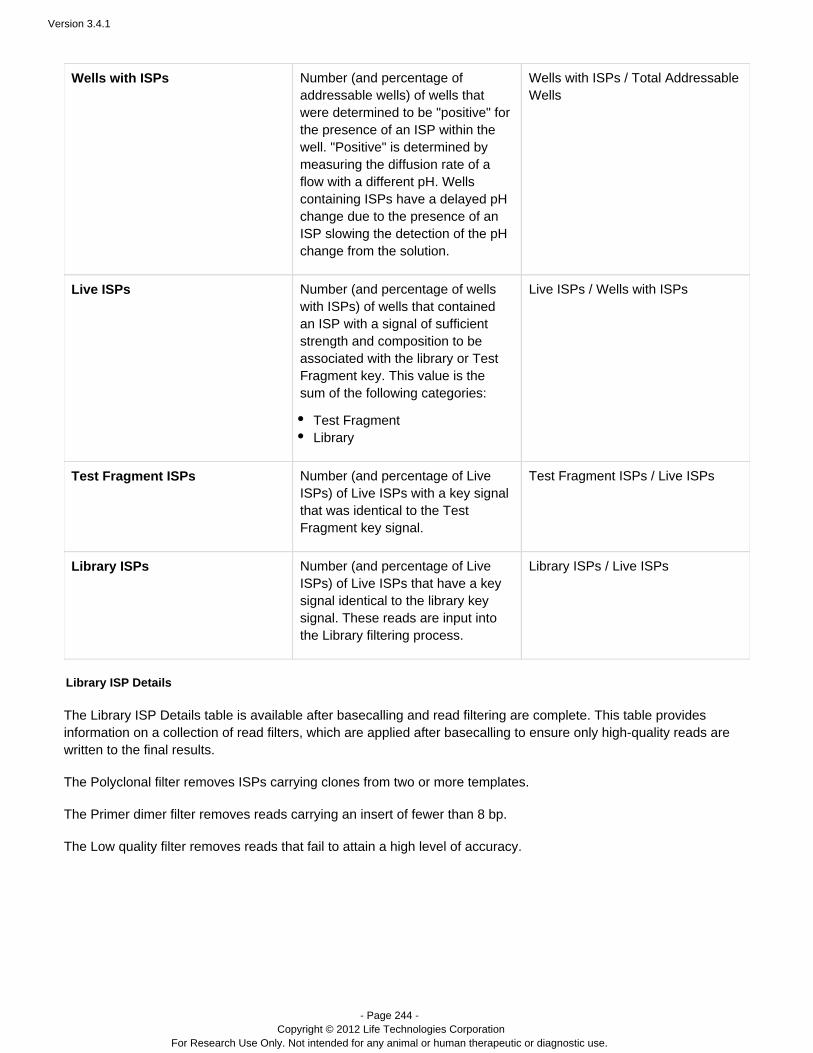
Version 3.4.1
- Page 244 - Copyright © 2012 Life Technologies Corporation
For Research Use Only. Not intended for any animal or human therapeutic or diagnostic use.
Wells with ISPs Number (and percentage ofaddressable wells) of wells thatwere determined to be "positive" forthe presence of an ISP within thewell. "Positive" is determined bymeasuring the diffusion rate of aflow with a different pH. Wellscontaining ISPs have a delayed pHchange due to the presence of anISP slowing the detection of the pHchange from the solution.
Wells with ISPs / Total AddressableWells
Live ISPs Number (and percentage of wellswith ISPs) of wells that containedan ISP with a signal of sufficientstrength and composition to beassociated with the library or TestFragment key. This value is thesum of the following categories:
Test FragmentLibrary
Live ISPs / Wells with ISPs
Test Fragment ISPs Number (and percentage of LiveISPs) of Live ISPs with a key signalthat was identical to the TestFragment key signal.
Test Fragment ISPs / Live ISPs
Library ISPs Number (and percentage of LiveISPs) of Live ISPs that have a keysignal identical to the library keysignal. These reads are input intothe Library filtering process.
Library ISPs / Live ISPs
Library ISP Details
The Library ISP Details table is available after basecalling and read filtering are complete. This table providesinformation on a collection of read filters, which are applied after basecalling to ensure only high-quality reads arewritten to the final results.
The Polyclonal filter removes ISPs carrying clones from two or more templates.
The Primer dimer filter removes reads carrying an insert of fewer than 8 bp.
The Low quality filter removes reads that fail to attain a high level of accuracy.
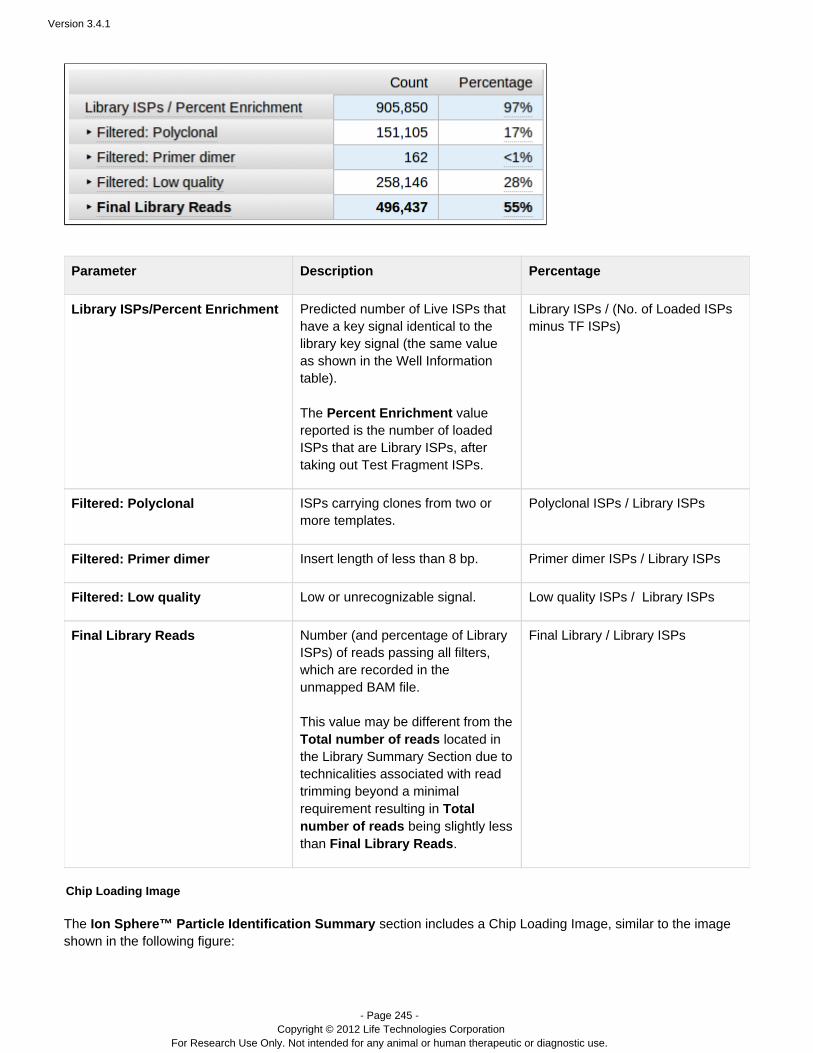
Version 3.4.1
- Page 245 - Copyright © 2012 Life Technologies Corporation
For Research Use Only. Not intended for any animal or human therapeutic or diagnostic use.
Parameter Description Percentage
Library ISPs/Percent Enrichment Predicted number of Live ISPs thathave a key signal identical to thelibrary key signal (the same valueas shown in the Well Informationtable).
The valuePercent Enrichmentreported is the number of loadedISPs that are Library ISPs, aftertaking out Test Fragment ISPs.
Library ISPs / (No. of Loaded ISPsminus TF ISPs)
Filtered: Polyclonal ISPs carrying clones from two ormore templates.
Polyclonal ISPs / Library ISPs
Filtered: Primer dimer Insert length of less than 8 bp. Primer dimer ISPs / Library ISPs
Filtered: Low quality Low or unrecognizable signal. Low quality ISPs / Library ISPs
Final Library Reads Number (and percentage of LibraryISPs) of reads passing all filters,which are recorded in theunmapped BAM file.
This value may be different from the located inTotal number of reads
the Library Summary Section due totechnicalities associated with readtrimming beyond a minimalrequirement resulting in Total
being slightly lessnumber of readsthan .Final Library Reads
Final Library / Library ISPs
Chip Loading Image
The section includes a Chip Loading Image, similar to the imageIon Sphere™ Particle Identification Summaryshown in the following figure:
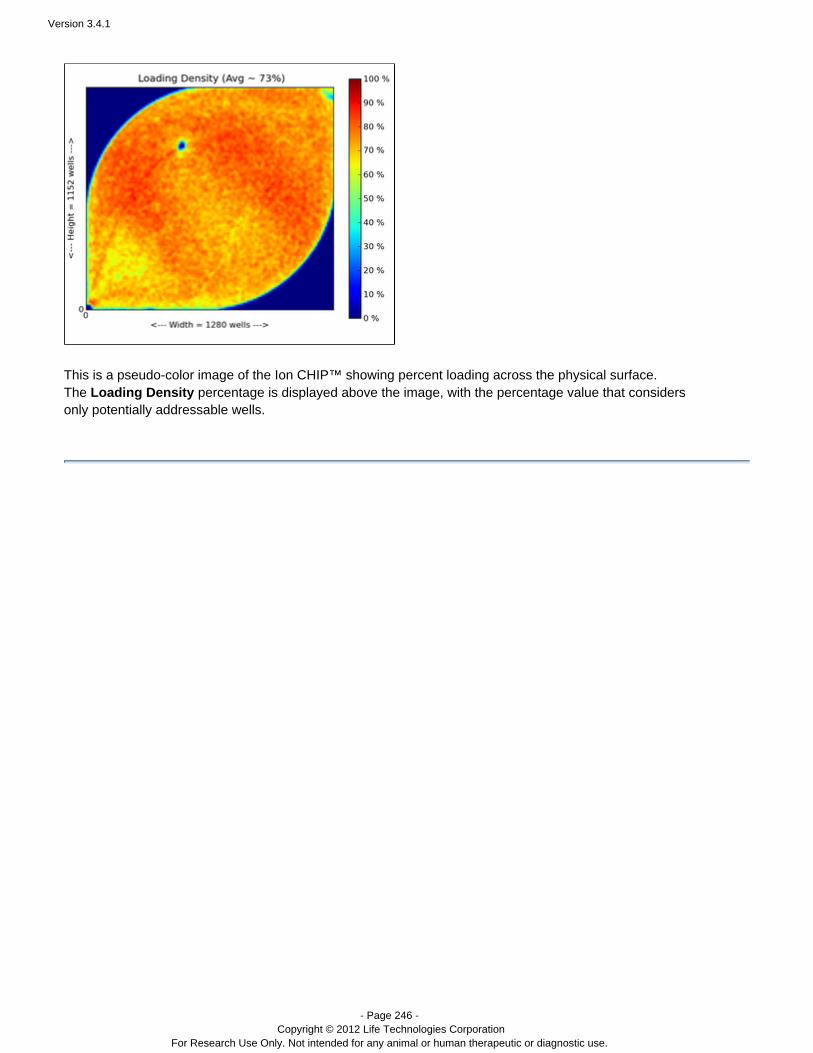
Version 3.4.1
- Page 246 - Copyright © 2012 Life Technologies Corporation
For Research Use Only. Not intended for any animal or human therapeutic or diagnostic use.
This is a pseudo-color image of the Ion CHIP™ showing percent loading across the physical surface.The percentage is displayed above the image, with the percentage value that considersLoading Densityonly potentially addressable wells.
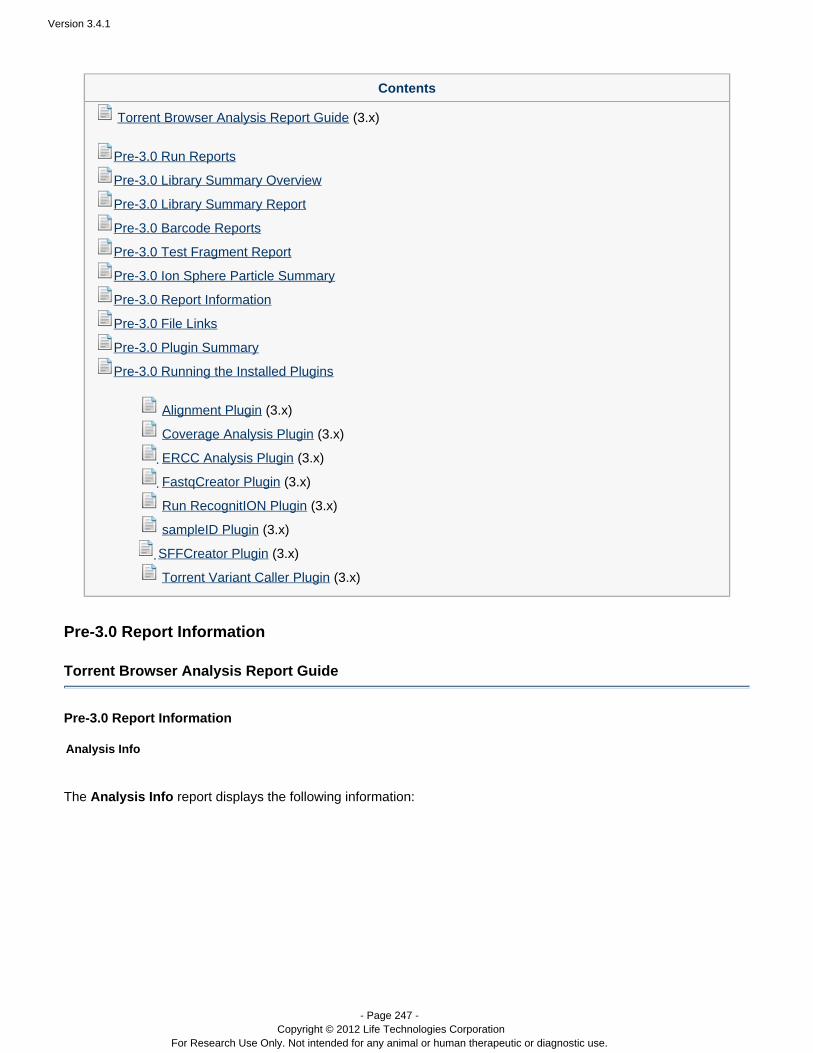
Version 3.4.1
- Page 247 - Copyright © 2012 Life Technologies Corporation
For Research Use Only. Not intended for any animal or human therapeutic or diagnostic use.
Contents
(3.x)Torrent Browser Analysis Report Guide
Pre-3.0 Run Reports
Pre-3.0 Library Summary Overview
Pre-3.0 Library Summary Report
Pre-3.0 Barcode Reports
Pre-3.0 Test Fragment Report
Pre-3.0 Ion Sphere Particle Summary
Pre-3.0 Report Information
Pre-3.0 File Links
Pre-3.0 Plugin Summary
Pre-3.0 Running the Installed Plugins
(3.x) Alignment Plugin
(3.x) Coverage Analysis Plugin
(3.x)ERCC Analysis Plugin
FastqCreator Plugin (3.x)
(3.x)Run RecognitION Plugin
(3.x)sampleID Plugin
SFFCreator Plugin (3.x)
(3.x)Torrent Variant Caller Plugin
Pre-3.0 Report Information
Torrent Browser Analysis Report Guide
Pre-3.0 Report Information
Analysis Info
The report displays the following information:Analysis Info
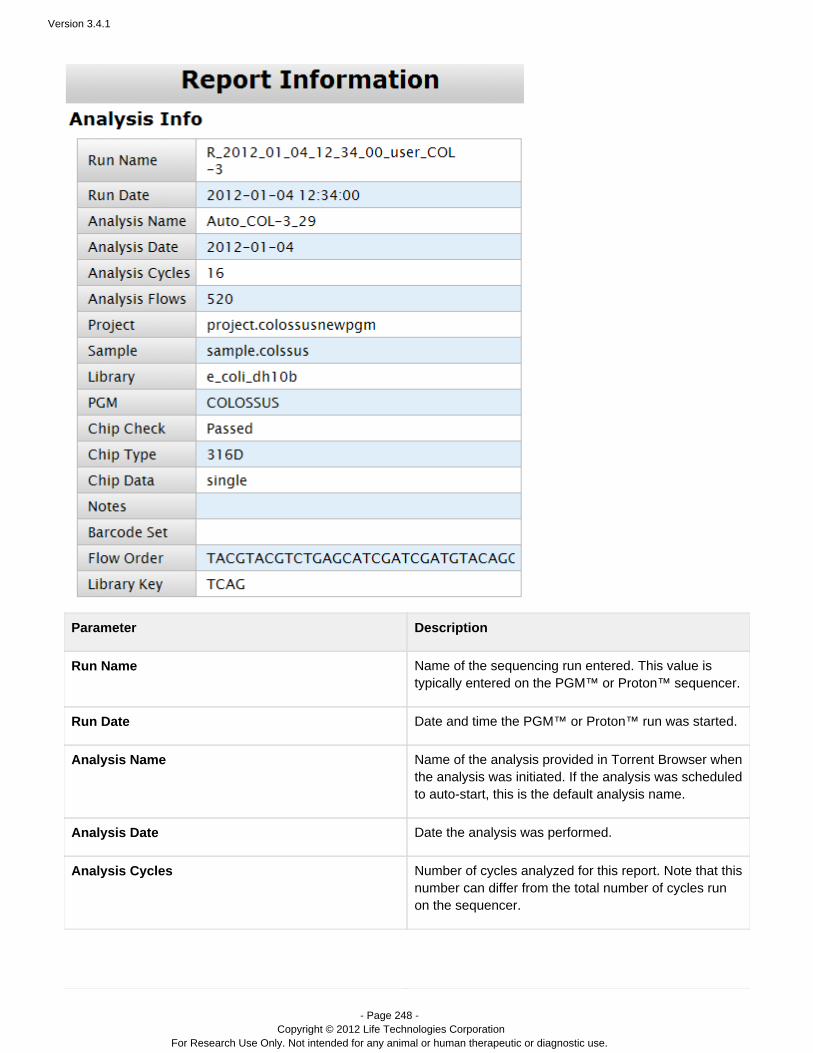
Version 3.4.1
- Page 248 - Copyright © 2012 Life Technologies Corporation
For Research Use Only. Not intended for any animal or human therapeutic or diagnostic use.
Parameter Description
Run Name Name of the sequencing run entered. This value istypically entered on the PGM™ or Proton sequencer.™
Run Date Date and time the PGM™ run was started.or Proton™
Analysis Name Name of the analysis provided in Torrent Browser whenthe analysis was initiated. If the analysis was scheduledto auto-start, this is the default analysis name.
Analysis Date Date the analysis was performed.
Analysis Cycles Number of cycles analyzed for this report. Note that thisnumber can differ from the total number of cycles runon the sequencer.
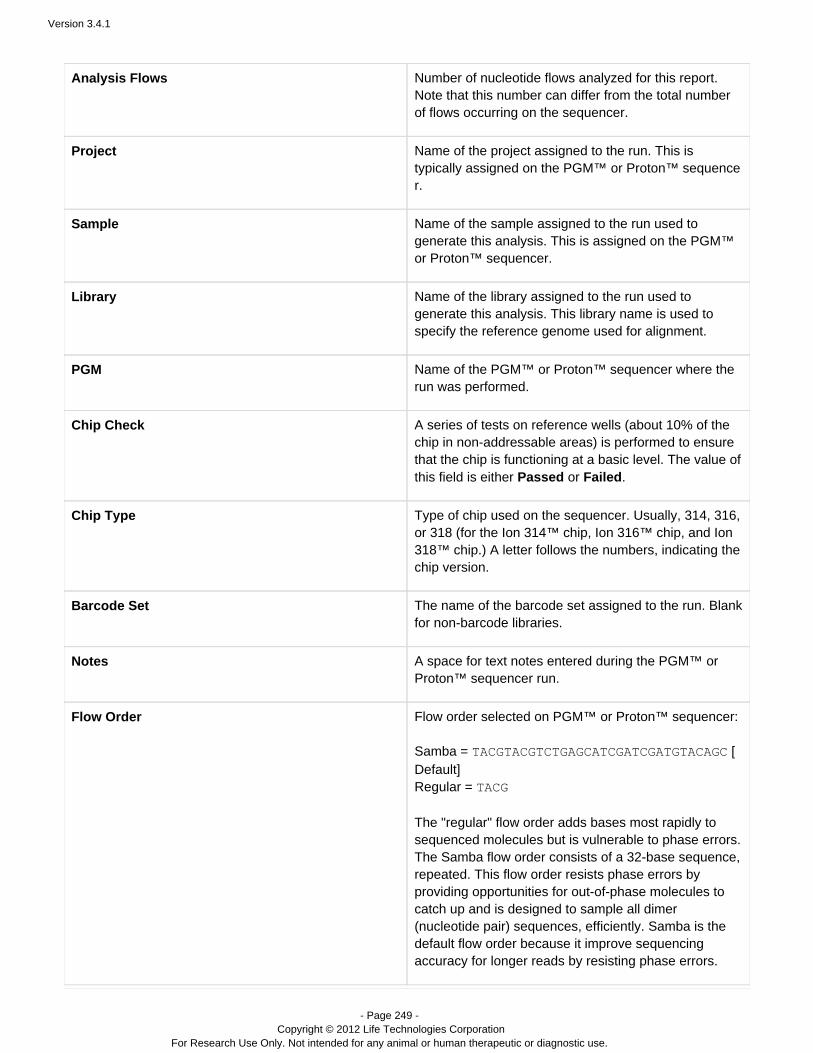
Version 3.4.1
- Page 249 - Copyright © 2012 Life Technologies Corporation
For Research Use Only. Not intended for any animal or human therapeutic or diagnostic use.
Analysis Flows Number of nucleotide flows analyzed for this report.Note that this number can differ from the total numberof flows occurring on the sequencer.
Project Name of the project assigned to the run. This istypically assigned on the PGM™ sequenceor Proton™ r.
Sample Name of the sample assigned to the run used togenerate this analysis. This is assigned on the PGM™
sequencer.or Proton™
Library Name of the library assigned to the run used togenerate this analysis. This library name is used tospecify the reference genome used for alignment.
PGM Name of the PGM™ sequencer where theor Proton™ run was performed.
Chip Check A series of tests on reference wells (about 10% of thechip in non-addressable areas) is performed to ensurethat the chip is functioning at a basic level. The value ofthis field is either or .Passed Failed
Chip Type Type of chip used on the sequencer. Usually, 314, 316,or 318 (for the Ion 314™ chip, Ion 316™ chip, and Ion318™ chip.) A letter follows the numbers, indicating thechip version.
Barcode Set The name of the barcode set assigned to the run. Blankfor non-barcode libraries.
Notes A space for text notes entered during the PGM™ orsequencer run.Proton™
Flow Order Flow order selected on PGM™ sequencer: or Proton™ Samba = [TACGTACGTCTGAGCATCGATCGATGTACAGC
Default] Regular = TACG
The "regular" flow order adds bases most rapidly tosequenced molecules but is vulnerable to phase errors.The Samba flow order consists of a 32-base sequence,repeated. This flow order resists phase errors byproviding opportunities for out-of-phase molecules tocatch up and is designed to sample all dimer(nucleotide pair) sequences, efficiently. Samba is thedefault flow order because it improve sequencingaccuracy for longer reads by resisting phase errors.
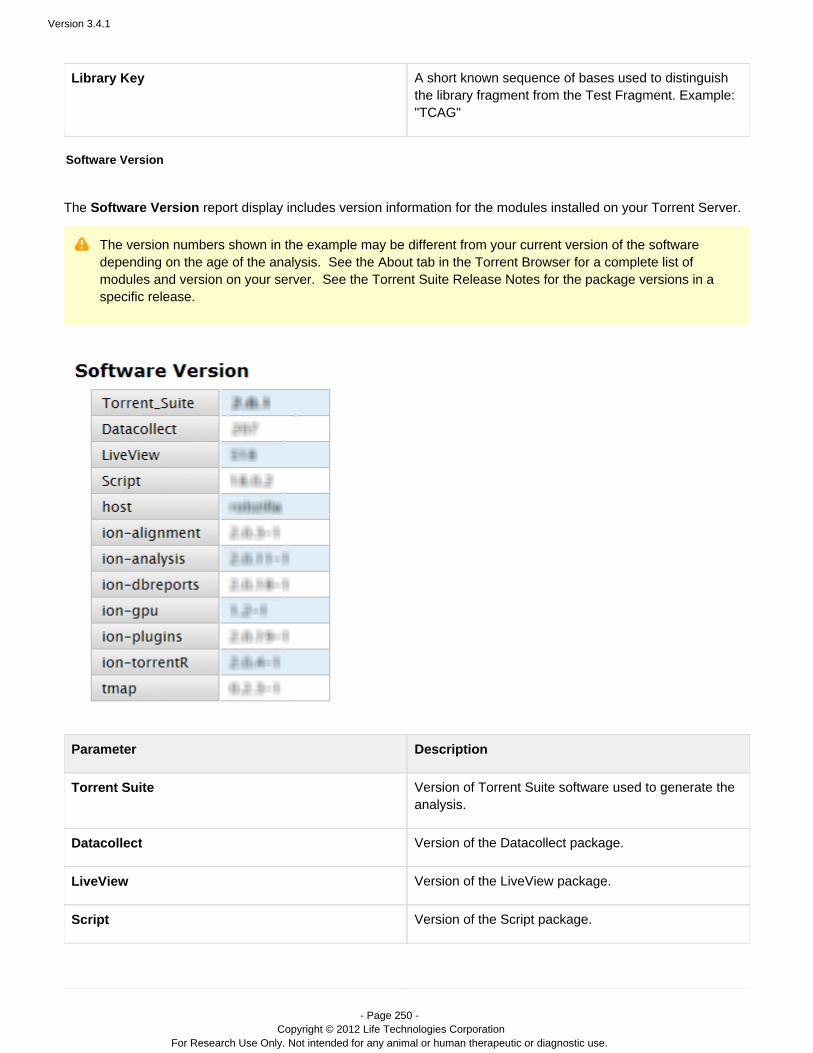
Version 3.4.1
- Page 250 - Copyright © 2012 Life Technologies Corporation
For Research Use Only. Not intended for any animal or human therapeutic or diagnostic use.
Library Key A short known sequence of bases used to distinguishthe library fragment from the Test Fragment. Example:"TCAG"
Software Version
The report display includes version information for the modules installed on your Torrent Server.Software Version
The version numbers shown in the example may be different from your current version of the softwaredepending on the age of the analysis. See the About tab in the Torrent Browser for a complete list ofmodules and version on your server. See the Torrent Suite Release Notes for the package versions in aspecific release.
Parameter Description
Torrent Suite Version of Torrent Suite software used to generate theanalysis.
Datacollect Version of the Datacollect package.
LiveView Version of the LiveView package.
Script Version of the Script package.
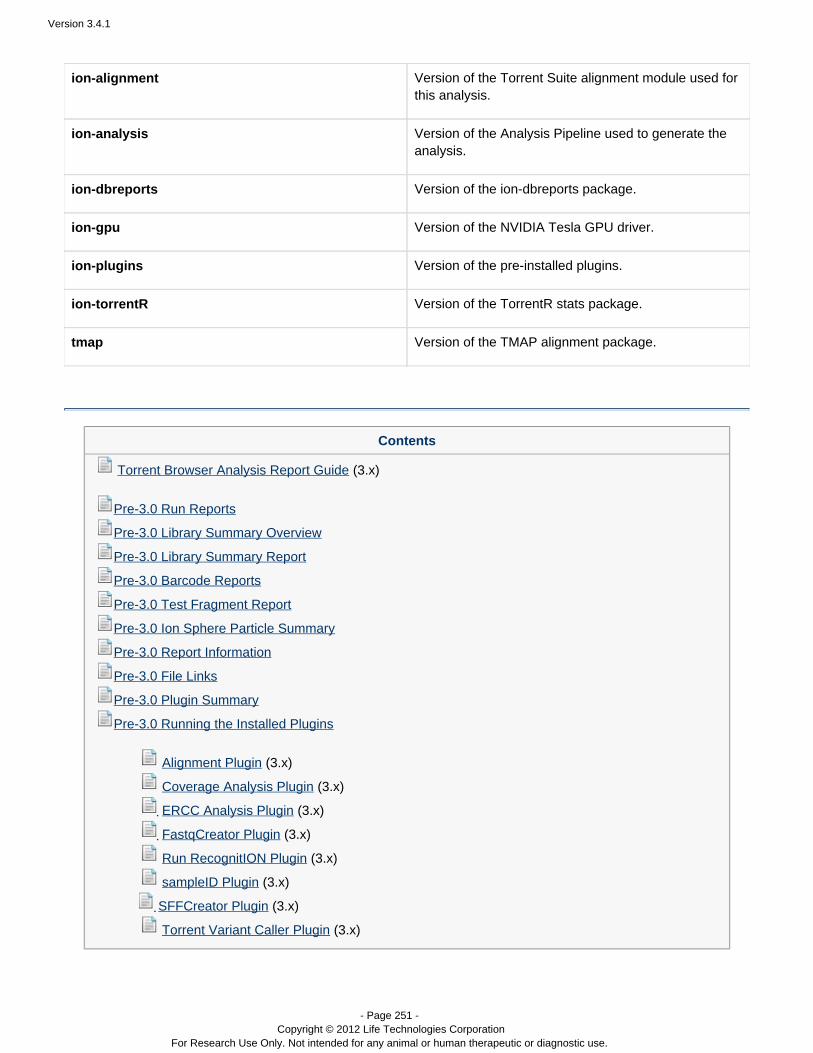
Version 3.4.1
- Page 251 - Copyright © 2012 Life Technologies Corporation
For Research Use Only. Not intended for any animal or human therapeutic or diagnostic use.
ion-alignment Version of the Torrent Suite alignment module used forthis analysis.
ion-analysis Version of the Analysis Pipeline used to generate theanalysis.
ion-dbreports Version of the ion-dbreports package.
ion-gpu Version of the NVIDIA Tesla GPU driver.
ion-plugins Version of the pre-installed plugins.
ion-torrentR Version of the TorrentR stats package.
tmap Version of the TMAP alignment package.
Contents
(3.x)Torrent Browser Analysis Report Guide
Pre-3.0 Run Reports
Pre-3.0 Library Summary Overview
Pre-3.0 Library Summary Report
Pre-3.0 Barcode Reports
Pre-3.0 Test Fragment Report
Pre-3.0 Ion Sphere Particle Summary
Pre-3.0 Report Information
Pre-3.0 File Links
Pre-3.0 Plugin Summary
Pre-3.0 Running the Installed Plugins
(3.x) Alignment Plugin
(3.x) Coverage Analysis Plugin
(3.x)ERCC Analysis Plugin
FastqCreator Plugin (3.x)
(3.x)Run RecognitION Plugin
(3.x)sampleID Plugin
SFFCreator Plugin (3.x)
(3.x)Torrent Variant Caller Plugin
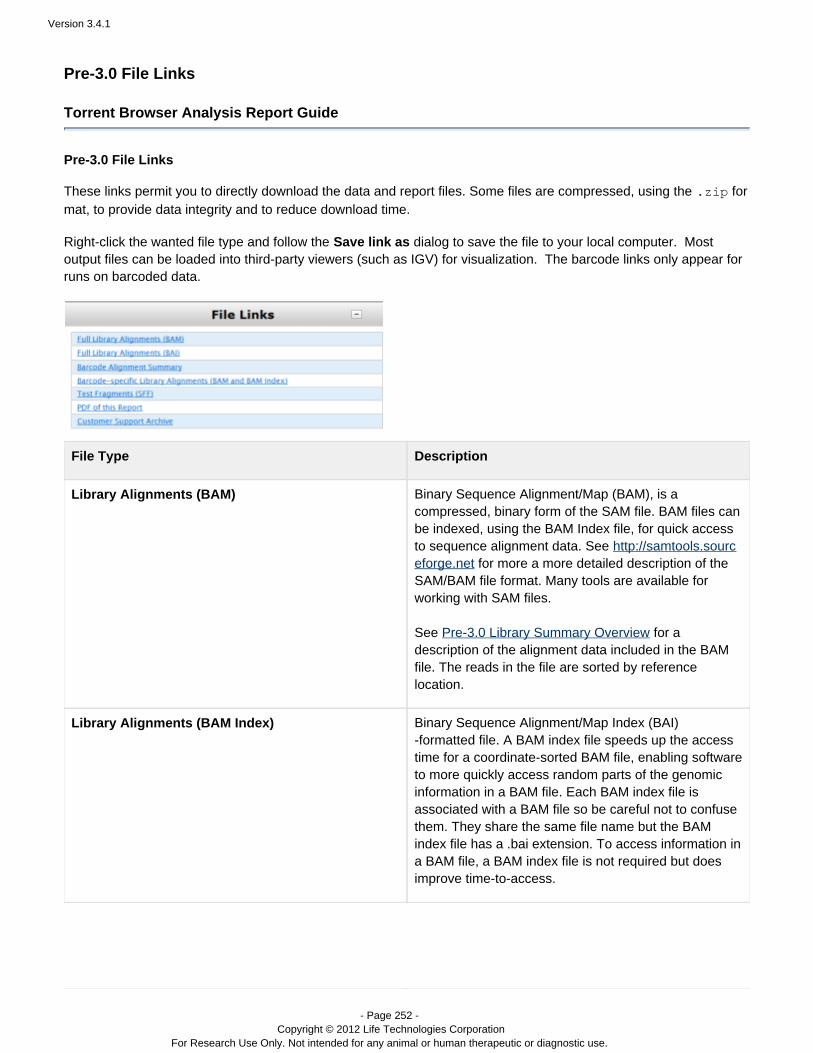
Version 3.4.1
- Page 252 - Copyright © 2012 Life Technologies Corporation
For Research Use Only. Not intended for any animal or human therapeutic or diagnostic use.
Pre-3.0 File Links
Torrent Browser Analysis Report Guide
Pre-3.0 File Links
These links permit you to directly download the data and report files. Some files are compressed, using the for.zip
mat, to provide data integrity and to reduce download time.
Right-click the wanted file type and follow the dialog to save the file to your local computer. MostSave link asoutput files can be loaded into third-party viewers (such as IGV) for visualization. The barcode links only appear forruns on barcoded data.
File Type Description
Library Alignments (BAM) Binary Sequence Alignment/Map (BAM), is acompressed, binary form of the SAM file. BAM files canbe indexed, using the BAM Index file, for quick accessto sequence alignment data. See http://samtools.sourc
for more a more detailed description of theeforge.netSAM/BAM file format. Many tools are available forworking with SAM files.
See for aPre-3.0 Library Summary Overviewdescription of the alignment data included in the BAMfile. The reads in the file are sorted by referencelocation.
Library Alignments (BAM Index) Binary Sequence Alignment/Map Index (BAI)-formatted file. A BAM index file speeds up the accesstime for a coordinate-sorted BAM file, enabling softwareto more quickly access random parts of the genomicinformation in a BAM file. Each BAM index file isassociated with a BAM file so be careful not to confusethem. They share the same file name but the BAMindex file has a .bai extension. To access information ina BAM file, a BAM index file is not required but doesimprove time-to-access.
Version 3.4.1
- Page 253 - Copyright © 2012 Life Technologies Corporation
For Research Use Only. Not intended for any animal or human therapeutic or diagnostic use.
Barcode Alignments Summary A summary file of alignment metrics for barcodes. Themetrics include the quality and read lengths at whicheach barcode aligns to reference. This link appears on barcode runs only.
Barcode-specific Library Alignments (BAM andBAM Index)
The same format and purpose as the LibraryAlignments (BAM) and Library Alignments (BAM Index)files, with content for specific barcodes. The BAM andBAM Index files for each barcode are zipped together. This link appears on barcode runs only.
PDF of this Report Complete detailed in PDF format.Analysis Report
Customer Support Archive ZIP archive containing the PDF and HTML version ofthe run report as well as useful logs in casetroubleshooting is required.
The SFF and FASTQ files formats are deprecated. See Technical Note - Transition from SFF to BAM and format SFFCreator and FastqCreator Plugins.

Version 3.4.1
- Page 254 - Copyright © 2012 Life Technologies Corporation
For Research Use Only. Not intended for any animal or human therapeutic or diagnostic use.
Contents
(3.x)Torrent Browser Analysis Report Guide
Pre-3.0 Run Reports
Pre-3.0 Library Summary Overview
Pre-3.0 Library Summary Report
Pre-3.0 Barcode Reports
Pre-3.0 Test Fragment Report
Pre-3.0 Ion Sphere Particle Summary
Pre-3.0 Report Information
Pre-3.0 File Links
Pre-3.0 Plugin Summary
Pre-3.0 Running the Installed Plugins
(3.x) Alignment Plugin
(3.x) Coverage Analysis Plugin
(3.x)ERCC Analysis Plugin
FastqCreator Plugin (3.x)
(3.x)Run RecognitION Plugin
(3.x)sampleID Plugin
SFFCreator Plugin (3.x)
(3.x)Torrent Variant Caller Plugin
Pre-3.0 Plugin Summary
Torrent Browser Analysis Report Guide
Pre-3.0 Plugin Summary
The lists the plugins associated with the analysis, and provides an interface for running andPlugin Summarymonitoring your plugin(s).
Plugins can have one of the following behaviors:
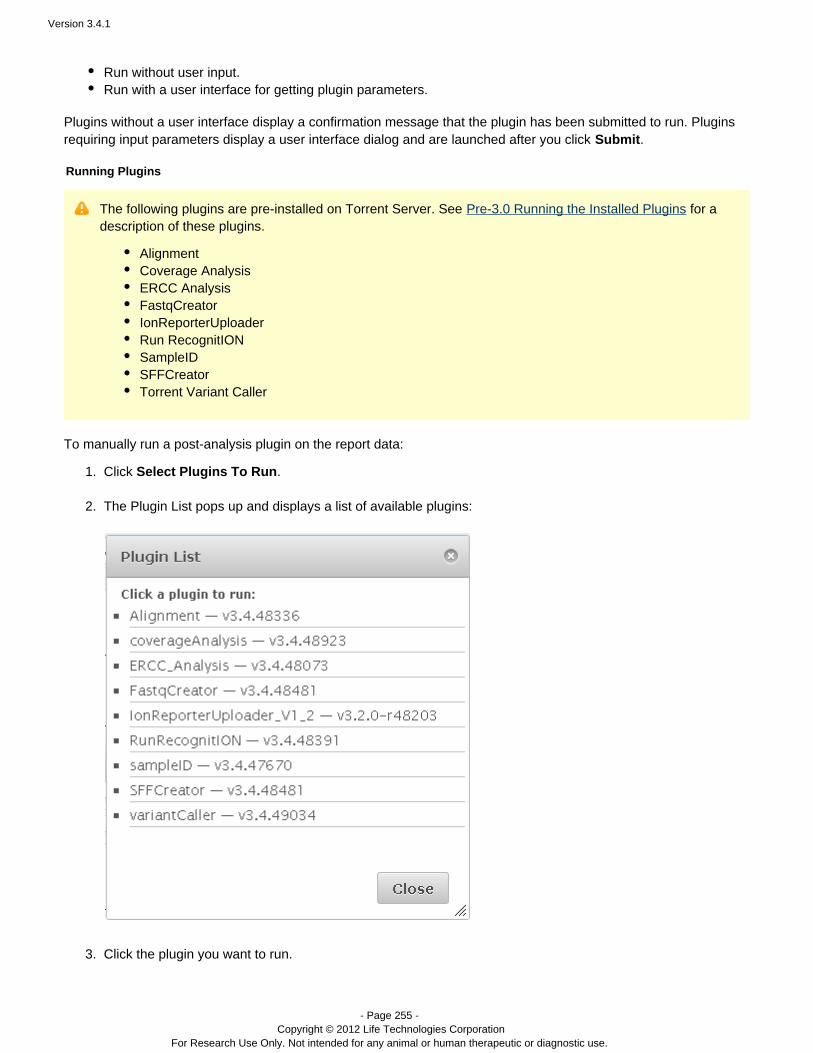
Version 3.4.1
- Page 255 - Copyright © 2012 Life Technologies Corporation
For Research Use Only. Not intended for any animal or human therapeutic or diagnostic use.
1.
2.
3.
Run without user input.Run with a user interface for getting plugin parameters.
Plugins without a user interface display a confirmation message that the plugin has been submitted to run. Pluginsrequiring input parameters display a user interface dialog and are launched after you click .Submit
Running Plugins
The following plugins are pre-installed on Torrent Server. See for aPre-3.0 Running the Installed Pluginsdescription of these plugins.
AlignmentCoverage AnalysisERCC AnalysisFastqCreatorIonReporterUploaderRun RecognitIONSampleIDSFFCreatorTorrent Variant Caller
To manually run a post-analysis plugin on the report data:
Click .Select Plugins To Run The Plugin List pops up and displays a list of available plugins:
Click the plugin you want to run.

Version 3.4.1
- Page 256 - Copyright © 2012 Life Technologies Corporation
For Research Use Only. Not intended for any animal or human therapeutic or diagnostic use.
3.
4.
5.
1.
If the plugin does not require user input, it begins execution. This displays the user interface for your plugin. In this example, the plugin is selected, displayingAlignmentthe plugin dialog (See for more information about runningAlignment Pre-3.0 Running the Installed Pluginspre-installed plugins.):
Select the desired plugin options and click . This runs your plugin, listing the run status in the Submit Plugin
panel.Summary For plugins that take a long time to run, click to update the plugin display status.Refresh Plugin StatusWhen your plugin completes, the status is updated to Started.
The Plugin Summary List
After a plugin runs, it is listed in the panel:Plugin Summary
Some plugins, such as Alignment, display a preview results window in the Plugin Summary list.
Plugin Reports
Plugin results, results summaries, links to output files, and other information are available in the plugin reportpages. See for a description of report pages for the installed plugins.Pre-3.0 Running the Installed Plugins
Click the plugin html link in the Plugin Summary section to open that plugin's report page.
Plugin Log Files
To view the plugin log file, hover your mouse pointer over the log icon to the right of your plugin to display theplugin log file:
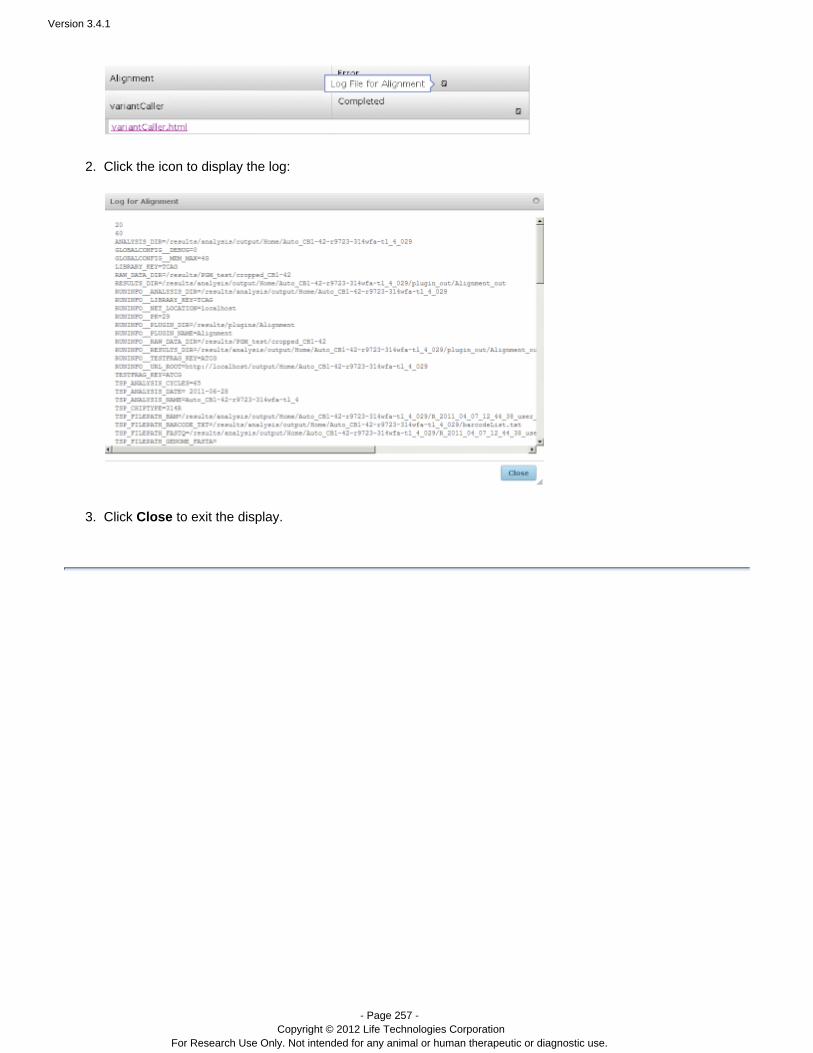
Version 3.4.1
- Page 257 - Copyright © 2012 Life Technologies Corporation
For Research Use Only. Not intended for any animal or human therapeutic or diagnostic use.
1.
2.
3.
Click the icon to display the log:
Click to exit the display.Close
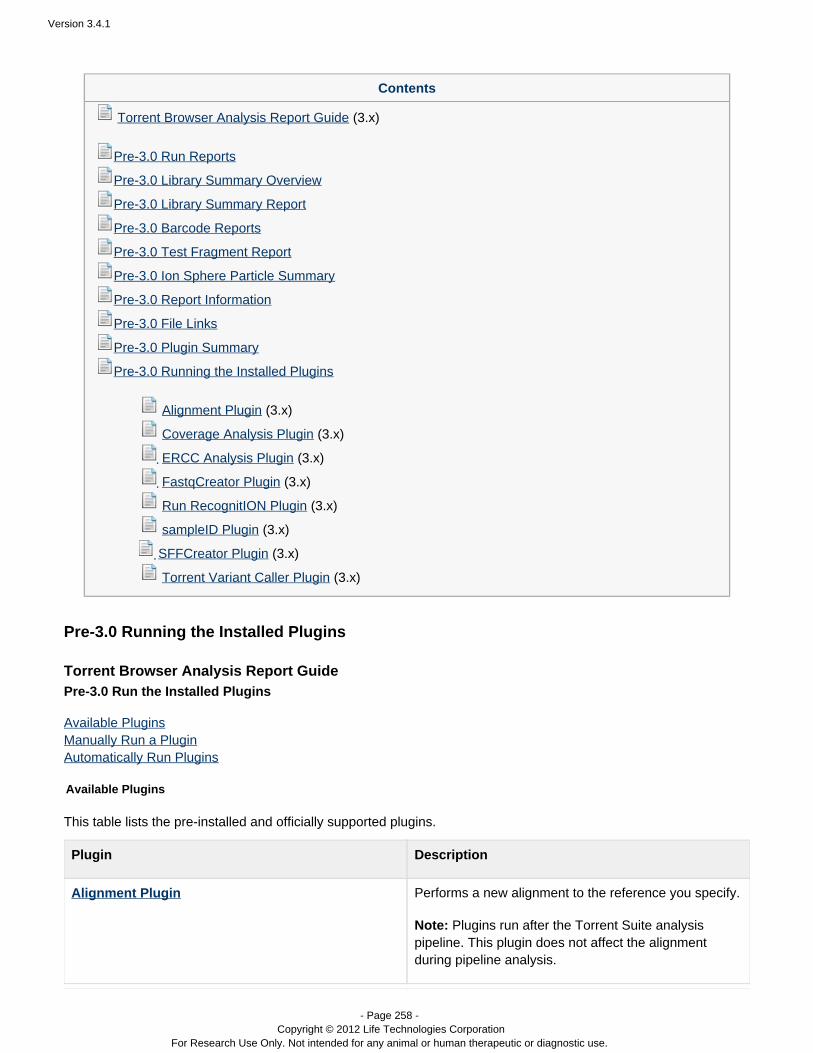
Version 3.4.1
- Page 258 - Copyright © 2012 Life Technologies Corporation
For Research Use Only. Not intended for any animal or human therapeutic or diagnostic use.
Contents
(3.x)Torrent Browser Analysis Report Guide
Pre-3.0 Run Reports
Pre-3.0 Library Summary Overview
Pre-3.0 Library Summary Report
Pre-3.0 Barcode Reports
Pre-3.0 Test Fragment Report
Pre-3.0 Ion Sphere Particle Summary
Pre-3.0 Report Information
Pre-3.0 File Links
Pre-3.0 Plugin Summary
Pre-3.0 Running the Installed Plugins
(3.x) Alignment Plugin
(3.x) Coverage Analysis Plugin
(3.x)ERCC Analysis Plugin
FastqCreator Plugin (3.x)
(3.x)Run RecognitION Plugin
(3.x)sampleID Plugin
SFFCreator Plugin (3.x)
(3.x)Torrent Variant Caller Plugin
Pre-3.0 Running the Installed Plugins
Torrent Browser Analysis Report GuidePre-3.0 Run the Installed Plugins
Available PluginsManually Run a PluginAutomatically Run Plugins
Available Plugins
This table lists the pre-installed and officially supported plugins.
Plugin Description
Alignment Plugin Performs a new alignment to the reference you specify.
Note: Plugins run after the Torrent Suite analysispipeline. This plugin does not affect the alignmentduring pipeline analysis.
Version 3.4.1
- Page 259 - Copyright © 2012 Life Technologies Corporation
For Research Use Only. Not intended for any animal or human therapeutic or diagnostic use.
Coverage Analysis Plugin Provides statistics and graphs describing the level ofsequence coverage produced for targeted genomicregions.
ERCC Analysis Plugin Helps with ERCC RNA Spike-in Controls: enables youto quickly determine whether or not the ERCC resultsindicate a problem with either the library preparation orthe sequencing instrument run.
FastqCreator Generates a Fastq format file of the analysis output.
Run RecognitION Plugin Considers candidate runs for inclusion in IonCommunity leaderboards. Within each chip type (Ion314™ chip, Ion 316™ chip, and Ion 318™ chip), topruns are ranked according the number of AQ20 basesmapped.
sampleIDPlugin Uses sample fingerprinting to identify anycross-contamination between samples or betweenbarcodes in a run.
SFFCreator Generates an SFF format file of the analysis output.
Torrent Variant Caller Plugin Calls SNP and InDel variants across a reference orwithin a targeted subset of that reference. Withlow-frequency variant options, the plugin can callvariants down to a 5% level of variant frequency. It canalso show which variants coincide with predefined“HotSpot” positions on the reference sequence.
This table lists functionality that was available as plugins in previous releases. These are now available in otherareas of the Torrent Browser.
Previous plugin Description and new location
IonReporterUploader Transfers run results files to the Ion Reporter™Software (access is available under a separatelicense).
The IonReporterUploader is now selected before a runin the > , > , and Plan Templates Plan Planned Run wiza
pages. After a run, if the results set is a member of ardproject, you invoke the IonReporterUploader fromthe project page (see ).Projects
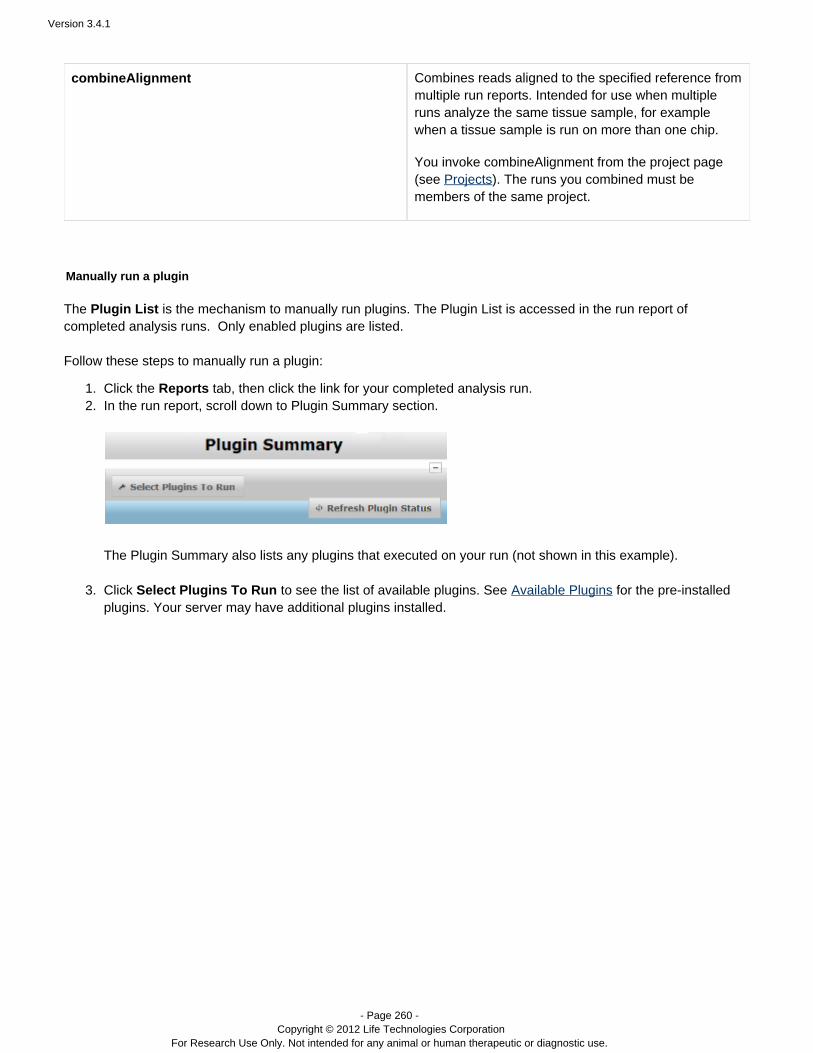
Version 3.4.1
- Page 260 - Copyright © 2012 Life Technologies Corporation
For Research Use Only. Not intended for any animal or human therapeutic or diagnostic use.
1. 2.
3.
combineAlignment Combines reads aligned to the specified reference frommultiple run reports. Intended for use when multipleruns analyze the same tissue sample, for examplewhen a tissue sample is run on more than one chip.
You invoke combineAlignment from the project page(see ). The runs you combined must beProjectsmembers of the same project.
Manually run a plugin
The is the mechanism to manually run plugins. The Plugin List is accessed in the run report ofPlugin Listcompleted analysis runs. Only enabled plugins are listed. Follow these steps to manually run a plugin:
Click the tab, then click the link for your completed analysis run.ReportsIn the run report, scroll down to Plugin Summary section.
The Plugin Summary also lists any plugins that executed on your run (not shown in this example). Click to see the list of available plugins. See for the pre-installedSelect Plugins To Run Available Pluginsplugins. Your server may have additional plugins installed.
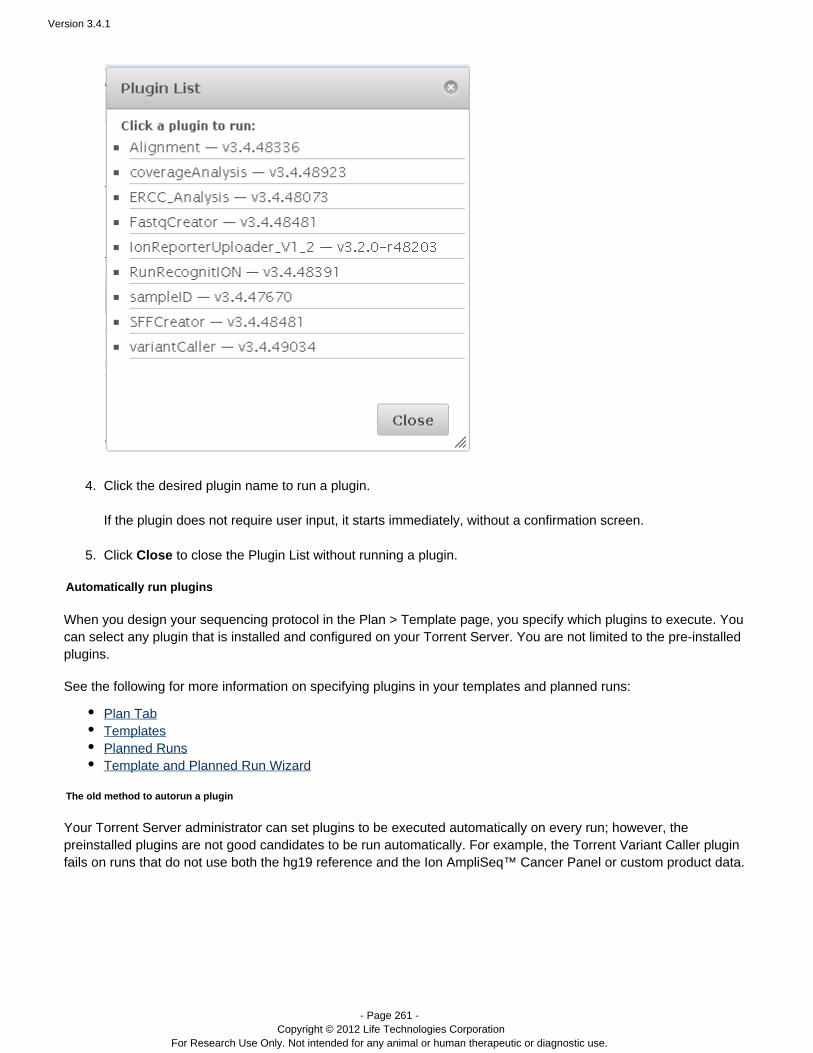
Version 3.4.1
- Page 261 - Copyright © 2012 Life Technologies Corporation
For Research Use Only. Not intended for any animal or human therapeutic or diagnostic use.
3.
4.
5.
Click the desired plugin name to run a plugin. If the plugin does not require user input, it starts immediately, without a confirmation screen. Click to close the Plugin List without running a plugin.Close
Automatically run plugins
When you design your sequencing protocol in the Plan > Template page, you specify which plugins to execute. Youcan select any plugin that is installed and configured on your Torrent Server. You are not limited to the pre-installedplugins.
See the following for more information on specifying plugins in your templates and planned runs:
Plan TabTemplatesPlanned RunsTemplate and Planned Run Wizard
The old method to autorun a plugin
Your Torrent Server administrator can set plugins to be executed automatically on every run; however, thepreinstalled plugins are not good candidates to be run automatically. For example, the Torrent Variant Caller pluginfails on runs that do not use both the hg19 reference and the Ion AmpliSeq™ Cancer Panel or custom product data.
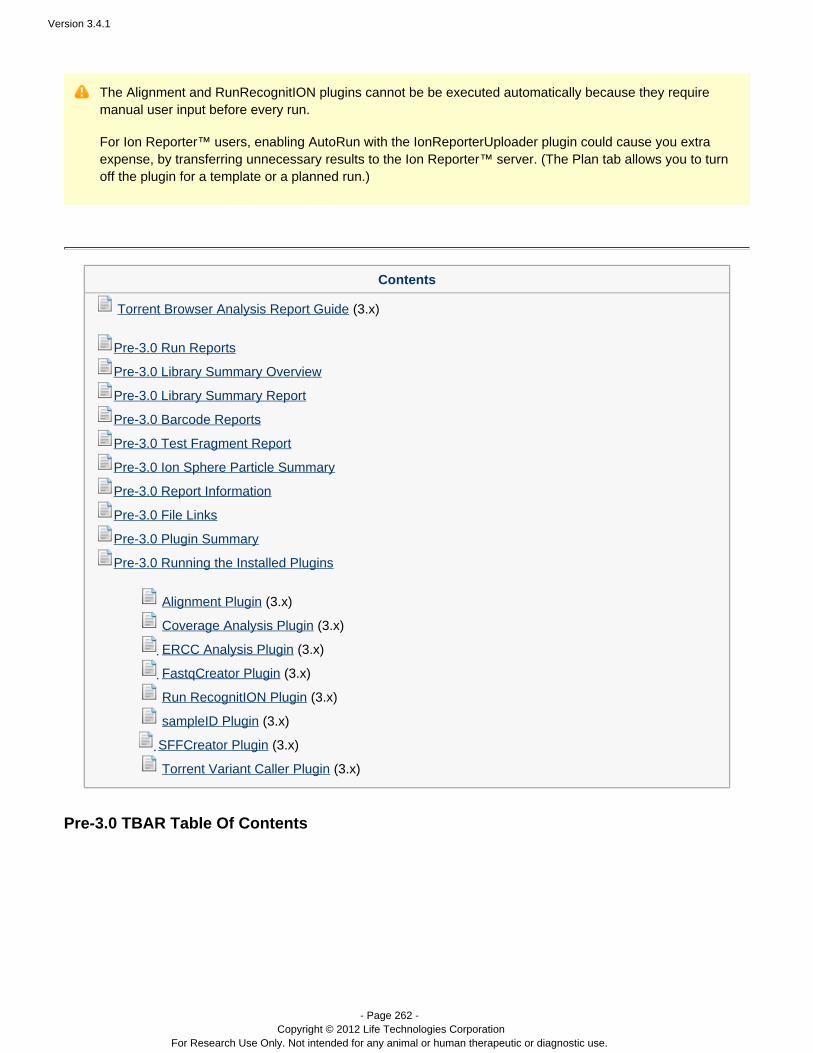
Version 3.4.1
- Page 262 - Copyright © 2012 Life Technologies Corporation
For Research Use Only. Not intended for any animal or human therapeutic or diagnostic use.
The Alignment and RunRecognitION plugins cannot be be executed automatically because they requiremanual user input before every run.
For Ion Reporter users, enabling AutoRun with the IonReporterUploader plugin could cause you extra™expense, by transferring unnecessary results to the Ion Reporter server. (The Plan tab allows you to turn™off the plugin for a template or a planned run.)
Contents
(3.x)Torrent Browser Analysis Report Guide
Pre-3.0 Run Reports
Pre-3.0 Library Summary Overview
Pre-3.0 Library Summary Report
Pre-3.0 Barcode Reports
Pre-3.0 Test Fragment Report
Pre-3.0 Ion Sphere Particle Summary
Pre-3.0 Report Information
Pre-3.0 File Links
Pre-3.0 Plugin Summary
Pre-3.0 Running the Installed Plugins
(3.x) Alignment Plugin
(3.x) Coverage Analysis Plugin
(3.x)ERCC Analysis Plugin
FastqCreator Plugin (3.x)
(3.x)Run RecognitION Plugin
(3.x)sampleID Plugin
SFFCreator Plugin (3.x)
(3.x)Torrent Variant Caller Plugin
Pre-3.0 TBAR Table Of Contents
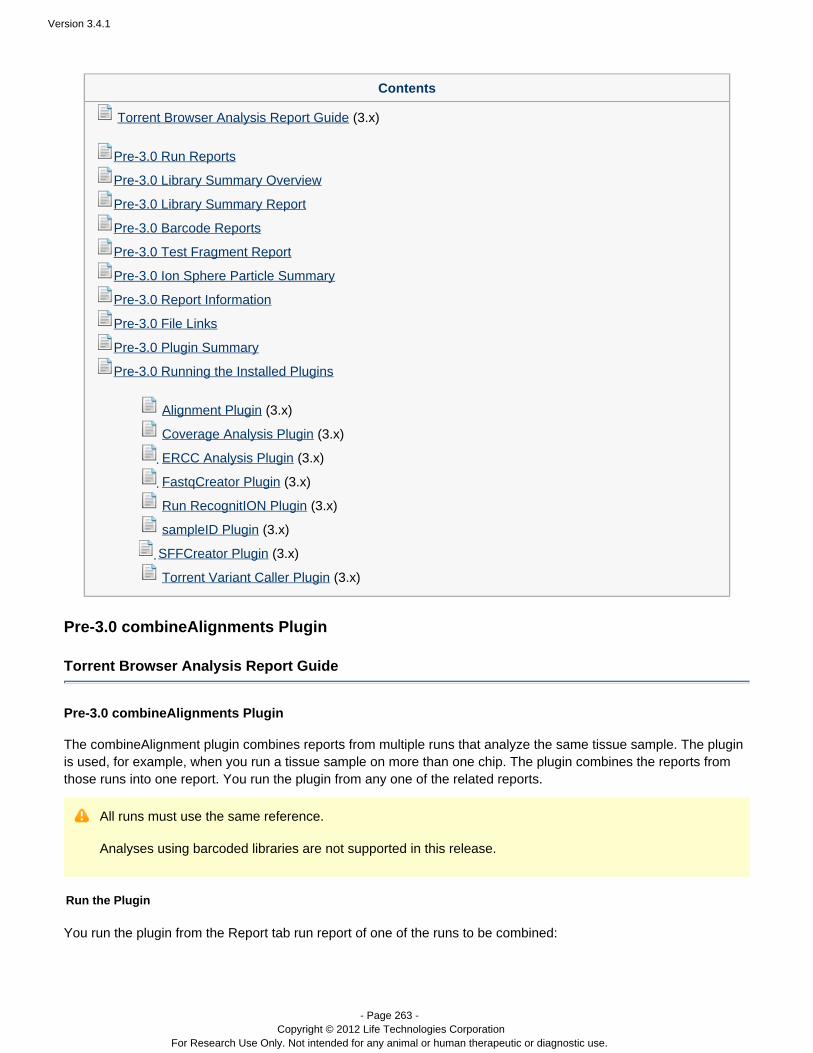
Version 3.4.1
- Page 263 - Copyright © 2012 Life Technologies Corporation
For Research Use Only. Not intended for any animal or human therapeutic or diagnostic use.
Contents
(3.x)Torrent Browser Analysis Report Guide
Pre-3.0 Run Reports
Pre-3.0 Library Summary Overview
Pre-3.0 Library Summary Report
Pre-3.0 Barcode Reports
Pre-3.0 Test Fragment Report
Pre-3.0 Ion Sphere Particle Summary
Pre-3.0 Report Information
Pre-3.0 File Links
Pre-3.0 Plugin Summary
Pre-3.0 Running the Installed Plugins
(3.x) Alignment Plugin
(3.x) Coverage Analysis Plugin
(3.x)ERCC Analysis Plugin
FastqCreator Plugin (3.x)
(3.x)Run RecognitION Plugin
(3.x)sampleID Plugin
SFFCreator Plugin (3.x)
(3.x)Torrent Variant Caller Plugin
Pre-3.0 combineAlignments Plugin
Torrent Browser Analysis Report Guide
Pre-3.0 combineAlignments Plugin
The c Alignment plugin combines reports from multiple runs that analyze the same tissue sample. The pluginombineis used, for example, when you run a tissue sample on more than one chip. The plugin combines the reports fromthose runs into one report. You run the plugin from any one of the related reports.
All runs must use the same reference.
Analyses using barcoded libraries are not supported in this release.
Run the Plugin
You run the plugin from the Report tab run report of one of the runs to be combined:
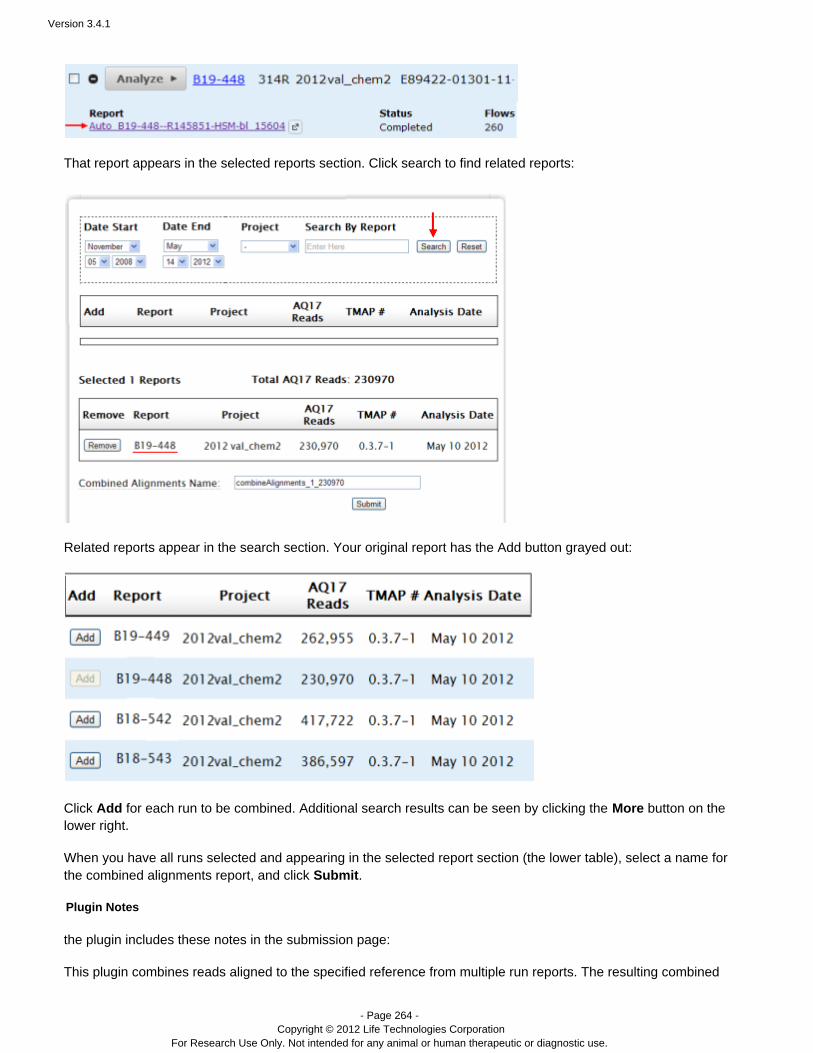
Version 3.4.1
- Page 264 - Copyright © 2012 Life Technologies Corporation
For Research Use Only. Not intended for any animal or human therapeutic or diagnostic use.
That report appears in the selected reports section. Click search to find related reports:
Related reports appear in the search section. Your original report has the Add button grayed out:
Click for each run to be combined. Additional search results can be seen by clicking the button on theAdd Morelower right.
When you have all runs selected and appearing in the selected report section (the lower table), select a name forthe combined alignments report, and click .Submit
Plugin Notes
the plugin includes these notes in the submission page:
This plugin combines reads aligned to the specified reference from multiple run reports. The resulting combined
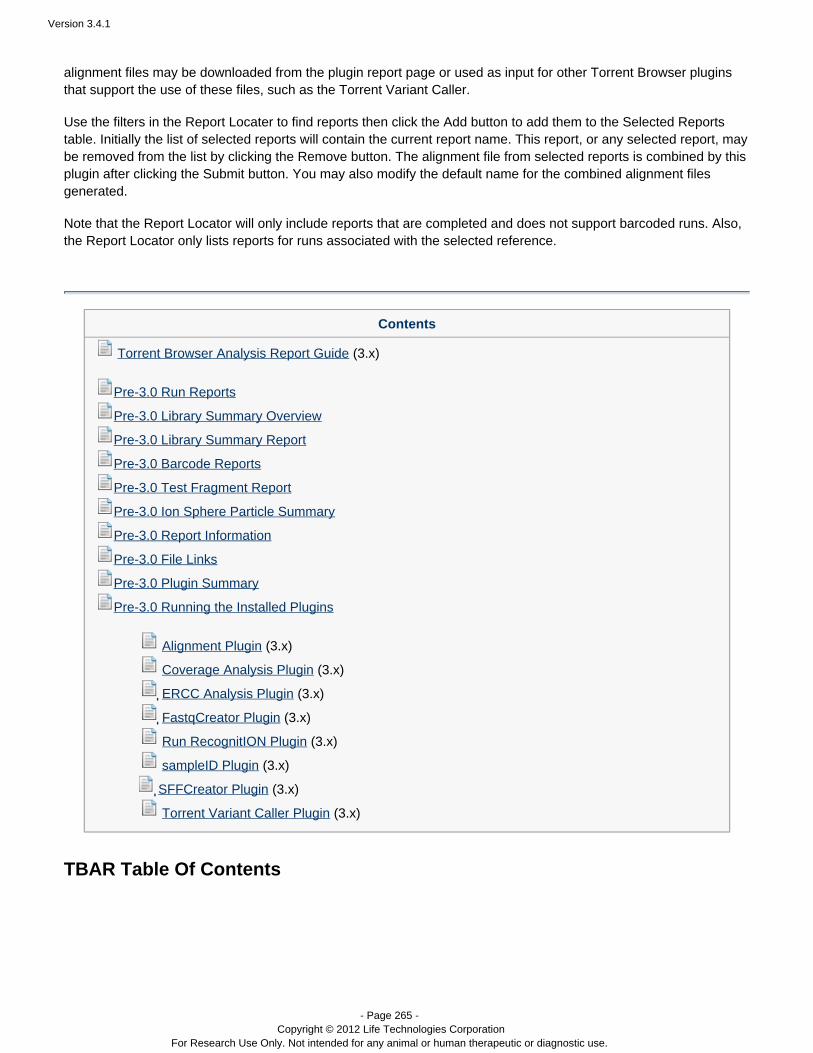
Version 3.4.1
- Page 265 - Copyright © 2012 Life Technologies Corporation
For Research Use Only. Not intended for any animal or human therapeutic or diagnostic use.
alignment files may be downloaded from the plugin report page or used as input for other Torrent Browser pluginsthat support the use of these files, such as the Torrent Variant Caller.
Use the filters in the Report Locater to find reports then click the Add button to add them to the Selected Reportstable. Initially the list of selected reports will contain the current report name. This report, or any selected report, maybe removed from the list by clicking the Remove button. The alignment file from selected reports is combined by thisplugin after clicking the Submit button. You may also modify the default name for the combined alignment filesgenerated.
Note that the Report Locator will only include reports that are completed and does not support barcoded runs. Also,the Report Locator only lists reports for runs associated with the selected reference.
Contents
(3.x)Torrent Browser Analysis Report Guide
Pre-3.0 Run Reports
Pre-3.0 Library Summary Overview
Pre-3.0 Library Summary Report
Pre-3.0 Barcode Reports
Pre-3.0 Test Fragment Report
Pre-3.0 Ion Sphere Particle Summary
Pre-3.0 Report Information
Pre-3.0 File Links
Pre-3.0 Plugin Summary
Pre-3.0 Running the Installed Plugins
(3.x) Alignment Plugin
(3.x) Coverage Analysis Plugin
(3.x)ERCC Analysis Plugin
FastqCreator Plugin (3.x)
(3.x)Run RecognitION Plugin
(3.x)sampleID Plugin
SFFCreator Plugin (3.x)
(3.x)Torrent Variant Caller Plugin
TBAR Table Of Contents
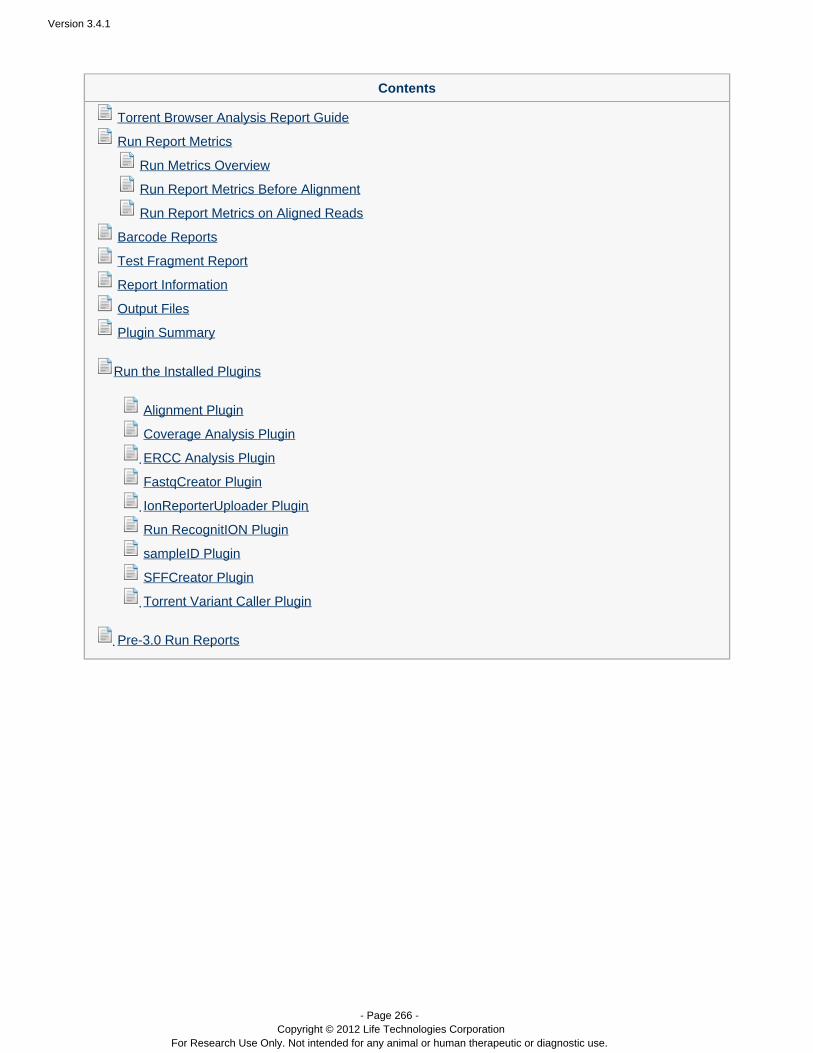
Version 3.4.1
- Page 266 - Copyright © 2012 Life Technologies Corporation
For Research Use Only. Not intended for any animal or human therapeutic or diagnostic use.
Contents
Torrent Browser Analysis Report Guide
Run Report Metrics
Run Metrics Overview
Run Report Metrics Before Alignment
Run Report Metrics on Aligned Reads
Barcode Reports
Test Fragment Report
Report Information
Output Files
Plugin Summary
Run the Installed Plugins
Alignment Plugin
Coverage Analysis Plugin
ERCC Analysis Plugin
FastqCreator Plugin
IonReporterUploader Plugin
Run RecognitION Plugin
sampleID Plugin
SFFCreator Plugin
Torrent Variant Caller Plugin
Pre-3.0 Run Reports
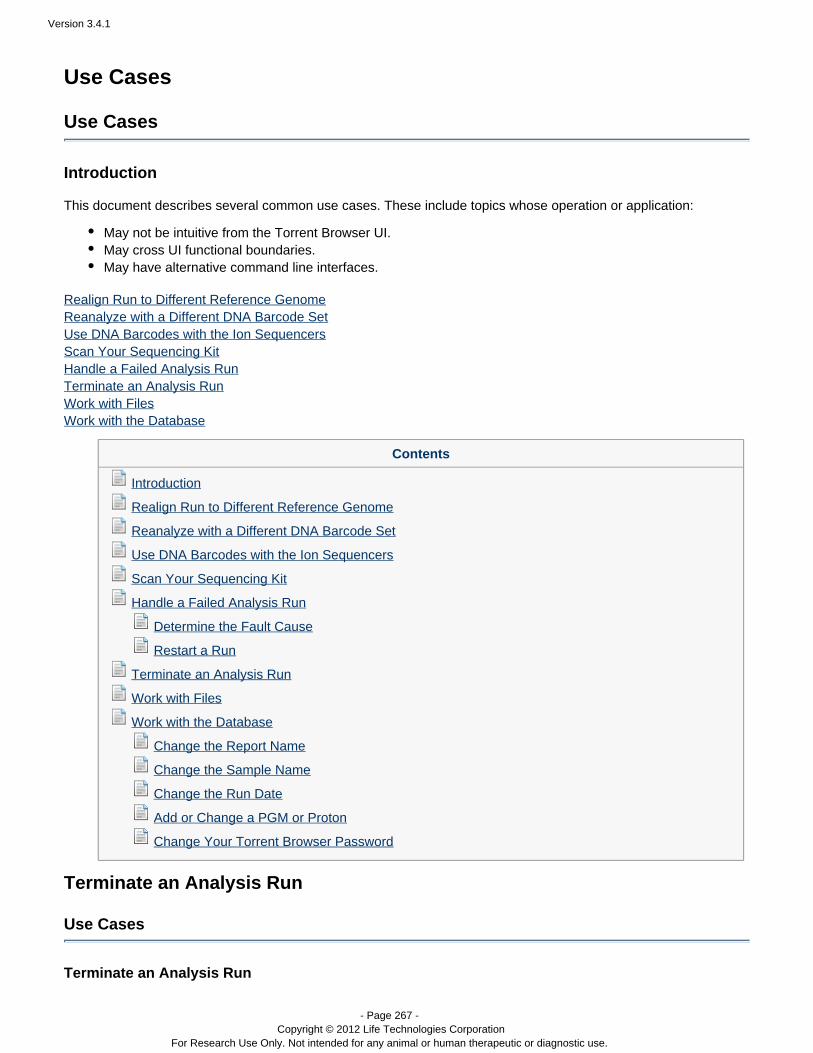
Version 3.4.1
- Page 267 - Copyright © 2012 Life Technologies Corporation
For Research Use Only. Not intended for any animal or human therapeutic or diagnostic use.
Use Cases
Use Cases
Introduction
This document describes several common use cases. These include topics whose operation or application:
May not be intuitive from the Torrent Browser UI.May cross UI functional boundaries.May have alternative command line interfaces.
Realign Run to Different Reference GenomeReanalyze with a Different DNA Barcode SetUse DNA Barcodes with the Ion SequencersScan Your Sequencing KitHandle a Failed Analysis RunTerminate an Analysis RunWork with FilesWork with the Database
Contents
Introduction
Realign Run to Different Reference Genome
Reanalyze with a Different DNA Barcode Set
Use DNA Barcodes with the Ion Sequencers
Scan Your Sequencing Kit
Handle a Failed Analysis Run
Determine the Fault Cause
Restart a Run
Terminate an Analysis Run
Work with Files
Work with the Database
Change the Report Name
Change the Sample Name
Change the Run Date
Add or Change a PGM or Proton
Change Your Torrent Browser Password
Terminate an Analysis Run
Use Cases
Terminate an Analysis Run
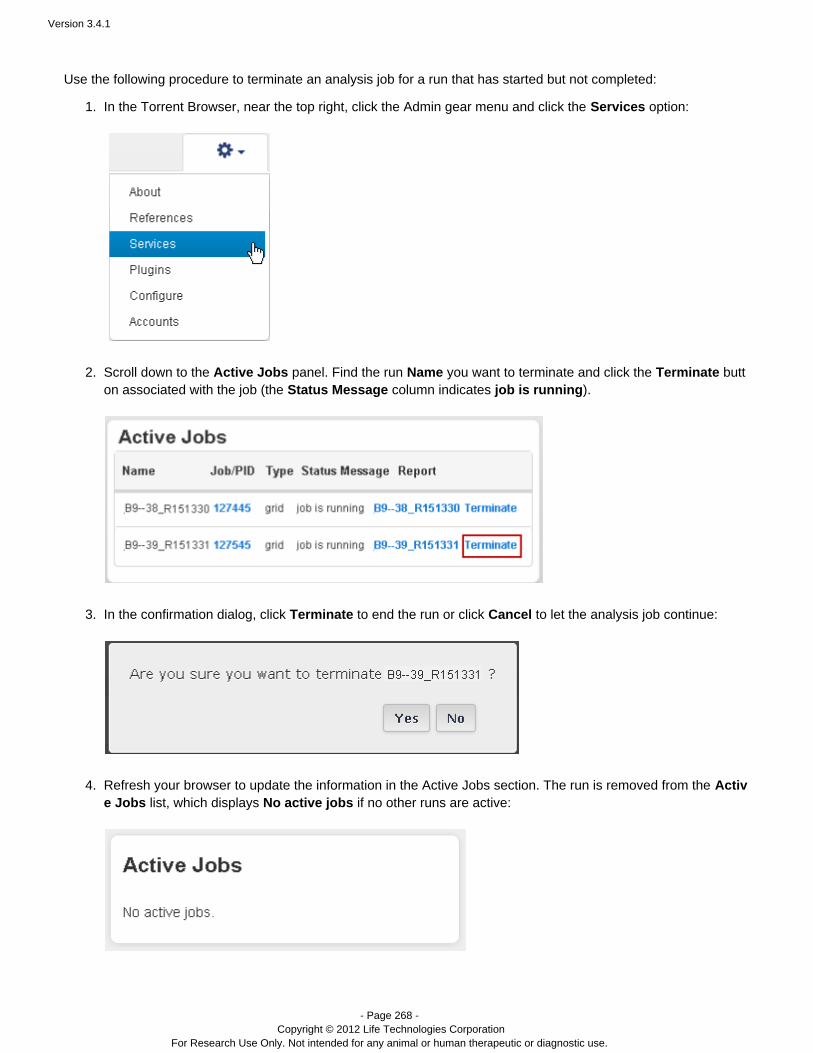
Version 3.4.1
- Page 268 - Copyright © 2012 Life Technologies Corporation
For Research Use Only. Not intended for any animal or human therapeutic or diagnostic use.
1.
2.
3.
4.
Use the following procedure to terminate an analysis job for a run that has started but not completed:
In the Torrent Browser, near the top right, click the Admin gear menu and click the option:Services
Scroll down to the panel. Find the run you want to terminate and click the buttActive Jobs Name Terminateon associated with the job (the column indicates ).Status Message job is running
In the confirmation dialog, click to end the run or click to let the analysis job continue:Terminate Cancel
Refresh your browser to update the information in the Active Jobs section. The run is removed from the Activ
list, which displays if no other runs are active:e Jobs No active jobs
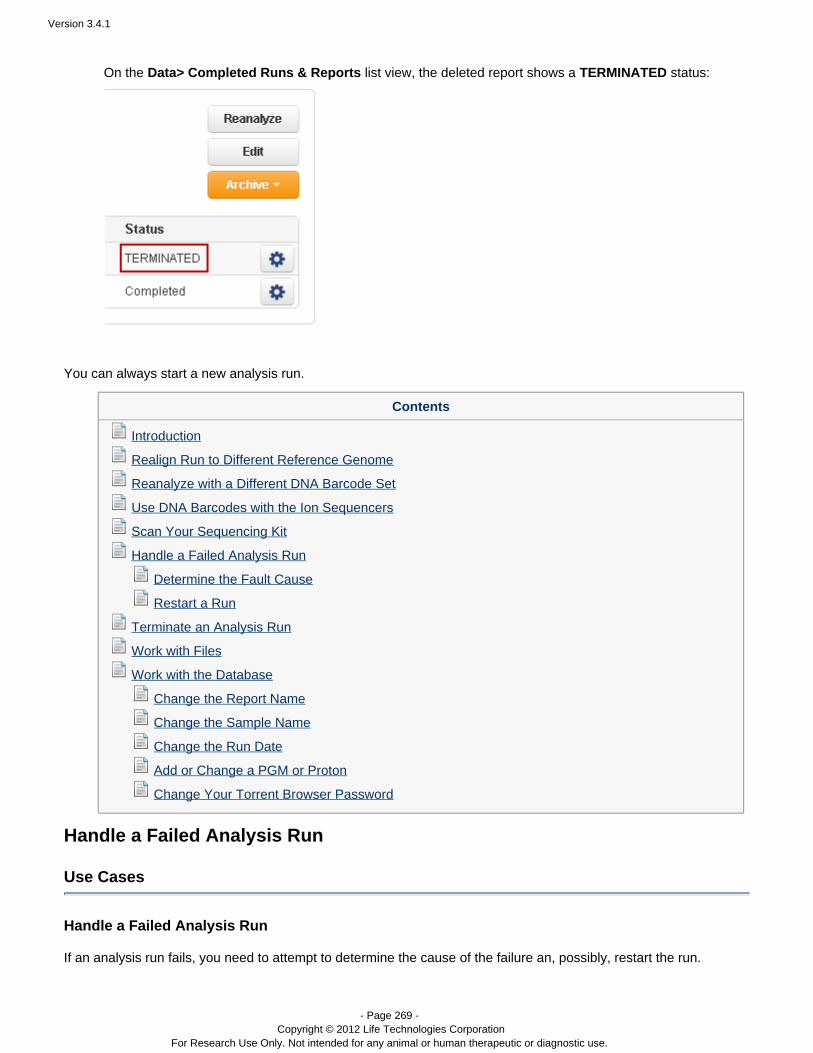
Version 3.4.1
- Page 269 - Copyright © 2012 Life Technologies Corporation
For Research Use Only. Not intended for any animal or human therapeutic or diagnostic use.
4.
On the list view, the deleted report shows a status:Data> Completed Runs & Reports TERMINATED
You can always start a new analysis run.
Contents
Introduction
Realign Run to Different Reference Genome
Reanalyze with a Different DNA Barcode Set
Use DNA Barcodes with the Ion Sequencers
Scan Your Sequencing Kit
Handle a Failed Analysis Run
Determine the Fault Cause
Restart a Run
Terminate an Analysis Run
Work with Files
Work with the Database
Change the Report Name
Change the Sample Name
Change the Run Date
Add or Change a PGM or Proton
Change Your Torrent Browser Password
Handle a Failed Analysis Run
Use Cases
Handle a Failed Analysis Run
If an analysis run fails, you need to attempt to determine the cause of the failure an, possibly, restart the run.
Version 3.4.1
- Page 270 - Copyright © 2012 Life Technologies Corporation
For Research Use Only. Not intended for any animal or human therapeutic or diagnostic use.
1.
2.
3. 4.
5.
Determine the Fault CauseRestart a Run
Contents
Introduction
Realign Run to Different Reference Genome
Reanalyze with a Different DNA Barcode Set
Use DNA Barcodes with the Ion Sequencers
Scan Your Sequencing Kit
Handle a Failed Analysis Run
Determine the Fault Cause
Restart a Run
Terminate an Analysis Run
Work with Files
Work with the Database
Change the Report Name
Change the Sample Name
Change the Run Date
Add or Change a PGM or Proton
Change Your Torrent Browser Password
Determine the Fault Cause
Use Cases
Determine the Fault Cause
If an analysis run fails, make the following checks:
Has the PGM™ or Proton sequencer completely transferred the data for the run? Go to the sequencer™Data Management screen to verify complete data transfer. You can re-transfer the data if you are not sure itwas completely transmitted.Go to the Torrent Browser tab and see that the file transfer wasData > Completed Runs & Reportscomplete. Also, check if there are any error messages, such as . User Aborted Look for a status of Error orPending.If the report was generated, check if there are any messages on the report itself.Click the link towards the bottom of the run report (above the row of buttons).Support Plugin SummaryClick or . You can send the customerView the Report Log Download the Customer Support Archivesupport archive to your Ion Torrent contact for review.If you cannot determine the cause of the fault, try restarting the run.
See for a description of the Customer Support Archive.Customer Support Archive
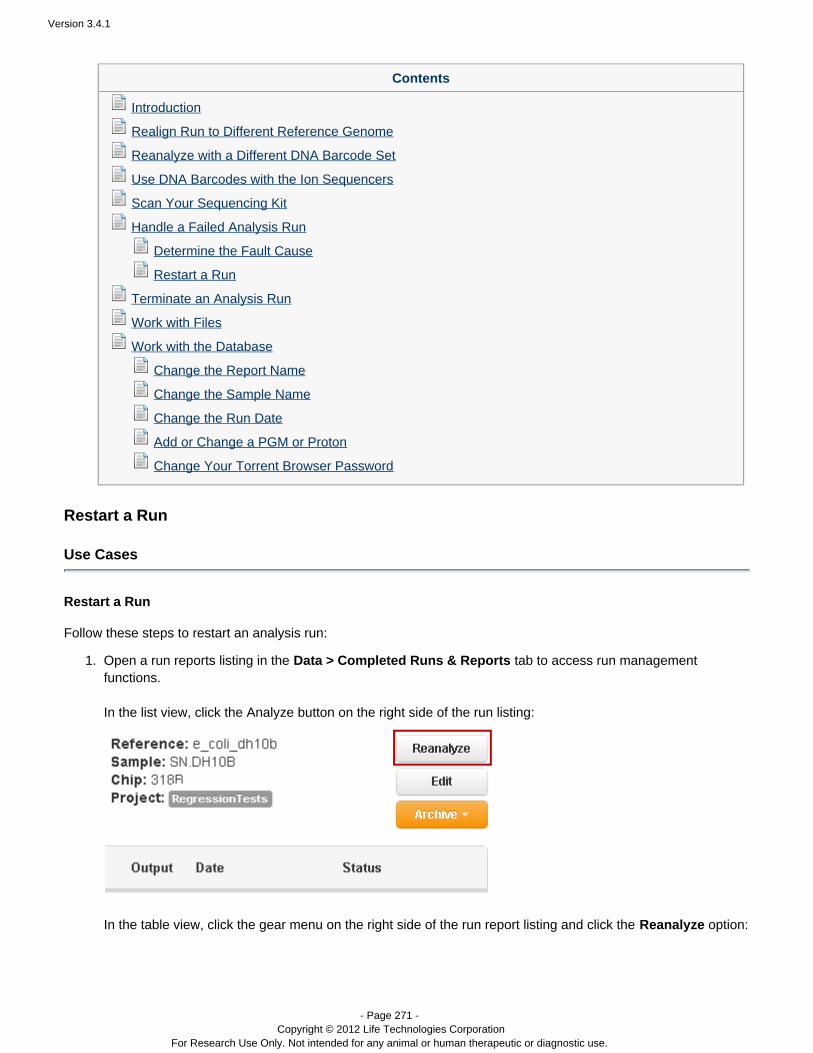
Version 3.4.1
- Page 271 - Copyright © 2012 Life Technologies Corporation
For Research Use Only. Not intended for any animal or human therapeutic or diagnostic use.
1.
Contents
Introduction
Realign Run to Different Reference Genome
Reanalyze with a Different DNA Barcode Set
Use DNA Barcodes with the Ion Sequencers
Scan Your Sequencing Kit
Handle a Failed Analysis Run
Determine the Fault Cause
Restart a Run
Terminate an Analysis Run
Work with Files
Work with the Database
Change the Report Name
Change the Sample Name
Change the Run Date
Add or Change a PGM or Proton
Change Your Torrent Browser Password
Restart a Run
Use Cases
Restart a Run
Follow these steps to restart an analysis run:
Open a run reports listing in the tab to access run managementData > Completed Runs & Reports functions.
In the list view, click the Analyze button on the right side of the run listing:
In the table view, click the gear menu on the right side of the run report listing and click the option:Reanalyze

Version 3.4.1
- Page 272 - Copyright © 2012 Life Technologies Corporation
For Research Use Only. Not intended for any animal or human therapeutic or diagnostic use.
1.
2.
3.
The Start Analysis window opens:
Do not modify the Report Name field. To rerun with the same run settings, click . To modifyStart Analysisrun settings, click the button.Advanced + Modify the advanced options, if needed. See for information on Advanced fields.Work with Completed Runs
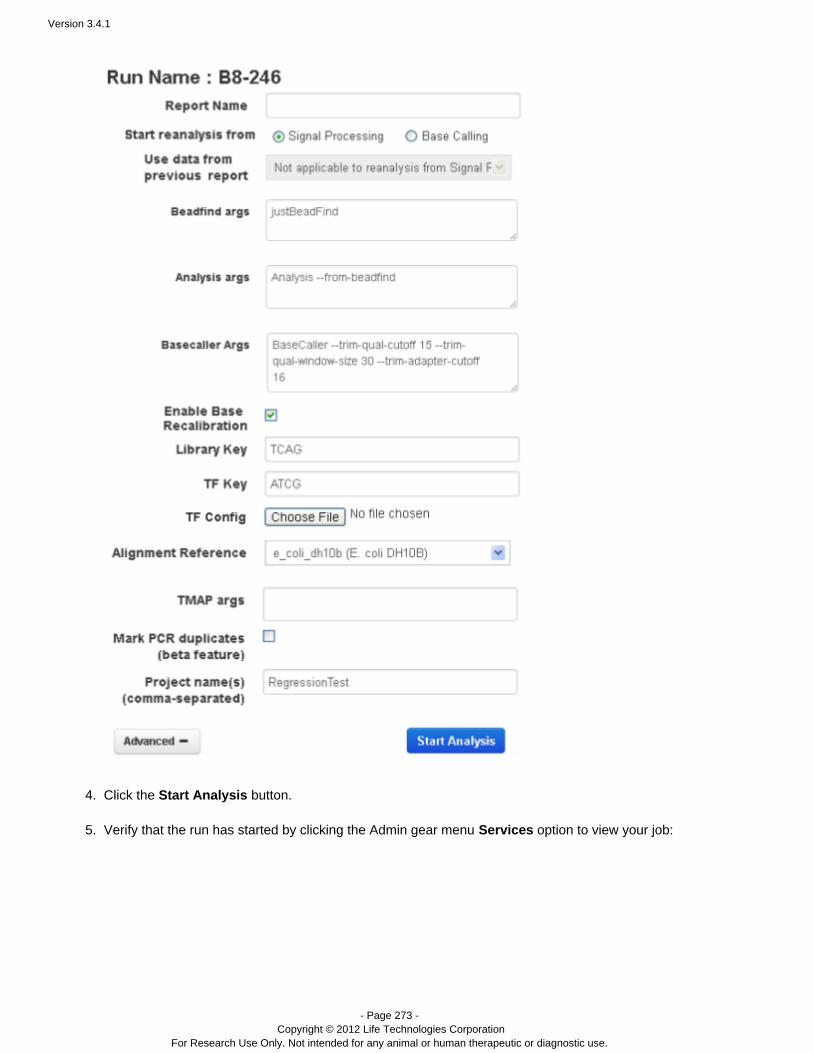
Version 3.4.1
- Page 273 - Copyright © 2012 Life Technologies Corporation
For Research Use Only. Not intended for any animal or human therapeutic or diagnostic use.
3.
4.
5.
Click the button. Start Analysis Verify that the run has started by clicking the Admin gear menu option to view your job:Services
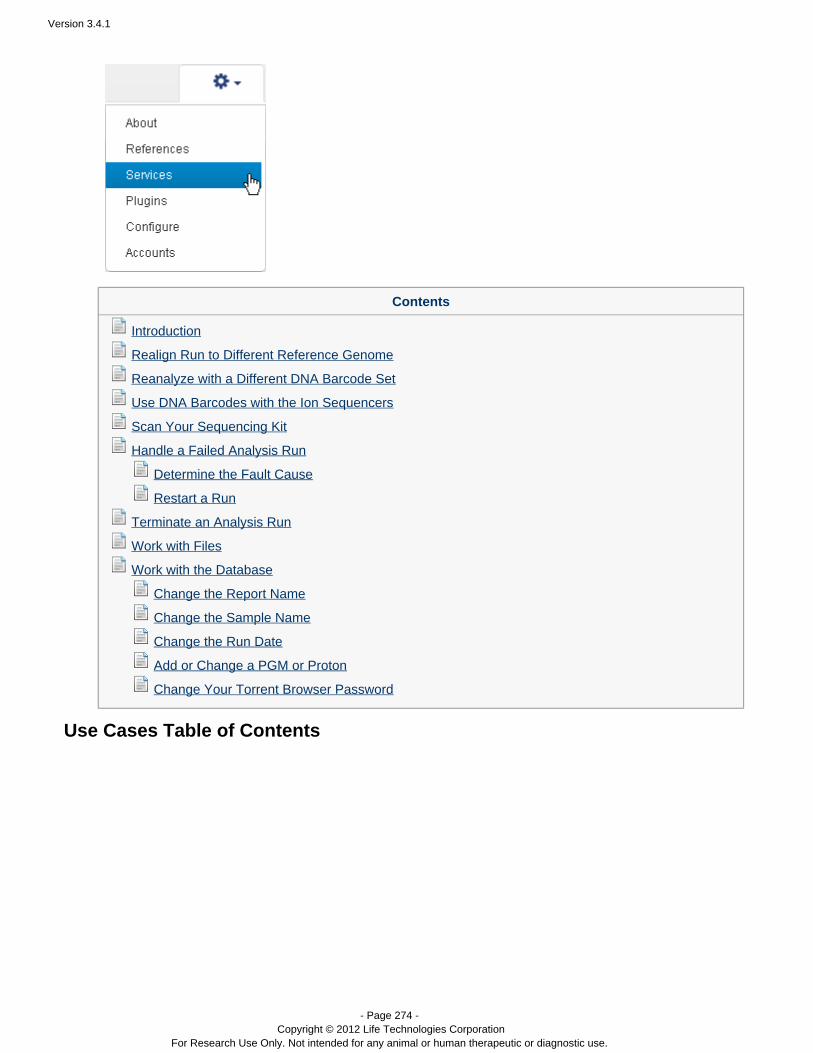
Version 3.4.1
- Page 274 - Copyright © 2012 Life Technologies Corporation
For Research Use Only. Not intended for any animal or human therapeutic or diagnostic use.
5.
Contents
Introduction
Realign Run to Different Reference Genome
Reanalyze with a Different DNA Barcode Set
Use DNA Barcodes with the Ion Sequencers
Scan Your Sequencing Kit
Handle a Failed Analysis Run
Determine the Fault Cause
Restart a Run
Terminate an Analysis Run
Work with Files
Work with the Database
Change the Report Name
Change the Sample Name
Change the Run Date
Add or Change a PGM or Proton
Change Your Torrent Browser Password
Use Cases Table of Contents
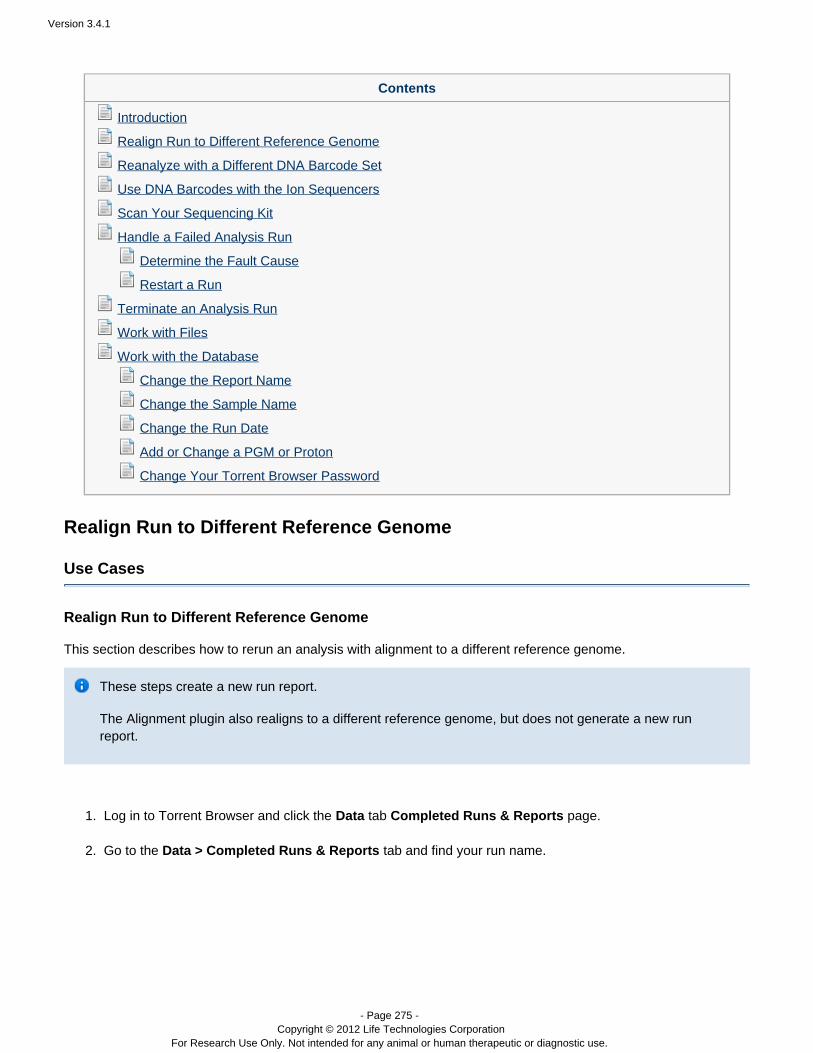
Version 3.4.1
- Page 275 - Copyright © 2012 Life Technologies Corporation
For Research Use Only. Not intended for any animal or human therapeutic or diagnostic use.
1.
2.
Contents
Introduction
Realign Run to Different Reference Genome
Reanalyze with a Different DNA Barcode Set
Use DNA Barcodes with the Ion Sequencers
Scan Your Sequencing Kit
Handle a Failed Analysis Run
Determine the Fault Cause
Restart a Run
Terminate an Analysis Run
Work with Files
Work with the Database
Change the Report Name
Change the Sample Name
Change the Run Date
Add or Change a PGM or Proton
Change Your Torrent Browser Password
Realign Run to Different Reference Genome
Use Cases
Realign Run to Different Reference Genome
This section describes how to rerun an analysis with alignment to a different reference genome.
These steps create a new run report.
The Alignment plugin also realigns to a different reference genome, but does not generate a new runreport.
Log in to Torrent Browser and click the tab page.Data Completed Runs & Reports
Go to the tab and find your run name.Data > Completed Runs & Reports
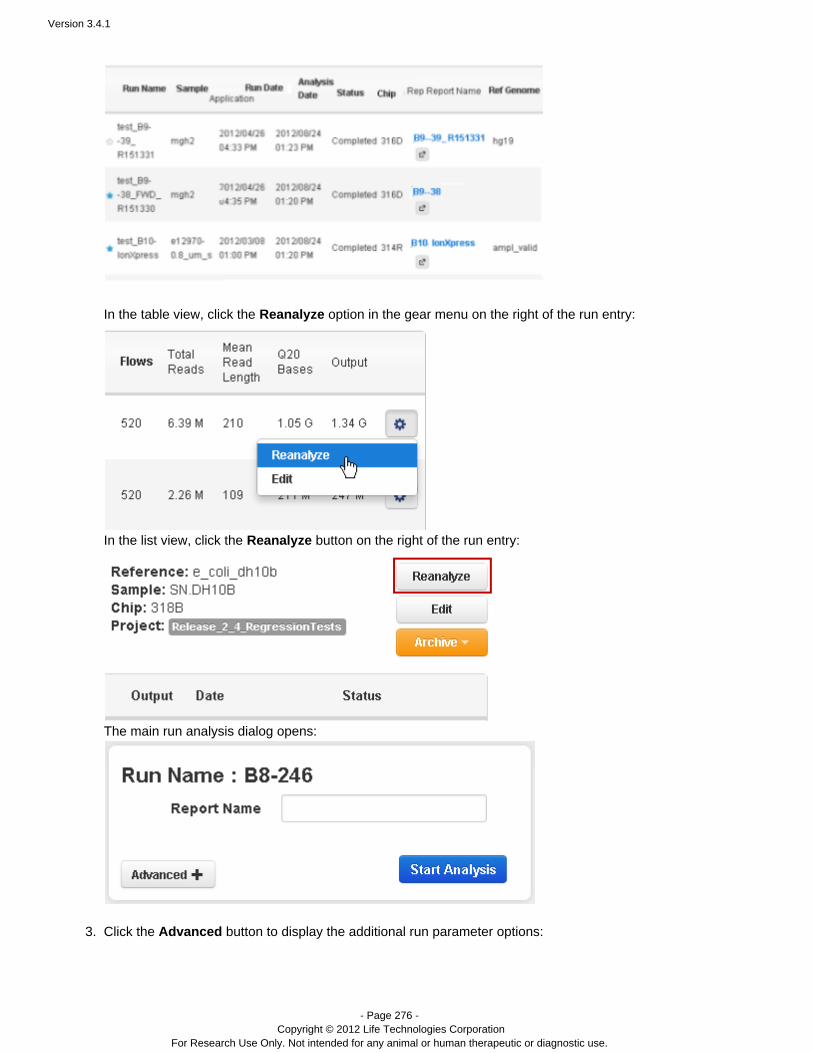
Version 3.4.1
- Page 276 - Copyright © 2012 Life Technologies Corporation
For Research Use Only. Not intended for any animal or human therapeutic or diagnostic use.
2.
3.
In the table view, click the option in the gear menu on the right of the run entry:Reanalyze
In the list view, click the button on the right of the run entry:Reanalyze
The main run analysis dialog opens:
Click the button to display the additional run parameter options:Advanced
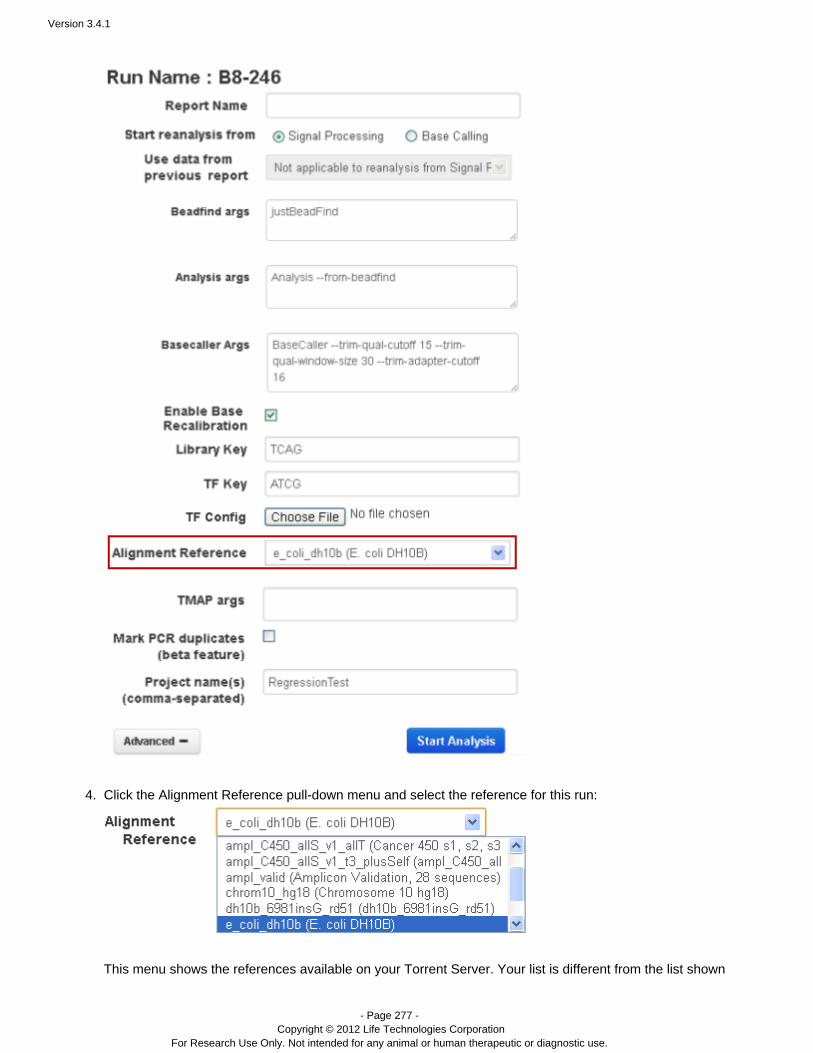
Version 3.4.1
- Page 277 - Copyright © 2012 Life Technologies Corporation
For Research Use Only. Not intended for any animal or human therapeutic or diagnostic use.
3.
4. Click the Alignment Reference pull-down menu and select the reference for this run:
This menu shows the references available on your Torrent Server. Your list is different from the list shown
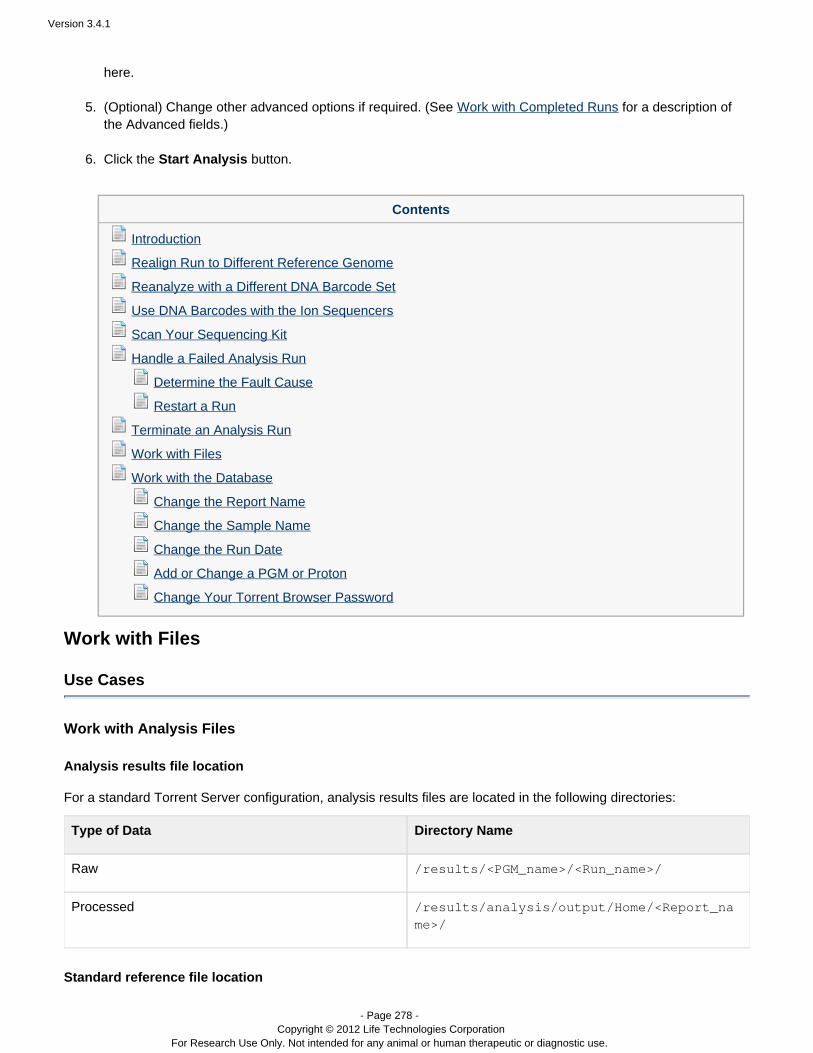
Version 3.4.1
- Page 278 - Copyright © 2012 Life Technologies Corporation
For Research Use Only. Not intended for any animal or human therapeutic or diagnostic use.
4.
5.
6.
here.
( ) Change other advanced options if required. (See for a description ofOptional Work with Completed Runsthe Advanced fields.)
Click the button.Start Analysis
Contents
Introduction
Realign Run to Different Reference Genome
Reanalyze with a Different DNA Barcode Set
Use DNA Barcodes with the Ion Sequencers
Scan Your Sequencing Kit
Handle a Failed Analysis Run
Determine the Fault Cause
Restart a Run
Terminate an Analysis Run
Work with Files
Work with the Database
Change the Report Name
Change the Sample Name
Change the Run Date
Add or Change a PGM or Proton
Change Your Torrent Browser Password
Work with Files
Use Cases
Work with Analysis Files
Analysis results file location
For a standard Torrent Server configuration, analysis results files are located in the following directories:
Type of Data Directory Name
Raw /results/<PGM_name>/<Run_name>/
Processed /results/analysis/output/Home/<Report_name>/
Standard reference file location
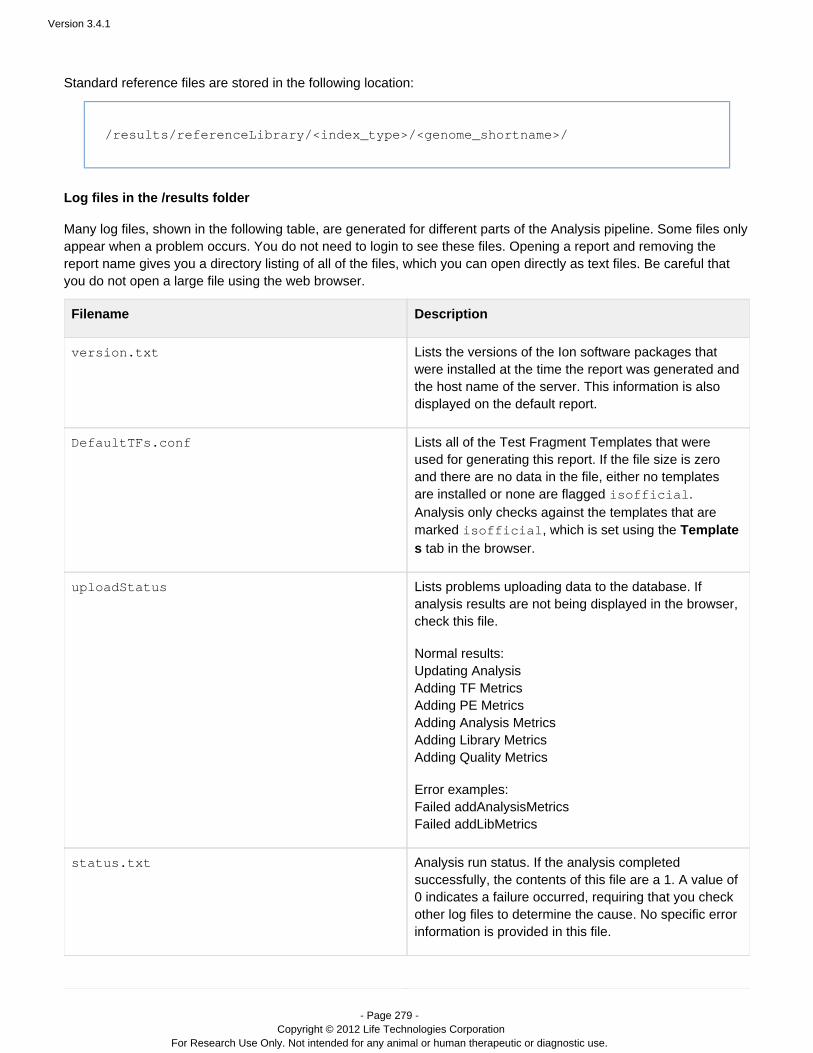
Version 3.4.1
- Page 279 - Copyright © 2012 Life Technologies Corporation
For Research Use Only. Not intended for any animal or human therapeutic or diagnostic use.
Standard reference files are stored in the following location:
/results/referenceLibrary/<index_type>/<genome_shortname>/
Log files in the /results folder
Many log files, shown in the following table, are generated for different parts of the Analysis pipeline. Some files onlyappear when a problem occurs. You do not need to login to see these files. Opening a report and removing thereport name gives you a directory listing of all of the files, which you can open directly as text files. Be careful thatyou do not open a large file using the web browser.
Filename Description
version.txt Lists the versions of the Ion software packages thatwere installed at the time the report was generated andthe host name of the server. This information is alsodisplayed on the default report.
DefaultTFs.conf Lists all of the Test Fragment Templates that wereused for generating this report. If the file size is zeroand there are no data in the file, either no templatesare installed or none are flagged .isofficial
Analysis only checks against the templates that aremarked , which is set using the isofficial Template
tab in the browser.s
uploadStatus Lists problems uploading data to the database. Ifanalysis results are not being displayed in the browser,check this file.
Normal results:Updating AnalysisAdding TF MetricsAdding PE MetricsAdding Analysis MetricsAdding Library MetricsAdding Quality Metrics
Error examples:Failed addAnalysisMetricsFailed addLibMetrics
status.txt Analysis run status. If the analysis completedsuccessfully, the contents of this file are a 1. A value of0 indicates a failure occurred, requiring that you checkother log files to determine the cause. No specific errorinformation is provided in this file.

Version 3.4.1
- Page 280 - Copyright © 2012 Life Technologies Corporation
For Research Use Only. Not intended for any animal or human therapeutic or diagnostic use.
processParameters.txt Run events and duration. The command-line passed tothe Analysis program is also included, which is useful ifyou want to re-run the same analysis. These files are insubdirectories named *.sigproc_results/block_
sigproc_results/sigproc.log
basecaller_results/basecaller.log
alignment.log
Analysis pipeline log files. Always check for errors inthese files, especially the first and the last pages.
The contents of these log files (without HTML are available in the Torrent Browser with theformatting)
run report Support tab link:View the report log
drmaa_stdout.txt Post-analysis events.
drmaa_stderr.txt Error messages related to processes called after theprimary analysis. This has a value of zero if theanalysis completed successfully.
analyzeReads_err.txt Useful troubleshooting information generated duringthe alignment process. This file is only created whenthere is a problem.
core A memory dump listing, usually caused by a criticalfault. You should see a related or exception core du
message in an analysis pipeline log file.mp
alignmentQC_out.txt Errors related to TMAP. If the file is not present, it islikely that TMAP was not called. These files are insubdirectories named basecaller_results/block_*.
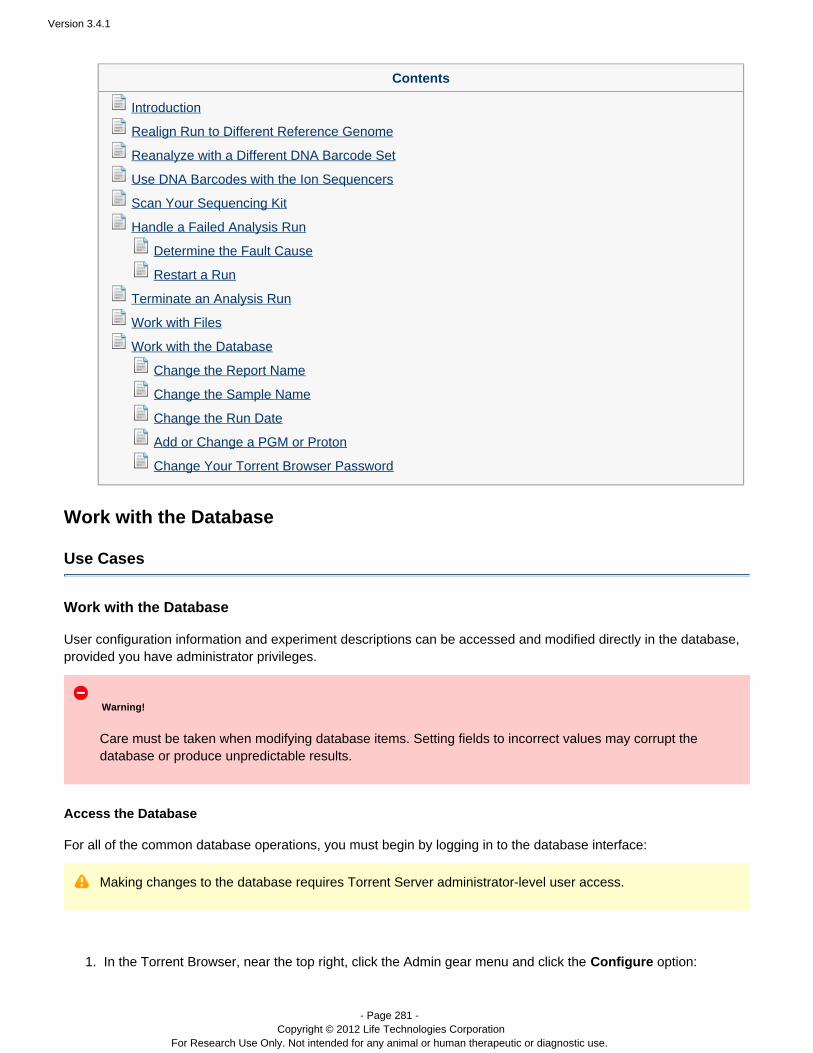
Version 3.4.1
- Page 281 - Copyright © 2012 Life Technologies Corporation
For Research Use Only. Not intended for any animal or human therapeutic or diagnostic use.
1.
Contents
Introduction
Realign Run to Different Reference Genome
Reanalyze with a Different DNA Barcode Set
Use DNA Barcodes with the Ion Sequencers
Scan Your Sequencing Kit
Handle a Failed Analysis Run
Determine the Fault Cause
Restart a Run
Terminate an Analysis Run
Work with Files
Work with the Database
Change the Report Name
Change the Sample Name
Change the Run Date
Add or Change a PGM or Proton
Change Your Torrent Browser Password
Work with the Database
Use Cases
Work with the Database
User configuration information and experiment descriptions can be accessed and modified directly in the database,provided you have administrator privileges.
Warning!
Care must be taken when modifying database items. Setting fields to incorrect values may corrupt thedatabase or produce unpredictable results.
Access the Database
For all of the common database operations, you must begin by logging in to the database interface:
Making changes to the database requires Torrent Server administrator-level user access.
In the Torrent Browser, near the top right, click the Admin gear menu and click the option:Configure
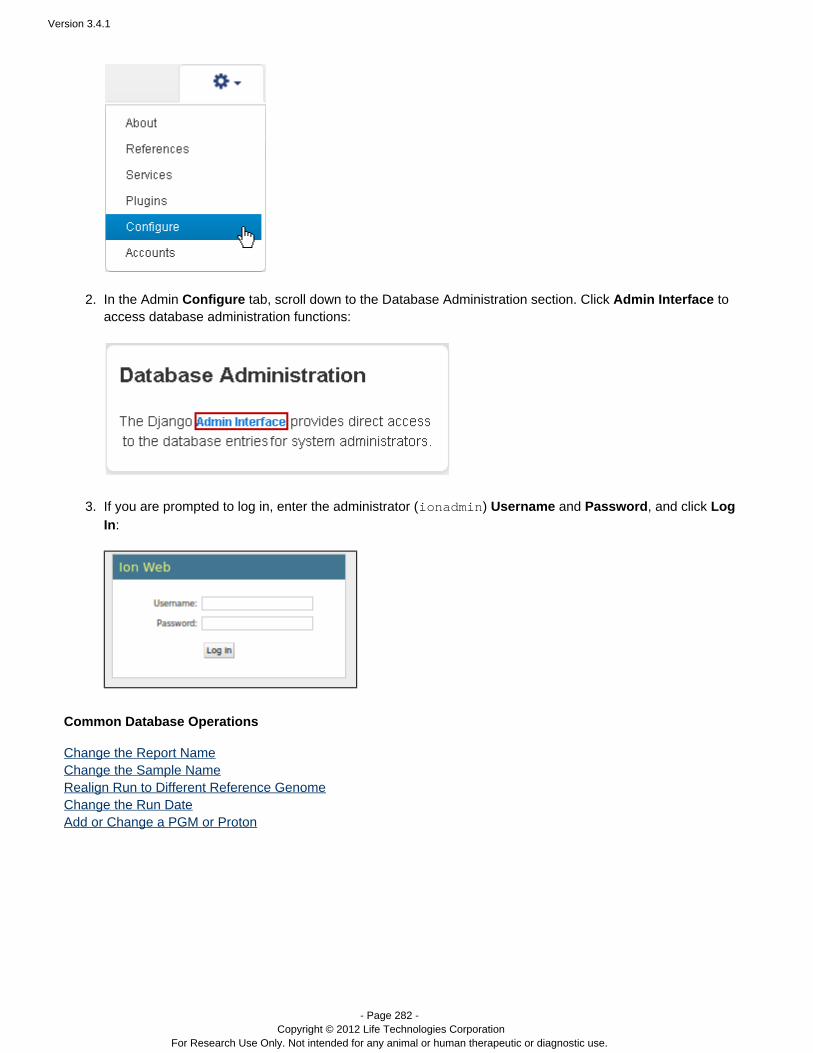
Version 3.4.1
- Page 282 - Copyright © 2012 Life Technologies Corporation
For Research Use Only. Not intended for any animal or human therapeutic or diagnostic use.
1.
2.
3.
In the Admin tab, scroll down to the D lick to Configure atabase Administration section. C Admin Interfaceaccess database administration functions:
If you are prompted to log in, enter the administrator ( ) and , and click ionadmin Username Password Log:In
Common Database Operations
Change the Report NameChange the Sample NameRealign Run to Different Reference GenomeChange the Run DateAdd or Change a PGM or Proton
Version 3.4.1
- Page 283 - Copyright © 2012 Life Technologies Corporation
For Research Use Only. Not intended for any animal or human therapeutic or diagnostic use.
1.
Contents
Introduction
Realign Run to Different Reference Genome
Reanalyze with a Different DNA Barcode Set
Use DNA Barcodes with the Ion Sequencers
Scan Your Sequencing Kit
Handle a Failed Analysis Run
Determine the Fault Cause
Restart a Run
Terminate an Analysis Run
Work with Files
Work with the Database
Change the Report Name
Change the Sample Name
Change the Run Date
Add or Change a PGM or Proton
Change Your Torrent Browser Password
Change the Report Name
Use Cases
Change the Report Name
If you manually started an analysis and realize that you typed the report name incorrectly, you can change the reportname using the following procedure. These steps require admin login.
It is not safe to change the report name while the report is being processed.
Select the dialog.Results

Version 3.4.1
- Page 284 - Copyright © 2012 Life Technologies Corporation
For Research Use Only. Not intended for any animal or human therapeutic or diagnostic use.
1.
2. On the page, click the name of the run you want to change, in the cSelect results to change ResultsNameolumn:

Version 3.4.1
- Page 285 - Copyright © 2012 Life Technologies Corporation
For Research Use Only. Not intended for any animal or human therapeutic or diagnostic use.
2.
3. Enter the new report name in the field:ResultsName
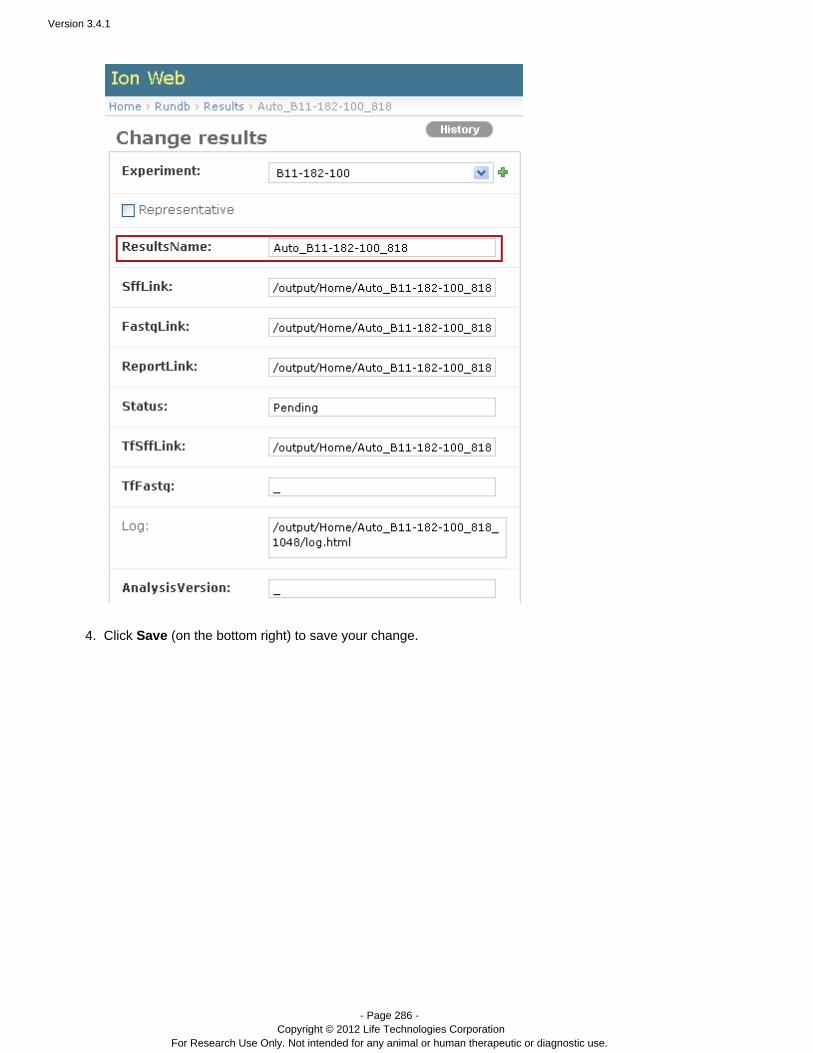
Version 3.4.1
- Page 286 - Copyright © 2012 Life Technologies Corporation
For Research Use Only. Not intended for any animal or human therapeutic or diagnostic use.
3.
4. Click (on the bottom right) to save your change.Save
Version 3.4.1
- Page 287 - Copyright © 2012 Life Technologies Corporation
For Research Use Only. Not intended for any animal or human therapeutic or diagnostic use.
Contents
Introduction
Realign Run to Different Reference Genome
Reanalyze with a Different DNA Barcode Set
Use DNA Barcodes with the Ion Sequencers
Scan Your Sequencing Kit
Handle a Failed Analysis Run
Determine the Fault Cause
Restart a Run
Terminate an Analysis Run
Work with Files
Work with the Database
Change the Report Name
Change the Sample Name
Change the Run Date
Add or Change a PGM or Proton
Change Your Torrent Browser Password
Change the Sample Name
Use Cases
Change the Sample Name
When you start to process a chip on the PGM™ or Proton™ sequencer, one of the things you must enter is asample name. The sample name can be any text that helps you to remember your data.
When the sequencer run completes, the data are transferred to the server for analysis and the sample name isdisplayed in the Torrent Browser, as shown in this example:
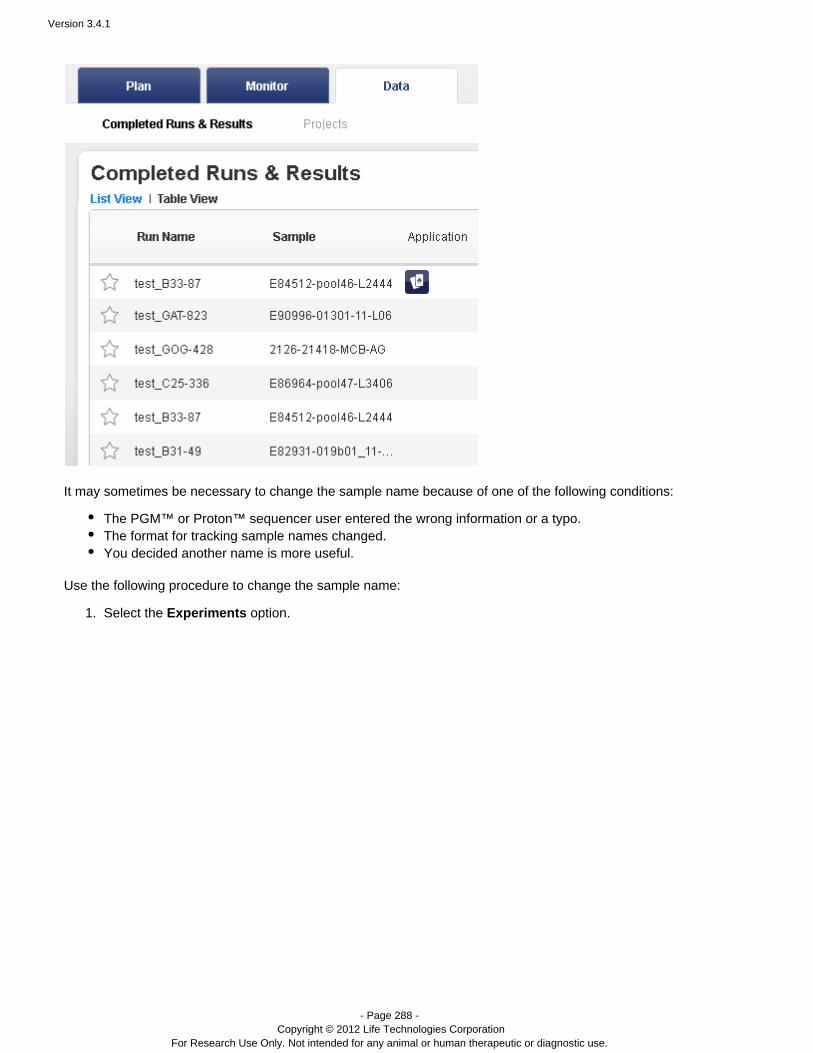
Version 3.4.1
- Page 288 - Copyright © 2012 Life Technologies Corporation
For Research Use Only. Not intended for any animal or human therapeutic or diagnostic use.
1.
It may sometimes be necessary to change the sample name because of one of the following conditions:
The PGM™ or Proton™ sequencer user entered the wrong information or a typo.The format for tracking sample names changed.You decided another name is more useful.
Use the following procedure to change the sample name:
Select the option.Experiments

Version 3.4.1
- Page 289 - Copyright © 2012 Life Technologies Corporation
For Research Use Only. Not intended for any animal or human therapeutic or diagnostic use.
1.
2.
3.
Scroll down the list of experiments and click to select the experiment that has the sample name that you wantto change. Scroll to the field for the selected experiment and change the contents of that field, as wanted.Sample
Warning
Again, do not change any other fields or you risk corrupting the database. If you think you may haveaccidently modified another field, click in your browser and do not press .Back Save

Version 3.4.1
- Page 290 - Copyright © 2012 Life Technologies Corporation
For Research Use Only. Not intended for any animal or human therapeutic or diagnostic use.
3.
4.
5.
When you are done changing the name, click the button in the lower-right corner.Sample Save Go back to the tab run reports listing in the Torrent Browser, and you should immediately see that theData sample name is changed.

Version 3.4.1
- Page 291 - Copyright © 2012 Life Technologies Corporation
For Research Use Only. Not intended for any animal or human therapeutic or diagnostic use.
1.
2.
Contents
Introduction
Realign Run to Different Reference Genome
Reanalyze with a Different DNA Barcode Set
Use DNA Barcodes with the Ion Sequencers
Scan Your Sequencing Kit
Handle a Failed Analysis Run
Determine the Fault Cause
Restart a Run
Terminate an Analysis Run
Work with Files
Work with the Database
Change the Report Name
Change the Sample Name
Change the Run Date
Add or Change a PGM or Proton
Change Your Torrent Browser Password
Change the Run Date
Use Cases
Change the Run Date
Occasionally, the PGM™ or Proton sequencer cannot get a date/time from the internet time server. When this™occurs, the sequencer date is set to January 1, 1969.
The date of the run is encoded in the folder name, which is parsed and used as the in the database. ThisRun Datecauses the new run to be displayed with the incorrect date. With a date of January 1, 1969, the run is the last itemon the last page of run reports listings in the tab.Data
Use the following procedure to change the date for this run:
In the Torrent Browser tab, click and login, if prompted.Config Admin Interface Click to open the database item for modification:Experiments
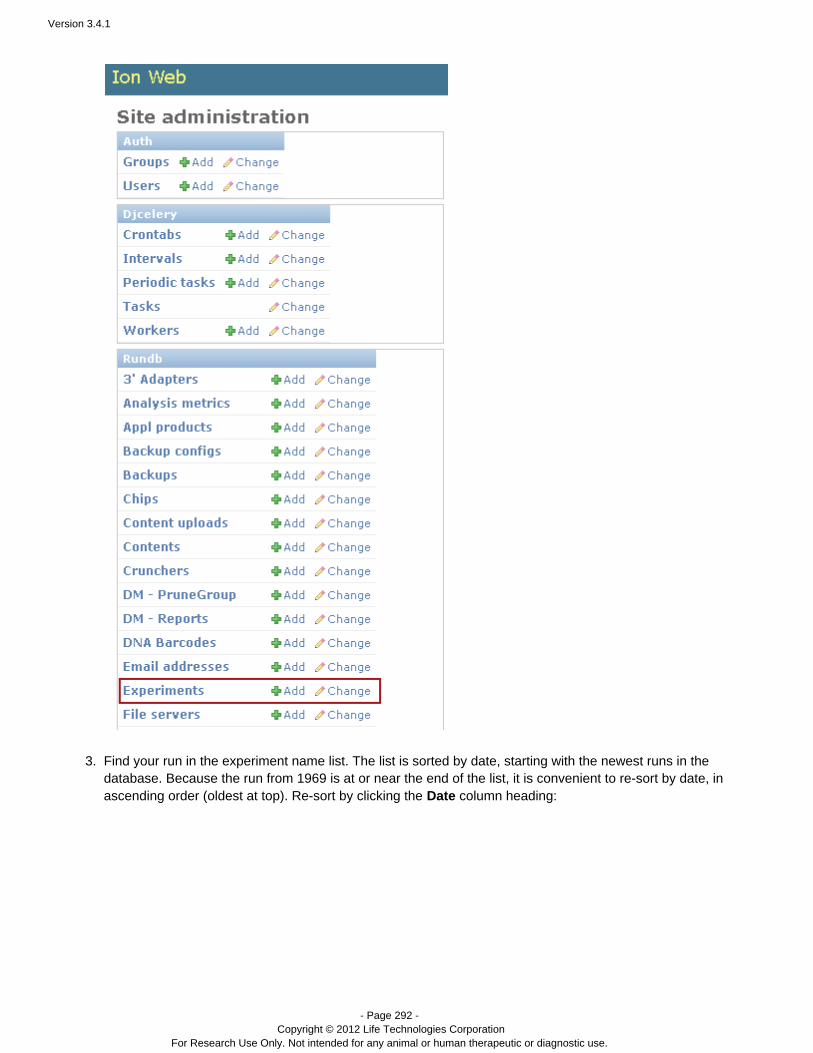
Version 3.4.1
- Page 292 - Copyright © 2012 Life Technologies Corporation
For Research Use Only. Not intended for any animal or human therapeutic or diagnostic use.
2.
3. Find your run in the experiment name list. The list is sorted by date, starting with the newest runs in thedatabase. Because the run from 1969 is at or near the end of the list, it is convenient to re-sort by date, inascending order (oldest at top). Re-sort by clicking the column heading:Date

Version 3.4.1
- Page 293 - Copyright © 2012 Life Technologies Corporation
For Research Use Only. Not intended for any animal or human therapeutic or diagnostic use.
3.
4. Click the for your run to select it and display the following run information:ExpName
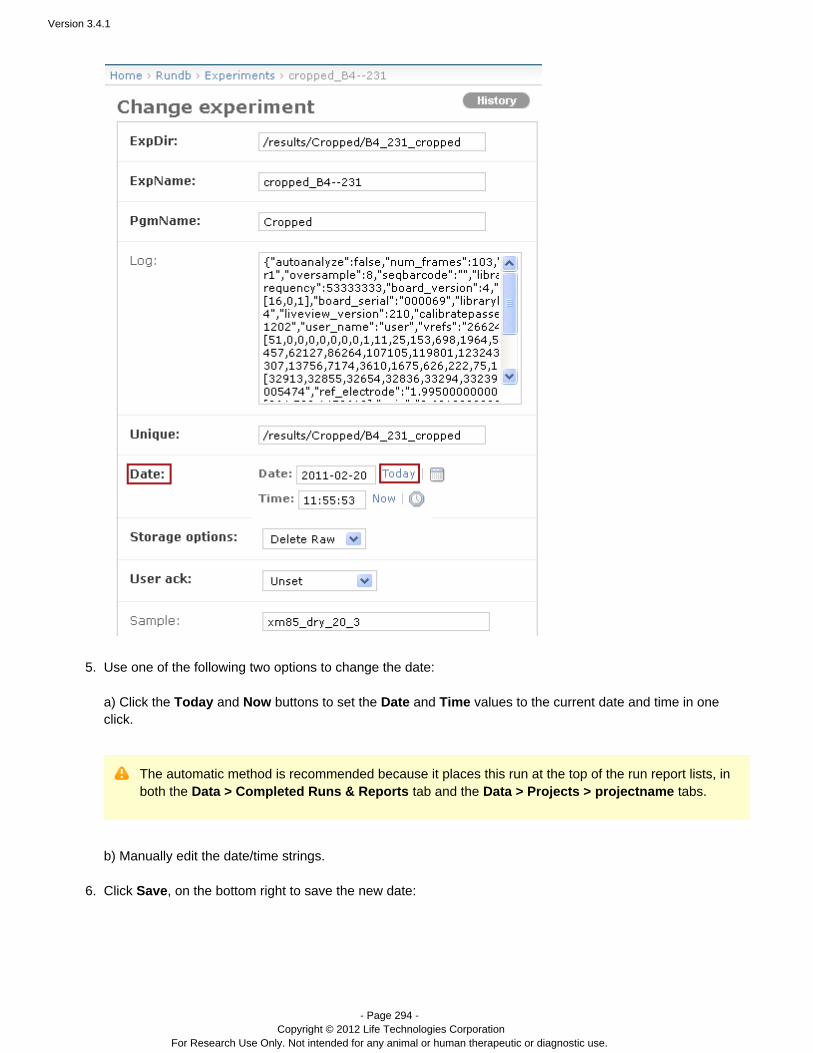
Version 3.4.1
- Page 294 - Copyright © 2012 Life Technologies Corporation
For Research Use Only. Not intended for any animal or human therapeutic or diagnostic use.
4.
5.
6.
Use one of the following two options to change the date: a) Click the and buttons to set the and values to the current date and time in oneToday Now Date Timeclick.
The automatic method is recommended because it places this run at the top of the run report lists, inboth the tab and the tabs.Data > Completed Runs & Reports Data > Projects > projectname
b) Manually edit the date/time strings. Click , on the bottom right to save the new date:Save
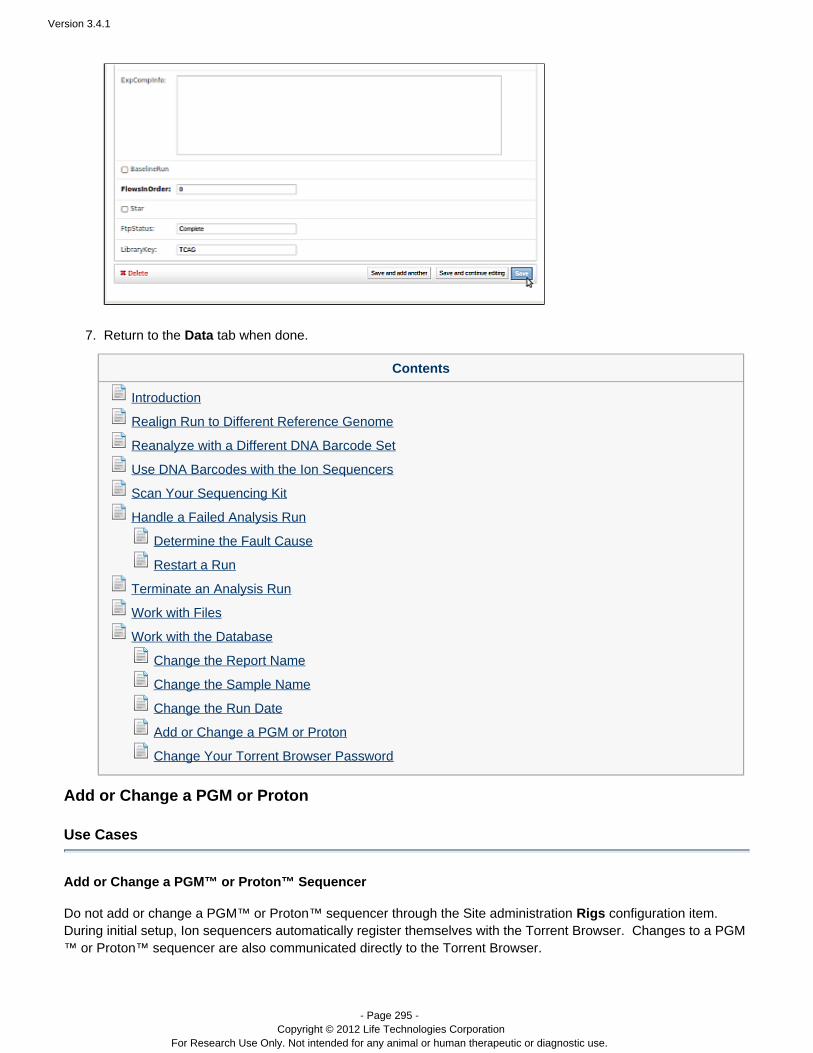
Version 3.4.1
- Page 295 - Copyright © 2012 Life Technologies Corporation
For Research Use Only. Not intended for any animal or human therapeutic or diagnostic use.
6.
7. Return to the tab when done.Data
Contents
Introduction
Realign Run to Different Reference Genome
Reanalyze with a Different DNA Barcode Set
Use DNA Barcodes with the Ion Sequencers
Scan Your Sequencing Kit
Handle a Failed Analysis Run
Determine the Fault Cause
Restart a Run
Terminate an Analysis Run
Work with Files
Work with the Database
Change the Report Name
Change the Sample Name
Change the Run Date
Add or Change a PGM or Proton
Change Your Torrent Browser Password
Add or Change a PGM or Proton
Use Cases
Add or Change a PGM™ or Proton™ Sequencer
Do not add or change a PGM™ or Proton through the Site administration configuration item. ™ sequencer RigsDuring initial setup, Ion sequencers automatically register themselves with the Torrent Browser. Changes to a PGM
are also communicated directly to the Torrent Browser.™ or Proton™ sequencer
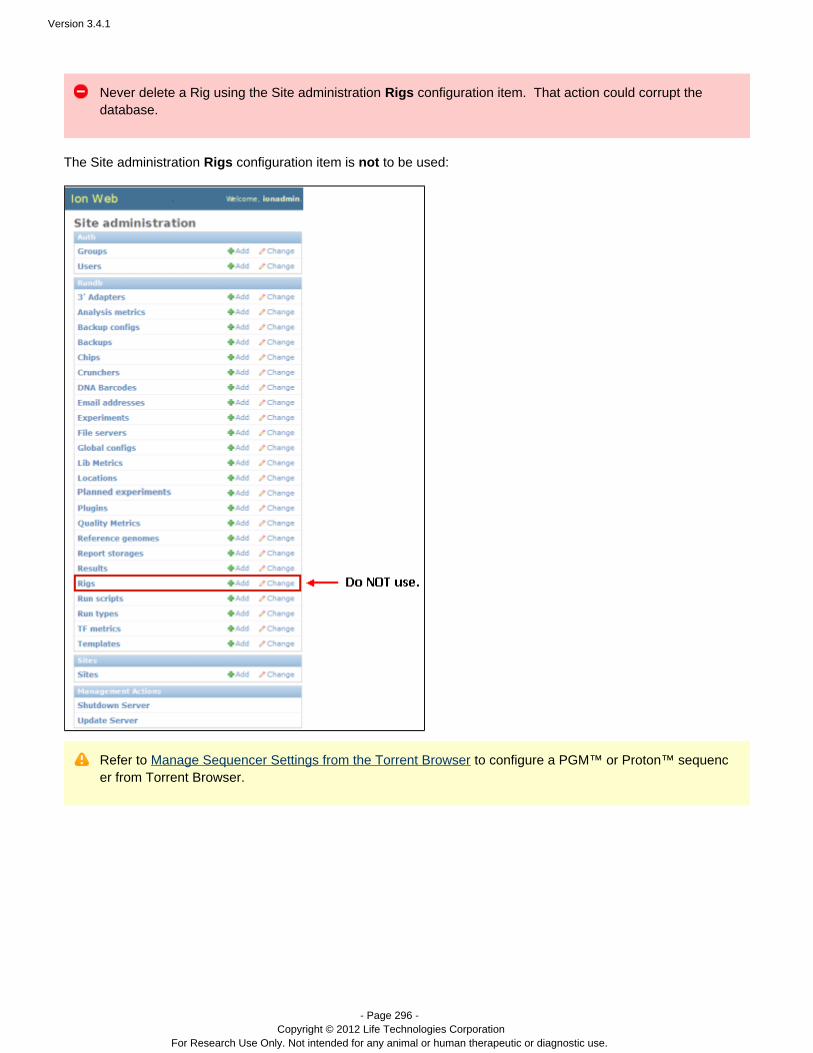
Version 3.4.1
- Page 296 - Copyright © 2012 Life Technologies Corporation
For Research Use Only. Not intended for any animal or human therapeutic or diagnostic use.
Never delete a Rig using the Site administration configuration item. That action could corrupt theRigsdatabase.
The Site administration configuration item is to be used:Rigs not
Refer to to configure a PGMManage Sequencer Settings from the Torrent Browser ™ or Proton™ sequenc from Torrent Browser.er
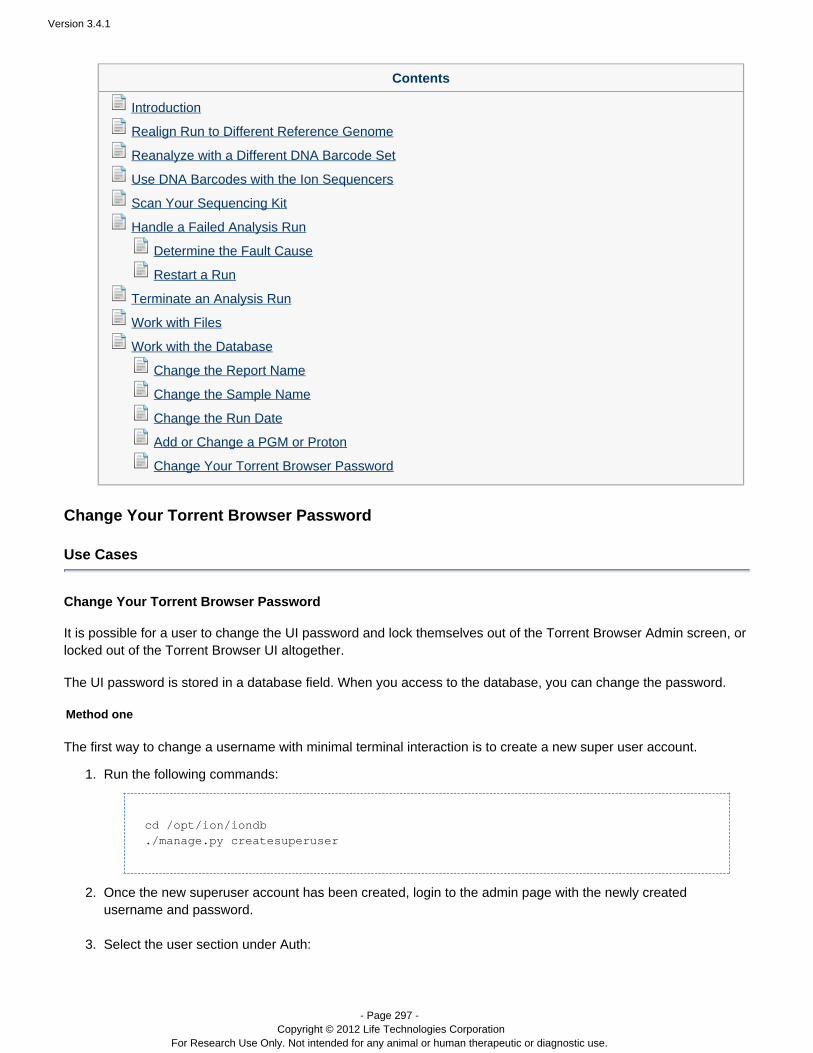
Version 3.4.1
- Page 297 - Copyright © 2012 Life Technologies Corporation
For Research Use Only. Not intended for any animal or human therapeutic or diagnostic use.
1.
2.
3.
Contents
Introduction
Realign Run to Different Reference Genome
Reanalyze with a Different DNA Barcode Set
Use DNA Barcodes with the Ion Sequencers
Scan Your Sequencing Kit
Handle a Failed Analysis Run
Determine the Fault Cause
Restart a Run
Terminate an Analysis Run
Work with Files
Work with the Database
Change the Report Name
Change the Sample Name
Change the Run Date
Add or Change a PGM or Proton
Change Your Torrent Browser Password
Change Your Torrent Browser Password
Use Cases
Change Your Torrent Browser Password
It is possible for a user to change the UI password and lock themselves out of the Torrent Browser Admin screen, orlocked out of the Torrent Browser UI altogether.
The UI password is stored in a database field. When you access to the database, you can change the password.
Method one
The first way to change a username with minimal terminal interaction is to create a new super user account.
Run the following commands:
cd /opt/ion/iondb./manage.py createsuperuser
Once the new superuser account has been created, login to the admin page with the newly createdusername and password.
Select the user section under Auth:
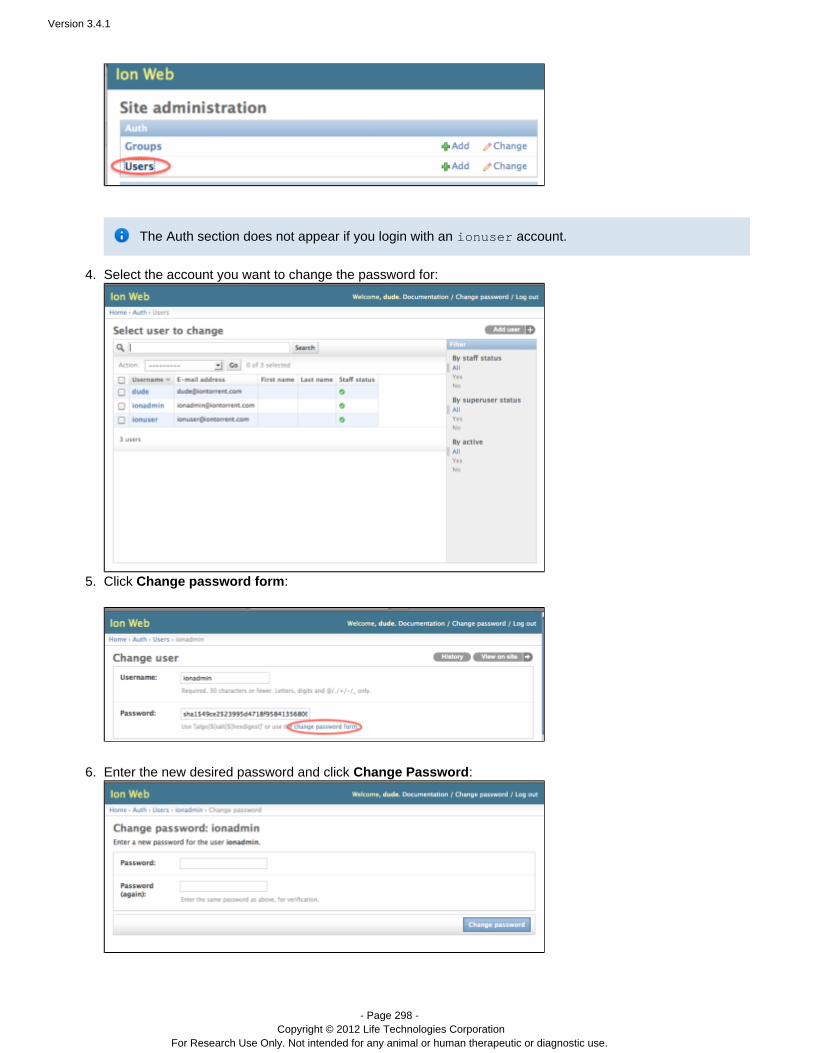
Version 3.4.1
- Page 298 - Copyright © 2012 Life Technologies Corporation
For Research Use Only. Not intended for any animal or human therapeutic or diagnostic use.
3.
4.
5.
6.
The Auth section does not appear if you login with an account.ionuser
Select the account you want to change the password for:
Click :Change password form
Enter the new desired password and click :Change Password
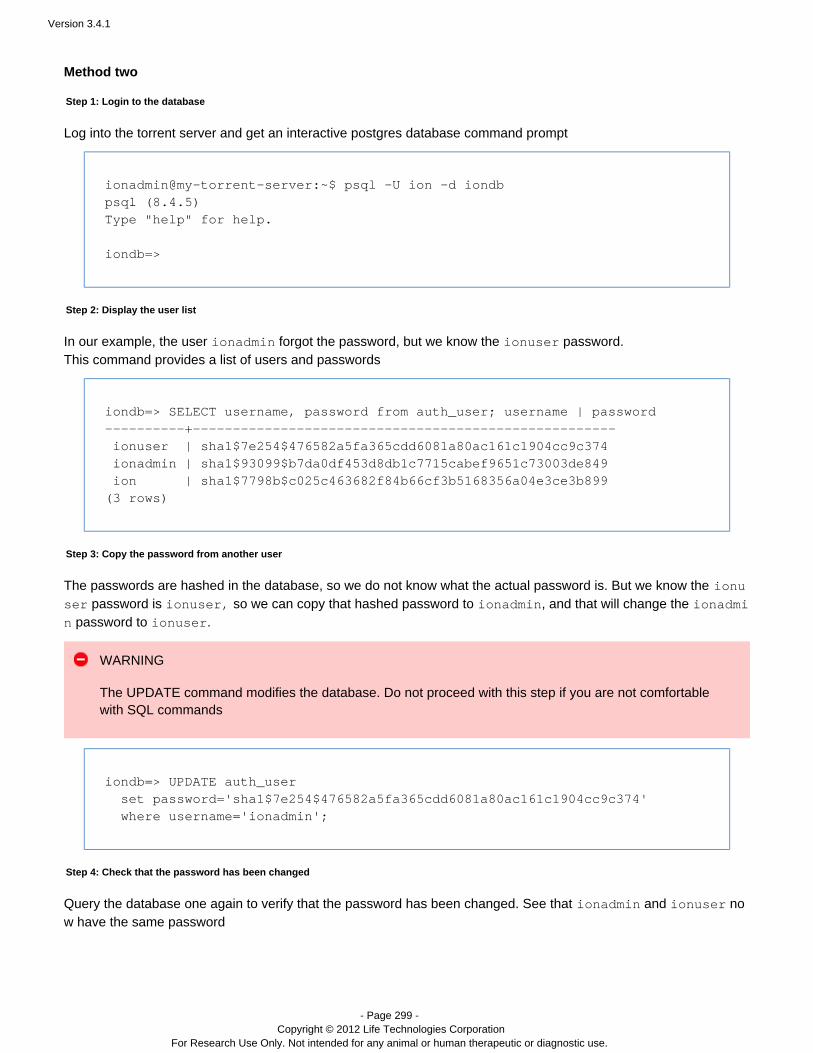
Version 3.4.1
- Page 299 - Copyright © 2012 Life Technologies Corporation
For Research Use Only. Not intended for any animal or human therapeutic or diagnostic use.
Method two
Step 1: Login to the database
Log into the torrent server and get an interactive postgres database command prompt
ionadmin@my-torrent-server:~$ psql -U ion -d iondbpsql (8.4.5)Type "help" for help.
iondb=>
Step 2: Display the user list
In our example, the user forgot the password, but we know the password.ionadmin ionuser
This command provides a list of users and passwords
iondb=> SELECT username, password from auth_user; username | password----------+----------------------------------------------------- ionuser | sha1$7e254$476582a5fa365cdd6081a80ac161c1904cc9c374 ionadmin | sha1$93099$b7da0df453d8db1c7715cabef9651c73003de849 ion | sha1$7798b$c025c463682f84b66cf3b5168356a04e3ce3b899(3 rows)
Step 3: Copy the password from another user
The passwords are hashed in the database, so we do not know what the actual password is. But we know the ionupassword is so we can copy that hashed password to , and that will change the ser ionuser, ionadmin ionadmi
password to . n ionuser
WARNING
The UPDATE command modifies the database. Do not proceed with this step if you are not comfortablewith SQL commands
iondb=> UPDATE auth_user set password='sha1$7e254$476582a5fa365cdd6081a80ac161c1904cc9c374' where username='ionadmin';
Step 4: Check that the password has been changed
Query the database one again to verify that the password has been changed. See that and noionadmin ionuser
w have the same password
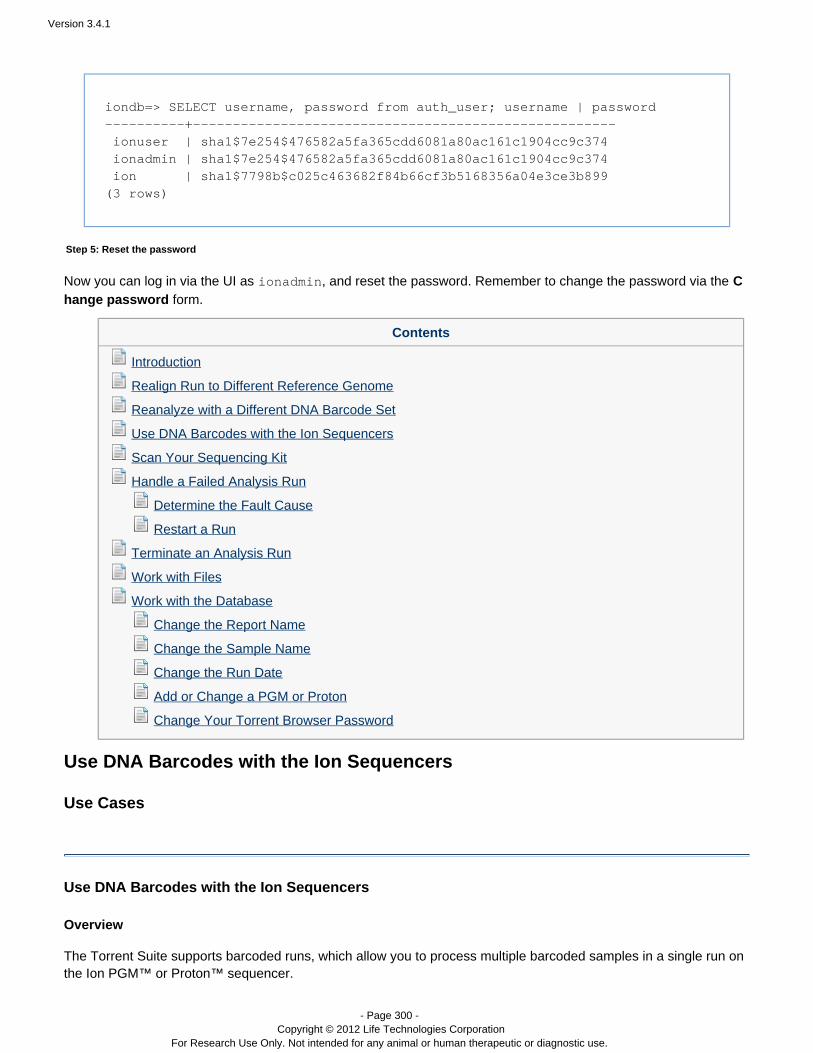
Version 3.4.1
- Page 300 - Copyright © 2012 Life Technologies Corporation
For Research Use Only. Not intended for any animal or human therapeutic or diagnostic use.
iondb=> SELECT username, password from auth_user; username | password----------+----------------------------------------------------- ionuser | sha1$7e254$476582a5fa365cdd6081a80ac161c1904cc9c374 ionadmin | sha1$7e254$476582a5fa365cdd6081a80ac161c1904cc9c374 ion | sha1$7798b$c025c463682f84b66cf3b5168356a04e3ce3b899(3 rows)
Step 5: Reset the password
Now you can log in via the UI as , and reset the password. Remember to change the password via the ionadmin C form.hange password
Contents
Introduction
Realign Run to Different Reference Genome
Reanalyze with a Different DNA Barcode Set
Use DNA Barcodes with the Ion Sequencers
Scan Your Sequencing Kit
Handle a Failed Analysis Run
Determine the Fault Cause
Restart a Run
Terminate an Analysis Run
Work with Files
Work with the Database
Change the Report Name
Change the Sample Name
Change the Run Date
Add or Change a PGM or Proton
Change Your Torrent Browser Password
Use DNA Barcodes with the Ion Sequencers
Use Cases
Use DNA Barcodes with the Ion Sequencers
Overview
The Torrent Suite supports barcoded runs, which allow you to process multiple barcoded samples in a single run onthe Ion PGM™ or Proton sequencer.™
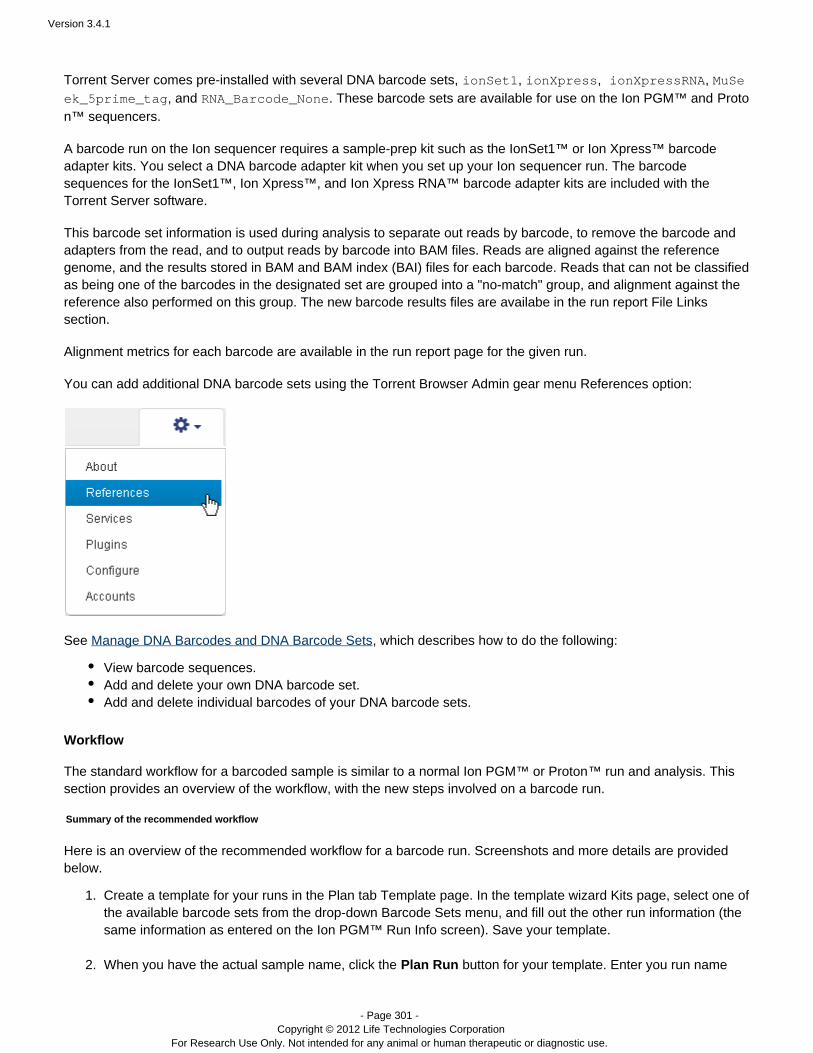
Version 3.4.1
- Page 301 - Copyright © 2012 Life Technologies Corporation
For Research Use Only. Not intended for any animal or human therapeutic or diagnostic use.
1.
2.
Torrent Server comes pre-installed with several DNA barcode sets, , ionSet1 ionXpress, ionXpressRNA, MuSe. These barcode sets are available for use on the Ion PGM™ and ek_5prime_tag, and RNA_Barcode_None Proto
sequencers.n™
A barcode run on the Ion sequencer requires a sample-prep kit such as the IonSet1™ or Ion Xpress™ barcodeadapter kits. You select a DNA barcode adapter kit when you set up your Ion run. The barcodesequencersequences for the IonSet1™, Ion Xpress™, and barcode adapter kits are included with theIon Xpress RNA™Torrent Server software.
This barcode set information is used during analysis to separate out reads by barcode, to remove the barcode andadapters from the read, and to output reads by barcode into BAM files. Reads are aligned against the referencegenome, and the results stored in BAM and BAM index (BAI) files for each barcode. Reads that can not be classifiedas being one of the barcodes in the designated set are grouped into a "no-match" group, and alignment against thereference also performed on this group. The new barcode results files are availabe in the run report File Linkssection.
Alignment metrics for each barcode are available in the run report page for the given run.
You can add additional DNA barcode sets using the Torrent Browser Admin gear menu References option:
See , which describes how to do the following: Manage DNA Barcodes and DNA Barcode Sets
View barcode sequences.Add and delete your own DNA barcode set.Add and delete individual barcodes of your barcode sets.DNA
Workflow
The standard workflow for a barcoded sample is similar to a normal Ion PGM™ or Proton run and analysis. This™ section provides an overview of the workflow, with the new steps involved on a barcode run.
Summary of the recommended workflow
Here is an overview of the recommended workflow for a barcode run. Screenshots and more details are providedbelow.
Create a template for your runs in the Plan tab Template page. In the template wizard Kits page, select one ofthe available barcode sets from the drop-down Barcode Sets menu, and fill out the other run information (thesame information as entered on the Ion PGM™ Run Info screen). Save your template.
When you have the actual sample name, click the Plan Run button for your template. Enter you run name

Version 3.4.1
- Page 302 - Copyright © 2012 Life Technologies Corporation
For Research Use Only. Not intended for any animal or human therapeutic or diagnostic use.
2.
3.
4.
5.
6.
1.
2.
and sample name, then click .Plan The Torrent Server assigns a name to your planned run, and generates a retail-style scannable barcodeimage representing your planned run name. Your run information is stored on the Torrent Server as a planne
run until you are ready to start the run on the Ion PGM™ sequencer.d When you are ready to start the run, on the Ion PGM™ Run Info screen you select your run from a list of plan
runs.ned The Torrent Server populates the Ion PGM™ Run Info with the information you entered in the Planning tab. (You may optionally change information on the Run Info screen.) You start the Ion PGM™ run as usual. When the run and report are complete, you can review the performance of the barcoded reads in the defaultreport page. The following additional barcode-specific files are available for download from the File Linksdownload section:
A zip of BAM and BAM index (BAI) files for each barcodeA csv-style spreadsheet summarizing the barcode performance for each barcode
Set up your barcode run in a Plan tab template
The same steps apply to a planned run (which is created from a template). For information on templates, includingapplication groups and the template wizard, see the following:
IntroductionPlan TabTemplatesTemplate and Planned Run Wizard
Follow these steps to set up your barcoded run information in a template:
Click the tab > page, click the button for the application groupPlan Template Add New Templateappropriate to your experiment. The Template wizard opens:
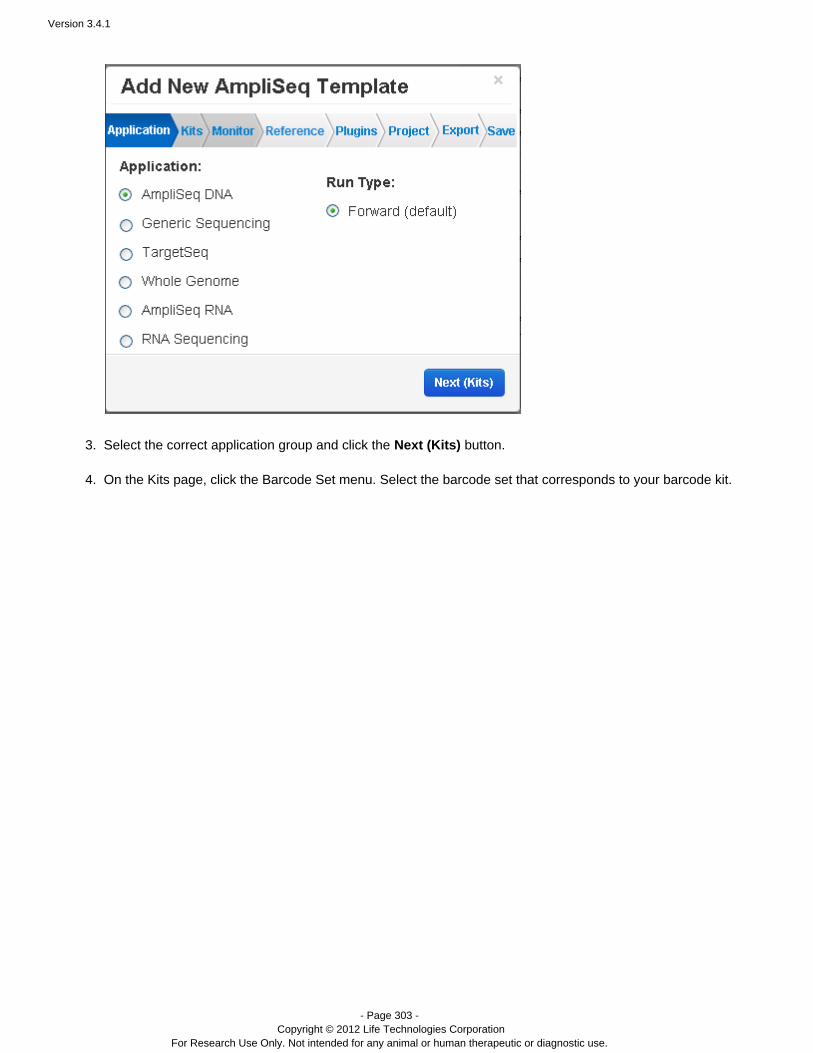
Version 3.4.1
- Page 303 - Copyright © 2012 Life Technologies Corporation
For Research Use Only. Not intended for any animal or human therapeutic or diagnostic use.
2.
3.
4.
Select the correct application group and click the button.Next (Kits)
On the Kits page, click the Barcode Set menu. Select the barcode set that corresponds to your barcode kit.
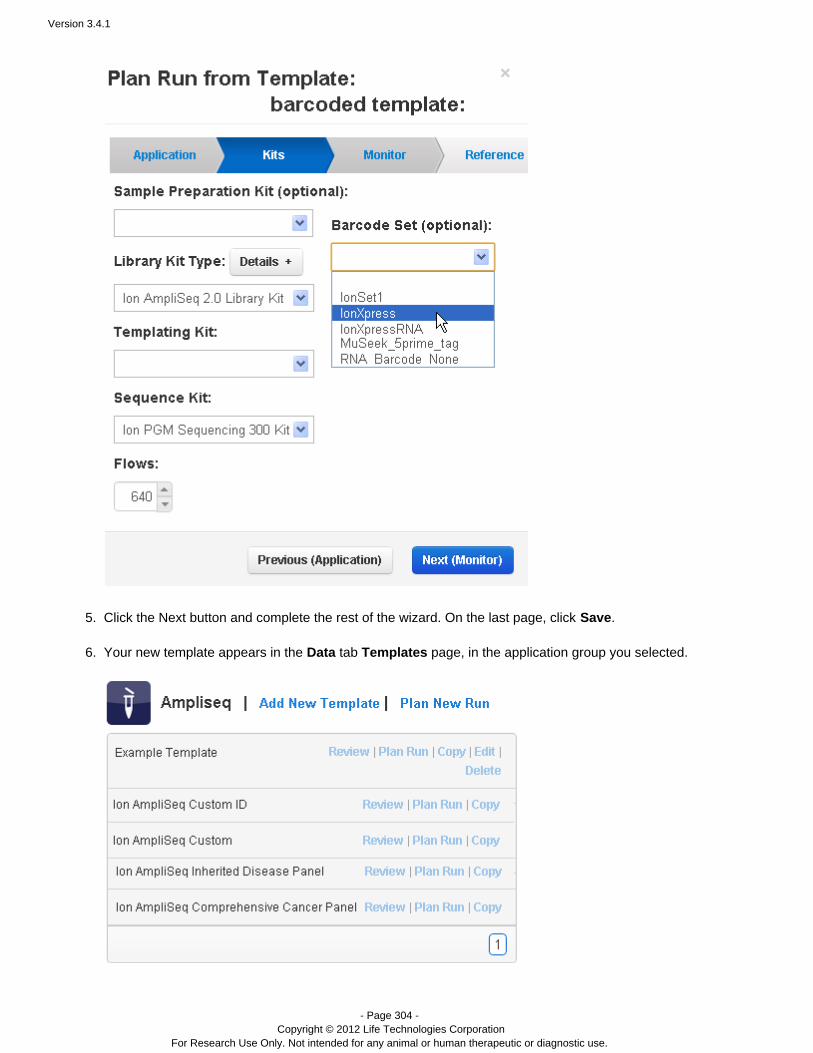
Version 3.4.1
- Page 304 - Copyright © 2012 Life Technologies Corporation
For Research Use Only. Not intended for any animal or human therapeutic or diagnostic use.
4.
5.
6.
7.
Click the Next button and complete the rest of the wizard. On the last page, click .Save
Your new template appears in the tab page, in the application group you selected.Data Templates
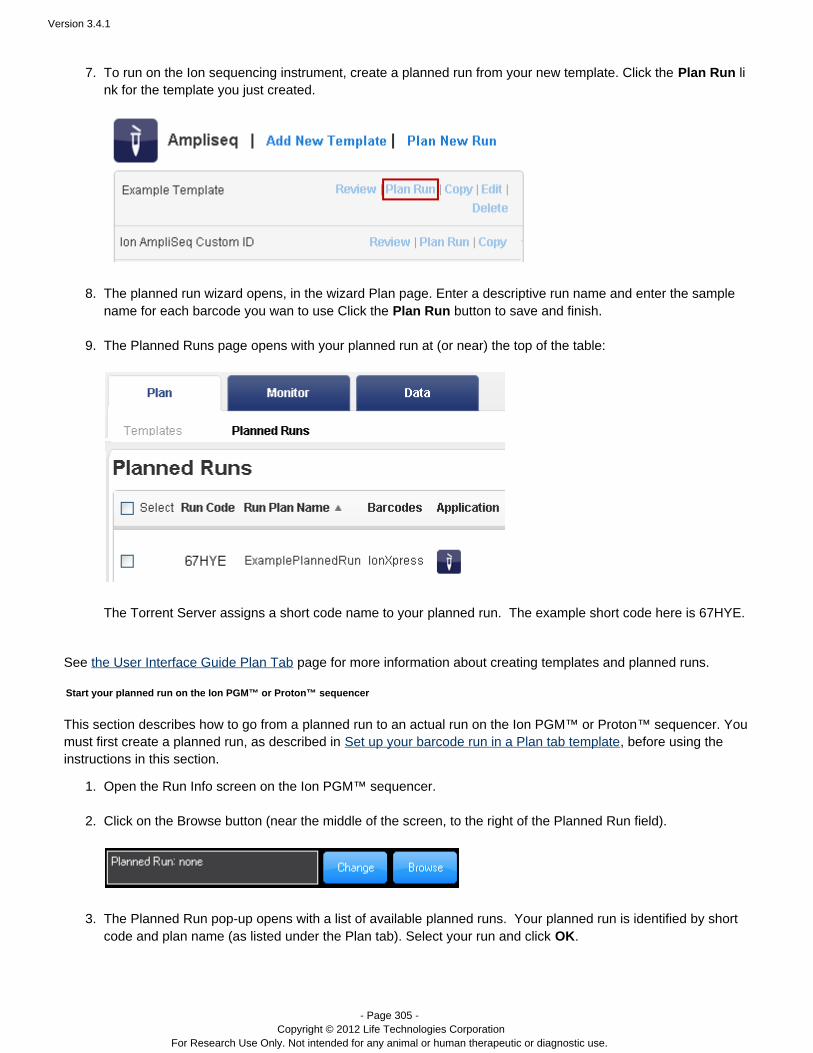
Version 3.4.1
- Page 305 - Copyright © 2012 Life Technologies Corporation
For Research Use Only. Not intended for any animal or human therapeutic or diagnostic use.
6.
7.
8.
9.
1.
2.
3.
To run on the Ion sequencing instrument, create a planned run from your new template. Click the liPlan Runnk for the template you just created.
The planned run wizard opens, in the wizard Plan page. Enter a descriptive run name and enter the samplename for each barcode you wan to use Click the button to save and finish.Plan Run The Planned Runs page opens with your planned run at (or near) the top of the table:
The Torrent Server assigns a short code name to your run. The example short code here is 67HYE.planned
See page for more information about creating templates and planned runs.the User Interface Guide Plan Tab
Start your planned run on the Ion PGM™ or Proton™ sequencer
This section describes how to go from a run to an actual run on the Ion PGM™ or Proton sequencer. Youplanned ™ must first create a planned run, as described in , before using theSet up your barcode run in a Plan tab templateinstructions in this section.
Open the Run Info screen on the Ion PGM™ sequencer. Click on the Browse button (near the middle of the screen, to the right of the Planned Run field).
The Run pop-up opens with a list of available uns. Your run is identified by shortPlanned planned r planned code and plan name (as listed under the Plan tab). Select your run and click .OK
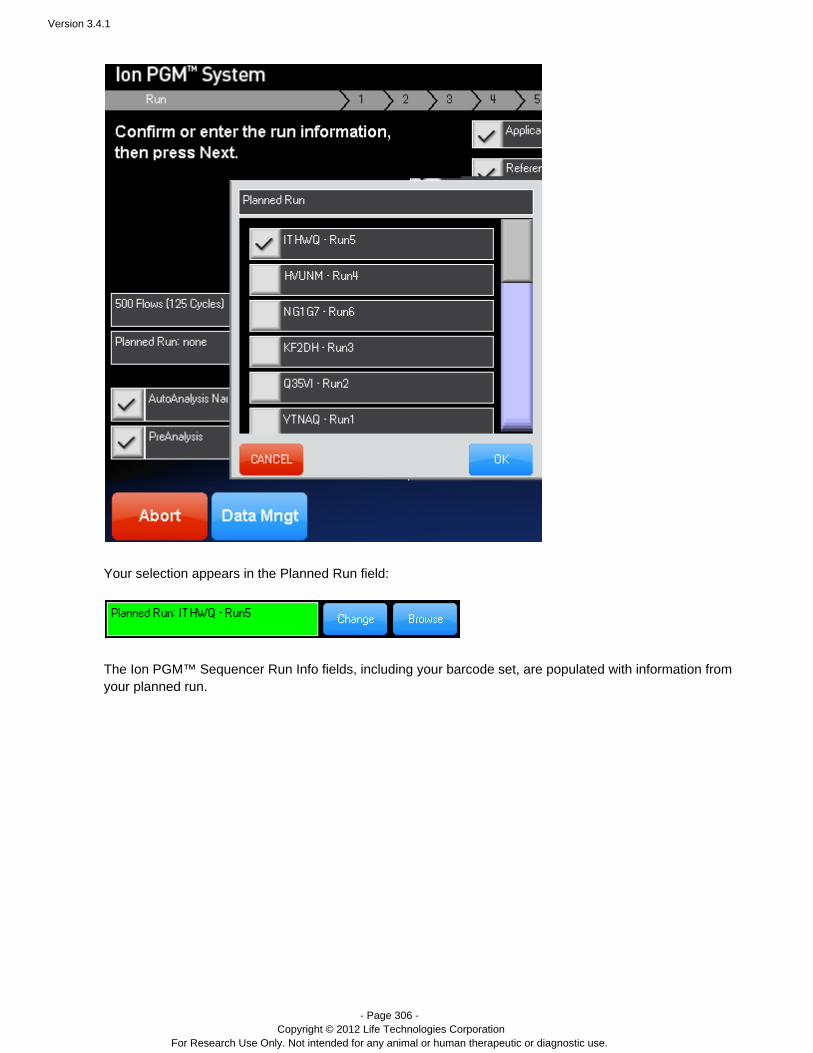
Version 3.4.1
- Page 306 - Copyright © 2012 Life Technologies Corporation
For Research Use Only. Not intended for any animal or human therapeutic or diagnostic use.
3.
Your selection appears in the Run field:Planned
The Ion PGM™ Sequencer Run Info fields, including your barcode set, are populated with information fromyour planned run.
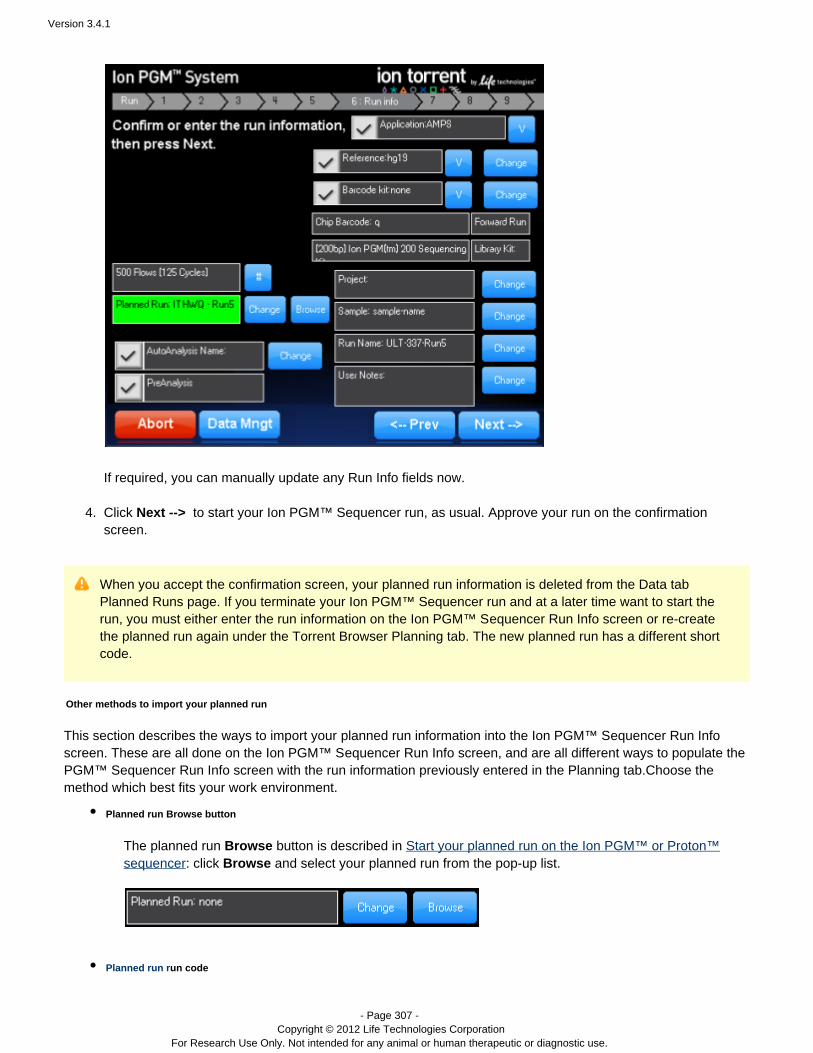
Version 3.4.1
- Page 307 - Copyright © 2012 Life Technologies Corporation
For Research Use Only. Not intended for any animal or human therapeutic or diagnostic use.
3.
4.
If required, you can manually update any Run Info fields now. Click to start your Ion PGM™ Sequencer run, as usual. Approve your run on the confirmationNext -->screen.
When you accept the confirmation screen, your run information is deleted from the Data tabplanned Planned Runs page. If you terminate your Ion PGM™ Sequencer run and at a later time want to start therun, you must either enter the run information on the Ion PGM™ S Run Info screen or re-createequencer the run again under the Torrent Browser Planning tab. The new run has a different shortplanned planned code.
Other methods to import your planned run
This section describes the ways to import your run information into the Ion PGM™ S Run Infoplanned equencer screen. These are all done on the Ion PGM™ S Run Info screen, and are all different ways to populate theequencer PGM™ S Run Info screen with the run information previously entered in the Planning tab.Choose theequencer method which best fits your work environment.
Planned run Browse button
The run button is described in planned Browse Start your planned run on the Ion PGM™ or Proton™: click and select your run from the pop-up list. sequencer Browse planned
Planned run run code
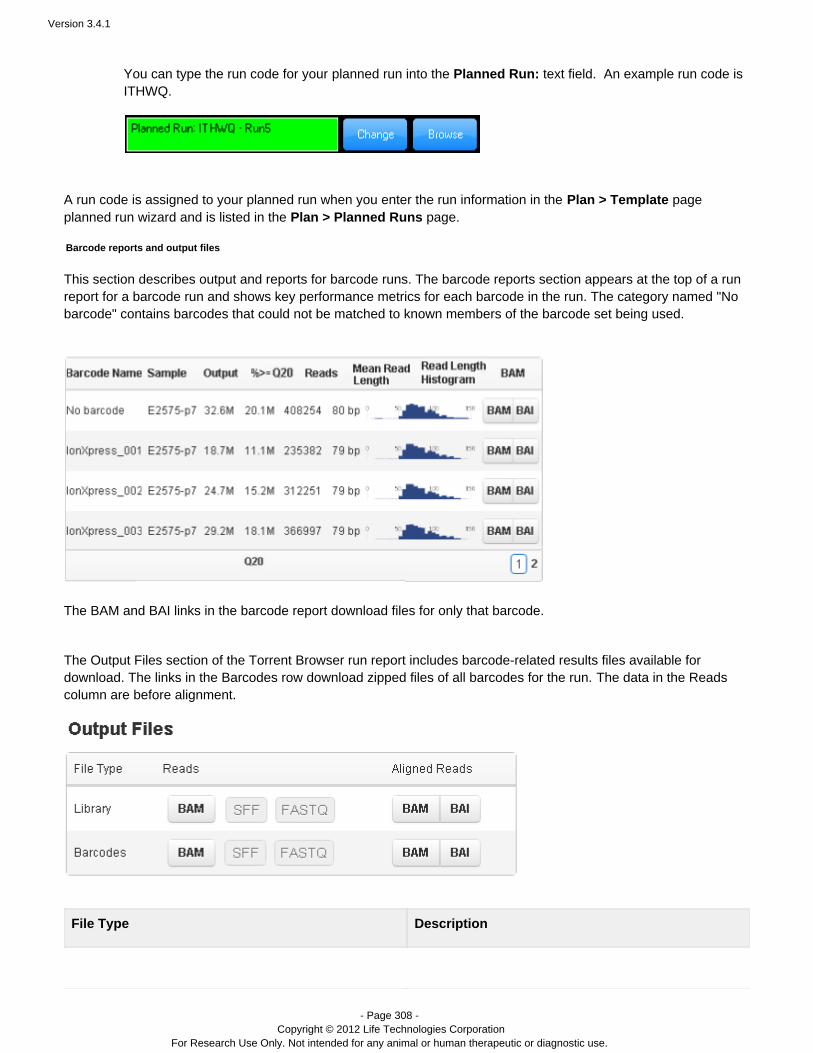
Version 3.4.1
- Page 308 - Copyright © 2012 Life Technologies Corporation
For Research Use Only. Not intended for any animal or human therapeutic or diagnostic use.
You can type the run code for your run into the text field. An example run code isplanned Planned Run:ITHWQ.
A run code is assigned to your planned run when you enter the run information in the pagePlan > Templateplanned run wizard and is listed in the page.Plan > Planned Runs
Barcode reports and output files
This section describes output and reports for barcode runs. The barcode reports section appears at the top of a runreport for a barcode run and shows key performance metrics for each barcode in the run. The category named "Nobarcode" contains barcodes that could not be matched to known members of the barcode set being used.
The BAM and BAI links in the barcode report download files for only that barcode.
The Output Files section of the Torrent Browser run report includes barcode-related results files available fordownload. The links in the Barcodes row download zipped files of all barcodes for the run. The data in the Readscolumn are before alignment.
File Type Description

Version 3.4.1
- Page 309 - Copyright © 2012 Life Technologies Corporation
For Research Use Only. Not intended for any animal or human therapeutic or diagnostic use.
Barcode-specific Library Alignments (BAM andBAM Index)
Binary Sequence Alignment/Map (BAM), is acompressed, binary form of the SAM file. The BAMindex (BAI) file speeds up the access time for acoordinate-sorted BAM file. The BAM and BAI files foreach barcode are zipped together.
The SFF and FASTQ file formats are not produced by the default analysis pipeline.
See and .SFFCreator and FastqCreator Plugins Technical Note - Transition from SFF to BAM format
Plugin Support for Barcodes
The following plugins supports barcode libraries. See Run the Installed Plugins for information on these plugins:
Coverage AnalysisTorrent Variant Caller
The following plugin does not support barcode libraries:
Alignment
Related Information
The following pages also discuss barcode usage, reports, and manipulation:
Manage DNA Barcodes and DNA Barcode Sets describes how to manage individual barcodes and barcodesets using the Torrent Browser Admin References tab. The User Interface Guide Plan Tab describes how to create templates and planned runs for yourexperiments.Run the Installed Plugins includes example barcode output for plugins.

Version 3.4.1
- Page 310 - Copyright © 2012 Life Technologies Corporation
For Research Use Only. Not intended for any animal or human therapeutic or diagnostic use.
1.
2.
Contents
Introduction
Realign Run to Different Reference Genome
Reanalyze with a Different DNA Barcode Set
Use DNA Barcodes with the Ion Sequencers
Scan Your Sequencing Kit
Handle a Failed Analysis Run
Determine the Fault Cause
Restart a Run
Terminate an Analysis Run
Work with Files
Work with the Database
Change the Report Name
Change the Sample Name
Change the Run Date
Add or Change a PGM or Proton
Change Your Torrent Browser Password
Reanalyze with a Different DNA Barcode Set
Use Cases
Reanalyze with a Different DNA Barcode Set
If you choose the wrong DNA barcode set or forget to select a barcode set during run planning, theseDNA instructions help you select the correct barcode set and reanalyze the run.
Follow these steps to change the barcode ID:DNA
Open a run reports listing in the tab.Data > Completed Runs & Reports
In the list view, click the Edit button on the right side of the run listing:
In the table view, click the gear menu on the right side of the run report listing and click the option:Edit
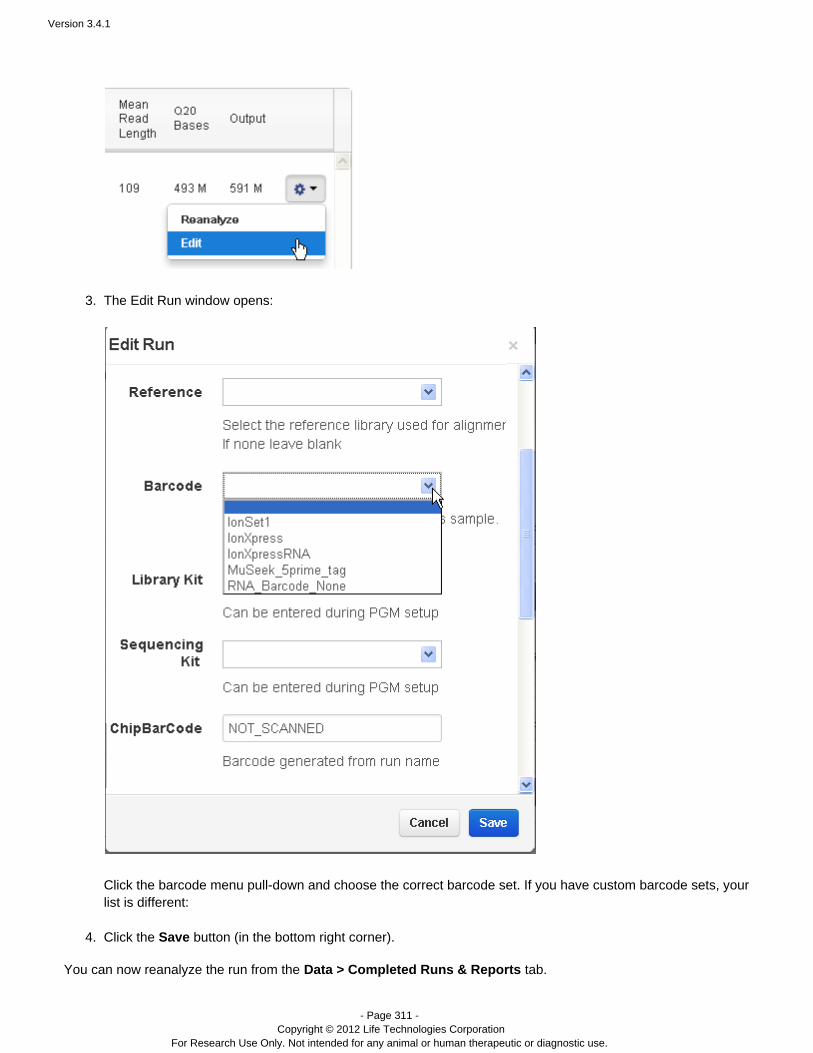
Version 3.4.1
- Page 311 - Copyright © 2012 Life Technologies Corporation
For Research Use Only. Not intended for any animal or human therapeutic or diagnostic use.
2.
3.
4.
The Edit Run window opens:
Click the barcode menu pull-down and choose the correct barcode set. If you have custom barcode sets, yourlist is different: Click the button (in the bottom right corner).Save
You can now reanalyze the run from the tab.Data > Completed Runs & Reports
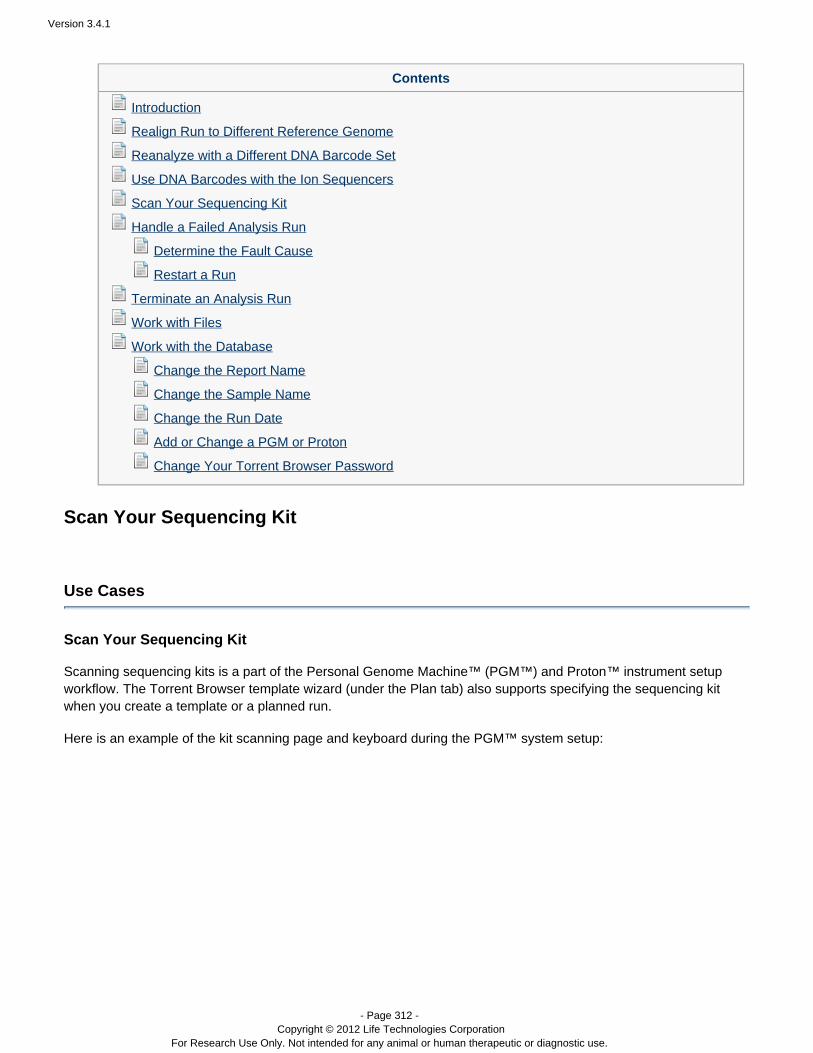
Version 3.4.1
- Page 312 - Copyright © 2012 Life Technologies Corporation
For Research Use Only. Not intended for any animal or human therapeutic or diagnostic use.
Contents
Introduction
Realign Run to Different Reference Genome
Reanalyze with a Different DNA Barcode Set
Use DNA Barcodes with the Ion Sequencers
Scan Your Sequencing Kit
Handle a Failed Analysis Run
Determine the Fault Cause
Restart a Run
Terminate an Analysis Run
Work with Files
Work with the Database
Change the Report Name
Change the Sample Name
Change the Run Date
Add or Change a PGM or Proton
Change Your Torrent Browser Password
Scan Your Sequencing Kit
Use Cases
Scan Your Sequencing Kit
Scanning sequencing kits is a part of the Personal Genome Machine™ (PGM™) and Proton setup™ instrument workflow. The Torrent Browser template wizard (under the Plan tab) also supports specifying the sequencing kitwhen you create a template or a planned run.
Here is an example of the kit scanning page and keyboard during the PGM™ system setup:
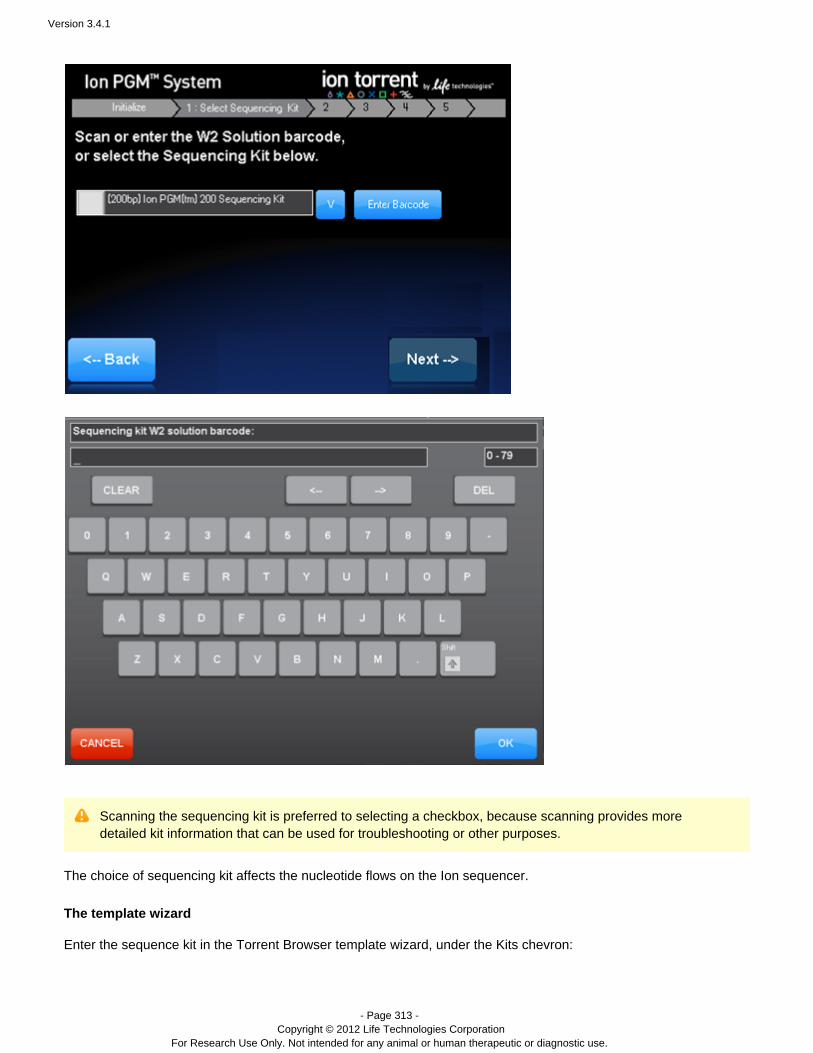
Version 3.4.1
- Page 313 - Copyright © 2012 Life Technologies Corporation
For Research Use Only. Not intended for any animal or human therapeutic or diagnostic use.
Scanning the sequencing kit is preferred to selecting a checkbox, because scanning provides moredetailed kit information that can be used for troubleshooting or other purposes.
The choice of sequencing kit affects the nucleotide flows on the Ion sequencer.
The template wizard
Enter the sequence kit in the Torrent Browser template wizard, under the Kits chevron:
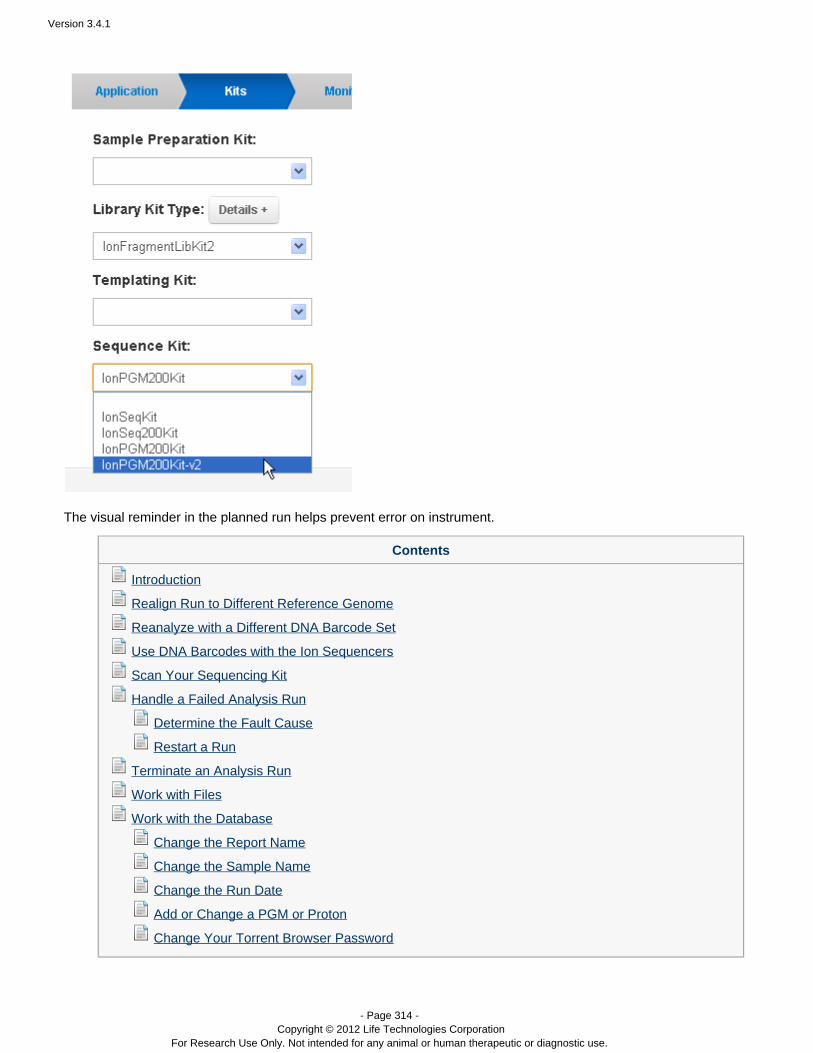
Version 3.4.1
- Page 314 - Copyright © 2012 Life Technologies Corporation
For Research Use Only. Not intended for any animal or human therapeutic or diagnostic use.
The visual reminder in the planned run helps prevent error on instrument.
Contents
Introduction
Realign Run to Different Reference Genome
Reanalyze with a Different DNA Barcode Set
Use DNA Barcodes with the Ion Sequencers
Scan Your Sequencing Kit
Handle a Failed Analysis Run
Determine the Fault Cause
Restart a Run
Terminate an Analysis Run
Work with Files
Work with the Database
Change the Report Name
Change the Sample Name
Change the Run Date
Add or Change a PGM or Proton
Change Your Torrent Browser Password
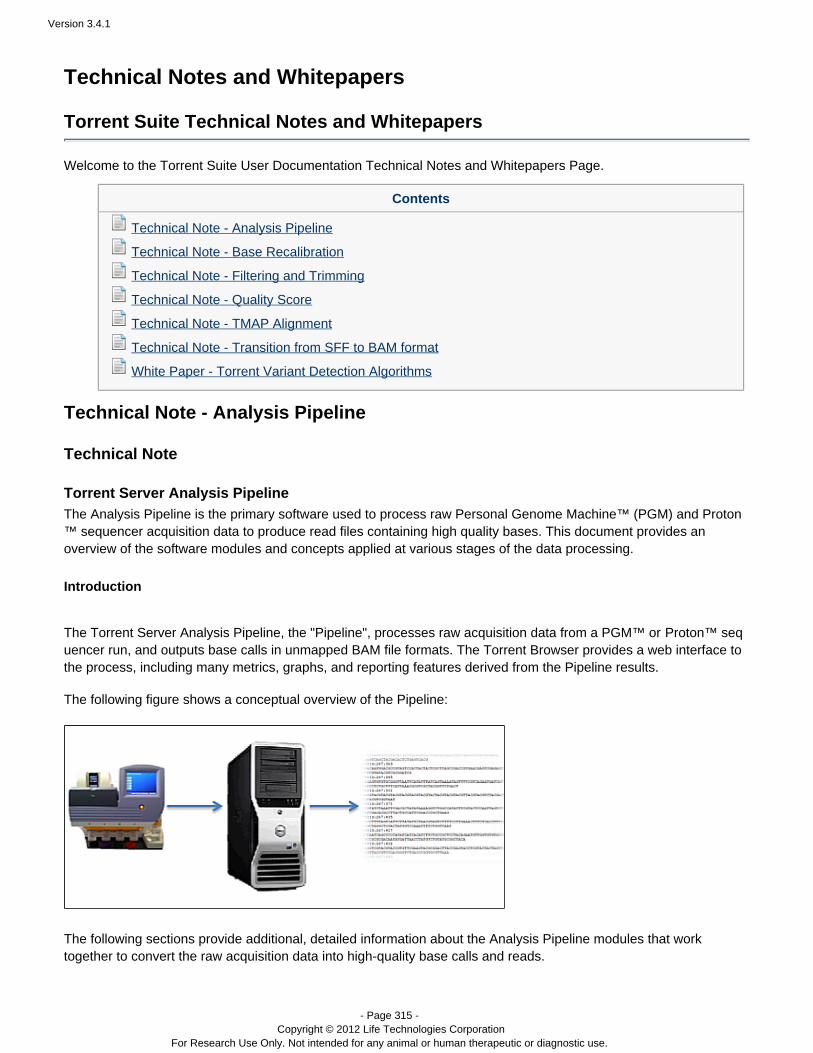
Version 3.4.1
- Page 315 - Copyright © 2012 Life Technologies Corporation
For Research Use Only. Not intended for any animal or human therapeutic or diagnostic use.
Technical Notes and Whitepapers
Torrent Suite Technical Notes and Whitepapers
Welcome to the Torrent Suite User Documentation Technical Notes and Whitepapers Page.
Contents
Technical Note - Analysis Pipeline
Technical Note - Base Recalibration
Technical Note - Filtering and Trimming
Technical Note - Quality Score
Technical Note - TMAP Alignment
Technical Note - Transition from SFF to BAM format
White Paper - Torrent Variant Detection Algorithms
Technical Note - Analysis Pipeline
Technical Note
Torrent Server Analysis PipelineThe Analysis Pipeline is the primary software used to process raw Personal Genome Machine™ (PGM) and Proton
sequencer acquisition data to produce read files containing high quality bases. This document provides an™overview of the software modules and concepts applied at various stages of the data processing.
Introduction
The Torrent Server Analysis Pipeline, the "Pipeline", processes raw acquisition data from a PGM™ or seqProton™uencer run, and outputs base calls in unmapped BAM file formats. The Torrent Browser provides a web interface tothe process, including many metrics, graphs, and reporting features derived from the Pipeline results.
The following figure shows a conceptual overview of the Pipeline:
The following sections provide additional, detailed information about the Analysis Pipeline modules that worktogether to convert the raw acquisition data into high-quality base calls and reads.
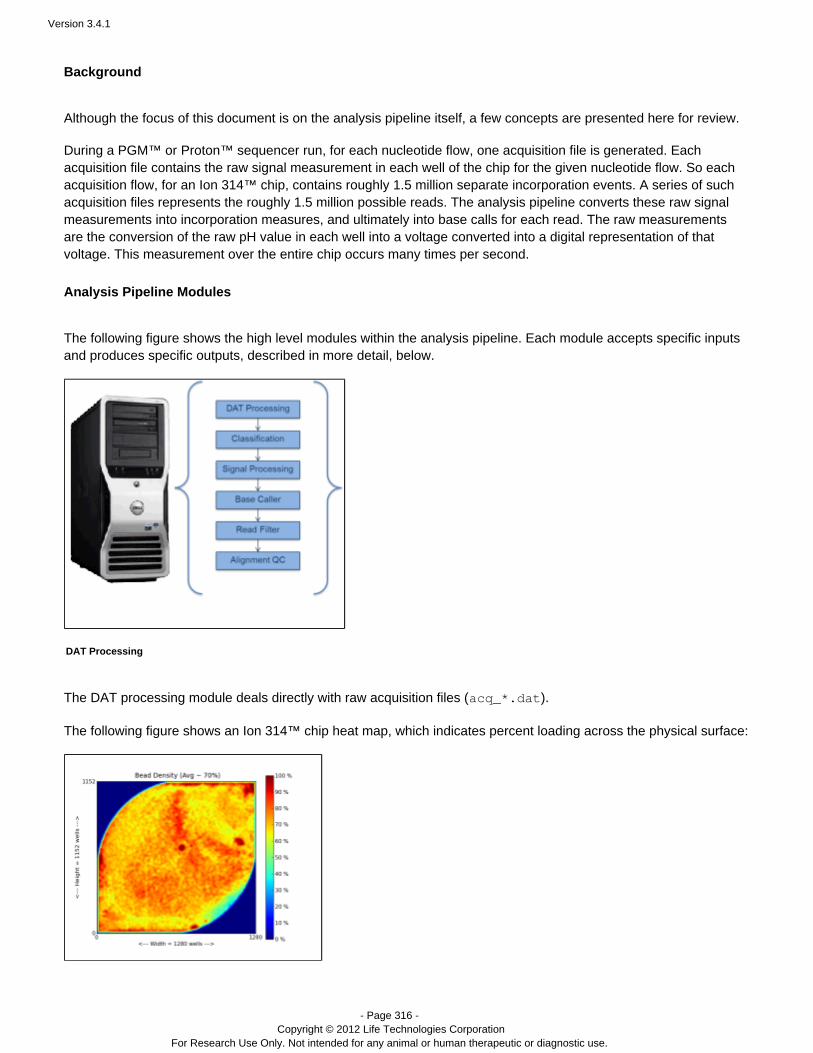
Version 3.4.1
- Page 316 - Copyright © 2012 Life Technologies Corporation
For Research Use Only. Not intended for any animal or human therapeutic or diagnostic use.
Background
Although the focus of this document is on the analysis pipeline itself, a few concepts are presented here for review.
During a PGM™ or sequencer run, for each nucleotide flow, one acquisition file is generated. EachProton™ acquisition file contains the raw signal measurement in each well of the chip for the given nucleotide flow. So eachacquisition flow, for an Ion 314™ chip, contains roughly 1.5 million separate incorporation events. A series of suchacquisition files represents the roughly 1.5 million possible reads. The analysis pipeline converts these raw signalmeasurements into incorporation measures, and ultimately into base calls for each read. The raw measurementsare the conversion of the raw pH value in each well into a voltage converted into a digital representation of thatvoltage. This measurement over the entire chip occurs many times per second.
Analysis Pipeline Modules
The following figure shows the high level modules within the analysis pipeline. Each module accepts specific inputsand produces specific outputs, described in more detail, below.
DAT Processing
The DAT processing module deals directly with raw acquisition files ( ).acq_*.dat
The following figure shows an Ion 314™ chip heat map, which indicates percent loading across the physical surface:
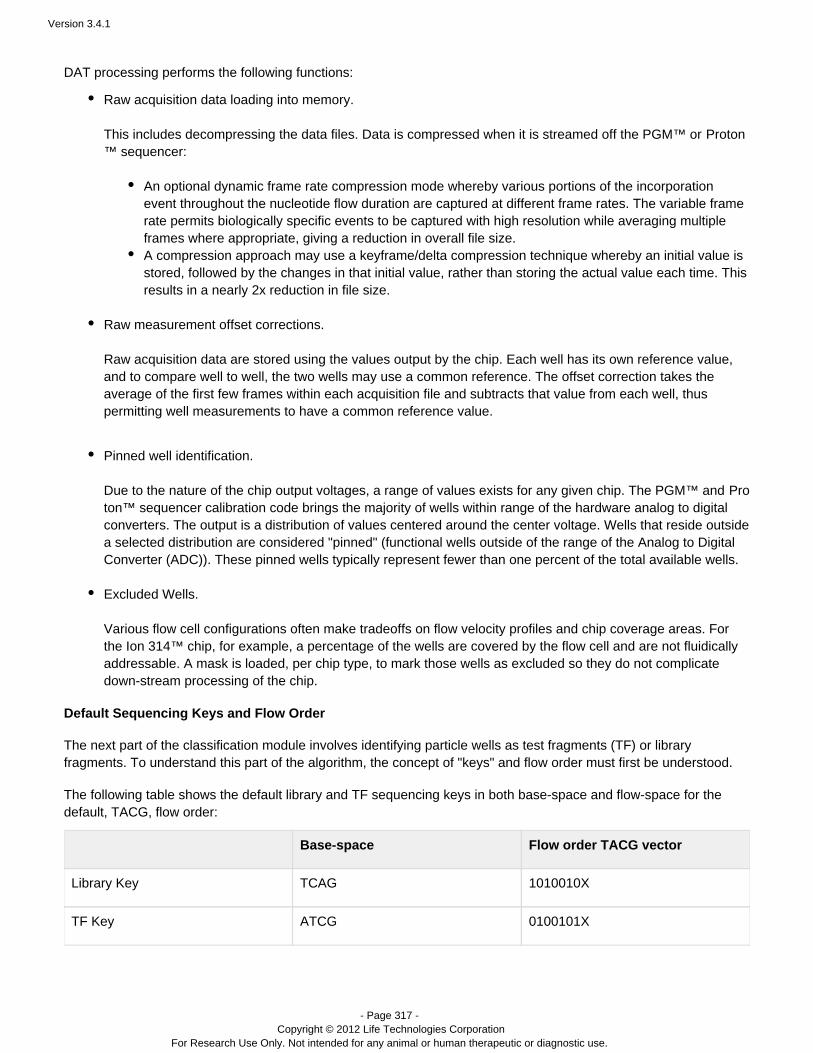
Version 3.4.1
- Page 317 - Copyright © 2012 Life Technologies Corporation
For Research Use Only. Not intended for any animal or human therapeutic or diagnostic use.
DAT processing performs the following functions:
Raw acquisition data loading into memory. This includes decompressing the data files. Data is compressed when it is streamed off the PGM™ or Proton
sequencer:™
An optional dynamic frame rate compression mode whereby various portions of the incorporationevent throughout the nucleotide flow duration are captured at different frame rates. The variable framerate permits biologically specific events to be captured with high resolution while averaging multipleframes where appropriate, giving a reduction in overall file size.A compression approach may use a keyframe/delta compression technique whereby an initial value isstored, followed by the changes in that initial value, rather than storing the actual value each time. Thisresults in a nearly 2x reduction in file size.
Raw measurement offset corrections. Raw acquisition data are stored using the values output by the chip. Each well has its own reference value,and to compare well to well, the two wells may use a common reference. The offset correction takes theaverage of the first few frames within each acquisition file and subtracts that value from each well, thuspermitting well measurements to have a common reference value.
Pinned well identification. Due to the nature of the chip output voltages, a range of values exists for any given chip. The PGM™ and Pro
sequencer calibration code brings the majority of wells within range of the hardware analog to digitalton™ converters. The output is a distribution of values centered around the center voltage. Wells that reside outsidea selected distribution are considered "pinned" (functional wells outside of the range of the Analog to DigitalConverter (ADC)). These pinned wells typically represent fewer than one percent of the total available wells. Excluded Wells. Various flow cell configurations often make tradeoffs on flow velocity profiles and chip coverage areas. Forthe Ion 314™ chip, for example, a percentage of the wells are covered by the flow cell and are not fluidicallyaddressable. A mask is loaded, per chip type, to mark those wells as excluded so they do not complicatedown-stream processing of the chip.
Default Sequencing Keys and Flow Order
The next part of the classification module involves identifying particle wells as test fragments (TF) or libraryfragments. To understand this part of the algorithm, the concept of "keys" and flow order must first be understood.
The following table shows the default library and TF sequencing keys in both base-space and flow-space for thedefault, TACG, flow order:
Base-space Flow order TACG vector
Library Key TCAG 1010010X
TF Key ATCG 0100101X

Version 3.4.1
- Page 318 - Copyright © 2012 Life Technologies Corporation
For Research Use Only. Not intended for any animal or human therapeutic or diagnostic use.
The "X" in the vector column indicates that the value is at least a one, but could in fact be higher because the nextbase after the key could also match, thus creating a longer homopolymer.
Classification
Classification is the process of determining the contents of each well on the chip. The primary purpose ofclassification is to determine which wells contain particles with template for sequencing and which wells are emptyfor use in background estimation during signal processing. The figure below illustrates the nested classes ofclassification.
A well can either be empty, contain a particle or be flagged as an outlier. Wells are flagged as outliers if they do notappear to be responding appropriately to the nucleotide, are not fitting the model well or are wells marked empty thatappear to be buffering. For wells containing a particle, the process additionally determines if the particle is:
A library particle.A test fragment (control) particle.A dud particle (a particle that does not produce a sufficiently strong sequence signal).
It is important to note at this point that classification is not simply processing the entire chip as one group. As ismentioned for other pipeline modules, the chip is processed in smaller regions. An Ion 314™ chip, for example, isdivided into on the order of 50x50 well regions, resulting in about 625 total regions. This enables processing manysmall regions in parallel and taking advantage of multi-core/multi-process compute nodes that have suchcapabilities. More importantly, regions in the chip are processed that contain fluidically similar wells, where smallerregions tend to be relatively homogeneous and facilitate comparing wells to each other within a region.
Key Classification
Each well is checked to see if it is producing sequence that matches any one of the keys. A model is fit and the keywith the best fit is assigned to that well. If no key has a high enough score then the well is not assigned to the liveclassification and will not be processed downstream.
With the default keys and flow order, above, there are two vectors in flow space:
Nuc Flow: TACGTACGLibrary: 1010010Test Frag: 0100101
Each key is tested to see if it fits the expected behavior of similar signals in the 1mer flows and no signal in the 0mer
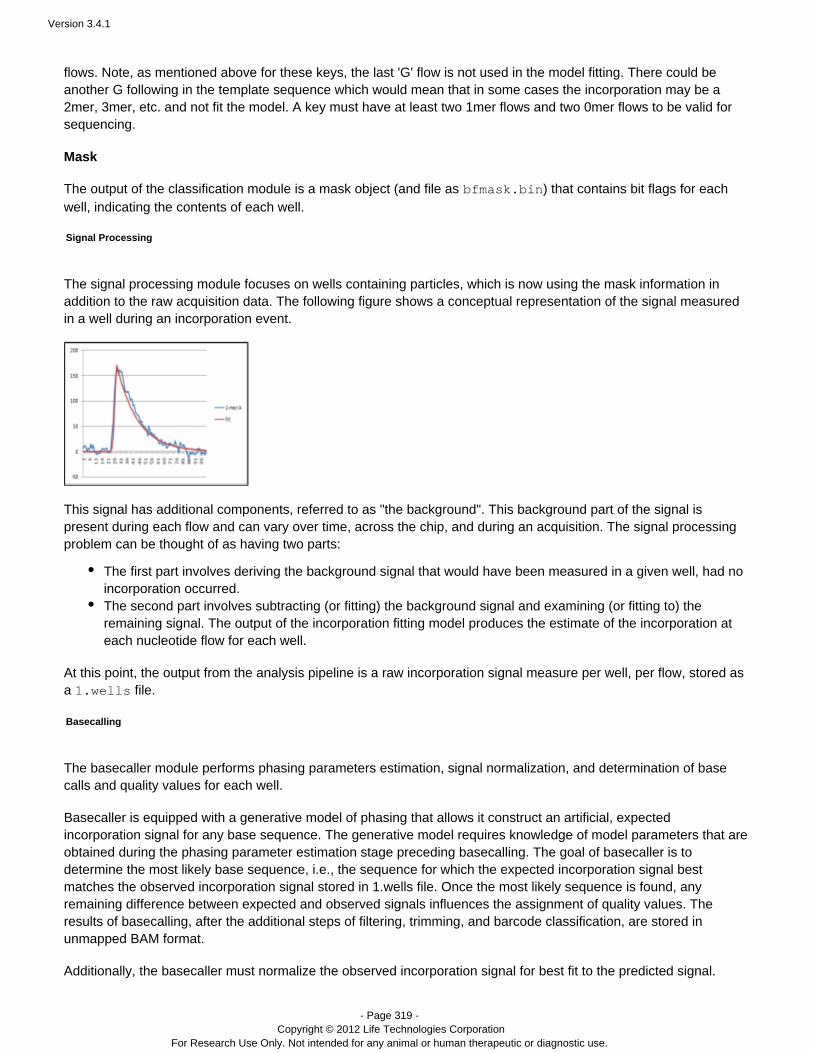
Version 3.4.1
- Page 319 - Copyright © 2012 Life Technologies Corporation
For Research Use Only. Not intended for any animal or human therapeutic or diagnostic use.
flows. Note, as mentioned above for these keys, the last 'G' flow is not used in the model fitting. There could beanother G following in the template sequence which would mean that in some cases the incorporation may be a2mer, 3mer, etc. and not fit the model. A key must have at least two 1mer flows and two 0mer flows to be valid forsequencing.
Mask
The output of the classification module is a mask object (and file as ) that contains bit flags for eachbfmask.bin
well, indicating the contents of each well.
Signal Processing
The signal processing module focuses on wells containing particles, which is now using the mask information inaddition to the raw acquisition data. The following figure shows a conceptual representation of the signal measuredin a well during an incorporation event.
This signal has additional components, referred to as "the background". This background part of the signal ispresent during each flow and can vary over time, across the chip, and during an acquisition. The signal processingproblem can be thought of as having two parts:
The first part involves deriving the background signal that would have been measured in a given well, had noincorporation occurred.The second part involves subtracting (or fitting) the background signal and examining (or fitting to) theremaining signal. The output of the incorporation fitting model produces the estimate of the incorporation ateach nucleotide flow for each well.
At this point, the output from the analysis pipeline is a raw incorporation signal measure per well, per flow, stored asa file.1.wells
Basecalling
The basecaller module performs phasing parameters estimation, signal normalization, and determination of basecalls and quality values for each well.
Basecaller is equipped with a generative model of phasing that allows it construct an artificial, expectedincorporation signal for any base sequence. The generative model requires knowledge of model parameters that areobtained during the phasing parameter estimation stage preceding basecalling. The goal of basecaller is todetermine the most likely base sequence, i.e., the sequence for which the expected incorporation signal bestmatches the observed incorporation signal stored in 1.wells file. Once the most likely sequence is found, anyremaining difference between expected and observed signals influences the assignment of quality values. Theresults of basecalling, after the additional steps of filtering, trimming, and barcode classification, are stored inunmapped BAM format.
Additionally, the basecaller must normalize the observed incorporation signal for best fit to the predicted signal.
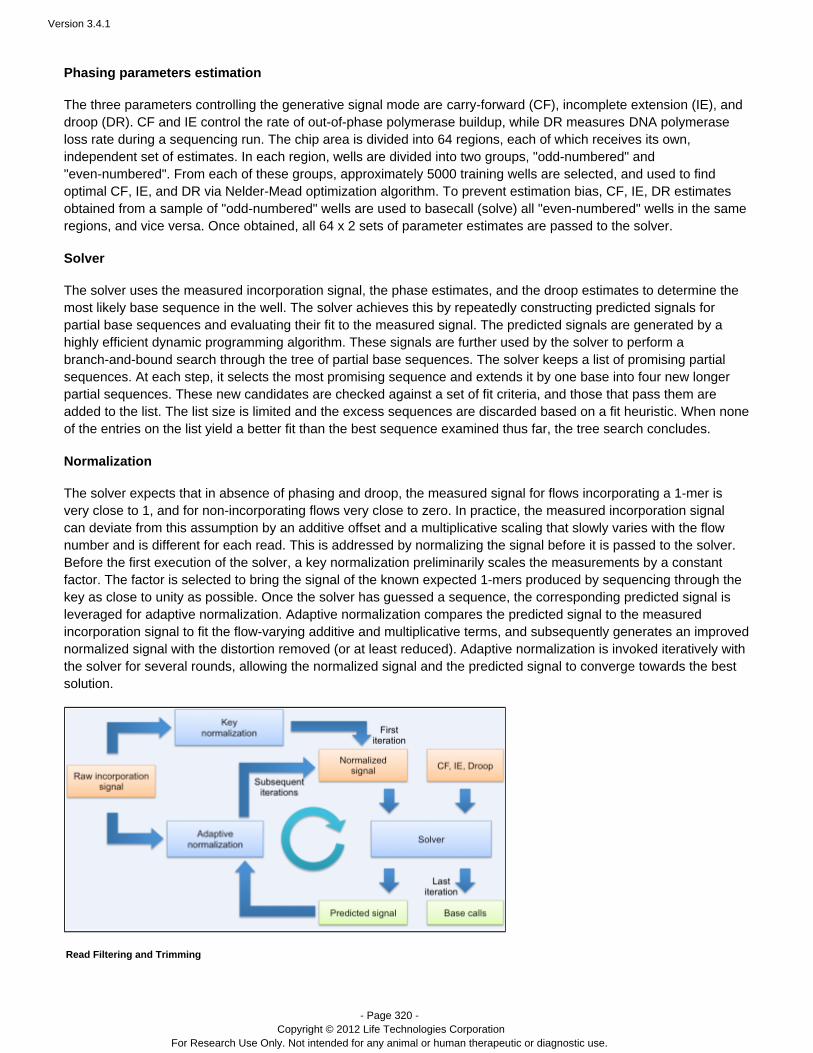
Version 3.4.1
- Page 320 - Copyright © 2012 Life Technologies Corporation
For Research Use Only. Not intended for any animal or human therapeutic or diagnostic use.
Phasing parameters estimation
The three parameters controlling the generative signal mode are carry-forward (CF), incomplete extension (IE), and DNA polymerasedroop (DR). CF and IE control the rate of out-of-phase polymerase buildup, while DR measures
loss rate during a sequencing run. The chip area is divided into 64 regions, each of which receives its own,independent set of estimates. In each region, wells are divided into two groups, "odd-numbered" and"even-numbered". From each of these groups, approximately 5000 training wells are selected, and used to findoptimal CF, IE, and DR via Nelder-Mead optimization algorithm. To prevent estimation bias, CF, IE, DR estimatesobtained from a sample of "odd-numbered" wells are used to basecall (solve) all "even-numbered" wells in the sameregions, and vice versa. Once obtained, all 64 x 2 sets of parameter estimates are passed to the solver.
Solver
The solver uses the measured incorporation signal, the phase estimates, and the droop estimates to determine themost likely base sequence in the well. The solver achieves this by repeatedly constructing predicted signals forpartial base sequences and evaluating their fit to the measured signal. The predicted signals are generated by ahighly efficient dynamic programming algorithm. These signals are further used by the solver to perform abranch-and-bound search through the tree of partial base sequences. The solver keeps a list of promising partialsequences. At each step, it selects the most promising sequence and extends it by one base into four new longerpartial sequences. These new candidates are checked against a set of fit criteria, and those that pass them areadded to the list. The list size is limited and the excess sequences are discarded based on a fit heuristic. When noneof the entries on the list yield a better fit than the best sequence examined thus far, the tree search concludes.
Normalization
The solver expects that in absence of phasing and droop, the measured signal for flows incorporating a 1-mer isvery close to 1, and for non-incorporating flows very close to zero. In practice, the measured incorporation signalcan deviate from this assumption by an additive offset and a multiplicative scaling that slowly varies with the flownumber and is different for each read. This is addressed by normalizing the signal before it is passed to the solver.Before the first execution of the solver, a key normalization preliminarily scales the measurements by a constantfactor. The factor is selected to bring the signal of the known expected 1-mers produced by sequencing through thekey as close to unity as possible. Once the solver has guessed a sequence, the corresponding predicted signal isleveraged for adaptive normalization. Adaptive normalization compares the predicted signal to the measuredincorporation signal to fit the flow-varying additive and multiplicative terms, and subsequently generates an improvednormalized signal with the distortion removed (or at least reduced). Adaptive normalization is invoked iteratively withthe solver for several rounds, allowing the normalized signal and the predicted signal to converge towards the bestsolution.
Read Filtering and Trimming
Version 3.4.1
- Page 321 - Copyright © 2012 Life Technologies Corporation
For Research Use Only. Not intended for any animal or human therapeutic or diagnostic use.
Read filtering involves generation of various quality metrics for each base call, quality metrics for each read, andusing those metrics to filter out low quality reads and trim reads back to acceptable quality levels. Additionally,adapter trimming is performed on the ends of each read.
See:
Technical Note - Filtering and TrimmingTechnical Note - Quality Score
Per-base Quality Scoring
Per-base quality scores are assigned to each read, and written to the unmapped BAM file along with the read itself.The per-base quality scores are assigned by calculating various metrics for the read and using those metrics aslookup indexes into a pre-defined quality lookup table established through prior system training. The metrics ofteninvolve estimates of accuracy at the current base, flow, and earlier or later bases or flows for each read.
Filtering
Filtering reads involves calculating an overall quality metric representing the basecaller capability to accuratelycorrect and base call the raw signals. Reads that have calculated low quality are not written to the unmapped BAMfile. Low quality reads are typically mixed reads or very low copy-count reads that produce low quality sequencesuch that they do not fit the expected incorporation model.
Quality and Adapter Trimming
Using processing algorithms, a read can be trimmed back until an acceptable level of quality persists for the entireread. A read is also examined to determine if the B-Primer adapter sequence or a portion thereof can be identifiedwith high confidence within the read. If a matching sequence is found, the read is trimmed to the base immediatelyprior to the start of the adapter.
Alignment QC
The alignment QC stage involves alignment of reads produced by the pipeline to a reference genome, andextracting metrics from those alignments. Currently, the TMAP aligner is used to align reads. As inputs to thealigner, some or all of the reads produced in the pipeline are used, along with the reference genome and index files.The output is a BAM file. This output BAM file is processed to extract various quality metrics, including estimates ofQ20 bases, estimates of number of reads at or above 100Q20. The results of the Alignment QC module areviewable using the Torrent Browser web interface in the summary page. The key output component is theReportsBAM file.
Data Files Produced
See for a listing of the files output at each stage or module, along with their expected size forQuickstart On Dataflowtypical runs.
Technical Note - Base Recalibration
Technical Note
Base Recalibration
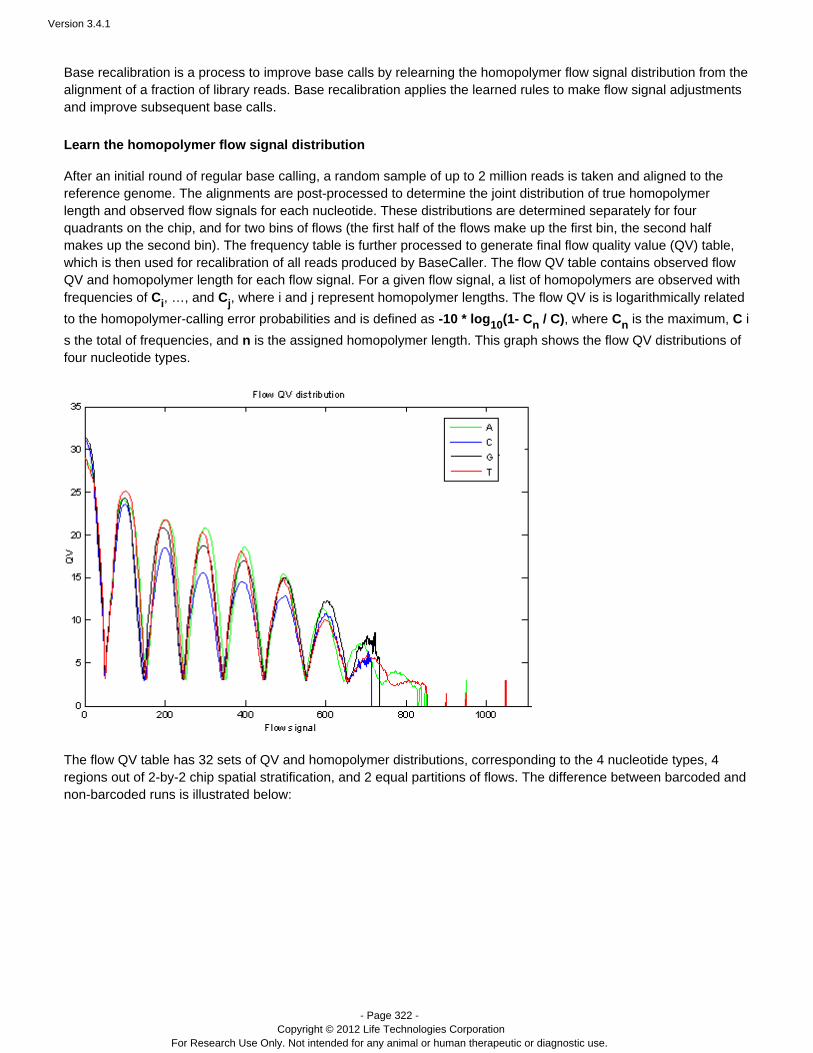
Version 3.4.1
- Page 322 - Copyright © 2012 Life Technologies Corporation
For Research Use Only. Not intended for any animal or human therapeutic or diagnostic use.
Base recalibration is a process to learning the homopolymer flow signal distribution from theimprove base calls by realignment of a fraction of library reads. Base recalibration applies the learned rules to make flow signal adjustmentsand . improve subsequent base calls
Learn the homopolymer flow signal distribution
After an initial round of regular base calling, a random sample of up to 2 million reads is taken and aligned to thereference genome. The alignments are post-processed to determine the joint distribution of true homopolymerlength and observed flow signals for each nucleotide. These distributions are determined separately for fourquadrants on the chip, and for two bins of flows (the first half of the flows make up the first bin, the second halfmakes up the second bin). The frequency table is further processed to generate final flow quality value (QV) table,which is then used for recalibration of all reads produced by BaseCaller. The flow QV table contains observed flowQV and homopolymer length for each flow signal. For a given flow signal, a list of homopolymers are observed withfrequencies of , …, and , where and represent homopolymer lengths. The flow QV is is logarithmically relatedCi Cj i j
to the homopolymer-calling error probabilities and is defined as , where is the maximum, i-10 * log (1- / )10 Cn C Cn C
s the total of frequencies, and is the assigned homopolymer length. This graph shows the flow QV distributions ofnfour nucleotide types.
The flow QV table has 32 sets of QV and homopolymer distributions, corresponding to the 4 nucleotide types, 4regions out of 2-by-2 chip spatial stratification, and 2 equal partitions of flows. The difference between barcoded andnon-barcoded runs is illustrated below:
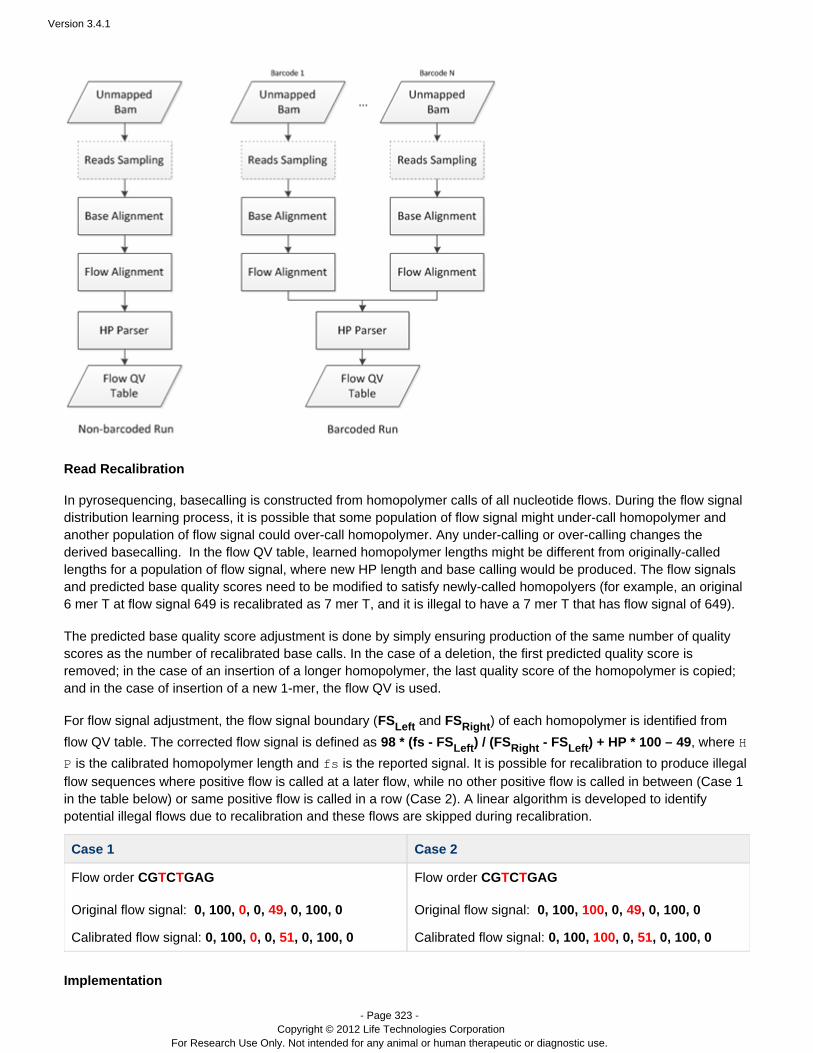
Version 3.4.1
- Page 323 - Copyright © 2012 Life Technologies Corporation
For Research Use Only. Not intended for any animal or human therapeutic or diagnostic use.
Read Recalibration
In pyrosequencing, basecalling is constructed from homopolymer calls of all nucleotide flows. During the flow signaldistribution learning process, it is possible that some population of flow signal might under-call homopolymer andanother population of flow signal could over-call homopolymer. Any under-calling or over-calling changes thederived basecalling. In the flow QV table, learned homopolymer lengths might be different from originally-calledlengths for a population of flow signal, where new HP length and base calling would be produced. The flow signalsand predicted base quality scores need to be modified to satisfy newly-called homopolyers (for example, an original6 mer T at flow signal 649 is recalibrated as 7 mer T, and it is illegal to have a 7 mer T that has flow signal of 649).
The predicted base quality score adjustment is done by simply ensuring production of the same number of qualityscores as the number of recalibrated base calls. In the case of a deletion, the first predicted quality score isremoved; in the case of an insertion of a longer homopolymer, the last quality score of the homopolymer is copied;and in the case of insertion of a new 1-mer, the flow QV is used.
For flow signal adjustment, the flow signal boundary ( and ) of each homopolymer is identified fromFSLeft FSRightflow QV table. The corrected flow signal is defined as , where 98 * (fs - FS ) / (FS - FS ) + HP * 100 –Left Right Left 49 H
is the calibrated homopolymer length and is the reported signal. It is possible for recalibration to produce illegalP fs
flow sequences where positive flow is called at a later flow, while no other positive flow is called in between (Case 1in the table below) or same positive flow is called in a row (Case 2). A linear algorithm is developed to identifypotential illegal flows due to recalibration and these flows are skipped during recalibration.
Case 1 Case 2
Flow order CG C GAGT T
Original flow signal: 0, 100, , 0, , 0, 100, 00 49
Calibrated flow signal: 0, 100, , 0, , 0, 100, 0 0 51
Flow order CG C GAGT T
Original flow signal: 0, , , 0, , 0, 100, 0100 100 49
Calibrated flow signal: 0, , , 0, , 0, 100, 0100 100 51
Implementation
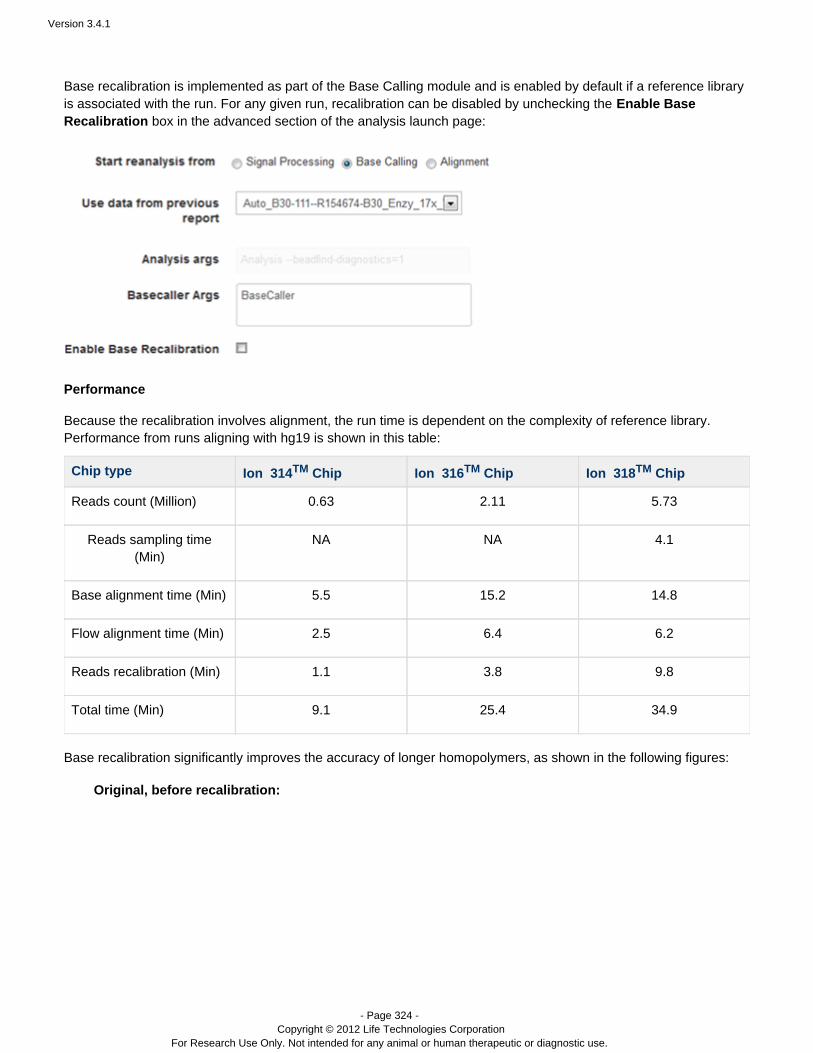
Version 3.4.1
- Page 324 - Copyright © 2012 Life Technologies Corporation
For Research Use Only. Not intended for any animal or human therapeutic or diagnostic use.
Base recalibration is implemented as part of the Base Calling module and is enabled by default if a reference libraryis associated with the run. For any given run, recalibration can be disabled by unchecking the Enable Base
box in the advanced section of the analysis launch page: Recalibration
Performance
Because the recalibration involves alignment, the run time is dependent on the complexity of reference library.Performance from runs aligning with hg19 is shown in this table:
Chip type Ion 314TM Chip Ion 316TM Chip Ion 318TM Chip
Reads count (Million) 0.63 2.11 5.73
Reads sampling time(Min)
NA NA 4.1
Base alignment time ( )Min 5.5 15.2 14.8
Flow alignment time ( )Min 2.5 6.4 6.2
Reads recalibration ( )Min 1.1 3.8 9.8
Total time ( )Min 9.1 25.4 34.9
Base recalibration significantly improves the accuracy of longer homopolymers, as shown in the following figures:
Original, before recalibration:
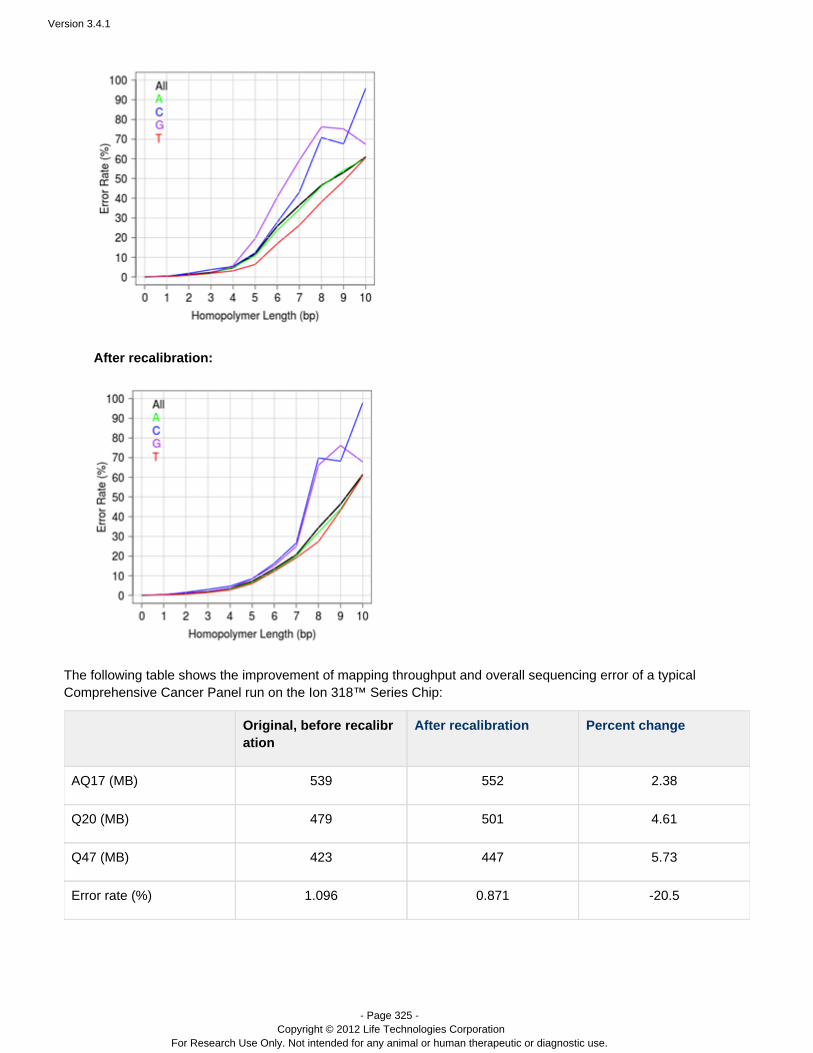
Version 3.4.1
- Page 325 - Copyright © 2012 Life Technologies Corporation
For Research Use Only. Not intended for any animal or human therapeutic or diagnostic use.
After recalibration:
The following table shows the improvement of mapping throughput and overall sequencing error of a typicalComprehensive Cancer Panel run on the Ion 318™ Series Chip:
Original, before recalibration
After recalibration Percent change
AQ17 (MB) 539 552 2.38
Q20 (MB) 479 501 4.61
Q47 (MB) 423 447 5.73
Error rate (%) 1.096 0.871 -20.5
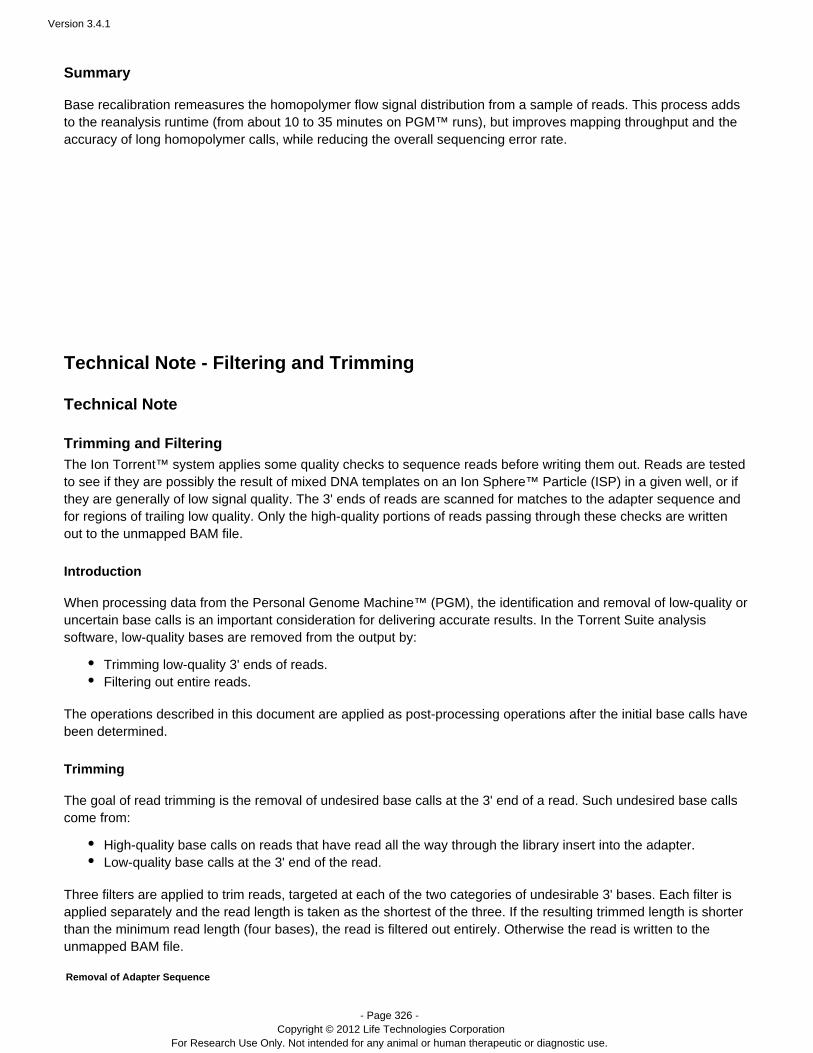
Version 3.4.1
- Page 326 - Copyright © 2012 Life Technologies Corporation
For Research Use Only. Not intended for any animal or human therapeutic or diagnostic use.
Summary
Base recalibration remeasures the homopolymer flow signal distribution from a sample of reads. This process addsto the reanalysis runtime (from about 10 to 35 minutes on PGM™ runs), but improves mapping throughput and the
while reducing the overall sequencing error rate.accuracy of long homopolymer calls,
Technical Note - Filtering and Trimming
Technical Note
Trimming and FilteringThe Ion Torrent™ system applies some quality checks to sequence reads before writing them out. Reads are testedto see if they are possibly the result of mixed DNA templates on an Ion Sphere™ Particle (ISP) in a given well, or ifthey are generally of low signal quality. The 3' ends of reads are scanned for matches to the adapter sequence andfor regions of trailing low quality. Only the high-quality portions of reads passing through these checks are writtenout to the unmapped BAM file.
Introduction
When processing data from the Personal Genome Machine™ (PGM), the identification and removal of low-quality oruncertain base calls is an important consideration for delivering accurate results. In the Torrent Suite analysissoftware, low-quality bases are removed from the output by:
Trimming low-quality 3' ends of reads.Filtering out entire reads.
The operations described in this document are applied as post-processing operations after the initial base calls havebeen determined.
Trimming
The goal of read trimming is the removal of undesired base calls at the 3' end of a read. Such undesired base callscome from:
High-quality base calls on reads that have read all the way through the library insert into the adapter.Low-quality base calls at the 3' end of the read.
Three filters are applied to trim reads, targeted at each of the two categories of undesirable 3' bases. Each filter isapplied separately and the read length is taken as the shortest of the three. If the resulting trimmed length is shorterthan the minimum read length (four bases), the read is filtered out entirely. Otherwise the read is written to theunmapped BAM file.
Removal of Adapter Sequence
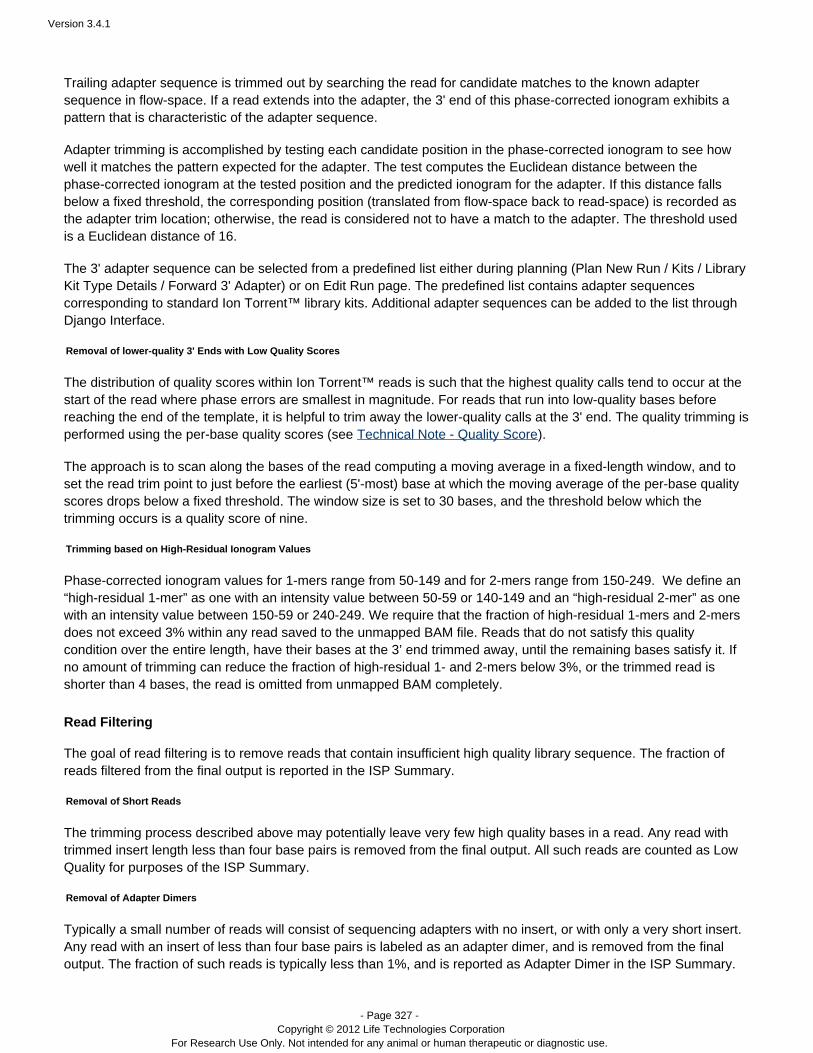
Version 3.4.1
- Page 327 - Copyright © 2012 Life Technologies Corporation
For Research Use Only. Not intended for any animal or human therapeutic or diagnostic use.
Trailing adapter sequence is trimmed out by searching the read for candidate matches to the known adaptersequence in flow-space. If a read extends into the adapter, the 3' end of this phase-corrected ionogram exhibits apattern that is characteristic of the adapter sequence.
Adapter trimming is accomplished by testing each candidate position in the phase-corrected ionogram to see howwell it matches the pattern expected for the adapter. The test computes the Euclidean distance between thephase-corrected ionogram at the tested position and the predicted ionogram for the adapter. If this distance fallsbelow a fixed threshold, the corresponding position (translated from flow-space back to read-space) is recorded asthe adapter trim location; otherwise, the read is considered not to have a match to the adapter. The threshold usedis a Euclidean distance of 16.
The 3' adapter sequence can be selected from a predefined list either during planning (Plan New Run / Kits / LibraryKit Type Details / Forward 3' Adapter) or on Edit Run page. The predefined list contains adapter sequencescorresponding to standard Ion Torrent™ library kits. Additional adapter sequences can be added to the list throughDjango Interface.
Removal of lower-quality 3' Ends with Low Quality Scores
The distribution of quality scores within Ion Torrent™ reads is such that the highest quality calls tend to occur at thestart of the read where phase errors are smallest in magnitude. For reads that run into low-quality bases beforereaching the end of the template, it is helpful to trim away the lower-quality calls at the 3' end. The quality trimming isperformed using the per-base quality scores (see ).Technical Note - Quality Score
The approach is to scan along the bases of the read computing a moving average in a fixed-length window, and toset the read trim point to just before the earliest (5'-most) base at which the moving average of the per-base qualityscores drops below a fixed threshold. The window size is set to 30 bases, and the threshold below which thetrimming occurs is a quality score of nine.
Trimming based on High-Residual Ionogram Values
Phase-corrected ionogram values for 1-mers range from 50-149 and for 2-mers range from 150-249. We define an“high-residual 1-mer” as one with an intensity value between 50-59 or 140-149 and an “high-residual 2-mer” as onewith an intensity value between 150-59 or 240-249. We require that the fraction of high-residual 1-mers and 2-mersdoes not exceed 3% within any read saved to the unmapped BAM file. Reads that do not satisfy this qualitycondition over the entire length, have their bases at the 3’ end trimmed away, until the remaining bases satisfy it. Ifno amount of trimming can reduce the fraction of high-residual 1- and 2-mers below 3%, or the trimmed read isshorter than 4 bases, the read is omitted from unmapped BAM completely.
Read Filtering
The goal of read filtering is to remove reads that contain insufficient high quality library sequence. The fraction ofreads filtered from the final output is reported in the ISP Summary.
Removal of Short Reads
The trimming process described above may potentially leave very few high quality bases in a read. Any read withtrimmed insert length less than four base pairs is removed from the final output. All such reads are counted as LowQuality for purposes of the ISP Summary.
Removal of Adapter Dimers
Typically a small number of reads will consist of sequencing adapters with no insert, or with only a very short insert.Any read with an insert of less than four base pairs is labeled as an adapter dimer, and is removed from the finaloutput. The fraction of such reads is typically less than 1%, and is reported as Adapter Dimer in the ISP Summary.
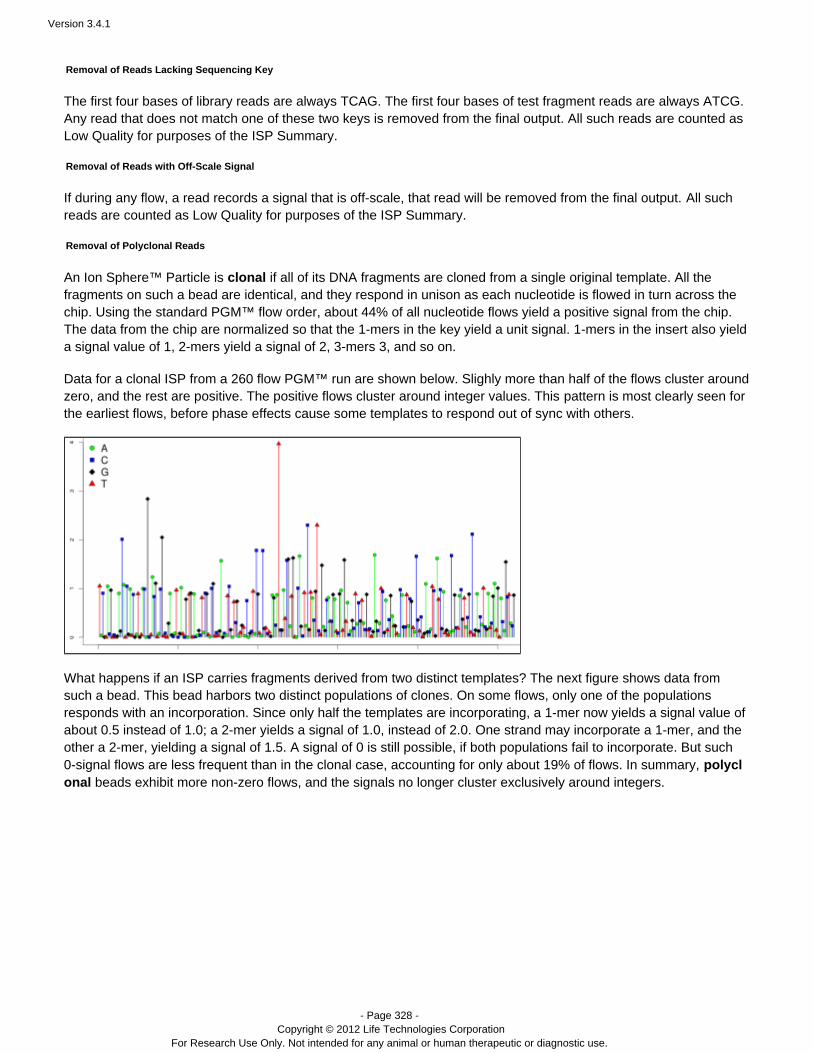
Version 3.4.1
- Page 328 - Copyright © 2012 Life Technologies Corporation
For Research Use Only. Not intended for any animal or human therapeutic or diagnostic use.
Removal of Reads Lacking Sequencing Key
The first four bases of library reads are always TCAG. The first four bases of test fragment reads are always ATCG.Any read that does not match one of these two keys is removed from the final output. All such reads are counted asLow Quality for purposes of the ISP Summary.
Removal of Reads with Off-Scale Signal
If during any flow, a read records a signal that is off-scale, that read will be removed from the final output. All suchreads are counted as Low Quality for purposes of the ISP Summary.
Removal of Polyclonal Reads
An Ion Sphere™ Particle is clonal if all of its DNA fragments are cloned from a single original template. All thefragments on such a bead are identical, and they respond in unison as each nucleotide is flowed in turn across thechip. Using the standard PGM™ flow order, about 44% of all nucleotide flows yield a positive signal from the chip.The data from the chip are normalized so that the 1-mers in the key yield a unit signal. 1-mers in the insert also yielda signal value of 1, 2-mers yield a signal of 2, 3-mers 3, and so on.
Data for a clonal ISP from a 260 flow PGM™ run are shown below. Slighly more than half of the flows cluster aroundzero, and the rest are positive. The positive flows cluster around integer values. This pattern is most clearly seen forthe earliest flows, before phase effects cause some templates to respond out of sync with others.
What happens if an ISP carries fragments derived from two distinct templates? The next figure shows data fromsuch a bead. This bead harbors two distinct populations of clones. On some flows, only one of the populationsresponds with an incorporation. Since only half the templates are incorporating, a 1-mer now yields a signal value ofabout 0.5 instead of 1.0; a 2-mer yields a signal of 1.0, instead of 2.0. One strand may incorporate a 1-mer, and theother a 2-mer, yielding a signal of 1.5. A signal of 0 is still possible, if both populations fail to incorporate. But such0-signal flows are less frequent than in the clonal case, accounting for only about 19% of flows. In summary, polycl
onal beads exhibit more non-zero flows, and the signals no longer cluster exclusively around integers.
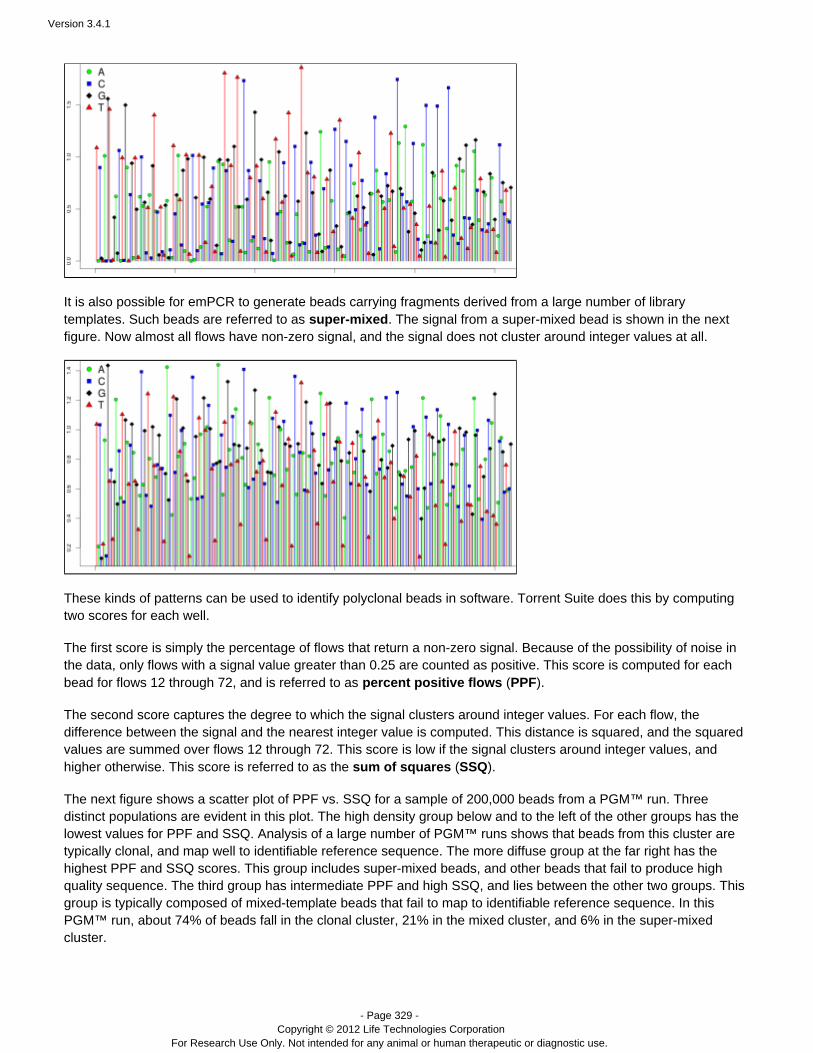
Version 3.4.1
- Page 329 - Copyright © 2012 Life Technologies Corporation
For Research Use Only. Not intended for any animal or human therapeutic or diagnostic use.
It is also possible for emPCR to generate beads carrying fragments derived from a large number of librarytemplates. Such beads are referred to as super-mixed. The signal from a super-mixed bead is shown in the nextfigure. Now almost all flows have non-zero signal, and the signal does not cluster around integer values at all.
These kinds of patterns can be used to identify polyclonal beads in software. Torrent Suite does this by computingtwo scores for each well.
The first score is simply the percentage of flows that return a non-zero signal. Because of the possibility of noise inthe data, only flows with a signal value greater than 0.25 are counted as positive. This score is computed for eachbead for flows 12 through 72, and is referred to as percent positive flows (PPF).
The second score captures the degree to which the signal clusters around integer values. For each flow, thedifference between the signal and the nearest integer value is computed. This distance is squared, and the squaredvalues are summed over flows 12 through 72. This score is low if the signal clusters around integer values, andhigher otherwise. This score is referred to as the sum of squares (SSQ).
The next figure shows a scatter plot of PPF vs. SSQ for a sample of 200,000 beads from a PGM™ run. Threedistinct populations are evident in this plot. The high density group below and to the left of the other groups has thelowest values for PPF and SSQ. Analysis of a large number of PGM™ runs shows that beads from this cluster aretypically clonal, and map well to identifiable reference sequence. The more diffuse group at the far right has thehighest PPF and SSQ scores. This group includes super-mixed beads, and other beads that fail to produce highquality sequence. The third group has intermediate PPF and high SSQ, and lies between the other two groups. Thisgroup is typically composed of mixed-template beads that fail to map to identifiable reference sequence. In thisPGM™ run, about 74% of beads fall in the clonal cluster, 21% in the mixed cluster, and 6% in the super-mixedcluster.
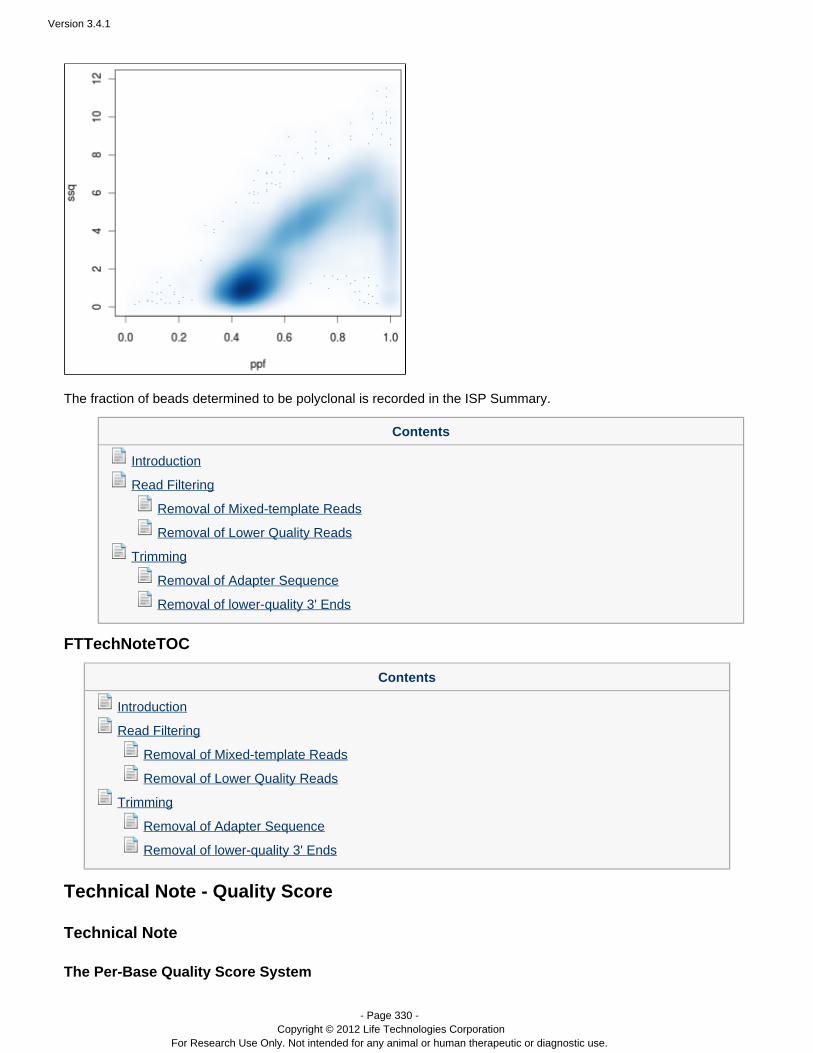
Version 3.4.1
- Page 330 - Copyright © 2012 Life Technologies Corporation
For Research Use Only. Not intended for any animal or human therapeutic or diagnostic use.
The fraction of beads determined to be polyclonal is recorded in the ISP Summary.
Contents
Introduction
Read Filtering
Removal of Mixed-template Reads
Removal of Lower Quality Reads
Trimming
Removal of Adapter Sequence
Removal of lower-quality 3' Ends
FTTechNoteTOC
Contents
Introduction
Read Filtering
Removal of Mixed-template Reads
Removal of Lower Quality Reads
Trimming
Removal of Adapter Sequence
Removal of lower-quality 3' Ends
Technical Note - Quality Score
Technical Note
The Per-Base Quality Score System
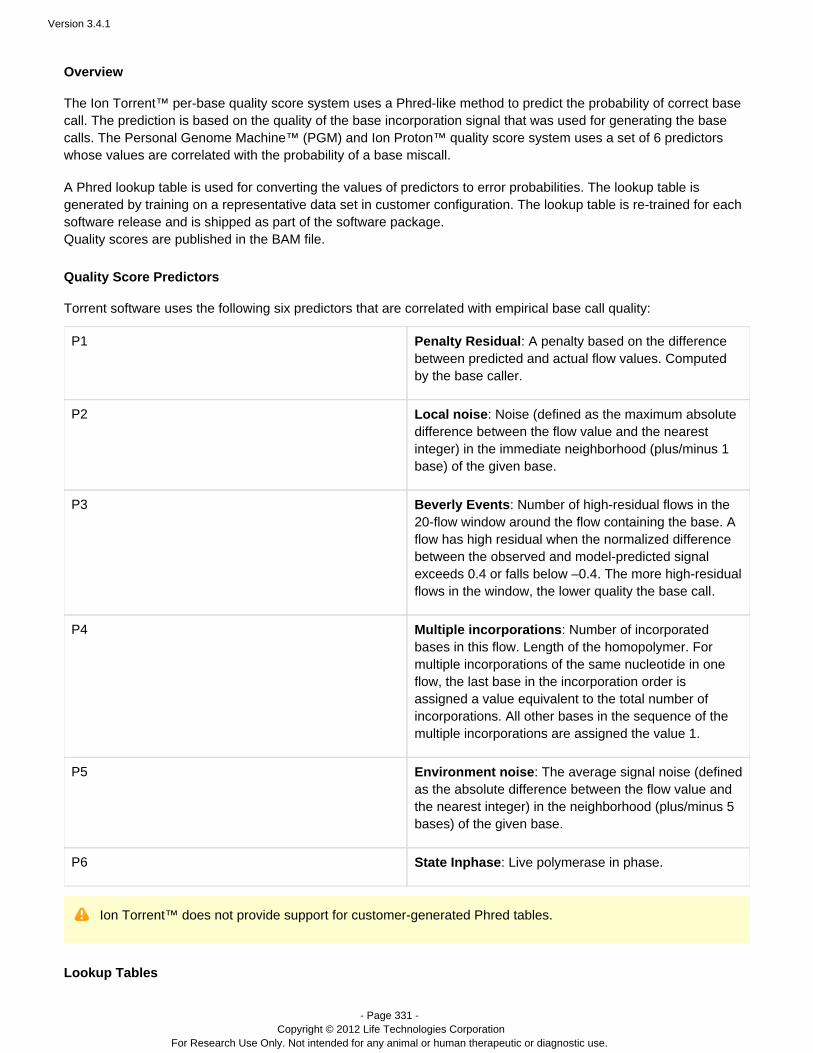
Version 3.4.1
- Page 331 - Copyright © 2012 Life Technologies Corporation
For Research Use Only. Not intended for any animal or human therapeutic or diagnostic use.
Overview
The Ion Torrent per-base quality score system uses a Phred-like method to predict the probability of correct base™call. The prediction is based on the quality of the base incorporation signal that was used for generating the basecalls. The Personal Genome Machine™ (PGM) and Ion Proton™ quality score system uses a set of 6 predictorswhose values are correlated with the probability of a base miscall.
A Phred lookup table is used for converting the values of predictors to error probabilities. The lookup table isgenerated by training on a representative data set in customer configuration. The lookup table is re-trained for eachsoftware release and is shipped as part of the software package.Quality scores are published in the BAM file.
Quality Score Predictors
Torrent software uses the following six predictors that are correlated with empirical base call quality:
P1 Penalty Residual: A penalty based on the differencebetween predicted and actual flow values. Computedby the base caller.
P2 Local noise: Noise (defined as the maximum absolutedifference between the flow value and the nearestinteger) in the immediate neighborhood (plus/minus 1base) of the given base.
P3 Beverly Events: Number of high-residual flows in the20-flow window around the flow containing the base. Aflow has high residual when the normalized differencebetween the observed and model-predicted signalexceeds 0.4 or falls below –0.4. The more high-residual
.flows in the window, the lower quality the base call
P4 Multiple incorporations: Number of incorporatedbases in this flow. Length of the homopolymer. Formultiple incorporations of the same nucleotide in oneflow, the last base in the incorporation order isassigned a value equivalent to the total number ofincorporations. All other bases in the sequence of themultiple incorporations are assigned the value 1.
P5 Environment noise: The average signal noise (definedas the absolute difference between the flow value andthe nearest integer) in the neighborhood (plus/minus 5bases) of the given base.
P6 State Inphase: Live polymerase in phase.
Ion Torrent does not provide support for customer-generated Phred tables.™
Lookup Tables
Version 3.4.1
- Page 332 - Copyright © 2012 Life Technologies Corporation
For Research Use Only. Not intended for any animal or human therapeutic or diagnostic use.
1.
2.
3.
The six quality predictors are calculated for each base. Other predictors (not described here) are computed from thecorrected flow values generated by the base caller.
The corresponding per-base quality value is located by finding the first line in the lookup table for which all sixcalculated predictors are less than or equal to the predictor values in the table. This process occurs automatically aspart of the standard analysis.
The Phred lookup tables are stored in the directory on Torrent Server. The Torrent Server/opt/ion/config
supports separate phred tables for each type of chip (Ion 314™ chip, Ion 316™ chip, Ion 318™ chip, and Ion900™), named , , and phredTable.txt_314 phredTable.txt_316 phredTable.txt_318 phredTable.txt
respectively._900
Results
The per-base quality along with all other read information is written to the unmapped BAM file. The per-base quality The quality scores are on a phred scale.scores are reported in the QUAL field. -10*log_10(error rate)
References
Brockman et al. (2008): "Quality scores and SNP detection in sequencing-by-synthesis systems." GenomeRes. 18: 763-770.ReferencesEwing B, Hillier L, Wendl MC, Green P. (1998): "Base-calling of automated sequencer traces using phred. I.Accuracy assessment." Genome Res. 8(3):175-185.Ewing B, Green P. (1998): "Base-calling of automated sequencer traces using phred. II. Error probabilities."Genome Res. 8(3):186-194.
Technical Note - TMAP Alignment
Technical Note
TMAP: The Torrent Mapping Alignment Program for Ion Torrent™A mapping software program, called Torrent Mapping Alignment Program (TMAP), has been developed to meet IonTorrent data mapping challenges.™
Background
Sequence alignment is a critical component of any project utilizing next generation sequencing technologies. Thereare many options for alignment software, each optimized for specific sequencing platforms and downstreamapplications. The Ion Torrent data have particular qualities requiring special consideration during the alignment™process:
Reads generated by the PGM™ Sequencer are variable length and are expected to increase over time.The principal error mode associated with Ion data relates to miscalling homopolymer lengths and results ininsertion or deletion errors during alignment and post-processing.
TMAP is part of Torrent Suite on Torrent Server and is used for alignment in the primary analysis pipeline. TheTMAP source code is available on the Torrent Dev community Web site under the GPLv2 license, and can becompiled on any standard *nix system for use outside the Torrent Server primary analysis pipeline.
Implementation
TMAP integrates three popular and one novel alignment algorithms:
BWA-short (Li and Durbin, 2009)
Version 3.4.1
- Page 333 - Copyright © 2012 Life Technologies Corporation
For Research Use Only. Not intended for any animal or human therapeutic or diagnostic use.
BWA-long (Li and Durbin, 2010)SSAHA (Ning et al, 2001)Super-maximal Exact Matching (Li 2012)
These provide a fast and accurate aligner.
The overall alignment strategy identifies a list of Candidate Mapping Locations (CMLs) using a subset of the abovealgorithms. These CMLs are then aligned using the Smith Waterman algorithm (Smith and Waterman, 1981). Theresulting alignments are aggregated to find the best mapping(s), and a user-defined parameter determines if allalignments, a subset of alignments, or a random best alignment is reported.
TMAP creates an efficient index using the compressed suffix array to quickly and compactly index and query thegenome reference. Index creation occurs for both the forward and reverse references, which benefits somealignment algorithms, resulting in a final index size of 4.7GB for a human hg19 reference and taking less than fourhours to create.
For these evaluations, a Mac Pro running Mac OS X (10.6.6) with a dual 6-core Intel Xeon Processors(2.66GHz) and 32GB of 1066 MHz DDR RAM was used. Up to 24-threads could be used because of thehyper-threading capability of these processors.
TMAP implements a two-stage mapping approach to maintain sensitivity and specificity while significantly reducingruntime. In two-stage mapping, reads that do not align during the first stage are passed to the second stage with anew set of algorithms and/or parameters.
The implementation also supports easy integration of other mapping algorithms that can utilize the TMAP index.
Advantages
TMAP has key advantages over other alignment tools:
The re-implemented versions of BWA-short, BWA-long, and SSAHA are significantly optimized to deal withvaried length reads and Ion Torrent Systems . Therefore, TMAP results areerror profiles specific to ™expected to perform significantly better when compared against the original algorithms. When you run TMAP,you can use all the algorithms, a subset, or only one algorithm, for greater flexibility, efficiency, and accuracy.Because TMAP can combine the CMLs for all three methods and identifies the best alignment, the finalaccuracy and specificity benefit from the advantages of each individual algorithm. Nonetheless, eachalgorithm is optimized and can be used on its own.TMAP has been optimized for performance and, because the TMAP index is shared between all algorithms,the overall performance (both CPU load and RAM utilization) is comparable to other popular alignmentsoftware. The performance when combining multiple algorithms is equal to or better than the totalperformance of running each algorithm, separately.With a framework that quickly integrates other algorithms, TMAP is a versatile tool for fast and accuratemapping of Ion Torrent data.™
Best Practices
The current algorithm recommended is . This algorithm runs quickly while maintaining a high degree ofmap4sensitivity and specificity. For maximum sensitivity and specificity at the cost of running time, utilizing all algorithmsor a subset is recommended. For maximum speed, it is recommended to use the algorithm with the optimap4 stageon --stage-seed-freq-cutoff=0.1.
References
Version 3.4.1
- Page 334 - Copyright © 2012 Life Technologies Corporation
For Research Use Only. Not intended for any animal or human therapeutic or diagnostic use.
Li, H, Durbin, R (2009). Fast and accurate short read alignment with Burrows-Wheeler transform. Bioinformati, 25, 14:1754-60.cs
Li, H, Durbin, R (2010). Fast and accurate long-read alignment with Burrows-Wheeler transform. Bioinformati, 26, 5:589-95.cs
Ning, Z, Cox, AJ, Mullikin, JC (2001). SSAHA: a fast search method for large DNA databases. ,Genome Res.11, 10:1725-9.Smith, T. F. and Waterman, M. S. (1981). Identification of common molecular subsequences. Journal ofMolecular Biology, 147(1), 195 – 197.Li, Heng (2012). Exploring single-sample SNP and INDEL calling with whole-genome de novo assembly.Bioinformatics, 28, 14:1838-1844.
Technical Note - Transition from SFF to BAM format
Transitioning from FASTQ/SFF to unmapped BAM
One of the changes in the update from Torrent Suite 2.x to Torrent Suite 3.0 is a transition from FASTQ and SFF toBAM as the principal format in which primary analysis results are delivered. The new file is sometimes referred to as“unmapped BAM” to indicate that it can still be produced in the absence of any reference genome. The mappingfields of the BAM are set to the usual defaults for unmapped reads. In the case of a reference genome beingavailable, the mapping information is added to the BAM. In TS 3.0, the unmapped BAM file names have theextension .*.basecaller.bam
The FASTQ and SFF formats are still provided in Torrent Suite 3.0 and 3.2. In Torrent Suite 3.4, the FASTQ andSFF files are no longer produced by default, though for backward compatibility both plugins and command-line toolsare provided to make it easy to create FASTQ and SFF files on demand. Note, however, that although the SFF filethat may be created on demand in Torrent Suite 3.4 has the same usual standard data format, the actual content ofone of the data fields in that SFF file is modified as further discussed below.
There are multiple reasons motivating the implementation of the previously-announced transition from SFF to BAM:
Community-driven standard – The BAM format is a community-driven standard that has become the formatof choice for representing next-generation sequence data for multiple sequencing technologies. Delivering thedata in BAM format will enable greater compatibility with current and future software tools.Native data compression – BAM supports native compression of the data, SFF was not designed withcompression in mind. An unmapped BAM from Torrent Suite 3.0 is typically less than half the size of thecorresponding SFF file, though it contains more information.SFF format constraints – The SFF format is rigid, there is no ability for it to adapt to improvements in theunderlying sequencing technology that it represents. For example, an SFF file cannot be used for runs thatincorporate multiple flow orders or multiple sequencing keys.Extensibility – The BAM format is extendable. New kinds of information can be added to it without breakingexisting parsers. Having the ability to record in the BAM file new kinds of data derived during primary analysiswill enable current and future improvements in the analysis methods used in downstream applications suchas variant calling improvements.
In Torrent Suite 3.0 and 3.2, the unmapped BAM file is generated directly from the BaseCaller, and the SFF andFASTQ files are then generated from the unmapped BAM. In Torrent Suite 3.4, the SFF and FASTQ generation areremoved from the default analysis pipeline, which has undergone significant changes. The BAM and SFF generatedby Torrent Suite 3.0 and 3.2 store the same library insert flow values, bases, and quality scores that are available inthe SFF from Torrent Suite 2.x, and all three would produce the same FASTQ file. There are some small differencesin some of the auxiliary information available relating to 5’-clipping and 3’-clipping.
In Torrent Suite 3.0 and 3.2, the corrected flow signals provided in the SFF and unmapped BAM correspond topreviously-made base calls and include residual terms related to the closeness between actual measurements andmeasurements predicted for the base calls under a predictive model of phasing effects.
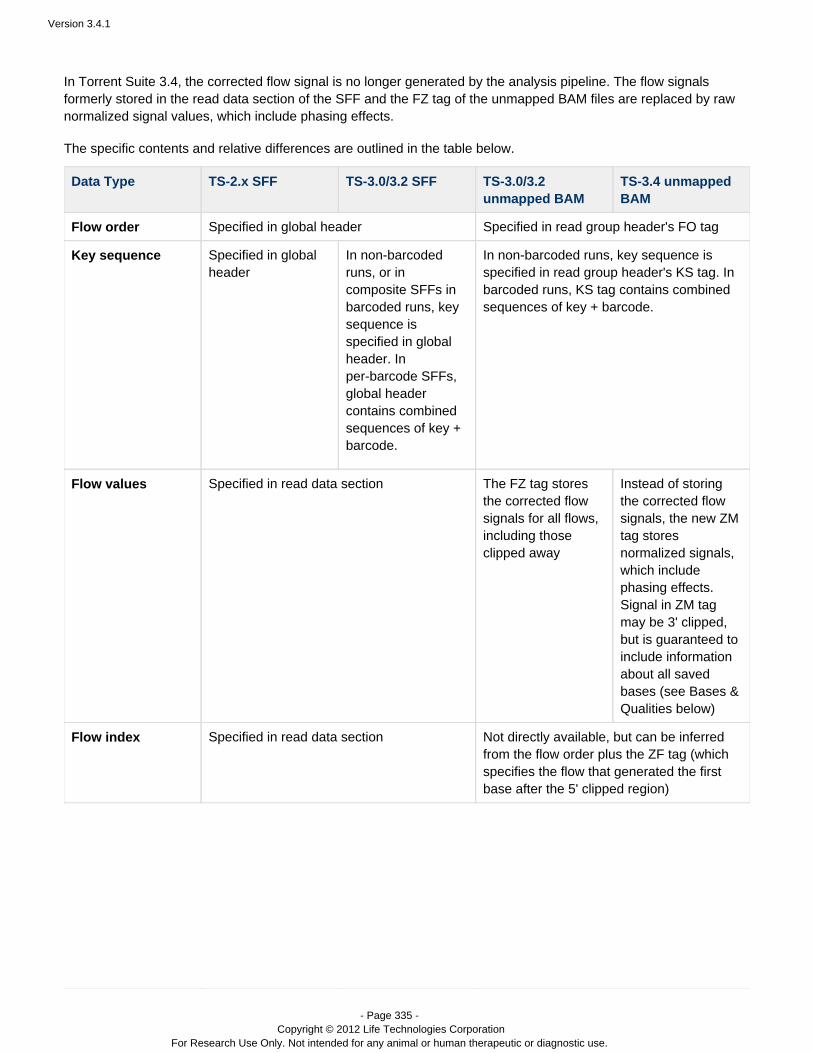
Version 3.4.1
- Page 335 - Copyright © 2012 Life Technologies Corporation
For Research Use Only. Not intended for any animal or human therapeutic or diagnostic use.
In Torrent Suite 3.4, the corrected flow signal is no longer generated by the analysis pipeline. The flow signalsformerly stored in the read data section of the SFF and the FZ tag of the unmapped BAM files are replaced by rawnormalized signal values, which include phasing effects.
The specific contents and relative differences are outlined in the table below.
Data Type TS-2.x SFF TS-3.0/3.2 SFF TS-3.0/3.2unmapped BAM
TS-3.4 unmappedBAM
Flow order Specified in global header Specified in read group header's FO tag
Key sequence Specified in globalheader
In non-barcodedruns, or incomposite SFFs inbarcoded runs, keysequence isspecified in globalheader. Inper-barcode SFFs,global headercontains combinedsequences of key +barcode.
In non-barcoded runs, key sequence isspecified in read group header's KS tag. Inbarcoded runs, KS tag contains combinedsequences of key + barcode.
Flow values Specified in read data section The FZ tag storesthe corrected flowsignals for all flows,including thoseclipped away
Instead of storingthe corrected flowsignals, the new ZMtag storesnormalized signals,which includephasing effects.Signal in ZM tagmay be 3' clipped,but is guaranteed toinclude informationabout all savedbases (see Bases &Qualities below)
Flow index Specified in read data section Not directly available, but can be inferredfrom the flow order plus the ZF tag (whichspecifies the flow that generated the firstbase after the 5' clipped region)
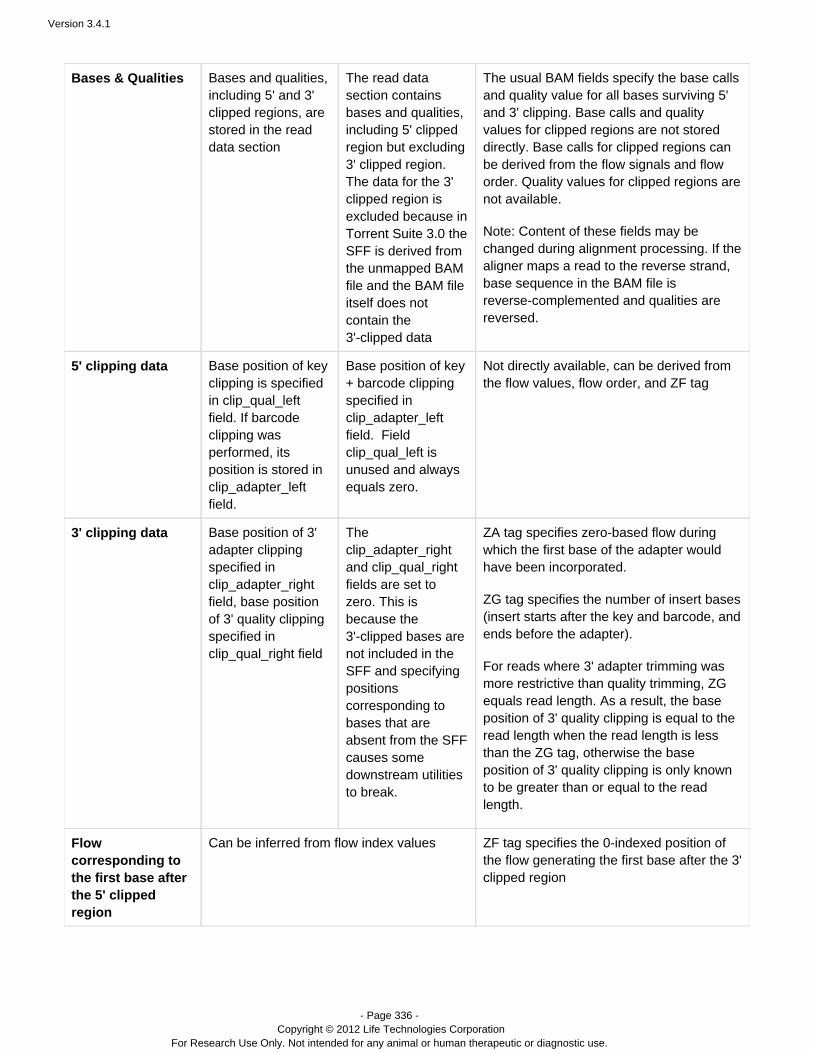
Version 3.4.1
- Page 336 - Copyright © 2012 Life Technologies Corporation
For Research Use Only. Not intended for any animal or human therapeutic or diagnostic use.
Bases & Qualities Bases and qualities,including 5' and 3'clipped regions, arestored in the readdata section
The read datasection containsbases and qualities,including 5' clippedregion but excluding3' clipped region.The data for the 3'clipped region isexcluded because inTorrent Suite 3.0 theSFF is derived fromthe unmapped BAMfile and the BAM fileitself does notcontain the3'-clipped data
The usual BAM fields specify the base callsand quality value for all bases surviving 5'and 3' clipping. Base calls and qualityvalues for clipped regions are not storeddirectly. Base calls for clipped regions canbe derived from the flow signals and floworder. Quality values for clipped regions arenot available.
Note: Content of these fields may bechanged during alignment processing. If thealigner maps a read to the reverse strand,base sequence in the BAM file isreverse-complemented and qualities arereversed.
5' clipping data Base position of keyclipping is specifiedin clip_qual_leftfield. If barcodeclipping wasperformed, itsposition is stored inclip_adapter_leftfield.
Base position of key+ barcode clippingspecified inclip_adapter_leftfield. Fieldclip_qual_left isunused and alwaysequals zero.
Not directly available, can be derived fromthe flow values, flow order, and ZF tag
3' clipping data Base position of 3'adapter clippingspecified inclip_adapter_rightfield, base positionof 3' quality clippingspecified inclip_qual_right field
Theclip_adapter_rightand clip_qual_rightfields are set tozero. This isbecause the3'-clipped bases arenot included in theSFF and specifyingpositionscorresponding tobases that areabsent from the SFFcauses somedownstream utilitiesto break.
ZA tag specifies zero-based flow duringwhich the first base of the adapter wouldhave been incorporated.
ZG tag specifies the number of insert bases(insert starts after the key and barcode, andends before the adapter).
For reads where 3' adapter trimming wasmore restrictive than quality trimming, ZGequals read length. As a result, the baseposition of 3' quality clipping is equal to theread length when the read length is lessthan the ZG tag, otherwise the baseposition of 3' quality clipping is only knownto be greater than or equal to the readlength.
Flowcorresponding tothe first base afterthe 5' clippedregion
Can be inferred from flow index values ZF tag specifies the 0-indexed position ofthe flow generating the first base after the 3'clipped region
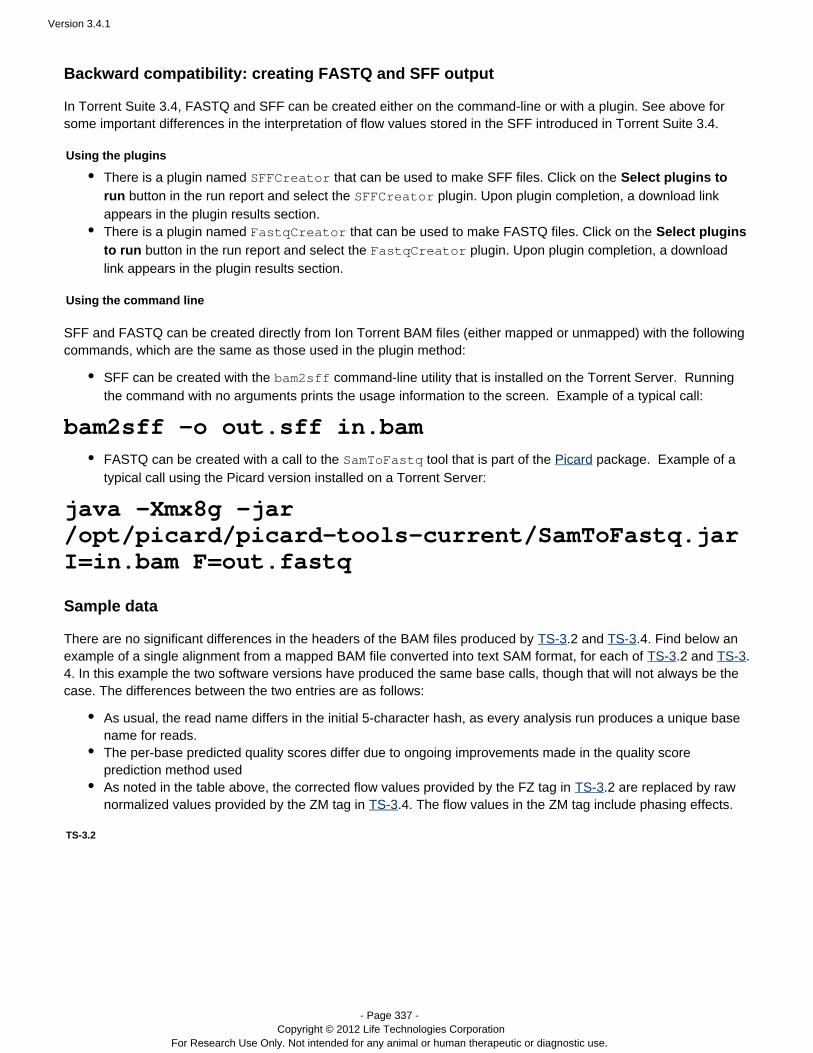
Version 3.4.1
- Page 337 - Copyright © 2012 Life Technologies Corporation
For Research Use Only. Not intended for any animal or human therapeutic or diagnostic use.
Backward compatibility: creating FASTQ and SFF output
In Torrent Suite 3.4, FASTQ and SFF can be created either on the command-line or with a plugin. See above forsome important differences in the interpretation of flow values stored in the SFF introduced in Torrent Suite 3.4.
Using the plugins
There is a plugin named that can be used to make SFF files. Click on the SFFCreator Select plugins to button in the run report and select the plugin. Upon plugin completion, a download linkrun SFFCreator
appears in the plugin results section.There is a plugin named that can be used to make FASTQ files. Click on the FastqCreator Select plugins
button in the run report and select the plugin. Upon plugin completion, a downloadto run FastqCreator
link appears in the plugin results section.
Using the command line
SFF and FASTQ can be created directly from Ion Torrent BAM files (either mapped or unmapped) with the followingcommands, which are the same as those used in the plugin method:
SFF can be created with the command-line utility that is installed on the Torrent Server. Runningbam2sff
the command with no arguments prints the usage information to the screen. Example of a typical call:
bam2sff -o out.sff in.bamFASTQ can be created with a call to the tool that is part of the package. Example of aSamToFastq Picardtypical call using the Picard version installed on a Torrent Server:
java -Xmx8g -jar/opt/picard/picard-tools-current/SamToFastq.jarI=in.bam F=out.fastq
Sample data
There are no significant differences in the headers of the BAM files produced by .2 and .4. Find below anTS-3 TS-3example of a single alignment from a mapped BAM file converted into text SAM format, for each of .2 and .TS-3 TS-34. In this example the two software versions have produced the same base calls, though that will not always be thecase. The differences between the two entries are as follows:
As usual, the read name differs in the initial 5-character hash, as every analysis run produces a unique basename for reads.The per-base predicted quality scores differ due to ongoing improvements made in the quality scoreprediction method usedAs noted in the table above, the corrected flow values provided by the FZ tag in .2 are replaced by rawTS-3normalized values provided by the ZM tag in .4. The flow values in the ZM tag include phasing effects.TS-3
TS-3.2
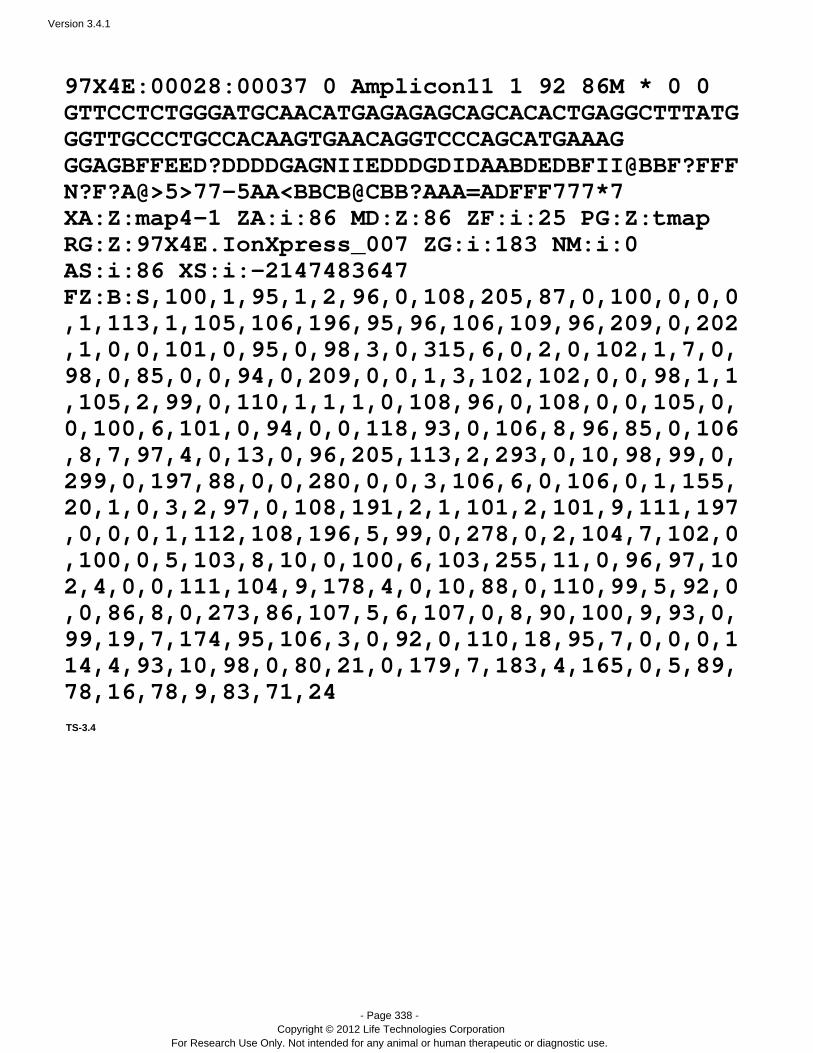
Version 3.4.1
- Page 338 - Copyright © 2012 Life Technologies Corporation
For Research Use Only. Not intended for any animal or human therapeutic or diagnostic use.
97X4E:00028:00037 0 Amplicon11 1 92 86M * 0 0GTTCCTCTGGGATGCAACATGAGAGAGCAGCACACTGAGGCTTTATGGGTTGCCCTGCCACAAGTGAACAGGTCCCAGCATGAAAGGGAGBFFEED?DDDDGAGNIIEDDDGDIDAABDEDBFII@BBF?FFFN?F?A@>5>77-5AA<BBCB@CBB?AAA=ADFFF777*7XA:Z:map4-1 ZA:i:86 MD:Z:86 ZF:i:25 PG:Z:tmapRG:Z:97X4E.IonXpress_007 ZG:i:183 NM:i:0AS:i:86 XS:i:-2147483647FZ:B:S,100,1,95,1,2,96,0,108,205,87,0,100,0,0,0,1,113,1,105,106,196,95,96,106,109,96,209,0,202,1,0,0,101,0,95,0,98,3,0,315,6,0,2,0,102,1,7,0,98,0,85,0,0,94,0,209,0,0,1,3,102,102,0,0,98,1,1,105,2,99,0,110,1,1,1,0,108,96,0,108,0,0,105,0,0,100,6,101,0,94,0,0,118,93,0,106,8,96,85,0,106,8,7,97,4,0,13,0,96,205,113,2,293,0,10,98,99,0,299,0,197,88,0,0,280,0,0,3,106,6,0,106,0,1,155,20,1,0,3,2,97,0,108,191,2,1,101,2,101,9,111,197,0,0,0,1,112,108,196,5,99,0,278,0,2,104,7,102,0,100,0,5,103,8,10,0,100,6,103,255,11,0,96,97,102,4,0,0,111,104,9,178,4,0,10,88,0,110,99,5,92,0,0,86,8,0,273,86,107,5,6,107,0,8,90,100,9,93,0,99,19,7,174,95,106,3,0,92,0,110,18,95,7,0,0,0,114,4,93,10,98,0,80,21,0,179,7,183,4,165,0,5,89,78,16,78,9,83,71,24
TS-3.4
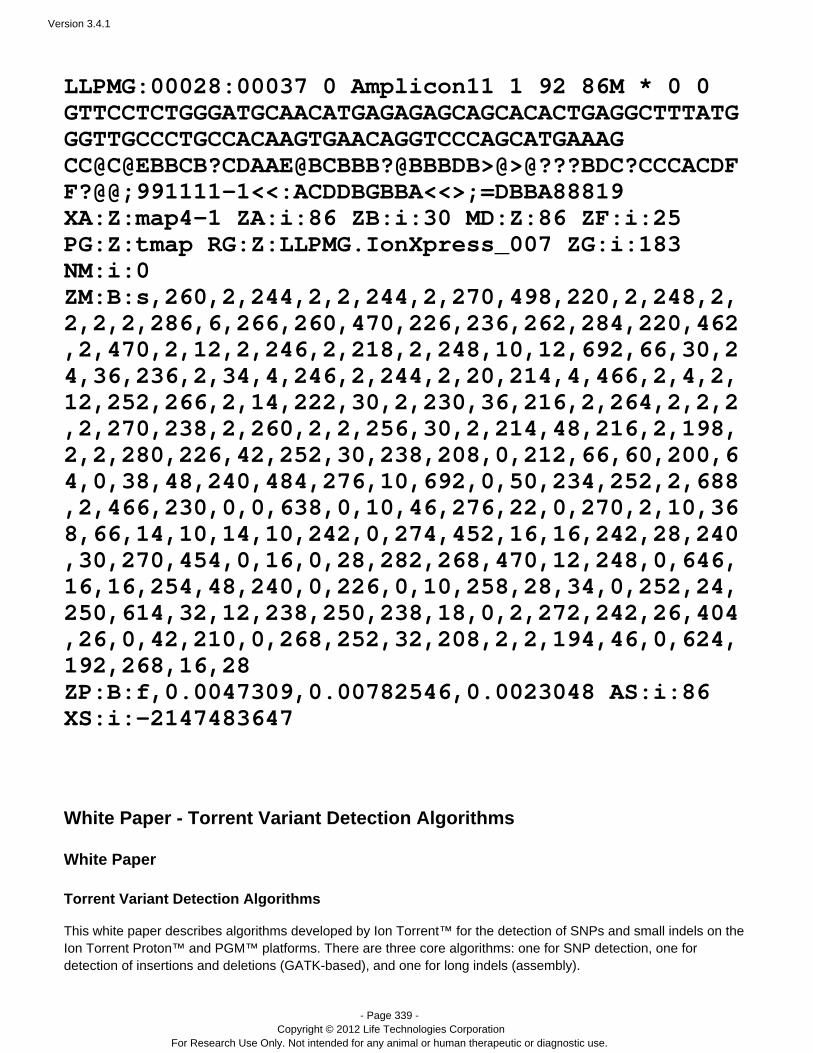
Version 3.4.1
- Page 339 - Copyright © 2012 Life Technologies Corporation
For Research Use Only. Not intended for any animal or human therapeutic or diagnostic use.
LLPMG:00028:00037 0 Amplicon11 1 92 86M * 0 0GTTCCTCTGGGATGCAACATGAGAGAGCAGCACACTGAGGCTTTATGGGTTGCCCTGCCACAAGTGAACAGGTCCCAGCATGAAAGCC@C@EBBCB?CDAAE@BCBBB?@BBBDB>@>@???BDC?CCCACDFF?@@;991111-1<<:ACDDBGBBA<<>;=DBBA88819XA:Z:map4-1 ZA:i:86 ZB:i:30 MD:Z:86 ZF:i:25PG:Z:tmap RG:Z:LLPMG.IonXpress_007 ZG:i:183NM:i:0ZM:B:s,260,2,244,2,2,244,2,270,498,220,2,248,2,2,2,2,286,6,266,260,470,226,236,262,284,220,462,2,470,2,12,2,246,2,218,2,248,10,12,692,66,30,24,36,236,2,34,4,246,2,244,2,20,214,4,466,2,4,2,12,252,266,2,14,222,30,2,230,36,216,2,264,2,2,2,2,270,238,2,260,2,2,256,30,2,214,48,216,2,198,2,2,280,226,42,252,30,238,208,0,212,66,60,200,64,0,38,48,240,484,276,10,692,0,50,234,252,2,688,2,466,230,0,0,638,0,10,46,276,22,0,270,2,10,368,66,14,10,14,10,242,0,274,452,16,16,242,28,240,30,270,454,0,16,0,28,282,268,470,12,248,0,646,16,16,254,48,240,0,226,0,10,258,28,34,0,252,24,250,614,32,12,238,250,238,18,0,2,272,242,26,404,26,0,42,210,0,268,252,32,208,2,2,194,46,0,624,192,268,16,28ZP:B:f,0.0047309,0.00782546,0.0023048 AS:i:86XS:i:-2147483647
White Paper - Torrent Variant Detection Algorithms
White Paper Torrent Variant Detection Algorithms
This white paper describes algorithms developed by Ion Torrent for the detection of SNPs and small indels on the™Ion Torrent Proton™ and PGM™ platforms. There are three core algorithms: one for SNP detection, one fordetection of insertions and deletions (GATK-based), and one for long indels (assembly).
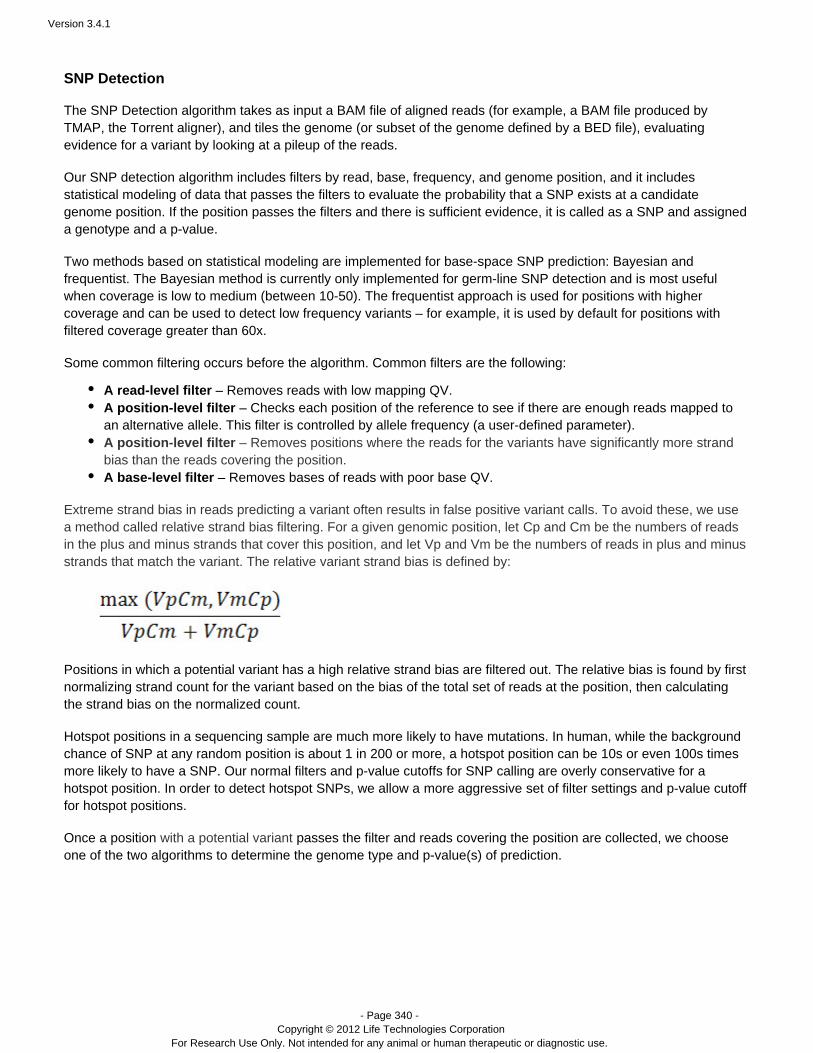
Version 3.4.1
- Page 340 - Copyright © 2012 Life Technologies Corporation
For Research Use Only. Not intended for any animal or human therapeutic or diagnostic use.
SNP Detection
The SNP Detection algorithm takes as input a BAM file of aligned reads (for example, a BAM file produced byTMAP, the Torrent aligner), and tiles the genome (or subset of the genome defined by a BED file), evaluatingevidence for a variant by looking at a pileup of the reads.
Our SNP detection algorithm includes filters by read, base, frequency, and genome position, and it includesstatistical modeling of data that passes the filters to evaluate the probability that a SNP exists at a candidategenome position. If the position passes the filters and there is sufficient evidence, it is called as a SNP and assigneda genotype and a p-value.
Two methods based on statistical modeling are implemented for base-space SNP prediction: Bayesian andfrequentist. The Bayesian method is currently only implemented for germ-line SNP detection and is most usefulwhen coverage is low to medium (between 10-50). The frequentist approach is used for positions with highercoverage and can be used to detect low frequency variants – for example, it is used by default for positions withfiltered coverage greater than 60x.
Some common filtering occurs before the algorithm. Common filters are the following:
A read-level filter emoves reads with low mapping QV.– RA position-level filter – Checks each position of the reference to see if there are enough reads mapped toan alternative allele. This filter is controlled by allele frequency (a user-defined parameter).
emoves positions where the reads for the variants have significantly more strandA position-level filter – Rbias than the reads covering the position.A base-level filter emoves bases of reads with poor base QV.– R
Extreme strand bias in reads predicting a variant often results in false positive variant calls. To avoid these, we usea method called relative strand bias filtering. For a given genomic position, let and be the numbers of readsCp Cmin the plus and minus strands that cover this position, and let and be the numbers of reads in plus and minusVp Vmstrands that match the variant. The relative variant strand bias is defined by:
Positions in which a potential variant has a high relative strand bias are filtered out. The relative bias is found by firstnormalizing strand count for the variant based on the bias of the total set of reads at the position, then calculatingthe strand bias on the normalized count.
Hotspot positions in a sequencing sample are much more likely to have mutations. In human, while the backgroundchance of SNP at any random position is about 1 in 200 or more, a hotspot position can be 10s or even 100s timesmore likely to have a SNP. Our normal filters and p-value cutoffs for SNP calling are overly conservative for ahotspot position. In order to detect hotspot SNPs, we allow a set of filter settings and p-value cutoffmore aggressive for hotspot positions.
Once a position passes the filter and reads covering the position are collected, we choosewith a potential variant one of the two algorithms to determine the genome type and p-value(s) of prediction.
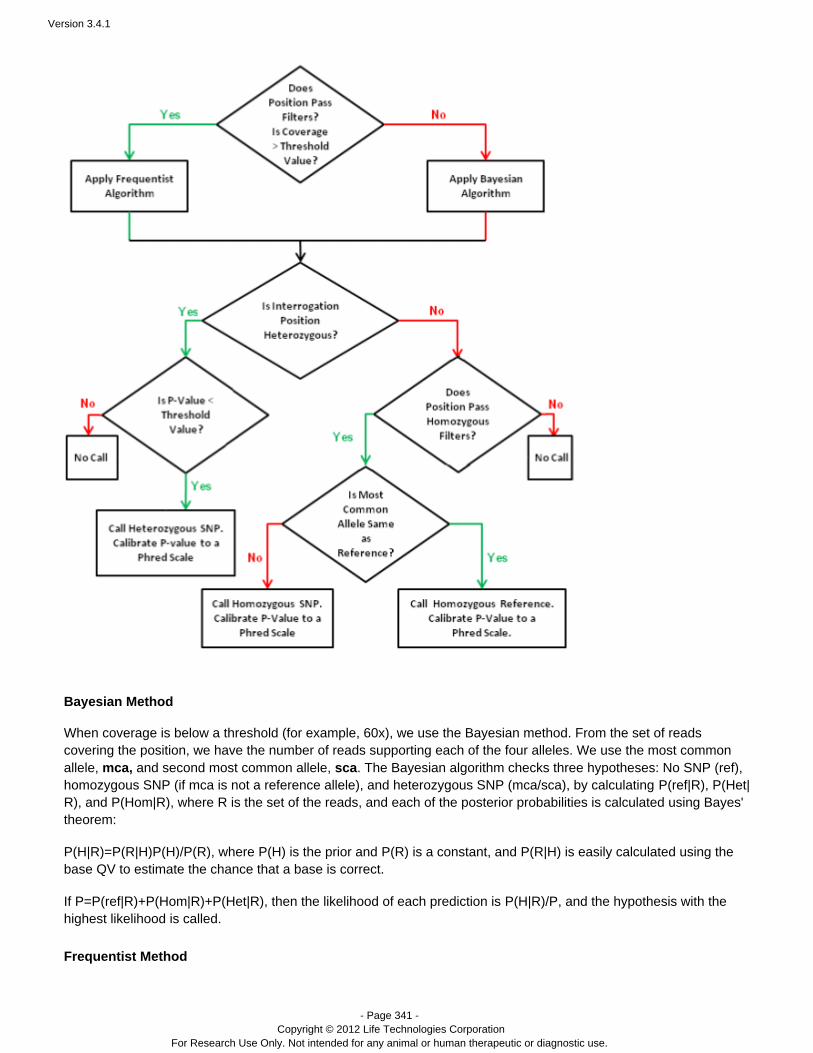
Version 3.4.1
- Page 341 - Copyright © 2012 Life Technologies Corporation
For Research Use Only. Not intended for any animal or human therapeutic or diagnostic use.
Bayesian Method
When coverage is below a threshold (for example, 60x), we use the Bayesian method. From the set of readscovering the position, we have the number of reads supporting each of the four alleles. We use the most commonallele, and second most common allele, . The Bayesian algorithm checks three hypotheses: No SNP (ref),mca, scahomozygous SNP (if mca is not a reference allele), and heterozygous SNP (mca/sca), by calculating ,P(ref|R) P(Het|
, and , where is the set of the reads, and each of the posterior probabilities is calculated using Bayes'R) P(Hom|R) Rtheorem:
P(H|R)=P(R|H)P(H)/P(R), where is the prior and is a constant, and is easily calculated using theP(H) P(R) P(R|H)base QV to estimate the chance that a base is correct.
If , then the likelihood of each prediction is , and the hypothesis with theP=P(ref|R)+P(Hom|R)+P(Het|R) P(H|R)/Phighest likelihood is called.
Frequentist Method
Version 3.4.1
- Page 342 - Copyright © 2012 Life Technologies Corporation
For Research Use Only. Not intended for any animal or human therapeutic or diagnostic use.
1. 2.
3.
When coverage is high, we can use the frequentist method, which effectively estimates . If the genomeP(ref|R)position does not have an alternative allele (i.e., it has no SNP), we do this by estimating the expected number ofreads matched to an alternative allele. Using the QV of all reads, we estimate the error rate of the bases coveringthis position. This error rate times the coverage depth is the number of non-reference reads expected. From the setof reads, we know the “actual” number of reads matching the alternative allele. A Poisson distribution is used toestimate the likelihood of this happening by chance. Low-frequency variants can be detected by this method. Thevariants are reported in a VCF file.
SNPs called near homopolymer (HP) positions tend to be more likely to be false positives because of a higherchance of mismapping, in addition to the higher error rate at these positions. Also, longer HPs are more likely tocause false positives. We model this observation by adding an HP penalty. Formally, for any HP of length L wedefine a penalty function when and otherwise, where , , , are user-specifiedP(L)=a+bL L<C P(L)=a+bL+d a b c dparameters. In the frequentist method, the error rate of each base was determined by its base QV, and for any basebelong to a HP of length , we multiply by the error rate calculated from the base QV. The process is alsoL P(L)equivalent to lowering the base QV of HP by a certain amount determined by length.
Indel Detection - GATK
Overall Ion's Unified Genotyper in the current release makes use of not only the flow order and flow intensities, butalso Ion's base calls, CIGAR alignment, and base quality calls.
The indel caller in the Torrent Variant Caller (TVC) implements four consecutive steps. The first two steps aredesigned to accurately call short indels of less than 15bp. The third step is designed to reconstruct long indels15–70bp in size. The fourth step filters candidate indels and produces final calls.
First step
In the first step, we traverse all genomic positions limited to the regions provided in the BED file. For each position,we generate a list of observed indels by inspecting a pileup of base-space alignments crossing that position. Bydefault, each indel that is present at a frequency of 10% or higher is included in the set of candidate variants. Thisstep is implemented by calling GATK UnifiedGenotyper in the multi-threaded mode with a certain level ofdownsampling for speed. The list of candidate indels contains most of the true indels and a large number of falseindels caused by misalignments and sequencing errors.
Second step
In general in this step, each candidate indel is rescored using a Bayesian framework that estimates significance ofthe indel from flow intensities and flow-space alignments across reads that have the indel in their base-spacesequence. This step is implemented by calling a modified version of the GATK UnifiedGenotyper that has two majoradditional functionalities:
a. Extracts flow signal from BAM. Realigns flow signal to base calls. Collects flow intensities from readssupporting an indel. Calculates a new Bayesian score (with calls external to GATK).
b. Correctly calculates the number of reads on each strand that support the reference allele or indel variant.
All the candidate indels identified in step 1 are classified into one of the following three categories:
Indels in a homopolymer region (example: 'TTTT' -> 'TTT')Indels within a multi-nucleotide repeat region (MNR), where one or more copies of a series of 2-, 3-, or4-nucleotide bases are either inserted or deleted (example: 'ATATAT' -> 'ATAT') Other indels of one or more bases that are not in a homopolymer or multi-nucleotide repeat region
Previous releases refer to the category as di-nucleotide and tri-nucleotide repeats. 3.x releases alsoMNRconsider 4-nucleotide repeats in this category.
Version 3.4.1
- Page 343 - Copyright © 2012 Life Technologies Corporation
For Research Use Only. Not intended for any animal or human therapeutic or diagnostic use.
Each candidate category receives a different approach, as described in the following sections.
Indels in a homopolymer region
The candidate indels classified as homopolymer indels are further evaluated using a separate module called FlowPeak Estimator (FPE). FPE develops the distribution of flow signals from all the reads spanning the candidateposition and does a flow-space evaluation using the flow signal distribution. The module assigns a score to allcandidate indels and filters out all candidates below a score threshold.
The FPE module fits the flow signal distribution to a Gaussian model and uses a least-squares min approach todetermine the number of peaks in the flow signal distribution. The presence of two signal peaks, one centeredaround the reference homopolymer length and the other centered around the candidate homopolymer length, isused as evidence for a heterozygous sample. The presence of a single peak centered around candidatehomopolymer length is evidence of a homozygous indel. Several quantitative measures are used to identify errormodes in the flow signal distribution.
Strand-bias is the principal error mode that results in noisy bi-modal flow signal distribution (where only one strandcontributes to signal peak around candidate homopolymer length). A k-means clustering approach is used toidentify the two clusters (if any) within all the flow signals contributing to the candidate indel position. The strand-biasestimate is calculated from the number of flow signals contributing to the two identified clusters from the postive andnegative strands. The strand-bias threshold is controlled by the parameter hp_stb_max_two_peaks_relative_
, which is set to default value of 0.8. The minimum coverage required to calculate this flow space basedbias
strand-bias estimate is controlled by the parameter and the default value is set to 50.hp_stb_fpe_min_coverage
If the coverage at any candidate indel position is below this threshold, then the position is no longer consider as anMNR candidate and is evaluated as a potential indel of one or non-consecutive bases:
The indel is scored by the Bayesian frameworkThe strand-bias is calculated using base space (number of reference and candidate alleles from each strand).
The standard deviation of the flow signal distribution is used as a measure to identify noisy signals at any givencandidate indel position (homozygous variants in particular). The threshold for of uni-modal flowstandard deviationsignal distributions is controlled jointly by these parameters:
hp_max_single_peak_std_23 – Signifies the maximum allowed standard deviation for homopolymers oflength up to 3hp_max_single_peak_std_increment – Signifies the maximum allowed increment in standard deviationfor homopolymers greater than length 3.
In the case of homozygous variants, the distribution of flow signals is expected to be uni-modal with the peak ideallycentered around the homopolymer length of the variant allele (for example, around 600 for a 6mer ).homopolymerThe distance ( ) between the observed and the expected mean of the flow signal peaks is another good quantitativeDmeasure of noise in flow signals and is controlled using the parameter . A large is anhp-max_peak_deviation Dindicator of an error prone position and increasing this threshold would lower the specificity of the variants reported.
The allele frequencies, in case of heterozygous variants, is estimated using the flow signal distribution by taking theratio of the areas under the two peaks in a bi-modal distribution (bi-modality is expected in flow signal distributions atheterozygous positions), rather than by simple counting of number reads supporting the each allele in base space.
hp_max_length parameter
This parameter, new in release 3.2, sets the maximum indel homopolymer length. HP indels longer than this valueare not called. The default for this parameter varies by workflow:
Ion AmpliSeq™ workflows – 8
Version 3.4.1
- Page 344 - Copyright © 2012 Life Technologies Corporation
For Research Use Only. Not intended for any animal or human therapeutic or diagnostic use.
Ion ™ TargetSeq workflows – 7Whole Genome workflow – 7
Indels in a multi-nucleotide region
Candidate indels classified to be within a multi-nucleotide repeat region are further evaluated in the second stepusing a separate MNR module. This module again operates within the flow space rather than the base space toevaluate the candidate variants. The observed flow signals within the flow order spanning the candidate indelposition is evaluated against the expected flow signals from both the null hypothesis (reference) and the hypothesisthat variant is present. The measure of similarity between the observed and expected flow signals is used togenerate a quantitative score for each candidate variant which is used in the final step of filter variants.
Other indels
All candidate indels that have not been classified as either of the other two types (in a homopolyer or in amulti-nucleotide repeat region) are further evaluated using a Bayesian framework that estimates significance of theindel from flow intensities and flow-space alignments across reads that have the indel in their base-space sequence.
Second step output
The output of this step is a new VCF file that includes each candidate indel generated in the first step with theaddition of the Bayesian score and strand counts in the info field of each variant.
Third step
In the third step, we sequentially traverse all reads in the BAM file and detect genomic regions with a large numberof partially aligned reads that have >10bp of soft-clipped (non-aligned) sequence. This signals the possibility ofpresence of a large indel sequence that does not align to the reference. De novo assembly proceeds withsoft-clipped sequences from partially aligned reads in a region and calls an indel if assembled sequence anchors tothe reference. This step is designed to call long indels that are missed by the first two steps due to being soft-clippedby the aligner.
Fourth step
The fourth step step merges results from step 2 and 3 and filters them based on score, frequency, and relativestrand bias. This step also sorts and produces the final list of variant calls.
Workflows
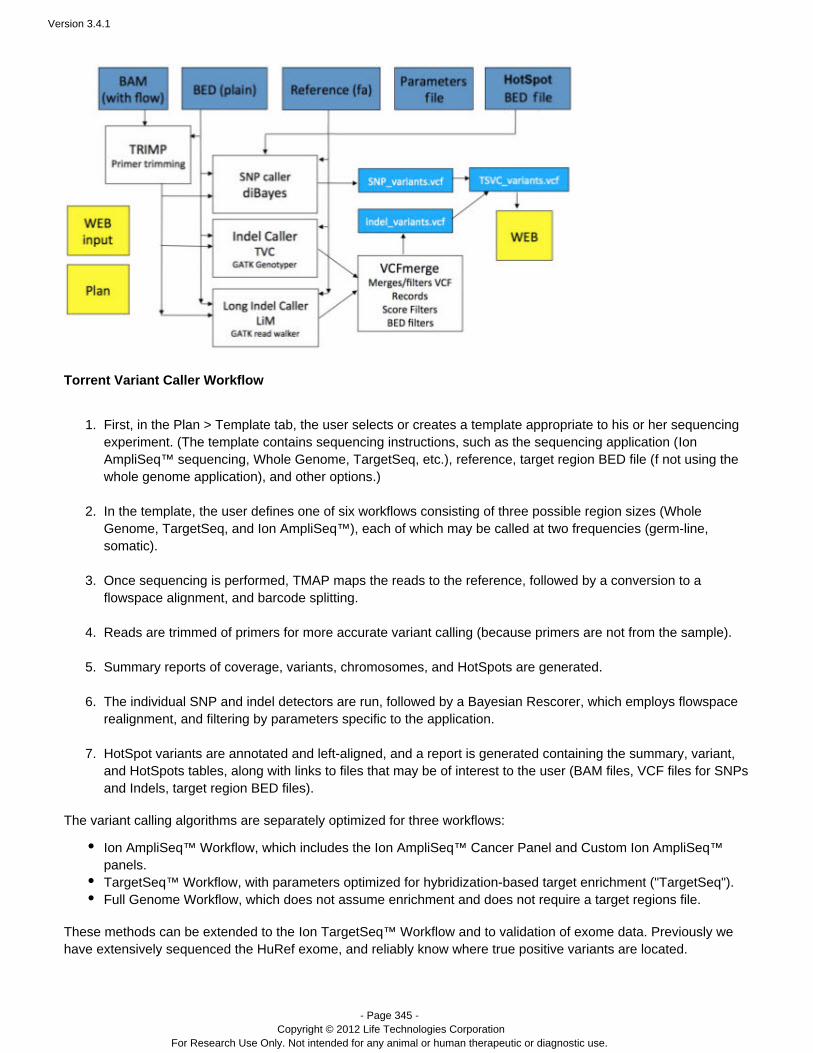
Version 3.4.1
- Page 345 - Copyright © 2012 Life Technologies Corporation
For Research Use Only. Not intended for any animal or human therapeutic or diagnostic use.
1.
2.
3.
4.
5.
6.
7.
Torrent Variant Caller Workflow
First, in the Plan > Template tab, the user selects or creates a template appropriate to his or her sequencingexperiment. (The template contains sequencing instructions, such as the sequencing application (Ion
reference, target region BED file (AmpliSeq™ sequencing, Whole Genome, TargetSeq, etc.), f not using the.)whole genome application), and other options
In the template, the user defines one of six workflows consisting of three possible region sizes (WholeGenome, TargetSeq, and Ion AmpliSeq™), each of which may be called at two frequencies (germ-line,somatic).
Once sequencing is performed, maps the reads to the reference, followed by a conversion to aTMAP flowspace alignment, and barcode splitting.
Reads are trimmed of primers for more accurate variant calling (because primers are not from the sample).
Summary reports of coverage, variants, chromosomes, and HotSpots are generated.
The individual SNP and indel detectors are run, followed by a Bayesian Rescorer, which employs flowspacerealignment, and filtering by parameters specific to the application.
HotSpot variants are annotated and left-aligned, and a report is generated containing the summary, variant,and HotSpots tables, along with links to files that may be of interest to the user (BAM files, VCF files for SNPsand Indels, target region BED files).
The variant calling algorithms are separately optimized for three workflows:
Ion AmpliSeq™ Workflow, which includes the Ion AmpliSeq™ Cancer Panel and Custom Ion AmpliSeq™panels.TargetSeq Workflow, with parameters optimized for hybridization-based target enrichment ("TargetSeq").™Full Genome Workflow, which does not assume enrichment and does not require a target regions file.
These methods can be extended to the and to validation of exome data. Previously weIon ™ Workflow TargetSeqhave extensively sequenced the HuRef exome, and reliably know where true positive variants are located.
Version 3.4.1
- Page 346 - Copyright © 2012 Life Technologies Corporation
For Research Use Only. Not intended for any animal or human therapeutic or diagnostic use.
Ion AmpliSeq™ Workflow
We report only variants within the target region (defined by the target BED file).
One specific module for the Ion AmpliSeq is Primer Trimming. For AmpliSeq, we assign each read to the™ workflowamplicon to which it most likely belongs and trim away any primer sequence, leaving only the insert sequence. Thisallows us to elegantly manage overlapping amplicons.
Several methods are used to validate indels. We obtained and sequenced 15 samples from the HapMap project, forwhich sequencing and variant data from the 1000 Genomes Project is publicly available. This provides us with, inprincipal, true positives for comparison, although they are somewhat limited in number per sample. To increase theabsolute number of true positives, a dataset of simulated indels was generated by mapping reads from a HapMapsample to a modified hg19 reference. The strength of this method is that there are many true positives that aredefinitively known; however, simulation of this type is limited to homozygous calls. Early-access customer feedbackis also a valuable source of information for validating indels, especially when attempting to discover the reasonsbehind false positives. In some cases, customers have Sanger sequenced variants, providing us with the ability toexamine known false negatives.
TargetSeq Workflow
We report only variants within the target region (defined by the target BED file).
Whole Genome Workflow
We report variants across the entire sequenced region.