ion dynamics and aerosol mass spectrometry during ... · ion dynamics and aerosol mass spectrometry...
TRANSCRIPT

Ion dynamics and aerosol mass spectrometry
during atmospheric new particle formation
Dissertation
zur Erlangung des Doktorgrades der Naturwissenschaften (Dr. rer. nat.)
an der Bayreuther Graduiertenschule für Mathematik und Naturwissenschaften
der Universität Bayreuth
Vorgelegt von
Stefan Georg Gonser
Bayreuth, März 2014


Die vorliegende Arbeit wurde in der Zeit von Juni 2010 bis März 2014in Bayreuth
an der Juniorprofessur für Atmosphärische Chemie unter Betreuung von Herrn Professor Dr. Andreas Held angefertigt.
Vollständiger Abdruck der von der Bayreuther Graduiertenschule für Mathematik
und Naturwissenschaften (BayNAT) der Universität Bayreuth genehmigten
Dissertation zur Erlangung des akademischen Grades eines Doktors der Naturwissenschaften (Dr. rer. Nat.)
Disseration eingereicht am: 17.03.2014
Zulassung durch das Leitungsgremium: 26.03.2014
Wissenschaftliches Kolloquium: 31.07.2014
Amtierender Direktor: Prof. Dr. F. X. Schmid
Prüfungsausschuss:
Prof. Dr. Thomas Foken (Vorsitz)
Prof. Dr. Andreas Held (Erstgutachter)
Prof. Dr. Otto Klemm (Zweitgutachter)
Prof. Dr. Corneius Zetzsch


I may not have gone where I intended to go,
but I think I ended up where I needed to be.
- Douglas Adams -

Abstract
New particle formation (NPF) is a frequently occurring phenomenon in the Earth’s
atmosphere, thereby contributing to the total number concentration of aerosol particles.
The formed particles, originating from gas-to-particle conversion processes, typically grow to diameters relevant for the Earth’s climate. Climate effects of particles include the
direct and indirect interaction with solar shortwave radiation and thermal radiation emitted by the Earth’s surface.
In the past 20 years a lot of effort has been put into investigating the mechanisms
governing atmospheric NPF. Only in the course of the past few years a general picture of the mechanisms dominating atmospheric NPF was put together. To date, NPF is known to
occur due to clustering of precursor gas molecules (e.g. sulfuric acid, amines, ammonia, organic compounds) to form stable initial particle nuclei (diameter between 1.5 and
1.9 nm). Further, condensation of predominantly organic molecules causes particle
growth. Nevertheless, a lot of open questions remain, regarding the initial particle formation, as well as the processes dominating particle growth.
In this work, the role of ions on particle formation and growth is assessed, and a novel
instrument to analyze the chemical composition of the growing particles is presented.
Ionized air molecules, permanently available in the Earth’s atmosphere, are thought to considerably influence NPF. During the initial clustering process the presence of a charge
stabilizes the clusters and enhances condensational growth by gas molecules with an
electrical dipole moment (e.g. sulfuric acid). To assess the role of ions in NPF, ion and neutral particle number size distributions
from four different field sites were analyzed. At all four locations, the same type of instrument was deployed (neutral cluster and air ion spectrometer – NAIS). The NAIS
exhibits detection limits in the diameter range of molecular clusters for the ion fraction
(~0.8 nm) and in the diameter range of ~2 nm for neutral particles. Data from two locations, with presumably high precursor gas concentrations, showed a
clear earlier occurrence of 2 nm ions compared to 2 nm neutral particles. This initial advance of the ion fraction vanished during the consecutive growth process. At diameters
between 10 and 20 nm, neutral particles exhibited the same diameter as the ion fraction.
Neutral particles with diameters below 10 to 20 nm were observed to experience an enhanced growth rate (GR) in comparison to the ion fraction. On the other hand, at
locations with presumably low precursor gas concentrations an advance of the ion
fraction was not as pronounced, and GRs of ions and neutral particles exhibited similar values.
A special focus was put on the Waldstein site, NE Bavaria, Germany, where relatively high precursor gas concentrations and elevated ion concentrations are thought to be
present. For this field site, the influence of ion recombination on neutral particle
formation was assessed. Therefore, neutral particle distributions arising from recombination of oppositely charged ions were calculated. GRs of the recombined neutral
particles were elevated in comparison to ion GRs. Consequently, an ion accelerated growth mechanism including recombination and attachment of ions is proposed in order
to explain the observed elevated neutral GRs. At field sites with low precursor gas
concentrations, the ion accelerated growth mechanism does not contribute significantly to

neutral particle growth. Nevertheless, ions are likely to contribute largely to the initial
formation of neutral particles at sites with low precursor gas concentrations.
To shed more light on the chemical compounds contributing to particle growth, a particle
interface for a time of flight mass spectrometer (ToF-MS) was developed in this work. The developed chemical analyzer for charged ultrafine particles (CAChUP) is capable of
analyzing particles with diameters below 30 nm for their chemical composition. Charged
particles of a defined diameter interval are electrostatically collected on a metal filament. Following the collection, the filament is resistively heated to evaporate the sample. The
resultant gas phase is eventually transferred to the ToF-MS, ionized via electron impact
ionization and analyzed for its molecular composition. To characterize CAChUP in the laboratory, two main experiments were performed: (1)
the application of known masses of camphene to the metal filament and (2) the collection and analysis of laboratory-generated secondary organic aerosol (SOA) particles with
diameters of 25 nm. Direct application, evaporation and analysis of known camphene
masses to/from the metal filament resulted in a detection limit of CAChUP below 5 ng. SOA was produced by dark ozonolysis of alpha-pinene in a flow tube reactor. Particles
with diameters of 25 nm exiting the flow tube reactor were selected in a radial differential mobility analyzer (rDMA). The analysis of the samples in the ToF-MS resulted in typical
mass spectra for SOA generated by dark ozonolysis of alpha-pinene. Collected masses for
the 0.5 hour experiment were estimated to be 2.1 to 2.6 ng. Sampling times below 0.5 hours did not yield quantifiable mass spectra.
CAChUP performed well in the laboratory, and is ready for further laboratory experiments. A sensitivity analysis regarding the deployment of CAChUP to measure
atmospheric NPF in the field, showed that extended collection periods (8 hours for 20 nm
particles) are required with the current setup. Therefore, field measurements are assumed to be possible for NPF events with continuous particle formation and high particle
number concentrations.

Zusammenfassung
Eine große Zahl atmosphärischer Aerosolpartikel entsteht durch häufig auftretende
sekundäre Neubildungsprozesse. Die aus Vorläufergasen entstehenden Partikel tragen zu
einem großen Teil zur Gesamtpartikelanzahl in der Atmosphäre bei und haben somit einen weitreichenden Einfluss auf das Klima. Die Klimaeffekte von Aerosolpartikeln
ergeben sich hauptsächlich durch die direkte und indirekte Interaktion mit kurzwelliger Sonneneinstrahlung als auch mit planetarer Wärmestrahlung.
Während der letzten zwei Jahrzehnte konnten die generellen Mechanismen der
Neubildung von sekundären Aerosolpartikeln aufgedeckt werden. Heute ist bekannt, dass erste „embryonale“ Partikel aus Molekülclustern bestehen. Diese ersten Cluster setzten
sich vermutlich aus einer Vielzahl von Vorläufermolekülen zusammen (z.B. Schwefelsäure, Amine, Ammoniak und organische Moleküle). Nach der Bildung erster
stabiler Cluster (Durchmesser zwischen 1.5 und 1.9 nm) folgt ein Anwachsen zu
beständigen Partikeln durch Kondensation von meist organischen Molekülen. Trotz weitreichender Erkenntnisse bleiben bis heute noch viele Fragen zur initialen
Partikelbildung als auch bezüglich des weiteren Partikelwachstums offen.
In der vorliegenden Arbeit werden Ergebnisse zu Untersuchungen über den Einfluss von Luftionen auf Bildung und Wachstum von Aerosolpartikeln sowie die Entwicklung eines
Messgeräts zur Untersuchung der chemischen Zusammensetzung von wachsenden
Aerosolpartikeln vorgestellt.
Elektrische Ladungen sind permanent in der Atmosphäre vorhanden und liegen überwiegend in Form von ionisierten Clustern vor. Das Vorhandensein einer Ladung in
einem Cluster erhöht sowohl dessen Stabilität als auch die Kondensation von Vorläufergasen mit einem Dipolmoment (z.B. Schwefelsäure) an das Cluster. Somit
spielen Ladungen bei der Partikelneubildung wahrscheinlich eine wichtige Rolle.
Zur Klärung der Rolle von Ionen bei der Partikelneubildung wurden atmosphärische Messdaten zu Ionen- und Partikelanzahlgrößenverteilungen analysiert. Die Messungen
wurden mit dem gleichen Gerätetyp (Neutrale Cluster und Luftionen Spektrometer – NAIS) an vier verschiedenen Standorten durchgeführt. Das NAIS misst zeitgleich die
Anzahlgrößenverteilungen ionischer Cluster ab einem Mobilitätsdurchmesser von
~0.8 nm, und die Anzahlgrößenverteilungen neutraler Partikel ab einem Mobilitätsdurchmesser von ~2 nm.
An zwei Standorten mit vermutlich hoher Vorläufergaskonzentration konnte
regelmäßig die Bildung von Ionen mit 2 nm Durchmesser deutlich vor der Entstehung neutraler 2 nm Partikel beobachtet werden. Während des folgenden Partikelwachstums
nahm der zeitliche Vorsprung der Ionen jedoch rasch ab, um schließlich ganz zu verschwinden. Ab Durchmessern zwischen 10 und 20 nm hatten neutrale Partikel den
Durchmesser der Ionen erreicht. Somit wiesen neutrale Partikel gegenüber den Ionen eine
erhöhte Wachstumsrate auf. An Standorten mit vermutlich geringen Vorläufergaskonzentrationen war der zeitliche Vorsprung der Ionen weniger stark
ausgeprägt und die Wachstumsraten von Ionen und neutralen Partikeln wiesen kaum Unterschiede auf.
Messungen am Standort Waldstein, NO Bayern, Deutschland, bildeten einen
besonderen Schwerpunkt dieser Arbeit, da vor Ort erhöhte Ionenkonzentrationen und

hohe Vorläufergaskonzentrationen vorliegen. Für Messungen am Waldstein wurde die
Entstehung neutraler Partikel aus der Rekombination gegensätzlich geladener Ionen
berechnet. Eine höhere Wachstumsrate der so entstandenen neutralen Partikel im Vergleich zur Wachstumsrate der gemessenen Ionen war zu beobachten. Somit scheint
ein Ionen-beschleunigtes Wachstum die erhöhte neutrale Wachstumsrate an Standorten mit hohen Vorläufergaskonzentrationen erklären zu können. An Standorten mit
geringeren Vorläufergaskonzentrationen scheint die Ionenrekombination jedoch keinen
erheblichen Einfluss auf das neutrale Partikelwachstum zu haben. Nichtsdestotrotz haben Ionen an diesen Standorten einen erhöhten Einfluss auf die initiale Bildung der Partikel.
Die chemische Zusammensetzung von neugebildeten Aerosolpartikeln gibt Aufschluss über die Mechanismen des Partikelwachstums. Zur chemischen Analyse von Partikeln
mit Durchmessern unter 30 nm wurde, im Rahmen der vorliegenden Arbeit, ein Partikel-interface für ein Flugzeitmassenspektrometer (ToF-MS) entwickelt. Der chemische
Analysator für geladene ultrafeine Partikel (CAChUP) wurde erfolgreich in
Laborexperimenten getestet und charakterisiert. Das Herzstück des CAChUP ist eine Sammeleinheit, in welcher geladene und größenselektierte Partikel elektrostatisch auf
einem Metalldraht gesammelt werden. Sobald eine genügende Partikelmasse auf dem Draht abgeschieden wurde, wird der Draht langsam aufgeheizt und die Partikelprobe
somit verdampft. Die entstandene Gasphase wird per Elektronenstoß ionisiert und auf
ihre chemische Zusammensetzung im ToF-MS analysiert. Zur Charakterisierung von CAChUP wurden zwei Experimenttypen durchgeführt: (1)
das direkte Aufbringen von bekannten Mengen Camphen auf den Sammeldraht und (2) die Sammlung von sekundären organischen Partikeln mit einem Durchmesser von 25 nm.
Direktes Aufbringen und folgendes Verdampfen von bekannten Mengen Camphen auf
den Draht resultierte in einer Nachweisgrenze von besser als 5 ng. Für die Sammelexperimente wurden in einem Flussreaktor organische Partikel durch Ozonolyse
von Alpha-Pinen produziert und über verschieden lange Zeiträume auf dem Draht abgeschieden. Die erhaltenen Massenspektren sind vergleichbar mit publizierten Spektren
von größeren Partikeln aus der Ozonolyse von Alpha-Pinen. Sammelzeiten unter 0.5
Stunden führten zu keinem klaren Signal im Massenspektrometer. Eine Abschätzung der gesammelten Masse über einen Zeitraum von 0.5 Stunden resultierte in 2.1 bis 2.6 ng.
CAChUP ist für weitere Laborexperimente bestens gerüstet. Für den Einsatz bei
Feldexperimenten wurde eine Sensitivitätsstudie durchgeführt, mit dem Ergebnis der Notwendigkeit von ausgedehnten Sammelzeiten (8 Stunden für 20 nm Partikel). Der
Einsatz von CAChUP im Feld ist somit vorstellbar, allerdings nur bei Neubildungsereignissen mit einer intensiven und langanhaltenden Neubildung von
Partikeln.
Content
List of publications 1
1 Introduction 2
Aerosol particles in general 2
Particle nucleation 3
Ions in new particle formation 3
Chemical analysis of nucleation mode particles 4
2 Objectives 6
3 Ion and neutral particle dynamics during particle formation 7
3.1 Methods 8
Instrumentation 8
Growth rate 9
Time difference in occurrence of ions and neutral particles 10
Particle formation- and ionization rates 11
Ion recombination 12
3.2 Results 13
Timing of ions and neutral particles 13
Growth rate differences 17
3.3 Discussion 20
4 Mass spectrometry of nucleation mode particles 24
4.1 Chemical analyzer for charged ultrafine particles 24
Particle charging 25
Particle size selection 26
Particle collection and desorption 26
Chemical analysis 28
4.2 Characterization 28
5 Conclusions and outlook 31
Nomenclature 33
Acronyms 33
Symbols 34
Individual contribution to the joint manuscripts 35
References 36
Appendix I: (Gonser et al., 2014a) 44
Appendix II: (Gonser et al., 2014b) 72

Appendix III: (Gonser and Held, 2013) 97
Acknowledgements 116
Declaration 117


1
List of publications
This thesis consists of an introductory review of the accomplished research, followed by
three research articles in appendix I, II and III, respectively.
I. Gonser et al. (2014a):
Gonser, S. G., Klein, F., Birmili, W., Größ, J., Kulmala, M., Manninen, H. E.,
Wiedensohler, A. and Held, A.: Ion - particle interactions during particle
formation and growth at a coniferous forest site in central Europe,
Atmospheric Chem. Phys. Discuss., 14(1), 171–211, doi:10.5194/acpd-14-171-2014, 2014.
II. Gonser et al. (2014b):
Gonser, S. G., Birmili, W., Rose, C., Sellegri, K. and Held, A.: Occurrence and
growth of ions and neutral particles during particle formation events in four
different environments, to be submitted, 2014.
III. Gonser and Held (2013):
Gonser, S. G. and Held, A.: A chemical analyzer for charged ultrafine
particles, Atmospheric Meas. Tech., 6(9), 2339–2348, doi:10.5194/amt-6-2339-
2013, 2013.

2
1 Introduction
Aerosol particles in general
The suspension of fine liquid and solid particles in a gas is defined as an aerosol (Seinfeld and Pandis, 2006). Such aerosol particles are a ubiquitous component of the earth’s
atmosphere. Typical aerosol particle concentrations in the troposphere vary between 300 cm-3 and 10000 cm-3 for very remote and strongly polluted environments,
respectively (Spracklen et al., 2010), while concentrations in the stratosphere are
significantly lower (< 0.5 cm-3; Deshler, 2008). Aerosol particles appear in various shapes. Therefore, several definitions for the particle size are used. In this work the size
of a particle will be defined by its electrical mobility diameter (e.g. Hinds, 1999). The diameters of individual atmospheric aerosol particles cover a range of five orders of
magnitude, exhibiting diameters between ~2 nm and 100 µm. Typically, tropospheric
aerosol particles are composed of sea salt, soot, minerals, pollen, bacteria, sulfuric acid, organic compounds or inorganic salts like ammonium nitrate and ammonium sulfate.
Mostly, single particles are a mixture of the mentioned components, as permanent interaction among particles as well as interactions of particles with the available gas
phase components alter the particles’ composition.
The earth’s hydrological cycle is strongly depending on atmospheric particles. Cloud formation at typical water vapor supersaturation is only possible in the presence of cloud
condensation nuclei (Pruppacher and Klett, 2010). Furthermore, particles have a strong
impact on the climate by interacting directly and indirectly with solar radiation (Boucher et al., 2013). Direct interactions are the scattering and absorption of solar shortwave
radiation and planetary infrared radiation on the particle surfaces. Indirect effects are due to modified cloud formation and cloud properties depending on the number of cloud
condensation and ice nuclei. Besides the global climate effects of aerosol particles there
are several local and individual effects on plants (Burkhardt et al., 2001; Stoorvogel et al., 1997), animals and humans. The major impact on human life is the health effect (e.g.
Rückerl et al., 2011), as aerosol particles are continuously inhaled and may penetrate deep into the respiratory system as far as the bloodstream, depending on their size and
shape (e.g. Geiser et al., 2005). Depending on their chemical composition and size, the
inhaled particles may cause severe damage to the human body (e.g. Pope and Dockery, 2006).
Generally, aerosol particles may be classified into two categories: primary aerosol particles and secondary aerosol particles. Primary particles are emitted directly into the
atmosphere, for example as mineral dust, sea salt, smoke or pollen. Therefore, primary
particles are mostly found in the so-called accumulation and coarse modes. On the other hand, secondary aerosol particles are formed in the atmosphere by clustering and
condensation of atmospheric trace gas components. Secondary aerosol particles are initially of a very small diameter (~1.6 nm) and eventually grow to larger diameters.
Sources for secondary aerosol particles are mainly exhaust gases from industrial activity,
volcanoes as well as organic and inorganic emissions from the biosphere. To date, secondary particles are thought to contribute largely to the global particle number
concentration (Merikanto et al., 2009), and therefore exhibiting an enormous impact on
the formation of clouds and their life time.

3
Particle nucleation
The initial nucleation of secondary aerosol particles as well as the mechanisms governing the consecutive growth are not yet understood to a sufficient degree to reliably predict
new particle formation events (NPF events) in the atmosphere. The first formation of “embryonic” particles is thought to happen due to clustering of precursor gas molecules
to form stable clusters (diameter range 1.3 – 1.5 nm at tropospheric conditions; Kulmala
et al., 2013; Zhang, 2010). The gas phase molecules involved in the initial clustering are thought to be sulfuric acid, water, ammonia, amines and organic compounds (e.g.
Kulmala et al., 2013; Metzger et al., 2010). Once a thermodynamically stable cluster is
formed, it serves as a surface for the condensation of low volatile trace gases and an intense growth can be observed (e.g. Kulmala et al., 2004; Manninen et al., 2009).
Growth by condensation and coagulation eventually results in the formation of persistent aerosol particles. The gas species mainly involved in the growth processes are thought to
be oxidation products of volatile organic carbon species in natural environments (e.g. Ehn
et al., 2007; Kulmala et al., 2013; Riipinen et al., 2009; Smith et al., 2008). However, the exact mechanisms and involved gas species for the initial nucleation and further growth
are still a topic of research.
Ions in new particle formation
A common phenomenon during NPF events is the simultaneous occurence of charged
particles (e.g. Gagné, 2011; Hirsikko et al., 2005; Iida et al., 2006; Manninen et al., 2010). In the diameter range between 2 and 3 nm, the appearance of ionic particles was
observed before the much more intense formation of neutral particles occurred (Manninen et al., 2010).
The presence of a charge in a molecular cluster will enhance its thermodynamic
stability, and therefore facilitate the formation of the initial nuclei (Lushnikov and Kulmala, 2004; Winkler et al., 2008). Further, the growth by condensation of precursor
gases with a dipole (e.g. sulfuric acid) is enhanced by the presence of charges (e.g. Nadykto and Yu, 2003). Finally, the collision probability between ions of opposite
polarity as well as among ions and neutral particles is enhanced (e.g. Hoppel and Frick,
1986; Tammet and Kulmala, 2005), resulting in an enhanced growth rate due to coagulation. When ionic clusters are involved, enhanced coagulation may happen by ion
recombination or ion-particle attachment. Therefore, the formation and growth of particles in the presence of ions is more probable and happening faster than in the pure
neutral case.
A requirement for the involvement of ions in NPF is of course a sufficient abundance of charges in the atmosphere. This is very probable, as already discovered more than one
century ago, the earth’s atmosphere is an electrically conducting medium (Gerdien,
1905). According to their electrical mobility diameter, atmospheric ions are usually classified into three classes: cluster ions (Dm < 1.6 nm), intermediate ions (1.6 nm < Dm
< 7.4 nm) and large ions (Dm > 7.4 nm) (Hirsikko et al., 2011). Cluster ions are ubiquitous in the atmosphere, while larger ions do only occur during NPF events, rain and
snow events (e.g. Manninen et al., 2010; Tammet et al., 2009; Virkkula et al., 2007).
Major sources for cluster ions are the ionization via radioactive decay and cosmic radiation (Hirsikko et al., 2011). Major sinks are recombination with ions of opposite

4
polarity, dry deposition and attachment to present aerosol particles (e.g. Tammet et al.,
2006). In the troposphere, usual cluster ion concentrations are in the range of a few
hundred cm-3 up to a few thousands cm-3 depending on the present sources and sinks (Hirsikko et al., 2011). The limiting factor for the role of ions in atmospheric NPF is the
ionization rate, also often referred to as the cluster ion production rate. If the cluster ion production rate is below the total particle formation rate, ions cannot be the only factor
triggering NPF. Typical particle formation rates in the planetary boundary layer are
between 0.1 and 10 cm-3 s-1 (Kulmala et al., 2004; Manninen et al., 2010), and cluster ion formation rates are often in the range of 2 to 15 ion pairs cm-3 s-1 (Hess, 1912; Hirsikko et
al., 2007b; Hõrrak et al., 2008; Laakso et al., 2004; Tammet et al., 2006). Therefore, ions
could be the driving factor in NPF in the planetary boundary layer, but this is certainly depending on regional variations in cluster ionization and particle formation rates.
When ions are involved in NPF two terms are usually used: ion induced nucleation (IIN) and ion mediated nucleation (IMN). IIN refers to particle formation happening in
the ionized particle fraction, hence, the particle formation on charged clusters while the
charge is conserved during particle growth. On the other hand, IMN does additionally consider the interactions of ions with oppositely charged cluster ions, oppositely charged
particles and neutral clusters or particles. Thus, IMN includes the recombination and attachment of ions and particles during NPF to form neutral and charged particles of a
somewhat greater diameter. IIN and IMN should not be considered as separate
mechanisms, as IMN includes IIN. IMN is very likely to contribute largely to the formation of stable clusters and to a further particle growth.
For the last two decades the role of ions in NPF has been widely discussed (for reviews see Enghoff and Svensmark (2008); Hirsikko et al. (2011); Kazil et al. (2008)).
Approaches to clarify this topic included field measurements (e.g. Boulon et al., 2010;
Gagné et al., 2010, 2012; Iida et al., 2006; Kontkanen et al., 2013; Laakso et al., 2007; Manninen et al., 2010; Nieminen et al., 2011) and comprehensive computer based
modeling (e.g. Leppä et al., 2009; Yu, 2006). Results from measurements at different field sites in Europe suggest a minor contribution of IIN (1-30 %) to total particle
formation (Manninen et al., 2010). Estimates of the magnitude of IMN to total NPF, on
basis of field measurements, was up to 13 % in the Finnish boreal forest (Kontkanen et al., 2013) and about 22 % on the high elevation site Jungfaujoch (Boulon et al., 2010).
Modeling results, on the other hand, suggest IMN to be the major contributor to NPF (Yu
and Turco, 2008, 2011). The discrepancies between modeling and field measurement are very difficult to assess, as both approaches are subject to various uncertainties. Theories
describing microphysical processes of particle formation, either with or without the presence of a charge, are not all-encompassing while concentration measurements in the
relevant size range are prone to errors. Therefore, a lot of open questions remain
unsolved. For example, Manninen et al. (2010) observed an earlier formation of 2 nm ions prior to the formation of neutral particles at different field sites around Europe,
without applying the role of their observation on NPF.
Chemical analysis of nucleation mode particles
The major factor limiting the knowledge regarding the composition of individual freshly
nucleated particles is their vanishingly small mass. For example, a spherical particle of 10 nm diameter (which experienced a lifespan of a few hours since its nucleation) does

5
exhibit a mass of less than one attogram (10-18 g). An analysis for the molecular
composition of such small masses is extremely difficult, and only feasible with
sophisticated analytical instruments in a laboratory. An online analysis for the molecular composition of single freshly nucleated particles in the field is not yet possible. Various
direct and indirect methods have been used during the last decade to obtain an insight into the mechanisms governing new particle formation and the further growth processes.
Indirect approaches used to infer information on the chemical composition of
nucleation mode particles are for example: the measurement of precursor trace gas concentrations during particle formation events, to thereby deduce the individual
contribution of single trace gases (e.g. Boy et al., 2008; Ehn et al., 2010; Jokinen et al.,
2012) or the determination of hygroscopic or volatility characteristics of particles (e.g. Ehn et al., 2007; Riipinen et al., 2009) and therefore gaining information about the
chemical composition. Direct approaches often comprise the collection of a sufficiently large particle sample
on a filter for a later analysis in the laboratory, e.g. by means of an impactor (e.g. Makela
et al., 2001). For a direct online measurement in the field, mass spectrometry is the tool of choice, since it exhibits a sufficiently low detection limit and a time resolution high
enough to resolve atmospheric NPF events. To date two instruments are reported to be capable to measure the chemical
composition of nucleation mode particles (diameter < 30 nm) directly in the field: the
thermal desorption chemical ionization mass spectrometer (TDCIMS; Held et al., 2009; Smith et al., 2004; Voisin et al., 2003) and the nano aerosol mass spectrometer (NAMS;
Wang et al., 2006; Zordan et al., 2008). The NAMS is capable of analyzing the atomic composition of particles down to diameters of 7 nm (Wang et al., 2006). Single charged
particles are trapped in an ion trap and ablated by a high energy laser pulse. Due to the
intense laser pulse the particle is decomposed into positively charged atomic ions. A time-of-flight mass spectrometer (ToF-MS) eventually analyzes the atomic composition
of the particle. Consequently, the NAMS measures the atomic composition of nucleation mode particles, with the drawback that molecular information is lost due to the high
energetic laser ablation. On the other hand, the TDCIMS is capable of analyzing the
molecular composition of a bulk of size selected nucleation mode particles. Particles are charged, size selected and collected on a metal filament. Once a sufficient particle mass is
collected, the sample is thermally desorbed, the resultant gas phase is chemically ionized
and analyzed for its molecular composition in a mass spectrometer (Voisin et al., 2003). The use of the soft chemical ionization method minimizes fragmentation of the
molecules, eventually allowing to obtain relatively clear information about the particle’s molecular composition. Both instruments are custom built and individual. Therefore,
direct studies on the chemical composition of freshly nucleated particles are still very
rare.
6
2 Objectives
The goal of this thesis is to extend the knowledge of atmospheric new particle formation (NPF), with a special focus on the role of air ions and the chemical composition of freshly
formed aerosol particles.
To assess the role of ions in atmospheric particle formation, ion and particle size spectra
measured during NPF events at four different locations are analyzed. The background conditions of the four locations are very diverse, covering altitudes from 86 m to 3580 m
above sea level. Ionization sources, precursor gas concentrations and precursor gas
species are expected to differ significantly between the four field sites. Therefore, the dynamics of ions and neutral particles measured quasi-simultaneously in the size range
where particle formation takes place will be analyzed to answer the following questions:
I. Are ions required for the formation of secondary particles?
II. Do neutral particles and ions show different dynamics during NPF, regarding
growth behaviour and formation rates?
III. Can the dynamics of ions and neutral particles provide evidence on the role
of ions in NPF?
To assess the chemical composition of freshly formed secondary aerosol particles, the development and characterization of an instrument capable of analyzing particles with
diameters below 30 nm is presented. In particular, the following questions will be addressed:
I. Can secondary organic aerosol particles smaller than 30 nm in diameter be successfully collected and analyzed with the new instrument?
II. Are obtained aerosol mass spectra comparable to mass spectra of larger organic aerosol particles?
III. Is the current detection limit of the instrument sufficient for analyzing
organic aerosol compounds under typical field conditions?

7
3 Ion and neutral particle dynamics during
particle formation
In order to shed light on the earliest stages of NPF and the role of ions, simultaneous atmospheric measurements of number size distributions of ions and neutral particles are
crucial. Therefore, measurements were conducted at the Waldstein field site of the
University of Bayreuth during summer 2012. The Waldstein site is known to have an elevated background radioactive radiation due to high radon soil gas concentrations
(Kemski et al., 2001; Lüers et al., 2007). As radioactive decay is one of the major cluster ion sources, the Waldstein site is a suitable location to analyze the influence of ions on
NPF. A further insight into the subject was obtained by analyzing additional data from
ion and particle measurements from three other locations around Europe. In total, 49 NPF events at four field sites were analyzed for the influence of ions on
NPF. At all four sites the same type of instrumentation was used. The field sites are
described in more detail by Gonser et al. (2014b) and in Tab. 1. A remarkable difference among the four sites is their altitude above sea level. The lowest site is located at 86 m
while the highest site is at 3580 m. The concentration of precursor gas species is expected to differ significantly, as anthropogenic and vegetation influences are different between
the sites.
Tab. 1: Location, elevation, landscape type and observation periods of measurement sites. Table
from Gonser et al. (2014b).
Site Coordinates Elevation Landscape type Observation period
#
events
Melpitz
(MLP)
12.928°E
51.526°N 86 m
Rural - Meadow /
forest
07.05.2008 -
24.07.2009 19
Waldstein
(WST)
11.864°E
50.143°N 776 m
Rural - Coniferous
forest
17.06.2012 -
18.08.2012 8
Puy de
Dôme (PDD)
02.964°E
45.772°N 1465 m
Mountainous -
Meadow / Forest
04.02.2011 -
01.12.2011 11
Jungfraujoch
(JFJ)
07.985°E
46.548°N 3580 m
Mountainous -
snow covered
09.04.2008 -
05.05.2009 11
8
3.1 Methods
New particle formation events were recorded at four locations in Europe (c.f. Tab.1). In
order to determine the role of ions in NPF measured from a fixed location, the observed NPF events have to be of regional character.
In regional NPF events it is assumed that the formation of particles happens at the same
time over a large area. This assumption is necessary as newly formed particles are carried with the moving air masses past the measuring instrument. A regional NPF event is
assumed to be present when the observed particle number size distributions show a constant growth of the nucleating mode with time. Hirsikko et al. (2007) proposed a
classification scheme for NPF events according to visual parameters deduced from
contour plots of recorded number size distributions. According to this classification only events from classes Ia and Ib where utilized for further analyses. Regarding data from
WST, meteorological data was also considered in order to evaluate the regionality. The
selection of regional NPF events resulted in a total number of 49 events. Once a NPF event meets the criterion of being of regional character several parameters
can be calculated from the number size distributions. For our analysis, we calculated the particle and ion growth rates (GR [nm h-1]), the particle and ion formation rates (J [cm-3
s-1]) between 2 and 3 nm diameter, the time difference (∆t [min]) of the first occurrence
of ions in comparison to the first occurrence of neutral particles, the number concentration of cluster ions (N [cm-3]) and their production rate (Q [cm-3 s-1]), and the
neutral particle number size distribution resulting from recombination of oppositely charged ions as well as the growth rates of recombined neutral particles.
Instrumentation
In order to deduce information about the influence of ions on NPF, instrumentation with a sufficiently low detection limit and an adequate time resolution is necessary. An
instrument capable to resolve NPF at its earliest stages is the neutral cluster and air ion spectrometer (NAIS, Airel ltd, Estonia). NAIS instruments were deployed to all four
different field sites. The NAIS obtains information on ion number size distributions in the
diameter range from 0.8 to 42 nm, while total particle number size distributions (neutral particles plus ions of both polarities) are measured in the diameter range from 2 to 42 nm
(Manninen et al., 2009b, 2011; Mirme and Mirme, 2013). Both number size distributions are measured consecutively within the same instrument with a minimum time resolution
for both measurements of about three minutes. The operation principle of the NAIS is
comparable to other particle mobility size spectrometers, as electrical mobilities of charged particles or clusters are analyzed by means of a known electric field within a
cylindrical capacitor. The cylindrical capacitor is usually denoted as a differential mobility analyzer (DMA), paying tribute to the intentional variation of the electric field in
order to analyze particles with differing electrical mobilities. In contrast to most other
particle mobility instruments the NAIS is equipped with two DMAs in order to analyze both ion polarities at the same time. Further, the DMAs don’t comprise only one variable
electric field, but several constant electric fields of different field strengths. The different electric fields are obtained by the geometry of the DMAs as well as by the applied
voltages (Mirme and Mirme, 2013). Therefore, a broad range of electrical mobilities can
9
be analyzed at the same time. Concentrations of clusters or particles of a known electrical
mobility are measured by means of 21 electrometers directly inside the DMAs.
Usually, the NAIS is operated in three different consecutive operation modes: (1) the ion mode, (2) the particle mode and (3) the offset mode. In the ion mode (1), the aerosol
is introduced without any treatment to the two DMAs, therefore only naturally charged particles and clusters are analyzed. For the particle mode (2), ambient particles are
unipolarly charged by means of a corona discharge and afterwards introduced into the
DMAs for mobility analysis. For the offset mode (3), an electrical filter is activated in order to remove all charges from the sample. By this way the background noise of the
single electrometers is determined and subtracted from the measurement signals. The
unipolar charging of clusters and particles prior to the mobility analysis is accompanied by some inevitable side effects: cluster ions are formed due to the corona discharge and a
considerable fraction of particles with mobility diameters above 20 nm carry more than one elementary charge. Manninen et al. (2011) examined the mobility and composition of
the corona generated cluster ions, concluding that measurements for total particles below
a mobility diameter of 2 nm could not be distinguished reliably from the corona generated ions. Multiple charges on particles with diameters above 20 nm hamper the mobility
analysis for these diameters. Therefore, particle diameters analyzed to a satisfying degree in the particle mode are 2 to ~20 nm.
Asmi et al. (2009) and Gagné et al. (2011) reported of extensive intercomparison and
characterization studies of different NAIS instruments. Gagné et al. (2011) concluded that mobility analysis of the NAIS instruments can be trusted, provided the instrument is clean
and no problems with the aerosol and sheath flows are present. Concentration measurements, on the other hand, were subject to higher uncertainties. Especially, total
particle concentrations are overestimated by a factor of 2-3 (Gagné et al., 2011). A reason
for this could be the inversion routine of the instrument software. The inversion routine assumes the aerosol to be in bipolar Fuchs-charge equilibrium (Fuchs, 1963;
Wiedensohler, 1988) prior to charging by the unipolar corona discharge (Kulmala et al., 2012). This assumption is surely not given for small particle diameters (< 5 nm) during
NPF, as small particles were observed not to be in charge equilibrium during NPF (e.g.
Gagné et al., 2008; Iida et al., 2006; Laakso et al., 2007). Therefore, total particle number concentrations have to be considered with care when evaluating data recorded with the
NAIS.
Growth rate
The GR describes the rate at which the mean diameter of a newly formed particle population grows with time [nm h-1]. The total observed, or apparent, GR includes the
growth by condensation of precursor gases, coagulation of newly formed particles with
each other as well as coagulation with the background aerosol particles. The GR was calculated for neutral particles as well as for the ion fraction by means of
two different methods: the maximum concentration method (MCM) and the mode fitting method (MFM) (e.g. Kulmala et al., 2012; Yli-Juuti et al., 2011).
For the MCM, particle concentration time series in defined diameter intervals (e.g. the
NAIS size bins) are searched for the time of maximum concentration. For increasing diameters the maximum of concentration will appear at later times during NPF.
Therefore, the change of particle diameter with the time of maximum concentration is a

10
measure for the particle GR. As data obtained with the NAIS instruments in the field are
subject to artificial and natural fluctuations, the data have to be smoothed in order to
obtain a clear time of maximum concentration. The smoothing is performed by means of a Savitzky-Golay smoothing algorithm (Savitzky and Golay, 1964), which fits a running
least square low degree polynomial to the concentration time series. By further Savitzky-Golay smoothing of the found times of maximum concentration it is possible to deduce a
GR between single NAIS size bins. Additionally, linear least square regressions were
fitted to the times of maximum concentration in the diameter ranges 2-3 nm, 3-7 nm and 7-15 nm. The slopes of the fits give therefore the GR in the considered diameter interval.
The MFM on the other hand, fits a series of Gaussian log-normal distributions to the
number size distributions obtained for each measurement interval (Hussein et al., 2005). From the log-normal distribution fitted to the growing mode the mean diameter can be
deduced. The GR is subsequently determined from the mean diameters at known times. Again, linear least square fits were adapted to defined diameter intervals (2-3 nm, 3-7 nm
and 7-15 nm) in order to obtain GR for these intervals.
The two methods are not expected to give the exact same results for atmospheric NPF events, as they consider NPF from two different perspectives. The MCM considers NPF
from a vertical perspective, providing a time of maximum concentration for every considered diameter interval. The MFM on the other hand, considers NPF from a lateral
perspective, supplying a mean diameter for every time step but not necessarily for every
diameter. Further, if the contour plot does exhibit a broad base, hence small particles are formed persistently over a rather long time period, both methods will deviate
considerably from each other (c.f. Fig. 6 a).
Time difference in occurrence of ions and neutral particles
During an intensive observation period in the frame of the EUCAARI campaign
(Kulmala et al., 2011), NPF was measured at several locations in Europe with a special focus on the ion fraction. In this context, Manninen et al. (2010) observed a prior
formation of 2-3 nm ions to total particles in the same diameter range, giving rise to the question which role this prior formation plays for NPF. To assess the observed prior
formation of ions we applied a cross correlation analysis to the data recorded with the
NAIS instruments. The cross correlation method compares the similarity of two time series with respect to a possibly present time lag. Therefore, this method was chosen to
identify the time of advance ∆t [min] of ion occurrence in comparison to neutral particle occurrence, for every NAIS size channel. To illustrate the method, Fig. 1 shows the
concentration time series for ions and total particles in five NAIS size bins for a NPF
event at WST.

11
Fig. 1: Temporal evolution of total particle concentrations as well as positive and negative ion
concentrations during a NPF event on 12 August 2012 at WST. Shown are concentrations in
diameter ranges of (a) 1.8–2.1 nm, (b) 3.7–4.3 nm, (c) 7.6–8.8 nm, (d) 13.6– 15.7 nm and (e)
21.1–24.5 nm. Additionally shown is an illustration of the time difference in occurrence of
positive ions and total particles (red shaded area). Data was smoothed for illustrational purpose.
Figure adapted from Gonser et al. (2014a).
Particle formation- and ionization rates
The particle formation rate J is defined as the number concentration of particles growing into a defined diameter interval per second [cm-3 s-1]. In most cases, the diameter interval
is chosen to be 2 to 3 nm as particles in this interval are very likely to eventually experience an intense growth. J was calculated according to equations 9 and 10 from
Kulmala et al. (2012). Examples for the progression of J for ions and neutral particles
during a NPF at the four locations are shown in Fig. 3.

12
The ionization rate or cluster ion production rate Q [cm-3 s-1] is an essential factor for the
role of ions in NPF. Q was calculated according to the simplified balance equation
proposed by Hoppel and Frick (1986). It assumes the recombination of cluster ions of opposite polarity and the attachment of cluster ions to the background aerosol as the only
ion sinks. This assumption is not fully adequate as more sinks are surely present in the planetary boundary layer. Hõrrak et al. (2008) estimated the real ion production rates to
be about a factor of 2 higher than the values deduced with the simplified balance
equation. The balance equation was extended in the present work as concentration symmetry of positive and negative cluster ions were not assumed and size dependent
recombination and attachment coefficients were utilized. The balance equation in steady
state is:
Q� � ∑ α��N�N��� �∑ β �p N N�� � . (1)
Here, j and k represent the size classes below a diameter of 1.6 nm, N� and N� are
positive and negative ion concentrations in size class j and k, and N is the concentration
of neutral particles in size class i.
Ion recombination
The probability for recombination of ions with opposite polarity is enhanced in comparison to pure neutral coagulation. The recombination of ions of opposing polarity
will result in the formation of a somewhat larger neutral particle. Therefore, a fraction of neutral particles during NPF may originate from ion-ion recombination. Kontkanen et al.
(2013) proposed a formulation to evaluate the contribution of recombination during NPF
on neutral particle concentrations with diameters below 2.1 nm. For the present work, the formulation by Kontkanen et al. (2013) was extended to calculate the recombination of
ions with diameters up to 42 nm (Gonser et al., 2014a):
�������� � ∑ r��α��N�N��� �N ���� �����∆ ! "
N ��� $CoagS � CharS � CharS � ���∆ !+ (2)
The balance equation (2) for neutral particles generated by ion recombination consists of
two source terms (first and second term) and four sink terms (third to sixth term). Sources
for recombined particles N ��� in size class i are the recombination of positive ions N� and
negative ions N� in size classes j and k, and the growth �����∆ ! of recombined particles
N ���� from size class i " 1 into size class i. The sink terms are the coagulation sink CoagS (Kulmala et al., 2012; Tammet and Kulmala, 2005), the positive and negative charging
sinks CharS � and the growth sink ���∆ ! of recombined particles growing out of size class i.
r�� is a coefficient allocating the resulting recombined neutral particles to size class i by
assuming spherical ions with a given density, and � is the size dependent recombination
coefficient for size classes j and k.

13
According to Hõrrak et al. (2008) the charging sink for neutral particles in size class i is:
CharS � � p ∑ β �N��� (3)
where p is the probability of a particle in size class i to carry one elementary charge and
β � is the size dependent attachment coefficient.
To assess the contribution of recombined particles to NPF, the number size distributions
deduced from Eq. 2 may be compared to the measured neutral particle number size
distributions. However, this is not thought to be reasonable as neutral particle number concentrations from NAIS measurements are most probably overestimated by a factor of
2-3 (Gagné et al., 2011). The measured mobilities are more reliable (Gagné et al., 2011).
Therefore, the GR of the recombined neutral particles is expected to be a better measure to evaluate the influence of recombination on NPF. The GR of the recombined neutral
particles was determined by means of the MCM.
3.2 Results
Timing of ions and neutral particles
Manninen et al. (2010) observed an earlier formation of 2 nm ions prior to the formation of 2 nm neutral particles at different locations in Europe. We analyzed data from four
locations around Europe, with a distinct gradient in altitude above sea level and presumably varying precursor species and concentrations, for the occurrence of ions and
neutral particles during NPF. At all four sites, the cross correlation analyses showed a
prior formation of ions compared to neutral particles (Fig. 2). A further pattern of the occurrence of ions and neutral particles was a rapid decrease of
∆t with increasing particle diameter. The highest median ∆t of 2-3 nm ions could be observed at the field sites MLP and WST. Both sites exhibited a median advance of 25 to
30 minutes (cf. Tab. 2).
Tab. 2: Median values of 2-3 nm formation rate J [cm-3
s-1
] and 2-3 nm growth rate GR [nm h-1
]
for neutral particles, negative and positive ions, respectively; time difference in first occurrence
of ions and neutral particles Δt [min] in the diameter interval of 2-3 nm, and negative and
positive cluster ion concentrations Nclus [cm-3
]. Growth rates are determined by means of the
maximum concentration method. Table from Gonser et al. (2014b).
Location Jneut Jneg Jpos GRneut GRneg GRpos Δtneg Δtpos Nclus neg Nclus pos
MLP 13.3 0.010 0.012 5.1 2.8 2.8 30 25 176 185
WST 3.0 0.012 0.027 6.4 3.2 3.5 30 27 145 338
PDD 0.4 0.009 0.023 2.1 1.6 2.0 2 9 132 419
JFJ 0.4 0.022 0.020 3.7 3.7 3.1 14 17 166 383

14
The clearest advances, according to the cross correlation analyses, showed NPF events at
MLP and JFJ. Both sites exhibited only minor variations around the median values (cf.
Fig. 2). At JFJ the median 2-3 nm ion advance was 14 to 17 minutes for negative and positive ions, respectively. The lowest ∆t was observed at PDD, where negative and
positive ions occurred in median only 2 and 9 minutes prior to neutral particles, respectively. Regarding the rate of decrease of ∆t with growing particle diameter, WST
showed the slowest decrease, reaching ∆t values around zero at diameters of about 10 to
20 nm. All other sites showed a decrease of ∆t with increasing particle diameter, reaching ∆t values around zero at about 5 to 10 nm diameter.
Moreover, from Fig. 2 a remarkable broadening of the 25th and 75th percentile interval
is visible, when small particle diameters are considered. Therefore, the results from the cross correlation at small diameters have to be considered with caution.
The temporal advance can also be seen in the 2-3 nm formation rates. Figure 3 shows exemplary NPF events at the four sites, in panels b, e, h and k, the formation rates for
ions and particles are depicted. For both lower altitude sites (MLP and WST) a very clear
prior ion formation is visible, while at PDD and JFJ the advance is less obvious, probably due to strong fluctuations in the neutral particle formation rate. The fluctuations are
expected to have an impact on the cross correlation analysis, visible also from the broad percentile interval of ∆t at small diameters in Fig. 2. Further, the cross correlation results
at JFJ and PDD are in contrast to the findings of Manninen et al. (2010). They reported of
an earlier formation at MLP but no visible prior formation during NPF at JFJ.

15
Fig. 2: Median values of the size dependent time difference Δt at Melpitz (a, b), Waldstein (c, d),
Puy de Dôme (d, f) and Jungfraujoch (g, h) for positive and negative ions during all analyzed NPF
events. Shaded areas represent the 25th
and 75th
percentile. Figure from Gonser et al. (2014b).

16
Fig
. 3: E
xem
pla
ry N
PF e
ve
nts a
t Me
lpitz (a
, c), Wa
ldste
in (d
, f), Pu
y d
e D
ôm
e (g
, i) an
d Ju
ng
frau
joch
(j, l) for n
eu
tral p
article
s an
d p
ositiv
e io
ns a
s
me
asu
red
with
diffe
ren
t NA
IS in
strum
en
ts. Ad
ditio
na
lly, th
e fo
rma
tion
rate
s in th
e d
iam
ete
r inte
rva
l 2-3
nm
for n
eu
tral, n
eg
ative
an
d p
ositive
ion
s
are
sho
wn
(b, e
, h, k
). Fig
ure
from
Go
nse
r et a
l. (20
14
b).

17
Growth rate differences
GR analysis with the maximum concentration method (MCM) at the four field sites resulted in generally enhanced neutral GRs for the lower altitude sites (MLP and WST)
compared to the higher altitude sites (PDD and JFJ; cf. Tab. 3). Another typical pattern for the MCM at MLP and WST are generally higher neutral GRs in comparison to ion
GRs. At PDD and JFJ on the other hand, ion and neutral GRs determined with the MCM
are in the same range. The mode fitting method (MFM) did mostly not result in reasonable results for the diameter range between 2-3 nm. Further, the MFM showed not
the same differences between neutral and ionic GRs as the MCM. For the diameter range
between 3-7 nm the MFM gave enhanced ion GRs compared to the neutral GRs at all considered field sites (cf. Tab. 3). In the diameter range 7-15 nm ion and neutral GRs
determined with the MFM were of comparable magnitudes. The generally elevated neutral GRs, as visible from the MCM at lower altitude sites compared to high altitude
sites, are not visible in the 3-7 nm diameter range for the MFM. Nevertheless, the MFM
showed enhanced neutral GRs at MLP and WST when the diameter range 7-15 nm was considered.
In general, the MCM did result in higher GRs than the MFM. The differences between the two methods were up to one order of magnitude in extreme cases for the 3-7 nm
diameter range (cf. Tab. 3). At larger diameters the differences were less distinct. Fig. 4
shows exemplary NPF events at the four field sites with the results of the two applied GR methods.
Tab. 3: Median growth rates [nm h-1
] for neutral particles, negative and positive ions for diameter
ranges 2-3 nm, 3-7 nm and 7-15 nm for the maximum concentration method (MCM) and the
mode fitting method (MFM) at the four field sites. For missing values the respective method gave
no results. Table from Gonser et al. (2014b).
2-3 nm MFMneut MCMneut MFMneg MCMneg MFMpos MCMpos
MLP - 5.1 0.8 2.8 5.7 2.8
WST - 6.4 - 3.2 - 3.5
PDD 3.4 2.1 2.0 1.6 1.7 2.0
JFJ 0.9 3.7 2.6 3.7 4.7 3.1
3-7 nm MFMneut MCMneut MFMneg MCMneg MFMpos MCMpos
MLP 0.7 7.8 3.2 4.7 3.1 4.9
WST 1.4 11.1 3.5 6.0 4.0 5.6
PDD 1.4 3.3 2.9 3.4 3.4 3.5
JFJ 1.4 6.9 - 6.0 7.4 5.4
7-15 nm MFMneut MCMneut MFMneg MCMneg MFMpos MCMpos
MLP 4.8 12.0 5.1 9.9 4.8 9.9
WST 4.2 16.4 4.7 12.0 3.7 10.1
PDD 2.5 8.2 1.9 8.7 3.3 7.1
JFJ 2.7 13.3 2.4 11.1 2.2 11.4

18
Fig
. 4: E
xem
pla
ry N
PF e
ven
ts at M
elp
itz (a, b
, c), Wa
ldste
in (d
, e, f), P
uy
de
Dô
me
(g, h
, i) an
d Ju
ng
frau
joch
(j, k, l) fo
r ne
utra
l pa
rticles, a
s we
ll as n
eg
ativ
e a
nd
po
sitive
ion
s me
asu
red
with
diffe
ren
t NA
IS in
strum
en
ts. Ad
ditio
na
lly, tim
es o
f ma
ximu
m co
nce
ntra
tion
with
line
ar fits fo
r the
ma
ximu
m co
nce
ntra
tion
me
tho
d (b
lack
crosse
s an
d lin
es) a
nd
the
ma
xima
of th
e g
row
ing
mo
de
s with
the
ir line
ar fits fo
r the
mo
de
fitting
me
tho
d (b
lue
crosse
s an
d lin
es) a
re sh
ow
n.
Fig
ure
from
Go
nse
r et a
l. (20
14
b).
19
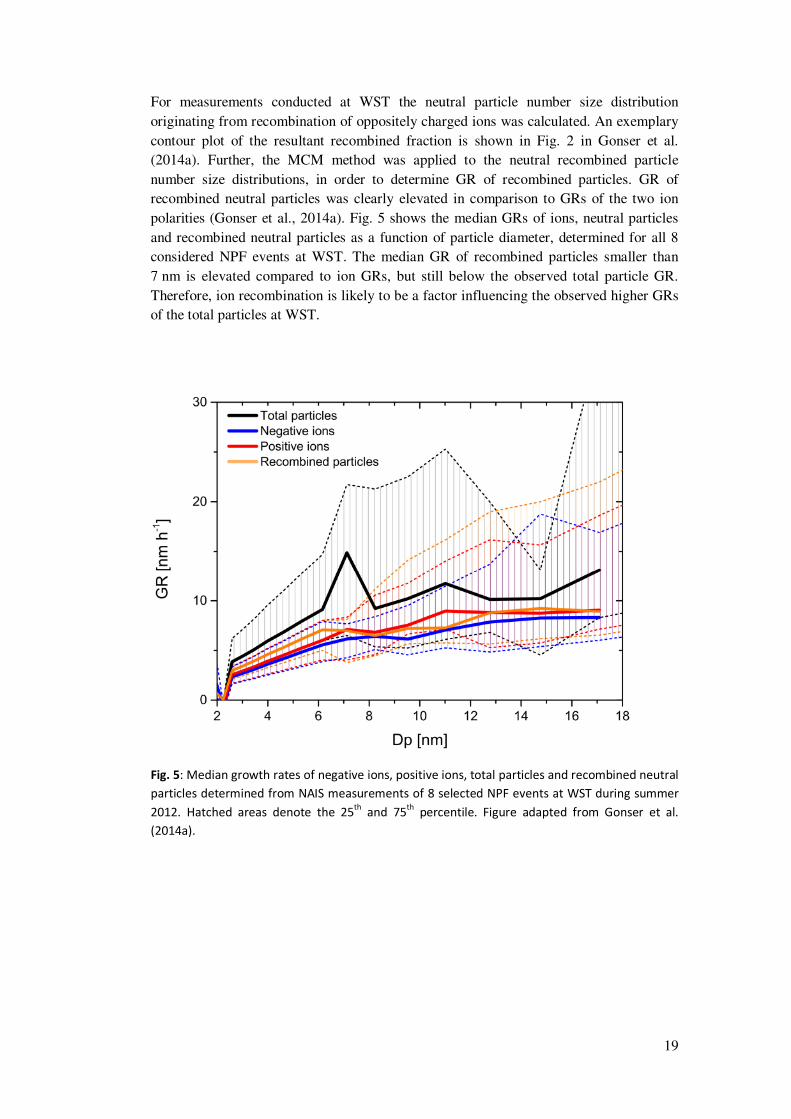
For measurements conducted at WST the neutral particle number size distribution
originating from recombination of oppositely charged ions was calculated. An exemplary
contour plot of the resultant recombined fraction is shown in Fig. 2 in Gonser et al. (2014a). Further, the MCM method was applied to the neutral recombined particle
number size distributions, in order to determine GR of recombined particles. GR of recombined neutral particles was clearly elevated in comparison to GRs of the two ion
polarities (Gonser et al., 2014a). Fig. 5 shows the median GRs of ions, neutral particles
and recombined neutral particles as a function of particle diameter, determined for all 8 considered NPF events at WST. The median GR of recombined particles smaller than
7 nm is elevated compared to ion GRs, but still below the observed total particle GR.
Therefore, ion recombination is likely to be a factor influencing the observed higher GRs of the total particles at WST.
Fig. 5: Median growth rates of negative ions, positive ions, total particles and recombined neutral
particles determined from NAIS measurements of 8 selected NPF events at WST during summer
2012. Hatched areas denote the 25th
and 75th
percentile. Figure adapted from Gonser et al.
(2014a).

20
3.3 Discussion
New particle formation (NPF) at MLP and WST generally showed comparable patterns.
NPF events at both sites were very intense, 2 nm ions occurred well before neutral particles, GRs of neutral particles were elevated in comparison to ion GRs and the first
neutral particles to appear often exhibited diameters above 2 nm (cf. Tab. 2, Fig. 2, Fig. 3 and Fig. 4). As measurements at MLP were conducted over the period of more than one
year (cf. Tab. 1), a high number of NPF events were observed at this field site. The
benefit from such a long dataset is the availability of a few very clear and undisturbed “ideal” events. Fig. 6 depicts such an “ideal” NPF event on 31 August, 2008, with wind
speed, solar radiation, air temperature, relative humidity and ozone concentration exhibiting smooth and continuous progressions over the day, and a constant wind
direction from the east. Therefore, this event will be used as a representative example to
discuss dynamics of ions and neutral particles at MLP and WST. Clearly visible during this event is the first occurrence of neutral particles larger than 2 nm in diameter and a
persistent formation of 2 nm particles over the course of about four hours. Striking is also the most intense 2-3 nm neutral particle formation about 2 hours after the onset of the
event. It is also from this time on that the most intense neutral particle growth can be
observed (black curve in Fig. 6). On the other hand, the maximum ion formation is occurring about one hour before the maximum of neutral particle formation.
The observed patterns in the ionic and neutral particle formation suggest NPF at MLP
and WST to be a dynamic process, with several factors influencing the intense formation of neutral particles. The high altitude sites did not show the persistent 2 nm neutral
particle formation and the prior occurrence of the ion fraction to the same extent as the low altitude sites.
A major difference among the sites is presumably the availability of precursor gas
sources. PDD and JFJ are expected to exhibit rather low precursor gas concentrations as both sites are influenced by free tropospheric air during the night. Only during daytime,
air from the planetary boundary layer reaches the sites (Lugauer et al., 2000; Venzac et al., 2009). On the other hand, both MLP and WST exhibit several precursor gas sources
in their surroundings (e.g. forests). Therefore, the often observed persistent 2 nm neutral
particle formation at MLP and WST is thought to be related to changes in precursor gas chemistry and a rise in precursor concentrations during the course of NPF. However,
these changes have to be of a sufficient magnitude to surpass the present condensational sink of the already present growing particles. If the increase in precursor gas
concentrations is too low, the available gas phase will solely condense to the present
particles instead of contributing to the intense formation of 2 nm neutral particles.

21
Fig. 6: Contour plot of a NPF-event recorded with the NAIS at Melpitz on 31 August ,2008. Shown
are (a) neutral particles, (b) negative ions, (c) positive ions and (d) the 2-3 nm formation rates J
for neutral, negative and positive particles. Additionally shown are the times of maximum
concentration and linear fits in the diameters 2-3 nm, 3-7 nm and 7-15 nm as determined with
the maximum concentration method (black crosses and lines). Blue crosses represent the results
from the mode fitting method, linear fits are shown for the diameters 3-7 nm and 7-15 nm (blue
lines). The slopes of the linear fits represent the GR [nm h-1
]. Figure adapted from Gonser et al.
(2014b).
Further, the growth of the neutral particles may be accelerated by recombination of
cluster ions with the earlier formed intermediate ions of opposite polarity. Fig. 7 displays
a conceptual mechanism likely to accelerate neutral particle growth during NPF, as proposed by Gonser et al. (2014a). The top panels show the permanent pool of positive
cluster ions (red) as well as the initially formed negative intermediate ions (blue). The bottom panels represent the neutral particle fraction. Fig. 7 panel (a) shows the
recombination of the initially occurring negative intermediate ions with positive cluster
ions, to form small neutral particles at conditions not yet favorable for neutral particle formation. Therefore, the resulting neutral particles are likely to evaporate. Once
sufficient precursor gas molecules are available for an intense formation of neutral particles (Fig. 7 panel b), the intermediate ions have already grow to larger diameters.
Now, the recombination will result in stable neutral particles as enough precursor
molecules are available to prevent the particles from evaporation and the recombined particles exhibit diameters of a thermodynamically stable size. As the recombined neutral
particles are somewhat larger in diameter than the freshly formed neutral particle population they will contribute to an acceleration of the neutral particle population’s
apparent GR (Fig. 7 panels b and c).

22
Fig. 7: Conceptual model of the influence of cluster ion recombination and attachment at
different stages of particle nucleation and growth (a-d). Permanently available positive cluster
ions are denoted in red, the negative growing mode in blue and neutral particle modes in black.
The black and red arrows denote the generation of neutral and charged particles, respectively.
The thickness of the arrows and dashed lines denotes the prevailing mechanism. Numerals
indicate the orders of magnitude of the number concentrations of the respective modes. Figure
from Gonser et al. (2014a).
On the other hand, the withdrawal of intermediate ions from the ion population through recombination, and the formation of intermediate ions by attachment of cluster ions to the
smaller neutral particles, results in an apparent deceleration of the intermediate ion GR (Fig. 7 panels b and c). Therefore, after some time both the ionic and the neutral
population approach the same mean diameter and no further acceleration of the neutral
GR is apparent (Fig. 7 panel d). Most probably, the persistent formation and enhanced GR of neutral particles at MLP
and WST are induced by both mechanisms, the change in precursor chemistry and concentration as well as by ion accelerated growth.
At PDD and JFJ, differences in GRs of ions and neutral particles were not observed to
the same extent as at MLP and WST. Further, the ion fraction at PDD and JFJ did not occur with a comparable temporal advance prior to neutral particle occurrence. Finally, a
persistent formation of 2 nm particles, as often observed at MLP and WST, was not often visible at PDD and JFJ. Therefore, the above suggested mechanisms are not likely to play
a role for NPF at more remote sites. Nevertheless, ions seem to play a considerable role at
JFJ. Boulon et al. (2010) report of ion mediated nucleation to contribute 22 % to NPF at JFJ. However, the high relative contribution of ions to NPF at JFJ is not caused by
especially high ion formation rates but rather by the comparably low neutral formation
rates. Therefore, PDD is also expected to exhibit high contributions of ions to NPF, also at this site neutral particle formation rates are relatively low while ion formation rates are
in the same range as at the other sites. A reason for the large differences among the two GR methods at MLP and WST is
thought to be due to the patterns governing neutral particle formation at these sites.
Neutral particle formation at MLP and WST mostly began at diameters well above 2 nm, and after the first occurrence of neutral particles a persistent formation of 2 nm particles
was often observed. Therefore, the contour plots result in a rather broad based particle

23
banana (cf. Fig. 6 a). As the two methods use different approaches to determine the GR,
the shape of the NPF event has a considerable influence on the results. While the MCM
uses a vertical approach, considering each measured diameter interval to find a time of maximum concentration, the MFM considers the NPF event horizontally, with the course
of time. Depending on the shape of the NPF event, the MFM will not always find a solution for the smallest measured particle diameters. Further, the persistent formation of
2 nm neutral particles shifts the results of the MFM towards lower GRs. In extreme cases,
the GRs of both methods varied by up to one order of magnitude (cf. Tab. 3), while still giving visually reasonable results (cf. Fig. 6).
Ion and neutral GRs determined at the high altitude sites were observed to be similar to
each other (cf. Tab. 3). Even though the two methods exhibit differences among each other, within the two methods ion and neutral GRs were of comparable magnitude at
PDD and JFJ. As both GR methods give reasonable results at all field sites it remains unclear which
method better represents the “real” growth of the neutral particle population below a
diameter of 10 nm. Despite the differences among the two methods, it is crucial to determine ion and neutral particle GRs separately at sites with high precursor gas
concentrations, as considerable differences among the two fractions may be present.
24
4 Mass spectrometry of nucleation mode
particles
A major factor limiting today’s knowledge of the chemical processes governing NPF and particle growth is the lack of appropriate instrumentation for the online analysis of
particles with diameters below 30 nm. It is a challenging task to analyze the chemical
composition of particles with diameters below 30 nm due to the vanishing small mass of individual particles, being close to the analytical detection limits. A promising analytical
method exhibiting detection limits low enough for this task is mass spectrometry. Therefore, a time of flight mass spectrometer (ToF-MS) is used to measure the chemical
composition of nucleation mode particles.
4.1 Chemical analyzer for charged ultrafine particles
In order to shed light on the chemical composition of nucleation mode particles, a particle interface for a mass spectrometer was developed, allowing to determine the chemical
composition of particles with diameters below 30 nm (Gonser and Held, 2013). The
instrument is in principle comparable to the thermal desorption chemical ionization mass spectrometer (TDCIMS; Voisin et al., 2003), as it charges, sizes, collects and desorbs a
bulk particle sample, to finally analyze its molecular composition in a ToF-MS. The working principle of the chemical analyzer for charged ultrafine particles (CAChUP) and
its components are described below. A sketch of the components forming the CAChUP is
shown in Fig. 8.

25
Fig. 8: Sketch of CAChUP, with unipolar charger, radial differential mobility analyzer (rDMA),
collection unit and time of flight mass spectrometer (ToF-MS). The condensation particle counter
(CPC) is located downstream of the collection unit to determine the number of collected
particles. The gas phase resulting from particle desorption in the collection unit is transferred via
a heated fused silica capillary to the ionization unit of the ToF-MS. Figure from Gonser and Held
(2013).
Particle charging
Particles are collected electrostatically on a NiCr filament in the CAChUP. Therefore,
only charged particles may be analyzed for their chemical composition in the ToF-MS.
Additionally, an accurate size selection in a differential mobility analyzer does require the particles to carry one elementary charge. Therefore, CAChUP is equipped with a
charging unit (cf. Fig. 8), charging the particles via diffusion charging (Hinds, 1999). For this purpose two different charger types are available, either a bipolar radioactive charger
or a unipolar corona discharge charger. Both chargers exhibit individual advantages as
well as some drawbacks. The custom built unipolar corona charger (Han et al., 2008) is able to charge particles at typical ambient concentrations with a relatively high efficiency
(cf. Fig. 2 in Gonser and Held (2013)). Charging particles in a unipolar ion environment was observed to result in a considerable amount of multiple charges carried by the
particles (Gonser and Held, 2013). Therefore, an electrostatic size selection of a single
desired particle diameter is not possible with the current setup. Further, the corona charger is not able to efficiently charge aerosols with very high particle number
concentrations (> 105 cm-3). This is especially relevant when conducting laboratory experiments. On the other hand, the radioactive charger produces only negligible multiple
charges for particles with diameters below 30 nm (e.g. Wiedensohler, 1988), but exhibits
a low charging efficiency for one polarity (cf. Fig. 2 in Gonser and Held (2013)).

26
Nevertheless, the charging efficiency of the bipolar radioactive charger is nearly
independent of particle number concentrations up to 106 cm-3. Further, transportation
regulations of radioactive material are very strict, making field measurements difficult. Therefore, the radioactive charger is ideal for laboratory measurements with high particle
number concentrations, while the corona charger is better fitted for measurements in the field.
Particle size selection
In order to analyze particles of only one defined size range for their chemical composition
particle size selection is accomplished electrostatically, in a radial differential mobility analyzer (rDMA). An rDMA separates particles according to their electrical mobility
diameter by exposing the laminar particle flow to a freely selectable electric field between
two circular electrodes. The rDMA used in CAChUP is custom built and based on the design of Zhang et al. (1995) and Zhang and Flagan (1996), optimized to select particles
in the diameter range of 1 to 100 nm. The rDMA selects quasi mono disperse particle
distributions (geometric standard deviation of 1.09) from a bulk particle population carrying one elementary charge on each particle (cf. Fig. 3 in Gonser and Held (2013)).
Particle collection and desorption
To collect the charged and sized particles, the sample is introduced into the collection unit
(Fig. 9). The unit is of a circular design with the particles entering from an annular gap at the edge of the collection unit (No. 6 in Fig. 9). Within the unit, a NiCr filament serves to
collect the particles. Particles are electrostatically precipitated onto the filament as it is biased with a high voltage. The collection efficiency depends on particle size, sample
flow rate and applied voltage. At a flow rate of one liter per minute and a voltage of 4 kV,
Berberich (2014) reported of a collection efficiency variation between 28 and 52 % for particles with diameters of 59 and 20 nm, respectively. However, when the collection
voltage is increased to 5 kV the collection efficiency increases to values above 95 %. Once a sufficiently large sample is collected, the filament is transported, by means of a
movable polyetheretherketone (PEEK) piston, to the desorption region of the sampling
unit. During particle collection the desorption chamber and the NiCr filament are permanently flushed with molecular nitrogen to prevent contamination by gas phase
components. The desorption region is a conical cavity made of aluminum forming an air tight volume (~0.4 cm³) once the NiCr filament is in desorption position. Finally, the
collected sample is desorbed by heating the desorption chamber’s walls up to 200 °C and
eventually resistively heating the filament, by applying up to 3 A at 5 V, to a maximum temperature of about 800 °C.

27
To estimate the collected particle number, a condensation particle counter (CPC) is
attached downstream of the collection unit’s exhaust. The collected number of particles is the measured particle number concentration with no voltage applied to the collection
filament minus the concentration with a voltage applied to the filament, multiplied with the sampled air volume. This approach is only valid if the particle number concentration
entering the collection unit remains constant over the whole collection phase.
Fig. 9: Schematic of the radial collection and desorption unit with NiCr filament in collection
position: (1) collection region, (2) desorption region, (3) collection tube, (4) PEEK piston, (5)
collection filament, (6) aerosol inlet, (7) collection flushing inlet, (8) desorption flushing inlet, (9)
exhaust and (10) screw connection for transfer capillary. Positions of O-rings are shown in black.
Figure from Gonser and Held (2013).

28
Chemical analysis
The desorbed particle sample is introduced to the electron impact ionization source of the ToF-MS for ionization and the eventual mass spectrometric analysis. The transport of the
sample from ambient pressure to high vacuum (10-5 mbar) within the ToF-MS is conducted via a deactivated fused silica capillary, with an inner diameter of 25 µm. To
minimize losses in the capillary the whole transfer line is heated to 200 °C. Electron
impact ionization of the gas phase sample is performed with standard 70 eV, therefore the fragmentation patterns for several molecules are known. In the aerosol mass spectrometer
(AMS; Aerodyne Research Inc., Billerica, MA, USA) the same ionization type and
energy is used. Therefore several methods have been developed for the AMS to determine chemical particle compositions on basis of the molecular fragmentation
patterns (e.g. Allan et al., 2004). The used mass spectrometer for CAChUP is a compact time of flight mass spectrometer (CTOF; Tofwerk AG, Thun, Switzerland), yielding a
mass resolving power of 800 Th and a mass accuracy of better than 100 ppm. Typically,
the recorded mass spectra are averaged to obtain a time resolution of one second and saved in a hierarchical data format (HDF5).
4.2 Characterization
In order to characterize the detection limit as well as the capability to collect and detect particles, laboratory experiments were performed with CAChUP. The detection limit was
assessed by manual application of known masses of camphene (C10H16) to the NiCr
filament. For this purpose, a dilution series of differently concentrated camphene-ethanol solutions was produced. 1 µL of the solution was applied to the filament by means of a
5 µL syringe, through an aperture in the housing of the sampling unit. Following the application, the desorption filament was moved to the heated desorption region (80° C),
in order to desorb the gas phase for the eventual analysis in the ToF-MS. Fig. 10 shows
the results of the camphene application experiments. Camphene masses of 5 ng to 5 µg applied to the filament showed a near to linear relation in the signal intensity of the ToF-
MS. Applied camphene masses below 5 ng did not result in clear mass spectra.
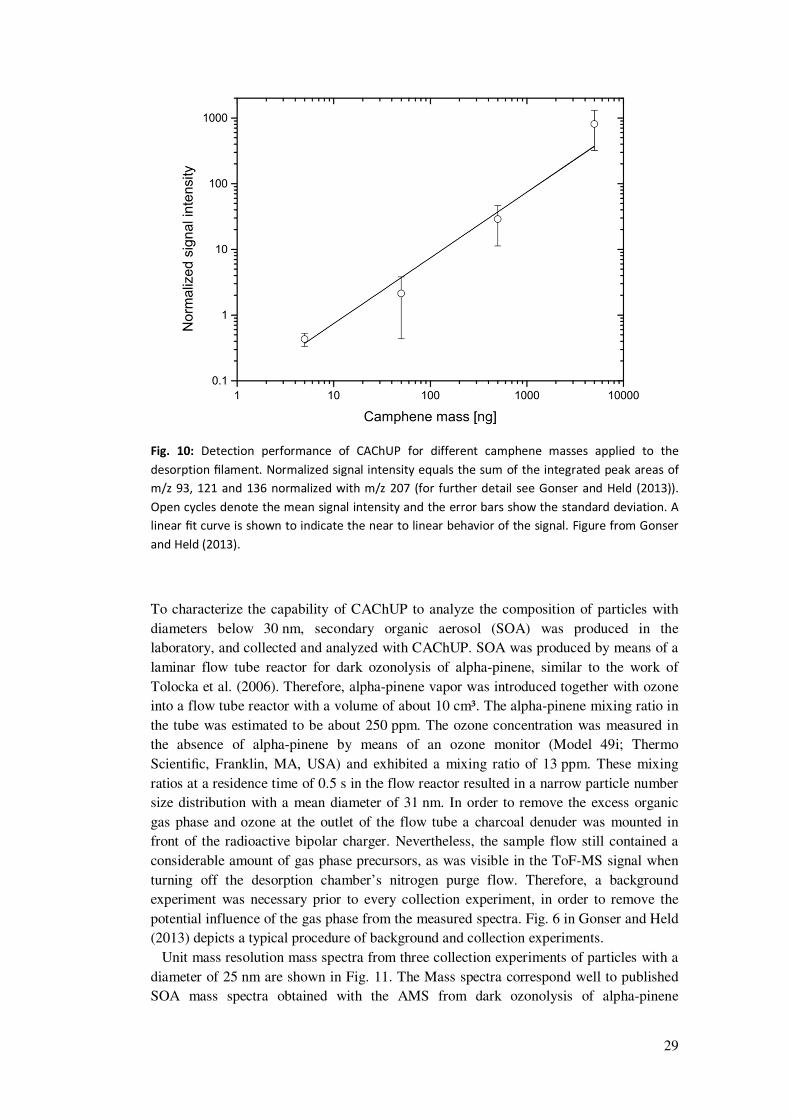
29
Fig. 10: Detection performance of CAChUP for different camphene masses applied to the
desorption filament. Normalized signal intensity equals the sum of the integrated peak areas of
m/z 93, 121 and 136 normalized with m/z 207 (for further detail see Gonser and Held (2013)).
Open cycles denote the mean signal intensity and the error bars show the standard deviation. A
linear fit curve is shown to indicate the near to linear behavior of the signal. Figure from Gonser
and Held (2013).
To characterize the capability of CAChUP to analyze the composition of particles with
diameters below 30 nm, secondary organic aerosol (SOA) was produced in the laboratory, and collected and analyzed with CAChUP. SOA was produced by means of a
laminar flow tube reactor for dark ozonolysis of alpha-pinene, similar to the work of
Tolocka et al. (2006). Therefore, alpha-pinene vapor was introduced together with ozone into a flow tube reactor with a volume of about 10 cm³. The alpha-pinene mixing ratio in
the tube was estimated to be about 250 ppm. The ozone concentration was measured in the absence of alpha-pinene by means of an ozone monitor (Model 49i; Thermo
Scientific, Franklin, MA, USA) and exhibited a mixing ratio of 13 ppm. These mixing
ratios at a residence time of 0.5 s in the flow reactor resulted in a narrow particle number size distribution with a mean diameter of 31 nm. In order to remove the excess organic
gas phase and ozone at the outlet of the flow tube a charcoal denuder was mounted in front of the radioactive bipolar charger. Nevertheless, the sample flow still contained a
considerable amount of gas phase precursors, as was visible in the ToF-MS signal when
turning off the desorption chamber’s nitrogen purge flow. Therefore, a background experiment was necessary prior to every collection experiment, in order to remove the
potential influence of the gas phase from the measured spectra. Fig. 6 in Gonser and Held (2013) depicts a typical procedure of background and collection experiments.
Unit mass resolution mass spectra from three collection experiments of particles with a
diameter of 25 nm are shown in Fig. 11. The Mass spectra correspond well to published SOA mass spectra obtained with the AMS from dark ozonolysis of alpha-pinene
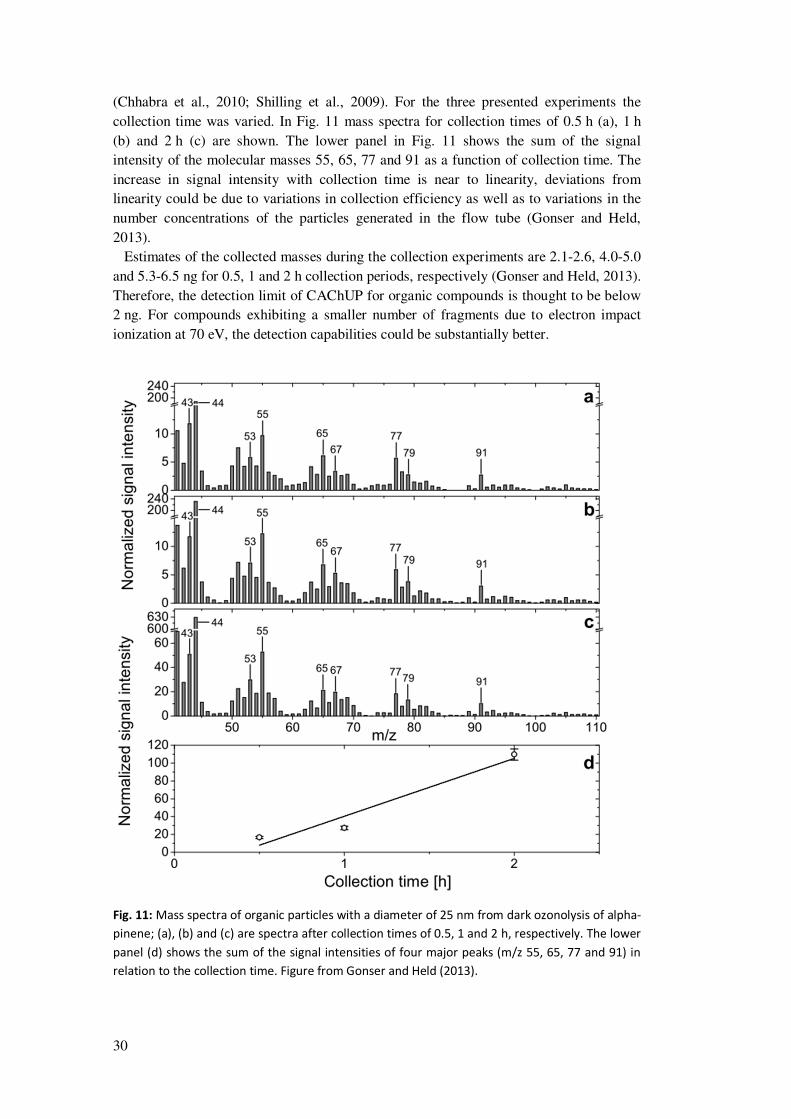
30
(Chhabra et al., 2010; Shilling et al., 2009). For the three presented experiments the
collection time was varied. In Fig. 11 mass spectra for collection times of 0.5 h (a), 1 h
(b) and 2 h (c) are shown. The lower panel in Fig. 11 shows the sum of the signal intensity of the molecular masses 55, 65, 77 and 91 as a function of collection time. The
increase in signal intensity with collection time is near to linearity, deviations from linearity could be due to variations in collection efficiency as well as to variations in the
number concentrations of the particles generated in the flow tube (Gonser and Held,
2013). Estimates of the collected masses during the collection experiments are 2.1-2.6, 4.0-5.0
and 5.3-6.5 ng for 0.5, 1 and 2 h collection periods, respectively (Gonser and Held, 2013).
Therefore, the detection limit of CAChUP for organic compounds is thought to be below 2 ng. For compounds exhibiting a smaller number of fragments due to electron impact
ionization at 70 eV, the detection capabilities could be substantially better.
Fig. 11: Mass spectra of organic particles with a diameter of 25 nm from dark ozonolysis of alpha-
pinene; (a), (b) and (c) are spectra after collection times of 0.5, 1 and 2 h, respectively. The lower
panel (d) shows the sum of the signal intensities of four major peaks (m/z 55, 65, 77 and 91) in
relation to the collection time. Figure from Gonser and Held (2013).

31
5 Conclusions and outlook
In this thesis, considerable effort has been put into a better understanding of atmospheric new particle formation (NPF). This was done by analyzing atmospheric NPF events,
measured at different locations, for the dynamics of ions and neutral particles (Gonser et
al., 2014a, 2014b), and by developing an appropriate measurement technique for the
chemical analysis of ultrafine particles (Gonser and Held, 2013).
Regarding the role of ions in NPF the major conclusions are:
I. From the analyzed data, ions did not appear to be essential for the formation of secondary aerosol particles. At field sites with elevated precursor gas
concentrations, secondary particles seem to form predominantly by neutral nucleation mechanisms. Neutral formation rates are two to three orders of
magnitude higher than the corresponding ion formation rates, and ion
recombination is not able to explain the intense neutral particle formation (Gonser et al., 2014a).
On the other hand, when precursor gas concentrations are low, ions contribute considerably to the initial particle formation (Boulon et al., 2010),
and may be an important factor to trigger NPF.
II. Ions were observed to form earlier than the corresponding neutral particles,
especially at locations with high precursor gas concentrations. Neutral
particle growth rates (GRs) exhibited higher values compared to the ion fraction at small diameters (< 10 to 20 nm). Therefore, when analyzing the
growth behaviour of particles at small diameters, ions and neutral particles have to be considered separately (Gonser et al., 2014b).
III. Calculations of ion recombination during NPF at locations with high precursor gas concentrations resulted in a considerable contribution of ion
recombination to particle growth (Gonser et al., 2014a). On the other hand, when precursor gas concentrations are low the growth process is not clearly
enhanced by ion recombination.
Regarding the development and characterization of the chemical analyzer for charged
ultrafine particles (CAChUP), the major conclusions are:
I. Collection experiments with laboratory generated secondary organic aerosol (SOA) particles of 25 nm diameter were conducted successfully with
CAChUP. Extending the collection periods resulted in increasing signal
intensities in the mass spectrometer (Gonser and Held, 2013).
II. The mass spectra obtained from the collection experiments were comparable to published mass spectra of larger SOA particles from dark ozonolysis of
alpha-pinene (Gonser and Held, 2013).
32
III. From the direct application of known masses of camphene to the collection
filament and the collection experiments, the detection limit of CAChUP is
estimated to be better than 2 ng (Gonser and Held, 2013). Therefore, field experiments with CAChUP are feasible during NPF events
with high particle concentrations. When sampling particles with 20 nm in diameter, assuming particle concentrations of 3000 cm-3 in this diameter, a
sampling time of about 8 hours would be necessary with the current setup.
For particles with a diameter of 30 nm the time necessary to collect 2 ng will be about 3 hours.
The current setup is ready for analyzing particles with 30 nm diameter or
larger in reasonable time frames during atmospheric NPF. However, for the analysis of particles with smaller diameters, the collected mass needs to be
enhanced. This could be done by increasing the flow rate through the collection unit, enhancing the collection efficiency to the NiCr filament, and
by realizing more efficient particle charging.
Future applications of CAChUP in the field and in the laboratory will shed more light on the mechanisms governing particle formation and growth.
For example, experiments to investigate the role of ion recombination on particle growth from a chemical point of view are now possible with the help of CAChUP. In
flow tube experiments, two different organic precursor gases could be used which yield
distinct differences in the particle mass spectra (e.g. alpha-pinene and mesitylene). Exposing one of the precursor gases to elevated ion concentrations should result in
particles predominantly composed of oxidation products of this gas. Therefore, ion recombination could be investigated directly from the chemical composition of secondary
organic particles with CAChUP.

33
Nomenclature
Acronyms
AMS Aerosol mass spectrometer
CAChUP Chemical analyzer for charge ultrafine particles
CPC Condensation particle counter
CTOF Compact time of flight mass spectrometer
DMA/rDMA Differential mobility analyzer / radial differential mobility
analyzer
EUCAARI European integrated project on aerosol cloud climate and air
quality
GR Growth rate of a particle population
HDF5 Hierarchical data format
IIN Ion induced nucleation
IMN Ion mediated nucleation
JFJ Jungfraujoch field station, Switzerland
MCM Maximum concentration method to determine the growth rate of a particle population
MFM Mode fitting method to determine the growth rate of a particle
population
MLP Melpitz field station, Germany
NAIS Neutral cluster and air ion spectrometer
NAMS Nano aerosol mass spectrometer
NiCr Nichrome – an alloy of nickel and chromium
NPF New particle formation
PDD Puy de Dôme field station, France
PEEK Polyetheretherketone – an organic polymer thermoplastic
SOA Secondary organic aerosol

34
TDCIMS Thermal desorption chemical ionization mass spectrometer
ToF-MS Time of flight mass spectrometer
WST Waldstein field station, Germany
Symbols
αjk Size dependent ion recombination coefficient [cm³ s-1]
βij Size dependent ion attachment coefficient [cm³ s-1]
CharS Charging sink [s-1]
CoagS Coagulation sink [s-1]
Dp Particle mobility diameter [nm]
Dm Mobility diameter [nm]
∆t Time difference in the occurrence of ions and neutral particles [min.]
GR Growth rate of a particle population [nm h-1]
J Formation rate [cm-3 s-1]
N Particle or ion number concentration [cm-3]
pi Probability of a particle of size i to carry one elementary charge
Q Cluster ion production rate [cm-3 s-1]
rjk Diameter allocating coefficient
t time [s]

35
Individual contribution to the joint
manuscripts
Gonser, S. G., Klein, F., Birmili, W., Größ, J., Kulmala, M., Manninen, H. E., Wiedensohler, A. and Held, A.: Ion - particle interactions during particle formation
and growth at a coniferous forest site in central Europe, Atmospheric Chem. Phys. Discuss., 14(1), 171–211, doi:10.5194/acpd-14-171-2014, 2014.
All data analysis was performed by myself. Interpretation of data and results was done largely by myself. The complete manuscript was written by myself. F. Klein largely
conducted the field measurements. W. Birmili, J. Größ, M. Kulmala and A. Wiedensohler
provided the measurement technique and helped in editing the manuscript. H. E. Manninen helped in editing the manuscript. A. Held helped to conduct the field
measurements, helped to interpret the data, discussed the results and helped in writing the manuscript.
Gonser, S. G., Birmili, W., Rose, C., Sellegri, K. and Held, A.: Occurrence and growth
of ions and neutral particles during particle formation events in four different
environments, to be submitted, 2014.
All data analysis was performed by myself. Interpretation of data and results was done
largely by myself. The complete manuscript was written by myself. W. Birmili, C. Rose,
K. Sellegri provided data and helped in editing the manuscript. A. Held provided data, helped to interpret the data, discussed the results and helped in writing the manuscript.
Gonser, S. G. and Held, A.: A chemical analyzer for charged ultrafine particles, Atmospheric Meas. Tech., 6(9), 2339–2348, doi:10.5194/amt-6-2339-2013, 2013.
The idea, planning and construction of the collection unit was done by myself. The experimental setup was partly my idea. All data analysis was performed by myself.
Interpretation of data and results was done largely by myself. The manuscript was largely
written by myself. A. Held contributed the overall idea for the instrument, contributed partly to the experimental setup, helped in the interpretation of the data and results and
helped writing the manuscript.

36
References
Allan, J. D., Delia, A. E., Coe, H., Bower, K. N., Alfarra, M. R., Jimenez, J. L., Middlebrook, A. M., Drewnick, F., Onasch, T. B., Canagaratna, M. R., Jayne, J. T. and Worsnop, D. R.: A generalised method for the extraction of chemically resolved mass spectra from aerodyne aerosol mass spectrometer data, J. Aerosol Sci., 35(7), 909–922, doi:10.1016/j.jaerosci.2004.02.007, 2004.
Asmi, E., Sipilä, M., Manninen, H. E., Vanhanen, J., Lehtipalo, K., Gagné, S., Neitola, K., Mirme, A., Mirme, S., Tamm, E., Uin, J., Komsaare, K., Attoui, M. and Kulmala, M.: Results of the first air ion spectrometer calibration and intercomparison workshop, Atmospheric Chem. Phys., 8(5), 17257–17295, doi:10.5194/acpd-8-17257-2008, 2009.
Berberich, C.: Untersuchung von sekundären Aerosolpartikeln aus organischen Vorläufergasen mit dem Aerosolmassenspektrometer CAChUP: Laborversuche zur Vorbereitung auf den Feldeinsatz, Master thesis, University of Bayreuth, Bayreuth., 2014.
Boucher, O., Randall, D., Artaxo, P., Bretherton, C., Feingold, G., Forster, P., Kerminen, V.-M., Kondo, Y., Liao, H., Lohmann, U., Rasch, P., Satheesh, S. K., Sherwood, S., Stevens, B. and Zhang, X. Y.: Clouds and Aerosols, in Climate Change 2013: The Physical Science Basis, pp. 571–657, Cambridge University Press, Cambridge., 2013.
Boulon, J., Sellegri, K., Venzac, H., Picard, D., Weingartner, E., Wehrle, G., Collaud Coen, M., Bütikofer, R., Flückiger, E., Baltensperger, U. and Laj, P.: New particle formation and ultrafine charged aerosol climatology at a high altitude site in the Alps (Jungfraujoch, 3580 m a.s.l., Switzerland), Atmos Chem Phys, 10(19), 9333–9349, doi:10.5194/acp-10-9333-2010, 2010.
Boy, M., Karl, T., Turnipseed, A., Mauldin, R. L., Kosciuch, E., Greenberg, J., Rathbone, J., Smith, J., Held, A., Barsanti, K., Wehner, B., Bauer, S., Wiedensohler, A., Bonn, B., Kulmala, M. and Guenther, A.: New particle formation in the Front Range of the Colorado Rocky Mountains, Atmospheric Chem. Phys., 8(6), 1577–1590, doi:10.5194/acp-8-1577-2008, 2008.
Burkhardt, J., Kaiser, H., Kappen, L. and Goldbach, H. E.: The possible role of aerosols on stomatal conductivity for water vapour, Basic Appl. Ecol., 2(4), 351–364, doi:10.1078/1439-1791-00062, 2001.
Chhabra, P. S., Flagan, R. C. and Seinfeld, J. H.: Elemental analysis of chamber organic aerosol using an aerodyne high-resolution aerosol mass spectrometer, Atmospheric Chem. Phys., 10(9), 4111–4131, doi:10.5194/acp-10-4111-2010, 2010.
Deshler, T.: A review of global stratospheric aerosol: Measurements, importance, life cycle, and local stratospheric aerosol, Atmospheric Res., 90(2–4), 223–232, doi:10.1016/j.atmosres.2008.03.016, 2008.
Ehn, M., Junninen, H., Petaja, T., Kurten, T., Kerminen, V.-M., Schobesberger, S., Manninen, H. E., Ortega, I. K., Vehkamaki, H., Kulmala, M. and Worsnop, D. R.: Composition and temporal behavior of ambient ions in the boreal forest, Atmospheric Chem. Phys., 10(17), 8513–8530, doi:10.5194/acp-10-8513-2010, 2010.

37
Ehn, M., Petäjä, T., Birmili, W., Junninen, H., Aalto, P. and Kulmala, M.: Non-volatile residuals of newly formed atmospheric particles in the boreal forest, Atmos Chem Phys, 7(3), 677–684, doi:10.5194/acp-7-677-2007, 2007.
Enghoff, M. B. and Svensmark, H.: The role of atmospheric ions in aerosol nucleation – a review, Atmospheric Chem. Phys., 8(16), 4911–4923, doi:10.5194/acp-8-4911-2008, 2008.
Fuchs, N. A.: On the stationary charge distribution on aerosol particles in a bipolar ionic atmosphere, Geofis. Pura E Appl., 56(1), 185–193, doi:10.1007/BF01993343, 1963.
Gagné, S.: On the charging state of atmospheric aerosols and ion-induced nucleation, [online] Available from: https://helda.helsinki.fi/handle/10138/26362 (Accessed 17 December 2013), 2011.
Gagné, S., Laakso, L., Petäjä, T., Kerminen, V.-M. and Kulmala, M.: Analysis of one year of Ion-DMPS data from the SMEAR II station, Finland, Tellus B, 60(3), 318–329, doi:10.1111/j.1600-0889.2008.00347.x, 2008.
Gagné, S., Lehtipalo, K., Manninen, H. E., Nieminen, T., Schobesberger, S., Franchin, A., Yli-Juuti, T., Boulon, J., Sonntag, A., Mirme, S., Mirme, A., Hõrrak, U., Petäjä, T., Asmi, E. and Kulmala, M.: Intercomparison of air ion spectrometers: an evaluation of results in varying conditions, Atmospheric Meas. Tech., 4(5), 805–822, doi:10.5194/amt-4-805-2011, 2011.
Gagné, S., Leppä, J., Petäjä, T., McGrath, M. J., Vana, M., Kerminen, V.-M., Laakso, L. and Kulmala, M.: Aerosol charging state at an urban site: new analytical approach and implications for ion-induced nucleation, Atmospheric Chem. Phys., 12(10), 4647–4666, doi:10.5194/acp-12-4647-2012, 2012.
Gagné, S., Nieminen, T., Kurtén, T., Manninen, H. E., Petäjä, T., Laakso, L., Kerminen, V.-M., Boy, M. and Kulmala, M.: Factors influencing the contribution of ion-induced nucleation in a boreal forest, Finland, Atmospheric Chem. Phys., 10(8), 3743–3757, doi:10.5194/acp-10-3743-2010, 2010.
Geiser, M., Rothen-Rutishauser, B., Kapp, N., Schurch, S., Kreyling, W., Schulz, H., Semmler, M., Hof, V. I., Heyder, J. and Gehr, P.: Ultrafine Particles Cross Cellular Membranes by Nonphagocytic Mechanisms in Lungs and in Cultured Cells, Environ. Health Perspect., 113(11), 1555–1560, doi:10.1289/ehp.8006, 2005.
Gerdien, H.: Demonstration eines Apparates zur absoluten Messung der elektrischen Leitfähigkeit der Luft, Phys. Z., (6), 800–801, 1905.
Gonser, S. G., Klein, F., Birmili, W., Größ, J., Kulmala, M., Manninen, H. E., Wiedensohler, A. and Held, A.: Ion -- particle interactions during particle formation and growth at a coniferous forest site in central Europe, Atmospheric Chem. Phys. Discuss., 14(1), 171–211, doi:10.5194/acpd-14-171-2014, 2014a.
Gonser, S. G., Birmili, W., Rose, C., Sellegri, K. and Held, A.: Occurrence and growth of ions and neutral particles during particle formation events in four different environments, to be submitted., 2014b.
Gonser, S. G. and Held, A.: A chemical analyzer for charged ultrafine particles, Atmospheric Meas. Tech., 6(9), 2339–2348, doi:10.5194/amt-6-2339-2013, 2013.

38
Han, B., Kim, H.-J., Kim, Y.-J. and Sioutas, C.: Unipolar Charging of Fine and Ultra-Fine Particles Using Carbon Fiber Ionizers, Aerosol Sci. Technol., 42(10), 793–800, doi:10.1080/02786820802339553, 2008.
Held, A., Rathbone, G. J. and Smith, J. N.: A Thermal Desorption Chemical Ionization Ion Trap Mass Spectrometer for the Chemical Characterization of Ultrafine Aerosol Particles, Aerosol Sci. Technol., 43(3), 264–272, doi:10.1080/02786820802603792, 2009.
Hess, V. F.: Über Beobachtungen der durchdringenden Strahlung bei sieben Freiballonfahrten, Phys. Zeitschr, 8, 1084–1091, 1912.
Hinds, W. C.: Aerosol technology: properties, behavior, and measurement of airborne particles, Wiley, New York., 1999.
Hirsikko, A., Bergman, T., Laakso, L., Dal Maso, M., Riipinen, I., Horrak, U. and Kulmala, M.: Identification and classification of the formation of intermediate ions measured in boreal forest, Atmospheric Chem. Phys., 7, 201–210, 2007a.
Hirsikko, A., Laakso, L., Hörrak, U., Aalto, P. P., Kerminen, V.-M. and Kulmala, M.: Annual and size dependent variation of growth rates and ion concentrations in boreal forest, Boreal Environ. Res., 10(5), 357–369, 2005.
Hirsikko, A., Nieminen, T., Gagné, S., Lehtipalo, K., Manninen, H. E., Ehn, M., Hõrrak, U., Kerminen, V.-M., Laakso, L., McMurry, P. H., Mirme, A., Mirme, S., Petäjä, T., Tammet, H., Vakkari, V., Vana, M. and Kulmala, M.: Atmospheric ions and nucleation: a review of observations, Atmospheric Chem. Phys., 11(2), 767–798, doi:10.5194/acp-11-767-2011, 2011.
Hirsikko, A., Paatero, J., Hatakka, J. and Kulmala, M.: The 222Rn activity concentration, external radiation dose and air ion production rates in a boreal forest in Finland between March 2000 and June 2006, Boreal Environ. Res., 12(3), 265–278, 2007b.
Hoppel, W. A. and Frick, G. M.: Ion—Aerosol Attachment Coefficients and the Steady-State Charge Distribution on Aerosols in a Bipolar Ion Environment, Aerosol Sci. Technol., 5(1), 1–21, doi:10.1080/02786828608959073, 1986.
Hõrrak, U., Aalto, P. P., Salm, J., Komsaare, K., Tammet, H., Mäkelä, J. M., Laakso, L. and Kulmala, M.: Variation and balance of positive air ion concentrations in a boreal forest, Atmos Chem Phys, 8(3), 655–675, doi:10.5194/acp-8-655-2008, 2008.
Hussein, T., Dal Maso, M., Petäjä, T., Koponen, I. K., Paatero, P., Aalto, P. P., Hämeri, K. and Kulmala, M.: Evaluation of an automatic algorithm for fitting the particle number size distributions, Boreal Environ. Res., 10(5), 337–355, 2005.
Iida, K., Stolzenburg, M., McMurry, P., Dunn, M. J., Smith, J. N., Eisele, F. and Keady, P.: Contribution of ion-induced nucleation to new particle formation: Methodology and its application to atmospheric observations in Boulder, Colorado, J. Geophys. Res., 111(D23), doi:10.1029/2006JD007167, 2006.
Jokinen, T., Sipilä, M., Junninen, H., Ehn, M., Lönn, G., Hakala, J., Petäjä, T., Mauldin, R. L., Kulmala, M. and Worsnop, D. R.: Atmospheric sulphuric acid and neutral cluster measurements using CI-APi-TOF, Atmospheric Chem. Phys., 12(9), 4117–4125, doi:10.5194/acp-12-4117-2012, 2012.
39
Kazil, J., Harrison, R. G. and Lovejoy, E. R.: Tropospheric New Particle Formation and the Role of Ions, Space Sci. Rev., 137(1-4), 241–255, doi:10.1007/s11214-008-9388-2, 2008.
Kemski, J., Siehl, A., Stegemann, R. and Valdivia-Manchego, M.: Mapping the geogenic radon potential in Germany, Sci. Total Environ., 272(1–3), 217–230, doi:10.1016/S0048-9697(01)00696-9, 2001.
Kontkanen, J., Lehtinen, K. E. J., Nieminen, T., Manninen, H. E., Lehtipalo, K., Kerminen, V.-M. and Kulmala, M.: Estimating the contribution of ion–ion recombination to sub-2 nm cluster concentrations from atmospheric measurements, Atmospheric Chem. Phys. Discuss., 13(8), 20809–20837, doi:10.5194/acpd-13-20809-2013, 2013.
Kulmala, M., Asmi, A., Lappalainen, H. K., Baltensperger, U., Brenguier, J.-L., Facchini, M. C., Hansson, H.-C., Hov, Ø., O’Dowd, C. D., Pöschl, U., Wiedensohler, A., Boers, R., Boucher, O., de Leeuw, G., Denier van der Gon, H. A. C., Feichter, J., Krejci, R., Laj, P., Lihavainen, H., Lohmann, U., McFiggans, G., Mentel, T., Pilinis, C., Riipinen, I., Schulz, M., Stohl, A., Swietlicki, E., Vignati, E., Alves, C., Amann, M., Ammann, M., Arabas, S., Artaxo, P., Baars, H., Beddows, D. C. S., Bergström, R., Beukes, J. P., Bilde, M., Burkhart, J. F., Canonaco, F., Clegg, S. L., Coe, H., Crumeyrolle, S., D’Anna, B., Decesari, S., Gilardoni, S., Fischer, M., Fjaeraa, A. M., Fountoukis, C., George, C., Gomes, L., Halloran, P., Hamburger, T., Harrison, R. M., Herrmann, H., Hoffmann, T., Hoose, C., Hu, M., Hyvärinen, A., Hõrrak, U., Iinuma, Y., Iversen, T., Josipovic, M., Kanakidou, M., Kiendler-Scharr, A., Kirkevåg, A., Kiss, G., Klimont, Z., Kolmonen, P., Komppula, M., Kristjánsson, J.-E., Laakso, L., Laaksonen, A., Labonnote, L., Lanz, V. A., Lehtinen, K. E. J., Rizzo, L. V., Makkonen, R., Manninen, H. E., McMeeking, G., Merikanto, J., Minikin, A., Mirme, S., Morgan, W. T., Nemitz, E., O’Donnell, D., Panwar, T. S., Pawlowska, H., Petzold, A., Pienaar, J. J., Pio, C., Plass-Duelmer, C., Prévôt, A. S. H., Pryor, S., Reddington, C. L., Roberts, G., Rosenfeld, D., Schwarz, J., Seland, Ø., et al.: General overview: European Integrated project on Aerosol Cloud Climate and Air Quality interactions (EUCAARI) – integrating aerosol research from nano to global scales, Atmos Chem Phys, 11(24), 13061–13143, doi:10.5194/acp-11-13061-2011, 2011.
Kulmala, M., Kontkanen, J., Junninen, H., Lehtipalo, K., Manninen, H. E., Nieminen, T., Petaja, T., Sipila, M., Schobesberger, S., Rantala, P., Franchin, A., Jokinen, T., Jarvinen, E., Aijala, M., Kangasluoma, J., Hakala, J., Aalto, P. P., Paasonen, P., Mikkila, J., Vanhanen, J., Aalto, J., Hakola, H., Makkonen, U., Ruuskanen, T., Mauldin, R. L., Duplissy, J., Vehkamaki, H., Back, J., Kortelainen, A., Riipinen, I., Kurten, T., Johnston, M. V., Smith, J. N., Ehn, M., Mentel, T. F., Lehtinen, K. E. J., Laaksonen, A., Kerminen, V.-M. and Worsnop, D. R.: Direct Observations of Atmospheric Aerosol Nucleation, Science, 339(6122), 943–946, doi:10.1126/science.1227385, 2013.
Kulmala, M., Petäjä, T., Nieminen, T., Sipilä, M., Manninen, H. E., Lehtipalo, K., Dal Maso, M., Aalto, P. P., Junninen, H., Paasonen, P., Riipinen, I., Lehtinen, K. E. J., Laaksonen, A. and Kerminen, V.-M.: Measurement of the nucleation of atmospheric aerosol particles, Nat. Protoc., 7(9), 1651–1667, doi:10.1038/nprot.2012.091, 2012.
Kulmala, M., Vehkamäki, H., Petäjä, T., Dal Maso, M., Lauri, A., Kerminen, V.-M., Birmili, W. and McMurry, P. H.: Formation and growth rates of ultrafine atmospheric particles: a review of observations, J. Aerosol Sci., 35(2), 143–176, doi:10.1016/j.jaerosci.2003.10.003, 2004.
40
Laakso, L., Gagné, S., Petäjä, T., Hirsikko, A., Aalto, P. P., Kulmala, M. and Kerminen, V.-M.: Detecting charging state of ultra-fine particles: instrumental development and ambient measurements, Atmospheric Chem. Phys., 7(5), 1333–1345, doi:10.5194/acp-7-1333-2007, 2007.
Laakso, L., Petäjä, T., Lehtinen, K. E. J., Kulmala, M., Paatero, J., Hõrrak, U., Tammet, H. and Joutsensaari, J.: Ion production rate in a boreal forest based on ion, particle and radiation measurements, Atmos Chem Phys, 4(7), 1933–1943, doi:10.5194/acp-4-1933-2004, 2004.
Leppä, J., Gagné, S., Manninen, H. E. and Nieminen, T.: Ion-UHMA: a model for simulating the dynamics of neutral and charged aerosol particles., Boreal Environ. Res., 14(4), 559–575, 2009.
Lüers, J., Smaczny, J., Kies, A. and Bareiss, J.: Dynamik der Austauschprozesse von CO2 und Radon zwischen Waldboden, Waldbestand und Atmosphäre, Berichte Meteorol. Inst. Uiversität Freibg., (16), 147–52, 2007.
Lugauer, M., Baltensperger, U., Furger, M., Gäggeler, H. W., Jost, D. T., Nyeki, S. and Schwikowski, M.: Influences of vertical transport and scavenging on aerosol particle surface area and radon decay product concentrations at the Jungfraujoch (3454 m above sea level), J. Geophys. Res. Atmospheres, 105(D15), 19869–19879, doi:10.1029/2000JD900184, 2000.
Lushnikov, A. A. and Kulmala, M.: Charging of aerosol particles in the near free-molecule regime, Eur. Phys. J. - At. Mol. Opt. Plasma Phys., 29(3), 345–355, doi:10.1140/epjd/e2004-00047-9, 2004.
Makela, J. M., Yli-Koivisto, S., Hiltunen, V., Seidl, W., Swietlicki, E., Teinila, K., Sillanpaa, M., Koponen, I. K., Paatero, J., Rosman, K. and Hameri, K.: Chemical composition of aerosol during particle formation events in boreal forest, Tellus Ser. B-Chem. Phys. Meteorol., 53(4), 380–393, doi:10.1034/j.1600-0889.2001.530405.x, 2001.
Manninen, H. E., Franchin, A., Schobesberger, S., Hirsikko, A., Hakala, J., Skromulis, A., Kangasluoma, J., Ehn, M., Junninen, H., Mirme, A., Mirme, S., Sipilä, M., Petäjä, T., Worsnop, D. R. and Kulmala, M.: Characterisation of corona-generated ions used in a Neutral cluster and Air Ion Spectrometer (NAIS), Atmospheric Meas. Tech., 4(12), 2767–2776, doi:10.5194/amt-4-2767-2011, 2011.
Manninen, H. E., Nieminen, T., Asmi, E., Gagné, S., Häkkinen, S., Lehtipalo, K., Aalto, P., Vana, M., Mirme, A., Mirme, S., Hõrrak, U., Plass-Dülmer, C., Stange, G., Kiss, G., Hoffer, A., Törő, N., Moerman, M., Henzing, B., de Leeuw, G., Brinkenberg, M., Kouvarakis, G. N., Bougiatioti, A., Mihalopoulos, N., O’Dowd, C., Ceburnis, D., Arneth, A., Svenningsson, B., Swietlicki, E., Tarozzi, L., Decesari, S., Facchini, M. C., Birmili, W., Sonntag, A., Wiedensohler, A., Boulon, J., Sellegri, K., Laj, P., Gysel, M., Bukowiecki, N., Weingartner, E., Wehrle, G., Laaksonen, A., Hamed, A., Joutsensaari, J., Petäjä, T., Kerminen, V.-M. and Kulmala, M.: EUCAARI ion spectrometer measurements at 12 European sites – analysis of new particle formation events, Atmospheric Chem. Phys., 10(16), 7907–7927, doi:10.5194/acp-10-7907-2010, 2010.
Manninen, H. E., Nieminen, T., Riipinen, I., Yli-Juuti, T., Gagné, S., Asmi, E., Aalto, P. P., Petäjä, T., Kerminen, V.-M. and Kulmala, M.: Charged and total particle formation and growth rates during EUCAARI 2007 campaign in Hyytiälä, Atmospheric Chem. Phys., 9(12), 4077–4089, doi:10.5194/acp-9-4077-2009, 2009a.
41
Manninen, H. E., Petaja, T., Asmi, E., Riipinen, I., Nieminen, T., Mikkila, J., Horrak, U., Mirme, A., Mirme, S., Laakso, L., Kerminen, V.-M. and Kulmala, M.: Long-term field measurements of charged and neutral clusters using Neutral cluster and Air Ion Spectrometer (NAIS), Boreal Environ. Res., 14(4), 591–605, 2009b.
Merikanto, J., Spracklen, D. V., Mann, G. W., Pickering, S. J. and Carslaw, K. S.: Impact of nucleation on global CCN, Atmospheric Chem. Phys., 9(21), 8601–8616, doi:10.5194/acp-9-8601-2009, 2009.
Metzger, A., Verheggen, B., Dommen, J., Duplissy, J., Prevot, A. S. H., Weingartner, E., Riipinen, I., Kulmala, M., Spracklen, D. V., Carslaw, K. S. and Baltensperger, U.: Evidence for the role of organics in aerosol particle formation under atmospheric conditions, Proc. Natl. Acad. Sci. U. S. A., 107(15), 6646–6651, doi:10.1073/pnas.0911330107, 2010.
Mirme, S. and Mirme, A.: The mathematical principles and design of the NAIS – a spectrometer for the measurement of cluster ion and nanometer aerosol size distributions, Atmospheric Meas. Tech., 6(4), 1061–1071, doi:10.5194/amt-6-1061-2013, 2013.
Nadykto, A. B. and Yu, F.: Uptake of neutral polar vapor molecules by charged clusters/particles: Enhancement due to dipole-charge interaction, J. Geophys. Res. Atmospheres, 108(D23), n/a–n/a, doi:10.1029/2003JD003664, 2003.
Nieminen, T., Paasonen, P., Manninen, H. E., Sellegri, K., Kerminen, V.-M. and Kulmala, M.: Parameterization of ion-induced nucleation rates based on ambient observations, Atmos Chem Phys, 11(7), 3393–3402, doi:10.5194/acp-11-3393-2011, 2011.
Pope, C. A. and Dockery, D. W.: Health Effects of Fine Particulate Air Pollution: Lines that Connect, J. Air Waste Manag. Assoc., 56(6), 709–742, doi:10.1080/10473289.2006.10464485, 2006.
Pruppacher, H. R. and Klett, J. D.: Microphysics of Clouds and Precipitation, Springer, Heidelberg., 2010.
Riipinen, I., Manninen, H. E., Yli-Juuti, T., Boy, M., Sipilä, M., Ehn, M., Junninen, H., Petäjä, T. and Kulmala, M.: Applying the Condensation Particle Counter Battery (CPCB) to study the water-affinity of freshly-formed 2–9 nm particles in boreal forest, Atmospheric Chem. Phys., 9(10), 3317–3330, doi:10.5194/acp-9-3317-2009, 2009.
Rückerl, R., Schneider, A., Breitner, S., Cyrys, J. and Peters, A.: Health effects of particulate air pollution: A review of epidemiological evidence, Inhal. Toxicol., 23(10), 555–592, doi:10.3109/08958378.2011.593587, 2011.
Savitzky, A. and Golay, M. J.: Smoothing and Differentiation of Data by Simplified Least Squares Procedures, Anal. Chem., 36(8), 1627, 1964.
Seinfeld, J. H. and Pandis, S. N.: Atmospheric chemistry and physics: from air pollution to climate change, 2nd ed., J. Wiley, Hoboken, N.J., 2006.
Shilling, J. E., Chen, Q., King, S. M., Rosenoern, T., Kroll, J. H., Worsnop, D. R., DeCarlo, P. F., Aiken, A. C., Sueper, D., Jimenez, J. L. and Martin, S. T.: Loading-dependent elemental composition of α-pinene SOA particles, Atmospheric Chem. Phys., 9(3), 771–782, doi:10.5194/acp-9-771-2009, 2009.
42
Smith, J. N., Dunn, M. J., VanReken, T. M., Iida, K., Stolzenburg, M. R., McMurry, P. H. and Huey, L. G.: Chemical composition of atmospheric nanoparticles formed from nucleation in Tecamac, Mexico: Evidence for an important role for organic species in nanoparticle growth, Geophys. Res. Lett., 35(4), doi:10.1029/2007GL032523, 2008.
Smith, J. N., Moore, K. F., McMurry, P. H. and Eisele, F. L.: Atmospheric Measurements of Sub-20 nm Diameter Particle Chemical Composition by Thermal Desorption Chemical Ionization Mass Spectrometry, Aerosol Sci. Technol., 38(2), 100–110, doi:10.1080/02786820490249036, 2004.
Spracklen, D. V., Carslaw, K. S., Merikanto, J., Mann, G. W., Reddington, C. L., Pickering, S., Ogren, J. A., Andrews, E., Baltensperger, U., Weingartner, E., Boy, M., Kulmala, M., Laakso, L., Lihavainen, H., Kivekäs, N., Komppula, M., Mihalopoulos, N., Kouvarakis, G., Jennings, S. G., O’Dowd, C., Birmili, W., Wiedensohler, A., Weller, R., Gras, J., Laj, P., Sellegri, K., Bonn, B., Krejci, R., Laaksonen, A., Hamed, A., Minikin, A., Harrison, R. M., Talbot, R. and Sun, J.: Explaining global surface aerosol number concentrations in terms of primary emissions and particle formation, Atmospheric Chem. Phys., 10(10), 4775–4793, doi:10.5194/acp-10-4775-2010, 2010.
Stoorvogel, J. J., Breemen, N. V. and Jassen, B. H.: The nutrient input by Harmattan dust to a forest ecosystem in Côte d’Ivoire, Africa, Biogeochemistry, 37(2), 145–157, doi:10.1023/A:1005734225727, 1997.
Tammet, H., Hõrrak, U. and Kulmala, M.: Negatively charged nanoparticles produced by splashing of water, Atmos Chem Phys, 9(2), 357–367, doi:10.5194/acp-9-357-2009, 2009.
Tammet, H., Hõrrak, U., Laakso, L. and Kulmala, M.: Factors of air ion balance in a coniferous forest according to measurements in Hyytiälä, Finland, Atmos Chem Phys, 6(11), 3377–3390, doi:10.5194/acp-6-3377-2006, 2006.
Tammet, H. and Kulmala, M.: Simulation tool for atmospheric aerosol nucleation bursts, J. Aerosol Sci., 36(2), 173–196, doi:10.1016/j.jaerosci.2004.08.004, 2005.
Tolocka, M. P., Heaton, K. J., Dreyfus, M. A., Wang, S., Zordan, C. A., Saul, T. D. and Johnston, M. V.: Chemistry of particle inception and growth during α-pinene ozonolysis, Environ. Sci. Technol., 40(6), 1843–1848, 2006.
Venzac, H., Sellegri, K., Villani, P., Picard, D. and Laj, P.: Seasonal variation of aerosol size distributions in the free troposphere and residual layer at the puy de Dôme station, France, Atmos Chem Phys, 9(4), 1465–1478, doi:10.5194/acp-9-1465-2009, 2009.
Virkkula, A., Hirsikko, A., Vana, M., Aalto, P. P., Hillamo, R. and Kulmala, M.: Charged particle size distributions and analysis of particle formation events at the Finnish Antarctic research station Aboa, Boreal Environ. Res., 12(3), 397–408, 2007.
Voisin, D., Smith, J. N., Sakurai, H., McMurry, P. H. and Eisele, F. L.: Thermal desorption chemical ionization mass spectrometer for ultrafine particle chemical composition, Aerosol Sci. Technol., 37(6), 471–475, 2003.
Wang, S., Zordan, C. A. and Johnston, M. V.: Chemical Characterization of Individual, Airborne Sub-10-nm Particles and Molecules, Anal. Chem., 78(6), 1750–1754, doi:10.1021/ac052243l, 2006.
43
Wiedensohler, A.: An approximation of the bipolar charge distribution for particles in the submicron size range, J. Aerosol Sci., 19(3), 387–389, doi:10.1016/0021-8502(88)90278-9, 1988.
Winkler, P. M., Steiner, G., Vrtala, A., Vehkamaki, H., Noppel, M., Lehtinen, K. E. J., Reischl, G. P., Wagner, P. E. and Kulmala, M.: Heterogeneous nucleation experiments bridging the scale from molecular ion clusters to nanoparticles, Science, 319(5868), 1374–1377, doi:10.1126/science.1149034, 2008.
Yli-Juuti, T., Nieminen, T., Hirsikko, A., Aalto, P. P., Asmi, E., Hõrrak, U.,
Manninen, H. E., Patokoski, J., Dal Maso, M., Petäjä, T., Rinne, J., Kulmala, M., and
Riipinen, I.: Growth rates of nucleation mode particles in Hyytiälä during 2003−2009: variation with particle size, season, data analysis method and ambient conditions, Atmos.
Chem. Phys., 11, 12865-12886, doi:10.5194/acp-11-12865-2011, 2011.
Yu, F.: From molecular clusters to nanoparticles: second-generation ion-mediated nucleation model, Atmospheric Chem. Phys., 6(12), 5193–5211, doi:10.5194/acp-6-5193-2006, 2006.
Yu, F. and Turco, R.: Case studies of particle formation events observed in boreal forests: implications for nucleation mechanisms, Atmospheric Chem. Phys., 8(20), 6085–6102, doi:10.5194/acp-8-6085-2008, 2008.
Yu, F. and Turco, R. P.: The size-dependent charge fraction of sub-3-nm particles as a key diagnostic of competitive nucleation mechanisms under atmospheric conditions, Atmospheric Chem. Phys., 11(18), 9451–9463, doi:10.5194/acp-11-9451-2011, 2011.
Zhang, R.: Getting to the Critical Nucleus of Aerosol Formation, Science, 328(5984), 1366–1367, doi:10.1126/science.1189732, 2010.
Zhang, S. H. and Flagan, R. C.: Resolution of the radial differential mobility analyzer for ultrafine particles, J. Aerosol Sci., 27(8), 1179–1200, doi:10.1016/0021-8502(96)00036-5, 1996.
Zhang, S.-H., Akutsu, Y., Russell, L. M., Flagan, R. C. and Seinfeld, J. H.: Radial Differential Mobility Analyzer, Aerosol Sci. Technol., 23(3), 357–372, doi:10.1080/02786829508965320, 1995.
Zordan, C. A., Wang, S. and Johnston, M. V.: Time-Resolved Chemical Composition of Individual Nanoparticles in Urban Air, Environ. Sci. Technol., 42(17), 6631–6636, doi:10.1021/es800880z, 2008.

44
Appendix I: (Gonser et al., 2014a)
Ion - particle interactions during particle formation
and growth at a coniferous forest site in central
Europe
S. G. Gonser1, F. Klein1,*, W. Birmili2, J. Größ2, M. Kulmala3, H. E. Manninen3,
A. Wiedensohler2 and A. Held1
[1] University of Bayreuth, BayCEER, Atmospheric Chemistry, 95448 Bayreuth, Germany
[2] Leibniz Institute for Tropospheric Research, 04318 Leipzig, Germany
[3] Department of Physics, University of Helsinki, 00014 Helsinki, Finland
[*] now at: Gasphase and Aerosol Chemistry Group, Paul Scherrer Institute, 5232 Villigen,
Switzerland
Abstract
In this work, we examined the interaction of ions and neutral particles during atmospheric
new particle formation (NPF) events. The analysis is based on simultaneous field measurements of atmospheric ions and total particles using a neutral cluster and air ion
spectrometer (NAIS) across the diameter range 2 - 25 nm. The “Waldstein” research site
is located in a spruce forest in NE Bavaria, Southern Germany, known for enhanced radon concentrations, presumably leading to elevated ionization rates. Our observations
show that the occurrence of the ion nucleation mode preceded that of the total particle nucleation mode during all analysed NPF events. The time difference between the
appearance of 2 nm ions and 2 nm total particles was typically about 20 to 30 minutes. A
cross correlation analysis showed a rapid decrease of the time difference between the ion and total modes during the growth process. Eventually, this time delay vanished when
both ions and total particles did grow to larger diameters. Considering the growth rates of ions and total particles separately, total particles exhibited enhanced growth rates at
diameters below 15 nm. This observation cannot be explained by condensation or
coagulation, because these processes would act more efficiently on charged particles compared to neutral particles. To explain our observations, we propose a mechanism
including recombination and attachment of continuously present cluster ions with the ion
nucleation mode and the neutral nucleation mode, respectively.
45
1 Introduction
Tropospheric new particle formation (NPF) is a worldwide phenomenon (Kulmala et al.,
2004a; Kulmala and Kerminen, 2008) contributing to the global particle number and total amount of cloud condensation nuclei (Makkonen et al., 2012, Merikanto et al., 2009;
Spracklen et al., 2006;). The first step leading to NPF is thought to be the formation of
stable clusters from precursor gas phase components as sulfuric acid, amines, ammonia and organic vapors (Almeida et al. 2013; Kulmala et al., 2013; Schobesberger et al.,
2013). The formation of stable clusters happens in the mobility diameter (Dm) range between 1 to 2 nm. Once formed, the stable clusters are activated and experience rapid
growth (Kulmala et al., 2013). Atmospheric ions are very likely to play a considerable
role in atmospheric nucleation processes, as ions reduce the critical cluster size and facilitate cluster activation (e.g. Enghoff and Svensmark, 2008; Winkler et al., 2008; Yue
and Chan, 1979). In fact, comprehensive field measurements of NPF events at different
locations in Europe showed an earlier formation of charged particles compared to total particles (Manninen et al., 2010). Furthermore, the charging state of aerosol particles (i.e.
the ratio of the present charged particle fraction to the bipolar charge equilibrium charged fraction (Fuchs, 1963; Wiedensohler, 1988)) during NPF was observed to be frequently
overcharged (Gagné et al., 2010; Iida et al., 2006; Laakso et al., 2007).
When ions are involved in the nucleation process, two terms are usually used: ion induced nucleation (IIN: e.g. Manninen et al. (2010)) and ion mediated nucleation (IMN;
e.g. Yu and Turco (2000)). IIN denotes the formation of particles from small ionic clusters, preserving the charge during growth process. Additionally, when interactions of
ions and particles are taken into account the term IMN is used. Hence, IMN includes IIN
and does also consider interactions among ions and particles, like recombination and attachment.
Yu (2006) developed a detailed model to simulate the IMN process. Results from this model point towards the dominant role of ions in NPF, especially, when the actual aerosol
charged fraction is elevated in comparison to the equilibrium charging state (Yu and
Turco, 2011). On the other hand, when comparing formation rates of charged particles to total particle formation rates, only a small fraction (less than 10 %) of the particle
formation can be attributed to IIN (Manninen et al., 2009a; 2010). Only recently, Kulmala
et al. (2013) published results of field measurements with a sophisticated set of instruments, covering the size range where the very first steps of NPF take place. From
their data and theoretical calculations of ion-ion recombination, Kulmala et al. (2013) concluded that pure neutral nucleation processes dominate over IMN.
Atmospheric ions are generally classified according to their mobility diameter Dm into
three classes: (1) small ions or cluster ions (Dm < 1.6 nm), (2) intermediate ions (1.6 nm < Dm < 7.4 nm) and (3) large ions (Dm > 7.4 nm) (e.g. Hirsikko et al., 2011). Small
atmospheric ions are always present in the atmosphere, being mainly generated by radioactive decay and cosmic radiation. The total concentration of small ions varies
spatially and temporally, depending on ion sources and sinks (Hirsikko et al. (2011) and
references therein). Intermediate and large ions are usually only present during NPF events, snow fall and rain (Tammet et al., 2009; Virkkula et al., 2007).
Only during the last decade, appropriate instrumentation became available to measure neutral and charged cluster size distributions down to diameters relevant for NPF
(Kulmala et al., 2012). One instrument capable of measuring ions down to Dm of about

46
0.8 nm and neutral particles down to 2 nm is the neutral cluster and air ion spectrometer
(NAIS) (Manninen et al., 2009b; 2011; Mirme and Mirme, 2013). In this paper, we
present measurements performed with the NAIS during NPF. A new approach to evaluate the data is proposed to elucidate the interactions of ions and neutral particles in the
formation and growth of atmospheric particles.
2 Measurements and data analysis
2.1 Measurement setup
New particle formation (NPF) events were observed from 17 June to 18 August, 2012 at
the “Waldstein” ecosystem research site in the Fichtelgebirge mountain range, NE
Bavaria, Southern Germany. The measurements were carried out in a coniferous forest (50°08’35’’ N, 11°51’49’’ E, 776 m above sea level) dominated by Norway spruce. NPF
was measured by means of a neutral cluster and air ion spectrometer (S/N NAIS15) (Airel Ltd., Tartu, Estonia) and a mobility particle size spectrometer (reference system of
TROPOS, Leipzig, Germany; Wiedensohler et al., 2012).
The NAIS is capable of measuring neutral particles in the diameter range from about 2 nm to 42 nm and atmospheric ions in the range of 0.8 nm to 42 nm (Manninen et al.,
2011). The NAIS is composed of two cylindrical differential mobility analyzers (DMA), each with a sample flow of 30 standard liters per minute (SLM) and a sheath flow of 60
SLM. Each DMA is equipped with 21 electrometers for simultaneous detection of ions.
Positive and negative ions are analyzed separately in a positive and a negative DMA, respectively. The NAIS can be used in different operating modes. In the particle mode,
clusters are charged by corona discharge prior to the mobility analysis in one of the DMAs. During ion measurement mode the sample is directed to the DMAs without any
prior treatment. The offset mode is used for detection of the electrometer background
noise level. To do this, charging to opposite polarity and an electric filter is activated inhibiting the introduction of ions to the DMAs. During the whole campaign the NAIS
was operated alternatingly with these three modes: offset mode, ion mode and particle
mode. The cycle time of the consecutive modes was 200 seconds, with the particle mode set to 66 seconds, the ion mode set to 67 seconds and the offset mode set to 67 seconds.
Therefore, the overall temporal resolution of the NAIS was 200 seconds. In particle mode, the recorded data is inverted by the instrument software, assuming the
Fuchs-charge equilibrium of the sample prior to charging and that all classified particles
are singly charge. However, if the particle population is not in charge equilibrium but either overcharged or undercharged, the NAIS will overestimate or underestimate the
total particle concentrations, respectively (Kulmala et al., 2012). Additionally, an overestimation of the total particle concentration by a factor of 2-3 is a general
characteristic of NAIS instruments, as was shown by an intercomparison of several NAIS
instruments by Gagné et al., (2011). In the ion mode, no charging of the sample is performed and the DMAs sample the naturally charged clusters. The NAIS is described in
more detail by Manninen et al. (2009b) and Mirme and Mirme (2013). The particle number size distributions measured with the mobility particle size
spectrometer cover a diameter size range from 10 nm to 680 nm with a temporal
resolution of 5 minutes. It was operated with a closed loop sheath flow of 5 SLM and a sample flow of 1 SLM. More details about the mobility particle size spectrometer are
47
described in Wiedensohler et al. (2012; cf. Fig. 1). Both instruments were located in a
container on a clearing in the forest with the inlets pointing towards east, at a height of 2
m above ground. Additionally, meteorological parameters including ozone concentration, wind speed, wind direction, temperature, relative humidity as well direct and diffuse solar
radiation were measured at the forest clearing. To obtain robust information about the processes governing NPF from measurements at
a fixed location, the analyzed nucleation events have to be of regional character, and
occur in a generally homogenous air mass. The homogeneity of air masses was assessed by considering the following parameters: Wind direction, wind speed, ozone
concentration, relative humidity and particle concentration in the diameter range from 4
to 10 nm. Only when wind speeds varied less than 0.5 m s-1 and wind directions varied less than 60° prior and during NPF, and all other parameters showed a continuous and
consistent progression, the air mass was judged to be homogeneous. The focus of this study is to determine ion interactions during NPF measured with the
NAIS. Hence, the data of the mobility particle size spectrometer was mainly considered
for calculations of ion and total particle sink rates. For this purpose, the NAIS particle data were merged with this data by means of a linearly weighted merging algorithm in the
overlapping region of both instruments between 15 and 27 nm. The mobility particle size spectrometer was measuring with a 5 minute temporal resolution and its size bins were
different from the NAIS size bins. Both the size bins and the time resolution were
interpolated to match the NAIS time resolution and size bins. The resultant particle number size distribution between 2 nm and 680 nm was used for calculating the sink rates
for ions and total particles according to Hõrrak et al. (2008), Kulmala et al. (2012) and Tammet and Kulmala (2005).
2.2 Interactions of ions and neutral particles
The major interactions of ions and neutral particles among themselves and with the
background aerosol particle population are (1) coagulation of neutral particles, (2) attachment of ions to neutral particles and (3) recombination of ions with ions of
opposing polarity. The magnitude of these interactions can be calculated theoretically as
corresponding coefficients (see appendix for the formulations). Coagulation (1) is an important sink for freshly nucleated particles and a factor
enhancing the particle growth rate (GR) during NPF events (Kulmala et al., 2004b). To
determine the size-dependent coagulation coefficient 012 , an approximation from Tammet
and Kulmala (2005) was used (cf. Eqs. A1 and A2). The theoretical approach for 012 is
valid for the interaction of neutral particles and clusters of all diameters i and j.
The ion aerosol attachment (2) is described by the attachment coefficient 3 for the
interaction of small air ions with neutral particles. 3 is commonly assumed constant
(1x10⁻⁸ cm³ s-1) when determining ion formation rates, where the attachment of small ions to neutral particles of a large diameter is considered a source for ions of the same
diameter (Hirsikko et al., 2011; Kulmala et al., 2012; Manninen et al., 2010). However, this size-independent approach is only an approximation. In particular, when the diameter
i of neutral particles is greater than 10 nm, a constant value is inaccurate (cf. green solid
line in Fig. 1). Therefore, when calculating ion sinks, the size dependence of 3 has to be
taken into account. The size dependent 312 varies by three orders of magnitude, when the

48
interactions of small ions of size j with neutral particles of size i are considered (cf. solid
green line in Fig. 1; Hoppel and Frick, 1990; Hõrrak et al., 2008; Tammet and Kulmala,
2005). For this study, we determined by applying a formulation by Hõrrak et al.
(2008), which is an approximation of the tabulated results by Hoppel and Frick (1990)
(cf. Eqs. A3 and A4). Since intermediate and large ions also have a slightly enhanced attachment probability compared to pure neutral coagulation (cf. Fig. 1, dashed lines), we
extrapolated for all measured ion size ranges, still using the formulation by Hõrrak et
al. (2008).
In principle, the ion-ion recombination (3) can also be described by the attachment
coefficient, assuming the interaction of clusters with opposite charges. Usually, the
recombination coefficient is denoted as and assumed to be constant (1.6x10⁻⁶ cm³ s-1)
when the interaction among small ions is considered (Hoppel and Frick, 1990; Kulmala et
al., 2013; Tammet and Kulmala, 2005). Considering the case of cluster ions of diameter j,
interacting with oppositely charged clusters of a similar diameter k, should be equal
to (Hoppel and Frick, 1986). In fact, for ions with j = 1.5 nm interacting with
oppositely charged ions with k = 1.5 nm, as used in this study, is 1.3x10⁻⁶ cm³ s-1 (solid
orange line in Fig. 1). Therefore, for the interaction of oppositely charged clusters in
the sizes class j and k, i.e. the size-dependent recombination coefficient, will be denoted
as in the following (Eq. A5).
Fig. 1: Coagulation coefficient K, attachment coefficient β and recombination coefficient α
[cm3 s
-1] for small cluster ions and particles (1.5 nm, solid lines) and large ions and
particles (10 nm, dashed lines) as function of ions and particles of diameter Dp.

49
The theory for ion attachment and recombination was developed to calculate the
attachment of small ions to larger particles or ions, in order to theoretically assess the
particle charge distribution in a bipolar ion environment (Hoppel and Frick, 1986; 1990; Reischl et al., 1996). The interaction of intermediate and large ions with even larger
neutral or charged particles was not the aim of these studies. Nevertheless, the sinks and sources for all ion sizes have to be taken into account when analyzing ion interactions in
NPF. Therefore, we chose to use the approximated theory from Hõrrak et al. (2008) to
obtain a first order approximation of the coefficients governing the behavior of larger ions, and to apply the calculations also for larger diameters. A validation of this approach
is given by comparing the size dependence of β and α to K. In Fig. 1, all three coefficients
are depicted for aerosols of two different diameters (1.5 and 10 nm). As electrical effects will enhance the probability of an encounter of two particles, K is the lower limit for the
three considered interactions. When small ions (1.5 nm) and small neutral particles interact with each other (green solid line in Fig. 1), the electrical effect can enhance the
collision probability by more than one order of magnitude. Considering the interaction of
oppositely charged ions, the enhancement can be greater than three orders of magnitude (orange solid line in Fig. 1). The largest differences are found for interactions of small
particles or ions. However, when small ions interact with larger particles or ions, α and β approach K, indicating a smaller influence of the charge on the collision probability. A
similar pattern can be seen when considering the interaction of large ions with larger
aerosol particles (dashed lines in Fig. 1). For the interaction of particles or ions with a diameter of 10 nm, α and β decrease about 1-2 orders of magnitude while K is not that
strongly affected. The difference among the three coefficients is less pronounced, pointing towards a smaller influence of the charge on collision probabilities when larger
ions and particles are considered.
2.3 Ion-ion recombination
Knowing the recombination coefficient 425 and the number concentration of ions of both
polarities, a theoretical number size distribution of neutral particles from ion-ion
recombination can be deduced. Kontkanen et al. (2013) and Kulmala et al. (2013) propose a method to calculate the number size distribution resulting from recombination.
Both authors used a constant value of 1.6x10⁻⁶ cm³ s-1 for α. This is justified since only
recombination of charged clusters below 2.1 nm in diameter was considered. However,
we use the size-dependent 425 for our approach as the recombination of charged clusters
up to 42 nm is considered. Furthermore, Kulmala et al. (2013) used a very simple balance equation, by assuming recombination as the only source of neutral clusters and
coagulations as the only sink. Similar to Kontkanen et al. (2013), our analysis includes
additional sinks and source terms. The sources are given by the recombination of positive and negative ions contributing to size class i as well as the growth of recombined neutral
particles into size class i. The sinks include (1) the coagulation sink (6789:1; cf. Eq. A6)
describing the loss of the recombined neutral particles to the background neutral particles,
(2) the charging sink (6;8<9=:1�; cf. Eq. A7) defining the number of recombined neutral
particles in size i being charged either positively or negatively by the present ions (Hõrrak
et al., 2008), and (3) the growth sink, describing the growth of recombined neutral
particles out of the size class i. The balance equation for recombination is therefore:
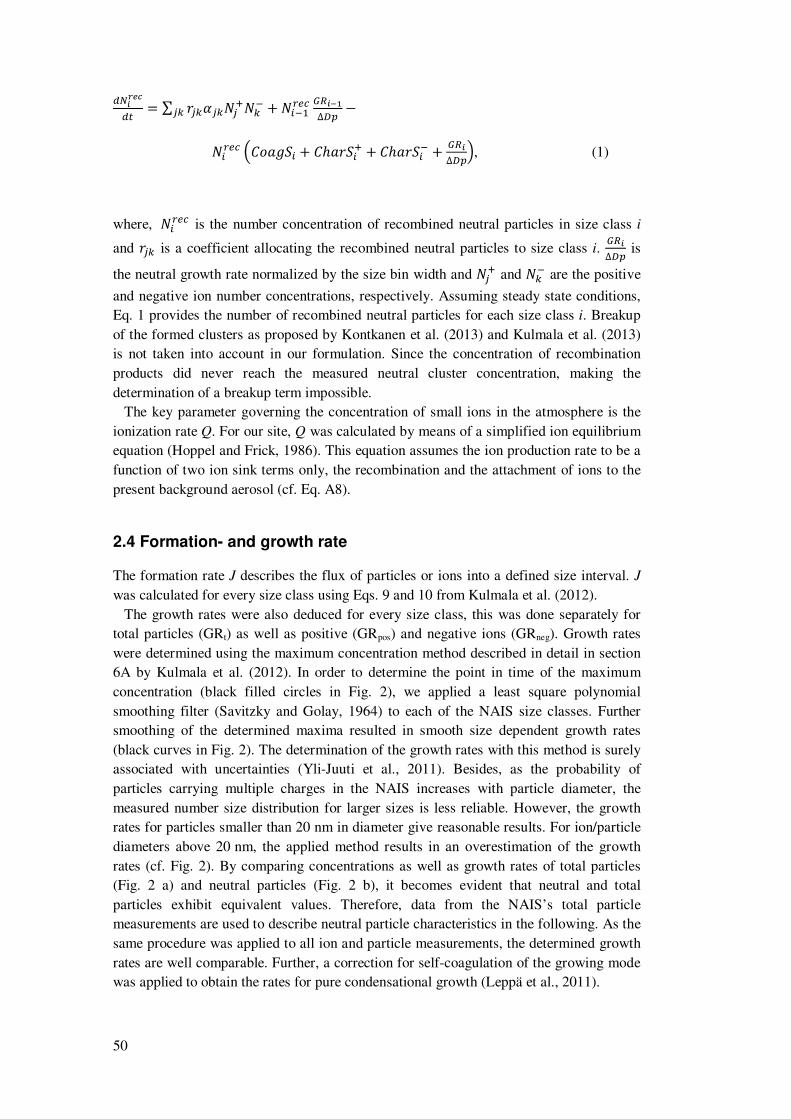
50
>?@ABC>D � ∑ <25425E2E525 �E1�FGH IJ@��∆KL "
E1FGH $6789:1 � 6;8<:1 � 6;8<:1 � IJ@∆KL+, (1)
where, E1FGH is the number concentration of recombined neutral particles in size class i
and <25 is a coefficient allocating the recombined neutral particles to size class i. IJ@∆KL is
the neutral growth rate normalized by the size bin width and E2 and E5 are the positive
and negative ion number concentrations, respectively. Assuming steady state conditions, Eq. 1 provides the number of recombined neutral particles for each size class i. Breakup
of the formed clusters as proposed by Kontkanen et al. (2013) and Kulmala et al. (2013) is not taken into account in our formulation. Since the concentration of recombination
products did never reach the measured neutral cluster concentration, making the
determination of a breakup term impossible. The key parameter governing the concentration of small ions in the atmosphere is the
ionization rate Q. For our site, Q was calculated by means of a simplified ion equilibrium equation (Hoppel and Frick, 1986). This equation assumes the ion production rate to be a
function of two ion sink terms only, the recombination and the attachment of ions to the
present background aerosol (cf. Eq. A8).
2.4 Formation- and growth rate
The formation rate J describes the flux of particles or ions into a defined size interval. J
was calculated for every size class using Eqs. 9 and 10 from Kulmala et al. (2012).
The growth rates were also deduced for every size class, this was done separately for total particles (GRt) as well as positive (GRpos) and negative ions (GRneg). Growth rates
were determined using the maximum concentration method described in detail in section 6A by Kulmala et al. (2012). In order to determine the point in time of the maximum
concentration (black filled circles in Fig. 2), we applied a least square polynomial
smoothing filter (Savitzky and Golay, 1964) to each of the NAIS size classes. Further smoothing of the determined maxima resulted in smooth size dependent growth rates
(black curves in Fig. 2). The determination of the growth rates with this method is surely associated with uncertainties (Yli-Juuti et al., 2011). Besides, as the probability of
particles carrying multiple charges in the NAIS increases with particle diameter, the
measured number size distribution for larger sizes is less reliable. However, the growth rates for particles smaller than 20 nm in diameter give reasonable results. For ion/particle
diameters above 20 nm, the applied method results in an overestimation of the growth
rates (cf. Fig. 2). By comparing concentrations as well as growth rates of total particles (Fig. 2 a) and neutral particles (Fig. 2 b), it becomes evident that neutral and total
particles exhibit equivalent values. Therefore, data from the NAIS’s total particle measurements are used to describe neutral particle characteristics in the following. As the
same procedure was applied to all ion and particle measurements, the determined growth
rates are well comparable. Further, a correction for self-coagulation of the growing mode was applied to obtain the rates for pure condensational growth (Leppä et al., 2011).

51
Fig. 2: NPF event of 12 August 2012 as measured with the NAIS. Shown are a) total
particles, b) neutral particles, c) positive ions, d) negative ions and e) calculated neutral
particles from ion-ion recombination. Black filled circles denote the concentration maxima
for each size class, while black lines are smoothed fits in order to obtain continuous
growth rates.
3 Results
3.1 General event characteristics
Simultaneous measurements of neutral and charged clusters and particles at the “Waldstein” ecosystem research site from 17 June to 18 August 2012 showed a frequent
occurrence of new particle formation events. Typically, the events occurred during sunny
morning hours while wind directions from the east prevailed. However, several events did also occur in the afternoons and when wind directions were not from the east. A total
number of 17 NPF events (28 % of measurement period) were observed, while 29 days (47 %) could not be defined as clear events but did still show particle formation. Non-
event days were less frequent with only 15 out of 61 days. Since the measurements were
taken at a fixed location, a reliable evaluation of the patterns governing the formation and growth of particles were only possible in homogeneous air masses. After careful
evaluation for homogeneous air masses as described above, a total of 8 events were chosen for detailed analysis. Fig. 2 shows a typical NPF event. Growth rates of those 8
days compare well to prior observations, reporting growth rates in the range from 2.2 to
5.7 nm h-1 at the same location (Held et al., 2004). For particles in diameter range 2 – 3

52
nm median total particle growth rates (GRt), negative (GRneg) and positive growth rates
(GRpos) were found to be 4.1 nm h-1, 2.4 nm h-1 and 2.8 nm h-1, respectively. Median
formation rates J for 2-3 nm particles were in the order of 3.5 cm-3 s-1, 0.015 cm-3 s-1 and 0.02 cm-3 s-1 for total, negative and positive particles, respectively.
3.2 Ion concentrations and ionization rates at “Waldstein”
The “Waldstein” site is located in the Fichtelgebirge mountain range, NE Bavaria, which
is known for its enhanced background radioactive radiation levels. In particular, radon
concentrations are elevated reaching soil gas concentrations of up to 4000 kBq m-3
(Kemski et al., 2001; Lüers et al., 2007). As the primary sources for atmospheric ions are radon decay, gamma radiation and cosmic radiation (Hirsikko et al., 2011), ion
concentrations and ionization rates Q are expected to be elevated at the “Waldstein” site.
Fig. 3: Median diurnal variation of cluster ion concentrations (diameter < 1.6 nm) during 8
selected NPF event days (a, c) and 13 non-event days (b, d), as measured with the NAIS
during summer 2012 at the “Waldstein” site. The shaded areas denote the 25th and 75
th
percentile.
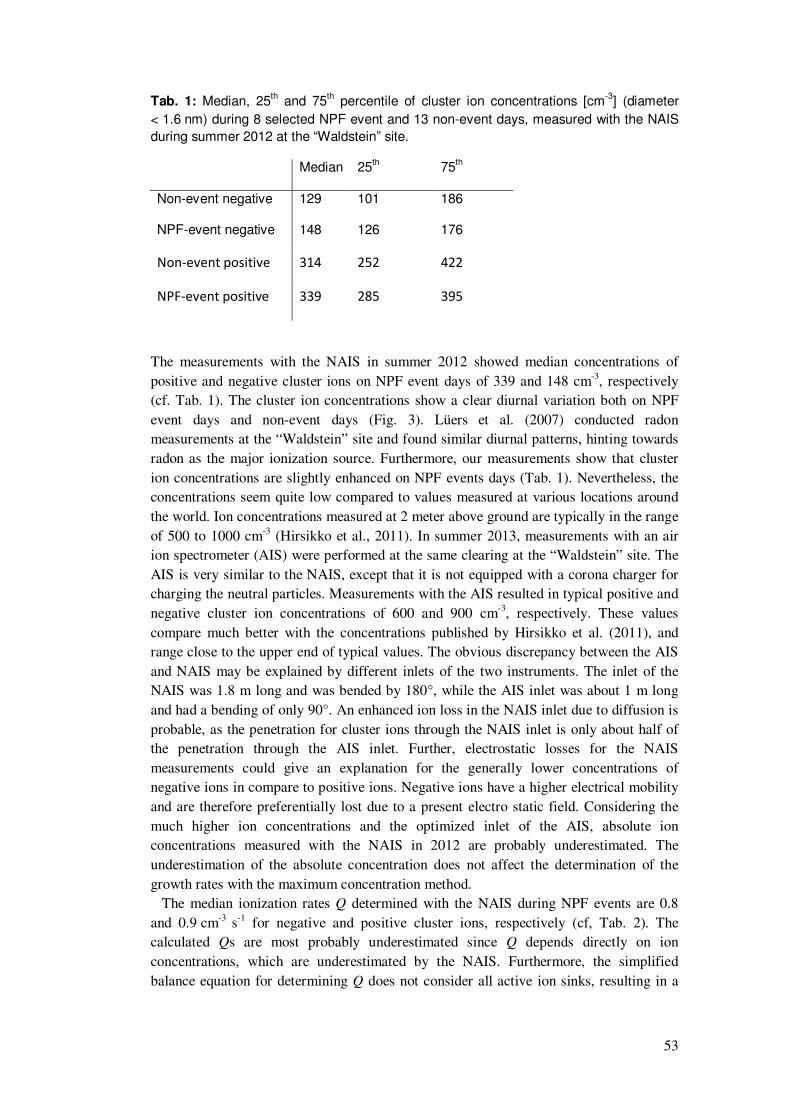
53
Tab. 1: Median, 25th and 75
th percentile of cluster ion concentrations [cm
-3] (diameter
< 1.6 nm) during 8 selected NPF event and 13 non-event days, measured with the NAIS
during summer 2012 at the “Waldstein” site.
Median 25th 75
th
Non-event negative 129 101 186
NPF-event negative 148 126 176
Non-event positive 314 252 422
NPF-event positive 339 285 395
The measurements with the NAIS in summer 2012 showed median concentrations of
positive and negative cluster ions on NPF event days of 339 and 148 cm-3, respectively (cf. Tab. 1). The cluster ion concentrations show a clear diurnal variation both on NPF
event days and non-event days (Fig. 3). Lüers et al. (2007) conducted radon measurements at the “Waldstein” site and found similar diurnal patterns, hinting towards
radon as the major ionization source. Furthermore, our measurements show that cluster
ion concentrations are slightly enhanced on NPF events days (Tab. 1). Nevertheless, the concentrations seem quite low compared to values measured at various locations around
the world. Ion concentrations measured at 2 meter above ground are typically in the range
of 500 to 1000 cm-3 (Hirsikko et al., 2011). In summer 2013, measurements with an air ion spectrometer (AIS) were performed at the same clearing at the “Waldstein” site. The
AIS is very similar to the NAIS, except that it is not equipped with a corona charger for charging the neutral particles. Measurements with the AIS resulted in typical positive and
negative cluster ion concentrations of 600 and 900 cm-3, respectively. These values
compare much better with the concentrations published by Hirsikko et al. (2011), and range close to the upper end of typical values. The obvious discrepancy between the AIS
and NAIS may be explained by different inlets of the two instruments. The inlet of the NAIS was 1.8 m long and was bended by 180°, while the AIS inlet was about 1 m long
and had a bending of only 90°. An enhanced ion loss in the NAIS inlet due to diffusion is
probable, as the penetration for cluster ions through the NAIS inlet is only about half of the penetration through the AIS inlet. Further, electrostatic losses for the NAIS
measurements could give an explanation for the generally lower concentrations of negative ions in compare to positive ions. Negative ions have a higher electrical mobility
and are therefore preferentially lost due to a present electro static field. Considering the
much higher ion concentrations and the optimized inlet of the AIS, absolute ion concentrations measured with the NAIS in 2012 are probably underestimated. The
underestimation of the absolute concentration does not affect the determination of the
growth rates with the maximum concentration method. The median ionization rates Q determined with the NAIS during NPF events are 0.8
and 0.9 cm-3 s-1 for negative and positive cluster ions, respectively (cf, Tab. 2). The calculated Qs are most probably underestimated since Q depends directly on ion
concentrations, which are underestimated by the NAIS. Furthermore, the simplified
balance equation for determining Q does not consider all active ion sinks, resulting in a

54
general underestimation of about a factor of 2 (Hõrrak et al., 2008). Considering these
facts, Q was probably well above 3 ion pairs cm-3 s-1 during summer 2012 at “Waldstein”.
3.3 Time difference
In all 8 evaluated NPF events, 2 nm ions (NAIS size bin limits were 1.8 – 2.1 nm)
showed a concentration increase before the concentrations of total particles of the same
size increased. Fig. 4 (a) shows the course of concentration for 2 nm total particles and ions for an exemplary NPF event on 12 August, 2012. The occurrence of an earlier ion
formation prior to total particle formation seems to be a typical pattern during NPF. Manninen et al. (2010) report of NAIS measurements during NPF at several locations in
Europe. They also observed the earlier formation of 2 nm ions prior to 2 nm total particle
formation in different environments. However, this behavior was not investigated in more detail in other studies. When considering the concentrations of larger particles and ions,
the time gap between the appearance of charged and total particles becomes smaller with
increasing particle size (Fig. 4 b-e). This behavior was observed throughout all NPF events considered in our study. In order to determine the time difference ∆t between the
appearance of ions and total particles, a cross-correlation analysis was performed individually for each size class. Cross-correlation analysis is a standard procedure to
analyze time shifts in two time series. The result of the cross-correlation analysis can be
seen in Fig. 5. For small particles, ∆t is largest and sharply decreases as the particle diameter increases, eventually reaching ∆t = 0 for diameters of about 20 nm. Therefore,
the total particles seem to grow faster than ions after the onset of a NPF event, as ∆t becomes smaller during the growth process.

55
Fig. 4: Temporal evolution of total particle concentrations as well as positive and negative
ion concentrations in diameter ranges of a) 1.8-2.1 nm, b) 3.7-4.3 nm, c) 7.6-8.8 nm, d)
13.6-15.7 nm and e) 21.1-24.5 nm. The data originates from single NAIS size channels,
measured during the NPF event on 12 August 2012 at “Waldstein”. Ion concentrations
increase during the growth process, while total particle concentrations increase rapidly at
the beginning of NPF but begin to decrease at diameters above 8 nm. Note that the ion
concentrations (right axes) are always smaller than the particle concentrations (left axes).
Data was smoothed for illustrational purpose.
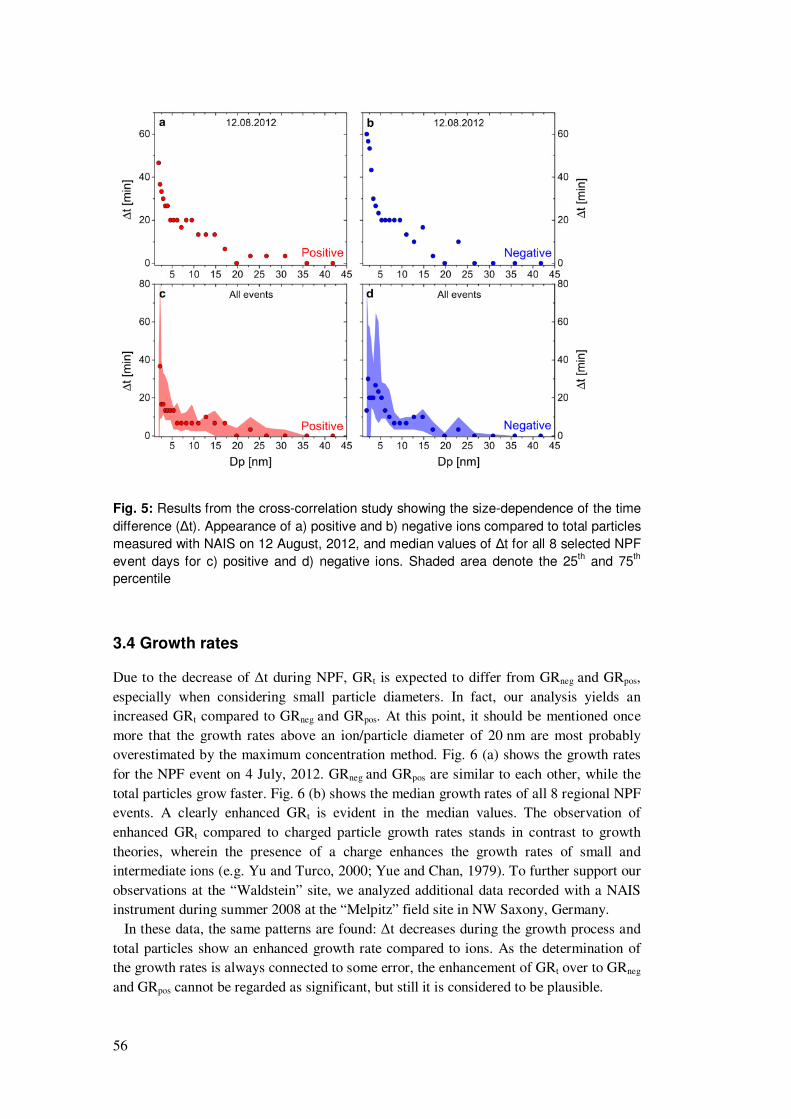
56
Fig. 5: Results from the cross-correlation study showing the size-dependence of the time
difference (∆t). Appearance of a) positive and b) negative ions compared to total particles
measured with NAIS on 12 August, 2012, and median values of ∆t for all 8 selected NPF
event days for c) positive and d) negative ions. Shaded area denote the 25th and 75
th
percentile
3.4 Growth rates
Due to the decrease of ∆t during NPF, GRt is expected to differ from GRneg and GRpos,
especially when considering small particle diameters. In fact, our analysis yields an increased GRt compared to GRneg and GRpos. At this point, it should be mentioned once
more that the growth rates above an ion/particle diameter of 20 nm are most probably overestimated by the maximum concentration method. Fig. 6 (a) shows the growth rates
for the NPF event on 4 July, 2012. GRneg and GRpos are similar to each other, while the
total particles grow faster. Fig. 6 (b) shows the median growth rates of all 8 regional NPF events. A clearly enhanced GRt is evident in the median values. The observation of
enhanced GRt compared to charged particle growth rates stands in contrast to growth
theories, wherein the presence of a charge enhances the growth rates of small and intermediate ions (e.g. Yu and Turco, 2000; Yue and Chan, 1979). To further support our
observations at the “Waldstein” site, we analyzed additional data recorded with a NAIS instrument during summer 2008 at the “Melpitz” field site in NW Saxony, Germany.
In these data, the same patterns are found: ∆t decreases during the growth process and
total particles show an enhanced growth rate compared to ions. As the determination of the growth rates is always connected to some error, the enhancement of GRt over to GRneg
and GRpos cannot be regarded as significant, but still it is considered to be plausible.

57
Fig. 6: Growth rates of negative ions, positive ions and total particles determined from
NAIS measurements, a) for a single event on 04 July, 2012 and b) median values for all 8
selected NPF events used for this study. Hatched areas denote the 25th and 75
th
percentile. Additionally, GRrec deduced from ion-ion recombination is shown in orange.
Dashed segments of the curves denote inaccurate growth rates.
3.5 Recombination
The number size distributions deduced from ion-ion recombination as described by Eq. 1 are generally comparable to the measured total particle distributions. However, the
resulting absolute concentrations of particles from ion-ion recombination are one to three
orders of magnitude smaller than the observed total particle distributions. Particularly, when diameters below 10 nm are considered, recombination cannot explain the
abundance of total particles (cf. Fig. 2). This may be partly due to the performance of the NAIS, as it generally underestimates the ion concentrations and overestimates the total
particle concentrations. Therefore, the absolute values are not taken into consideration for
our study. Nevertheless, the recombination gives valuable information regarding the growth behavior of neutral particles. A measure which can still be used for our analysis is
the growth rate of the recombination products (GRrec). As mentioned above, GRt is

58
elevated at small particle diameters compared to GRneg and GRpos. GRrec seems to behave
similar to GRt as can be seen in Figs. 2 and 6. For most of the NPF events considered in
our study, GRrec is well above GRneg and GRpos (Fig. 6 b) and sometimes matches GRt quite well (Fig. 6 a).
Tab. 2: Event features of all 8 selected NPF events used for this study. Shown are: NPF
event start time (CET), prevailing wind direction, time difference ∆t of 2-3 nm ions [min.],
growth rates GR of 2-3 nm total particles and ions [nm h-1
], formation rates J of 2-3 nm
total particles and ions [cm-3
s-1
] and ionization rates Q for cluster ions [cm-3
s-1
]. Values
for Qneg, Qpos, Jneg and Jpos are probably underestimated, please refer to section 3.2 for
detail.
Date Start
Wind
sector Δtneg Δtpos GRt GRneg GRpos Jt Jneg Jpos Qneg Qpos
17 June 2012 13:00 W 20 5 2.8 6.3 3.2 0.4 0.02 0.02 0.4 0.4
19 June 2012 12:00 E -62 0 1.5 2 1.9 0.4 0.002 0.006 0.5 0.7
04 July 2012 09:30 E 33 22 2.9 2.4 2.3 0.5 0.006 0.007 0.7 0.9
23 July 2012 07:30 E 102 97 5.3 1.5 1.4 5 0.02 0.02 0.9 1
24 July 2012 08:30 E 67 42 9 2.4 3.7 2.3 0.004 0.01 0.8 0.9
12 August 2012 08:30 E 53 38 6.9 3.2 3.8 4.7 0.02 0.04 1.1 1.2
13 August 2012 07:30 E 17 13 6 3.5 4.4 5.2 0.02 0.05 1.3 1.6
17 August 2012 08:30 E 10 5 1.6 1.6 1.8 5.2 0.01 0.02 0.8 0.8
Median - - 26.5 17.5 4.1 2.4 2.75 3.5 0.015 0.02 0.8 0.9

59
4 Discussion
The 8 particle formation events at the “Waldstein” site considered in this study can be
separated into two distinct stages. The formation of the first stable clusters and particles seem to happen in the ion fraction. Later, the ion formation step is followed by a very
intense formation and growth of neutral clusters and particles. The initial ion induced
nucleation (IIN) typically happens about 20 - 30 minutes before the first appearance of neutral particles (Fig. 5 c, d; Tab. 2) at “Waldstein”. This observation can most likely be
explained by the higher stability of charged clusters over neutral ones at a certain precursor gas saturation ratio (Enghoff and Svensmark, 2008; Yue and Chan, 1979).
Furthermore, charged clusters clearly activate more easily and grow more quickly (e.g.
Lushnikov and Kulmala, 2004; Winkler et al., 2008; Yu and Turco, 2000). Keeping this in mind and neglecting any ion-ion and ion-particle interactions, the temporal advanced
of the ion fraction during the growth process should increase or remain constant.
However, our measurements show a contrary behavior: once formed, the neutral particles grow considerably faster than the ion fraction, and eventually, the earlier occurrence of
the ions vanishes completely. As this behavior can most likely not be explained by pure condensational growth, ion-ion and ion-particle interactions are thought to play a key role
in the growth behavior of charged and neutral particles.
Neutral particles and ions are related due to two different types of interaction. Either ions carrying opposite charges recombine to form a somewhat greater neutral particle, or
an existing neutral particle grows and becomes charged by the attachment of an ion. Considering these ion-particle interactions by applying theoretical parameterizations of
the attachment and recombination processes to the combined NAIS and mobility particle
size spectrometer measurements, we obtained the ion-mediated or -recombined fraction of neutral particles. As the NAIS number concentration measurements are subject to
uncertainties both for ions and total particles (Asmi et al., 2009; Gagné et al., 2011), the absolute concentrations of the recombination products are not considered in our work.
However, particle mobility measurements and particle sizing with the NAIS are more
accurate (Gagné et al., 2011). The growth rate analyses are not influenced by the uncertainties in NAIS number concentrations as it is based on locating the peak of each
size fraction. Therefore, we chose GRrec deduced from the calculated recombination
number size distribution as a measure for the influence of ions on neutral particle formation. Considering the growth rates in Fig. 6 (b), GRt is generally elevated, while
median GRneg and GRpos are very similar to each other. Recombined particles have a median GRrec somewhere between ions and neutral particles. During some of the NPF
events, GRrec was very close to GRt while GRneg and GRpos were lower (Fig. 6 a; Tab. 2).
In general, our analyses show an earlier formation of charged particles compared to total particles (Fig. 5). When looking more closely at the time difference of appearance
(∆t) of ions and total particles, the 8 considered NPF events can be divided in two classes: (1) initial ∆t is larger than 20 minutes (Fig. 7) and (2) initial ∆t is smaller than 20 minutes
(Fig. 8).
Median values of four NPF events (04 July; 23 July; 24 July; 12 August 2012; cf. Tab. 2) with ∆t > 20 minutes are shown in Fig. 7. The large differences in the growth rates for
ions and total particles (Fig. 7 a) are remarkable.

60
Fig. 7: Median evolution of ions and particles for four NPF events with ∆t > 20 minutes. a)
GR for total, positive, negative and recombined particles. b) Time evolution of the growing
modes (Dpmax) of negative, positive and total particles, respectively. Hatched areas
denote the 25th and 75
th percentiles. c, d) Time difference (∆t) for negative and positive
ions, respectively. Dotted black lines are time differences calculated from the negative
and positive growing mode to the total one, in principle this is the difference between the
three Dpmax-values from section b).
While GRneg and GRpos are as expected for small diameters, GRt for small total particles is
strongly elevated (cf. Tab. 2). This strong growth is maintained until a sharp drop for
diameters above 10 nm is evident. The unusual sharpness of the decrease can most likely be attributed to limitations of the maximum concentration method and the inversion
routine of the NAIS. Nevertheless, qualitatively the decrease in GRt is considered real, indicating a change in the prevailing growth conditions. Fig. 7 (b) shows the time
evolution of the growing mode’s diameter of maximum concentration (Dpmax) for both
ion polarities as well as for total particles. More specifically, Dpmax is the result of the maximum concentration method for the determination of the growth rates (cf. black lines
in Fig. 2). The origin of the horizontal axis (time = 0) indicates the first appearance of the total particle growing mode. The time of initial ion appearance is offset by the median of
∆t at 2 nm for positive and negative ions, respectively (cf. Fig. 7 c, d). The initial offset of
the ion growing mode is about 60 minutes. As total particles exhibit a higher GRt, their growing mode finally reaches the same Dpmax as the ion modes, about 40 to 60 minutes
after the first appearance of total particles.
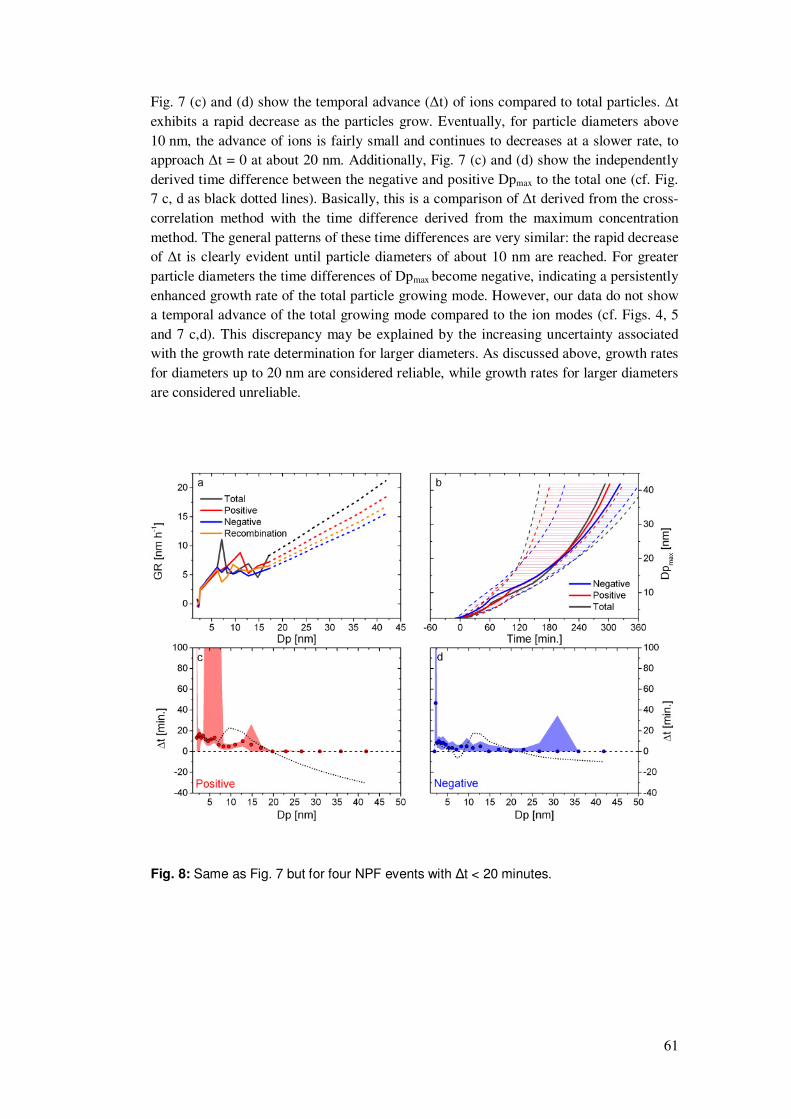
61
Fig. 7 (c) and (d) show the temporal advance (∆t) of ions compared to total particles. ∆t
exhibits a rapid decrease as the particles grow. Eventually, for particle diameters above
10 nm, the advance of ions is fairly small and continues to decreases at a slower rate, to approach ∆t = 0 at about 20 nm. Additionally, Fig. 7 (c) and (d) show the independently
derived time difference between the negative and positive Dpmax to the total one (cf. Fig. 7 c, d as black dotted lines). Basically, this is a comparison of ∆t derived from the cross-
correlation method with the time difference derived from the maximum concentration
method. The general patterns of these time differences are very similar: the rapid decrease of ∆t is clearly evident until particle diameters of about 10 nm are reached. For greater
particle diameters the time differences of Dpmax become negative, indicating a persistently
enhanced growth rate of the total particle growing mode. However, our data do not show a temporal advance of the total growing mode compared to the ion modes (cf. Figs. 4, 5
and 7 c,d). This discrepancy may be explained by the increasing uncertainty associated with the growth rate determination for larger diameters. As discussed above, growth rates
for diameters up to 20 nm are considered reliable, while growth rates for larger diameters
are considered unreliable.
Fig. 8: Same as Fig. 7 but for four NPF events with ∆t < 20 minutes.

62
Median values for four NPF events with ∆t < 20 minutes (17 June; 19 June; 13 August;
17 August 2012; cf. Tab. 2) are shown in Fig. 8. The median growth rates for these events
(Fig. 8 a) are significantly lower compared to the high growth rates presented in Fig. 7. Additionally, there is no visible difference in GRneg, GRpos and GRt. They exhibit similar
values throughout the whole growth process (cf. Tab. 2). Typically, 2 nm positive and negative ions show an earlier appearance (∆t) of about 15 and 10 minutes, respectively
(Fig. 8 c, d). The decrease of ∆t during the growth process is relatively slow.
Nevertheless, the diameter at which ∆t approaches zero is still at about 20 nm. The time needed for the total particle mode to grow to this size is approximately 200 minutes (Fig.
8 b). The time difference deduced from Dpmax becomes negative at a diameter of about 20
nm, supporting the assumption that growth rates above this diameter are overestimated. As ∆t shows a slow decrease during the growth process, GRt should be slightly enhanced
compared to GRneg and GRpos. This is not visible in our data. Presumably, the accuracy of the applied growth rate determination is not sufficient to resolve such slight differences.
As the absolute contribution of ion-ion recombination and ion-particle attachment to
NPF is not quantitatively assessed in this work we propose a conceptual mechanism governing our observations. Fig. 9 shows the conceptual model for interactions of
positive cluster ions (red) with the negative growing ion mode (blue), the neutral background particles and the neutral growing mode (both black). For illustrational
purposes, we will focus on the ion attachment (green dashed lines) and the recombination
of cluster ions with the growing ion mode (yellow dashed lines) and neglect the recombination of cluster ions with each other.
Fig. 9: Conceptual model of the influence of cluster ion recombination and attachment at
different stages of particle nucleation and growth (a-d). Permanently available positive
cluster ions are denoted in red, the negative growing mode in blue and neutral particle
modes in black. The black and red arrows denote the generation of neutral and charged
particles, respectively. The size of the arrows and dashed lines denotes the prevailing
mechanism. Numerals indicate the orders of magnitude of the number concentrations of
the respective modes.

63
At the onset of NPF (Fig. 9 a), first particles are formed in the ion fraction, exhibiting
concentrations in the order of 101 cm-3. Ion-ion recombination occurs among cluster ions
and the freshly nucleated ion mode (yellow dashed line). Additionally, the background aerosol particles, exhibiting concentrations in the order of 103 cm-3, are available for the
attachment of cluster ions (green dashed line). Considering the recombination coefficient
4 at 2 nm and the attachment coefficient 3 at 100 nm (cf. Fig. 1, yellow and green solid
lines), the probabilities for cluster ions to interact with the growing ion mode and with the
neutral background particles are approximately the same. As the background aerosol is more numerous than the freshly nucleated ion mode, attachment to the background
particles dominates over recombination. Hence, only a very small number of neutral
particles are formed by recombination. Once precursor gas phase components are available in a sufficient quantity for neutral
nucleation (cf. Almeida et al. 2013; Kulmala et al., 2013; Schobesberger et al., 2013), a
strong nucleation burst of neutral particles occurs (Fig. 9 b). The freshly nucleated neutral mode has a very small mean diameter (e.g. 1.5-2 nm) and shows typical concentrations in
the order of 103 cm-3. The background particle number size distribution stays mostly unchanged (Dp > 100 nm; 103 cm-3). Now, the neutral nucleation mode and the
background particles are available for the attachment of cluster ions. Meanwhile, the ion
mode has grown to a greater diameter (e.g. 4 nm), exhibiting only a slightly enhanced
number concentration still in the order of 101 cm-3. 3for cluster ion attachment to the
background particles is elevated by 2 orders of magnitude compared to the neutral
nucleation mode (cf. Fig. 1). Therefore, cluster ion attachment to the background particles dominates over the attachment to the neutral nucleation mode, as both modes have similar
concentrations. On the other hand, 4 for cluster ions with the growing ion mode is
elevated by 2 orders of magnitude compared to 3 for the neutral growing mode. As the neutral mode exhibits approximately 2 orders of magnitude more particles, the absolute
number of cluster ions recombining with the ion mode is comparable to the number of
ions attaching to the neutral mode. In other words, background particles are charged strongly (bold red arrow), the neutral nucleation mode experiences moderate charging
(red arrow) and the formation of neutral particles by recombination is also moderate (black arrow). This moderate formation of somewhat greater neutral particles from
recombination contributes to the growth of the neutral mode and slightly reduces the
growth of the ion mode. On the other hand, the ions formed by attachment to the neutral mode are somewhat smaller than the mean ion mode diameter, and contribute to a slower
growth of the ion mode. The absolute production of neutral and charged particles by this mechanism depends on the concentration of cluster ions as well as on the concentration of
the growing ion- and neutral modes, and is thought to be in the order of 0.01 cm-3 s-1.
As the growth continues, the neutral particle mode reaches a number concentration peak (order of 104 cm-3) at diameters of approximately 4 - 5 nm (Fig. 9 c). Due to the high
concentration, the attachment probability of cluster ions to the neutral nucleation mode
and the background particles is similar (green dashed lines). Meanwhile, the ion mode has grown further (e.g. 6 nm diameter), and is slightly more numerous but still in the order of
101 cm-3. Therefore, recombination is somewhat enhanced compared to stage (b). Nevertheless, the neutral nucleation mode experiences a stronger loss of particles due to
attachment of cluster ions. As a result, the concentration of the growing ion mode is
further enhanced by the addition of somewhat smaller charged particles. Again, the loss of ions (due to recombination) and the addition of newly formed smaller ions (due to
64
attachment) results in an apparent growth rate reduction of the ion mode. On the other
hand, the concentration of the neutral mode is constantly reduced, while its growth rate
stays elevated. Finally, the diameters of the neutral and ion growing modes approach each other (Fig. 9
d). By this time the concentration of the ion mode is further enhanced (102 cm-3) and the neutral mode concentration has decreased to about 103 cm-3. The converging
concentrations and similar diameters result in a comparable magnitude of attachment and
recombination to the ion and neutral growing modes. As the neutral particles (formed from recombination) and the charged particles (formed from attachment) have
approximately the same diameter, an enhancement or slowing of the growth rates is not
expected. This results in an equilibrium state where ions and neutral particles grow at similar rates.
5 Conclusions
Data from 8 NPF events measured with the NAIS at the “Waldstein” site clearly showed an earlier appearance of the ion modes in the beginning of NPF and a higher initial
growth rate of the “delayed” total particle mode in comparison to the ion modes. The
enhanced growth of the total particle mode does eventually result in the disappearance of the ion’s temporal advance. To our knowledge, such differences of ion and total growth
rates in the initial stages of cluster growth have not been presented before. Therefore, it is an interesting yet open question if these observations are just a special feature of the
“Waldstein” site, or if they can also be found elsewhere. An earlier appearance of the ion
mode is plausible, as ions reduce the critical cluster size and facilitate the cluster activation (e.g. Lushnikov and Kulmala, 2004; Winkler et al., 2008; Yu and Turco, 2000;
Yue and Chan, 1979). To explain the difference in the growth rates we have proposed a
mechanism including ion-ion recombination and ion-particle attachment (cf. Fig. 9). Due to limitations of our measurement equipment (detection limit for neutral particles ~
2 nm), no direct conclusions on the influence of ions on neutral particle nucleation can be deduced at the size range where the onset of NPF occurs. As stated by Kontkanen et al.
(2013) and Kulmala et al. (2013), pure cluster ion recombination is not thought to be of
sufficient magnitude to explain the intense neutral nucleation bursts. Further, Manninen et al. (2010) reported that ion induced nucleation does only contribute about 10 - 13 % to
NPF. Nevertheless, ion interactions may play an important role in NPF by simultaneously enhancing the neutral particle growth rate and reducing the ion growth rate. However, the
proposed mechanism is only valid in environments where the ionization rate (Q) is strong
enough to provide sufficient cluster ions for recombination and attachment.
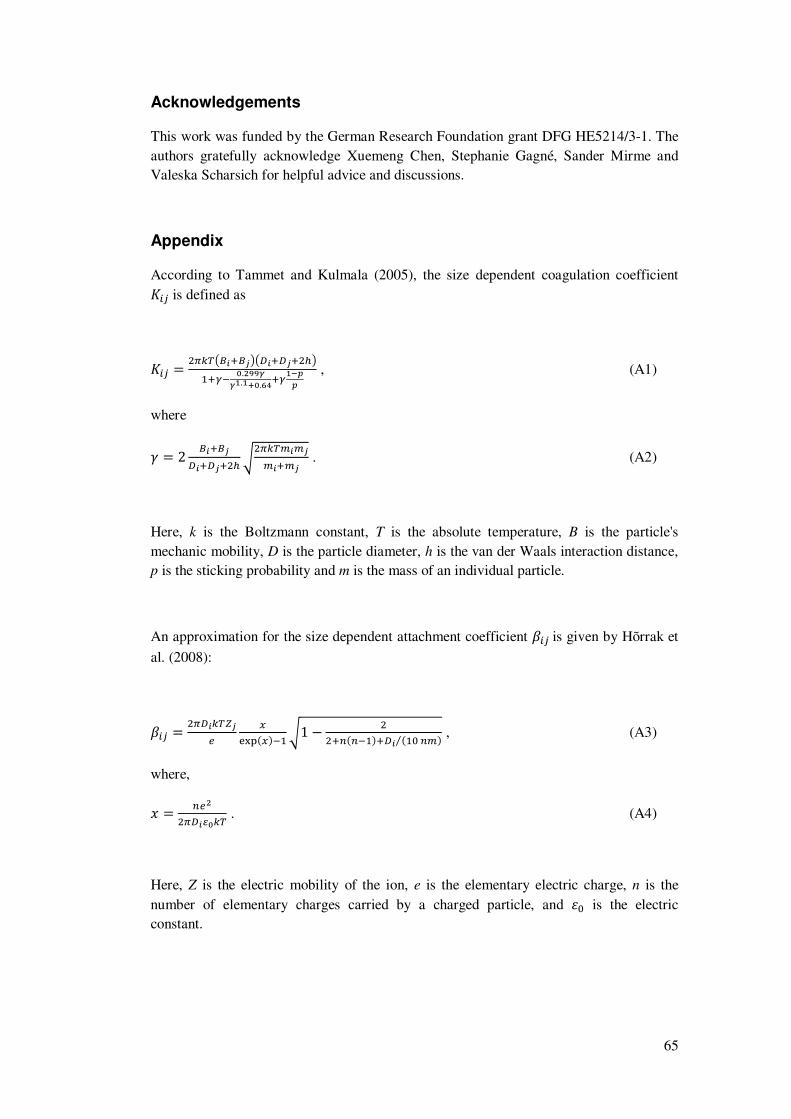
65
Acknowledgements
This work was funded by the German Research Foundation grant DFG HE5214/3-1. The
authors gratefully acknowledge Xuemeng Chen, Stephanie Gagné, Sander Mirme and Valeska Scharsich for helpful advice and discussions.
Appendix
According to Tammet and Kulmala (2005), the size dependent coagulation coefficient
012 is defined as
012 � MN5OPQ@QRSPK@KRMTS�U V.XYYZ
Z�.�[V.\]U��^^
, (A1)
where
_ � 2 Q@QRK@KRMTa
MN5Ob@bRb@bR . (A2)
Here, k is the Boltzmann constant, T is the absolute temperature, B is the particle's
mechanic mobility, D is the particle diameter, h is the van der Waals interaction distance, p is the sticking probability and m is the mass of an individual particle.
An approximation for the size dependent attachment coefficient 312is given by Hõrrak et
al. (2008):
312 � MNK@5OcRG
d�e!fdg�a1" M
Mhfh�gK@ f�ihbg⁄ , (A3)
where,
k � hGXMNK@lV5O . (A4)
Here, Z is the electric mobility of the ion, e is the elementary electric charge, n is the
number of elementary charges carried by a charged particle, and mi is the electric constant.

66
For the interaction of two oppositely charged ions of size j and k, the size dependent
recombination coefficient 425 can be described by the attachment coefficient 325 (Hoppel
and Frick, 1986):
425 � 325. (A5)
The coagulation sink is calculated according to Kulmala et al. (2012):
6789:1 � ∑ 01nEnnobpdno1 , (A6)
where Enis the number concentration of the background aerosol in the size class l.
The calculation of the charging sink follows Eq. 3 from Hõrrak et al. (2008):
6;8<:1� � q1 ∑ 312E2�2 , (A7)
where, q1 is the probability of a neutral particle in size class i to carry one elementary
charge and E2� is the number concentration of positive or negative ions in size class j.
Hoppel and Frick (1986) proposed a simplified balance equation for the cluster ion
production rate. For our work, we use a slightly altered version, not assuming symmetric concentrations of positive and negative small ions and considering size-dependent
attachment and recombination coefficients. In equilibrium state, the ionization rate is
defined as:
r� � ∑ 425E2E525 � ∑ 312q1E1E2�12 , (A8)
where size classes j and k < 1.6 nm, E2 and E5 are positive and negative ion
concentrations in size class j and k, and E1 is the concentration of neutral particles in size
class i.
67
References
Asmi, E., Sipilä, M., Manninen, H. E., Vanhanen, J., Lehtipalo, K., Gagné, S., Neitola,
K., Mirme, A., Mirme, S., Tamm, E., Uin, J., Komsaare, K., Attoui, M. and Kulmala, M.: Results of the first air ion spectrometer calibration and intercomparison workshop,
Atmos. Chem. Phys., 8(5), 17257–17295, doi:10.5194/acpd-8-17257-2008, 2009.
Almeida, J., Schobesberger, S., Kürten, A., Ortega, I. K., Kupiainen-Määttä, O., Praplan,
A. P., Adamov, A., Amorim, A., Bianchi, F., Breitenlechner, M., David, A., Dommen, J.,
Donahue, N. M., Downard, A., Dunne, E., Duplissy, J., Ehrhart, S., Flagan, R. C., Franchin, A., Guida, R., Hakala, J., Hansel, A., Heinritzi, M., Henschel, H., Jokinen, T.,
Junninen, H., Kajos, M., Kangasluoma, J., Keskinen, H., Kupc, A., Kurtén, T., Kvashin, A. N., Laaksonen, A., Lehtipalo, K., Leiminger, M., Leppä, J., Loukonen, V.,
Makhmutov, V., Mathot, S., McGrath, M. J., Nieminen, T., Olenius, T., Onnela, A.,
Petäjä, T., Riccobono, F., Riipinen, I., Rissanen, M., Rondo, L., Ruuskanen, T., Santos, F. D., Sarnela, N., Schallhart, S., Schnitzhofer, R., Seinfeld, J. H., Simon, M., Sipilä, M.,
Stozhkov, Y., Stratmann, F., Tomé, A., Tröstl, J., Tsagkogeorgas, G., Vaattovaara, P., Viisanen, Y., Virtanen, A., Vrtala, A., Wagner, P. E., Weingartner, E., Wex, H.,
Williamson, C., Wimmer, D., Ye, P., Yli-Juuti, T., Carslaw, K. S., Kulmala, M., Curtius,
J., Baltensperger, U., Worsnop, D. R., Vehkamäki, H. and Kirkby, J.: Molecular understanding of sulphuric acid-amine particle nucleation in the atmosphere, Nature,
502(7471), 359–363, doi:10.1038/nature12663, 2013.
Enghoff, M. B. and Svensmark, H.: The role of atmospheric ions in aerosol nucleation – a
review, Atmos. Chem. Phys., 8(16), 4911–4923, doi:10.5194/acp-8-4911-2008, 2008.
Fuchs, N. A.: On the stationary charge distribution on aerosol particles in a bipolar ionic
atmosphere, Geofis. Pura E Appl., 56(1), 185–193, doi:10.1007/BF01993343, 1963.
Gagné, S., Nieminen, T., Kurtén, T., Manninen, H. E., Petäjä, T., Laakso, L., Kerminen,
V.-M., Boy, M. and Kulmala, M.: Factors influencing the contribution of ion-induced nucleation in a boreal forest, Finland, Atmos. Chem. Phys., 10(8), 3743–3757,
doi:10.5194/acp-10-3743-2010, 2010.
Gagné, S., Lehtipalo, K., Manninen, H. E., Nieminen, T., Schobesberger, S., Franchin,
A., Yli-Juuti, T., Boulon, J., Sonntag, A., Mirme, S., Mirme, A., Hõrrak, U., Petäjä, T., Asmi, E. and Kulmala, M.: Intercomparison of air ion spectrometers: an evaluation of
results in varying conditions, Atmos. Meas. Tech., 4(5), 805–822, doi:10.5194/amt-4-805-2011, 2011.
Held, A., Nowak, A., Birmili, W., Wiedensohler, A., Forkel, R. and Klemm, O.: Observations of particle formation and growth in a mountainous forest region in central
Europe, J. Geophys. Res., 109(D23), doi:10.1029/2004JD005346, 2004.
Hirsikko, A., Nieminen, T., Gagné, S., Lehtipalo, K., Manninen, H. E., Ehn, M., Hõrrak,
U., Kerminen, V.-M., Laakso, L., McMurry, P. H., Mirme, A., Mirme, S., Petäjä, T., Tammet, H., Vakkari, V., Vana, M. and Kulmala, M.: Atmospheric ions and nucleation: a
review of observations, Atmos. Chem. Phys., 11(2), 767–798, doi:10.5194/acp-11-767-
2011, 2011.

68
Hoppel, W. A. and Frick, G. M.: Ion—Aerosol Attachment Coefficients and the Steady-
State Charge Distribution on Aerosols in a Bipolar Ion Environment, Aerosol Sci.
Technol., 5(1), 1–21, doi:10.1080/02786828608959073, 1986.
Hoppel, W. A. and Frick, G. M.: The Nonequilibrium Character of the Aerosol Charge
Distributions Produced by Neutralizes, Aerosol Sci. Technol., 12(3), 471–496, doi:10.1080/02786829008959363, 1990.
Hõrrak, U., Aalto, P. P., Salm, J., Komsaare, K., Tammet, H., Mäkelä, J. M., Laakso, L.
and Kulmala, M.: Variation and balance of positive air ion concentrations in a boreal
forest, Atmos. Chem. Phys., 8(3), 655–675, doi:10.5194/acp-8-655-2008, 2008.
Iida, K., Stolzenburg, M., McMurry, P., Dunn, M. J., Smith, J. N., Eisele, F. and Keady,
P.: Contribution of ion-induced nucleation to new particle formation: Methodology and its application to atmospheric observations in Boulder, Colorado, J. Geophys. Res.,
111(D23), doi:10.1029/2006JD007167, 2006.
Kemski, J., Siehl, A., Stegemann, R. and Valdivia-Manchego, M.: Mapping the geogenic
radon potential in Germany, Sci. Total Environ., 272(1–3), 217–230, doi:10.1016/S0048-9697(01)00696-9, 2001.
Kontkanen, J., Lehtinen, K. E. J., Nieminen, T., Manninen, H. E., Lehtipalo, K., Kerminen, V.-M., and Kulmala, M.: Estimating the contribution of ion–ion
recombination to sub-2 nm cluster concentrations from atmospheric measurements, Atmos. Chem. Phys., 13, 11391-11401, doi:10.5194/acp-13-11391-2013, 2013.
Kulmala, M. and Kerminen, V.-M.: On the formation and growth of atmospheric nanoparticles, Atmospheric Res., 90(2–4), 132–150, doi:10.1016/j.atmosres.2008.01.005,
2008.
Kulmala, M., Laakso, L., Lehtinen, K. E. J., Riipinen, I., Dal Maso, M., Anttila, T.,
Kerminen, V.-M., Hõrrak, U., Vana, M. and Tammet, H.: Initial steps of aerosol growth, Atmos. Chem. Phys., 4(11/12), 2553–2560, doi:10.5194/acp-4-2553-2004, 2004b.
Kulmala, M., Vehkamäki, H., Petäjä, T., Dal Maso, M., Lauri, A., Kerminen, V.-M., Birmili, W. and McMurry, P. H.: Formation and growth rates of ultrafine atmospheric
particles: a review of observations, J. Aerosol Sci., 35(2), 143–176, doi:10.1016/j.jaerosci.2003.10.003, 2004a.
Kulmala, M., Petäjä, T., Nieminen, T., Sipilä, M., Manninen, H. E., Lehtipalo, K., Dal Maso, M., Aalto, P. P., Junninen, H., Paasonen, P., Riipinen, I., Lehtinen, K. E. J.,
Laaksonen, A. and Kerminen, V.-M.: Measurement of the nucleation of atmospheric
aerosol particles, Nat. Protoc., 7(9), 1651–1667, doi:10.1038/nprot.2012.091, 2012.
Kulmala, M., Kontkanen, J., Junninen, H., Lehtipalo, K., Manninen, H. E., Nieminen, T., Petaja, T., Sipila, M., Schobesberger, S., Rantala, P., Franchin, A., Jokinen, T., Jarvinen,
E., Aijala, M., Kangasluoma, J., Hakala, J., Aalto, P. P., Paasonen, P., Mikkila, J.,
Vanhanen, J., Aalto, J., Hakola, H., Makkonen, U., Ruuskanen, T., Mauldin, R. L., Duplissy, J., Vehkamaki, H., Back, J., Kortelainen, A., Riipinen, I., Kurten, T., Johnston,
M. V., Smith, J. N., Ehn, M., Mentel, T. F., Lehtinen, K. E. J., Laaksonen, A., Kerminen,

69
V.-M. and Worsnop, D. R.: Direct Observations of Atmospheric Aerosol Nucleation,
Science, 339(6122), 943–946, doi:10.1126/science.1227385, 2013.
Laakso, L., Gagné, S., Petäjä, T., Hirsikko, A., Aalto, P. P., Kulmala, M. and Kerminen,
V.-M.: Detecting charging state of ultra-fine particles: instrumental development and
ambient measurements, Atmos. Chem. Phys., 7(5), 1333–1345, doi:10.5194/acp-7-1333-2007, 2007.
Leppä, J., Anttila, T., Kerminen, V.-M., Kulmala, M. and Lehtinen, K. E. J.: Atmospheric
new particle formation: real and apparent growth of neutral and charged particles, Atmos.
Chem. Phys., 11(10), 4939–4955, doi:10.5194/acp-11-4939-2011, 2011.
Lüers, J., Smaczny, J., Kies, A. and Bareiss, J.: Dynamik der Austauschprozesse von CO2
und Radon zwischen Waldboden, Waldbestand und Atmosphäre, Berichte Meteorol. Institutes Uiversität Freibg., (16), 147–52, 2007.
Lushnikov, A. A. and Kulmala, M.: Charging of aerosol particles in the near free-
molecule regime, Eur. Phys. J. - At. Mol. Opt. Plasma Phys., 29(3), 345–355,
doi:10.1140/epjd/e2004-00047-9, 2004.
Makkonen, R., Asmi, A., Kerminen, V.-M., Boy, M., Arneth, A., Hari, P. and Kulmala,
M.: Air pollution control and decreasing new particle formation lead to strong climate warming, Atmos. Chem. Phys., 12(3), 1515–1524, doi:10.5194/acp-12-1515-2012, 2012.
Manninen, H. E., Nieminen, T., Riipinen, I., Yli-Juuti, T., Gagné, S., Asmi, E., Aalto, P.
P., Petäjä, T., Kerminen, V.-M. and Kulmala, M.: Charged and total particle formation
and growth rates during EUCAARI 2007 campaign in Hyytiälä, Atmos. Chem. Phys., 9(12), 4077–4089, doi:10.5194/acp-9-4077-2009, 2009a.
Manninen, H. E., Petaja, T., Asmi, E., Riipinen, I., Nieminen, T., Mikkila, J., Horrak, U., Mirme, A., Mirme, S., Laakso, L., Kerminen, V.-M. and Kulmala, M.: Long-term field
measurements of charged and neutral clusters using Neutral cluster and Air Ion Spectrometer (NAIS), Boreal Environ. Res., 14(4), 591–605, 2009b.
Manninen, H. E., Nieminen, T., Asmi, E., Gagné, S., Häkkinen, S., Lehtipalo, K., Aalto, P., Vana, M., Mirme, A., Mirme, S., Hõrrak, U., Plass-Dülmer, C., Stange, G., Kiss, G.,
Hoffer, A., Törő, N., Moerman, M., Henzing, B., de Leeuw, G., Brinkenberg, M., Kouvarakis, G. N., Bougiatioti, A., Mihalopoulos, N., O’Dowd, C., Ceburnis, D., Arneth,
A., Svenningsson, B., Swietlicki, E., Tarozzi, L., Decesari, S., Facchini, M. C., Birmili,
W., Sonntag, A., Wiedensohler, A., Boulon, J., Sellegri, K., Laj, P., Gysel, M., Bukowiecki, N., Weingartner, E., Wehrle, G., Laaksonen, A., Hamed, A., Joutsensaari, J.,
Petäjä, T., Kerminen, V.-M. and Kulmala, M.: EUCAARI ion spectrometer measurements at 12 European sites – analysis of new particle formation events, Atmos.
Chem. Phys., 10(16), 7907–7927, doi:10.5194/acp-10-7907-2010, 2010.
Manninen, H. E., Franchin, A., Schobesberger, S., Hirsikko, A., Hakala, J., Skromulis,
A., Kangasluoma, J., Ehn, M., Junninen, H., Mirme, A., Mirme, S., Sipilä, M., Petäjä, T.,
Worsnop, D. R. and Kulmala, M.: Characterisation of corona-generated ions used in a Neutral cluster and Air Ion Spectrometer (NAIS), Atmos. Meas. Tech., 4(12), 2767–
2776, doi:10.5194/amt-4-2767-2011, 2011.
70
Merikanto, J., Spracklen, D. V., Mann, G. W., Pickering, S. J. and Carslaw, K. S.: Impact
of nucleation on global CCN, Atmos. Chem. Phys., 9(21), 8601–8616, doi:10.5194/acp-
9-8601-2009, 2009.
Mirme, S. and Mirme, A.: The mathematical principles and design of the NAIS – a
spectrometer for the measurement of cluster ion and nanometer aerosol size distributions, Atmos. Meas. Tech., 6, 1061-1071, doi:10.5194/amt-6-1061-2013, 2013.
Reischl, G. P., Mäkelä, J. M., Karch, R. and Necid, J.: Bipolar charging of ultrafine
particles in the size range below 10 nm, J. Aerosol Sci., 27(6), 931–949,
doi:10.1016/0021-8502(96)00026-2, 1996.
Savitzky, A. and Golay, M. J.: Smoothing and Differentiation of Data by Simplified Least
Squares Procedures, Anal. Chem., 36(8), 1627, 1964.
Schobesberger, S., Junninen, H., Bianchi, F., Lönn, G., Ehn, M., Lehtipalo, K., Dommen, J., Ehrhart, S., Ortega, I. K., Franchin, A., Nieminen, T., Riccobono, F., Hutterli, M.,
Duplissy, J., Almeida, J., Amorim, A., Breitenlechner, M., Downard, A. J., Dunne, E. M.,
Flagan, R. C., Kajos, M., Keskinen, H., Kirkby, J., Kupc, A., Kürten, A., Kurtén, T., Laaksonen, A., Mathot, S., Onnela, A., Praplan, A. P., Rondo, L., Santos, F. D.,
Schallhart, S., Schnitzhofer, R., Sipilä, M., Tomé, A., Tsagkogeorgas, G., Vehkamäki, H., Wimmer, D., Baltensperger, U., Carslaw, K. S., Curtius, J., Hansel, A., Petäjä, T.,
Kulmala, M., Donahue, N. M. and Worsnop, D. R.: Molecular understanding of
atmospheric particle formation from sulfuric acid and large oxidized organic molecules, Proc. Natl. Acad. Sci., 110(43), 17223–17228, doi:10.1073/pnas.1306973110, 2013.
Spracklen, D. V., Carslaw, K. S., Kulmala, M., Kerminen, V.-M., Mann, G. W. and Sihto, S.-L.: The contribution of boundary layer nucleation events to total particle
concentrations on regional and global scales, Atmos. Chem. Phys., 6(12), 5631–5648, doi:10.5194/acp-6-5631-2006, 2006.
Tammet, H. and Kulmala, M.: Simulation tool for atmospheric aerosol nucleation bursts, J. Aerosol Sci., 36(2), 173–196, doi:10.1016/j.jaerosci.2004.08.004, 2005.
Tammet, H., Hõrrak, U. and Kulmala, M.: Negatively charged nanoparticles produced by splashing of water, Atmos. Chem. Phys., 9(2), 357–367, doi:10.5194/acp-9-357-2009,
2009.
Virkkula, A., Hirsikko, A., Vana, M., Aalto, P. P., Hillamo, R. and Kulmala, M.: Charged
particle size distributions and analysis of particle formation events at the Finnish Antarctic research station Aboa, Boreal Environ. Res., 12(3), 397–408, 2007.
Wiedensohler, A.: An approximation of the bipolar charge distribution for particles in the submicron size range, J. Aerosol Sci., 19(3), 387–389, doi:10.1016/0021-8502(88)90278-
9, 1988.
Wiedensohler, A., Birmili, W., Nowak, A., Sonntag, A., Weinhold, K., Merkel, M.,
Wehner, B., Tuch, T., Pfeifer, S., Fiebig, M., Fjäraa, A. M., Asmi, E., Sellegri, K., Depuy, R., Venzac, H., Villani, P., Laj, P., Aalto, P., Ogren, J. A., Swietlicki, E.,
Williams, P., Roldin, P., Quincey, P., Hüglin, C., Fierz-Schmidhauser, R., Gysel, M.,

71
Weingartner, E., Riccobono, F., Santos, S., Grüning, C., Faloon, K., Beddows, D.,
Harrison, R., Monahan, C., Jennings, S. G., O’Dowd, C. D., Marinoni, A., Horn, H.-G.,
Keck, L., Jiang, J., Scheckman, J., McMurry, P. H., Deng, Z., Zhao, C. S., Moerman, M., Henzing, B., de Leeuw, G., Löschau, G. and Bastian, S.: Mobility particle size
spectrometers: harmonization of technical standards and data structure to facilitate high quality long-term observations of atmospheric particle number size distributions, Atmos.
Meas. Tech., 5(3), 657–685, doi:10.5194/amt-5-657-2012, 2012.
Winkler, P. M., Steiner, G., Vrtala, A., Vehkamaki, H., Noppel, M., Lehtinen, K. E. J.,
Reischl, G. P., Wagner, P. E. and Kulmala, M.: Heterogeneous nucleation experiments
bridging the scale from molecular ion clusters to nanoparticles, Science, 319(5868), 1374–1377, doi:10.1126/science.1149034, 2008.
Yli-Juuti, T., Nieminen, T., Hirsikko, A., Aalto, P. P., Asmi, E., Hõrrak, U.,
Manninen, H. E., Patokoski, J., Dal Maso, M., Petäjä, T., Rinne, J., Kulmala, M., and
Riipinen, I.: Growth rates of nucleation mode particles in Hyytiälä during 2003−2009: variation with particle size, season, data analysis method and ambient conditions, Atmos.
Chem. Phys., 11, 12865-12886, doi:10.5194/acp-11-12865-2011, 2011.
Yu, F.: From molecular clusters to nanoparticles: second-generation ion-mediated
nucleation model, Atmos. Chem. Phys., 6(12), 5193–5211, doi:10.5194/acp-6-5193-2006, 2006.
Yu, F. and Turco, R. P.: Ultrafine aerosol formation via ion-mediated nucleation, Geophys. Res. Lett., 27(6), 883–886, doi:10.1029/1999GL011151, 2000.
Yu, F. and Turco, R. P.: Case studies of particle formation events observed in boreal forests: implications for nucleation mechanisms, Atmos. Chem. Phys., 8(20), 6085–6102,
doi:10.5194/acp-8-6085-2008, 2008.
Yu, F. and Turco, R. P.: The size-dependent charge fraction of sub-3-nm particles as a
key diagnostic of competitive nucleation mechanisms under atmospheric conditions, Atmos. Chem. Phys., 11(18), 9451–9463, doi:10.5194/acp-11-9451-2011, 2011.
Yue, G. K. and Chan, L. .: Theory of the formation of aerosols of volatile binary solutions through the ion-induced nucleation process, J. Colloid Interface Sci., 68(3), 501–507,
doi:10.1016/0021-9797(79)90308-4, 1979.
72
Appendix II: (Gonser et al., 2014b)
Occurrence and growth of ions and neutral
particles during particle formation events in four
different environments
S. G. Gonser1, W. Birmili2, K. Sellegri3 and A. Held1
[1] University of Bayreuth, BayCEER, Atmospheric Chemistry, 95448 Bayreuth, Germany
[2] Leibniz Institute for Tropospheric Research, 04318 Leipzig, Germany
[3] Laboratoire de Météorologie Physique CNRS UMR6016, Observatoire de Physique du Globe de
Clermont-Ferrand, Université Blaise Pascal, France
Abstract
New particle formation (NPF) strongly contributes to the number concentration of
atmospheric aerosol particles. The formation of neutral particles in the atmosphere is
always accompanied by the formation of intermediate and large ions. Previous investigations trying to quantify the contribution of ions to particle formation yielded
contrasting findings. While modeling approaches did indicate a major role of ions, most field measurements suggested a minor role of the ion fraction. However, an earlier
occurrence of ions in comparison to neutral particles was observed at several field sites.
In this work, we analyze the occurrence and growth behavior of ions and neutral particles at the four field sites Melpitz (86 m), Waldstein (776 m), Puy de Dôme (1465 m) and
Jungfraujoch (3580 m) with distinct differences in their altitude above sea level. Ion and
neutral particle number size distributions were measured with the neutral cluster and air ion spectrometer (NAIS), down to a mobility diameter of 0.8 and 2 nm, respectively. At
all four field sites, 2-3 nm ions occurred earlier than 2-3 nm neutral particles. During the following growth process the time gap decreased, approaching zero at diameters between
10 and 20 nm. Growth rates (GRs) for ions and neutral particles were determined by
means of two independent methods: the maximum concentration method and the mode fitting method. Neutral GRs showed distinct differences between some sites, with
generally higher GRs at lower altitude sites. Ion GRs were of the same magnitude at all four sites. The maximum concentration method, which is more appropriate to determine
GR for very small particle diameters, resulted in elevated GRs for neutral particles
compared to ion GRs in environments with considerable precursor gas sources. At the more remote sites, the GRs for ions and neutral particles were more similar. This
phenomenon may be explained by a persistent formation of neutral 2 nm particles during the progression of an event at the low altitude sites. However, this was not observed at the
high altitude sites to the same extent. It remains an open question if GRs of ions or GRs
of neutral particles are more representative for the growth of a whole particle population.
73
1 Introduction
New particle formation (NPF) in the atmosphere is always related to simultaneous
formation of charged particles (e.g. Boulon et al., 2010; Gonser et al., 2014; Hirsikko et al., 2011; Iida et al., 2006; Leppä et al., 2011; Manninen et al., 2010). Therefore, the role
of atmospheric ions in NPF is still widely discussed (e.g. Gonser et al., 2014; Iida et al.,
2006; Kontkanen et al., 2013; Kulmala et al., 2013; Yu and Turco, 2011). Ions are likely to contribute to or even be essential for NPF, as the presence of an elementary charge
increases the thermodynamic stability of initial clusters as well as their growth rate (e.g. Lushnikov and Kulmala, 2004; Nadykto and Yu, 2003; Winkler et al., 2008; Yu and
Turco, 2000).
The limiting factor for the role of ions in NPF is the ionization rate, hence the formation of cluster ions with an electric mobility diameter below 1.6 nm. Clearly, when the
ionization rate is below the particle formation rate, ionic clusters cannot be the only factor
triggering NPF. Typical formation rates in the planetary boundary layer are between 0.1 and 10 cm-3 s-1 (Kulmala et al., 2004; Manninen et al., 2010) while ionization rates are
often in the range of 2 to 15 ion pairs cm-3 s-1 (Hess, 1912; Hirsikko et al., 2007b; Hõrrak et al., 2008; Laakso et al., 2004; Tammet et al., 2006). Therefore, ion induced nucleation
(IIN) in the planetary boundary layer seems to be possible, but is certainly depending on
regional variations in ionization and formation rates. A comprehensive computer-based modeling approach for the role of ions in NPF was
presented by Yu and Turco (Yu and Turco, 2000, 2001, 2008, 2011; Yu, 2006). In their work, Yu and Turco take into account the recombination of cluster ions and the
attachment of cluster ions to the background aerosol. This so-called ion mediated
nucleation (IMN) differs from IIN which does not include the interactions among ions and particles but assumes the preservation of the charge during particle growth. Results
from their simulations and comparisons with data measured at the Hyytiälä field site, Finland, pointed towards IMN as the major factor driving NPF.
On the other hand, field measurements suggest a minor role of ions in NPF (e.g. Iida et
al., 2006; Manninen et al., 2010). Only recently, the first simultaneous measurements of sub-2 nm neutral clusters and ions at Hyytiälä where analyzed for the role of ion
recombination in NPF (Kontkanen et al., 2013; Kulmala et al., 2013). The results suggest
a contribution of ion recombination to NPF of up to 17 %. At the high altitude station Jungfraujoch (3580 m a.s.l.), Switzerland, the contribution of ions to NPF was estimated
to be in the order of 22 % (Boulon et al., 2010). While trying to clarify the role of ions in NPF it was observed that ions form prior to
neutral particles. At different locations around Europe Manninen et al. (2010) observed
an earlier formation of 2 nm ions compared to the formation of 2 nm total particles (neutral particles plus ions of both polarities). Gonser et al. (2014) observed a similar
pattern at a coniferous forest site in Germany, with a presumably high ionization rate due to elevated background radioactive radiation. The time difference between the first
occurrence of 2 nm ions and neutral particles was typically in the order of 20 to 30
minutes. Further analysis showed a decrease of the time difference during the growth process. Once the particles reached diameters between 10 to 20 nm, the time difference
was not observed anymore. Further, total particles showed an elevated growth rate (GR) for diameters below 10 to 20 nm compared to the ion mode. Gonser et al. (2014)

74
concluded that this observation could be explained by a GR enhancement due to
interactions of ions and neutral particles.
The question remains whether ions are essential for tropospheric NPF or if their role during NPF is only minor. To shed more light on this topic we analyzed ion and particle
data from different field sites in Europe for the temporal dynamics of the ion mode and differences in GR for neutral and charged particles, extending the work by Gonser et al.
(2014).
2 Methods
The present study is based on measurements of the number size distribution of neutral particles and ions in the diameter range from 2 nm to 20 nm at different field sites in
Europe. All data were recorded with the same type of instrument, the neutral cluster and
air ion spectrometer (NAIS). The different NAIS instruments were located in different environments, in order to analyze ion concentration patterns during new particle
formation (NPF) under different conditions with respect to ion abundance, precursor gas concentrations and types as well as background particle number concentrations. The four
field stations Melpitz (MLP), Waldstein (WST), Puy de Dôme (PDD) and Jungfraujoch
(JFJ) are described in more detail in the following. A total number of 49 NPF events were analyzed for the occurrence and growth of ions and neutral particles. For the analysis only
regional NPF events were utilized. Hirsikko et al. (2007a) proposed a visual classification scheme on basis of ion and particle contour plots to identify regional events. For our
analysis, only class Ia and Ib events were used.
2.1 Description of measurement sites
Data presented here were measured during different time periods at four different
locations in Europe. The most prominent difference among the field sites is the altitude
above sea level and their location in different environments. For an overview of the measurement site locations and measurement periods see Tab. 1.
Tab. 1: Location, elevation, landscape type and observation periods of measurement
sites.
Site Coordinates Elevation Landscape type Observation period # events
Melpitz
(Germany)
12.928°E
51.526°N 86 m
Rural - Meadow /
forest
07.05.2008 -
24.07.2009 19
Waldstein
(Germany)
11.864°E
50.143°N 776 m
Rural - Coniferous
forest
17.06.2012 -
18.08.2012 8
Puy de Dôme
(France)
02.964°E
45.772°N 1465 m
Mountainous -
Meadow / Forest
04.02.2011 -
01.12.2011 11
Jungfraujoch
(Switzerland)
07.985°E
46.548°N 3580 m
Mountainous -
snow covered
09.04.2008 -
05.05.2009 11

75
2.1.1 Melpitz
The Melpitz (MLP) site is located in NW Saxony, Germany. The site is located on a
pasture at 86 m a.s.l. in a rural landscape with no considerable orography in the immediate surroundings. The site can be characterized as a central European background
site. More information can be found in Poulain et al. (2011) and Spindler et al. (2010)
and in Tab. 1. The NAIS (serial number SN-4) was located in a container with the inlet emerging from the roof top. Cluster ion concentrations at MLP do show a diurnal pattern,
with a maximum in concentration during night time and a minimum during the day.
2.1.2 Waldstein
The Waldstein (WST) site is located in the Fichtelgebirge low mountain range in NE Bavaria, Germany. The research station is located in a rural area dominated by coniferous
forest at 776 m a.s.l. The NAIS (serial number SN-15) was located in a container on a
clearing in a forest dominated by Norway spruce. The inlet of the NAIS was positioned at 2 m above ground and pointed towards the east. The Fichtelgebirge low mountain range
is known for its enhanced background radiation due to high radon soil concentrations
(Kemski et al., 2001). Radon concentrations exhibit a clear diurnal variation at WST with the minimum concentration around noon and the maximum during the night. This is
thought to be due to stable stratification at night and mixing of the planetary boundary layer during daytime, respectively (Lüers et al., 2007). The same diurnal variation can
also be seen in cluster ion concentrations, leading to the conclusion that radon is the
major ionizing component at the WST site (Gonser et al., 2014).
2.1.3 Puy de Dôme
The Puy de Dôme (PDD) field site is located in the Auvergne region in central France. The measurement station is located on the peak of the extinct volcano Puy de Dôme at an
altitude of 1465 m a.s.l. The greater surroundings of the field site are characterized by agriculture and forests, while the top of the mountain is covered with grassland. For more
detail regarding the site refer to Venzac et al. (2009). A diurnal variation in cluster ion
concentrations at PDD can only be seen in positive ion concentrations, as they exhibit a slight concentration maximum during daytime (Rose et al., 2013).
2.1.4 Jungfraujoch
The Jungfraujoch (JFJ) site is located on the northern ridge of the Bernese Alps,
Switzerland. The measurement station is located on an anticline between the Jungfrau (4158 m) and the Mönch (4089 m) peaks. Air masses being advected to the station
originate mostly from the Swiss plateau or from the inner Alpine area (Lugauer et al.,
1998). Due to its high altitude at 3580 m a.s.l., the atmosphere at the JFJ is not significantly influenced by anthropogenic pollution sources. During daytime and summer,
air masses from the planetary boundary layer are transported to the JFJ site (Lugauer et
al., 2000). Diurnal variations in cluster ion concentrations show a maximum during midday (Boulon et al., 2010).
76
2.2 The neutral cluster and air ion spectrometer (NAIS)
The NAIS is a unique instrument as it is capable of measuring total particle
concentrations down to a mobility diameter of 2 nm and air ions down to a mobility diameter of 0.8 nm, with an upper limit of 42 nm both for ions and total particles
(Manninen et al., 2009, 2011; Mirme and Mirme, 2013). The NAIS measures
alternatingly total particle number size distributions and ion number size distributions. Positive and negative ions are analyzed simultaneously in a positive and a negative
differential mobility analyzer (DMA) each equipped with 21 electrometers. To measure total particle concentrations the aerosol is charged prior to the mobility analysis by means
of a unipolar corona discharger. The unipolar charging results in a considerable amount
of multiply charged particles, which is especially notable for mobility diameters above 20 nm. Further, total particles below a diameter of 2 nm cannot be distinguished clearly from
the corona-generated ions (Manninen et al., 2011). Therefore, in this study we only
consider the diameter range from 2 nm to 20 nm when ions and particles are compared. In addition to every ion and particle measurement, the NAIS performs an offset
measurement to obtain the magnitude of the background noise of the electrometers. For the offset mode, particles and ions are prevented from entering the DMAs by means of
electrical filters. The total time necessary for one measurement cycle (ion, total particle
and offset measurement) depends on the instrument settings. For our study, the data of the different NAIS instruments were kept at the time resolution as provided by the instrument
operators. Therefore, data from MLP has a resolution of 5 minutes, data from WST and JFJ a resolution of 3 minutes, and data from PDD a resolution of 2 minutes. In order to
analyze the neutral particle fraction we subtracted the measured positive and negative ion
concentrations from the measured total particle concentrations.
2.3 Determination of formation rate, growth rate and ion/particle
temporal dynamics
From the NAIS number size distribution data various parameters were determined. The most important parameters to describe NPF are the formation rate J in the diameter
interval 2-3 nm, the growth rate GR in defined diameter intervals and the timing of first
occurrence of ions and neutral particles in a defined diameter interval. The formation rates for neutral particles (Jn) and negative and positive ions (Jneg; Jpos) in
the diameter interval from 2 to 3 nm were calculated according to equations 9 and 10 in Kulmala et al. (2012), respectively. For this approach, knowledge of the coagulation sink
for small particles and ions is required. As no data for the background aerosol particles
was analyzed in this study, the coagulation sink was assumed to be constant and the same at all measurement sites (10-3 s-1). This assumption is certainly not appropriate for all field
sites; especially the high elevation sites do have considerably lower coagulation sinks. Therefore, the obtained formation rates are not quantitative but do rather serve as relative
values to compare the different field sites to each other.
Manninen et al. (2010) and Gonser et al. (2014) observed an earlier formation of ions in comparison to total particles during NPF. In order to determine a diameter-dependent
time difference in appearance of ions and neutral particles (∆t) during NPF, a cross-
correlation analysis was performed for particle/ion concentrations of each NAIS size channel (Gonser et al., 2014). In principle, this method calculates the time difference

77
between the occurrence of the ion and neutral maximum concentration for each NAIS
size channel.
As proposed by Gonser et al. (2014), differences in the growth rates (GR) of ions and particles may help to identify the role of ions in NPF. Therefore, GRs were determined
with special care by applying two independent methods: (1) the maximum concentration method (Kulmala et al., 2012; Lehtinen and Kulmala, 2003; Yli-Juuti et al., 2011) and (2)
the mode fitting method (Hussein et al., 2005; Kulmala et al., 2012; Dal Maso et al.,
2005; Yli-Juuti et al., 2011). (1) The maximum concentration method (MCM) is an approach considering the particle
concentration time series of a defined diameter interval (e.g. a single size channel of the
NAIS) to find the time of maximum concentration. By considering multiple size intervals and the time differences between the different times of maximum concentration in the
respective intervals, the growth rate can be determined. In order to find the best estimate for the time of maximum concentration, in most approaches a Gauss normal distribution
is fitted to the data (e.g. Kulmala et al., 2012; Yli-Juuti et al., 2011). For the present
study, we did not fit a normal distribution to the time series of single NAIS size channels, but rather smoothed each time series with a Savitzky-Golay smoothing algorithm
(Savitzky and Golay, 1964) to reduce the measurement noise. This approach is thought to better describe the real concentration progression of aerosol particles in a defined size
range, as concentration time series are not expected to follow the progression of a
Gaussian normal distribution. The resulting times of maximum concentration for each considered diameter interval were further smoothed by means of a Savitzky-Golay
smoothing algorithm and a linear regression was fitted for the diameter ranges of 2-3 nm, 3-7 nm and 7-15 nm. The slopes of the fitted functions give the GR for the considered
diameter intervals.
(2) Our application of the mode fitting method (MFM) is based on the work of Hussein et al. (2005), optimized for data obtained with the NAIS. Hence, a log normal distribution
was fitted to the narrow diameter range of 2 to 16 nm of number size distributions obtained from NAIS measurements using an automated fitting algorithm. The Gauss-
Newton method was used to solve the least square estimate problem in the nonlinear case.
It improves the least squares iteratively with a linear approximation until there is no further change above a defined threshold (Bates and Watts, 2008). The geometric mean
diameter of the fitted log normal distribution gives the mean diameter of the nucleation
mode at a certain point in time. Again, linear regressions in the diameter ranges 2-3 nm, 3-7 nm and 7-15 nm were fitted to the results. However, most of the measured number
size distributions did not allow the determination of GR for the lowest diameter range, as the first neutral particles visible during NPF events often exhibited diameters well above
2 nm.
3 Results and discussion
3.1 General event characteristics
New particle formation at WST and MLP is a common phenomenon during spring and
summer (e.g. Birmili et al., 2001; Gonser et al., 2014; Held et al., 2004; Wiedensohler et
al., 2002), while at PDD and JFJ NPF does occur during spring, summer and fall with a

78
minimum in Winter (e.g. Boulon et al., 2010; Rose et al., 2013). At all field stations, NPF
is accompanied by the formation of charged particles. Hirsikko et al. (2011) proposed a
division of atmospheric ions into three classes according to their mobility diameter: cluster ions (< 1.6 nm), intermediate ions (1.6 – 7.4 nm) and large ions (> 7.4 nm).
Cluster ions are always present in the atmosphere, being formed by radioactive decay and cosmic radiation. On the other hand, intermediate ions do only form during NPF and
precipitation (Tammet et al., 2009; Virkkula et al., 2007). Cluster ions at MLP, WST,
PDD and JFJ were always present, exhibiting median concentrations on event days in the range of 130 to 420 cm-3. At WST, PDD and JFJ positive cluster ion concentrations were
found to be elevated by at last a factor of 2 over negative cluster ion concentrations. MLP
was the only site with comparable concentrations for both polarities. The highest positive cluster ion concentrations as well as the lowest concentrations in negative cluster ions
were measured at PDD. A general increase of cluster ion concentrations with increasing altitude can be deduced from the data (for more details see Tab. 2). At all sites
intermediate and large ions could be observed during NPF, while at the mountainous sites
PDD and JFJ larger ions do also appear when the stations are engulfed in clouds (Boulon et al., 2010; Rose et al., 2013).
Fig. 1 shows exemplary NPF events for all four field sites for neutral particles as well as positive and negative ions. A rather typical characteristic of NPF at the MLP and WST
field sites was the deviation from a perfect banana shape for small neutral particles (< 10
nm). At small diameters, the contour plots typically show a very broad base. Additionally, most events did not start with particle diameters of 2 nm but the first particles to appear
rather exhibited diameters around 3 to 5 nm. Only during the progression of the event, also particles with diameters as small as 2 nm did form. Once the particles have grown to
diameters larger than 10 nm a typical banana-shaped growth can be observed in the
contour plots. On the other hand, both ion polarities typically exhibited a clear banana shape for all considered diameters at MLP and WST, as the first intermediate ions to
appear exhibited diameters of 2 nm and below. For the two high elevation sites PDD and JFJ, a banana shape can typically be observed
in the contour plots for ions and neutral particles (e.g. Fig. 1 g-l). At both locations,
intermediate ions and neutral particles appeared at diameters around 2 nm at the onset of NPF events and continued to grow in a similar fashion. Additionally, NPF in the ion
fraction at PDD and JFJ did always show a clear connection to the present cluster ions
(cf. Fig. 1 h, I, k, l). This could not be observed to the same extent at the low altitude filed sites MLP and WST.
Further differences among the field sites can be found in neutral particle concentrations as well as in different formation and growth rates (for an overview refer to Tab. 2 and
Tab. A1). In general, particle formation was more intense at the field sites located at
lower altitudes. Therefore, the formation rates were elevated for neutral particles at MLP and WST. Regarding positive and negative ion formation, the differences among the field
sites are not that pronounced (Tab. 2). GRs determined with two independent methods resulted in considerable differences among the field sites as well as among the two
methods (cf. Fig. 1, Tab. 2 and Tab. 3). Neutral GRs were observed to be elevated at
MLP and WST, while ion GRs were comparable at all four field sites.
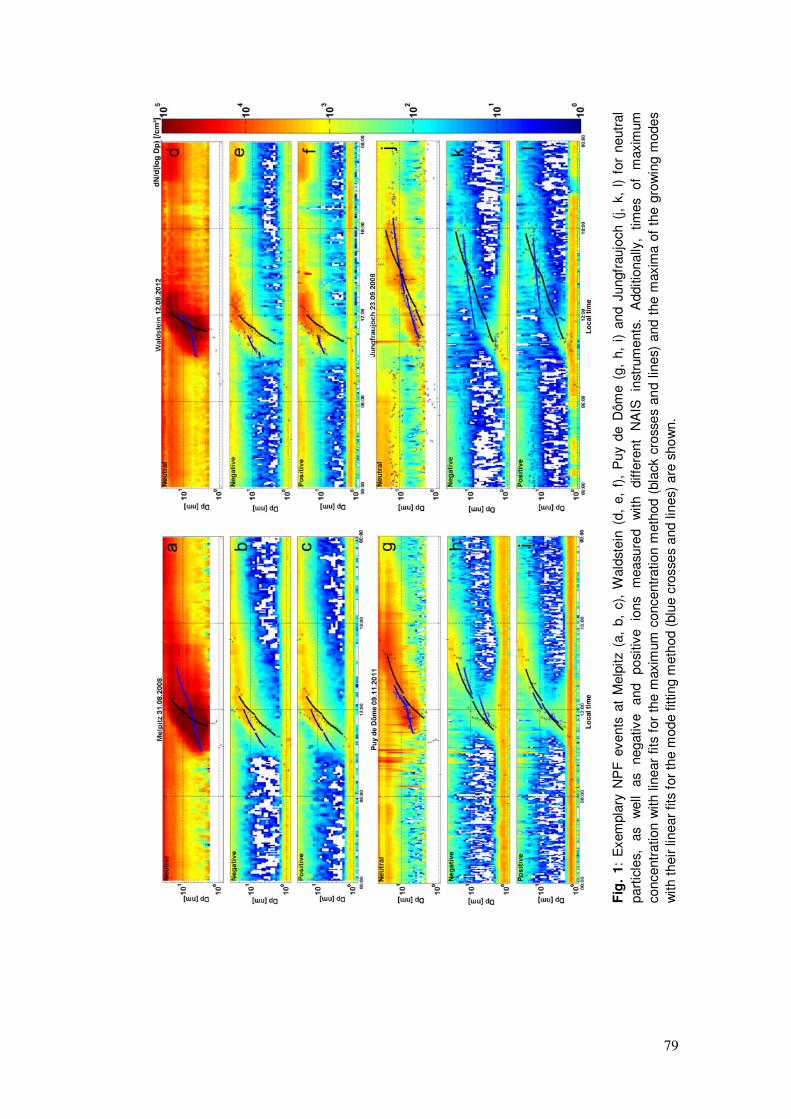
79
Fig
. 1:
Exem
pla
ry N
PF
events
at
Melp
itz
(a,
b,
c),
Wald
stein
(d,
e,
f),
Puy
de D
ôm
e (
g,
h,
i) a
nd J
ungfr
aujo
ch (
j, k
, l) f
or
neutr
al
part
icle
s,
as
well
as
negative
and
posi
tive
ions
measu
red
with
diffe
rent
NA
IS
inst
rum
ents
. A
dditio
nally
, tim
es
of
maxim
um
concentr
ation w
ith lin
ear
fits
for
the m
axim
um
concentr
ation m
eth
od (
bla
ck c
ross
es
an
d l
ines)
and t
he m
axim
a o
f th
e g
row
ing m
odes
with t
heir lin
ear
fits
for
the m
ode fitting m
eth
od (
blu
e c
rosse
s and lin
es)
are
sho
wn.

80
Tab. 2: Median values of 2-3 nm formation rate J [cm-3
s-1
] and 2-3 nm growth rate GR
[nm h-1
] for neutral particles, negative and positive ions, respectively; time difference in
first occurrence of ions and neutral particles ∆t [min.] in the diameter interval of 2-3 nm,
and negative and positive cluster ion concentrations Nclus [cm-3
] (for more detail see Tab.
A2). Growth rates are determined by means of the maximum concentration method.
Location Jneut Jneg Jpos GRneut GRneg GRpos Δtneg Δtpos Nclus neg Nclus pos
MLP 13.3 0.010 0.012 5.1 2.8 2.8 30 25 176 185
WST 3.0 0.012 0.027 6.4 3.2 3.5 30 27 145 338
PDD 0.4 0.009 0.023 2.1 1.6 2.0 2 9 132 419
JFJ 0.4 0.022 0.020 3.7 3.7 3.1 14 17 166 383
3.2 Size dependent occurrence of ions and neutral particles
As already observed by Gonser et al. (2014) at the WST site, intermediate ions appear
earlier than neutral particles of the same size. This earlier occurrence of ion formation can be described by the size dependent time of advance ∆t. Typical values of ∆t at a diameter
of 2 nm at WST were reported to be in the order of 20 – 30 minutes, and to decrease as the particles and ions grow (Gonser et al., 2014). To further analyze this phenomenon, ∆t
was calculated for all considered events at the four field sites. However, the results have
to be interpreted with care for the high elevation sites PDD and JFJ, as neutral particle measurements at diameters smaller 3 nm are subject to high noise levels (cf. Fig. 2 g, j
and Fig. 3 g, h, j ,k). The analysis showed very similar patterns for all field sites. In particular, MLP, WST
and JFJ clearly showed the occurrence of ions prior to neutral particles (Fig. 2 a, b, c, d,
g, h). The median ∆t of 2-3 nm positive ions at MLP, WST and JFJ was 25, 27 and 17 minutes, respectively. The median ∆t of 2-3 nm negative ions was 30, 30 and 14
minutes for MLP, WST and JFJ, respectively (cf. Tab. 2). The only site with a less pronounced time gap between the ion and neutral fractions was PDD. Here, the median ∆t
is only 2 and 9 minutes for 2-3 nm negative and positive ions, respectively (cf. Fig 2 e, f
and Tab. 2). Compared to the other sites, WST showed a less steep decrease of ∆t with increasing particle diameter. While ∆t at MLP and JFJ reached zero at diameters of
around 10 nm, the difference did not vanish before the particles reached diameters of about 20 nm at WST.
The observation of earlier ion formation at JFJ stands in contrast to the observations of
Manninen et al. (2010), as they observed no earlier occurrence of the ion fraction at JFJ. As mentioned above, the results from the cross correlation analysis for JFJ and PDD are
subject to rather high uncertainties due to a high background noise in the neutral particle
fraction.
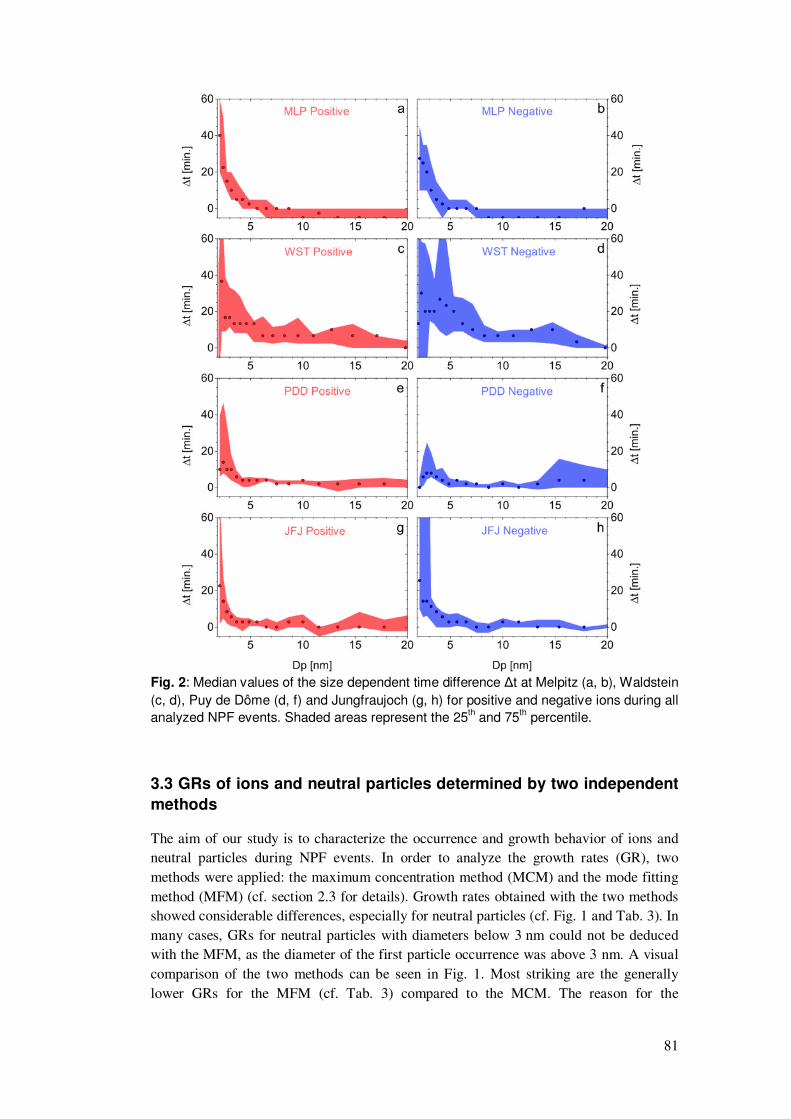
81
Fig. 2: Median values of the size dependent time difference ∆t at Melpitz (a, b), Waldstein
(c, d), Puy de Dôme (d, f) and Jungfraujoch (g, h) for positive and negative ions during all
analyzed NPF events. Shaded areas represent the 25th and 75
th percentile.
3.3 GRs of ions and neutral particles determined by two independent
methods
The aim of our study is to characterize the occurrence and growth behavior of ions and neutral particles during NPF events. In order to analyze the growth rates (GR), two
methods were applied: the maximum concentration method (MCM) and the mode fitting
method (MFM) (cf. section 2.3 for details). Growth rates obtained with the two methods showed considerable differences, especially for neutral particles (cf. Fig. 1 and Tab. 3). In
many cases, GRs for neutral particles with diameters below 3 nm could not be deduced with the MFM, as the diameter of the first particle occurrence was above 3 nm. A visual
comparison of the two methods can be seen in Fig. 1. Most striking are the generally
lower GRs for the MFM (cf. Tab. 3) compared to the MCM. The reason for the

82
pronounced differences can be found in the fundamental principles of the two methods:
the MCM analyzes the data in a "vertical" manner, beginning with the smallest diameter
class, while the MFM considers the NPF event from a temporal point of view, proceeding "horizontally" with the course of time. Therefore, when an NPF event does not exhibit a
perfect banana-shaped evolution, both methods will inevitably deviate from each other. This is especially the case for the neutral fraction in NPF events at MLP and WST. At
both sites, NPF events are frequently accompanied by a persistent formation of 2 nm
particles leading to a broad based banana in the contour plots (cf. Fig. 1 a, d and Fig. 3 a, d). Therefore, the deviation among the two methods is greatest for neutral particles at
MLP and WST (cf. Tab. 3). At the two high elevation sites the differences are less
pronounced. In general, the MFM and the MCM do agree much better for ion growth rates, as ion formation does mostly show a nice banana shaped growth (cf. Tab. 3 and
Fig. 1). Furthermore, a rather striking difference between the two methods is a contrasting
behavior regarding the differences in GRs for ions and neutral particles. While neutral
particles show elevated GRs for the MCM, the results from the MFM point towards a faster growth of charged particles.
Tab. 3: Median growth rates [nm h
-1] for neutral particles, negative and positive ions for
diameter ranges 2-3 nm, 3-7 nm and 7-15 nm for the maximum concentration method
(MCM) and the mode fitting method (MFM) at the four field sites.
2-3 nm MFMneut MCMneut MFMneg MCMneg MFMpos MCMpos
MLP - 5.1 0.8 2.8 5.7 2.8
WST - 6.4 - 3.2 - 3.5
PDD 3.4 2.1 2.0 1.6 1.7 2.0
JFJ 0.9 3.7 2.6 3.7 4.7 3.1
3-7 nm MFMneut MCMneut MFMneg MCMneg MFMpos MCMpos
MLP 0.7 7.8 3.2 4.7 3.1 4.9
WST 1.4 11.1 3.5 6.0 4.0 5.6
PDD 1.4 3.3 2.9 3.4 3.4 3.5
JFJ 1.4 6.9 - 6.0 7.4 5.4
7-15 nm MFMneut MCMneut MFMneg MCMneg MFMpos MCMpos
MLP 4.8 12.0 5.1 9.9 4.8 9.9
WST 4.2 16.4 4.7 12.0 3.7 10.1
PDD 2.5 8.2 1.9 8.7 3.3 7.1
JFJ 2.7 13.3 2.4 11.1 2.2 11.4

83
3.4 Cluster ion concentrations
The field sites show significant differences in cluster ion concentrations (cf. Tab. 2).
While median concentrations for negative and positive cluster ions did not vary significantly at MLP, clear differences in positive and negative concentrations could be
observed at the other field sites. At WST, PDD and JFJ, positive cluster ion
concentrations prevailed by at least a factor of two. This may be explained by the atmospheric electrode effect, which causes the repulsion of negative cluster ions from the
negatively charged surface. This effect results in elevated positive cluster ion concentrations in the first few meters of the planetary boundary layer (e.g. Hirsikko et al.,
2011; Hoppel et al., 1986). On the other hand, this effect should also be visible at MLP.
Rose et al. (2013) and Gonser et al. (2014) report of measurements performed at PDD and WST with air ion spectrometers (AIS; Mirme et al., 2007), and both studies did not show
a dominance of positive cluster ions. Therefore, it is not clear whether positive cluster ion
concentrations prevail over negative cluster ions at the four measurement sites. To calculate the ionization rate for cluster ions, sink and source terms have to be
considered. The major sinks for cluster ions are recombination and the attachment to background aerosol particles. Sources for cluster ions are the ionization of air molecules
by means of cosmic radiation as well as radioactive decay. The ionization rate was not
calculated for the different field sites, as no data of the background aerosol was considered for our analysis. Therefore, we only report the measured absolute
concentrations.
3.5 Differences in the onset of NPF at the four field sites
NPF events showed several different characteristics at the four field sites. While neutral
formation rates (Jneut) and growth rates (GRneut) were elevated at the lower altitude sites MLP and WST, ion formation rates (Jneg, Jpos) and ion growth rates (GRneg, GRpos) were of
the same magnitude at all sites (cf. Tab. 2 and Tab. A1). Considering the contour plots in
Fig. 1 and Fig. 3, a striking difference regarding the smallest detectable diameter in neutral NPF was observed. At MLP and WST neutral NPF often did not begin with the
smallest detectable diameter, while neutral NPF at PDD and JFJ mostly began in the lowest detectable size class. The first occurrence of particles larger than 2 nm in diameter
at MLP and WST is thought to be related to the advection of particles formed upwind or
in higher altitudes of the measuring instrument. This is very likely due to spatial variations of precursor gas sources and sinks in the greater surroundings of the
measurement locations. The advection of charged particles was not that strongly
pronounced, as intermediate ions are likely to achieve the Fuchs equilibrium charging state (Fuchs, 1963; Wiedensohler, 1988) by recombining with cluster ions during the time
necessary to reach the measurement location. Interestingly, neutral particle formation seems to begin after the first advection of intermediate neutral particles at MLP and WST.
The data show the maximum Jneut after the appearance of the first intermediate particles
(cf. Fig. 3 a, b and d, e). Obviously, local formation of neutral particles is triggered even at the presence of elevated background particle concentrations. This is a rather
astonishing fact, as condensation of precursor gases should happen predominantly onto preexisting particles of larger diameters.

84
Fig
. 3: T
ypic
al N
PF
events a
t Melp
itz (a
, c), W
ald
stein
(d, f), P
uy d
e D
ôm
e (g
, i) and J
ungfra
ujo
ch (j, l) fo
r neutra
l particle
s and p
ositiv
e
ions a
s measu
red
with
diffe
rent N
AIS
instru
ments. A
dditio
nally
, the fo
rmatio
n ra
tes in
the d
iam
ete
r inte
rval 2
-3 n
m fo
r neutra
l, negativ
e
and p
ositiv
e io
ns a
re sh
ow
n (b
, e, h
, k).

85
Considering the formation rates in Fig. 3 (b, e), an earlier formation of intermediate ions
can be observed compared to neutral formation at MLP and WST. Therefore, the
triggering mechanism of the neutral formation may be related to the ion fraction as proposed by Gonser et al. (2014). However, once the formation of 2 nm neutral particles
began, it usually lasted for a few hours. At the high altitude sites PDD and JFJ, an earlier occurrence of the ion fraction is not as
clearly visible as for MLP and WST (cf. Fig. 3 h, k). Neutral NPF at PDD and JFJ mostly
exhibited a less persistent 2-3 nm particle formation in comparison to the lower altitude sites. The contour plots of the ion fraction and neutral particles are much more similar (cf.
Fig. 1 g-l, Fig. 3 g, i, j, l). Therefore, neutral particles and ions generally exhibited similar
GRs (cf. Tab. 2). Nevertheless, at PDD a persistent formation of 2-3 nm neutral particles could also be observed in some cases (e.g. Fig. 3 g).
3.6 Potential mechanisms of initial new particle formation
In Fig. 4 a regional NPF event is shown at MLP on 29 May, 2008. This event is undisturbed, as this day showed ideal conditions for regional particle formation. Wind
speed was moderate and wind direction was very constant throughout the whole event.
Additionally, solar radiation, air temperature, relative humidity and ozone concentration showed smooth and continuous progressions. In the neutral particle fraction, the initial
advection of intermediate particles was followed by the formation of 2 nm particles. Following the first formation event, a second and more intense formation event of 2 nm
neutral particles occurred. These patterns are also very clearly reflected in the neutral
formation rate (Fig. 4 d), as two maxima are visible. Both sub-events showed distinctly different GRs. This difference is quite well represented by the two GR methods in the
diameter range from 3 to 7 nm. The mode fitting method (MFM) fits well onto the first
nucleating mode (GR 3.7 nm h-1), while the maximum concentration method (MCM) represents the second and more intense formation event (GR 13.2 nm h-1).
The first formation of 2 nm neutral particles occurred approximately 10 minutes after the maximum formation rate in the ion fraction (Fig. 4 d). The 3-7 nm GR for neutral
particles determined by MFM was 3.7 nm h-1, and the GR of positive ions determined by
MCM was 7.1 nm h-1. Keeping in mind that both methods principally deviate from each other, these GRs agree quite well. Therefore, the first formation of 2 nm neutral particles
may be related to ion mediated nucleation (Yu and Turco, 2008, 2011). On the other hand, the second and stronger formation of 2 nm neutral particles differs strongly from
the ion GR patterns. Its GR is elevated (13.2 nm h-1) and its occurrence is delayed by a
considerable time period. Gonser et al. (2014) proposed a conceptual explanation for this enhanced growth behavior, including the recombination and attachment of ions. Another
explanation may be a shift in concentrations and available precursor gas species during the event. When the precursor gas composition changes or shows a significant
concentration increase, a very intense neutral particle formation may result. This requires
the change in precursor gases to be of such intensity to surpass the condensational sink of the background particles, formed earlier during the event. If the change is not sufficient,
the majority of the available precursor gas molecules will inevitably condense onto the background particles, and the precursor concentration would remain too low for such
intense neutral particle formation.

86
Fig. 4: NPF event on 29 May, 2008 at Melpitz measured with the NAIS. Shown are (a)
neutral particles, (b) negative ions, (c) positive ions and (d) 2-3 nm neutral and ion
formation rates. Additionally the linear fits of the two GR methods are depicted in panels a
to c, MFM - blue lines and crosses, MCM – black lines and crosses. For negative ions (b)
the MFM did not result in clear results.
Sulfuric acid, amines, ammonia and organic molecules are potential precursor gas species possibly involved in this mechanism. Unfortunately, no data on precursor gas
concentrations was available in our study to further investigate this possible mechanism.
Thus, with the present set of data it is not possible to determine whether the mechanism triggering the second and very intense neutral NPF is ion recombination, a change in
precursor chemistry and concentration, or a combination of both mechanisms. However, the persistent formation of neutral 2 nm particles frequently observed at MLP and WST,
which is indicated by the broad base of the observed NPF banana, may be related to these
mechanisms. Whichever of the proposed mechanisms is responsible for the persistent formation of
neutral particles at MLP and WST, the phenomenon is not as clearly visible at the high
altitude sites PDD and JFJ (cf. Fig. 1 and Fig. 3). NPF events at PDD and JFJ generally show slower GRs and less intense 2-3 nm particle formation rates. Therefore, the events
shown in Fig. 1 and Fig. 3 still appear to exhibit relatively broad bases, but this is due to the slow growth rate rather than to a persistent formation of 2-3 nm particles. Less
persistent formation of 2-3 nm neutral particles at PDD and JFJ is supported by less
pronounced differences among the GRs determined from the MCM and the MFM at the individual sites (cf. Tab. 3 and Tab. A2). The lack of persistent production of 2-3 nm
neutral particles can be explained by a much cleaner atmosphere at PDD and JFJ, not exhibiting an excess of precursor gases. Both sites are influenced by free tropospheric air
during the night. Only during daytime, air from the planetary boundary layer reaches the
sites (Lugauer et al., 2000; Venzac et al., 2009). Furthermore, air masses reaching the field sites already travelled for a considerable amount of time, giving more time to
dilution, oxidation processes and aging of air masses. Therefore, less pronounced changes in precursor concentrations and their chemical composition are expected, resulting in less
intense but more ideally banana-shaped NPF events.
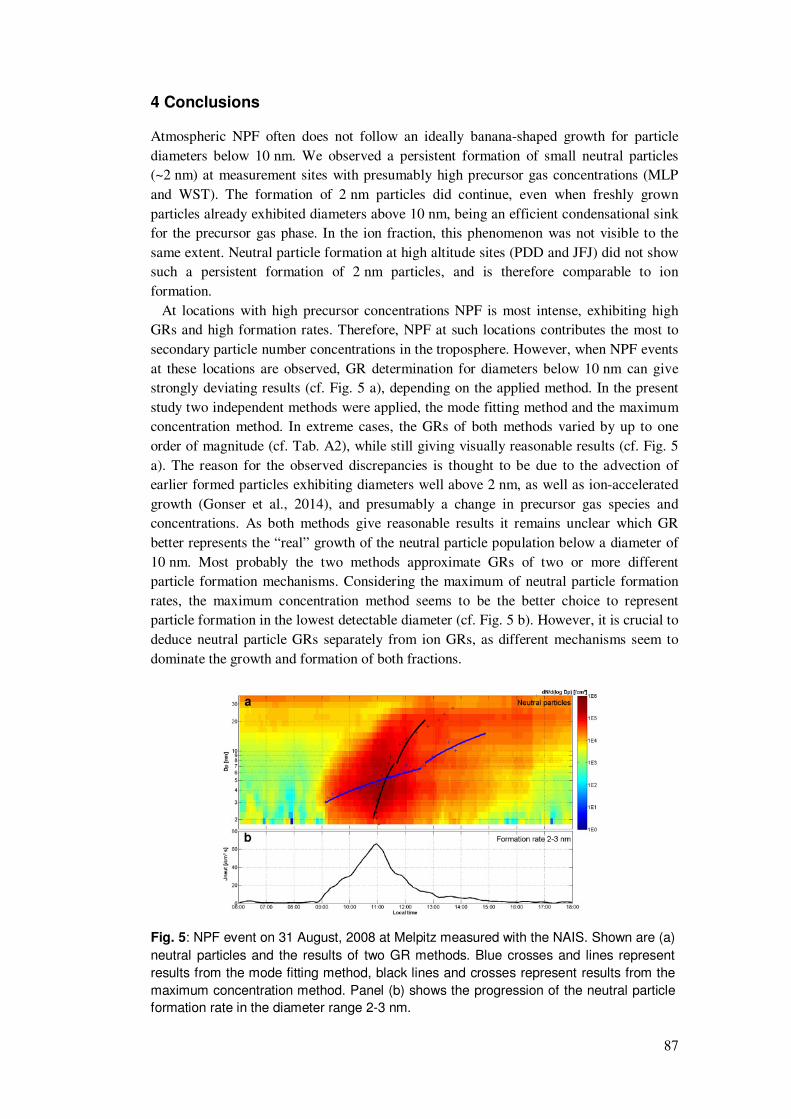
87
4 Conclusions
Atmospheric NPF often does not follow an ideally banana-shaped growth for particle
diameters below 10 nm. We observed a persistent formation of small neutral particles (~2 nm) at measurement sites with presumably high precursor gas concentrations (MLP
and WST). The formation of 2 nm particles did continue, even when freshly grown
particles already exhibited diameters above 10 nm, being an efficient condensational sink for the precursor gas phase. In the ion fraction, this phenomenon was not visible to the
same extent. Neutral particle formation at high altitude sites (PDD and JFJ) did not show such a persistent formation of 2 nm particles, and is therefore comparable to ion
formation.
At locations with high precursor concentrations NPF is most intense, exhibiting high GRs and high formation rates. Therefore, NPF at such locations contributes the most to
secondary particle number concentrations in the troposphere. However, when NPF events
at these locations are observed, GR determination for diameters below 10 nm can give strongly deviating results (cf. Fig. 5 a), depending on the applied method. In the present
study two independent methods were applied, the mode fitting method and the maximum concentration method. In extreme cases, the GRs of both methods varied by up to one
order of magnitude (cf. Tab. A2), while still giving visually reasonable results (cf. Fig. 5
a). The reason for the observed discrepancies is thought to be due to the advection of earlier formed particles exhibiting diameters well above 2 nm, as well as ion-accelerated
growth (Gonser et al., 2014), and presumably a change in precursor gas species and concentrations. As both methods give reasonable results it remains unclear which GR
better represents the “real” growth of the neutral particle population below a diameter of
10 nm. Most probably the two methods approximate GRs of two or more different particle formation mechanisms. Considering the maximum of neutral particle formation
rates, the maximum concentration method seems to be the better choice to represent particle formation in the lowest detectable diameter (cf. Fig. 5 b). However, it is crucial to
deduce neutral particle GRs separately from ion GRs, as different mechanisms seem to
dominate the growth and formation of both fractions.
Fig. 5: NPF event on 31 August, 2008 at Melpitz measured with the NAIS. Shown are (a)
neutral particles and the results of two GR methods. Blue crosses and lines represent
results from the mode fitting method, black lines and crosses represent results from the
maximum concentration method. Panel (b) shows the progression of the neutral particle
formation rate in the diameter range 2-3 nm.

88
6 Appendix
Tab. A1: Formation rates (J [cm-3
s-1
]) and growth rates (GR [nm h-1
]) for 2-3 nm neutral
particles, negative and positive ions, time difference (∆t [min.]) for 2-3 nm negative and
positive ions as well as positive and negative cluster ion concentrations (Nclus [cm-3
]) for
all observed NPF events at the different locations. For missing values the respective
method gave no result. Also shown are the median values for each site.
Date Location Jneut Jneg Jpos GRneut GRneg GRpos Δtneg Δtpos Nclus neg Nclus pos
07.05.2008 MLP 14.1 0.015 0.017 3.0 3.1 2.0 -10 30 111.7 110.3
11.05.2008 MLP 3.9 0.009 0.007 3.8 3.0 3.2 10 15 139.2 130.2
14.05.2008 MLP 10.3 0.012 0.010 8.6 6.2 4.2 5 15 102.3 122.9
19.05.2008 MLP 2.0 0.016 0.023 2.1 1.4 1.9 45 50 121.7 147.2
25.05.2008 MLP 1.8 0.006 0.007 7.1 3.1 3.4 40 70 128.8 144.0
29.05.2008 MLP 7.2 0.010 0.007 8.5 3.7 4.0 45 50 88.9 112.8
02.06.2008 MLP 1.0 0.000 0.003 5.1 2.8 2.8 25 15 125.3 145.0
06.06.2008 MLP 6.7 0.010 0.010 4.0 2.4 2.4 20 25 124.0 175.6
03.07.2008 MLP 2.2 0.003 0.012 8.4 3.3 5.0 35 15 153.1 182.4
06.08.2008 MLP 26.3 0.015 0.017 14.6 5.1 5.5 30 20 240.9 277.3
07.08.2008 MLP 3.5 0.005 0.010 2.0 1.9 2.1 45 55 255.7 276.3
31.08.2008 MLP 13.3 0.008 0.018 5.3 2.8 2.9 45 45 260.1 271.6
01.04.2009 MLP 74.1 0.016 0.020 5.1 3.6 3.6 -5 5 186.6 187.6
03.04.2009 MLP 34.9 0.007 0.017 3.9 2.6 3.1 15 20 175.5 185.4
24.04.2009 MLP 29.3 0.008 0.012 2.9 1.8 1.8 15 25 248.3 234.3
25.04.2009 MLP 95.1 0.000 0.005 5.2 2.2 2.1 45 65 251.5 247.8
26.04.2009 MLP 22.0 0.012 0.019 3.5 1.9 1.8 20 70 297.7 295.0
27.04.2009 MLP 53.7 0.026 0.028 9.8 1.4 1.4 50 55 302.0 285.6
02.05.2009 MLP 16.0 0.018 0.024 3.0 1.9 2.1 30 25 297.6 302.8
Median MLP 13.3 0.010 0.012 5.1 2.8 2.8 30 25 175.5 185.4
17.06.2012 WST 1.3 0.022 0.030 6.4 8.7 4.3 23 17 156.2 455.9
19.06.2012 WST 0.4 0.001 0.006 2.1 2.7 2.4 -127 0 142.8 382.5
04.07.2012 WST 1.2 0.007 0.005 4.6 3.4 3.3 37 37 137.3 351.7
23.07.2012 WST
0.015 0.032
1.6 2.2 100 97 132.2 306.4
24.07.2012 WST 5.2 0.004 0.011 10.3 3.0 3.7 67 50 147.4 297.4
12.08.2012 WST 9.4 0.020 0.028 10.4 4.0 4.5 53 37 158.6 340.6
13.08.2012 WST 11.8 0.023 0.048 8.4 4.9 6.2 23 10 172.6 335.9
17.08.2012 WST 3.0 0.010 0.026 2.1 1.9 2.3 17 10 123.6 207.3
Median WST 3.0 0.012 0.027 6.4 3.2 3.5 30 27 145.1 338.2
06.02.2011 PDD 0.5 0.012 0.031 1.6 1.3 1.6 8 12 131.8 419.1
24.03.2011 PDD 0.4 0.002 0.006 2.6 1.3 1.5 0 -2 80.7 97.1
25.03.2011 PDD 0.3 0.002 0.006 1.2 1.5 1.2 2 16 89.4 163.3
02.04.2011 PDD 0.4 0.003 0.010 2.1 1.4 2.0 0
95.9 157.3
05.04.2011 PDD 0.3 0.002 0.006 1.4 1.6 2.0 0 10 82.8 150.3
08.05.2011 PDD 0.4 0.006 0.019 1.4 1.7 1.5 2 60 145.1 202.0
03.07.2011 PDD 0.1 0.009 0.045 10.5 4.7 4.2 52 32 129.3 424.7
06.09.2011 PDD 1.2 0.043 0.149 3.8 2.6 4.7 22 6 156.5 493.7

89
09.11.2011 PDD 0.1 0.046 0.054 3.1 2.4 2.5 0 8 632.3 752.0
14.11.2011 PDD 0.1 0.018 0.023 1.3 1.0 1.1 6 8 317.0 486.4
18.11.2011 PDD 2.1 0.035 0.077 33.9 5.3 5.7 -26 8 366.6 646.0
Median PDD 0.4 0.009 0.023 2.1 1.6 2.0 2 9 131.8 419.1
10.07.2008 JFJ 0.3 0.036 0.048 3.1 6.3 3.1 14 -34 197.4 381.1
23.09.2008 JFJ 0.2 0.014 0.020 1.1 0.9 0.9 11 17 114.7 434.2
26.09.2008 JFJ 0.2 0.022 0.020 1.3 0.7 0.9 3 8 238.5 480.3
13.11.2008 JFJ 0.3 0.043 0.012 4.8 4.6 4.3 6 0 143.8 398.6
14.11.2008 JFJ 0.3 0.010 0.005 1.9 1.7 1.6 8 -3 311.4 503.8
26.12.2008 JFJ 2.4 0.047 0.032 2.4 2.1 2.2
251.0 382.5
20.01.2009 JFJ 0.6 0.034 0.021 6.5 3.7 3.9
125.6 237.3
21.01.2009 JFJ 0.4 0.007 0.010 3.7 2.0 2.3 37 51 57.0 322.2
03.02.2009 JFJ 2.2 0.020 0.009 25.1 4.6 6.0 74 74 166.0 450.0
19.03.2009 JFJ 8.3 0.045 0.044 18.5 5.3 5.5 23 23 173.0 267.8
03.04.2009 JFJ 0.7 0.011 0.006 9.8 4.9 5.1 31 23 93.3 248.0
Median JFJ 0.4 0.022 0.020 3.7 3.7 3.1 14 17 166.0 382.5
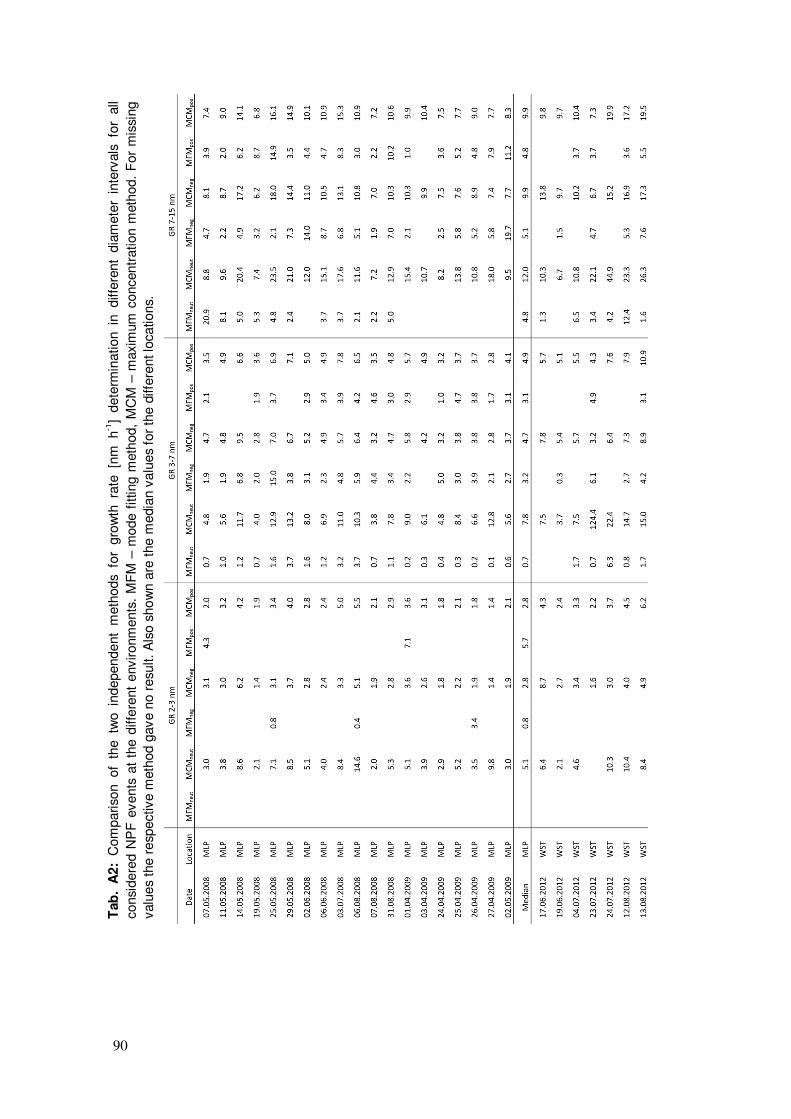
90
Tab
. A
2:
Com
pariso
n of
the tw
o in
dependent
meth
ods
for
gro
wth
ra
te [n
m h
-1]
dete
rmin
ation in
diffe
rent
dia
mete
r in
terv
als
fo
r all
consi
dere
d N
PF
events
at
the d
iffe
rent
environm
ents
. M
FM
– m
ode f
itting m
eth
od,
MC
M –
maxim
um
concentr
ation m
eth
od.
For
mis
sing
valu
es
the r
esp
ective m
eth
od g
ave n
o r
esu
lt. A
lso s
ho
wn a
re t
he m
edia
n v
alu
es
for
the d
iffe
rent lo
cations.

91

92
References
Bates, D. M. and Watts, D. G.: Nonlinear Regression: Iterative Estimation and Linear Approximations, in Nonlinear Regression Analysis and Its Applications, pp. 32–66, John Wiley & Sons, Inc., 2008.
Birmili, W., Wiedensohler, A., Heintzenberg, J. and Lehmann, K.: Atmospheric particle number size distribution in central Europe: Statistical relations to air masses and meteorology, J. Geophys. Res. Atmospheres, 106(D23), 32005–32018, doi:10.1029/2000JD000220, 2001.
Boulon, J., Sellegri, K., Venzac, H., Picard, D., Weingartner, E., Wehrle, G., Collaud Coen, M., Bütikofer, R., Flückiger, E., Baltensperger, U. and Laj, P.: New particle formation and ultrafine charged aerosol climatology at a high altitude site in the Alps (Jungfraujoch, 3580 m a.s.l., Switzerland), Atmos Chem Phys, 10(19), 9333–9349, doi:10.5194/acp-10-9333-2010, 2010.
Fuchs, N. A.: On the stationary charge distribution on aerosol particles in a bipolar ionic atmosphere, Geofis. Pura E Appl., 56(1), 185–193, doi:10.1007/BF01993343, 1963.
Gonser, S. G., Klein, F., Birmili, W., Größ, J., Kulmala, M., Manninen, H. E., Wiedensohler, A. and Held, A.: Ion -- particle interactions during particle formation and growth at a coniferous forest site in central Europe, Atmospheric Chem. Phys. Discuss., 14(1), 171–211, doi:10.5194/acpd-14-171-2014, 2014.
Held, A., Nowak, A., Birmili, W., Wiedensohler, A., Forkel, R. and Klemm, O.: Observations of particle formation and growth in a mountainous forest region in central Europe, J. Geophys. Res., 109(D23), doi:10.1029/2004JD005346, 2004.
Hess, V. F.: Über Beobachtungen der durchdringenden Strahlung bei sieben Freiballonfahrten, Phys. Zeitschr, 8, 1084–1091, 1912.
Hirsikko, A., Bergman, T., Laakso, L., Dal Maso, M., Riipinen, I., Horrak, U. and Kulmala, M.: Identification and classification of the formation of intermediate ions measured in boreal forest, Atmospheric Chem. Phys., 7, 201–210, 2007a.
Hirsikko, A., Nieminen, T., Gagné, S., Lehtipalo, K., Manninen, H. E., Ehn, M., Hõrrak, U., Kerminen, V.-M., Laakso, L., McMurry, P. H., Mirme, A., Mirme, S., Petäjä, T., Tammet, H., Vakkari, V., Vana, M. and Kulmala, M.: Atmospheric ions and nucleation: a review of observations, Atmospheric Chem. Phys., 11(2), 767–798, doi:10.5194/acp-11-767-2011, 2011.
Hirsikko, A., Paatero, J., Hatakka, J. and Kulmala, M.: The 222Rn activity concentration, external radiation dose and air ion production rates in a boreal forest in Finland between March 2000 and June 2006, Boreal Environ. Res., 12(3), 265–278, 2007b.
Hoppel, W. A., Anderson, R. V. and Willet, J. C.: Atmospheric electricity in the planetary boundary layer, in The Earth’s Electrical Environment, pp. 149–165, National Academy Press, Washington, DC, USA., 1986.
Hõrrak, U., Aalto, P. P., Salm, J., Komsaare, K., Tammet, H., Mäkelä, J. M., Laakso, L. and Kulmala, M.: Variation and balance of positive air ion concentrations in a boreal forest, Atmos Chem Phys, 8(3), 655–675, doi:10.5194/acp-8-655-2008, 2008.

93
Hussein, T., Dal Maso, M., Petäjä, T., Koponen, I. K., Paatero, P., Aalto, P. P., Hämeri, K. and Kulmala, M.: Evaluation of an automatic algorithm for fitting the particle number size distributions, Boreal Environ. Res., 10(5), 337–355, 2005.
Iida, K., Stolzenburg, M., McMurry, P., Dunn, M. J., Smith, J. N., Eisele, F. and Keady, P.: Contribution of ion-induced nucleation to new particle formation: Methodology and its application to atmospheric observations in Boulder, Colorado, J. Geophys. Res., 111(D23), doi:10.1029/2006JD007167, 2006.
Kemski, J., Siehl, A., Stegemann, R. and Valdivia-Manchego, M.: Mapping the geogenic radon potential in Germany, Sci. Total Environ., 272(1–3), 217–230, doi:10.1016/S0048-9697(01)00696-9, 2001.
Kontkanen, J., Lehtinen, K. E. J., Nieminen, T., Manninen, H. E., Lehtipalo, K., Kerminen, V.-M. and Kulmala, M.: Estimating the contribution of ion–ion recombination to sub-2 nm cluster concentrations from atmospheric measurements, Atmos Chem Phys, 13(22), 11391–11401, doi:10.5194/acp-13-11391-2013, 2013.
Kulmala, M., Kontkanen, J., Junninen, H., Lehtipalo, K., Manninen, H. E., Nieminen, T., Petaja, T., Sipila, M., Schobesberger, S., Rantala, P., Franchin, A., Jokinen, T., Jarvinen, E., Aijala, M., Kangasluoma, J., Hakala, J., Aalto, P. P., Paasonen, P., Mikkila, J., Vanhanen, J., Aalto, J., Hakola, H., Makkonen, U., Ruuskanen, T., Mauldin, R. L., Duplissy, J., Vehkamaki, H., Back, J., Kortelainen, A., Riipinen, I., Kurten, T., Johnston, M. V., Smith, J. N., Ehn, M., Mentel, T. F., Lehtinen, K. E. J., Laaksonen, A., Kerminen, V.-M. and Worsnop, D. R.: Direct Observations of Atmospheric Aerosol Nucleation, Science, 339(6122), 943–946, doi:10.1126/science.1227385, 2013.
Kulmala, M., Petäjä, T., Nieminen, T., Sipilä, M., Manninen, H. E., Lehtipalo, K., Dal Maso, M., Aalto, P. P., Junninen, H., Paasonen, P., Riipinen, I., Lehtinen, K. E. J., Laaksonen, A. and Kerminen, V.-M.: Measurement of the nucleation of atmospheric aerosol particles, Nat. Protoc., 7(9), 1651–1667, doi:10.1038/nprot.2012.091, 2012.
Kulmala, M., Vehkamäki, H., Petäjä, T., Dal Maso, M., Lauri, A., Kerminen, V.-M., Birmili, W. and McMurry, P. H.: Formation and growth rates of ultrafine atmospheric particles: a review of observations, J. Aerosol Sci., 35(2), 143–176, doi:10.1016/j.jaerosci.2003.10.003, 2004.
Laakso, L., Petäjä, T., Lehtinen, K. E. J., Kulmala, M., Paatero, J., Hõrrak, U., Tammet, H. and Joutsensaari, J.: Ion production rate in a boreal forest based on ion, particle and radiation measurements, Atmos Chem Phys, 4(7), 1933–1943, doi:10.5194/acp-4-1933-2004, 2004.
Lehtinen, K. E. J. and Kulmala, M.: A model for particle formation and growth in the atmosphere with molecular resolution in size, Atmos Chem Phys, 3(1), 251–257, doi:10.5194/acp-3-251-2003, 2003.
Leppä, J., Anttila, T., Kerminen, V.-M., Kulmala, M. and Lehtinen, K. E. J.: Atmospheric new particle formation: real and apparent growth of neutral and charged particles, Atmospheric Chem. Phys., 11(10), 4939–4955, doi:10.5194/acp-11-4939-2011, 2011.
Lüers, J., Smaczny, J., Kies, A. and Bareiss, J.: Dynamik der Austauschprozesse von CO2 und Radon zwischen Waldboden, Waldbestand und Atmosphäre, Berichte Meteorol. Inst. Uiversität Freibg., (16), 147–52, 2007.

94
Lugauer, M., Baltensperger, U., Furger, M., Gäggeler, H. W., Jost, D. T., Nyeki, S. and Schwikowski, M.: Influences of vertical transport and scavenging on aerosol particle surface area and radon decay product concentrations at the Jungfraujoch (3454 m above sea level), J. Geophys. Res. Atmospheres, 105(D15), 19869–19879, doi:10.1029/2000JD900184, 2000.
Lugauer, M., Baltensperger, U., Furger, M., Gäggeler, H. W., Jost, D. T., Schwikowski, M. and Wanner, H.: Aerosol transport to the high Alpine sites Jungfraujoch (3454 m asl) and Colle Gnifetti (4452 m asl), Tellus B, 50(1), 76–92, doi:10.1034/j.1600-0889.1998.00006.x, 1998.
Lushnikov, A. A. and Kulmala, M.: Charging of aerosol particles in the near free-molecule regime, Eur. Phys. J. - At. Mol. Opt. Plasma Phys., 29(3), 345–355, doi:10.1140/epjd/e2004-00047-9, 2004.
Manninen, H. E., Franchin, A., Schobesberger, S., Hirsikko, A., Hakala, J., Skromulis, A., Kangasluoma, J., Ehn, M., Junninen, H., Mirme, A., Mirme, S., Sipilä, M., Petäjä, T., Worsnop, D. R. and Kulmala, M.: Characterisation of corona-generated ions used in a Neutral cluster and Air Ion Spectrometer (NAIS), Atmospheric Meas. Tech., 4(12), 2767–2776, doi:10.5194/amt-4-2767-2011, 2011.
Manninen, H. E., Nieminen, T., Asmi, E., Gagné, S., Häkkinen, S., Lehtipalo, K., Aalto, P., Vana, M., Mirme, A., Mirme, S., Hõrrak, U., Plass-Dülmer, C., Stange, G., Kiss, G., Hoffer, A., Törő, N., Moerman, M., Henzing, B., de Leeuw, G., Brinkenberg, M., Kouvarakis, G. N., Bougiatioti, A., Mihalopoulos, N., O’Dowd, C., Ceburnis, D., Arneth, A., Svenningsson, B., Swietlicki, E., Tarozzi, L., Decesari, S., Facchini, M. C., Birmili, W., Sonntag, A., Wiedensohler, A., Boulon, J., Sellegri, K., Laj, P., Gysel, M., Bukowiecki, N., Weingartner, E., Wehrle, G., Laaksonen, A., Hamed, A., Joutsensaari, J., Petäjä, T., Kerminen, V.-M. and Kulmala, M.: EUCAARI ion spectrometer measurements at 12 European sites – analysis of new particle formation events, Atmospheric Chem. Phys., 10(16), 7907–7927, doi:10.5194/acp-10-7907-2010, 2010.
Manninen, H. E., Petaja, T., Asmi, E., Riipinen, I., Nieminen, T., Mikkila, J., Horrak, U., Mirme, A., Mirme, S., Laakso, L., Kerminen, V.-M. and Kulmala, M.: Long-term field measurements of charged and neutral clusters using Neutral cluster and Air Ion Spectrometer (NAIS), Boreal Environ. Res., 14(4), 591–605, 2009.
Dal Maso, M., Kulmala, M., Riipinen, I., Wagner, R., Hussein, T., Aalto, P. P. and Lehtinen, K. E. J.: Formation and growth of fresh atmospheric aerosols : eight years of aerosol size distribution data from SMEAR II, Hyytiälä, Finland, Boreal Environ. Res., 10(5), 323–336, 2005.
Mirme, A., Tamm, E., Mordas, G., Vana, M., Uin, J., Mirme, S., Bernotas, T., Laakso, L., Hirsikko, A. and Kulmala, M.: A wide-range multi-channel air ion spectrometer, Boreal Environ. Res., 12(3), 247–264, 2007.
Mirme, S. and Mirme, A.: The mathematical principles and design of the NAIS – a spectrometer for the measurement of cluster ion and nanometer aerosol size distributions, Atmospheric Meas. Tech., 6(4), 1061–1071, doi:10.5194/amt-6-1061-2013, 2013.
Nadykto, A. B. and Yu, F.: Uptake of neutral polar vapor molecules by charged clusters/particles: Enhancement due to dipole-charge interaction, J. Geophys. Res. Atmospheres, 108(D23), n/a–n/a, doi:10.1029/2003JD003664, 2003.

95
Poulain, L., Spindler, G., Birmili, W., Plass-Dülmer, C., Wiedensohler, A. and Herrmann, H.: Seasonal and diurnal variations of particulate nitrate and organic matter at the IfT research station Melpitz, Atmos Chem Phys, 11(24), 12579–12599, doi:10.5194/acp-11-12579-2011, 2011.
Rose, C., Boulon, J., Hervo, M., Holmgren, H., Asmi, E., Ramonet, M., Laj, P. and Sellegri, K.: Long-term observations of cluster ion concentration, sources and sinks in clear sky conditions at the high-altitude site of the Puy de Dôme, France, Atmos Chem Phys, 13(22), 11573–11594, doi:10.5194/acp-13-11573-2013, 2013.
Savitzky, A. and Golay, M. J.: Smoothing and Differentiation of Data by Simplified Least Squares Procedures, Anal. Chem., 36(8), 1627, 1964.
Spindler, G., Brüggemann, E., Gnauk, T., Grüner, A., Müller, K. and Herrmann, H.: A four-year size-segregated characterization study of particles PM10, PM2.5 and PM1 depending on air mass origin at Melpitz, Atmos. Environ., 44(2), 164–173, doi:10.1016/j.atmosenv.2009.10.015, 2010.
Tammet, H., Hõrrak, U. and Kulmala, M.: Negatively charged nanoparticles produced by splashing of water, Atmos Chem Phys, 9(2), 357–367, doi:10.5194/acp-9-357-2009, 2009.
Tammet, H., Hõrrak, U., Laakso, L. and Kulmala, M.: Factors of air ion balance in a coniferous forest according to measurements in Hyytiälä, Finland, Atmos Chem Phys, 6(11), 3377–3390, doi:10.5194/acp-6-3377-2006, 2006.
Venzac, H., Sellegri, K., Villani, P., Picard, D. and Laj, P.: Seasonal variation of aerosol size distributions in the free troposphere and residual layer at the puy de Dôme station, France, Atmos Chem Phys, 9(4), 1465–1478, doi:10.5194/acp-9-1465-2009, 2009.
Virkkula, A., Hirsikko, A., Vana, M., Aalto, P. P., Hillamo, R. and Kulmala, M.: Charged particle size distributions and analysis of particle formation events at the Finnish Antarctic research station Aboa, Boreal Environ. Res., 12(3), 397–408, 2007.
Wiedensohler, A.: An approximation of the bipolar charge distribution for particles in the submicron size range, J. Aerosol Sci., 19(3), 387–389, doi:10.1016/0021-8502(88)90278-9, 1988.
Wiedensohler, A., Wehner, B. and Birmili, W.: Aerosol Number Concentrations and Size Distributions at Mountain-Rural, Urban-Influenced Rural, and Urban-Background Sites in Germany, J. Aerosol Med., 15(2), 237–243, doi:10.1089/089426802320282365, 2002.
Winkler, P. M., Steiner, G., Vrtala, A., Vehkamaki, H., Noppel, M., Lehtinen, K. E. J., Reischl, G. P., Wagner, P. E. and Kulmala, M.: Heterogeneous nucleation experiments bridging the scale from molecular ion clusters to nanoparticles, Science, 319(5868), 1374–1377, doi:10.1126/science.1149034, 2008.
Yli-Juuti, T., Nieminen, T., Hirsikko, A., Aalto, P. P., Asmi, E., Hõrrak, U., Manninen, H. E., Patokoski, J., Dal Maso, M., Petäjä, T., Rinne, J., Kulmala, M. and Riipinen, I.: Growth rates of nucleation mode particles in Hyytiälä during 2003−2009: variation with particle size, season, data analysis method and ambient conditions, Atmos Chem Phys, 11(24), 12865–12886, doi:10.5194/acp-11-12865-2011, 2011.

96
Yu, F.: From molecular clusters to nanoparticles: second-generation ion-mediated nucleation model, Atmospheric Chem. Phys., 6(12), 5193–5211, doi:10.5194/acp-6-5193-2006, 2006.
Yu, F. and Turco, R.: Case studies of particle formation events observed in boreal forests: implications for nucleation mechanisms, Atmospheric Chem. Phys., 8(20), 6085–6102, doi:10.5194/acp-8-6085-2008, 2008.
Yu, F. and Turco, R. P.: Ultrafine aerosol formation via ion-mediated nucleation, Geophys. Res. Lett., 27(6), 883–886, doi:10.1029/1999GL011151, 2000.
Yu, F. and Turco, R. P.: From molecular clusters to nanoparticles: Role of ambient ionization in tropospheric aerosol formation, J. Geophys. Res., 106(D5), 4797, doi:10.1029/2000JD900539, 2001.
Yu, F. and Turco, R. P.: The size-dependent charge fraction of sub-3-nm particles as a key diagnostic of competitive nucleation mechanisms under atmospheric conditions, Atmospheric Chem. Phys., 11(18), 9451–9463, doi:10.5194/acp-11-9451-2011, 2011.
97
Appendix III: (Gonser and Held, 2013)
A chemical analyzer for charged ultrafine particles
Stefan G. Gonser and Andreas Held
Junior Professorship in Atmospheric Chemistry, University of Bayreuth, 95440 Bayreuth, Germany
Abstract
New particle formation is a frequent phenomenon in the atmosphere and of major
significance for the Earth's climate and human health. To date the mechanisms leading to the nucleation of particles as well as to aerosol growth are not completely understood. A
lack of appropriate measurement equipment for online analysis of the chemical
composition of freshly nucleated particles is one major limitation. We have developed a Chemical Analyzer for Charged Ultrafine Particles (CAChUP) capable of analyzing
particles with diameters below 30 nm. A bulk of size separated particles is collected electrostatically on a metal filament, resistively desorbed and subsequently analyzed for
its molecular composition in a time of flight mass spectrometer. We report of technical
details as well as characterization experiments performed with the CAChUP. Our instrument was tested in the laboratory for its detection performance as well as for its
collection and desorption capabilities. The manual application of defined masses of
camphene (C10H16) to the desorption filament resulted in a detection limit between 0.5 ng and 5 ng, and showed a linear response of the mass spectrometer. Flow tube experiments
of 25 nm diameter secondary organic aerosol from ozonolysis of alpha-pinene also showed a linear relation between collection time and the mass spectrometer’s signal
intensity. The resulting mass spectra from the collection experiments are in good
agreement with published work on particles generated by the ozonolysis of alpha-pinene. A sensitivity study shows that the current setup of CAChUP is ready for laboratory
measurements and for the observation of new particle formation events in the field.

98
1 Introduction
Aerosol particles are of significant relevance for the Earth's radiation balance (Forster et
al., 2007) and human health (Delfino et al., 2005; Stieb et al., 2002). It is well known that part of the aerosol forms in the atmosphere through nucleation of gas-phase precursor
molecules. The formation of these so-called secondary aerosol particles can be observed
in the planetary boundary layer at a multitude of locations around the world both in natural backgrounds as well as in polluted industrial areas (e.g. Kulmala et al., 2004).
Typically, particle nucleation events begin in the morning hours and the nucleated particles grow for several hours to a few days by coagulation and condensation, reaching
diameters in the order of 100 nm. Typical aerosol growth and nucleation rates are in the
range of 1-20 nm h-1 and 0.01–10 cm−3 s−1, respectively (Kulmala et al., 2004). Once the initial nuclei are formed the particles will grow due to condensation of certain trace gases.
The main contributors to the growth of particles are thought to be sulfuric acid, oxidation
products of volatile organic compounds (VOCs), ammonia salts such as ammonium sulfate and aminium salts, as has been shown by several studies using direct as well as
indirect methods (e.g. Barsanti et al, 2009; Held et al., 2004; Laaksonen et al., 2008; Riipinen et al., 2009; Smith et al., 2010). Even though there is a general idea about the
mechanisms governing the growth of freshly nucleated particles a lot of processes remain
unrevealed. This is due to the challenging task of performing online chemical analysis of sub-30 nm particles. The small mass of these ultrafine particles is a limiting factor. For
example, a particle of 10 nm diameter has a mass of a few attograms (10-18 g). The preferred method to perform such measurements is the mass spectrometric approach, as
the achieved detection limits are low enough to analyze chemical components of ultrafine
particles. To date there are two instruments available which are capable of performing online
measurements of the chemical composition of sub-30 nm aerosol particles in the field: (I) NAMS – the Nano Aerosol Mass Spectrometer (Wang et al., 2006) and (II) TDCIMS –
the Thermal Desorption Chemical Ionization Mass Spectrometer (Voisin et al., 2003).
NAMS is capable of measuring the quantitative atomic composition of individual particles down to diameters of 7 nm (Wang et al., 2006). Its principle of operation is the
laser induced ablation of single particles captured in an ion trap, and the subsequent
elemental analysis with a time of flight mass spectrometer (TOF-MS). Due to the high energetic laser pulse the particles break up into ionized atomic elements. Thus, molecular
information about the sampled aerosol is not available. The TDCIMS, in contrast, analyzes the molecular composition of a particle bulk of one size range, down to
diameters of 6 nm (Smith et al., 2004). The particles are charged in a unipolar charger,
size selected in a differential mobility analyzer (DMA), collected on a filament and subsequently evaporated. The resulting gas is chemically ionized and analyzed for its
molecular composition in a triple-quadrupole mass spectrometer, an ion trap mass spectrometer (Held et al., 2009), or a high resolution time of flight mass spectrometer
(Winkler et al., 2012). Both instruments are custom-built. Considering the scarcity of
available instrumentation to measure the molecular composition of sub-30 nm particles, we present the design and first measurement results of an additional aerosol mass
spectrometer for this size range. In principle, our instrument is similar to the TDCIMS, with a few major differences: Firstly, for charging the particles we optionally use a non-
radioactive source, thus facilitating the transport of the instrument to field sites in

99
consideration of the transport restrictions regarding radioactive material. Secondly, we
use a compact TOF-MS, minimizing the overall size of our instrument while accepting a
lower mass resolution. Thirdly, we use electron ionization instead of chemical ionization resulting in well-known fragmentation of many molecules.
For characterization of the instrument we analyzed particles generated in the laboratory using a 10 cm3 laminar flow tube. Secondary organic aerosol (SOA) was produced by
dark ozonolysis of alpha-pinene resulting in an aerosol size distribution with a mean
diameter of 31 nm.
2 Chemical analyzer for charged ultrafine particles
The general setup for aerosol collection and desorption of our Chemical Analyzer for
Charged Ultrafine Particles (CAChUP) is similar to the TDCIMS. A size-segregated particle sample is collected by electrostatic precipitation and subsequently desorbed for
mass spectrometric analysis. Figure 1 shows a sketch of the complete setup: In the
charger, ambient aerosol particles are charged either by corona discharge or by a radioactive neutralizer. The radial differential mobility analyzer (rDMA) selects particles
with a defined mobility diameter, which then are collected on a high voltage biased filament in the collection unit. After the collection period, the sample is evaporated by
resistive heating of the filament. The resultant gas phase is transferred via a heated fused
silica capillary to the TOF-MS and ionized by electron impact before mass spectrometric analysis. Following the collection unit, the aerosol flow is measured for its particle
concentration with a condensation particle counter (CPC), allowing to determine the collection efficiency as well as to estimate the collected particle mass. The individual
parts of the instrument are described in more detail below.
Fig. 1: Sketch of the instrument setup, with particle charging unit, radial differential
mobility analyzer (rDMA), collection and desorption unit and electron ionization time of
flight mass spectrometer (TOF-MS).
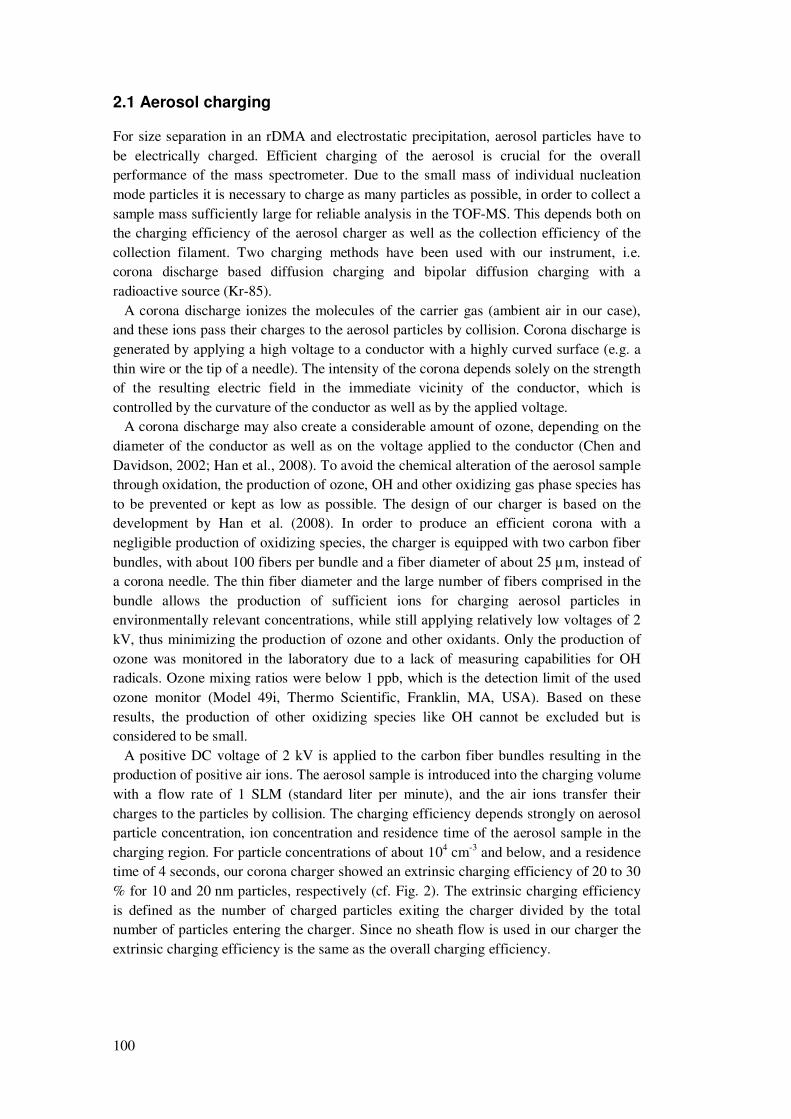
100
2.1 Aerosol charging
For size separation in an rDMA and electrostatic precipitation, aerosol particles have to
be electrically charged. Efficient charging of the aerosol is crucial for the overall performance of the mass spectrometer. Due to the small mass of individual nucleation
mode particles it is necessary to charge as many particles as possible, in order to collect a
sample mass sufficiently large for reliable analysis in the TOF-MS. This depends both on the charging efficiency of the aerosol charger as well as the collection efficiency of the
collection filament. Two charging methods have been used with our instrument, i.e. corona discharge based diffusion charging and bipolar diffusion charging with a
radioactive source (Kr-85).
A corona discharge ionizes the molecules of the carrier gas (ambient air in our case), and these ions pass their charges to the aerosol particles by collision. Corona discharge is
generated by applying a high voltage to a conductor with a highly curved surface (e.g. a
thin wire or the tip of a needle). The intensity of the corona depends solely on the strength of the resulting electric field in the immediate vicinity of the conductor, which is
controlled by the curvature of the conductor as well as by the applied voltage. A corona discharge may also create a considerable amount of ozone, depending on the
diameter of the conductor as well as on the voltage applied to the conductor (Chen and
Davidson, 2002; Han et al., 2008). To avoid the chemical alteration of the aerosol sample through oxidation, the production of ozone, OH and other oxidizing gas phase species has
to be prevented or kept as low as possible. The design of our charger is based on the development by Han et al. (2008). In order to produce an efficient corona with a
negligible production of oxidizing species, the charger is equipped with two carbon fiber
bundles, with about 100 fibers per bundle and a fiber diameter of about 25 µm, instead of a corona needle. The thin fiber diameter and the large number of fibers comprised in the
bundle allows the production of sufficient ions for charging aerosol particles in environmentally relevant concentrations, while still applying relatively low voltages of 2
kV, thus minimizing the production of ozone and other oxidants. Only the production of
ozone was monitored in the laboratory due to a lack of measuring capabilities for OH radicals. Ozone mixing ratios were below 1 ppb, which is the detection limit of the used
ozone monitor (Model 49i, Thermo Scientific, Franklin, MA, USA). Based on these
results, the production of other oxidizing species like OH cannot be excluded but is considered to be small.
A positive DC voltage of 2 kV is applied to the carbon fiber bundles resulting in the production of positive air ions. The aerosol sample is introduced into the charging volume
with a flow rate of 1 SLM (standard liter per minute), and the air ions transfer their
charges to the particles by collision. The charging efficiency depends strongly on aerosol particle concentration, ion concentration and residence time of the aerosol sample in the
charging region. For particle concentrations of about 104 cm-3 and below, and a residence time of 4 seconds, our corona charger showed an extrinsic charging efficiency of 20 to 30
% for 10 and 20 nm particles, respectively (cf. Fig. 2). The extrinsic charging efficiency
is defined as the number of charged particles exiting the charger divided by the total number of particles entering the charger. Since no sheath flow is used in our charger the
extrinsic charging efficiency is the same as the overall charging efficiency.
101
Fig. 2: Size dependent extrinsic charging efficiency of the unipolar carbon fiber corona
charger, and the theoretical charging efficiency of the bipolar charge equilibrium
(Wiedensohler, 1988) for singly positive charged particles. Additionally, the number size
distribution of the aerosol used for characterization is shown.
A known problem for unipolar charging is the occurrence of multiply charged particles. A
doubly charged particle exhibits a larger diameter than the singly charged particle of the
same electrical mobility. Hence, both sizes will be selected in the rDMA, and the collected aerosol sample will be contaminated by the larger doubly charged particles. In
fact, under certain experimental conditions we observed considerable double charging of sub-30 nm particles with the unipolar corona charger. This observation is consistent with
the size dependent charge distribution of a unipolar charger (Chen and Pui, 1999) shown
in McMurry et al. (2009) (Fig. 2). The perturbing influence of doubly charged particles could be minimized by applying a pre-separator prior to the unipolar charger, preventing
particles with diameters above 50 nm to enter the charger. Otani et al. (2007) report of a metal fiber filter having a high penetration efficiency in the size range between 5 nm and
50 nm exhibiting only a small pressure drop of 130 hPa. Alternatively, a radioactive
bipolar diffusion charger (Kr-85) can be used to minimize multiple charging of aerosol particles. According to Wiedensohler (1988), particles smaller than 30 nm in diameter
exhibit less than 0.1 % positive double charges in the bipolar charge equilibrium state. However, the radioactive charging results in much lower charging efficiencies than our
unipolar design (cf. Fig. 2). For characterization experiments in the laboratory, the
radioactive bipolar charger was used with sufficiently high particle concentrations produced in the flow tube and minimized production of doubly charged particles.
102
2.2 Aerosol size separation
Size separation of the aerosol particles was performed with a custom built radial
differential mobility analyzer (rDMA). The rDMA design is adapted from Zhang et al. (1995) and Zhang and Flagan (1996) and optimized to separate particles in the size range
1-100 nm. In principle, the layout of an rDMA is similar to a plate capacitor composed of
two separated circular electrodes with central outlets. A voltage is applied to one electrode while the other electrode is grounded, resulting in the formation of a uniform
electric field. The charged aerosol particles enter the space between the electrodes from an annular gap at the outer edges with the flow directed radially towards the center, where
the sample is extracted at the outlet of the grounded electrode. When an electric field is
applied between the electrodes, the charged particles follow distinct trajectories depending on their electrical mobility and the field strength. Thus, the application of a
specific electric field strength will result in the selection of particles with a distinct
mobility diameter. In contrast to the original design by Zhang et al. (1995) the spacing of the two
electrodes is 9 mm while the radius between the annular aerosol inlet and the central outlet is 30 mm, shifting the design's operation range towards smaller particles. Flows in
the rDMA were set to a sheath flow of 4 SLM and an aerosol flow of 1 SLM. Figure 3
shows the performance of the rDMA in laboratory experiments, by coupling the rDMA to a reference scanning mobility particle sizer (SMPS, TROPOS Leipzig). Charged ambient
aerosol was introduced into the rDMA while applying a constant electric field. The size segregated aerosol was then introduced into the SMPS, recharged and scanned in a size
range from 10 to 800 nm. Additionally, the theoretical transfer functions including
particle diffusion (Stolzenburg and McMurry (2008), Zhang and Flagan (1996)) for the sequential setup of the rDMA and the cylindrical DMA as described above are shown.
The maxima of the calculated transfer functions lie within a maximum deviation of 0.7 nm of the geometric mean diameter calculated from the size distributions of the tandem
DMA measurements. Differences between the measured distributions (Fig. 3 a) and the
theoretical transfer functions (Fig. 3 b) are thought to be due to additional broadening in the real flow path through the rDMA and the SMPS’s cylindrical DMA. As a result, the
custom-built rDMA is capable of separating quasi monodisperse aerosol samples with a
geometric standard deviation of about 1.09 in the relevant diameter range from 10 nm to 50 nm from ambient aerosol samples.

103
Fig. 3: Comparison of the performance of the rDMA coupled to an SMPS system (a) with
theoretical transfer functions (b). A sheath flow of 4 SLM and voltages of 116 V, 504 V,
1003 V and 2000 V resulted in geometric mean diameters measured by an SMPS system
of 11.3 nm, 22.0 nm, 31.7 nm and 46.4 nm, respectively. The theoretical transfer
functions peak at 10.7 nm, 22.7 nm, 32.4 nm and 46.7 nm, respectively.
2.3 Aerosol collection and desorption
Exiting the rDMA, the size-segregated charged particles are introduced into the collection and desorption unit. Particles are collected on a high voltage (3 - 5 kV) biased NiCr
filament. The circular design (see Fig. 4 for details) can be divided into two distinct
regions, i.e. (1) the collection region and (2) the desorption region. The collection region is composed of a collection tube (3) containing a movable PEEK (polyetheretherketone)
piston (4) with the collection filament attached to its top (5). The collection tube is enclosed in a cylindrical housing. The sample flow with the charged particles is
introduced between the collection tube and the housing via an annular gap (6) and
extracted above (9). Due to the electric field originating from the collection filament, charged particles are directed towards the filament. For protection of the collected sample
from contamination with gaseous constituents of the sample flow, the collection tube is permanently flushed with molecular nitrogen (7). A second nitrogen flow is introduced
through an annular gap above (8), protecting the desorption region from contamination.
The sample flow rate is set to 1 SLM while the collection region flushing flow rate (7) is set to 1.3 SLM, assuring that both flows have the same velocity at the upper edge of the
collection tube. Both nitrogen flows and the sample flow are extracted through another annular gap (9) located above the collection tube.

104
Fig. 4: Schematic of the radial collection and desorption unit with NiCr filament in
collection position: (1) collection region, (2) desorption region, (3) collection tube, (4)
PEEK piston, (5) collection filament, (6) aerosol inlet, (7) collection flushing inlet, (8)
desorption flushing inlet (9), exhaust and (10) screw connection for transfer capillary.
Positions of O-rings are shown in black.
During collection the filament is positioned below the upper edge of the collection tube. The collection efficiency for 25 nm particles is greater than 95% for 5 kV applied to the
filament and the mentioned flow rates. After collection, the PEEK piston is moved by
means of a linear actuator towards the desorption region (2). The desorption chamber is a conical cavity made of aluminum with a volume of 0.4 cm3. The angles of the desorption
chamber walls are chosen to fit the angles of the PEEK piston, providing that the chamber is sealed once the PEEK piston is pushed into the desorption position. Resistive heating
of the collection filament allows temperature controlled evaporation of the sample. The
wire temperature is estimated based on the Stefan-Boltzmann law corrected with an optical temperature estimation through the wire's annealing color. The correction is
necessary since the Stefan-Boltzmann law overestimates the temperature, only accounting
for radiative heat transport. However, a considerable part of the heat is transported from the wire towards the connecting sockets as well as by convection to the surrounding gas
phase. In order to avoid condensational losses of the evaporated particles to the desorption
chamber the walls can be heated up to 200° C. Finally, a heated deactivated fused silica
capillary is connected to the upper part of the desorption region (10).

105
2.4 Time-of-flight mass spectrometer
The fused silica capillary with an inner diameter of 25 µm transfers the desorbed gas
sample to the TOF-MS. The capillary fulfills the tasks of transferring the sample directly to the ionization region in the TOF-MS as well as ensuring the necessary pressure drop
from the desorption region to the MS operating at a pressure of less than 1x10⁻⁶ mbar.
The mass spectrometer is a compact time-of-flight mass spectrometer (CTOF, Tofwerk AG, Thun, Switzerland). The compact, field portable design yields a nominal mass
resolving power of 800 Th and a mass accuracy of better than 100 ppm. Standard 70 eV electron ionization is applied resulting in fragmentation of the analytes. The
fragmentation patterns are well known for many molecules, hence allowing a chemical
interpretation of the mass spectra to a certain degree (Allan et al., 2004). Thus, the ionization method is a trade-off between high ionization efficiency and accurate
compound identification. To enhance the potential for molecular identification, this
CTOF is ready to be equipped with a soft photo ionization method in future studies. The mass spectrometer has a time resolution of 20 kHz, and typically one second averages are
written to hierarchical data format files (HDF5). Data analysis is performed with the Matlab based toolbox tofTools, developed by H. Junninen (University of Helsinki).
2.5 Experimental characterization
To infer the detection performance of the mass spectrometer, a dilution series of an
individual organic compound was measured. For this purpose, 1 µl of camphene-ethanol dilutions of different concentrations were applied manually to the desorption filament by
means of a 5 µl syringe. After application, the filament was moved to the heated desorption region (80° C) to desorb the sample for analysis in the TOF-MS. Being a
monoterpene, camphene (C10H16) represents one of the major compound groups with
oxidation products contributing to the growth of secondary particles. Its suitability for the dilution series is given by its solubility in ethanol and its solid state up to temperatures
of about 51°C, hence allowing its application to the filament without a significant loss of material prior to the desorption. The sum of the integrated peak areas of the major
electron ionization fragments (m/z 93, 121 and 136) of camphene were used to obtain a
robust signal from the mass spectrometer. For further test and characterization purposes, laboratory generated secondary organic
aerosol (SOA) was collected, desorbed and analyzed with CAChUP. SOA was produced
with a laminar flow reactor (Reynolds number Re = 125) for dark ozonolysis of alpha-pinene similar to Tolocka et al. (2006). The flow reactor consists of a glass tube with a
length of 9 cm and a diameter of 1.2 cm. The total volume of the reactor is 10 cm³. The volume flow rate through the flow reactor was set to 1.1 SLM resulting in a residence
time of about 0.5 seconds. Alpha-pinene was introduced into the tube by passing a
filtered zero air flow of 0.045 SLM over liquid alpha-pinene in a 100 ml flask. Ozone was generated by exposing a particle free airflow of 0.85 SLM to UV radiation produced by a
Pen-Ray lamp. The ozone was introduced together with filtered air at a flow rate of 0.2 SLM. The alpha-pinene flow was introduced separately via a glass tubing in the center
axis of the flow tube. The concentration of alpha-pinene in the tube was about 250 ppm,
assuming saturation in the alpha-pinene flow at room temperature (25° C) and accounting
106
for the dilution with the other two flows. This value can be seen as an upper concentration
limit since saturation was most likely not achieved. The ozone mixing ratio was 13 ppm
in the absence of alpha-pinene in the reactor measured using an ozone monitor (Model 49i, Thermo Scientific, Franklin, MA, USA). Despite the high concentration of ozone in
the flow tube only a fraction of the gas-phase alpha-pinene was transformed to the particle phase. The aerosol flow still contained a considerable amount of gas-phase
organics, as could be seen by turning off the two nitrogen purge flows, hence sampling
with the mass spectrometer directly from the gas phase in the sample flow. About 90 % of these gas-phase organics were removed by an activated charcoal denuder, installed
between the flow tube and our instrument. The flow reactor setup resulted in a narrow
particle size distribution with a mean diameter of 31 nm and a geometric standard deviation of 1.33.
3 Results and discussion
The instrument's detection performance for monoterpenes was deduced from a series of camphene–ethanol solutions of different concentrations, as described above. From Fig. 5,
a linear relation between the applied mass and the mass spectrometers signal intensity is evident. Shown is the normalized signal intensity of the sum of three electron ionization
fragments of camphene (m/z 93, 121 and 136). Evaporation of a 1 µl droplet in the
desorption chamber resulted in a considerable pressure increase in the mass spectrometer. This effect resulted in a sudden increase of the overall mass spectrometer's signal
intensity. Therefore, a normalization of the data was performed by dividing the unit mass resolution sticks by the peak area of m/z 207. Mass 207, being a typical contamination
signal from silicone, was always visible in the measured mass spectra, showing variations
only due to the mass spectrometer's operating conditions, like ionization efficiency and pressure changes. This mass is suitable for normalization because its signal strength is
independent of the evaporation of the collected sample. Also shown in Fig. 5 are the standard deviations of the MS signal intensities. During the experiment pure ethanol as
well as camphene masses of 0.5, 5, 50, 500 and 5000 ng were applied to the filament.
Both pure ethanol and the solution with 0.5 ng camphene resulted in no clear signal from the TOF-MS. Figure 5 shows that a sample of 5 ng of camphene yields a clear and
quantitative signal. Thus, the detection limit for camphene is taken to be between 0.5 ng
and 5 ng with the present setup.

107
Fig. 5: Detection performance of the aerosol mass spectrometer for different camphene
masses applied to the desorption filament. Normalized signal intensity equals the sum of
the integrated peak areas of m/z 93, 121 and 136 normalized with m/z 207. Open cycles
denote the mean signal intensity and the error bars show the standard deviation. A linear
fit curve is shown to indicate the linearity of the signal.
Figure 6 (a) shows the procedure of the particle collection and blank experiments. Aerosol particles with a diameter of 25 nm were collected for time periods of 30 min, 1
hour and 2 hours, and desorbed from the NiCr filament. During collection, the desorption chamber was continuously kept at 100 °C and flushed with nitrogen. Also the filament
was flushed with nitrogen, minimizing the collection of gas phase compounds and
interactions of the collected sample with oxidants like ozone. Following the collection, the nitrogen flow is increased in order to flush the entire collection unit, preventing
contamination during the travel period of the piston towards the desorption chamber. Once the piston reached its final position, the desorption chamber was heated from 100°
C to 160° C. Only then the NiCr filament was heated gradually to its final temperature of
about 800 °C (see Fig. 6 (b) for details). The wire temperature was not directly measured, but estimated from the Stefan-Boltzmann law and by visual inspection of its annealing
color. In Figure 6 (b) the desorption process for the one hour collection experiment is
shown. Heating of the desorption chamber was initialized 60 seconds after the PEEK piston was moved to the desorption position. After 300 seconds the final desorption
chamber temperature of 160° was reached and the filament was heated from ~300 °C to 800 °C during the next two minutes. Also shown in Fig. 6 (b) is the time evolution of the
signal from averaged major peaks from the evaporated particles. The signal from the
TOF-MS is clearly increasing due to the heating of the desorption chamber and reaching its maximum well before the filament reached its final temperature. Once the maximum
was reached a steep decrease in the signal was observed, despite the persistent heating of the filament. Remarkable is that the signal seems less dependent from filament heating
than from the desorption chamber’s temperature.

108
Fig. 6: (a) Sketch of the procedure for the background and collection experiments, with
temperature courses of the desorption chamber (white circels) and the NiCr filament
(black triangles). (b) Time evolution of the averaged signal from major organic peaks (m/z
43, 53, 65, 67, 77 and 91) during the desorption of oxidized alpha-pinene particles. The
PEEK piston was in desorption position at second 60. Temperatures of the desorption
chamber and the filament are also shown. The hatched area denotes the one minute
averaging periode used for the mass spectrum shown in Figure 7 b.
The grey hatched area in Fig. 6 (b) indicates the averaging period from which the mass spectrum in Fig. 7 (b) was obtained. The one minute averaging period was chosen for all
experiments, always starting when the desorption current was applied to the NiCr
filament. Despite the activated charcoal denuder and the nitrogen purge flows, peaks of gas-phase
organics were observed in the mass spectra. To prevent misinterpretation of the signal, a correction for potential gas-phase contamination is necessary. For this purpose, a blank
measurement was performed, sampling the air without a high voltage applied to the
collection filament, hence not collecting any particles. This correction is only possible if the adsorption of the gas-phase is similar during collection and blank measurement. This
assumption is considered valid if the flow rates, temperatures and the duration of collection and desorption are kept constant for the regular and the blank measurement. A
second reason for performing blank measurements is the condensation of evaporated
particle compounds from the filament onto the desorption chamber walls. Even when the desorption region is heated to 200 °C, condensation of low volatile species cannot be

109
ruled out when the filament is heated up to 800 °C. To account for temporal variations of
the pressure in the mass spectrometer, the mass spectra were normalized. For
normalization, the peak at m/z 207 was used, showing variations only due to the mass spectrometer's operating conditions, thus being independent of the desorbed sample.
Figure 7 shows mass spectra of three collection cycles with flow tube generated particles with a diameter of 25 nm. During all three experiments, the basic conditions in
the flow tube, the rDMA and the collection unit were kept constant. Only the collection
time was varied between 0.5, 1 and 2 hours. For all three measurements, corresponding blank measurements were carried out. The presented mass spectra are consistent with
published studies on laboratory generated particles from ozonolysis of alpha-pinene (e.g.
Chhabra et al., 2010; Shilling et al., 2009). In both studies high resolution time of flight aerosol mass spectrometers (HR-TOF-AMS) with electron ionization were used. As
CHAChUP is also equipped with electron ionization the general fragmentation patterns are expected to be comparable.
Fig. 7: Mass spectra of organic particles with a diameter of 25 nm from dark ozonolysis of
alpha-pinene; a, b and c are spectra after collection times of 0.5 h, 1 h and 2 h,
respectively. The lower panel (d) shows the sum of the signal intensities of four major
peaks (m/z 55, 65, 77 and 91) in relation to the collection time.
110
For the three different collection periods, the signal intensities increase with longer
collection times while the ratios of the relative peak areas of the major peaks remain
constant over the experiments. The major peaks in Fig. 7 are thought to be fragments of oxidized organics like C2H3O
+ for m/z 43, CO2+ for m/z 44 and C3H3O
+ / C4H7+ for
m/z 55 (Chhabra et al., 2010; Shilling et al., 2009). Further prominent peaks are thought to be the non-oxidized ionization fragments C5H5
+, C6H5+, C6H7
+ and C7H7+ for m/z 65,
77, 79, and 91, respectively (based on Fig. 2 of Chhabra et al., 2010). The relation
between the signal intensity and the collection time shown in Fig. 7d indicates higher signal intensities with longer collection times, and thus, more collected aerosol mass. The
increase in signal with collection time is near to linearity, deviations could arise from
slight variations in collection efficiency and particle numbers produced in the flow tube. Overall, the collection experiments show good performance of our instrument in flow
tube experiments. The collection times can be extended to multi-hour periods and the use of a radioactive neutralizer is reasonable despite its poor charging efficiency, minimizing
the contribution of multiply charged particles in the sample. In principle, CAChUP is
ready for use in smog chamber experiments on the formation of SOA, either triggered by dark ozonolysis or photochemical reactions. Crucial for such experiments is the ability to
produce particle formation events with similar growth rates that can be observed in the atmosphere. If the growth rates are too high particles of a distinct diameter will not be
present for a time period sufficient for collecting the necessary aerosol mass. Therefore,
the concentration of gas phase precursors has to be chosen close to ambient concentrations yielding particles with a chemical composition comparable to atmospheric
particles. As described above the detection limit of CAChUP for the dilution series of camphene
is between 0.5 ng and 5 ng. The detection performance of CAChUP during the flow tube
experiments can only be determined roughly because the collected particle mass has to be estimated from particle concentration measurements with a CPC, attached downstream of
the exhaust of the collection unit. Concentrations measured are to be regarded with care due to particle losses at the collection unit’s exhaust and dilution with the nitrogen flows.
The collection efficiency was estimated by calculating the concentration ratio between
periods with a voltage applied to the collection filament and periods with no voltage applied. For particles with a diameter of 25 nm and 5 kV applied to the filament, the
collection efficiency was better than 95 %. The particle transmission through the
collection unit was estimated by measuring the particle concentration upstream and downstream of the unit's sample inlet and outlet, respectively. Accounting for the dilution
with the nitrogen purge flows the transmission was estimated to be between 81 % and 100 %. Applying the corresponding collection and transmission efficiencies together with an
assumed particle density of 1.25 g/cm3 (average estimate of the density values by
Bahreini et al. (2005) and Kostenidou et al. (2007)) and knowing the particle size and concentration as well as the aerosol volume flow through the collection unit, an estimate
of the collected mass was obtained. For the three performed experiments, rough estimates of the collected masses were in the range of 2.1-2.6 ng, 4.0-5.0 ng and 5.3-6.5 ng for the
0.5 h, 1 h and 2 h experiments, respectively. Since collection times below 0.5 h did not
result in quantitative signals from the mass spectrometer the lower detection limit for the performed experiments is estimated to be below 2.1-2.6 ng, being in the same range as
determined by the dilution series experiments. However, the detection limit will depend also on the composition of the collected particles. For example, for compounds

111
experiencing less fragmentation by the mass spectrometer's electron ionization the
detection could be substantially better.
The necessity of a sample of a few nanograms limits our present setup either to measurements of particles with diameters > 20 nm but relatively short collection periods,
or particles < 20 nm with collection periods of several hours.
4 Conclusions and outlook
We have developed an aerosol mass spectrometer for the chemical analysis of particles
with diameters below 30 nm. The instrument collects a charged and sized particle sample on a metal filament. After collection the filament is resistively heated and the resulting
gas phase is analyzed for its molecular composition in an electron ionization time of flight mass spectrometer. The functionality of the instrument has been validated in
laboratory measurements by means of secondary organic particles produced from dark
ozonolysis of alpha-pinene in a laminar flow tube, and by the direct application of known masses of camphene to the NiCr filament. Considering the results of these experiments,
an application of CAChUP in the field seems to be feasible. For example, during
nucleation events at the “Waldstein” ecosystem research site in the Fichtelgebirge mountain range, NE Bavaria, Germany, particle concentrations with up to 90,000 cm-3
were detected. During such events the concentration of particles with a diameter between 20 nm and 24 nm was found to be up to 4000 cm-3. Periods with elevated 20 nm particle
concentrations (> 1000 cm-3) prevailed for about 3 hours. Considering the charging
efficiency of our unipolar charger, particle losses in the rDMA and the collection unit as well as the collection efficiency onto the NiCr filament during nucleation events,
collected masses for 20 nm particles are expected to be in the order of 1 ng to 7 ng, thus being within the estimated detection limit.
The performance of CAChUP is promising both for laboratory experiments and also for
field measurements. Nevertheless, several improvements will further enhance the performance of the instrument. The unipolar charger is working, yet multiply charged
particles have still to be avoided. With the present setup, this requires the use of a pre-impactor with a cut-off diameter at 50 nm or below. Multiple charges can also be avoided
by charging the particles in a bipolar environment, although the charging efficiency will
be small. In the past few years major advances towards bipolar corona discharge chargers have been accomplished (e.g. Stommel and Riebel, 2004). Further enhancement of the
charged particle fraction could be accomplished by parallel use of multiple bipolar
chargers coupled to an electrostatic focusing device, focusing one polarity of charged particles to its centre while extracting the excess air at its periphery. This way the
concentration of charged particles could be enhanced significantly while keeping the same flow rate and collection efficiency in the collection unit. Finally, the flow regime
inside the collection and desorption unit should be improved. Despite the permanent
flushing of the NiCr filament and the desorption region, contaminations during the flow tube experiments could not be avoided completely, making it necessary to perform a
blank measurement for every measurement conducted. As laboratory generated secondary organic particles will always be associated with a huge fraction of precursor molecules in
the gas phase, the necessity of protecting the device from contaminations is crucial. To
tackle this issue the collection unit must be optimized towards a flow regime with

112
minimal turbulence, hence less penetration of the gas phase onto the NiCr filament and
into the desorption region. Turbulence in the desorption region is assumed to be of greater
importance due to the opposing direction of the N2 purge flow and the sample flow, as well as due to its enhanced surface compared to the filament. However, precursor gas
phase contaminations are expected to be significantly smaller in the field than in our flow tube experiments.
CAChUP is now ready to be used both in laboratory and field experiments, and the
described improvements will be implemented step by step for enhanced performance in future measurement campaigns.
Acknowledgements
This work was supported by the German Research Foundation (DFG grant HE5214/3-1). We acknowledge for construction and technical support Thomas Braun, Klaus Burger,
Andrej Einhorn, Stefan Feulner, Michael Groll and Heinz Krejtschi. For help and fruitful
discussions we thank Sergej Bleicher, Otto Klemm, Britta Planer-Friedrich, Matthias Sörgel and Julian Wittmer, as well as Heikki Junninen for providing the evaluation
software tofTools.

113
References
Allan, J. D., Delia, A. E., Coe, H., Bower, K. N., Alfarra, M. R., Jimenez, J. L.,
Middlebrook, A. M., Drewnick, F., Onasch, T. B., Canagaratna, M. R. and others: A generalised method for the extraction of chemically resolved mass spectra from Aerodyne
aerosol mass spectrometer data, J. Aerosol Sci., 35, 909–922, 2004.
Bahreini, R., Keywood, M. D., Ng, N. L., Varutbangkul, V., Gao, S., Flagan, R. C.,
Seinfeld, J. H., Worsnop, D. R., and Jimenez, J. L.: Measurement of secondary organic
aerosol from oxidation of cycloalkenes, terpenes, and m-xylene using an Aerodyne aerosol mass spectrometer, Environ. Sci. Technol., 39, 5674–5688, 2005.
Barsanti, K. C., McMurry, P. H., Smith, J. N.: The potential contribution of organic salts
to new particle growth, Atmos. Chem. Phys., 9, 2949–2957, 2009.
Chen, J. and Davidson, J. H.: Ozone production in the positive DC corona discharge:
Model and comparison to experiments, Plasma Chem. Plasma P., 22, 495–522, 2002.
Chen, D. R. and Pui, D. Y. H.: A high efficiency, high throughput unipolar aerosol
charger for nanoparticles, J. Nanopart. Res., 1, 115–126, 1999.
Chhabra, P., Flagan, R. and Seinfeld, J.: Elemental analysis of chamber organic aerosol
using an aerodyne high-resolution aerosol mass spectrometer, Atmos. Chem. Phys., 10, 4111–4131, 2010.
Delfino, R. J., Sioutas, C. and Malik, S.: Potential role of ultrafine particles in associations between airborne particle mass and cardiovascular health, Environ. Health
Persp., 113, 934–946, 2005.
Forster, P., Ramaswamy, V., Artaxo, P., Berntsen, T., Betts, R., Fahey, D. W., Haywood,
J., Lean, J., Lowe, D. C., Myhre, G., Nganga, J., Prinn, R., Raga, G., Schulz, M., and Dorland, R. V.: Changes in Atmospheric Constituents and in Radiative Forcing, in:
Climate Change 2007: The Physical Science Basis, Contribution of Working Group I to
the Fourth Assessment Report of the Intergovernmental Panel on Climate Change, edited by: Miller, H. L., Cambridge University Press, Cambridge, UK and New York, NY,
USA, 129–234, 2007.
Han, B., Kim, H.-J., Kim, Y.-J. and Sioutas, C.: Unipolar charging of fine and ultra-fine
particles using carbon fiber ionizers, Aerosol Sci. Tech., 42, 793–800, 2008.
Held, A., Nowak, A., Birmili, W., Wiedensohler, A., Forkel, R. and Klemm, O.:
Observations of particle formation and growth in a mountainous forest region in central Europe, J. Geophys. Res., 109, D23204, 2004.
Held, A., Rathbone, G. J. and Smith, J. N.: A thermal desorption chemical ionization ion
trap mass spectrometer for the chemical characterization of ultrafine aerosol particles,
Aerosol Sci. Tech., 43, 264–272, 2009.

114
Kostenidou, E., Pathak, R. K., and Pandis, S. N.: An algorithm for the calculation of
secondary organic aerosol density combining AMS and SMPS data, Aerosol Sci. Tech.,
41, 1002–1010, 2007.
Kulmala, M., Vehkamäki, H., Petäjä, T., Dal Maso, M., Lauri, A., Kerminen, V.-M.,
Birmili, W. and McMurry, P. H.: Formation and growth rates of ultrafine atmospheric particles: a review of observations, J. Aerosol Sci., 35, 143–176, 2004.
Laaksonen, A., Kulmala, M., O’Dowd, C. D., Joutsensaari, J., Vaattovaara, P., Mikkonen,
S., Lehtinen, K. E. J., Sogacheva, L., Dal Maso, M., Aalto, P., Petäjä, T., Sogachev, A.,
Yoon, Y. J., Lihavainen, H., Nilsson, D., Facchini, M. C., Cavalli, F., Fuzzi, S., Hoffmann, T., Arnold, F., Hanke, M., Sellegri, K., Umann, B., Junkermann, W., Coe, H.,
Allan, J. D., Alfarra, M. R., Worsnop, D. R., Riekkola, M.-L., Hyötyläinen, T., and Viisanen, Y.: The role of VOC oxidation products in continental new particle formation,
Atmos. Chem. Phys., 8, 2657–2665, 2008.
McMurry, P. H., Ghimire, A., Ahn, H. K., Sakurai, H., Moore, K., Stolzenburg, M and
Smith, J. N.: Sampling nanoparticles for chemical analysis by low resolution electrical
mobility classification, Environ. Sci. Technol. 43, 4653-4658, 2009.
Otani, Y., Eryu, K., Furuuchi, M., Tajima, N., and Tekasakul, P.: Inertial classification of nanoparticles with fibrous filters. Aerosol Air Qual. Res. 7, 343-352, 2007.
Riipinen, I., Manninen, H., Yli-Juuti, T., Boy, M., Sipilä, M., Ehn, M., Junninen, H., Petäjä, T. and Kulmala, M.: Applying the Condensation Particle Counter Battery (CPCB)
to study the water-affinity of freshly-formed 2-9 nm particles in boreal forest, Atmos.
Chem. Phys., 9, 3317–3330, 2009.
Shilling, J. E., Chen, Q., King, S. M., Rosenoern, T., Kroll, J. H., Worsnop, D. R., DeCarlo, P. F., Aiken, A. C., Sueper, D., Jimenez, J. L. and Martin, S. T.: Loading-
dependent elemental composition of alpha-pinene SOA particles, Atmos. Chem. Phys., 9,
771–782, 2009.
Smith, J. N., Moore, K. F., McMurry, P. H. and Eisele, F. L.: Atmospheric measurements
of sub-20 nm diameter particle chemical composition by thermal desorption chemical ionization mass spectrometry, Aerosol Sci. Tech., 38, 100–110, 2004.
Smith, J. N., Barsanti, K. C., Friedli, H. R., Ehn, M., Kulmala, M., Collins, D. R.,
Scheckman, J. H., Williams, B. J. and McMurry, P. H.: Observations of aminium salts in
atmospheric nanoparticles and possible climatic implications, P. Natl. Acad. Sci. USA, 107, 6634–6639, 2010.
Stieb, D. M., Judek, S. and Burnett, R. T.: Meta-analysis of time-series studies of air pollution and mortality: effects of gases and particles and the influence of cause of death,
age, and season, JAPCA J. Air Waste Ma., 52, 470–484, 2002.
Stolzenburg, M. R. and McMurry, P. H.: Equations governing single and tandem DMA
configurations and a new lognormal approximation to the transfer function, Aerosol Sci. Tech., 42, 421-432, 2008.

115
Stommel, Y. and Riebel, U.: A new corona discharge-based aerosol charger for
submicron particles with low initial charge, J. Aerosol Sci., 35, 1051–1069, 2004.
Tolocka, M. P., Heaton, K. J., Dreyfus, M. A., Wang, S., Zordan, C. A., Saul, T. D. and
Johnston, M. V.: Chemistry of particle inception and growth during α-pinene ozonolysis,
Environ. Sci. Technol., 40, 1843–1848, 2006.
Voisin, D., Smith, J. N., Sakurai, H., McMurry, P. H. and Eisele, F. L.: Thermal desorption chemical ionization mass spectrometer for ultrafine particle chemical
composition, Aerosol Sci. Tech., 37, 471–475, 2003.
Wang, S., Zordan, C. A. and Johnston, M. V.: Chemical characterization of individual,
airborne sub-10-nm particles and molecules, Anal. Chem., 78, 1750–1754, 2006.
Wiedensohler, A.: Technical note: an approximation of the bipolar charge distribution for
particles in the submicron size range, J. Aerosol Sci., 19, 387–389, 1988.
Winkler, P. M., Ortega, J., Karl, T., Cappellin, L., Friedli, H. R., Barsanti, K., McMurry,
P. H. and Smith, J. N.: Identification of biogenic compounds responsible for size-dependent nanoparticle growth, Geophys. Res. Lett., 39, L20815, 2012.
Zhang, S.-H., Akutsu, Y., Russell, L. M., Flagan, R. C. and Seinfeld, J. H.: Radial differential mobility analyzer, Aerosol Sci. Tech., 23, 357–372, 1995.
Zhang, S.-H. and Flagan, R. C.: Resolution of the radial differential mobility analyzer for
ultrafine particles, J. Aerosol Sci., 27, 1179–1200, 1996.

116
Acknowledgements
This work was conducted from June 2010 to March 2014 at the Professorship in Atmospheric Chemistry of the University of Bayreuth, under the guidance of Prof. Dr.
Andreas Held.
I gratefully thank Prof. Dr. Andreas Held for making this research possible, for his active
participation in the research by several discussions and his always optimistic and skilled support.
Further I would like to thank my mentors Prof. Dr. Britta Planer-Friedrich and Prof. Dr. Otto Klemm for their subject-specific support and their contribution to my compliance
with the time schedule.
For scientific discussions, technical- and scientific support I would like to thank, Paulo
Alarcón, Agnes Bednorz, Christopher Berberich, Dr. Wolfram Birmili, Dr. Sergej Bleicher, Thomas Braun, Klaus Burger, Dr. Joelle Buxmann, Xuemeng Chen, Andrej
Einhorn, Stefan Feulner, Milan Flach, Michael Groll, Johannes Größ, Lei Han, Maria
Hänsel, Heikki Junninen, Katharina Kamilli, Felix Klein, Heinz Krejtschi, Heinz-Ullrich Krüger†, Gerhard Küfner, Prof. Dr. Markku Kulmala, Dr. Hanna Manninen, Dr. Johannes
Ofner, Lena Pfister, Valeska Scharsich, Clemence Rose, Dr. Karine Sellegri, Dr. Matthias Sörgel, Prof. Dr. Alfred Wiedensohler, Julian Wittmer and Prof. Dr. Cornelius Zetzsch.
This work was funded by the German Research Foundation (DFG grant HE5214/3-1).
At last I would like to thank my friends and my family for always supporting me, also in
the most desperate times – thank you!

117
Declaration
I hereby declare that this thesis is my own original research work. Wherever contributions of others are involved, every effort is made to indicate this clearly, with due reference to
the literature, and acknowledgement of collaborative research and discussions.
I further declare that I have not previously attempted to or succeeded in acquiring any
academic degree except those presented with the submission of this thesis.
Erklärung
Hiermit erkläre ich, dass ich die vorliegende Promotionsarbeit selbstständig verfasst und keine anderen als die angegebenen Quellen und Hilfsmittel benutzt habe.
Ferner erkläre ich, dass ich nicht bereits anderweitig versucht habe, mit oder ohne Erfolg eine Dissertation einzureichen oder mich einer Doktorprüfung zu unterziehen.
Bayreuth, den 17.03.2014 ………………………………..
Stefan Georg Gonser