ioe562/stat535 – reliability fall 2007 instructor: vijay...
TRANSCRIPT

IOE562/Stat535 – ReliabilityFall 2007
Instructor: Vijay Nair Preliminaries
• Class Syllabus and Topics (Handout #1)
• Text and Other References (Handout #2)
• Grading (Handout #2)
• Student Background (Handout #3)
• Homework policy (Handout #4)
• Homework #1

VNN Info• Class web page: Ctools course site
• Office: 453 West Hall (central campus)1821 IOE Bldg (north campus)
• E-mail: [email protected] (only short e-mails please!)
• Instructor Office Hours – TBA
• Grader: Paul [email protected]
• Office Hours -- TBA
Handout #1IOE 562/Stat 535: RELIABILITY
Fall 2007Instructor: Vijay Nair
COURSE DESCRIPTION: This course will cover important reliability concepts and methodology that arise in modeling, assessing and improving product reliability and in analyzing field and warranty data.
Topics will be selected from the following:Basic Concepts in ReliabilityComponent and System Reliability
AgingHazard Component ReliabilityCommon Models for Component Reliability
Types of Censoring SchemesAnalysis of Time-to-Failure Data
Nonparametric TechniquesGraphical and Formal Goodness-of-Fit Tests for Model SelectionParametric Techniques
Reliability, Availability, and Maintainability for Repairable SystemsSystem StructuresCommon Models for System ReliabilityAnalysis of Time-Between-Failure Data Maintenance and Availability
Accelerated Stress Testing for Reliability AssessmentReliability Improvement Through Experimental DesignSpecial Topics: Warranty Data Analysis, Stress-Strength Models, etc.
TEXT: ``Statistical Methods for Reliability Data'' by Meeker and Escobar (1998), Wiley. This will be supplemented by selected material from engineering text books in reliability.
Handout #2IOE 562/Stat 535: RELIABILITY
Fall 2007Vijay Nair
REFERENCES
1. Meeker. W. Q. and Escobar L. (1998) Statistical Methods for Reliability Data, New York: Wiley2. Nelson, W. (1990), Accelerated Testing: Statistical Models, Test Plans and Data Analyses, New
York: Wiley. 3. Ascher, H. and Fiengold H. (1984), Repairable Systems Reliability, New York: Marcell Dekker,
Inc.4. O'Connor, P. D. T. (1985), Practical Reliability Engineering, New York: Wiley.5. Ebeling, C. E. (1997), Reliability and Maintainability Engineering, New York: McGraw Hill.6. Billinton, R. (1992), Reliability Evaluation of Engineering Systems: Concepts and Techniques,
Plenum Pr. NY.7. Lewis, E. E. (1996) Introduction to Reliability Engineering, New York: Wiley.8. Jardine, A. K. S. (1973), Maintenance, Replacement and Reliability, New York: Wiley9. Ditlevson, O. and Madsen, H. O. (1996) Structural Reliability Methods, New York: Wiley.
GRADING SCHEMEHomework 25%Midterm 25%Class Project 15%Final Exam 25% Class Participation 10%

Handout #3IOE 562/Stat 535: RELIABILITY
Fall 2007Vijay Nair
Name:
Dept & Program: (eg. IOE/Stat etc., Master's/Ph.D. etc):
Stat/Prob classes taken and level:
Other relevant information: (eg. practical experience)

Reading Assignment and HW #1(See Ctools course site in the future)
Reading Assignment:Meeker and Escobar –Chapter 1 – browse through whole chapter;Chapter 2 – Sections 2.1-2.2Chapter 4 – Sections 4.1-4.11Chapter 5 – Sections 5.1, 5.2, 5.6, 5.7, 5.10
HW #1: (due Mon 9/17)Meeker and Escobar:Problems 1.5, 1.6, 1.7, 1.8 (choose 3 of the applications),
and 1.9

Course Background
• Focus on methods for collecting and analyzing reliability data for making engineering decisions
• Breadth vs Depth (variety of topics)
• Not covered -- very applied, engineering and economic aspects of reliability (life cycle costs, FMEA, FTA, maintenance, …)
Review:
• Distributions (Important distributions, properties – quantiles, moments, …)
• Multivariate normal distributions (mean, covariance/correlation matrices)
• Likelihood – MLEs, Fisher information, etc.

Summary of Chapter 1 – M&EReliability Concepts and Reliability Data Objectives
• Explain the importance of reliability
• List some reasons for collecting reliability data
• Describe the distinguishing features of reliability data
• Provide examples of reliability data and describe the motivation for the collection of the data.
• Outline a general strategy that can be used for data analysis, modeling, and inference from reliability data.

MotivationRecent directions:• Intense global competition improve Q&R,
reduce product development cycle time, reduce product life-cycle costs
• Increasing customer expectations lot more functionality, high quality, AND low cost
• Rapid advances in technology more sophisticated products increase in product complexity more reliance on data
Emphasis on Quality and Reliability
Increasing pressure on manufacturers to produce products with high quality and reliability
Reliability:• “Ho” topic (like Q&P and quality management in 1980’s)• Lots of $$ at stake – product warranty now std but costs
in billions of $ -- Ford/Firestone eg.• Safety issues: Aircraft, Nuclear, Space, …• Software vs Hardware Reliability• Parts/Components vs System Reliability

What is the difference between quality and reliability?
Intuitive meaning of reliability?
Other terms – durability, …

Definitions of Reliability
• Informal: “Reliability is quality over time” (Condra 1993)
• Technical: Reliability is the probability that a system, vehicle, machine, device, and so on, will perform its intended function under encountered operating conditions, for a specified period of time.
T = “time”-to-failure R(100) = P(T > 100)More generally: Reliability function: R(t) = P(T > t)
T is random: why?Probability distribution – where does it come from? “Time” surrogate for …
Some Issues in Modeling Reliability Data
• Causes of failure?
• Degradation and environmental effects on reliability
• Catastrophic vs “soft” failures
• Homogeneous vs heterogeneous population?
• Definition of time scale
• Definitions of time origin and time of failure
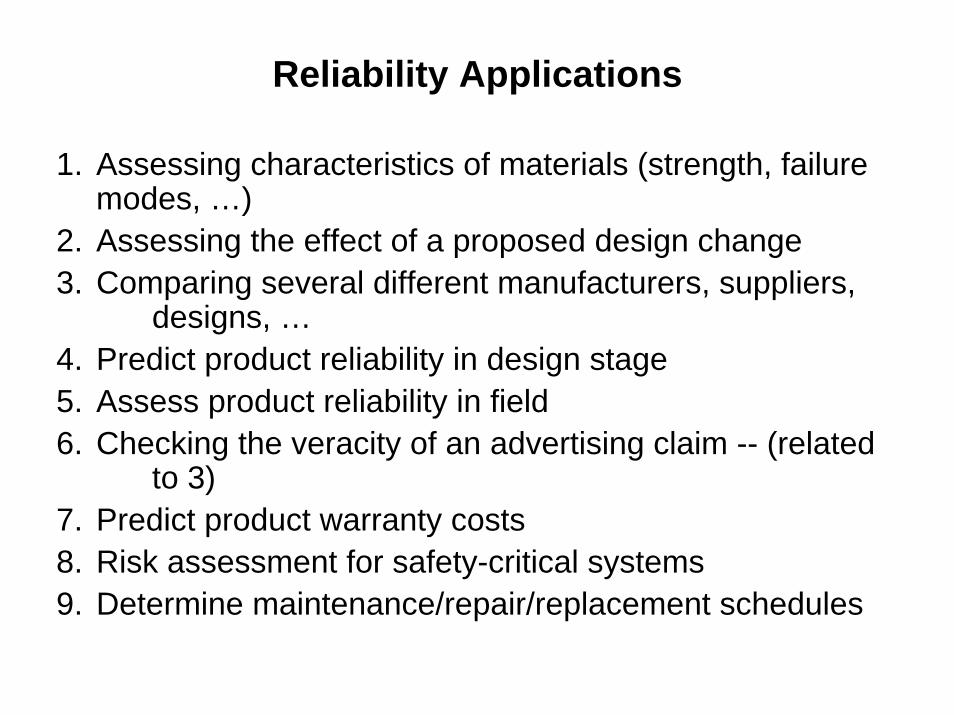
Reliability Applications
1. Assessing characteristics of materials (strength, failure modes, …)
2. Assessing the effect of a proposed design change3. Comparing several different manufacturers, suppliers,
designs, …4. Predict product reliability in design stage5. Assess product reliability in field6. Checking the veracity of an advertising claim -- (related
to 3)7. Predict product warranty costs8. Risk assessment for safety-critical systems9. Determine maintenance/repair/replacement schedules
Other Names for Reliability Data
• Life data
• Failure data
• Time-to-failure (TTF) data “time”
• Time-between-failure data
• Survival data
• Event-time data
Degradation data (somewhat different) measure how device state or performance changes over time

Distinguishing Features of Reliability Data
• Models for positive random variables (e.g., exponential, log-normal, Weibull, gamma). Normal distribution not common.
• Model parameters not of primary interest (instead, hazard rates, quantiles, probabilities of failure, …)
• Extrapolation often required (e.g., want proportion failing by 900 hours but test runs for only 400 hours).
• Data are typically censored (bounds on observations) – different types of censoring (examples to follow)
Repairable Systems and Nonrepairable Devices
• Failure data on components or nonrepairable devices- Laboratory tests on materials or components- Failure data of components in field- Time to first failure of a system.
• Failure data on repairable systems-- time-between-failures-- how do failure patterns change over time?-- repair as good as new?

Example: Ball Bearing Data
Fatigue endurance tests for deep-groove ball bearings from four major bearing companies (Lawless 1982) several stress levels
Data: Millions of revolutions to failure for each of n = 23 bearings until fatigue failure
Main objective of the study: Determine relationship between lifetime and stress load ( best values of the parameters in equation relating fatigue to load)
Motivation:• Fatigue affects service life of ball bearings.• Disagreement in the industry on the appropriate model to describe
relationship

F(80)?Proportion failing
by 80 million cycles?

All units failed in this study not very common F(80)?

Example: IC Data (Meeker, 1987)Integrated circuit failure times in hours – stress test
Test ended at 1,370 hours – 26 failed; 4,128 units were still running at end of test – (right) censored
Questions:- Probability of failing before 100 hours?- Hazard function at 100 hours- Proportion of units that will fail in 105 hours?- Extrapolation – in time and stress
Any interesting features in the data?


Example: Fan Failure Data
Hours to fan failure on 12 diesel generators and running times on 58 generators without fan failure, n = 70 (Nelson 1982).
-- example of different censoring times for different units
Some important questions of interest:
• Estimate percentage failing under warranty.
• Would the problem get better or worse as the remaining fans age?
In reliability terminology: does hazard function increase or decrease with age?
Shock Absorber Failure Data(O’Conner, 1985)
• Failure times of vehicle shock absorbers (in kilometers of vehicle use)
• Two failure modes, denoted M1 and M2
• Interest is on failure-time distributions of mode M1, mode M2, and overall part
• Example of “competing risks” and random right censoring

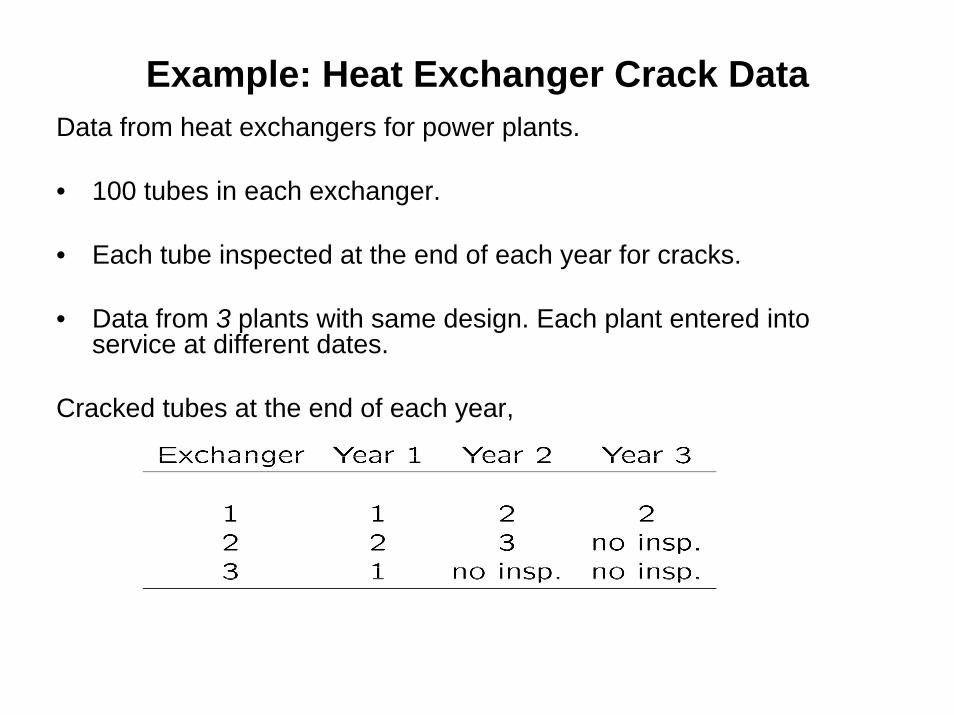
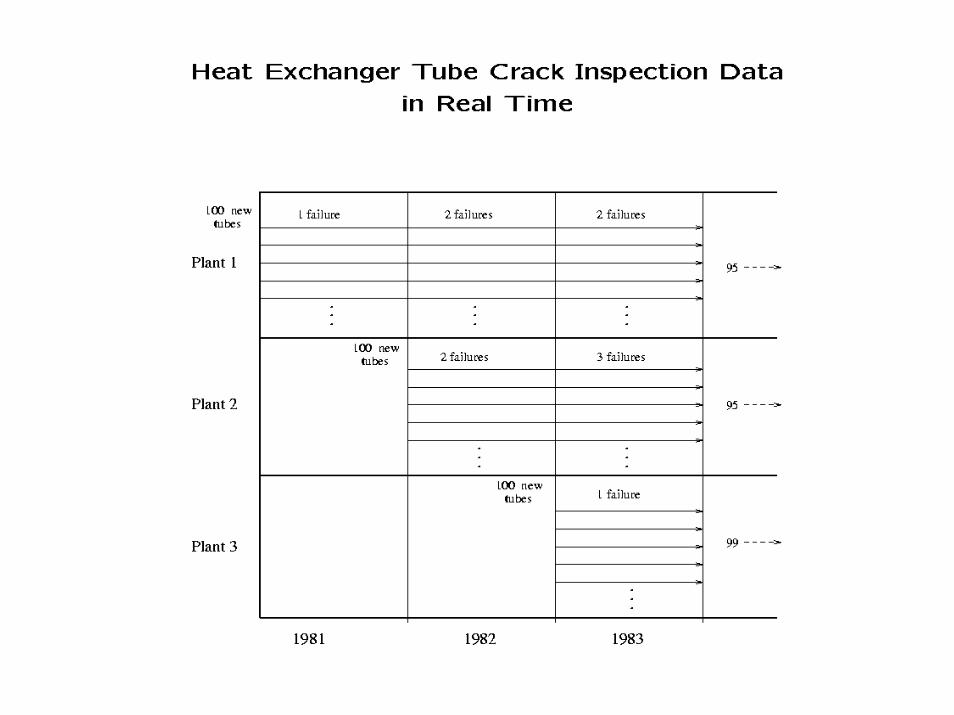
Example: Heat Exchanger Crack DataData from heat exchangers for power plants.
• 100 tubes in each exchanger.
• Each tube inspected at the end of each year for cracks.
• Data from 3 plants with same design. Each plant entered into service at different dates.
Cracked tubes at the end of each year,


Example: Turbine Wheel Data
Each of n = 432 wheels was inspected once to determine if it hadstarted to crack or not. Wheels had different ages at inspection(Nelson 1982)
Some important objectives were:• Need to schedule regular inspections.
• Estimate the distribution of time to crack.
• Is the reliability of the wheels getting worse as the wheels age?
An increasing hazard function would require replacement of the wheels by some age when the risk of cracking gets too high.

Example: Turbine Wheel Data Summary at Time of Study (Nelson 1982)
Cross-sectional study


Homogeneous vs Heterogeneous PopulationFailure time varies with stress

Degradation Data

Degradation Data
• Provides information on progression toward failure.
• Becoming more common in certain areas of component reliability where few or no failures expected in life tests.
• Important connections with physical mechanisms of failure and time-to-failure reliability models.
• Special methods of analysis needed (Chapters 13,21,22).

Biomedical Data
• Biomedical studies can yield data with censored structures similar to the ones observed in reliability.
• Similarly, some of the degradation data from biomedical studies resembles degradation data from reliability studies.
• Though some of the reliability methodology can be applied to biological studies, one can not blindly apply it ignoring the distinct nature of the problem handled in these two areas.

Example: DMBA Data
Number of days until the appearance of a carcinoma in 19 rats papinted with carcinogen DMBA.
Data from Pike (1966). See Lawless (1982).

Strategy for Data Analysis, Modeling, and Inference
• Model-free graphical analysis of data based on nonparametric methods
• Model fitting (parametric, including possible use of prior information).
• Inference: estimation or prediction (e.g., statistical intervals to reflect uncertainty/variability).
• Graphical and analytical diagnostics, assessment of model assumptions
• Sensitivity analysis
• Reliability conclusionsnot in this order
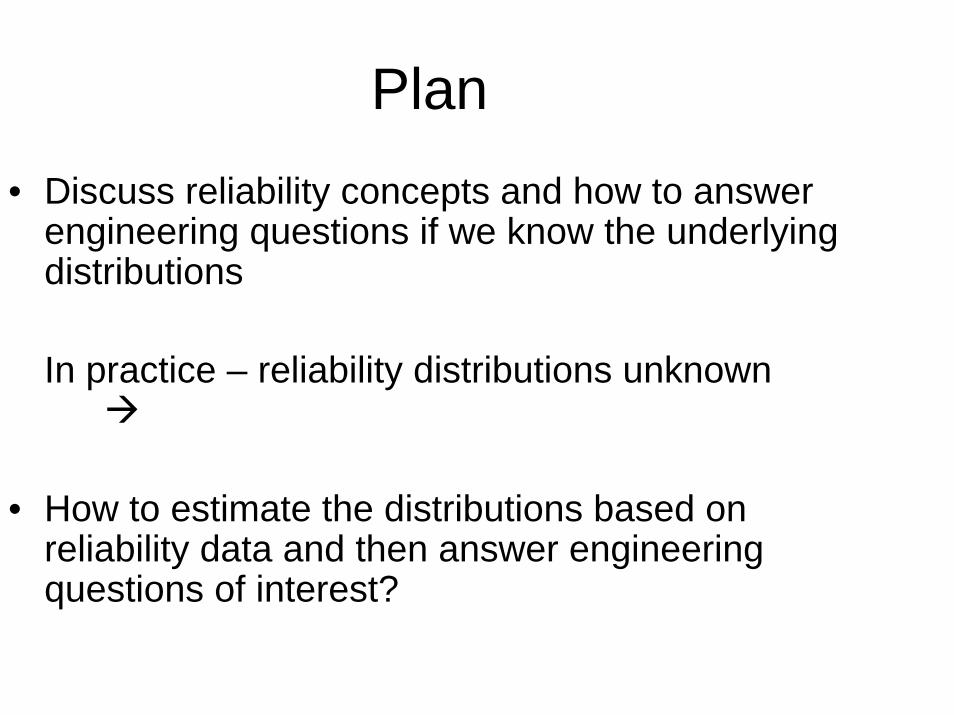
Plan• Discuss reliability concepts and how to answer
engineering questions if we know the underlying distributions
In practice – reliability distributions unknown
• How to estimate the distributions based on reliability data and then answer engineering questions of interest?

Computer SoftwareAnalysis of Reliability Data with Censoring
Some capabilities in:• Minitab• S-PLUS• SAS• WeibullSMITH• BMDP• StatGraphics

IOE562/Stat535: Reliability (Fall 06)Illustrative ApplicationsCASE 1: REDUNDANCY
In a large electronics company that manufactures small electrical parts such as resistors, capacitors, transistors, and inductors, a new component is experiencing a high failure rate. In order to meet government contract specifications, the function being performed by this component must have a 90 percent or better reliability over a 4-hour mission in a high-stress environment. Because of the cost and time required to redesign the component, design engineers are considering adding redundancy to achieve the desired reliability.In order to determine the reliability, 75 units were placed on test in a high-stress environment. The test was terminated at the 50th failure. The following failure times (in hours) were recorded:
0.4 0.8 0.8 1.9 2.0 2.2 2.4 2.73.1 3.23.6 3.9 4.0 4.0 4.3 5.7 6.0 6.36.5 6.88.3 10.1 11.1 11.4 11.5 11.7 11.8 12.412.7 13.115.0 15.4 17.6 17.8 18.3 18.7 18.9 19.419.6 19.821.0 21.5 21.6 22.2 22.8 24.1 25.1 25.625.8 26.0
What should the company do?

CASE 2: BURN-IN TESTING
A new fuel pump is experiencing manufacturing problems resulting in high infant mortality. The company has a 25-operating-hour warranty program that, because of the high infant mortality rate, is costing the company a considerable amount of money. Each failure under the warranty program costs the company approximately $1200 in replacement costs, administrative costs, and an estimated cost for the loss of goodwill. The company would like to implement a burn-in program in order to eliminate marginal pumps before they are sold under warranty. However, it is not certain whether a burn-in program will be effective and, if so, how many hours of testing would be necessary to implement the program. To answer these questions, the company first needed to establish an appropriate reliability model.
Twenty-five fuel pumps selected randomly from the production line were placed on test. The test ran for 500 operating hours (Type 1 test). The following failure times were obtained:
0.005 0.0 0.2 1.0 1.0 2.3 9.3 10.114.2 16.4 29.7 155.2 172.6 393.1 442.8 445.0
Should burn-in be used? If so, what is the optimal burn-in period?
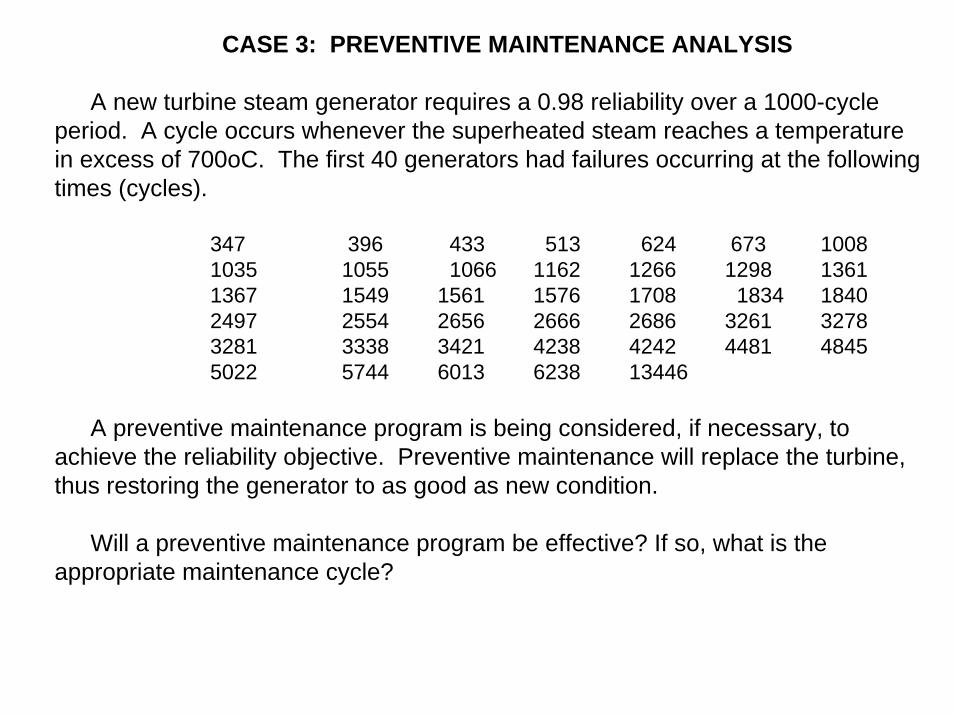
CASE 3: PREVENTIVE MAINTENANCE ANALYSIS
A new turbine steam generator requires a 0.98 reliability over a 1000-cycle period. A cycle occurs whenever the superheated steam reaches a temperature in excess of 700oC. The first 40 generators had failures occurring at the following times (cycles).
347 396 433 513 624 673 10081035 1055 1066 1162 1266 1298 13611367 1549 1561 1576 1708 1834 18402497 2554 2656 2666 2686 3261 32783281 3338 3421 4238 4242 4481 48455022 5744 6013 6238 13446
A preventive maintenance program is being considered, if necessary, to achieve the reliability objective. Preventive maintenance will replace the turbine, thus restoring the generator to as good as new condition.
Will a preventive maintenance program be effective? If so, what is the appropriate maintenance cycle?

CASE 4: RELIABILITY ALLOCATION
A high-frequency radio receiver consists of the serially related components shown in the figure below. A reliability testing program conducted during initial development tested each component independently, with the following results. The test was concluded after 8,000 operating hours (accelerated life testing).
If you are the design engineer, how would you use the test data below to determine the design configuration (optimal number of redundant components of each type) that achieves a 95 percent reliability at 1,000 operating hours at minimum cost?
PowerSupply Tuner Receiver
Unit cost ($) 175 250 525 Number on test 30 20 15
Failure times 4779 588.0 82.85051 3682.6 820.25633 3819.0 858.36317 4999.5 1201.97491 5048.3 1412.37573 5688.1 1989.17637 7480.7 2042.77953 4641.6 3113.9
3176.63706.73790.34057.04488.0

CASE 5: REPAIRABLE SYSTEM ANALYSIS
The Notso Reliable Manufacturing Company has been experiencing a high number of failures with its five-year-old industrial robot used for arc welding. Once the unit fails, it is often down for what is considered to be an excessive length of time for repair. Downtime costs the company $750 an hour in lost production and repair costs. A replacement unit will cost $21,000. The company wishes to determine whether it is economical to replace the unit. The unit was advertised as having a 10-year design life. The unit operates 8 hours per day for 240 days out of the year (1920 total operating hours per year).
From the time the robot was first installed, the company has recorded the following failure times, in operating hours, of the unit:
1339 1857 2307 3329 3792 38915541 5646 5726 5806 6530 67366771 6826 7056 7065 7097 77717779 7942 8045 8088 8558 8642
8764 8765 8958 9034 9104 9318 9523For the last 16 failures it has also maintained a log of the following repair times, in
hours:36.2 47.7 81 7.2 36.1 2.7 4.5 27.65.2 7.216.7 26.8 7.7 12.6 8.4 10.8
What would you conclude?