iodine speciation studies on bunsen reaction of s–i cycle using spectroscopic techniques
TRANSCRIPT
i n t e r n a t i o n a l j o u r n a l o f h y d r o g e n en e r g y 3 7 ( 2 0 1 2 ) 3 6 2 1e3 6 2 5
Avai lab le a t www.sc iencedi rec t .com
journa l homepage : www.e lsev ier . com/ loca te /he
Iodine speciation studies on Bunsen reaction of SeI cycleusing spectroscopic techniques
Deepak Tyagi, Salil Varma*, K. Bhattacharya, D. Jain, A.K. Tripathi, C.G.S. Pillai,S.R. Bharadwaj
Chemistry Division, Bhabha Atomic Research Centre, 400085 Mumbai, India
a r t i c l e i n f o
Article history:
Received 9 March 2011
Received in revised form
27 April 2011
Accepted 29 April 2011
Available online 12 June 2011
Keywords:
HIx
Raman spectroscopy
UVevisible spectroscopy
Speciation
* Corresponding author. Tel.: þ91 22 2559228E-mail address: [email protected] (S. V
0360-3199/$ e see front matter Copyright ªdoi:10.1016/j.ijhydene.2011.04.221
a b s t r a c t
Bunsen reaction is an important step of sulfureiodine cycle for hydrogen production from
thermochemical splitting of water. Polyiodide species generated during the separation
process need to be identified for complete understanding of the mechanism involved.
Speciation of these polyiodide species formed during Bunsen reaction can lead to better
understanding of kinetics of the process. HIx species formed have been analyzed using
UVevisible and Raman spectroscopic techniques. Peak corresponding to HI3 species have
been ascertained and their conversion to higher HI5, HI7 .. species has been observed.
Copyright ª 2011, Hydrogen Energy Publications, LLC. Published by Elsevier Ltd. All rights
reserved.
1. Introduction are explored for their capability to fulfill the future hydrogen
Fossil fuel resources of earth will not be able to meet the
energy needs of future generations, which leads to investi-
gation of many alternate energy sources. Among these
hydrogen seems to be an attractive energy carrier if it can be
produced in a clean and cost effective manner.
Hydrogen is future fuel to bring out shift from carbon based
energy sources to more energy efficient and environmentally
clean systems [1,2]. The development of newer technologies
based on fuel cells and other techniques require production of
hydrogen on large scale and in an economically viable
manner. The two processes which seems to be most prom-
ising for massive hydrogen production are electrolysis [3,4]
and thermochemical cycles [5e7]. In thermochemical cycles
heat can be directly used so they have potential of better
efficiency than alkaline electrolysis. Various thermochemical
cycles like sulfureiodine cycle [7], copper chlorine cycle [8,9]
2; fax: þ91 22 25505151.arma).2011, Hydrogen Energy P
demand.
Sulfureiodine cycle is based on integration of following
three reactions in a loop:
I2ðIÞ þ SO2ðgÞ þ 2H2OðIÞ/2HIðaq:Þ þH2SO4ðaq:Þ (1)
2HIðgÞ/I2ðgÞ þH2ðgÞ (2)
H2SO4ðgÞ/SO2ðgÞ þH2OðgÞ þ 0:5O2ðgÞ (3)
First reaction is known as the Bunsen reaction, which forms
an important step of sulfureiodine cycle for thermochemical
splitting of water. This reaction is carried out in liquid water
media with a large excess of iodine. Excess iodine is added to
avoid side reactions between iodine and sulfur compounds;
also excess iodine facilitates segregation of the two product
acids into two corresponding liquid phases [10e13]. These
phasesaresulfuricacidphase (about 50wt%H2SO4) inwhichHI
ublications, LLC. Published by Elsevier Ltd. All rights reserved.

i n t e rn a t i o n a l j o u r n a l o f h y d r o g e n en e r g y 3 7 ( 2 0 1 2 ) 3 6 2 1e3 6 2 53622
exhibits low solubility, andhydrogen iodide phase (namely the
“HIx phase”) containing almost all of the excess iodine, with
H2SO4 as a minor impurity. Hence, the reaction stoichiometry
andmass balance of this process can be described as follows:
ðxþ 1ÞI2 þ SO2 þ ðnþ 2ÞH2O/½H2SO4 þ ðn�mÞH2O� þ ½2HIþ ðxÞI2 þmH2O�Sulphuric acid phase HIx phase
(4)
wherexandnare the iodineandwatermolarexcessquantities,
respectively, in the reactant phase andm is themolar quantity
of the excess water that ends up in the product HIx phase.
Due to presence of excess iodine in HIx phase, various pol-
yiodide species are generated during the separation process.
The formation of various polyiodide species can be explained
as follows:
I2 þ I�4I�3 (5)
2I2 þ I�4I�5 (6)
3I2 þ I�4I�7 (7)
These polyiodide species need to be identified for complete
understanding of the mechanism involved and kinetics fol-
lowed in the processes. Lot of research works are reported in
literature for identification of polyiodide species [14e17]. Most
of the work reported in the literature is related to separation
and identification of salts and complexes of these polyiodides
in molten and solid form, only few of them are for aqueous
solutions [18,19]. The methods employed range from vibra-
tional spectroscopy, Mossbauer spectroscopy, NMR, ESR,
ESCA, UV/Visible spectroscopy, electro-analytical techniques
and X ray based methods.
The problem that we attempted to address in the present
study is the identification of different polyiodide species of HIx
phase of Bunsen reaction in absence and presence of sulfuric
acid. The spectroscopic techniques based on molecular absor-
bance inUVevisiblespectroscopyandRamanspectroscopywere
used to exploit change in symmetry for different HIx species.
Fig. 1 e Raman spectra of HI:I2 1:1 solution with
deconvulation showing v1, v2 and v3 peaks.
2. Experimental
2.1. Raman spectroscopy
Laser Raman spectra of the solutions containing varying
amounts of HI and I2 were recorded on a LABRAM-1 spec-
trometer (ISA) in a back-scattering geometry, at a spectral
resolution of 2 cm�1. An Arþ ion laser (488 nm) was used as an
excitation source. Test solutions were prepared by mixing
0.1M stock solutions of HI and iodine in required proportion to
make a final solutions of 50 ml volume.
2.2. UVevisible spectroscopy
The UV/Visible spectra of the solutions containing varying
amounts of HI, KI and I2 were recorded using a JASCO
Spectrophotometer (Model V-650), JAPAN. Test solutions were
prepared bymixing 2� 10�3 M stock solutions of HI and iodine
in required proportion to make a final solutions of 2 � 10�4 M
concentration for100 ml volume.
3. Results and discussion
3.1. Raman spectroscopy
Raman spectra were recorded for 0.1 M HI with iodine
concentration ranging from 0.1 to 0.6 M, i.e. the spectra were
obtained for I2:I� ratio of 1e6. No spectral features were
observed for both pure I� and pure I2 solutions. The solution
with HI:I2 ratio of 1:1 exhibits a strong broad Raman band in
region 90e170 cm�1 peaking at 113 cm�1 (Fig. 1). This is
attributed to presence centrosymmetric (Dih) I�3 species [14,20].
Triiodide species has a Raman active symmetric stretching
band at v1 at 110 cm�1 and two IR active bands at 50e70 cm�1
and 130e140 cm�1 corresponding to doubly degenerate
bending and asymmetric stretch modes, v2 and v3, respec-
tively. Appearance of peak at 60 cm�1 and 130 cm�1 is indic-
ative of change in symmetry of the I�3 species due to
anioneanion or anionesolvent interaction [21]. Presence of
donor I2 adduct has also been reported to play a major role in
appearance of v3 band [22].
Fig. 2 shows overlay of Raman spectra obtained for
increasing concentration of iodine from 0.1 M to 0.6 M in 0.1 M
HI solution. The broad peak obtained for 1:1 HI:I2 solution is
found to decrease as HI:I2 ratio increases to 1:4 and is constant
for HI:I2 ratio upto 1:5 and then again decreases for 1:6 ratio

Fig. 2 e Raman spectra for different HI:I2 ratio solutions.
Fig. 4 e Multiple deconconvulations corresponding to HI:I2ratio of 1:3.
i n t e r n a t i o n a l j o u r n a l o f h y d r o g e n en e r g y 3 7 ( 2 0 1 2 ) 3 6 2 1e3 6 2 5 3623
solution. Considering that 113 cm�1 peak corresponds to I�3species this decrease indicates for conversion of this species
into higher polyiodides either by disproportionation or by
adduct formation with iodine as shown below:
2I�34I�5 þ I�
I�3 þ I24I3ðI2Þ�
Fig. 3 e Variation of intensity of v1, v2 and v3 peaks for
different HI:I2 ratio solutions.
For understanding of this variation in the Raman spectra
the change in intensity of three deconvulated peaks as shown
in Fig. 3 was plotted. The peak corresponding to the v1 band
shows drastic decrease with increasing iodine concentration
upto 1:3 HI:I2 ratio and then remains constant for ratio upto 1:5
before decreasing further for 1:6 ratio. Similar trend is
observed for v3 band, too. Compared to these the v2 band
exhibits consistent increase with increasing HI:I2 ratio. Such
a pattern can be explained by taking into consideration the
presence of I�5 species. It is reported by Sharp et al. [20] that
various bands exist at 165, 55, 146 and 114 cm�1 and 157, 90,
143, 110 cm�1 for linear and bent pentaiodide species,
respectively. This system can be understood in terms of
a disproportionation and coupled equilibrium initiated by the
liquidification of a triiodide system as given below [14]:
I3ðI2Þ�þI�42I�3
Fig. 5 e Raman spectra in presence of different
concentrations of sulfuric acid, depicting no effect of its
presence.
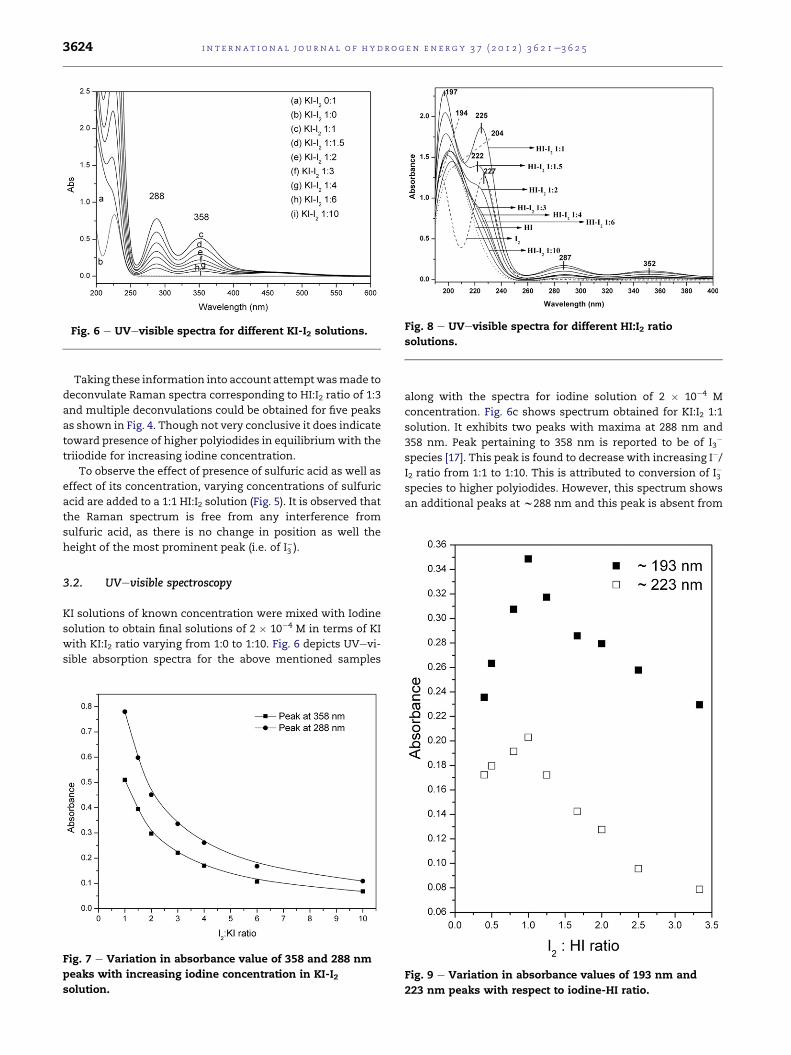
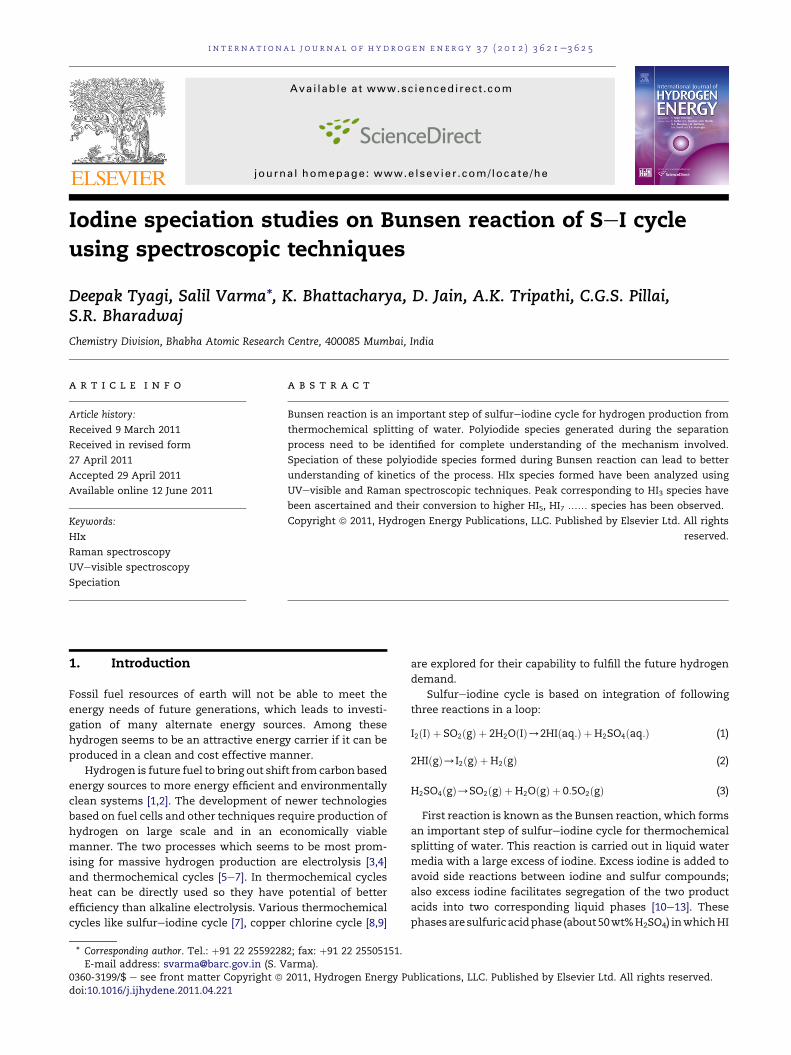
Fig. 6 e UVevisible spectra for different KI-I2 solutions. Fig. 8 e UVevisible spectra for different HI:I2 ratio
solutions.
i n t e rn a t i o n a l j o u r n a l o f h y d r o g e n en e r g y 3 7 ( 2 0 1 2 ) 3 6 2 1e3 6 2 53624
Taking these information into account attemptwasmade to
deconvulate Raman spectra corresponding to HI:I2 ratio of 1:3
and multiple deconvulations could be obtained for five peaks
as shown in Fig. 4. Though not very conclusive it does indicate
toward presence of higher polyiodides in equilibriumwith the
triiodide for increasing iodine concentration.
To observe the effect of presence of sulfuric acid as well as
effect of its concentration, varying concentrations of sulfuric
acid are added to a 1:1 HI:I2 solution (Fig. 5). It is observed that
the Raman spectrum is free from any interference from
sulfuric acid, as there is no change in position as well the
height of the most prominent peak (i.e. of I�3 ).
3.2. UVevisible spectroscopy
KI solutions of known concentration were mixed with Iodine
solution to obtain final solutions of 2 � 10�4 M in terms of KI
with KI:I2 ratio varying from 1:0 to 1:10. Fig. 6 depicts UVevi-
sible absorption spectra for the above mentioned samples
Fig. 7 e Variation in absorbance value of 358 and 288 nm
peaks with increasing iodine concentration in KI-I2solution.
along with the spectra for iodine solution of 2 � 10�4 M
concentration. Fig. 6c shows spectrum obtained for KI:I2 1:1
solution. It exhibits two peaks with maxima at 288 nm and
358 nm. Peak pertaining to 358 nm is reported to be of I3�
species [17]. This peak is found to decrease with increasing I�/I2 ratio from 1:1 to 1:10. This is attributed to conversion of I�3species to higher polyiodides. However, this spectrum shows
an additional peaks at w288 nm and this peak is absent from
Fig. 9 e Variation in absorbance values of 193 nm and
223 nm peaks with respect to iodine-HI ratio.

i n t e r n a t i o n a l j o u r n a l o f h y d r o g e n en e r g y 3 7 ( 2 0 1 2 ) 3 6 2 1e3 6 2 5 3625
spectrum as recorded for respective KI and iodine solutions.
As observed in Fig. 7, this peak also follows a pattern of
decrease in absorbance value with increasing I2:KI ratio as
observed for 358 nm peak. It again indicates toward presence
of I�3 species for its genesis.
When similar measurements were carried out for HI-I2solution of 2 � 10�4 M concentration, similar absorbance
patterns are observed, though with a reduced absorbance
values (Fig. 8). For these solutions the lower wavelength peaks
at w200 nm and w225 nm, which were out of scale for KI
based solutions, can be observed clearly. Both these peaks are
different from earlier mentioned peaks at 288 nm and 358 nm,
in the sense that they appear in case of pristine HI (204 nm)
and iodine (227 nm) solutions too, respectively. When this
data is analyzed for change in absorbance value of these peaks
with respect to increasing I2 concentration inHI solution a plot
similar to Job’s plot is obtained (Fig. 9) with maxima for 1:1
HI:I2 concentration. Maxima for 1:1 composition again points
toward assigning of these peaks to I�3 type of species. Due to
their very high absorbance value these peaks can be very
efficiently utilized for detection of triiodide species with high
sensitivity.
4. Conclusion
Presence of I�3 and higher polyiodides in the HIx phase of
Bunsen reaction of sulfur Iodine thermochemical cycle was
confirmed by UVevisible and Raman studies. The new
UVevisible peaks identified for I�3 species at wavelength of 193
and 223 nm with very high absorbance.
r e f e r e n c e s
[1] Dunn S. Hydrogen futures: toward a sustainable energysystem. Int J Hydrogen Energy 2002;27:235e64.
[2] Jain IP. Hydrogen the fuel for 21st century. Int J HydrogenEnergy 2009;34:7368e78.
[3] Herring JS, O’Brien JE, Stoots CM, Hawkes GL, Hartvigsen JJ,Shahnam M. Progress in high-temperature electrolysis forhydrogen production using planar SOFC technology. Int JHydrogen Energy 2007;32:440e50.
[4] Khaselev O, Turner JA. A monolithic photovoltaic-photoelectrochemical device for hydrogen production viawater splitting. Science 1998;280:425e7.
[5] Kodama T, Gokon N. Thermochemical cycles for high-temperature solar hydrogen production. Chem Rev 2007;107:4048e77.
[6] Mizuta S, Kumagai T. Thermochemical hydrogen productionby the magnesium-sulfur-iodine cycle. Bull Chem Soc Jpn1982;55:1939e42.
[7] Norman JH, Besenbruch GE, O’Keefe DR. Thermochemicalwater splitting for hydrogen production. General atomicsreport GRI-80/0105; 1981.
[8] Naterer G, Suppiah S, Lewis M, Gabriel K, Dincer I, Rosen MA,et al. Recent Canadian advances in nuclear-based hydrogenproduction and the thermochemical Cu-Cl cycle. Int JHydrogen Energy 2009;34:2901e17.
[9] Orhan MF, Dincer I, Rosen MA. Energy and exergyassessments of the hydrogen production step of a copper-chlorine thermochemical water splitting cycle driven bynuclear-based heat. Int J Hydrogen Energy 2008;33:6456e66.
[10] Norman JH, Mysels KJ, Sharp R, Williamson D. Studies of thesulfur-iodine thermochemical water-splitting cycle. Int JHydrogen Energy 1982;7:545e56.
[11] Sakurai M, Nakajima H, Onuki K, Ikenoya K, Shimizu S.Preliminary process analysis for the closed cycle operation ofthe iodineesulfur thermochemical hydrogen productionprocess. Int J Hydrogen Energy 1999;24:603e12.
[12] Sakurai M, Nakajima H, Onuki K, Shimizu S. Investigation of2 liquid phase separation characteristics on theiodineesulfur thermochemical hydrogen productionprocess. Int J Hydrogen Energy 2000;25:605e11.
[13] Sakurai M, Nakajima H, Amir R, Onuki K, Shimizu S.Experimental study on side-reaction occurrence condition inthe iodineesulfur thermochemical hydrogen productionprocess. Int J Hydrogen Energy 2000;25:613e9.
[14] Svensson PH, Kloo L. Synthesis, structure, and bonding inpolyiodide and metal iodide-iodine systems. Chem Rev 2003;103:1649e84.
[15] Blake AJ, Devillanova FA, Gould RO, Li WS, Lippolis V,Parsons S, et al. Template self-assembly of polyiodidenetworks. Chem Soc Rev 1998;3:195e205.
[16] Wiebenga EH, Havinga EE, Boswijk KH. Structures ofinterhalogen compounds and polyhalides. Adv Inorg ChemRad 1961;3:133e69.
[17] Anderson A, Sun TS. Raman spectra of molecular crystals I.Chlorine, bromine, and iodine. Chem Phys Lett 1970;6:611e6.
[18] Palmer DA, Ramette RW, Mesmer RE. Triiodide ion formationequilibrium and activity coefficients in aqueous solution.J Solution Chem 1984;13:673e83.
[19] Calabrese VT, Khan A. Polyiodine and polyiodide species inan aqueous solution of iodine þ KI: Theoretical andexperimental studies. J Phys Chem A 2000;104:1287e92.
[20] Sharp SB, Gellene GI. Ab initio calculations of the groundelectronic states of polyiodide anions. J Phys Chem 1997;101:2192e7.
[21] Svensson PH, Kloo L. A vibrational spectroscopic, structuraland quantum chemical study of the triiodide ion. J Chem SocDalton Trans; 2000:2449e55.
[22] Deplano P, Ferraro JR, Mercuri ML, Trogu EF. Structural andRaman spectroscopic studies as complementary tools inelucidating the nature of the bonding in polyiodides and indonor-I2 adducts. Coord Chem Rev 1999;188:71e95.