invisible quality in frozen vegetables - a study to - diva portal
TRANSCRIPT

1
KRISTIANSTADUNIVERSITY COLLEGE
Department of Business Studies
Invisible quality in frozen vegetables
- A study to indicate which factors influence brand loyalty
Bachelor dissertation
International
business program
FEK 685, January
2004
Tutor: Authors:
Christer Ekelund Sabina Dahlqvist
Viveca Fjelkner Lydia Fehér

2
Preface
This dissertation is the final work before we graduate from the business
department in Kristianstad after three and a half years of studies.
To write a dissertation like this for the first time requires many advice,
help and support from people both inside and outside the University. By
this we would like to thank some special persons that have helped us
from the very beginning to the end. Without their help and support there
would probably not be a dissertation.
We like to give a special thank to our tutor Christer Ekelund for his
willingness to help and to support in all situations. We also like to thank
him for all of the good advice and his patience since he always took the
time to listen to our questions and solve our problems.
A special thank to Viveca Fjelkner for her help and suggestions with the
English language.
We also like to thank Magnus Jeppsson at Findus, for all of his good
advice and support within the frozen vegetables area. We also like to
thank Findus marketing department for their fabulous help and advice
with the questionnaire.
Finally, we like to thank Jonas Mårtensson, from UULAS Architect office,
for the sponsoring of paper and printing material.
Kristianstad
January 2004
Sabina Dahlqvist Lydia Feher
3
Abstract This dissertation is written within the marketing area. From the beginning
we wanted the whole dissertation to be about invisible quality, but the
time and the amount written about the subject was too little, so we
decided to write the dissertation around brand loyalty and factors that
may influence. The factors are price, country of origin, invisible quality
and experienced knowledge.
One of the main problems is to find out how important invisible quality is
for brand loyalty and the active choice of brand in frozen vegetables for
the consumers. And the other problem is which factors will influence
brand loyalty.
The dissertation is written from a deductive point of view which means
that we have proceeded from existing theories and developed a model
that has brand loyalty as the core and the four factors that may influence
brand loyalty. The purpose of the model is to research if the factors
influence brand loyalty.
The primary data have been collected through a research we made with
one hundred end-consumers. We interviewed the respondents at the
frozen food-counter in three big supermarkets, Domus, Willy’s and Maxi,
in Kristianstad. We wanted to research their attitudes and behaviours
towards frozen vegetables.
This study shows that consumers do not have knowledge about the
concept invisible quality but know what the factor invisible quality
contains. The factor invisible quality means for example nutrition,
cultivation process and pesticide. The companies need to find a way to
communicate the invisible quality factor to end-consumers and not the
concept. We could not indicate any association between brand loyalty
and the four factors.

4
Table of contents 1............................................................................................................................ 8
INTRODUCTION.............................................................................................. 8 1.1 BACKGROUND............................................................................................. 8 1.2 PURPOSE ..................................................................................................... 9 1.3 LIMITATIONS............................................................................................. 10 1.4 PROBLEM DISCUSSION............................................................................... 10 1.5 PRESENTATION OF THE PROBLEM .............................................................. 10 1.6 DEFINITIONS ............................................................................................. 10 1.7 DISSERTATION STRUCTURE ....................................................................... 11
1.7.1 Disposition over the chapters ................................................................... 12
2.......................................................................................................................... 14
THE METHOD OF THE DISSERTATION................................................. 14 2.1 CHOICE OF SUBJECT .................................................................................. 14 2.2 RESEARCH PHILOSOPHIES.......................................................................... 14 2.3 DEDUCTION AND INDUCTION..................................................................... 15 2.4 LITERATURE.............................................................................................. 15 2.5 DATA COLLECTION.................................................................................... 15 2.6 RELIABILITY AND VALIDITY OF SECONDARY DATA ................................... 16 2.7 THE PROCESS OF THE DISSERTATION ......................................................... 16
3.......................................................................................................................... 18
LITERATURE OVERVIEW ......................................................................... 18 3.1 CONSUMER BEHAVIOUR ............................................................................ 18 3.2 BRAND LOYALTY ...................................................................................... 19
3.2.1 Brand......................................................................................................... 19 3.2.2 Brand Equity ............................................................................................. 19
3.3 QUALITY ................................................................................................... 20 3.3.1 Quality definitions..................................................................................... 20 3.3.2 Perceived quality ...................................................................................... 21
4.......................................................................................................................... 22
BRAND LOYALTY......................................................................................... 22
4.1 WHAT IS A BRAND? ................................................................................... 22 4.2 WHAT IS BRAND LOYALTY? ...................................................................... 23
4.2.1 The loyalty pyramid .................................................................................. 24 4.3 FACTORS INFLUENCING BRAND LOYALTY ................................................. 25 4.4 SUMMARY................................................................................................. 27
5.......................................................................................................................... 28
QUALITY......................................................................................................... 28
5.1 QUALITY CONCEPT.................................................................................... 28 5.2 QUALITY DIMENSIONS............................................................................... 29
5.2.1 Quality as consumer satisfaction .............................................................. 30 5.2.1.1 Kanomodel .............................................................................. 31

5
5.3 PERCEIVED QUALITY ................................................................................ 32 5.3.1 Creating perceived quality........................................................................ 32
5.4 SUMMARY................................................................................................. 33
6.......................................................................................................................... 35
FACTORS INFLUENCING BRAND LOYALTY....................................... 35 6.1 PRICE ........................................................................................................ 35 6.2 EXPERIENCED KNOWLEDGE....................................................................... 36 6.3 COUNTRY OF ORIGIN ................................................................................. 37 6.4 INVISIBLE QUALITY OF PRODUCTS............................................................. 37
6.4.1 Credence quality ....................................................................................... 38 6.4.2 Invisible product quality ........................................................................... 38
6.5 RESEARCH MODEL..................................................................................... 39 6.6 SUMMARY................................................................................................. 40
7.......................................................................................................................... 41
EMPIRICAL METHOD................................................................................. 41 7.1 DATA COLLECTION.................................................................................... 41 7.2 SAMPLE..................................................................................................... 41 7.3 QUALITATIVE AND QUANTITATIVE............................................................ 42
7.3.1 Qualitative................................................................................................. 42 7.3.2 Quantitative............................................................................................... 43
7.4 CONSUMER RESEARCH .............................................................................. 43 7.4.1 Ethical consideration ................................................................................ 44 7.4.2 Interview form ........................................................................................... 44 7.4.3 Questionnaires .......................................................................................... 44
7.4.3.1 Pilot test ................................................................................... 44 7.4.3.2 Category questions................................................................ 45 7.4.3.3 Quantity question ................................................................... 46 7.4.3.4 Scale & Rating questions ..................................................... 46 7.4.3.5 Open questions ...................................................................... 46 7.4.3.6 Ranking questions ................................................................. 47 7.4.3.7 The data collection................................................................. 47
7.5 RELIABILITY AND VALIDITY ..................................................................... 48 7.5.1 Reliability .................................................................................................. 48 7.5.2 Validity ...................................................................................................... 48
7.6 DATA PROCESS.......................................................................................... 49 7.7 METHOD REFLECTION ............................................................................... 50
7.7.1 Opinion poll .............................................................................................. 50
8.......................................................................................................................... 51
ANALYSIS ....................................................................................................... 51 8.1 INTRODUCTION.......................................................................................... 51 8.2 BRAND LOYALTY ...................................................................................... 52
8.2.1 Know which brand to buy before the purchase ........................................ 53 8.2.2 Buy the same brand crossed with the level of brand loyalty..................... 54 8.2.3 “No” on question 9 which factors influence? .......................................... 55 8.2.4 Brand characteristics................................................................................ 56
8.3 PRICE ........................................................................................................ 57

6
8.3.1 The importance of price ............................................................................ 58 8.3.2 Price in other questions ............................................................................ 60
8.4 EXPERIENCED KNOWLEDGE....................................................................... 61 8.4.1 Dissatisfaction........................................................................................... 62 8.4.2 Reasons to change brand .......................................................................... 63 8.4.3 Experienced knowledge in other questions............................................... 64
8.5 COUNTRY OF ORIGIN ................................................................................. 65 8.5.1 Importance of country of origin................................................................ 65 8.5.2 Country of origin in other questions......................................................... 69
8.6 INVISIBLE QUALITY ................................................................................... 69 8.6.1 Knowledge in invisible quality.................................................................. 70 8.6.2 Importance of invisible quality ................................................................. 72 8.6.3 Invisible quality in other questions ........................................................... 74
8.6.4.1 First ranked option ................................................................. 74 8.6.4.2 Second ranked option ........................................................... 76 8.6.4.3 Third ranked option................................................................ 77
9.......................................................................................................................... 78
CONCLUSIONS AND SUGGESTIONS FOR FURTHER RESEARCH.. 78 9.1 INTRODUCTION.......................................................................................... 78 9.2 CONCLUSIONS OF BRAND LOYALTY........................................................... 79 9.3 CONCLUSION OF THE FACTOR PRICE.......................................................... 81 9.4 CONCLUSION OF THE FACTOR EXPERIENCED KNOWLEDGE ........................ 82 9.5 CONCLUSIONS OF THE FACTOR COUNTRY OF ORIGIN ................................. 83 9.6 THE CONCLUSIONS OF THE INVISIBLE QUALITY FACTOR............................ 85 9.7 THE CONCLUSION OF THE DISSERTATION................................................... 87 9.8 REWORKED RESEARCH MODEL.................................................................. 89 9.9 SUGGESTIONS FOR FURTHER RESEARCH .................................................... 90
LIST OF REFERENCES................................................................................ 92 APPENDIX 1 .................................................................................................... 94 A1.1 RESEARCH QUESTIONNAIRE ................................................................... 94 APPENDIX 2 .................................................................................................... 97 A2.1 DESCRIBING THE DATA........................................................................... 97
A2.2.1 Household crossed with how often consumers buy frozen vegetables ... 98 A2.2.2 Main reasons for buying frozen vegetables............................................ 99
APPENDIX 3 .................................................................................................. 101 A3.1 THE PURPOSE OF THE BRAND LOYALTY QUESTIONS.............................. 101 APPENDIX 4 .................................................................................................. 102 A4.1 IMPORTANCE OF SEVERAL BRAND ALTERNATIVES ON THE MARKET ..... 102 APPENDIX 5 .................................................................................................. 104 A5.1 THE PURPOSE WITH THE QUESTIONS IN THE FACTOR PRICE ................... 104 APPENDIX 6 .................................................................................................. 105 A6.1 PRICE IN OTHER QUESTIONS.................................................................. 105

7
APPENDIX 7 .................................................................................................. 106 A7.1 THE PURPOSE WITH THE QUESTIONS IN EXPERIENCED KNOWLEDGE...... 106 APPENDIX 8 .................................................................................................. 107 A8.1 THE PURPOSE OF THE QUESTIONS IN COUNTRY OF ORIGIN .................... 107 APPENDIX 9 .................................................................................................. 108 A9.1 THE PURPOSE WITH THE QUESTIONS IN INVISIBLE QUALITY.................. 108 A9.2 THE REMAINING FOUR RANKED OPTIONS IN QUESTION 21 .................... 109

8
1
Introduction This introduction chapter contains the aim of this dissertation. The
background describes the development within brand loyalty and the
quality area, from visible quality to invisible quality. The chapter
continues with a problem discussion and the main problems. The
chapter ends with a disposition over the chapters.
1.1 Background
In today’s time people are more stressed and they need to take care of
every minute they have to spare. By this, planning becomes a keyword
and will probably be even more important in the future. To be stressed
and go grocery shopping can be very hard. Companies are aware of this
and therefore try to come up with new fast products that will fit every
consumer’s needs. The consumers in return probably feel more stressed
out of the increased amount of products on the market. It is important
that the food products shall be easy and fast to cook but in the same
time have high quality. This leads us into frozen vegetables since it is a
very good example. It is easy to prepare, fast to cook and it is a good
complement to the dinner.
Quality has got greater significance because of the increased amount of
products launched on the market, increased interest in health related
questions etc. The development of new and better quality in products is
also more important than ever for companies to be able to keep up with
their competitors.
Quality differs widely from person to person and to reach out to potential
consumers the companies need to know what quality is for their

9
consumers. The visible quality in products like taste, colour and
consistency must satisfy the consumers’ expectations so they
repurchase the product. Findus, a producer of frozen vegetable products
has made a distinction between visible and invisible quality. Invisible
quality is something that the consumers cannot ascertain either before or
after the purchase (Melin, 1999). Sometimes it is written on the
packages of the products like the amount of nutrition etc. but still the
consumers cannot ascertain it by themselves.
Because of the wider variety of products on the market, the companies
have to create stronger brand loyalty to keep existing consumers but at
the same time also attract new consumers. It is important for the
companies to understand consumers’ behaviour to be able to influence
their choice of brand and create brand loyalty. The consumers’
behaviour in connection with the choice of brand products is influenced
by individual factors, demographic, cultural and socio-economic and by
the decision-making process. A good definition of brand loyalty, which is
open for interpretation, is from Melin, (1999, p. 57):
“Brand loyalty is (1) the biased, (2) behavioural response, (3) expressed
over time, (4) by some decision-making unit, (5) with respect to one or
more alternative out of a set of such brands, and (6) is a function of
psychological processes.
1.2 Purpose
The purpose of this dissertation is to find out if invisible quality is
associated to consumers’ brand loyalty of frozen vegetables. We are
also interested to find out if there are other factors affecting the choice of
brand like experienced knowledge, price and country of origin.
The purpose is also to find a useful material both for the academic world
and Findus.

10
1.3 Limitations
We will only handle products and not services.
Another limitation is that the respondents have to have bought frozen
vegetables at least once before to be included in our research.
1.4 Problem discussion
As mentioned in the background, more and more products are launched
on the frozen vegetable market and at the same time there are also
more foreign brands entering. There are a lot of different brands to
choose from for the consumers and the companies try to give the
consumers as much information they can about their own brand
(Antonides & Van Raaij, 1998). Brand loyalty therefore, becomes an
important part in the course of this dissertation since we are interested to
find out if the factors (experienced knowledge, price, country of origin
and invisible quality) influence the choice of brand.
1.5 Presentation of the problem
How important is invisible quality for brand loyalty and the active choice
of brand of frozen vegetables for the consumers?
Which factors will influence brand loyalty?
1.6 Definitions
Invisible quality; is what the consumers cannot ascertain either before or
after the purchase. It is the amount of nutrition, the trace in the
vegetables from different kinds of pesticide, the cultivation process of the
vegetables etc.

11
1.7 Dissertation structure
The figure is an overview of the chapters’ structure in the dissertation.
We have this chapter structure in the dissertation to give the reader an
overview of what to expect.
Figure 1.1. A model of the chapters in the dissertation
12
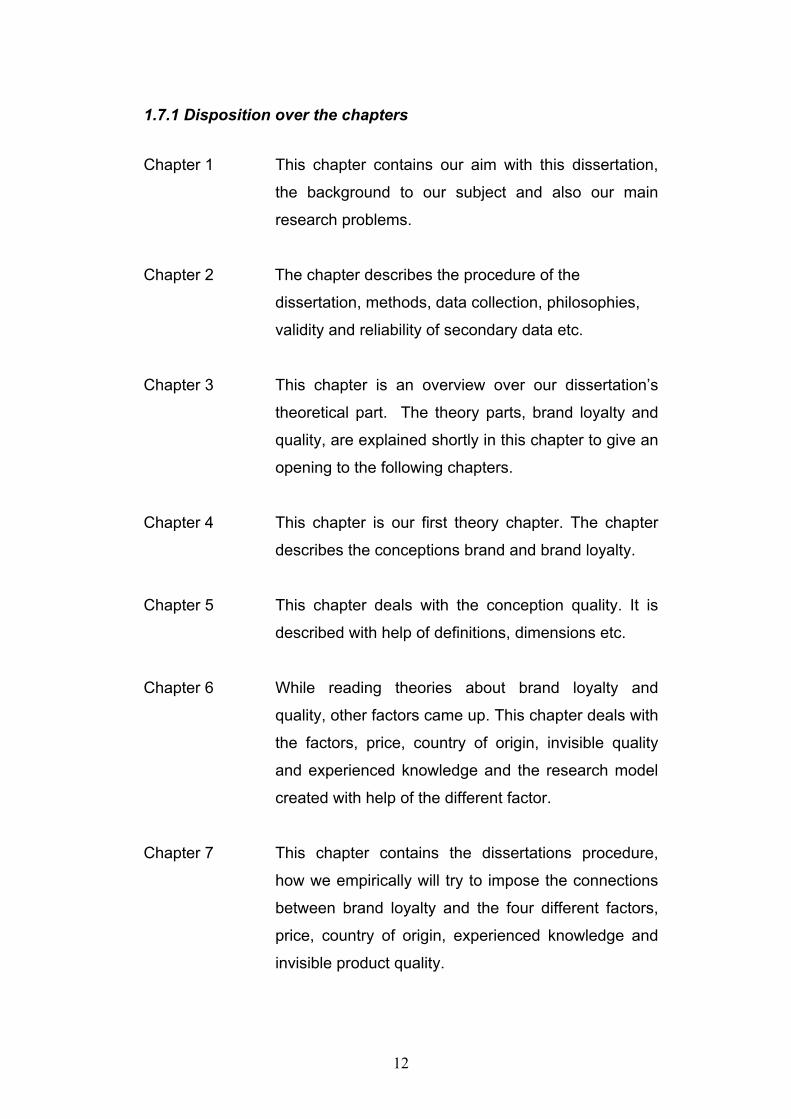
1.7.1 Disposition over the chapters
Chapter 1 This chapter contains our aim with this dissertation,
the background to our subject and also our main
research problems.
Chapter 2 The chapter describes the procedure of the
dissertation, methods, data collection, philosophies,
validity and reliability of secondary data etc.
Chapter 3 This chapter is an overview over our dissertation’s
theoretical part. The theory parts, brand loyalty and
quality, are explained shortly in this chapter to give an
opening to the following chapters.
Chapter 4 This chapter is our first theory chapter. The chapter
describes the conceptions brand and brand loyalty.
Chapter 5 This chapter deals with the conception quality. It is
described with help of definitions, dimensions etc.
Chapter 6 While reading theories about brand loyalty and
quality, other factors came up. This chapter deals with
the factors, price, country of origin, invisible quality
and experienced knowledge and the research model
created with help of the different factor.
Chapter 7 This chapter contains the dissertations procedure,
how we empirically will try to impose the connections
between brand loyalty and the four different factors,
price, country of origin, experienced knowledge and
invisible product quality.

13
Chapter 8 In this chapter we present the data from our research.
We give an analysis within the four factors that may
affect brand loyalty. The data is presented with help of
cross-tabulations to give a better overview of the data.
Chapter 9 Our conclusion is presented in this chapter. We are
answering our main problems. Ideas to following
research subjects within invisible quality are
presented.

14
2
The method of the dissertation
This chapter contains the reason why we decided to write about this
specific subject and also the method we have used for the dissertation’s
procedure. We will describe the two research philosophies our
dissertation is build on: positivism and realism. After the philosophies the
two methods, deductive and inductive, are explained and we have
chosen to write our dissertation from a deductive point of view. It means
that we have proceeded from existing theories. Reliability and validity of
secondary data are also explained in this chapter.
2.1 Choice of subject
We decided to write about this subject after a lesson with our tutor. He
showed us four suggestions from Findus, a company that produces
frozen vegetables etc. We decided us for this specific subject, invisible
quality of frozen vegetables. But we decided us also for another
problem, to find out if the four factors, price, country of origin,
experienced knowledge and invisible quality influences brand loyalty.
2.2 Research philosophies
The philosophies dominating the literature are positivism, interpretivism
and realism. They are different views about the way in which knowledge
is developed and judged. We believe that the dissertation is a mixture of
both positivism and realism. From the positivism point of view because
the information collected through our research will be analysed
statistically and with a detached interpretation. From the other point of
view, realism, we would like to find out the act of people’s food behaviour
and their attitudes toward frozen vegetables.

15
2.3 Deduction and induction
There are two different ways to look at scientific research. The two
methods are deductive and inductive. The inductive method means
starting with empirical studies to gather information and afterward
seeking theories, which explains what has been studied, or developing a
theory from the ground as a result of the data analysis. The empirical
data are used as a ground for generalising conclusions (Saunders et al,
2003).
The reason why we have chosen the deductive method is that the
quantitative research method is often based on existing theories and
former research results. As a background to the existing theories we
have created our own research model, which we will try on a specific
sample. The dissertation is based on existing theories in form of
secondary sources.
2.4 Literature The literature we have used in this work is based on existing theories
within the area: brand loyalty, quality, price, country of origin and
experienced knowledge. Known authors like David Aaker, Kotler and
Armstrong, Michael Solomon, Frans Melin, John Wiley, Bergman and
Klefsjö, Lars Sörqvist, K. Keller etc, have written our used theories. We
read the theories by these authors to get an understanding about the
subjects but also to be able to write about it in the theory part of this
dissertation.
2.5 Data collection
Secondary data are data that have already been collected for other
purposes, perhaps processed and subsequently stored. Two ways
searching for secondary data are library and desk researches (Saunders
et al., 2003). Our research project requires a combination of both
secondary and primary data to answer our research questions. We will

16
use secondary data to learn more about the subject but also to be able
to write our theory parts to give the readers necessary background
knowledge to our research questions. The primary data will be collected
through our research further on in the dissertation. When working with
secondary data it is important to be observant and have a critical attitude
towards the literature (Saunders et al., 2003). The sources we used to
collect information to the theory parts are books and articles. It is
important to be aware that books may contain out-of-date material; this
is why we borrowed the latest copy of the books. We also used articles
from the databases through the University, because the information
available in databases is rather new.
2.6 Reliability and validity of secondary data
The reliability and validity ascribed to secondary data are functions of the
method by which the data were collected and the source. Looking at the
source of the data can make a quick assessment of both reliability and
validity. It is particularly important to look up the source when searching
information via the Internet (Saunders et al., 2003). This is why we
searched for information via the University’s databases. Though the
information seems valid, it is important to have a critical sight towards
the information, which we believe we had. The other source we used to
the theory parts is books; tough it is printed material with known authors
it would be wrong to rely on it completely. Secondary data that fail to
provide the information needed to answer the research questions or
meet the objectives will result in invalid answers (Saunders et al., 2003).
In chapter seven we have written about the reliability and validity for our
research data and also about quality and quantity.
2.7 The process of the dissertation
In the beginning of the dissertation we wanted to write only about
invisible quality but we felt that the information written about invisible

17
quality and the amount of time was not enough so we decided to build
the dissertation around brand loyalty, but invisible quality still takes a big
part of the dissertation.
In the beginning we searched books in a wide area within marketing and
when deciding for what theory parts we wanted to add in the
dissertation, we specified our research to books within brand loyalty,
consumer behaviour and quality.
After the theory parts, consumer behaviour, brand loyalty and quality
were finished, we met our tutor for guidance. After the meeting we
decided to narrow down the chapter about consumer behaviour and
make an introduction to the theory part instead, as a literature overview
(chapter three).
While reading the literature for consumer behaviour, brand loyalty and
quality, other factors came up which we felt would be important for the
dissertation; experience knowledge, price and country of origin. With
help of these factors we designed a research model in chapter six, which
we will use in our research to see which factors affect brand loyalty.
After the theory chapters were finished, at least temporary, we wanted to
start with the research so we could go on with the dissertation, but
before we could begin, a questionnaire had to be done.
After we collected the data we used SPSS to process the data material
to be able to analyse the information statistically. After the input of the
data we made cross tabulations, different kinds of diagrams and analysis
of the material. After the chapter about analysis we began with the last
chapter of the dissertation, conclusions. The chapter ends with three
suggestions for further research studies within the invisible quality area.

18
3
Literature overview
This chapter is an overview of the dissertation’s theoretical part. The
theory parts, brand loyalty and quality are discussed in this chapter to
give an opening to the following theory chapters. As an introduction to
brand loyalty we have explained consumer behaviour. It is relevant
because a lot within the consumer marketing area is connected with
consumer behaviour. It is fascinating for marketing people to understand
why consumers behave like they do in different purchase situations.
3.1 Consumer behaviour
Consumer behaviour is important for a number of reasons. From the
marketing perspective, the study of consumers’ behaviour is important to
be able to forecast and to understand consumers’ demand for different
products, as well as their brand preferences (Antonides & Van Raaij,
1998). In recent years consumers’ purchasing habits, their need for
different products and different brands are constantly changing. It has
been necessary for both manufacturers and retailers to continuously
analyse consumers’ needs, how to improve marketing, products and
communication to meet the consumers’ needs more directly (Birn, 1992).
From the consumers’ perspective, it is important to inform the
consumers’ about the alternatives open to them on the market
(Antonides & Van Raaij, 1998).
Consumer behaviour can be seen in different ways. On the one hand
consumption can been seen as concrete, physical and observable
behaviour like the purchase of a milkshake. On the other hand,
consumer behaviour includes mental operations, which are not directly
observable, like a decision to engage in low-fat dieting and to reject

19
cakes and snacks. (Kotler & Armstrong, 1999). Consumer behaviour can
also be impulsive like for an example, an order in a bar. Often consumer
behaviour is a habitual behaviour like buying the same brand every time
(loyalty) or taking the same train to work every day (Antonides & Van
Raaij, 1998).
3.2 Brand loyalty
Consumers can be loyal toward different objects: a project group, a
brand, a store etc. This is a reflection of consumers’ satisfaction toward
different objects, and this satisfaction may lead to brand loyalty.
(Söderlund, 1997).
3.2.1 Brand
The word brand is derived from the Old Norse word brand, which means,
“to burn” as brands were and still are the means by which owners of
livestock mark their animals to identify them (Wiley, 1992). It is the same
as for brands today; products are marked so the consumers can identify
them. According to Melin (1999), a consumer’s relationship to a specific
brand can over time develop to brand loyalty. The consumer will choose
the specific brand and purchase it regularly.
By creating a strong personality and identity, the brand will be unique
and will not disappear in the large amount of other company brands. It is
the brand that in the first place creates the personality and identity for a
product but quality also has a large impact (Keller, 2003).
3.2.2 Brand Equity
Brand Equity is an important conception within the marketing area and
corresponds to the values that a product associates by carrying a certain
brand. Aaker (1991) points out the importance of the components
constituting Brand Equity; brand loyalty, name awareness, perceived

20
quality, brand associations and other proprietary brand assets− patents,
trademarks etc. We have decided to make a limitation and only explain
perceived quality and brand loyalty, because the other parts of brand
equity are outside our dissertation’s framework and we find them
irrelevant for this work.
Brand loyalty of the consumer base is often the core of a brand’s equity.
It reflects how likely a consumer will be to switch to another brand,
especially when that brand makes a change, either in price or in product
features (Aaker, 1991). A brand generates a quality signal to the
consumers, which in return can lead to brand loyalty (Keller, 2003). The
level of consumer satisfaction is connected to the consumers’
expectations and experiences but is also affected by the image and the
reputation the product has (Bergman & Klefsjö, 2003).
3.3 Quality
Quality is a very important factor for the consumers and their choice of
product and it can be so strong that it may lead to brand loyalty
(Sörqvist, 2000).
3.3.1 Quality definitions
The quality concept has changed over time but was originally defined as
“in accordance with demands and specification” (Sörqvist, 2000, p 11).
Today the most common definition of the quality concept is “ability to
carry out the consumers’ needs and expectations” (Sörqvist, 2000, p 11).
The later definition is consumer-orientated as opposed to the first
definition where it was producer orientated. In the first definition the
importance is to do things right while the definition today the importance
is to do right things. It is a big difference since in the latest definition the
consumers’ needs and demands are in the center and therefore it is
important to deliver products with the right quality that will satisfy

21
consumers’ expectations. Consumers’ expectations will also influence
how they experience the product quality.(Sörqvist, 2000).
In the different definitions about quality there are most of the times a
common factor and it is the consumer concept. According to the
definitions above and also in general, quality can be seen as a relation
between the product and its consumers’ instead of a pure product
attribute (Bergman & Klefsjö, 2003).
3.3.2 Perceived quality
According to Aaker (2002) is that perceived quality reflects a measure of
“goodness” that spreads over all elements of the brand like thick syrup.
Aaker (2002) also mentions how to create perceived quality and talks
about four differences, which will be more analysed in the chapter about
quality.
We will now from the literature overview continue with chapter four were
we will discuss brand loyalty in a more detailed form.

22
4
Brand loyalty
This chapter contains the conceptions brand and brand loyalty. Because
of the enormous supply of brand products, it is difficult for the consumers
to purchase every single product. When the consumers finally find a
product that suits and fulfils their needs and expectations they will
hopefully repurchase it year after year. Because the dissertation is build
round brand loyalty our ambition is to explain it as thorough as possible
so the reader will get good background-knowledge to the following
chapters.
4.1 What is a brand?
A brand is necessary for the consumers to be able to identify a mass-
produced product. This phenomenon became tangible during the
industrial revolution, when the progress for example production,
distribution, packing and media created the foundation for mass
communication of branded products (Melin, 1999). The word brand is an
ordinary word, but it is difficult to find a homogeneous definition. Kotler
and Armstrong (1996, p 571) use the following definition to explain the
word brand:
“…a name, term, symbol, or design, or a combination of them, which is
intended to signify the goods or services of one seller or group of sellers
and to differentiate them from those of competitors.”
This is a technical definition because Kotler describes different parts that
compose a brand: a name, figures etc. Another definition is from David

23
(1992, p 14). He means that a brand is more than just a name or a
symbol:
“Today’s great brands are personalities, as intrusive in our culture as film
stars, sports heroes, or fictional characters.”
Chernatony & McDonald (1997), add another aspect to the word brand
when they maintain:
“A successful brand is an identifiable product, person or place,
augmented in such a way that the buyer or user perceives relevant
unique added values which match their needs most closely.
Furthermore, its success results from being able to sustain these added
values in the face of competition”.
This definition by Chernatony & McDonald shows that a brand’s success
depends on the consumers’ satisfaction. In our opinion a brand is a
name, a symbol etc. something that differentiates a company’s products
from their competitors’ products. A brand is also something that
characterizes a company and its products. It is essential to assign an
identity to a product so the consumers can discern a company’s
products from the competitors’ products.
A brand creates unique associations to consumers’, which leads both to
brand loyalty and competition advantages. In other words, the most
distinguishing between a brand and its unbranded commodity
counterpart is the total sum of consumers’ perceptions and feelings
about the product’s attributes and how they perform (Keller, 2003).
4.2 What is brand loyalty?
“Reputation, reputation, reputation! O! I have lost my reputation. I have lost the immortal part of myself and what remains is bestial.”
William Shakespeare, Othello, act 2

24
Höglund & Lingbell (1996, p25) represent the following definition of
brand loyalty:
“Repeat behaviour is not the same as loyal behaviour. Repeat behaviour
can be bought through bribes. Spend 2/3 of your marketing dollars
featuring only price and you are selling products, but you are not building
brands. You are building deal loyalty, not real loyalty.”
The above definition shows clearly that brand loyalty is not created
because the consumer is buying a certain brand a couple of times. The
conception brand loyalty means that the consumer is creating a good
image of a brand and the brand advantages, is willing to invest time,
energy, money, and other resources in the brand beyond those
expended during purchase or consumption of the brand (Keller, 2003).
4.2.1 The loyalty pyramid
There are different levels of brand loyalty and consumers belong to one
of the levels. It is important for the company to know how the consumers
are divided among the levels (Aaker, 1991).
Figure 4.1. “The loyalty pyramid”
Aaker A. 1991, p 18

25
At the bottom of the pyramid is the non-loyal buyer who is completely
indifferent to the brand. The buyers that belong to the second and third
level are difficult to attract because they have switching costs− cost in
time, money or performance risk. To attract these buyers, competitors
need to overcome the switching costs by offering an inducement to
switch or by offering a benefit large enough to compensate. On the
fourth level there are buyers that truly like the brand and they can be
termed friends. At the top level are the committed consumers. The brand
is very important to them; they even recommend the brand to others.
The value of the committed consumer is not so much the business, more
the impact they have on others (Aaker, 1991). Because consumers with
a great deal of attitudinal attachment to a brand may state that they
“love” the brand and describe it as one of their favorite possessions. Or
they view it as a “little pleasure” that they look forward to, things that may
impact people in their surrounding (Keller, 2003).
Brand loyalty is an important asset to a brand intensive company, which
can be illustrated in the following quote (Melin & Urde, 1991. p24):
“A consumer franchise is measured by the number of regular purchasers
and the frequency and continuity of their purchases, indicating a loyalty
that withstands competitive attacks. The consumer franchise of our
brands is the Group’s most valuable asset. It is achieved by marketing
brands offering unique and relevant benefits, identifiable by brand name
and guaranteeing consistent quality.”
4.3 Factors influencing brand loyalty
While reading the literature to this chapter about brand loyalty other
factors appeared that might affect brand loyalty. The factors are
experienced knowledge, price, country of origin and invisible quality.
Invisible product quality is the fourth factor but the purpose with the
dissertation has been all along to research if invisible quality influences

26
the active choice of brand of frozen vegetables. Even though invisible
product quality belongs to the coming chapter about quality we will bring
it up here with the other factors.
We decided to include these factors in the dissertation to research if they
influence brand loyalty or not.
Experienced knowledge signifies the experience consumers have in
terms of how many times they have been in touch with the product. Habit
is a kind of experienced knowledge, a consumer who buys a product
continuously because he/she has good experienced knowledge about a
brand. Söderlund (2001) points out that habit can create loyalty because
the product creates some form of harmonization for the consumer and in
return makes the consumer loyal towards the brand.
The price factor can been seen in a way that if a consumer is willing to
pay 10 percent more to buy Coke rather than a Pepsi, shows that price
is associated with brand loyalty (Aaker 2002). Solomon (2001) thinks
that a high price can signal higher quality, and high quality may influence
brand loyalty.
A product’s country of origin is important information in the consumers’
decision-making process. Consumers choose among products made in
many different countries and consumers’ reactions to imports are mixed.
Some consumers’ assume that products made overseas are of better
quality than domestic. Meanwhile some consumers have lower
perceptions about imported products. Ethnocentric consumers are very
brand loyal though they feel it is wrong to buy products from other
countries (Solomon 2001).
Invisible product qualities are qualities (hereafter we will call it invisible
quality), which are for the consumer invisible both before and after the
purchase. This kind of invisible dimensions are quality, which the
average consumer never can ascertain by him/herself. If the consumers

27
trust the party giving the information, it may lead to brand loyalty in time
(Hoffmann, 2000).
4.4 Summary
This chapter has dealt with the conceptions brand and brand loyalty. A
brand is necessary for the consumers to be able to identify a mass-
produced product. The brand creates unique associations to the
consumers, which may lead to brand loyalty, but it is not created
because the consumers are buying a certain brand a couple of times.
The conception brand loyalty means that the consumers are creating a
good image of a brand and the brand advantages, and are willing to
invest time, energy, money, and other resources in the brand beyond
those expended while purchasing or consumption of the brand. It is the
brand that in the first place creates the personality and identity for a
product but quality has a large impact (Melin & Urde, 1991).
This chapter has also dealt with the four factors, price, experienced
knowledge, country of origin and invisible quality, which may or may not
influence brand loyalty.
In the next chapter, quality will be discussed closer with definitions,
different quality factors, relations, perceived quality etc.
28
5
Quality
In the chapter about brand loyalty, the quality expression was mentioned
and therefore it is natural to go further with this chapter about quality.
Quality is a word that is often used these days, but it is hardly anyone
who can explain exactly what it means because it differs widely from
people to people. We have tried to explain it as thorough as possible,
with a help of definitions, different dimensions, consumer satisfaction
and perceived quality.
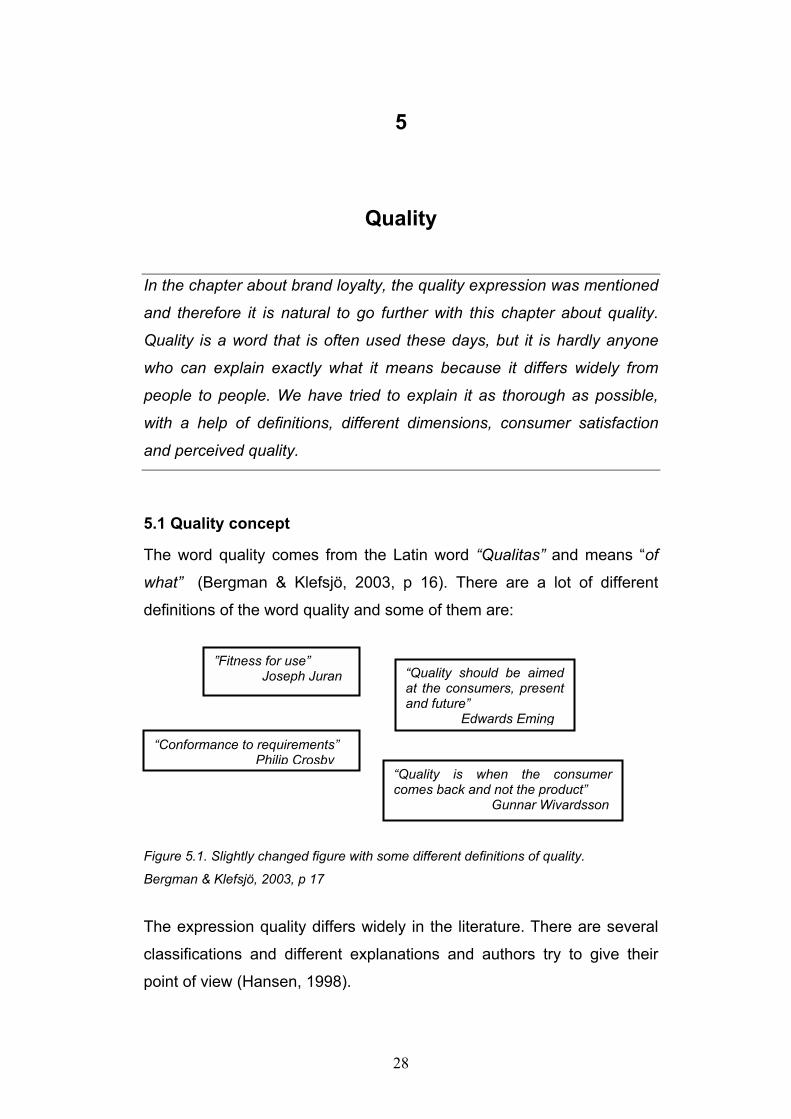
5.1 Quality concept
The word quality comes from the Latin word “Qualitas” and means “of
what” (Bergman & Klefsjö, 2003, p 16). There are a lot of different
definitions of the word quality and some of them are:
Figure 5.1. Slightly changed figure with some different definitions of quality.
Bergman & Klefsjö, 2003, p 17
The expression quality differs widely in the literature. There are several
classifications and different explanations and authors try to give their
point of view (Hansen, 1998).
”Fitness for use” Joseph Juran “Quality should be aimed
at the consumers, present and future” Edwards Eming
“Conformance to requirements” Philip Crosby
“Quality is when the consumer comes back and not the product” Gunnar Wivardsson

29
Quality can been seen as a physical characteristic in a product, service
or a process and the quality concept can be scaled down into different
elements until reaching a couple of independent characteristics that
together give the product (service or process) its quality (Sörqvist, 2000).
The quality concept is often used these days and daily we see this
concept in media and advertising. Some people think of quality as luxury
and associate quality with high costs while others think of quality as
good durability. In this way they avoid unnecessary costs since the
product is of a high standard.
The quality concept has changed over time and was originally defined as
“in accordance with demands and specification” (Sörqvist, 2000, p 11).
According to Sörqvist (2000), this definition leads to producer-orientation
and is most common when the producer formulates the demands and
specifications and thereafter tries to fulfill them. By this, the risk of
creating a gap grows between the actual consumer needs and demands
the producer tries to fulfill.
Quality has, on the world market, become a very important competitive
advantage and makes the companies constantly working towards
quality-improvements. They have to take advantage of those
improvements to get new market shares but also to keep the existing
market.
5.2 Quality dimensions
The quality concept can be seen from different angles and one of them
is product quality in merchandises. Here are some different dimensions
of the quality concept (Bergman & Klefsjö, 2003):
Performance characteristics are important for the consumers on the
concerned market segment.

30
Reliability, as a measure how often defects occur and how serious they
are.
Maintainability, as a measure how easy or hard it is to discover,
localize and repair the damage.
The above-mentioned dimensions affect experienced quality as well as
marketing strategy and the consumers’ preconceived opinion.
Merchandise quality is decided through construction, production and
distribution and also how the relations with the consumers are handled.
This is why people sometimes talk about (Bergman & Klefsjö, 2003):
• Developed quality
• Production quality
• Deliver quality
Developed quality means that the merchandise is constructed in such a
way that it can satisfy the consumers’ needs. Developed quality affects
the consumers’ experience of quality when it comes to usefulness,
reliability and user friendliness. A good construction quality is therefore
necessary but not enough to create a good product.
Production quality means that the product produced or service carried
out; fulfill those specifications laid down in the development. The
production quality is the part that has traditionally got the most attention.
Deliver quality, to deliver the agreed product at the agreed delivery time
and to the agreed delivery place.
5.2.1 Quality as consumer satisfaction
According to Bergman and Klefsjö (2003), consumer satisfaction is the
final measurement of quality and it is always the consumer who decides
whether the product is of high quality or not.

31
5.2.1.1 Kanomodel
It is not enough to satisfy the consumers or to avoid dissatisfaction, but
also too exceed their expectations. Noriaki Kano created a model at an
early stage of different dimensions of consumer satisfaction and
expectations. The model is called the Kanomodel.
Figure 5.2 “The Kanomodel of consumer satisfaction”, Bergman & Klefsjö, 2003 p. 307
There are three groups of consumer satisfaction (Bergman & Klefsjö,
2003):
Basic needs: If the basic needs are not fulfilled, the consumer will be
dissatisfied. These basic needs are so obvious for the consumer that
they are not mentioned at the inquiry of consumers’ wish.
Expressed needs: These needs answer the consumers’ expectations
and experiences that are seen as important. By being better than the
competitors at these dimensions the company will win new consumers.
Unconscious needs: These needs are impossible for the consumers to
demand since they have not experienced them but by satisfying them
you give the product an attractive value. By finding these kinds of

32
dimensions the company can get great competitive advantages towards
other companies and get loyal consumers.
By satisfying basic needs the company creates necessary quality and by
fulfilling expressed needs it creates expected quality. Finding and
satisfying unconscious needs, the company creates something extra,
attractive quality, which often leads to loyal consumers (Bergman &
Klefsjö, 2003).
5.3 Perceived Quality
Perceived quality is usually the heart of what consumers are buying and
in that senses a bottom-line measure of the impact of a brand identity.
When perceived quality in a product improves, most often all other
elements of consumers’ perceptions of the brand also change to the
better (Aaker, 1991).
5.3.1 Creating perceived quality
Generally it is quite impossible to achieve perceived quality, as long as
the claim has no substance. If a company wants to generate high quality
to their consumers it is important to understand what quality means to
different segments. Aaker (2002) talks about four differences between
perceived quality and actual quality in a variety of reasons.
First, consumers may be influenced by a previous image of poor quality
and because of that the consumers are not making any new claims of
the product or they may not even take the time to verify them. Examples
are Suntory Old Whiskey, Audi automobiles and Schlitz beer. They
found out that making excellent products is not enough to erase
consumers’ doubts raised by accidentally bad quality.
Secondly, a company may achieve quality in a dimension, which the
consumer don’t consider important. A company dramatically change its
33
process activities in some way but the consumer’s evaluation is a huge
disappointment. This could either show that the consumers did not
notice the changes or did not recognize any benefit in them. It is
important that investments in quality improvements of any kind occur in
areas that consumers will notice.
Thirdly, most of the time consumers rarely have all the information to
make a rational judgement of quality. Even if they would have the
information, they would probably not have the time and motivation to
process. It is important to understand the little things consumers’ use as
their motive making a judgment of quality. Consumers kick a car’s tiers
to judge its hardness. The tiers must be hard since that is what the
consumers are looking for.
Fourthly, since the consumers most often do not know how to judge
quality, they look at wrong factors. Aaker (2002) mentions an example
about a jewellery store and how they need to educate new buyers about
the quality not necessarily reflects the price tags or carat claims.
Melin (1999) talked about another level of quality that creates value for
the consumers. In the company Findus an interesting distinction is made
between visible and invisible quality. The invisible quality aspect Findus
stands for is not fully appreciated by consumers because they can not
ascertain that kind of quality. Melin thinks that invisible quality is
important but the companies need to find a way to communicate with the
consumers.
5.4 Summary
Quality differs among consumers but has on the world market become
an important competitive advantage, which makes the companies
constantly work toward better quality-improvements. They have to take
advantage of those improvements to get new market shares but also to
keep the existing market.
34
Unconscious needs are needs impossible for the consumers to demand
since they have not experienced them. By finding these kinds of
dimension the company can get great competitive advantage towards
other companies and get loyal consumers. If the consumers once found
a product, complied with their expectations, they will probably continue
to buy the product. If invisible quality complies with their expectations, it
can lead to brand loyalty in time.

35
6
Factors influencing brand loyalty
While we read the literature to the theory parts brand loyalty and quality,
new factors appeared regarding our subject. The four factors are country
of origin, price, experienced knowledge and invisible quality. We like to
find out if these factors influence brand loyalty but first we need to
discuss them a little bit closer and will in this chapter explain them as
thorough as possible. The chapter continues with our research model, it
is presented and explained.
6.1 Price
The base in loyalty is the amount a consumer will pay for the brand in
comparison with another brand offering similar or fewer benefits. If a
consumer is willing to pay 10 percent more to buy Coke rather than a
Pepsi, shows that price is associated with brand loyalty (Aaker, 2002).
Price can also be the only relevant product attribute for some consumers
and only follows those attributes and do not really care of other
characteristics a brand can have (Solomon, 2002).
Consumers’ price sensitiveness depends on many different factors like
knowledge of substitute, consumers’ possibilities to compare
competitors, cost importance for the consumers and their experienced
pleasure and quality (Sörqvist, 2000).
Urala and Lähteenmäki (2003) mention in their article that in hierarchical
value maps it is described that the consumers’ choice-reasons are
related to avoid disappointments from paying to expensive price
compared to product quality like taste, colure etc. The brand choice data
is aggregated though it is collected at the level of the individual buyer.
He or she may make purchases on behalf of several members in the

36
household. Foxall (2003) thinks that it still does not explain why the
cheapest brand is not universally favoured. Some consumers select
exclusively among the highly differentiated and heavily advertised
premium-priced brands. Such brands differ only slightly if at all in terms
of psychical formulation and function from retailer-label or economy
brands that cost considerably less.
6.2 Experienced knowledge
Söderlund (2001) points out that habit can create loyalty because the
product creates some form of harmonization for the consumer and in
return makes the consumer loyal towards the brand. The consequence
is that the consumer is insensitive to rival products and independent
experts.
Experienced knowledge signifies the experience consumers have to a
product in terms of how many times they have been in touch with the
product (Söderlund, 2001). The more experienced the consumers get
the more knowledge they have about the brand and it is the repetition
that signifies the loyal consumers’ activities. Although a repetitive
behaviour without any reflection and motivation only brings out a limited
knowledge about the brand (Solomon, 2002). The experienced
consumer notices the product wherever it shows up− in the store, at
friends’ house, in a movie etc. It means that it is difficult for the consumer
not to notice the product, so in environments with different restrictions
like, lack of time or a lot of brand products, the consumer notice the
product easy (Söderlund, 2001).
Brands are seen as a special quality cue since they allow consumers to
draw on their previous experiences with the product. If the product was
of satisfactory quality experience after the purchase, there is a big
chance that the consumer will repurchase the brand again, just as we
explained in the brand loyalty chapter.

37
Consumers that make purchase decisions form expectations and after
the purchase, the product will lead to some kind of experience. The
relationship between expectations and experiences is most often
believed to determine consumers satisfaction and if they will repurchase
the product (Grunert, 2002).
6.3 Country of origin
Country of origin is important for the consumer’s evaluation process so it
is relevant to examine if country of origin is an important quality indicator
and if so, for what kind of consumers this is true (Hoffmann, 2000).
According to Papadopoulos (1987) there is a belief that consumers will
rate their own country’s products as better than those from elsewhere.
The tendency, when consumers prefer products from the own country
than those from other countries, is called ethnocentrism. Ethnocentric
consumers are likely to feel it is wrong to buy products from other
countries, particularly because of the negative effect this may have on
the domestic economy (Solomon, 2002). Many government sponsored
“buy-domestic” campaigns are based on this premise. Yet findings in this
study do not necessarily support this hypothesis and suggest that there
are “cross-cultural” variations in the assessment of products from one’s
owns country.
6.4 Invisible quality of products
The consumers demand value added food products instead of greater
quantities of food. This demand forces food companies to innovate new
process technology, formulate new food products as well as upgrade
existing product lines in order to thrive (Imram, 1999).

38
6.4.1 Credence quality
Credence qualities are qualities, which are for the consumer invisible
both before and after the purchase. This kind of invisible dimensions are
quality which the average consumer never can ascertain by him/herself,
they just have to trust other judgements like e.g. weather the tomato is
healthy or organically produced. A very good example of invisible quality
is the technology used in the food production since the average
consumer cannot ascertain that the product really is for example,
guaranteed free from genetic modifications. Health related qualities are
also examples of invisible quality. Consumers do not usually expect to
feel healthier because they have eaten a product that is supposed to be
good for their health (Grunert, 2002).
Marketing food products that have invisible characteristic dimensions are
most often somewhat problematic to market and credibility-enhancing
devices are needed. The marketing of organic products gives us a good
example of this since different methods have been used in different
countries. E.g. Denmark has this government-controlled little label of the
Royal Crown that will inform the consumers that the product is organic.
In the absence of credible information about the invisible quality and its
characteristics consumer may, within the limits of their ability, try to infer
these characteristic of the invisible quality from other cues. But that
could also work the other way around like e.g., once the credible
information about invisible quality becomes available and reaches the
consumer, he or she may also make inferences to other quality
dimensions like believing that the organic vegetable tastes better or is
healthier (Grunert, 2002).
6.4.2 Invisible product quality
Invisible qualities are hidden qualities that the consumers cannot detect
by repurchase or through normal use. With respect to food, such
39
qualities can be animal welfare process, vegetables cultivation process
etc. Therefore, given that consumers demand such qualities, information
has to be communicated to the consumer by some trustworthy party to
avoid disappointments. If the consumers trust the party giving the
information, it may lead to brand loyalty in time (Hoffmann, 2000).
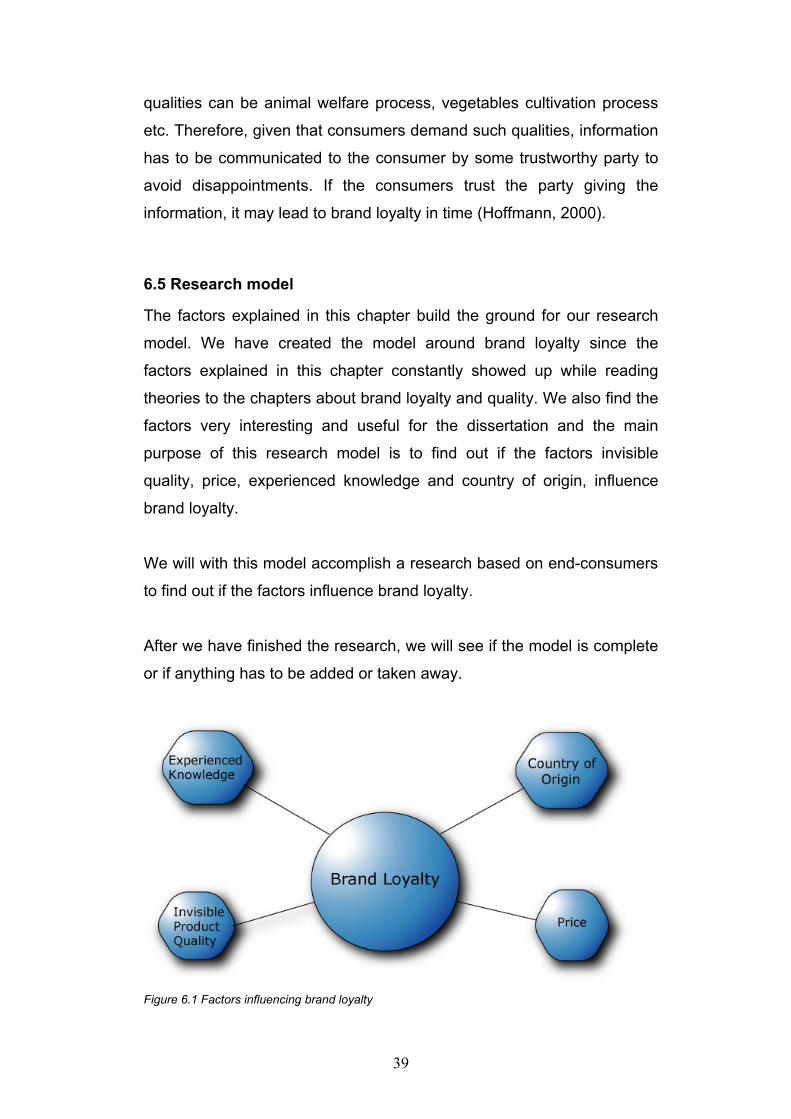
6.5 Research model
The factors explained in this chapter build the ground for our research
model. We have created the model around brand loyalty since the
factors explained in this chapter constantly showed up while reading
theories to the chapters about brand loyalty and quality. We also find the
factors very interesting and useful for the dissertation and the main
purpose of this research model is to find out if the factors invisible
quality, price, experienced knowledge and country of origin, influence
brand loyalty.
We will with this model accomplish a research based on end-consumers
to find out if the factors influence brand loyalty.
After we have finished the research, we will see if the model is complete
or if anything has to be added or taken away.
Figure 6.1 Factors influencing brand loyalty

40
6.6 Summary
While reading the literature to the theory parts, quality and brand loyalty,
the factors invisible quality, price, experienced knowledge and country of
origin constantly came up.
Invisible quality is invisible for the consumer both before and after the
purchase; an example of invisible quality is the amount of nutrition etc.
Experienced knowledge signifies the experience consumers have to a
product in terms of how many times they have been in touch with it. This
can turn to a habit and can lead to brand loyalty.
The base in loyalty is the amount a consumer will pay for the brand in
comparison with another brand offering similar or fewer benefits. This
shows price is connected to brand loyalty.
Country of origin is important for the consumer’s evaluation process;
there is a belief that consumers will rate their own country’s products as
better than those from elsewhere.
We have by these factors created a research model, which will be used
for the research on a sample.

41
7
Empirical method
This chapter contains the empirical method of the dissertation. How we
empirically try to impose the association between brand loyalty and the
four different factors, price, country of origin, experienced knowledge
and invisible product quality. Further, we also explain how we have
gathered primary information through interviews, the working process for
the research and interpretation and criticism of the questions.
7.1 Data collection
The secondary information we have found in books and articles are not
enough for our dissertation. We also need to collect primary information
from sources like interviews. The research is based on an opinion poll
with end-consumers of frozen vegetables. The aim with this research is
to impose if there is any association between brand loyalty and the four
factors, price, country of origin, experienced knowledge and invisible
product quality.
7.2 Sample
This dissertation is based on end-consumers of frozen vegetables. To be
able to fulfil the purpose of this dissertation and in a structured way find
out if there is any association between brand loyalty and the four factors,
we will make interviews with one hundred end-consumers. The amount
we have decided to interview is a reasonable sample to be able to get a
fair picture of our research subject.
There are different ways to select a sample and we have decided to use
an aimed sampling method. It means that we did not select the

42
respondents haphazardly instead we selected them systematically. The
criterion for the respondents to be included in our research is that they
once before have bought frozen vegetables.
We will make a questionnaire and interview people in three big
supermarkets in Kristianstad. We have chosen Domus, Maxi and Willis.
We chose those supermarkets because they are the three largest in
Kristianstad and because their consumers differ widely.
7.3 Qualitative and quantitative
Primary data can be qualitative or quantitative. Qualitative research can
be seen as an unstructured, primarily exploratory methodology based on
small samples, intended to provide insight and understanding. A
quantitative research methodology seeks to quantify the data and,
typically, applies some form of statistical analysis (Birks & Malhotra,
1999).
7.3.1 Qualitative
In a qualitative method, the investigator is more subjective and seeks
meanings through unstructured interviews. Scientists and readers allow
by this method to create a comprehensive view and good understanding
of the research. The investigator has by this a great opportunity to
understand the total connection in a certain situation (Seymour, 1992).
In this case, testing the responds validity is not the most important thing,
it is more important that emphasize is on the collection of the information
(Holme & Solvang, 1991).
There are circumstances where a qualitative research can be used to
present detailed descriptions that cannot be measured in a quantifiable
manner. For example, describing characteristic and styles of music that
may be used in advertising campaign (Birks & Malhotra, 1999).

43
7.3.2 Quantitative
The quantitative method means to do a data collection with the help of
direct observations (Seymour, 1992). Quantitative research is more
formalised, structured and also more influenced by the control from the
scientist view of point. The target of this choice of method is to be able to
do a comparison based on the conclusion from the data collection (Patel
& Tebelius, 1987).
We have chosen a quantitative method because we will use a formalised
and structured questionnaire for the sample compared to the qualitative
method where the questions are more unstructured. In a quantitative
research method the results are presented numerical and it makes it
easier to analyse the answers.
7.4 Consumer research
In an earlier chapter we talked about our brand loyalty model and the
different factors, which may influence it. We did an opinion poll based on
our research model and the different theory parts in a way of trying to
indicate any association between brand loyalty and the four factors. This
opinion poll was carried out in chosen supermarkets among the
consumers at the frozen-food counters. Our main purpose of this opinion
poll was to test our brand loyalty model on the market. With the help of
different theories, we wrote questions to the questionnaire about the four
factors. Among other things we want to find out the consumers’ attitude,
motive, knowledge and behaviour regarding their purchase of frozen
vegetables. We continued our research until the required sample of one
hundred end-consumers had been reached. We asked one hundred and
ten persons at the three supermarkets, before we reached our required
sample. The missing value was mostly young people that did not have
the time to answer our questionnaire.

44
7.4.1 Ethical consideration
It is important to inform the store managers before the research take
place in the stores. We called the managers one day before to inform
them about the aim of the research and to ask them if it was all right for
us to do the research in the stores.
All the respondents we interviewed are anonymous.
7.4.2 Interview form
At the different supermarkets and their frozen-food counters we did a
face-to-face interview. A face-to-face interview leads to street interviews,
in our case, store interview. In this kind of interviews, respondents are
stopped in the stores while they are shopping and they may be
questioned there and then. The great advantage of this kind of research
method is that it is more efficient for the interviewer to come to the
respondent than it is for the respondent to come to the interviewer
(Malhotra & Birks, 2000).
7.4.3 Questionnaires
A questionnaire is a method of obtaining specific information about a
defined problem so that the data, after analysis and interpretation, result
in a better appreciation of the problem. It is an important element in the
total research design. Research questionnaires can be applied in several
ways like personal interviews, telephone, mail etc. and as mentioned
earlier, in our case it was face-to-face interviews. The type of the
questionnaire will depend on the research method and that in turn will be
dependent on the nature of the problem being investigated, the kind of
population sampled and the sample size (Chisnall, 1997).
7.4.3.1 Pilot test
Before the final questionnaire was done we had to make a pilot test. We
wanted to see if something was unclear. The purpose of the pilot test

45
was to refine the questionnaire so the respondents would have no
problems to answer the questions and no problem for us to record the
data. For a pilot test an appropriate number of respondents are ten
(Saunders et al., 2003). We decided to interview twenty people at
Domus in Kristianstad around noon on a Thursday. We think twenty
people are a reasonable sample to test the questionnaire. The
conclusion from the pilot test was that we had to change some of the
questions to be more understandable. We also emailed the
questionnaire to Findus for guidance.
7.4.3.2 Category questions
Our final questionnaire contained twenty-one questions and eight of
them were category questions (Nr 1, 2, 4, 5, 8-10 and 12). Category
questions are designed so the respondent’s answer can fit only one
category. These kinds of questions are very useful to collect data about
behaviour or attitudes. In our case, we wanted to see what kind of
preferences the respondents have. The number of categories included
without affecting the accuracy of responses is dependent on the type of
questionnaire. The sample shall not have more then five categories to
choose from (Saunders et al., 2003).
The first two questions in the questionnaire were used to define gender
and age. The youngest age group in the questionnaire is -20 and the
oldest is 71-. By these age groups we welcomed everybody that once
before have bought frozen vegetables and wanted to answer the
questionnaire. The gender and age question was of importance to see if
there were any differences between the genders and age groups
connected to other questions in the questionnaire.
In questions four we asked for the total income in the household and in
question five we asked how often they buy frozen vegetables. We gave
them options from once a week to a couple of times per year. By this we
want to see if there are different preferences connected to the income

46
and or the amount of times they buy frozen vegetables. Questions eight
to ten and twelve were asked to see the respondents brand loyalty and
their attitudes toward a brand.
7.4.3.3 Quantity question
In one of the questions (Nr 3) we had a quantity question, which means
that we left a box open for the respondents to fill in. Because of this the
question could be entered into the computer without coding. Another
word for this is a self-coded question (Saunders et al., 2003). In our
research the respondents were asked to fill in how many they live in the
household. We hoped to find some differences between the households.
7.4.3.4 Scale & Rating questions
In the questionnaire there were also scale questions (Nr 7, 13 and 16-
19). These types of questions are often used to collect opinion data.
They shall include both positive and negative statements, usually on a
four, -five or six point rating scale.
For this type of scale questions we gave the respondents five options
between “Total unimportant” to “Very important”. These questions had
one purpose in mind; the respondent’s opinion of the importance to have
several brands on the market, dissatisfaction, importance of frozen
vegetables trace, importance of the invisible quality, price and country of
origin. If the respondent did not have any opinion in the matter they
could choose the option “Neither”. We had this option so the
respondents’ would not feel they had to take a stand in the matter if they
did not have one.
7.4.3.5 Open questions
Five of the other questions were open questions (Nr 6, 11, 14, 15 and
20). The use of open questions will allow participants to define and to

47
describe a situation or an event a little bit closer than in “closed”
questions. An open question is designed to encourage the interviewer to
provide an extensive and development answer, and may be used to
reveal attitudes or to collect facts. An open question is likely to start with,
or include, one of the following words, what, how or why. We have in our
open questions used what and why (Saunders et al., 2003). Opened
questions should be interesting, simple and non-threatening (Malhotra &
Birks, 2000). The reason why some of the questions were left open was
because we needed deeper answers from the respondents; it was not
enough to just cross a box. We asked for detailed answers from the
respondents.
7.4.3.6 Ranking questions
The last question was a ranking question (21) and it was designed so
the respondents should rank the different alternatives they were given.
By this we could discover the alternatives importance for the
respondents. With this kind of question, it is important to ensure that the
instructions to the question are clear and easy to understand by the
respondents. In general, respondents find more than seven or eight
ranking items as time consuming (Saunders et al., 2003). We have
seven items in our ranking question. We hope in this question to find out
some association between the knowledge about invisible quality and the
actual ranking order of it. Among the factors in the ranking question we
mixed invisible factors with visible ones like taste, colour etc.
7.4.3.7 The data collection
After the questionnaire was completed and we felt that we had
everything we needed, we went out to the three supermarkets and
collected our one hundred respondents. We interviewed 37 respondents
at Maxi on a Thursday between 09-13, 23 respondents at Domus on a
Friday between 10-13 and 40 respondents at Willy’s later that same
Friday between 14-19.

48
7.5 Reliability and Validity
Reliability and validity are crucial aspects of research practise and the
importance of these criteria should be fully recognised by all who are
engaged in a research project of any kind. These terms are not always
easy to distinguish and it seems to be an overlap between these two and
they are always in some way connected to each other (Chisnall, 1997)
7.5.1 Reliability
Reliability refers to the stability and consistency of the results derived
from a research to the probability that the same results could be
obtained if the measures used in the research were copied. Perfect
coincidence of such measures would not be likely, however, and
acceptability could range over specified limits, expressed in the form of
correlation coefficients. Essentially, reliability is concerned with the
consistency, accuracy and predictability of specific research findings
(Chisnall, 1997).
We have interviewed one hundred end-consumers in three different
supermarkets. We decided to fill out the inquiries by our selves instead
of giving it to the consumers and by this the response-rate become very
high. We decided to interview people face-to-face instead of sending the
questionnaires, to avoid a big missing value. We also used standardised
questionnaires. By interviewing people face-to-face the respondents will
have opportunity to ask if something is unclear and by this we hopefully
avoid misunderstandings.
7.5.2 Validity
Validity refers to how well a specific research method measures what it
claims to measure. For example, a thermometer is designed to measure
temperature, and a barometer to measure atmosphere pressure. It is in
generally more difficult to resolve validity than reliability (Malhotra &

49
Birks, 2000). To increase the validity in the research all of the team-
members participated during the interviews.
For a research measure to be valid it must also be reliable but if it is
reliable it may or may not be valid hence, reliability is a necessary but
not sufficient condition for validity (Chisnall, 1997). A validity problem
can be the respondent’s refusal to share information (Chisnall, 1997).
We noticed that the respondents experienced the questions about age
and income as sensitive. Nobody refused to answer the questions, but of
course we cannot ascertain that the answers are totally true. Although
we are aware of this kind of errors, we will work with the data as we got it
and still have a realistic view in it.
7.6 Data process
The raw material of the research has to be processed by tabulations,
analysis and interpretation so that the research findings can be readily
understood (Chisnall, 1997). When the collected data is processed it is
important to be observant at working mistakes that can arise. Wrong
conclusions drawn in connection with the data process depends on
handle- and analytical mistakes. Handle mistakes depend on mistakes
risen in connection with the transference from the questionnaires to the
computer program. With analytical mistakes are meant wrong
calculations, wrong interpretations or unsuitable analytical methods
(Dahmström, 1996).
To be able to process the data material, which we collected through the
opinion poll, we decided to use the data program SPSS. All of the group
members participated when we listed the data material to avoid
calculation-, handle-, and misinterpretation- mistakes.

50
7.7 Method reflection
This part of the dissertation contains the difficulties and problems with
the research questions.
7.7.1 Opinion poll
The research questions, which contained invisible quality (question 15
and 17), showed out to be problematic for the consumers to answer. We
knew it before our research but invisible quality is one of the
dissertations main questions.
In the pilot test we had question fifteen as a category question but the
pilot test showed that it was a too leading question and that we might not
get anything out of the answers as a category question. Since this
question is of a very important matter and take a major part of the
dissertation, we choose to have it as an open question. We want to find
out if the consumers know what invisible quality is and that demands an
open question.
A problem is how to ensure that the data collected will enable the
research questions to be answered and the objectives achieved
(Saunders et al., 2003). When we wrote the questionnaire we were
worried about missing important question/questions, so the
questionnaire would be incomplete. After we have finished the research
and are about to start the analysis, we feel at this point the questions in
the questionnaire were enough to get a good overview of our sample.

51
8
Analysis
In this chapter we tie together the theories and the research model we
developed in chapter six. We will show if there is any association or not
between brand loyalty and the factors, price, experienced knowledge,
country of origin and invisible quality.
8.1 Introduction
In this stage of the dissertation we have written the theoretical part,
described the research procedure, and finished the questionnaire and
also the research. We will continue with this chapter about the data
analysis.
This chapter describes and analysis the data from the research with 100
end-consumers. The purpose of the research was to find out the
respondents attitude and brand loyalty toward frozen vegetables. The
data is presented and explained with help of cross tabulations, bar
charts and pie charts, to give a clearer picture of the data. The purpose
of this chapter is to indicate if there is any association or not between
brand loyalty and the factors price, country of origin, experienced
knowledge and invisible quality.
The analysis is divided into five parts and each part handle one of the
factors, brand loyalty, price, country of origin, experienced knowledge
and invisible quality. In each part about the factors we have described
the results from the research and analysed the respondents’ answers.
To be able to follow the discussion around our data analysis in the best
possible way, the questionnaire used in the research is in appendix 1. In
the beginning of each part a model is shown as an overview of the

52
questions analysed in each specific part. Some of the questions show up
several times in the overview models, this because we have analysed
some of the questions from different angles. Open questions show up in
several parts because some of the answers we got belong to different
factors. We will start this chapter with brand loyalty.
We have decided to present the general data, age, household etc., in
appendix 2.
8.2 Brand loyalty
Consumers can be loyal toward different objects: a project group, a
store, a brand etc. This is a reflection of consumers’ satisfaction towards
different objects, and this satisfaction may lead to brand loyalty.
(Söderlund, 1997).
In the model below we present the questions that were asked regarding
brand loyalty.
Figure 8.1 Model over the questions in the brand loyalty part
The purpose and the motive with these questions are presented in
Appendix 3. The analysis of question 7 is shown in appendix 4.

53
8.2.1 Know which brand to buy before the purchase
To continue the discussion around brand loyalty we wanted to know how
often the consumers know before they buy frozen vegetables which
brand to buy. We included this question in the questionnaire to find out
how brand loyal they are against a brand. Do the respondents know
before they buy frozen vegetables which brand to buy or they decide at
the frozen counter?
We did a cross tabulation between question 8 and 9 to find out how
many of the respondents who know before the purchase which brand to
buy, actually buys that brand. We see question 9 as the “true” brand
loyalty question because of its simple ness. We gave the options “yes,
often, sometimes and no”.
Buying the same brand every time * Know what brand to buyCrosstabulation
Count
10 3 2 159 10 6 6 311 4 8 6 192 2 4 27 35
22 19 18 41 100
YesOftenSometimesNo
Buy thesamebrandevery time
Total
Yes Often Sometimes NoKnow what brand to buy before...
Total
Table 8.1 Cross tabulation between question 8 and 9..
The cross tabulation shows that 41 of the respondents do not know
which brand to buy before they do their purchase and 22 always know
which brand to buy. This shows that there are not too many consumers
that know which brand to buy before they do their purchase. They decide
at the frozen food-counter.
The cross tabulation shows that 27 of the respondents who do not know
before the purchase, which brand to buy, do not buy the same brand
every time. In the tabulation we also see a kind of pattern that the

54
consumers who often know which brand to buy before the purchase also
often buy the same brand and the consumers that sometimes know
which brand to buy sometimes buy the same brand.
We have now got a more descriptive picture of the data and the
consumers’ brand loyalty attitude and behaviour. We continue to cross
question 9 with question 12, which deals with the matter of different
levels of brand loyalty.
8.2.2 Buy the same brand crossed with the level of brand loyalty
We wanted to find out if the respondents consider themselves to be
brand loyal. We asked question 9 to find out if the consumers buy frozen
vegetables of the same brand every time and question 12 was asked to
find out on what brand loyalty level the consumers belong. They could
choose between 3 levels, buy any brand, sometimes buy other brands
and the last level; I do not buy other brands if my brand is not there.
Question 9 and 12 will be presented in a cross tabulation down below.
Same brand * Brand loyalty level Crosstabulation
Count
15 155 26 313 16 19
35 3543 57 100
YesOftenSometimesNo
Samebrand
Total
Buy anybrand
Sometimesother brands
Brand loyalty level
Total
Table 8.2 Question 9 (Buy same brand) crossed with question 12 (The level of brand loyalty).
Those 35 respondents who answered “No” on question 9 will
automatically be put on level one of question 12, which is, “buy any
brand”. We motivate this argument by; if the consumers never buy the
same brand, then they in return are not loyal towards a specific brand.
The cross tabulation shows only 8 of the respondents who answered

55
“often” or “sometimes”, that considered themselves to be on level one of
question 12.
The second level, “sometimes buy other brands”, shows that more than
50 respondents consider themselves buying other brands and in return
they are not very loyal consumers. Even the respondents that answered
“yes” on question 9, which means they buy the same brand every time,
considered themselves belonging to the second level and therefore does
not consider themselves to be brand loyal.
To strengthen our statement even more, that our research population
are not very loyal consumers, we will show the third level: “do not buy
other brands if my brand is not there” of the brand loyalty stage. The
data shows that none of the 65 respondents who answered “yes, often
or sometimes” on question 9, did not feel that they belonged to the third
level of the brand loyalty stage.
8.2.3 “No” on question 9 which factors influence?
Question 9 was asked to find out if the respondents buy the same brand
every time they purchase and its purpose was to find out if the
respondents are brand loyal towards a brand. A following question to the
respondents who answered, “No”, I do not buy the same brand” on,
question nine, question 10 was asked because we wanted to know what
factors influence their decision since they never buy the same brand.
The 65 missing values are the respondents who answered “yes, often or
sometimes” on question 9, and therefore not included in question 10.

56
Why not buying the same brand
OtherNeed of a vegetable
Have no favourite
Goes after price
Do not care for the
Missing
Cou
nt
70
60
50
40
30
20
10
010
20
65
Figure 8.2 Bar chart over different factors influencing the decision on never buying the same brand We can read from the bar chart that it is the price factor which is the
most influencing factor for their choice not to buy the same brand every
time. Even if they sometimes buy the same brand it is just a coincidence
because the price fits their preferences. The second most answered
factor is the need of a certain vegetable that influences their choice of
brand.
8.2.4 Brand characteristics
The respondents who answered yes, often or sometimes on question 9
had to answer two following questions; what they consider to be that
specific brands characteristics and how loyal they think they are to that
specific brand. We have already discussed question 12 above which
handle the brand loyalty level. Question 11 handles the matter what
different characteristics the brand has which the consumer buys “all the
times, often or sometimes” has.
We have chosen to analyse question 11 outside SPSS because we got
answers that would give us more if we analysed it qualitatively instead of
quantitatively. We will start to define the different answers from the

57
respondents and there is particularly one answer that has higher
frequency than the other answers. The answers we got are:
1. Taste/Consistency
2. Colour
3. That brands big assortment
4. Nutrition
5. Price
6. Experienced knowledge
7. Quality
The first 6 answers are equally mentioned but the 7th; quality is much
more used. After a calculation of the answers, 36 said “quality”. As
mentioned above, those 34 respondents who answered “No” are of
course not included in this question.
We asked those respondents, who answered quality on question 11,
what they meant by that. The respondents considered quality as visible
qualities such as taste, colour and also the package design. We know
that the two first answers are typically visible quality signs but those
respondents that answered quality were talking about the whole product
quality, such as taste, colour, consistency, the package design etc.
We will now continue with the factor, price that may or may not influence
brand loyalty.
8.3 Price
The base in loyalty is the amount a consumer will pay for the brand in
comparison with another brand offering similar or fewer benefits (Aaker,
2002). Our research model includes four different factors that may or
may not influence brand loyalty and price is one of them.

58
In our questionnaire we had some questions that handle the price factor.
In the model below we present the questions that were asked regarding
the price factor.
Figure 8.3 Model over the questions in the price factor
The purpose and motive with the questions about price are presented in
appendix 5.
8.3.1 The importance of price
Question 18 was asked to find out how important price is for the active
choice of brand in frozen vegetables and a question to continue our
research to find out if price influence brand loyalty. In this question we
gave them scale options from “total unimportant” to “very important”. We
did a pie chart so the material would be easy to overview. The pie chart
is presented down below and shows how the sample population is
divided in question 18:
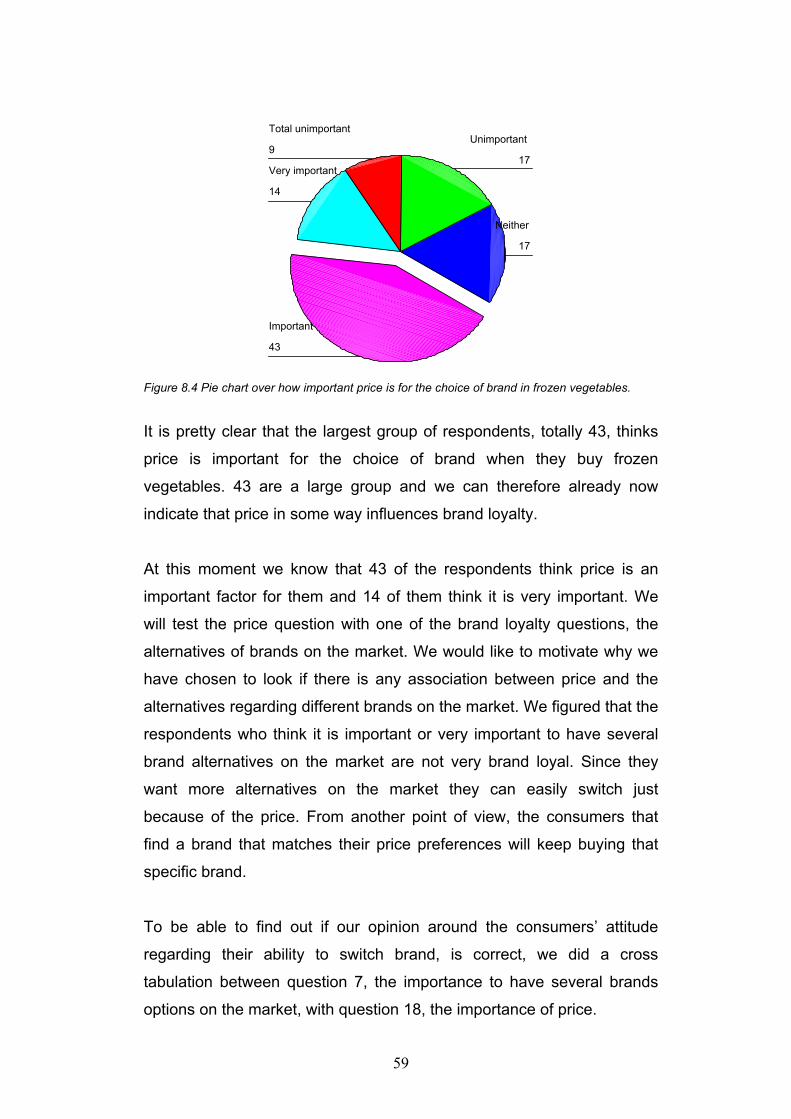
59
9
14
43
17
17
Total unimportant
Very important
Important
Neither
Unimportant
Figure 8.4 Pie chart over how important price is for the choice of brand in frozen vegetables.
It is pretty clear that the largest group of respondents, totally 43, thinks
price is important for the choice of brand when they buy frozen
vegetables. 43 are a large group and we can therefore already now
indicate that price in some way influences brand loyalty.
At this moment we know that 43 of the respondents think price is an
important factor for them and 14 of them think it is very important. We
will test the price question with one of the brand loyalty questions, the
alternatives of brands on the market. We would like to motivate why we
have chosen to look if there is any association between price and the
alternatives regarding different brands on the market. We figured that the
respondents who think it is important or very important to have several
brand alternatives on the market are not very brand loyal. Since they
want more alternatives on the market they can easily switch just
because of the price. From another point of view, the consumers that
find a brand that matches their price preferences will keep buying that
specific brand.
To be able to find out if our opinion around the consumers’ attitude
regarding their ability to switch brand, is correct, we did a cross
tabulation between question 7, the importance to have several brands
options on the market, with question 18, the importance of price.

60
In the cross tabulation, which is presented in appendix 5, we see there
are 21 respondents, which meet each other in the “important” category.
This shows that our opinion about the consumers’ attitude regarding
their switching ability to other brands because of the price is right, but we
still need to find out if price influences brand loyalty.
8.3.2 Price in other questions
As mentioned in the introduction to the price factor, price came up in
other questions. A part of this headline is presented in appendix 6.
We wanted to find out the amount of respondents, which do not buy the
same brand every time and find out their reasons for switching brand. To
get a good overview we did a cross tabulation between question 10 and
question 14.
Why No* Why switching brand Crosstabulation
Count
1 1 1 35 4 10 1 201 13 6 3 12
1 110 12 14 1 37
Do not care for the brandGoes after priceHave no favouriteNeed of a vegetableOther
Why No
Total
Poorerquality
Newalternatives
on themarket Price
Thebrand
was notthere
Why switching brand
Total
Table 8.3 Cross tabulation between different categories for not buying same brand and different switching factors.
With no surprise, 10 of those respondents who go after price when they
pick a brand see price as their main reason for switching brand. We
mention in our theory part an example from Aaker (2002) which states: a
consumer is willing to pay 10 percent more to buy Coke rather than a
Pepsi, this show that price is associated with brand loyalty. We see in

61
our sample that the consumers are somewhat price sensitive and see
price as a strong reason not to buy the same brand twice and as a
strong reason for switching brand.
If we follow Aakers example, our sample of consumers do not seem to
be very loyal towards a specific brand which means; price is not
associated to brand loyalty for frozen vegetables.
8.4 Experienced knowledge
The relationship between expectations and experiences is most often
believed to determine consumers satisfaction and if they will repurchase
the product (Grunert, 2002). Experienced knowledge is one of the
factors in our brand loyalty model. We will examine if experienced
knowledge influences brand loyalty.
In our research we had some questions that handle experienced
knowledge. In the model below we present the questions that were
asked regarding experienced knowledge.
Figure 8.5 Model over the questions in experienced knowledge factor
The purpose and motive with the questions about experienced
knowledge are presented in appendix 7.

62
8.4.1 Dissatisfaction
The first clear question in the questionnaire about experienced
knowledge is question 13. The question was asked to find out if the
respondents change brand if they will be dissatisfied once. We will start
this analyse about experienced knowledge by a cross tabulation
between question 9, if the consumers buy the same brand every time,
and question 13, if they change brand after dissatisfaction. We decided
to analyse these two questions to find out how important experienced
knowledge is. Do the consumers, who buy the same brand every time
and have good experience about the brand, change if they will have a
negative experience once? We have decided not to analyse those
respondents that never buy the same brand since it is not what we are
interested to analyse.
Dissatisfaction * Buying same brand Crosstabulation
Count
4 16 8 13 416 10 10 12 385 5 1 10 21
15 31 19 35 100
Yes SometimesNo
Dissatisfaction
Total
Yes Often Sometimes No
Buying same brand
Total
Table 8.4 Cross tabulation between question 9 and question thirteen.
By adding the respondents’ answers in question 9 regarding those who
buy the same brand always, often and sometimes we got 65
respondents. We think it would be interesting to find out how many of
those 65 respondents who will change brand after dissatisfaction.
28 of the 65 respondents will change brand at once if the product does
not meet their experiences. It shows rather clear that the companies
must keep equable quality or else they will loose almost fifty percent of
their consumers. The group in the middle, the respondents that change
brand sometimes is rather big, 26 respondents. They will give the

63
product one more chance if the default is not so big, but if the default is
big they change at once. It is individual what to be considered “big
default”. The last group, 11 respondents, do not change brand if the
product is default.
In the beginning of this part we wrote that we would not go to deep into
those respondents that never buy the same brand. But after we have
analysed the cross tabulation we see that 10 of those 35 respondents
would not change brand if they will be dissatisfied once. It seems to be
that those respondents who never buy the same brand are more tolerant
than those who buy the same brand every time.
8.4.2 Reasons to change brand
Question 14 was asked to the one hundred respondents to find out for
what kind of reasons the respondents would change brand. In appendix
7, were the cross tabulation is presented, we have a cross tabulation
which shows that 42 of the 100 respondents would change brand
because of poorer quality, 23 because of new alternatives on the market,
25 because of increased price or cheaper brands, and the last 10
respondents because the brand was sold out at the time when they
made their purchase. Once more it shows rather clear that it is important
for the companies to keep the quality equable or else they will lose
almost fifty of their consumers. 42 of the 100 respondents show that
experienced knowledge is important, because if the brand does not
achieve their former experiences the respondents will change brand.
We have crossed question 9, buy the same brand, with question 13,
change brand after dissatisfaction, to see if the experienced quality is
important for the respondents. We wanted to find out how many of the
respondent who buys the same brand always, often and sometimes that
will change brand after dissatisfaction if their former experiences are not
achieved.
64
As can be seen in the Figure 8.8 we added the 65 respondents who buy
the same brand always, often and sometimes and do not change brand
if they will be dissatisfied, and got 11 respondents. Those 11
respondents would not change brand if they will be dissatisfied once.
The other 54 respondents give a clear picture that experienced
knowledge is important because 28 of the respondents will change
brand immediately and 26 will give the brand one more chance. If they
are used to a brand and have good experienced knowledge, they will
change brand if the brand do not achieve their former experiences.
8.4.3 Experienced knowledge in other questions
Except for the questions 13 and 14, experienced knowledge also
showed up as an answer in question 11. This question was an open
question and we did not find any clear keywords in the different answers
from the 100 respondents. This made it easier and more useful for us to
analyse outside SPSS. We asked the respondents what they think are
distinguishing for their specific brand’s products they use to buy. One of
the category answers we got was habit. It is a kind of experienced
knowledge though the consumers keep buying the brand’s products of
habit because they are satisfied with the brand and have good
experienced knowledge.
This chapter has dealt with experienced knowledge, which is one of the
factors in our research model and we will now continue with the third
factor, country of origin.

65
8.5 Country of origin
Country of origin is one of the factors in our research model that may or
may not influence brand loyalty. We think country of origin does not have
any big influence for the choice of brand and loyalty. In our theory part
we mention that a product’s country of origin is important for the
consumer’s evaluation process. It is therefore relevant to examine if
country of origin is an important quality indicator and if so, for what kind
of consumers this is true (Hoffmann, 2000).
In our research, some of the questions handle the factor country of
origin. In the model below we present the questions that were asked
regarding country of origin.
Figure 8.6 Model over the questions in the country of origin factor
The purpose and motive with the factor country of origin are presented in
appendix 8.
8.5.1 Importance of country of origin
Just as the other factors of our research model, we also asked an
“importance question” about country of origin and that was question 19.
We gave the respondents same scale of answer as in the price question,
from “total unimportant” to “very important”. As a first step we did a bar

66
chart of question 19 to get a good overview of the respondents’ answers
to see how they felt about the importance of country of origin for their
choice of frozen vegetables.
Country of origin
Very importantImportant
NeitherUnimportant
Total unimportant
Cou
nt
50
40
30
20
10
0
19
41
1716
7
Figure 8.7 Bar chart over the respondents answer regarding importance of country of origin. The bar chart shows that 41 of the hundred respondents feel that
country of origin is important for their choice of brand when they buy
frozen vegetables. 19 of the respondents think country of origin is very
important for their choice of brand. We can see from the bar chart that
wholly 60 of our sample see country of origin as important or very
important and this indicate that country of origin has influence on the
consumers’ choice of brand. Still we cannot ascertain how it will affect
brand loyalty.
Now when we know that 60 of the respondents feel country of origin is
important or very important, we continue with the following question 20.
Every respondent who answered important or very important had to
move on to the open question 20 and tell us why they think country of
origin matter to them. This question was of great importance to us since
the respondents had to explain why country of origin matter and not only
answer important or very important. Naturally we wanted to see how the

67
respondents are divided between question 19 and 20. The questions is
presented in a cross tabulation.
Country of origin * If important, why? Crosstabulation
Count
14 9 6 12 412 6 4 7 19
16 15 10 19 60
ImportantVery important
Country
Total
Growingprocess Pesticide
Support theSwedish
companies
Confidencefor Swedish
law
If important or very important
Total
Table 8.5 Importance of country of origin crossed with the open question why it was important or
very important.
From the cross tabulation we get a good overview how the data material
is divided in question 19 and 20. The tabulation also presents the
different answers we coded from the open question 20. We se answers
like cultivation process, insecticide, support of the Swedish companies
and it also show the respondents have confidence for Swedish laws.
14 respondents in the category “country of origin is important” see
country of origin as important because of the different types of cultivation
processes that differs from country to country. 12 respondents have
confidence for the Swedish laws and therefore consider country of origin
to be important for the active choice of brand in frozen vegetables. 7
respondents in the group, which consider country of origin to be very
important, also have the confidence for the Swedish laws and see that
as the final judgement for their choice of brand.
According to Papadopoulos (1987) there is a belief that consumers will
rate their own country’s products as better than those from elsewhere.
We have 29 respondents in the categories, support of the Swedish
companies and confidence for Swedish laws. Since it is only 29
respondents we cannot determine this theory. We although see a pattern
that the respondents have a tendency to chose domestic brands.

68
To be sure that the respondents understood we meant the vegetables
country of origin and not the brands country of origin, we explained for
the respondents while doing the research that Swedish companies
sometimes import their frozen vegetables. Some vegetables are not able
to grow in Sweden some seasons. Even if we made this statement to the
respondents, it did not matter for their opinion; they still have confidence
for the Swedish laws.
The answers we got on question 20 showed us that besides confidence
for Swedish laws and support of Swedish companies, invisible quality
factors played a big roll if country of origin would be important or not.
We will make a cross tabulation between question 15, what is invisible
quality and question 19 to see how the data material is divided.
Country * Invisible quality Crosstabulation
Count
7 711 2 1 2 1613 3 1 1734 2 3 2 4115 1 1 2 1980 5 8 7 100
Total unimportantUnimportantNeitherImportantVery important
Country
Total
Do notknow Insecticide Nutrition
Growingprocess
Invivisble quality
Total
Table 8.6 Cross tabulation between invisible quality and importance of country of origin.
We see it is wholly 80 of our sample, which do not know what invisible
quality is. Out of the remaining 20 respondents who apparently have
knowledge in invisible quality, we see that 11 of those respondents think
country of origin is important or very important. If we look into the column
“do not know”, we see there are 49 respondents who consider country of
origin as important or very important, but they have no knowledge in
invisible quality. It is not necessarily to have knowledge in invisible
quality to think country of origin is important or very important for the
choice of brand.
69
8.5.2 Country of origin in other questions
Country of origin also took place in the last question 21, and was one of
the categories we wanted the respondents to rank. This data-material
will be presented in the next part, invisible quality. But we can already
mention that there were only 3 respondents that ranked country of origin
as their first choice, 9 as their second choice, 8 as their third choice etc.
Country of origin did not get any large number of respondents until the
ranking options 6 and 7. 19 respondents ranked it 6th and 27 ranked it
7th; this means country of origin is not a factor the respondents consider
important.
8.6 Invisible quality
Credence qualities are qualities, which are for the consumer invisible
both before and after the purchase. This kind of invisible dimensions are
quality, which the average consumer never can ascertain by him/herself
(Grunert, 2002). With respect to food, such qualities can be for example
animal welfare process and vegetables cultivation process. If the
consumers trust the party giving the information, it may lead to brand
loyalty in time (Hoffmann, 2000).
From the beginning we wanted to write the dissertation about invisible
quality of frozen vegetables. But as we wrote in chapter 2, the time and
the amount written about the subject was too little, so we have build the
dissertation round brand loyalty and the four factors that may influence
brand loyalty. In our research we had some questions that handle the
invisible quality factor. In the model below we present the questions that
were asked regarding invisible quality.

70
Figure 8.8 Model over the question in the invisible quality factor part
The purpose and motive with the questions about the factor invisible
quality are presented in appendix 9.
8.6.1 Knowledge in invisible quality
As a first step towards the concept invisible quality we needed to find out
the respondents knowledge regarding the concept invisible quality. We
asked question 15, what they consider to be invisible quality in frozen
vegetables. We also made the question a little bit clearer by telling the
respondents that invisible quality is something that they cannot ascertain
either before or after the consumption.
We had this question as an open question since we felt that it would be a
leading question if we had categories. Our main goal with this question
was to find out if the consumers know what invisible quality is. The data
material from this question will be presented down below in a bar chart.
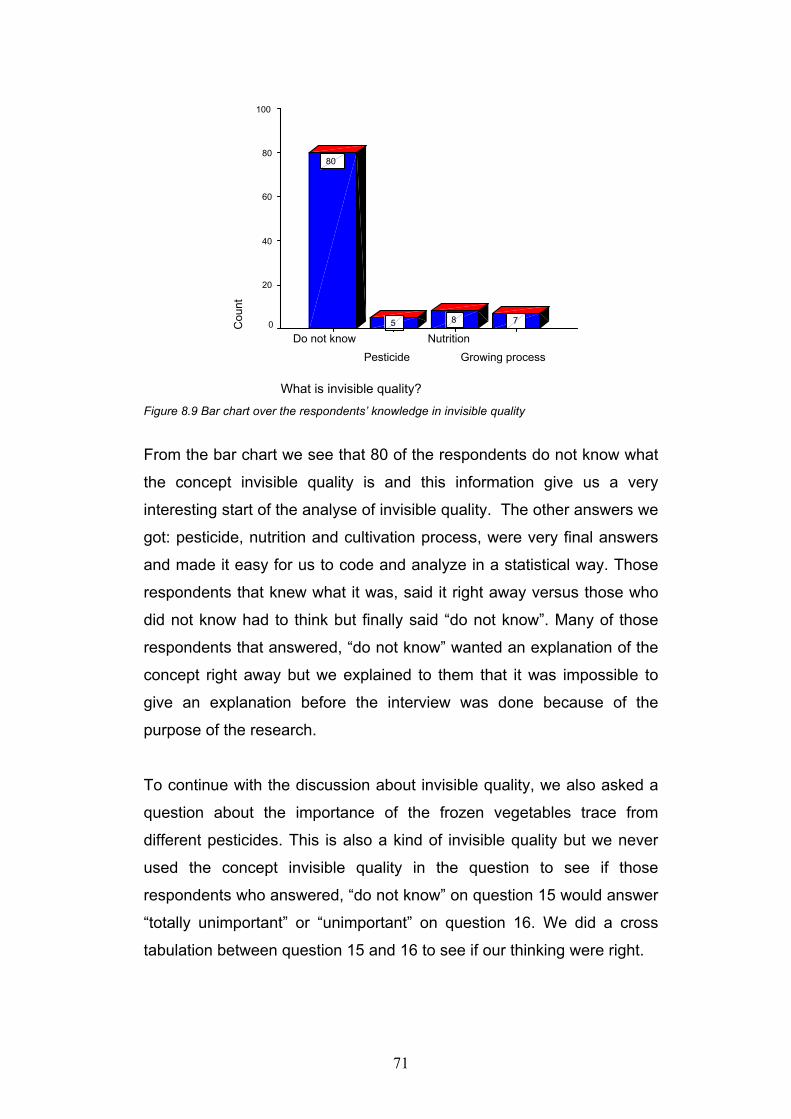
71
What is invisible quality?
Growing processNutrition
PesticideDo not know
Cou
nt
100
80
60
40
20
0 785
80
Figure 8.9 Bar chart over the respondents’ knowledge in invisible quality
From the bar chart we see that 80 of the respondents do not know what
the concept invisible quality is and this information give us a very
interesting start of the analyse of invisible quality. The other answers we
got: pesticide, nutrition and cultivation process, were very final answers
and made it easy for us to code and analyze in a statistical way. Those
respondents that knew what it was, said it right away versus those who
did not know had to think but finally said “do not know”. Many of those
respondents that answered, “do not know” wanted an explanation of the
concept right away but we explained to them that it was impossible to
give an explanation before the interview was done because of the
purpose of the research.
To continue with the discussion about invisible quality, we also asked a
question about the importance of the frozen vegetables trace from
different pesticides. This is also a kind of invisible quality but we never
used the concept invisible quality in the question to see if those
respondents who answered, “do not know” on question 15 would answer
“totally unimportant” or “unimportant” on question 16. We did a cross
tabulation between question 15 and 16 to see if our thinking were right.

72
Trace in frozen vegetables * Knowledge in invisble quality Crosstabulation
Count
10 1 1111 1 1221 2 1 2427 2 5 5 3911 1 1 1 1480 5 8 7 100
Total unimportanUnimportantNeitherImportantVery important
Trace infrozenvegetables
Total
Do notknow Pesticide Nutrition
Growingprocess
Knowledge in invisible quality
Total
Table 8.7 Cross tabulation between question 15 and 16
As we see in the cross tabulation our suspicion about which respondents
who would see the trace of frozen vegetables as totally unimportant or
unimportant were right. It was the respondents in the category do not
know who see the trace in frozen vegetables, as total unimportant and
they also stand for the largest group in the “unimportant” answer. The
most interesting number in the tabulation is 27. It is the group, which
thinks the trace question is important, but in the same time they do not
know what the concept invisible quality is. We can by the number 27 in
this tabulation see that it is not only the respondents that have
knowledge in invisible quality who think trace in frozen vegetables is
important for their choice of brand.
8.6.2 Importance of invisible quality
Just as the other factors of our research model, we asked how important
the different factors are for the respondents. The same question was
asked about invisible quality and the data is presented in appendix 9.
The data in question 17 is very spread out but we see that 31 of the
respondents feel that invisible quality is important for them. We also see
that there is a large group of respondents that feel invisible quality is
totally unimportant for their active choice of brand and 25 do not care
about the concept.

73
Now when we know how the data is spread out in question 17 we want
to find out how the data is spread out in a cross tabulation between
question 15 and 17. Will those respondents who answered “do not know”
in question 15, say “totally important” or “unimportant” in question 17?
We are aware that the discussion is very similar compared to the one
above, between the knowledge and the importance of the trace in frozen
vegetables, but we distinctively point out there is a big difference since
we did not mentioned the concept invisible quality in question 16, about
the trace in frozen vegetables.
Importance of invisible quality * The knowledge of invisible quality Cross tabulation
Count
23 2311 1120 1 2 2 2520 3 4 4 316 1 2 1 10
80 5 8 7 100
Total unimportantUnimportantNeitherImportantVery important
Importance of tracein frozen v.
Total
Do not know Pesticide NutritionGrowingprocess
The knowledge in invisible quality
Total
Table 8.8 Cross tabulation between question 15 and 17.
We see from the tabulation there is a larger group in the category “total
unimportant” of those respondents who do not know what invisible
quality is. We also see two equal groups in the categories “neither” and
“important”. Our interest also lays in the analysis to see if there are any
differences in the thinking from the respondent that do not know what
invisible quality is (since in fact the two questions are the same). The
difference in question 16 and 17 is not that big besides the large group
of respondent in the “total unimportant” category in question 17. We can
from the two cross tabulations indicate that the respondent considered
the concept invisible quality to be a little bit more unimportant than the
trace in frozen vegetables. We think it is because they recognise the
word trace in question 16. We state once again that question 16 and 17
are in fact the same question, only expressed differently, and we have

74
by these two questions once again indicated that the consumers are not
familiar with the concept “invisible quality”.
8.6.3 Invisible quality in other questions
Our last question was a ranking question and the purpose was to find
out how the respondents would rank the different factors set up in the
question. We mixed invisible and visible quality dimensions to see how
the respondents would rank these different factors. The question is
asked so the respondents would rank different factors from the point of
view how important they felt it is for them. The different factors are
presented in appendix 1 where the questionnaire is shown.
We will analyse question 21 by doing cross tabulations with the open
question of invisible quality. We will show the first three ranked options
among the respondents, the remaining ranked options will be showed in
appendix 9. To follow our interest, we consider the three highest ranked
options to be the most important ones at this point. The remaining four
ranked options are too far down on the ranking list to have any
significant meaning to us right now. We will only discuss them very
shallow in the appendix 9. Our main interest in the cross tabulation
between questions 15 and 21 is to see if the respondents rank invisible
quality high when they earlier in question 15 have stated they in fact do
not know what the concept is.
8.6.4.1 First ranked option
Our main interest of this question is to see how the respondents that
answered; “do not know” would rank the different factors. At first we took
out every first ranked option and then the second etc. By doing this we
would get a better overview of the different ranking stages and would
hopefully see a pattern that would lead us to the goal, “the consumers do
not know what invisible quality is but they consider it to be very
important”.
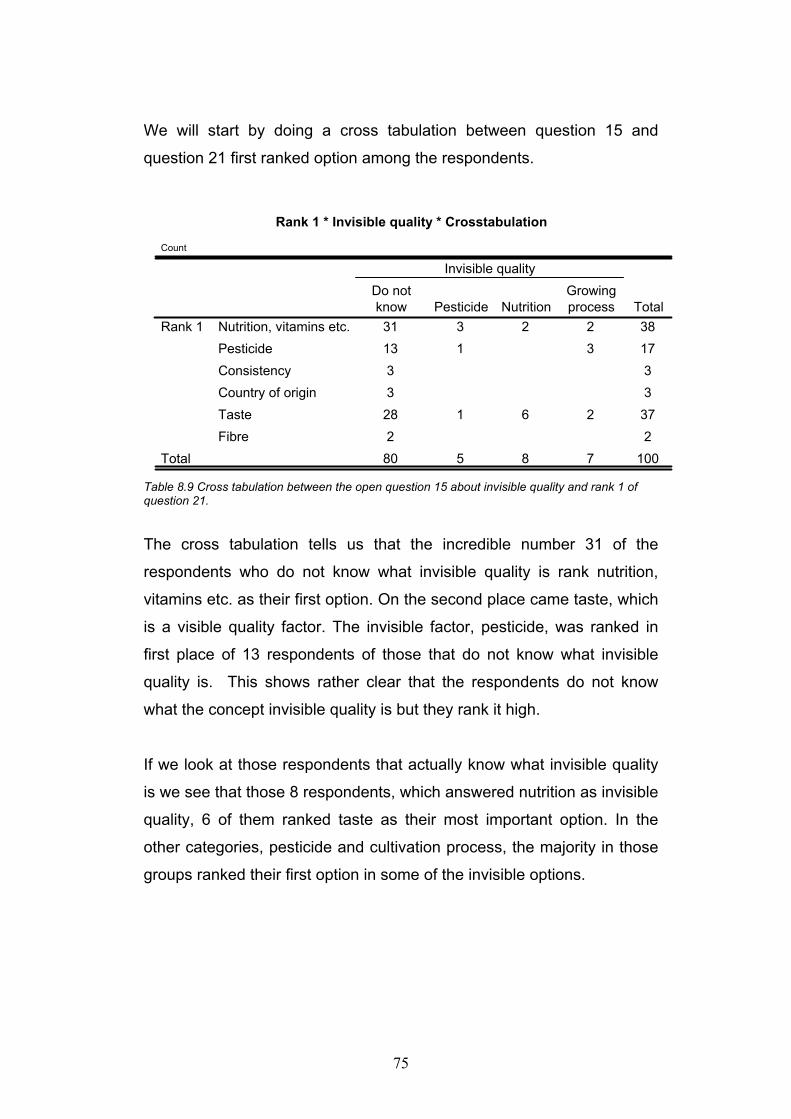
75
We will start by doing a cross tabulation between question 15 and
question 21 first ranked option among the respondents.
Rank 1 * Invisible quality * Crosstabulation
Count
31 3 2 2 3813 1 3 173 33 328 1 6 2 372 280 5 8 7 100
Nutrition, vitamins etc.PesticideConsistencyCountry of originTasteFibre
Rank 1
Total
Do notknow Pesticide Nutrition
Growingprocess
Invisible quality
Total
Table 8.9 Cross tabulation between the open question 15 about invisible quality and rank 1 of question 21.
The cross tabulation tells us that the incredible number 31 of the
respondents who do not know what invisible quality is rank nutrition,
vitamins etc. as their first option. On the second place came taste, which
is a visible quality factor. The invisible factor, pesticide, was ranked in
first place of 13 respondents of those that do not know what invisible
quality is. This shows rather clear that the respondents do not know
what the concept invisible quality is but they rank it high.
If we look at those respondents that actually know what invisible quality
is we see that those 8 respondents, which answered nutrition as invisible
quality, 6 of them ranked taste as their most important option. In the
other categories, pesticide and cultivation process, the majority in those
groups ranked their first option in some of the invisible options.

76
8.6.4.2 Second ranked option
To continue the analysis of this question we did a cross tabulation
between question 15, invisible quality and the second ranked question,
question 21.
Rank 2 * Invisble quality Crosstabulation
Count
11 1 2 3 1720 1 1 2213 1 1415 1 5 218 1 99 1 1 114 2 680 5 8 7 100
Nutrition, vitamins etcPesticideColourConsistencyCountry of originTasteFibre
Rank 2
Total
Do notknow Pesticide Nutrition
Growingprocess
Invisible quality
Total
Table 8.10 Cross tabulation between the open question 15 about invisible quality and rank2 of question 21.
As a difference from the first ranked option we see that pesticide is the
most favoured ranking as the second choice of those respondents that
do not know what invisible quality is. The nutrition option is also worth
mentioning even if there only were 11 respondents that put that option
as their second choice.
The numbers of the other categories, pesticide, nutrition and cultivation
process, are more spread out than in the first ranked option. Although,
we see here once again that those respondent that answered nutrition
do not consider the invisible quality factors important. The majority
consider consistency as their second ranked option. The pattern is
shown in the column pesticide.

77
8.6.4.3 Third ranked option
The third ranked options will be our last analysed part of invisible quality.
We will keep searching for pattern about those respondents that do not
know what invisible quality is but still rank it somewhat high.
Rank 3 * Invisible quality Crosstabulation
Count
13 2 158 1 3 1210 2 2 1414 1 1 3 195 2 1 819 1 1 2111 1180 5 8 7 100
Nutrition, vitamins etc.PesticideColourConsistencyCountry of originTasteFibre
Rank 3
Total
Do notknow Pesticide Nutrition
Growingprocess
Invisible quality
Total
Table 8.11 Cross tabulation between the open question 15 about invisible quality and rank 3 of question 21. We notice that further down we get regarding the ranking options; the
more the answers are spread out between the categories. In the third
ranked option under the category “do not know” the visible quality factors
taste and consistency are the most favoured.
We have, with this ranking question, showed that the respondents do
now know what the concept invisible quality is but they rank it high.

78
9
Conclusions and suggestions for further research
In this chapter our findings and conclusions are presented regarding the
different theories, research method and analysis. We have in the
dissertation discussed our core in the research model, brand loyalty and
the four factors, which may or may not influence. The research model
lays the foundation for our methodology and analyse. We will also
present the reworked research model influenced of our findings and give
suggestions for further research
9.1 Introduction
The purpose with the dissertation is to find out how important invisible
quality is for brand loyalty and the active choice of brand of frozen
vegetables for the consumers and also to find out which factors may or
may not influence brand loyalty. We proceeded from existing theories
and developed a research model presented below.
Figure 9.1 Factors influencing brand loyalty
79
The aim with the model was to research if the four factors influence
brand loyalty, and in that case which one. This chapter handles the
conclusions and is the final chapter of this dissertation.
9.2 Conclusions of brand loyalty
We will in this part of the chapter discuss our conclusions regarding
brand loyalty. The conception brand loyalty means that the consumer is
creating a good image of a brand and the brand advantages, is willing to
invest time, energy, money, and other resources in the brand beyond
those expended during purchase or consumption of the brand (Keller,
2003). Our purpose of this part is to find out how loyal our sample group
is and by this see if they are interested to invest time, energy and money
for buying a specific brand.
In the beginning of the dissertation, our aim was to write about invisible
quality but we felt that the information written about invisible quality and
the amount of time was not enough so we decided to build the
dissertation around brand loyalty. While collecting the different theories
regarding brand loyalty and quality, we created the model described both
in chapter six and in the introduction to this chapter. This model lays the
foundation for our methodology and analyse. Brand loyalty is the core of
our research model and takes a centre part of this dissertation.
Brand loyalty also took a big part of the empirical method since we
needed to create good questions for the questionnaire so we both would
be able to answer our main questions and reach the purpose of the
dissertation. We also wanted to be able to cross brand loyalty questions
with some of the other questions, which handle the four factors. We
needed to find out how brand loyal our sample group is and therefore we
analysed the different answers from the brand loyalty questions.

80
The analysis of the brand loyalty question showed that our sample does
not seem to be very loyal towards a specific brand. When it is over 50
percent of the respondents who think it is important or very important to
have several brand alternatives on the market we draw the conclusion
they are not loyal since they want other alternatives on the market if
something better comes along. Of course the consumers can be loyal to
a specific brand but their ability to switch to another brand seems to be
very high, i.e. the consumers do not find it hard to switch brand.
We also see the consumers’ lack of brand loyalty since most of them do
not know what brand to buy before the purchase of frozen vegetables.
The answers were different when we asked them if they bought the
same brand every time. Here we had a large group in the answer
category “often” but at the same time the largest group was in the “no”
category. We still do not see any brand loyalty of frozen vegetables.
There are different levels of brand loyalty and consumers belong to one
of the levels. It is important for the company to know how the consumers
are divided among the levels (Aaker, 1991). In our “brand loyalty
pyramid” as we call it, none of the consumers saw themselves to be so
loyal that they belonged to the third level. Level three is; they never buy
another brand and this is the ultimate brand loyalty attitude. Most of the
respondents put themselves in level two which means they are not
bothered to buy other brands if their brand is not there at that moment.
When the consumers are to some level brand loyal to a brand they buy
all the time, often or sometimes, they considered “quality” to be that
specific brands characteristics.
We draw the conclusion in brand loyalty that our sample group is not
very brand loyal and they do not even consider themselves to be brand
loyal to a specific brand. Our sample is not willing to invest time, energy
or the money to find a specific brand. It seems that the consumers have

81
different preferences, which do not demand a specific brand. This
conclusion gives us a very interesting continuing of this chapter.
9.3 Conclusion of the factor price
Price is one of the four factors, which may or may not influence brand
loyalty. In our research we had one question regarding price, but the
price factor came up as a category answer in three other questions. With
help of these questions we will be able to draw the conclusion if price will
influence brand loyalty.
The base in loyalty is the amount a consumer will pay for the brand in
comparison with another brand offering similar or fewer benefits. More
than 50 percent of our respondents think price is an important factor for
their choice of brand of frozen vegetables. This shows rather clear that
they are not brand loyal since they think price is the most important
factor instead of other brand attributes. Price can be the only relevant
product attribute for some consumers and only follows those attributes
and no not really care of other characteristics a brand can have
(Solomon, 2002). Price showed up in three of the open questions, which
showed that price is a very strong factor for not buying the same brand
and also to switch brand, according to our respondents.
The conclusion of the price factor is that more than 50 percent of the
respondents think price is an important or very important factor for their
choice of brand of frozen vegetables. Our respondents are not brand
loyal since they think price is the most important factor and are able to
switch to another brand that fits their price preferences. We associate
this with the theory from Solomon stating that price is the only relevant
product attribute for the largest part of our respondents. The final
conclusion of price is that it will only influence brand loyalty if the price
fits the consumers’ price preferences.

82
9.4 Conclusion of the factor experienced knowledge
Experienced knowledge is one of the four factors, which may or may not
influence brand loyalty. In our research we had two questions regarding
experienced knowledge, but the factor came up as a category answer in
one of the other questions. With help of these questions we will be able
to draw the conclusion if experienced knowledge will influence brand
loyalty.
The relationship between expectations and experiences is most often
believed to determine consumers satisfaction and if they will repurchase
the product (Grunert, 2002). 41 of the respondents would change brand
at once after dissatisfaction. This shows rather clear that if their former
experiences about the brand are not achieved they will switch brand. It is
important for the companies to hold equal quality or else they will lose
almost 50 percent of their consumers at once after the consumers’
dissatisfaction. We asked a question to the respondents according the
reason for switching brand. 42 of the respondents answered that they
will switch brand because of poorer quality. This data material shows
that experienced knowledge is important for the respondents to
repurchase the brand and for the companies to hold equal quality.
Söderlund (2001) points out that habit can create loyalty because the
product creates some form of harmonization for the consumer and in
return makes the consumer loyal towards the brand. Habit showed up in
one of the open questions of the questionnaire. The respondents who
answered habit had good experiences toward the specific brand and
repurchased it of habit.
Our research show that the respondents experienced knowledge about
the brand is important and if the brand does not achieve their former
experiences, they will switch to another brand. To connect the
conclusion about experienced knowledge to a theory we would indicate
that Grunert’s theory is correct and this because our research shows that
experienced knowledge is important. The respondents will change brand

83
if their former experiences and expectations about a brand are not
achieved. It is therefore important for the companies to hold equal quality
or else they will loose almost 50 percent of their consumers.
9.5 Conclusions of the factor country of origin
Country of origin is one of the four factors, which may or may not
influence brand loyalty. We had three questions regarding country of
origin included in the questionnaire. By these questions we will be able
to draw the conclusions if country of origin will influence brand loyalty or
not.
In our theory part we discussed a brands country of origin and the
importance for the consumers. A product’s country of origin is important
information in the consumers’ decision-making process and ethnocentric
consumers are very brand loyal though they feel it is wrong to buy
products from other countries (Solomon 2001). The analysis show that
60 percent of the respondents think country of origin is important or very
important for their active choice of brand. We therefore draw the
conclusion that country of origin has some level of importance for the
consumers when they buy frozen vegetables but we cannot yet indicate
if it will influence brand loyalty.
Now when we have drawn the conclusion that country of origin matter for
our sample group we need to find out why they think country origin is
important to them. It was only those respondents who answered
important or very important who answered that question. The answers
we got of the open question regarding country of origin, we see a large
group of respondents, which have confidence for the Swedish laws. We
connect these answers to the theory stated from Papadopoulos (1987);
there is a belief that consumers will rate their own country’s products as
better than those from elsewhere. We draw the conclusion that the
consumers have confidence in the Swedish laws and believe that “the
Swedish way is the right way” and will therefore rate domestic brands

84
before imported. We were although very clear towards the respondents
that the vegetables in Swedish brands are not always Swedish due to
different season etc. This statement did not matter for the respondents,
as long it was a Swedish brand it was of a high quality.
The open question also helped us draw the conclusion that country of
origin is on some level associated to invisible quality, which will be
discussed in the next part. Answers like growing process and pesticide
show that consumers care about the different countries processes
regarding these two matters. Most of the respondents said after they had
answered growing process or pesticide that they think Sweden takes
good care of the environment buy using better pesticide than other
countries. They also consider Sweden to have high quality in every
stage of the process, which in return give the vegetables good taste,
colour etc. So in fact, what we have found out is that Swedish brands are
highly valuated on many levels among the consumers in Sweden.
Country of origin was also one of the seven factors in the final ranking
question but the analysis of this question showed that country of origin
was ranked on the sixth and seventh place. We draw the conclusion that
country of origin is a factor the consumers consider to be unimportant for
them even though we have stated above that country of origin matter to
our sample group. We think this depends on when country of origin
stands alone as a factor it is important for the consumers but when the
consumers have to rank among other factors, country of origin drops its
importance for the consumers.
We draw the conclusion regarding the country of origin factor that it is
only important for the consumers if the factor stands alone and not
compared to other factors. The consumers rate the Swedish brands as
better than imported since they have a high belief in the Swedish
environment laws.

85
9.6 The conclusions of the invisible quality factor
Invisible quality is one of the four factors, which may or may not
influence brand loyalty in frozen vegetables. We had four questions
regarding invisible quality included in the questionnaire. By these
questions we will be able to draw the conclusion if invisible quality will
influence brand loyalty.
As discussed in the brand loyalty part, invisible quality was our main
interest in this dissertations beginning but because lack of time and very
little written about the subject we decided to put brand loyalty as a centre
part. Invisible quality still takes a major part of the dissertation and is one
of our main interests as a factor in the research model.
At the first sight of the subject we did not know what invisible quality was
so our first assignment was to find out what the subject was about.
Invisible quality is hidden qualities that the consumers cannot detect by
repurchase or through normal use (Hoffmann, 2000). This statement
from Hoffmann made our interest in the subject grow even more. The
next step was to find out if the consumers knew what the concept was.
Since we now know that 80 of the 100 respondents in our sample do not
know what invisible quality is, we wanted to see if there were any
differences if we asked about the importance of invisible quality. In this
category we asked two questions to see if they would answer differently
but it is in fact the same questions, they are only asked differently.
First they had to answer the importance of trace (pesticides etc.) in
frozen vegetables and than the importance of invisible quality. Our
analysis showed that the two largest groups in the question about trace
of frozen vegetables, is in the “neither” category nor the “important”
category. In the question about the importance of invisible quality there
is a larger group of respondents which thinks that invisible quality is
totally unimportant and two equal groups who thinks the trace in frozen
vegetables is “neither” or “important” for them. The difference we see in

86
the two questions is that in the question about the importance of invisible
quality has a larger group in the “total unimportant” category. We draw
the conclusion that since so many respondents do not know what the
concept invisible quality is, they do not either consider it to be important
for their choice of brand. We also draw the conclusion that since the
consumers recognize the words “trace in frozen vegetables”, they
consider it to be more important than “invisible quality” even though it is
the same thing.
To be able to answer one of our main questions; How important is
invisible quality for brand loyalty and the active choice of brand of frozen
vegetables for the consumers, we needed to find out if they rank invisible
quality high compared to other factors. We therefore asked a ranking
question. The second part of the main question, how important invisible
quality is for the consumers’ active choice of brand, is answered above;
invisible quality is not important for the consumers’ active choice of
brand.
In the ranking question we mixed three invisible quality factors with four
visible factors like taste, consistency etc. To be able to find out how the
consumers who have stated that they do not know what invisible quality
is have ranked invisible quality, we did cross tabulations.
The analysis shows that in the first ranked option of the ranking question
it is 46 of the 80 respondents, which do not know what invisible quality
is, that have put nutrition, pesticide and fibre as their first choice and by
this considered the invisible qualities to be the most important factors for
them. If we look into the second and third ranked options we see the
same pattern; 35 of the respondents see nutrition, pesticide and fibre as
their second ranked option and 32 that consider nutrition, pesticide and
fibre as their third ranked option.
We draw the conclusion that that the consumers do not know what
invisible quality is but they rank the invisible factors fairly high. We think

87
it is the concept invisible quality that the consumers do not have
knowledge or recognition in. It is not the invisible factor of frozen
vegetables they have problem with since they are able to rank them very
high among visible factors.
When we had asked the questionnaire, there were many respondents
that wanted information about invisible quality since they stated in the
questionnaire that they did not know what it was. We explained it for
them and then they said, “I know what that is” and asked us to change
their answers in the questionnaire, which we of course did not since it,
was the whole purpose of the dissertation.
To be able to answer the first part of our main question: how important is
invisible quality for brand loyalty, we used different cross tabulations and
diagrams etc. We think that in the long run invisible quality may be very
important for brand loyalty but the companies need to find a way to
communicate the concept invisible quality with the consumers.
In invisible quality we have concluded that the consumers do not know
what the concept invisible quality is and we can also answer the second
part of our main question; they do not consider the concept invisible
quality to be important for their active choice of brand in frozen
vegetables. The respondents have stated that they do not know what the
concept invisible quality is but they ranked the invisible factors fairly high
in the ranking question. Finally we state that invisible quality only
influences brand loyalty if the companies communicate invisible qualities
as invisible quality factors.
9.7 The conclusion of the dissertation
The dissertation’s first main question was to find out how important
invisible quality is for brand loyalty and the active choice of brand loyalty
of frozen vegetables. We draw the conclusion of the first part that

88
invisible quality is not important for brand loyalty since we cannot
ascertain that invisible quality will fully influence brand loyalty.
In the second part of the question we state that the consumers do not
consider the concept invisible quality to be important for their active
choice of brand of frozen vegetables. But we think that if we have asked
the question, if invisible quality is important for the active choice of
brand, after we have explained the concept invisible quality, our findings
would be different. Hoffmann (2000) states in the chapter about brand
loyalty that if the consumers trust the party giving the information it may
lead to brand loyalty in time. We think this theory is correct and the
companies therefore need to find a way to communicate invisible quality
factors to the consumers, especially if the companies have a desire to be
profiled as a company that invests a lot in those kinds of factors in their
products.
The second main question in the dissertation was to find out which
factors influence brand loyalty. Our way toward these findings regarding
this question are explained earlier in this chapter but we will once more
state the findings:
• We have here been able to indicate that experienced knowledge
influence brand loyalty in both directions. As long the brand has
equal quality the consumers will be brand loyal.
• Price will only influence brand loyalty as long as the brand fits the
consumers’ price preferences.
• Country of origin influence brand loyalty when it comes to the
domestic brand.
• Invisible quality will only influence brand loyalty if the companies
communicate invisible factors to the consumers.
We are aware that other studies regarding brand loyalty, in general,
have showed that some of these factors actually fully influence brand
loyalty. We are also aware that there are many other ways and levels of

89
testing associations, connections etc. between variables. We think that if
this kind of study regarding frozen vegetables would be done on a higher
level, the findings would be different. Although, we stand behind this
study and consider that these four factors do not influence brand loyalty
of frozen vegetables.
We stated earlier that we had trouble finding relevant theories regarding
invisible quality in the frozen vegetables area or invisible quality in other
products for that matter. We consider there is a need of a theory
regarding the consumers’ knowledge of the concept invisible quality.
Why we keep on calling it the “concept of invisible quality” is because
clearly the consumers are not familiar with the concept but are aware of
the factors that invisible quality contains like nutrition, pesticides and
cultivation processes etc. We now present a theory, which we think is up
to other users/authors to analyse or do further research on.
Consumers do not know what the concept invisible quality is but they
consider it to be very important for their active choice of brand of frozen
vegetables depending on what kind of preferences the consumers have.
9.8 Reworked research model
Because of the findings regarding the factors, we had to rework our
research model.

90
Figure 9.2 Reworked research model over brand loyalty and the four factors.
With this reworked research model we want to show that none of the
factors influence brand loyalty. We took the four factors and replaced
them as independent factors beside the original model. We have
decided not to take this model any further other than the model shown
above since our findings only stretch this far. At this point we cannot
determine if the factors influence each other and that was not either our
purpose with this dissertation, although, a very interesting thought. This
will lead us to the last part of this dissertation, suggestions for further
research.
9.9 Suggestions for further research
After we finished this dissertation we can present our findings regarding
brand loyalty and invisible quality. Our research results show that the
respondents do not know what the concept is but they consider it to be
important for them. Our suggestion for further research within this area is

91
to find a solution for the companies to communicate invisible quality in
an easy way to the consumers.
Another suggestion within this area is to build a model around trust and
commitment. This is an important area, because invisible quality is
qualities that the consumers cannot ascertain by themselves, they have
to trust the companies giving the information. There is a lot written within
the trust and commitment but it will be a challenge to associate it with
invisible quality.

92
List of references Aaker, David, 2002,”Building strong brands”, Simon & Schuster Inc, New York, USA Aaker, David A, 1995, “Strategic market management – fourth edition”, John Wiley Ltd, USA Aaker, David A, 1991,”Managing Brand Equity”, Simon & Schuster Inc, New York, USA Agresti & Finlay, 1999,”Statistical Methods for the Social Sciences”,
Prentince Hall, New Jersey, USA Antonides & Van Raaij, 1998,”Consumer behaviour - A European
perspective”, John Wiley Ltd, West Sussex, England. Arnold, David, 1992,”The Handbook of Brand Management”, The Economist Books, Wakefield, USA Aronsson, Åke, 1997, ”SPSS för Windows 95”, Studentliteratur, Lund,
Sweden Bergman & Klefsjö, 2003,”Quality, from Customer Needs to Customers Satisfaction”, Student literature, Lund, Sweden. Birks & Malhotra, 1999,”Marketing research – an applied approach”,
Second edition, Prentice-Hall Inc., London, England Birn, Robin, 1992,”The Effective Use of Marketing research – a guide for
management”, Biddles Ltd, London, England. Chisnall, Peter, 1997.”Marketing research – 5 edition”, Mcgraw-Hill
Publishing Company, Berkshire, England. De Chernatony, Leslie & McDonald, Malcolm, 1998,”Creating Powerful
Brands”, Second edition, Butterworth – Heinemann, Oxford, England.
Hansen, Torben, 1998,”Forbrugerens perceptionsproces i relation til fødevarers kvalitet”, HHK, Reproafdelingen, København.
Holme I. M. & Solvang, B. K., 1991, ”Forskningsmetodik – Om kvalitativa och kvantitativa metoder”, Student litteratur, Lund, Sweden.
Höglund, B. & Lingbell, R., 1996,”Varumärkets makt”, Skogs Boktryckeri AB, Trelleborg, Sweden.
Keller, K., 2003,”Strategic brand Management- Building, Measuring, and Managing brand Equity”, Prentice Hall Inc., USA
Kotler, P., & Armstrong, G., 1999,”Principles of Marketing”, Prentice Hall International Inc., USA, 2nd European edition.
Kotler, P., & Armstrong, G., 1994,”Principles of Marketing”, Prentice Hall International Inc., USA, 6th edition.
Melin Frans, 1999,”Varumärkesstrategi- om konsten att utveckla starka varumärken”, Liber ekonomi, Malmö, Sweden.
Melin & Urde, 1991,”Varumärket- en hotad tillgång”, Liber ekonomi, Malmö, Sweden.
Interbrand Group, 1992,”World’s Greatest Brands: an international review”, New York: John Wiley Ltd,
Papadopoulos & Heslop 1987,”Does country of origin matter”, Marketing Science Institute, Cambridge, USA.

93
Patel, R. & Tebelius, U., 1987,”Grundbok i forskningsmetodik”, Studentliteratur, Lund, Sweden.
Saunders, Lewis & Thornhill, 2003,”Research Methods for Business Students – third edition”, Rotolito Lombarda, Italy.
Seymour, D.T., 1992, ”Marknadsundersökningar med kvalitativa metoder”, IHM Förlag AB, Göteborg, Sweden.
Solomon, Micheal R. 2002,”Consumers behaviour”, Prentice-Hall Inc., New Jersey, USA.
Söderlund, Magnus 1997,”Den nöjda kunden”, Liber Ekonomi, Stockholm, Sweden.
Söderlund, Magnus 2001,”Den lojala kunden”, Liber Ekonomi, Malmö, Sweden.
Sörqvist, Lars 2000,”Kundtillfredsställelse och kundmätningar”, Student literatur, Lund, Sweden.
Wanger, Pierre 2002,”Kundpsykologi”, Student literature, Lund, Sweden. Articles Foxall, G. & Schrezenmaier T. (2003, No 24). ”The behavioural economics
of consumer brand choice: Establishing a methodology”. Journal of economic psychology, 675-695.
Grunert, K. (2002, April). ”Current issues in the understanding of consumer food choice”. Trends in Food Science & technology, 275-285.
Hoffmann, R. (2000, No 3).”Country of origin – a consumer perception perspective of fresh meat”. British Food Journal, 211-229.
Imram, N. (1999, Sept). ”The role of visual cues in consumer perception and acceptance of a food product”. Nutrition & Food Science, 224-228.
Urala, N. & Lähteenmäki, L. (2003, No 4). ”Reasons behind consumers’ functional food choices”. Nutrition & Food Science, 148-158.
Zeithaml V. (1988, July).”Consumer perceptions of price, quality and value”, Journal of Marketing.
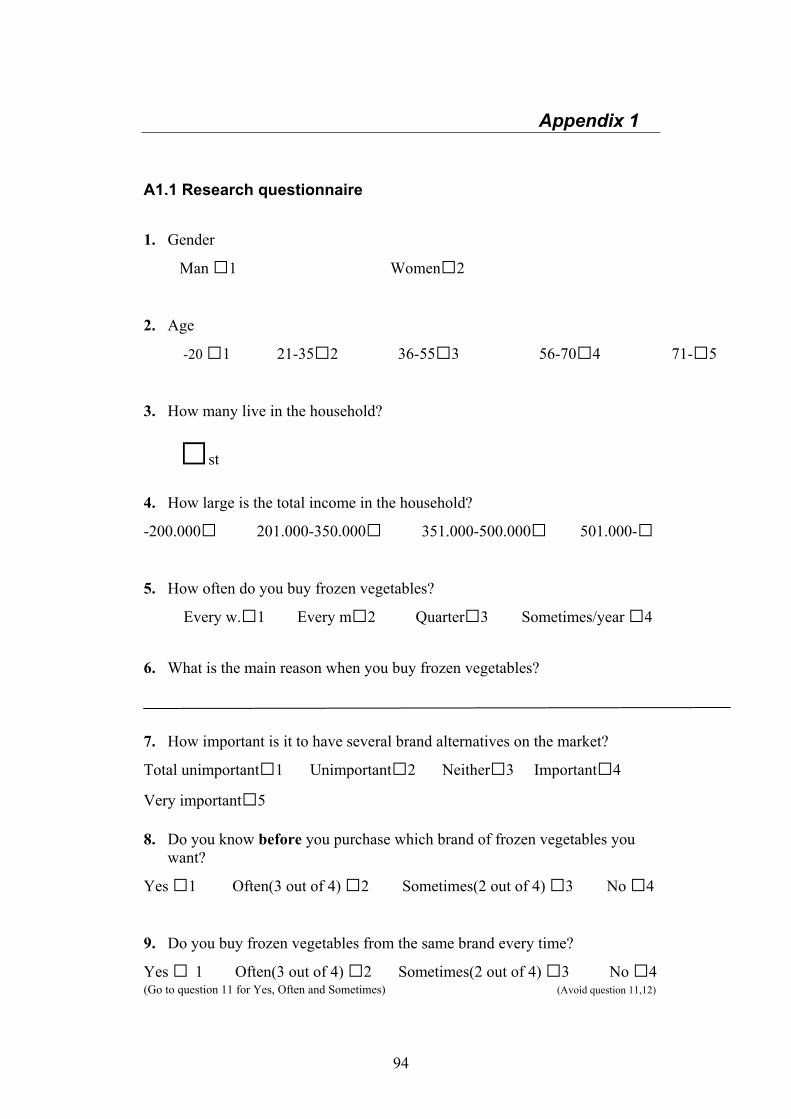
94
Appendix 1
A1.1 Research questionnaire
1. Gender
Man □1 Women□2
2. Age
-20 □1 21-35□2 36-55□3 56-70□4 71-□5 3. How many live in the household?
□st
4. How large is the total income in the household?
-200.000□ 201.000-350.000□ 351.000-500.000□ 501.000-□
5. How often do you buy frozen vegetables?
Every w.□1 Every m□2 Quarter□3 Sometimes/year □4
6. What is the main reason when you buy frozen vegetables? 7. How important is it to have several brand alternatives on the market?
Total unimportant□1 Unimportant□2 Neither□3 Important□4 Very important□5 8. Do you know before you purchase which brand of frozen vegetables you
want?
Yes □1 Often(3 out of 4) □2 Sometimes(2 out of 4) □3 No □4 9. Do you buy frozen vegetables from the same brand every time?
Yes □ 1 Often(3 out of 4) □2 Sometimes(2 out of 4) □3 No □4 (Go to question 11 for Yes, Often and Sometimes) (Avoid question 11,12)
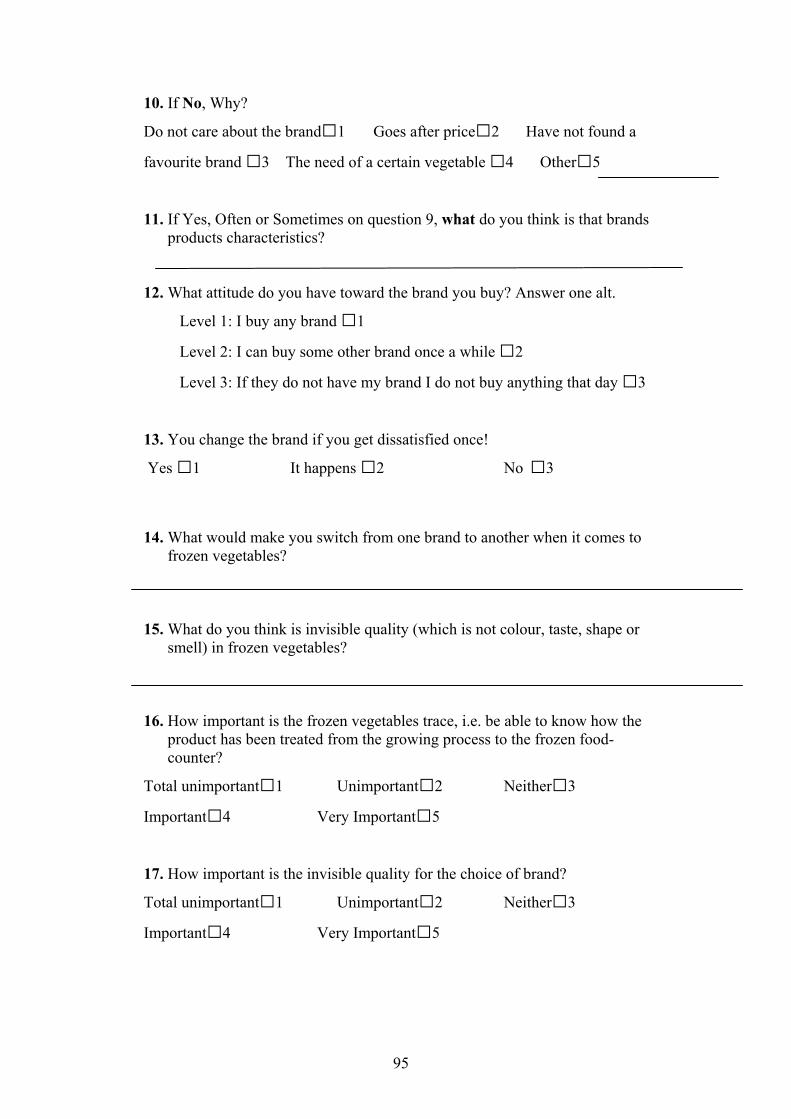
95
10. If No, Why?
Do not care about the brand□1 Goes after price□2 Have not found a
favourite brand □3 The need of a certain vegetable □4 Other□5
11. If Yes, Often or Sometimes on question 9, what do you think is that brands
products characteristics?
12. What attitude do you have toward the brand you buy? Answer one alt. Level 1: I buy any brand □1 Level 2: I can buy some other brand once a while □2 Level 3: If they do not have my brand I do not buy anything that day □3
13. You change the brand if you get dissatisfied once!
Yes □1 It happens □2 No □3 14. What would make you switch from one brand to another when it comes to
frozen vegetables?
15. What do you think is invisible quality (which is not colour, taste, shape or smell) in frozen vegetables?
16. How important is the frozen vegetables trace, i.e. be able to know how the
product has been treated from the growing process to the frozen food-counter?
Total unimportant□1 Unimportant□2 Neither□3 Important□4 Very Important□5 17. How important is the invisible quality for the choice of brand?
Total unimportant□1 Unimportant□2 Neither□3 Important□4 Very Important□5

96
18. How important is the price for the choice of brand?
Total unimportant□1 Unimportant□2 Neither□3 Important□4 Very Important□5
19. How important is it to know the frozen vegetables country of origin for the
choice of brand?
Total unimportant□1 Unimportant□2 Neither□3 Important□4 Very Important□5 20. If it is important or very important from which country the vegetables come
from, why?
21. Rank the following types of information about frozen vegetables after how important they are for you. 1 is the most important, 2 second most important etc.
Nutrition, vitamins etc. □1 Cultivations process, pesticides etc. □2 Colour□3 Country of origin □4 Taste □5 Consistency □6
Fibre contents □7

97
Appendix 2
A2.1 Describing the data In this part we have analysed the general data. For example how the
respondents are divided between men and women and how often and
for what reasons they buy frozen vegetables.
In the questionnaire we began with some describing questions so we
would get a picture over the data we would analyse. In the model below
we present those questions that were asked regarding the general data.
Figure A2.1 Model over the questions in the describing data part
Question 1 and 2 is obvious questions to include in the dissertation since
they give a descriptive picture of the data material. Question 3 was
asked so we would be able to know how many they live in the household
since this can have affect on why they buy frozen vegetables, how many
times they buy, if they are price-sensitive or not etc. We had the same
motive with question 4, how big is the total income in the household.
Question 5 and 6 were asked to find out the respondents’ behaviour and
buying process toward frozen vegetables. We will now start the analysis
of the describing data.

98
We interviewed 100 respondents and of these respondents we had 70
women and 30 men. The gender group, female, is overrepresented
compared to the gender, group, male and this may be due to it is the
women that do the grocery purchases. A cross tabulation was made
between question 1, 2 and 4, this to able to get a good overview.
Age * Income * Gender Crosstabulation
Count
6 6 1 131 3 4 8
2 4 3 98 11 3 8 302 1 37 10 6 1 243 5 9 4 214 3 6 137 2 9
23 21 21 5 70
21-3536-5556-70
Age
Total-2021-3536-5556-7071-
Age
Total
Gender
Male
Female
-200tkr 201-350 351-500 501-Income
Total
Table A2.1 Question 4 (income) crossed with question 2 (age) and a third variable, question 1
(gender)
We have already seen that the gender, group, female is over presented
but we see from the table above that the most represented age group is
21-35, both for men and women. We also see a pattern in the table that
there is a difference in income classes regarding the different gender
groups.
A2.2.1 Household crossed with how often consumers buy frozen
vegetables
We were interested to find out if there are any special preferences
regarding how many they live in the household and how often they buy
frozen vegetables. We crossed question 3, how many they live in the
household, with question 5, how often they buy frozen vegetables.

99
Household * How often Crosstabulation
Count
8 14 3 6 3114 12 6 5 375 8 1 144 7 3 142 1 31 1
34 42 13 11 100
123456
Household
Total
Every w. Every m. QuarterEvery now
and then/year
How often
Total
Table A2.2 Cross tabulation over how many they live in the household crossed with how often they buy frozen vegetables
We crossed these two questions because we wanted to see if there is a
pattern between household and how often they buy frozen vegetables.
Regarding the amount of people living in the household we got answers
between 1 and 6 people. Our calculations showed that 34 of the
respondents buy frozen vegetables every week and 42 buy every month.
An interesting view of this tabulation is that we see a pattern how often
they buy frozen vegetables compared to how many they live in the
household. The pattern shows that the fewer they are in the household;
the more it is spread out over the time they buy frozen vegetables, from
every week to every now and then per year. The households that have 3
to 4 family members do not buy frozen vegetables less than every
quarter while the households containing 5 or 6 do not buy less than
every week. We consider this to be natural since the more people live in
the household, the more food they have to buy.
A2.2.2 Main reasons for buying frozen vegetables
We have now looked at age, gender, income, the amount of people in
the household and how often they buy frozen vegetables. We have also
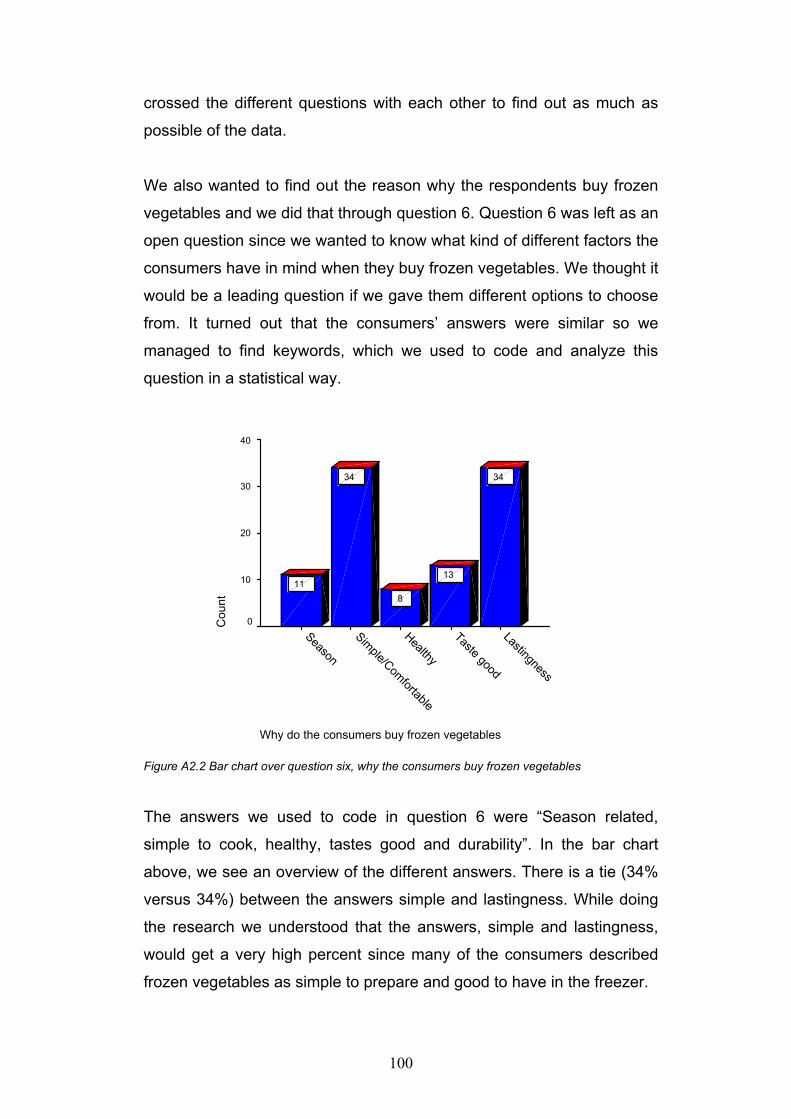
100
crossed the different questions with each other to find out as much as
possible of the data.
We also wanted to find out the reason why the respondents buy frozen
vegetables and we did that through question 6. Question 6 was left as an
open question since we wanted to know what kind of different factors the
consumers have in mind when they buy frozen vegetables. We thought it
would be a leading question if we gave them different options to choose
from. It turned out that the consumers’ answers were similar so we
managed to find keywords, which we used to code and analyze this
question in a statistical way.
Why do the consumers buy frozen vegetables
Lastingness
Taste good
Healthy
Simple/Comfortable
Season
Cou
nt
40
30
20
10
0
34
13
8
34
11
Figure A2.2 Bar chart over question six, why the consumers buy frozen vegetables
The answers we used to code in question 6 were “Season related,
simple to cook, healthy, tastes good and durability”. In the bar chart
above, we see an overview of the different answers. There is a tie (34%
versus 34%) between the answers simple and lastingness. While doing
the research we understood that the answers, simple and lastingness,
would get a very high percent since many of the consumers described
frozen vegetables as simple to prepare and good to have in the freezer.

101
Appendix 3
A3.1 The purpose of the brand loyalty questions
The purpose with the brand loyalty questions was to find out how brand
loyal the respondents are toward brands regarding frozen vegetables. To
a starting point within the brand loyalty area we wanted to find out the
respondents’ attitude toward different brand options on the market. We
asked question 7 to the respondents, how important it is to have several
brand-options on the market, to see if they care about other brands.
Question 8 was asked to find out if the consumers are so brand loyal
that they know before they do their purchase of frozen vegetables which
brand to buy of frozen vegetables. We consider question 9 to be very
important, both for the brand loyalty part and also for the whole picture
since we see this question as the “true” brand loyalty question. The
question is both forward and simple. “Do you buy the same brand every
time you buy frozen vegetables?”
Question 10 is a following up question to question 9. The respondents
who answered “No” on question 9 went right away to question 10. With
question 10 we wanted to find out the reasons the respondent have for
not buying the same brand every time. Question 11 is also a following up
question to question 9 but in this case it is the respondents who
answered “yes, often and sometimes” on question 9 that moves to
question 11. Question 11 was asked as an open question to find out the
specific brands characteristics which the consumer buys all the time,
often or sometimes. The final brand loyalty question was question 12
and the purpose with this question is very simple, to find out which brand
loyalty level the consumers see themselves belong on.

102
Appendix 4
A4.1 Importance of several brand alternatives on the market
Our reasoning toward the respondents, who think it is important or very
important with several brand options on the market, is not very loyal
consumers. Contrary to the respondents who think it is totally
unimportant or important with several brand options on the market. We
believe those respondents are loyal toward a specific brand. To get a
good overview, we made a bar chart over question 7.
Alternatives of brands on the market
Very importantImportant
NeitherUnimportant
Total unimportant
Cou
nt
60
50
40
30
20
10
0
8
50
1918
5
Figure A4.1 Bar chart over the importance to have several brand alternatives on the market
The bar chart tells us that 58 of the respondents think it is important or
very important to have several brand options on the market and only 23
of the respondents think it is unimportant or totally unimportant with
several brand options on the market.
Our argument about the 58 respondents who think it is important to have
several brand options on the market is that they have not found their
specific brand and are therefore not loyal consumers. The 23
respondents, who think it is unimportant or totally unimportant with
several brand options on the market, have found their brand and

103
therefore do not care about other brands. We consider them to be brand
loyal.
Some of the consumers are more loyal than others and therefore only
want other brands available on the market in case something would
happen to their own brand. Other less loyal consumers want other
brands on the market because of the price situation that would arise if
only few brands were available.

104
Appendix 5
A5.1 The purpose with the questions in the factor price
Question 18 was the clear question we had about price and was asked
to see how important the factor is for the consumers’ active choice of
brand. Price also came up in other coherences. For e.g. price came up
as an influencing factor in question 10, why the respondents never buy
the same brand, as a brand characteristics factor in question 11 and as
a reason to switch to another brand in question 14.
Importance with brands alt. on the market * Importance of price Crosstabulation
Count
1 1 2 1 53 2 10 3 18
2 2 6 6 3 196 10 8 21 5 50
2 4 2 89 17 17 43 14 100
Total unimportanUnimportantNeitherImportantVery important
Importancewith brandsalt. on themarket
Total
Totalunimportant Unimportant Neither Important
Veryimportant
Importance of price
Total
Table A5.1 Cross tabulation between question seven, importance with alt. brands on the market crossed with question eighteen, the importance of price.
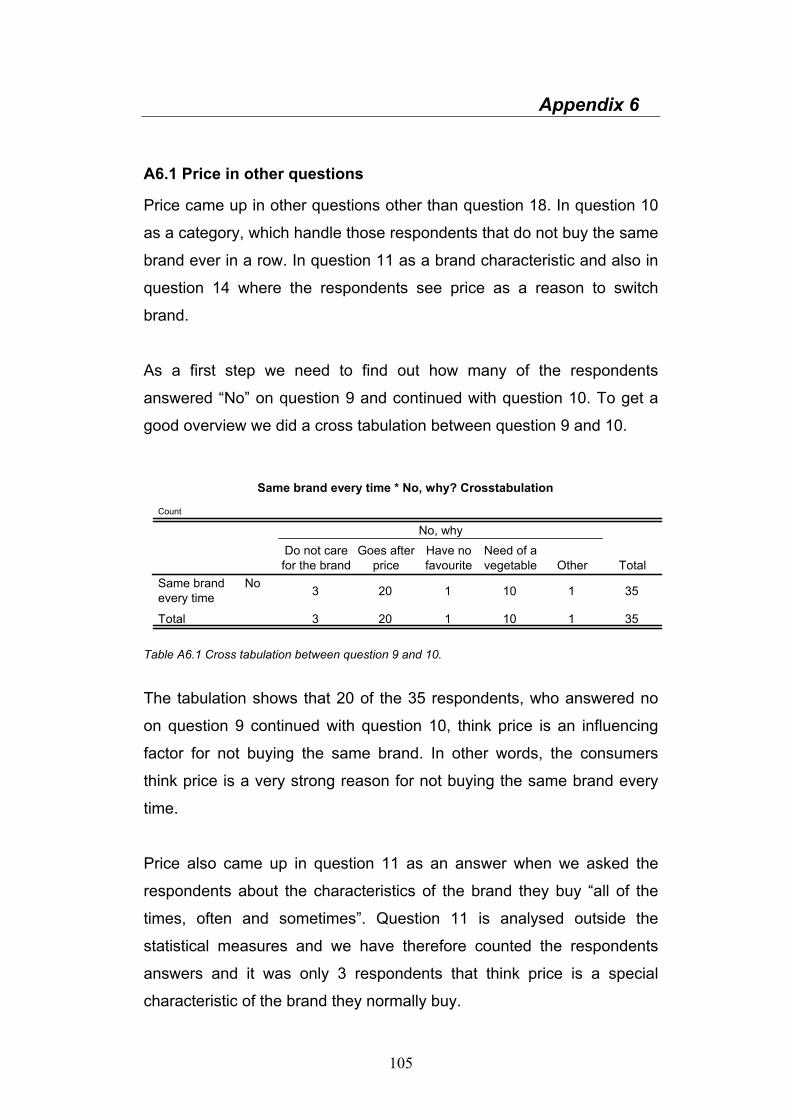
105
Appendix 6
A6.1 Price in other questions
Price came up in other questions other than question 18. In question 10
as a category, which handle those respondents that do not buy the same
brand ever in a row. In question 11 as a brand characteristic and also in
question 14 where the respondents see price as a reason to switch
brand.
As a first step we need to find out how many of the respondents
answered “No” on question 9 and continued with question 10. To get a
good overview we did a cross tabulation between question 9 and 10.
Same brand every time * No, why? Crosstabulation
Count
3 20 1 10 1 35
3 20 1 10 1 35
NoSame brandevery time
Total
Do not carefor the brand
Goes afterprice
Have nofavourite
Need of avegetable Other
No, why
Total
Table A6.1 Cross tabulation between question 9 and 10.
The tabulation shows that 20 of the 35 respondents, who answered no
on question 9 continued with question 10, think price is an influencing
factor for not buying the same brand. In other words, the consumers
think price is a very strong reason for not buying the same brand every
time.
Price also came up in question 11 as an answer when we asked the
respondents about the characteristics of the brand they buy “all of the
times, often and sometimes”. Question 11 is analysed outside the
statistical measures and we have therefore counted the respondents
answers and it was only 3 respondents that think price is a special
characteristic of the brand they normally buy.

106
Appendix 7
A7.1 The purpose with the questions in experienced knowledge
We had three questions included in the questionnaire about experienced
knowledge. The first question 11, which is an open question, included
experienced knowledge as an answer and is therefore included in this
part. The second question 13, was asked to find out if the respondents
change brand if they will be dissatisfied once. The purpose with this
question was to find out if the consumers experienced knowledge about
a certain brand is important. Will they switch brand if their former
experience is not achieved? Question 14 was asked to find out different
reasons the respondents have for changing brand. We asked this
question to find out the reasons the consumers consider being so strong
for changing brand.
Dissatisfaction * Changing factors Crosstabulation
Count
23 12 3 3 4114 8 13 3 385 3 9 4 21
42 23 25 10 100
Yes SometimesNo
Dissatisfaction
Total
Poorerquality
Newalternatives
on the market Price
The brandwas not
there
Changing factors
Total
Table A7.1 Cross tabulation between questions thirteen, dissatisfaction crossed with question fourteen, factors for switching brand.

107
Appendix 8
A8.1 The purpose of the questions in country of origin
Question 19 was asked to find out the importance of country of origin
since it is a good starting point for the rest of the analysis of country of
origin. Question 20 was a following up question for those respondents
who answered important or very important on question 19. We kept
question 20 as an open question because we wanted the respondents to
speak freely and we wanted to know why the respondents saw country
of origin as important or very important.

108
Appendix 9
A9.1 The purpose with the questions in invisible quality
The first question in the questionnaire about invisible quality is question
15. The purpose with question 15 was to find out if the respondents
know what invisible quality is. Even though we suspected that most of
the respondents would not know about the concept, we included the
question since it is one of the dissertations main questions and we also
needed to prove our suspicions.
Question 16 and 17 are two questions with the same motive. We wanted
to see if the respondents would answer differently since we used the
word “invisible quality” in one and not in the other question. We asked
question 16 to find out if the respondents think the trace of frozen
vegetables is important. Question 17 was asked to find out if the
respondents think invisible quality is important for their choice of brand.
The last question within the invisible quality is question 21. We had this
question as a ranking question with seven options mixed with both
invisible and visible quality dimensions. This question was asked to find
out if the respondents rank invisible quality dimensions high, even if they
do not know what the concept is about.
The importance of invisible quality
Very importantImportant
NeitherUnimportant
Total unimportant
Cou
nt
40
30
20
10
0
10
31
25
11
23
Figure A9.1 Bar chart over the importance of invisible quality
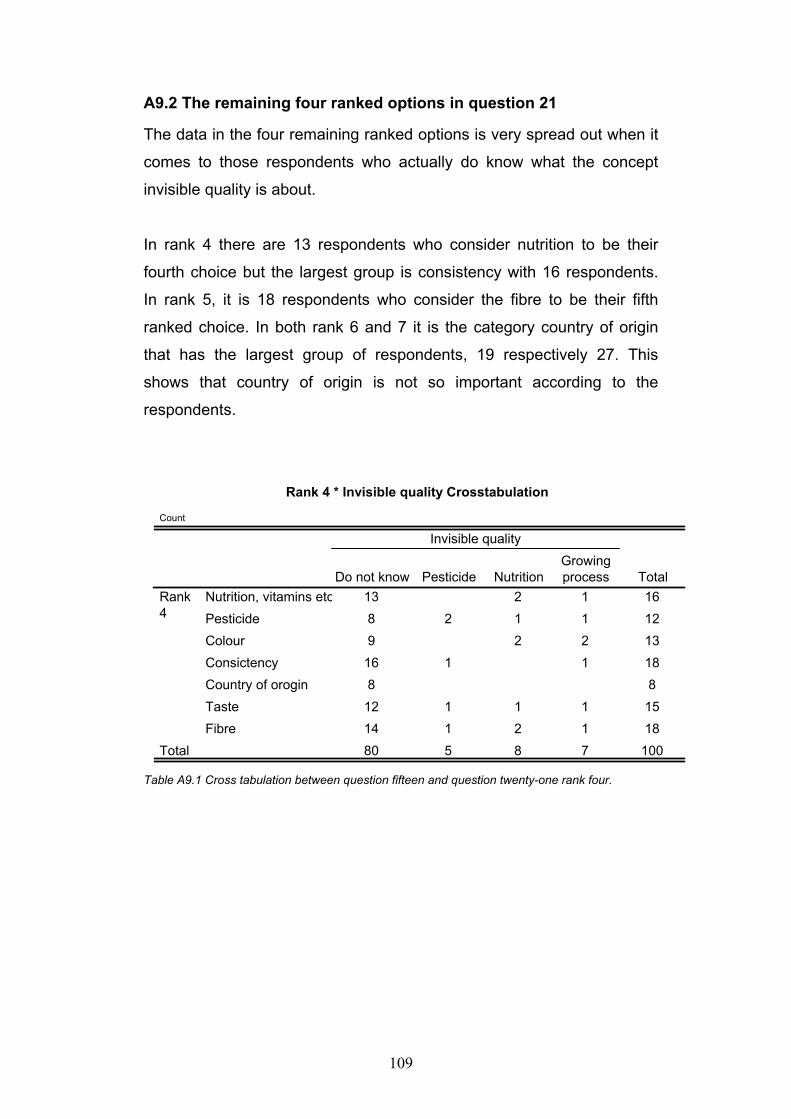
109
A9.2 The remaining four ranked options in question 21
The data in the four remaining ranked options is very spread out when it
comes to those respondents who actually do know what the concept
invisible quality is about.
In rank 4 there are 13 respondents who consider nutrition to be their
fourth choice but the largest group is consistency with 16 respondents.
In rank 5, it is 18 respondents who consider the fibre to be their fifth
ranked choice. In both rank 6 and 7 it is the category country of origin
that has the largest group of respondents, 19 respectively 27. This
shows that country of origin is not so important according to the
respondents.
Rank 4 * Invisible quality Crosstabulation
Count
13 2 1 168 2 1 1 129 2 2 13
16 1 1 188 8
12 1 1 1 1514 1 2 1 1880 5 8 7 100
Nutrition, vitamins etcPesticideColourConsictencyCountry of oroginTasteFibre
Rank4
Total
Do not know Pesticide NutritionGrowingprocess
Invisible quality
Total
Table A9.1 Cross tabulation between question fifteen and question twenty-one rank four.

110
Rank 5 * Invisible quality Crosstabulation
Count
5 1 1 7
11 1 2 1 1515 2 1 1 1915 1 2 2 2010 1 116 1 1 8
18 1 1 2080 5 8 7 100
Nutrition, vitaminsetc.PesticideColourConsictencyCountry of originTasteFibre
Rank5
Total
Do notknow Pesticide Nutrition
Growingprocess
Invisble quality
Total
Table A9.2 Cross tabulation between question fifteen and question twenty-one rank fife.
Rank 6 * Invisible quality Crosstabulation
Count
7 79 1 10
16 3 1 2012 1219 1 3 3 264 1 5
13 1 3 3 2080 5 8 7 100
Nutrition, vitamins etcPesticideColourConsistencyCountry of originTasteFibre
Rank6
Total
Do not know Pesticide NutritionGrowingprocess
Invisible quality
Total
Table A9.3 Cross tabulation between question fifteen and question twenty-one rank six.

111
Rank 7 * Invisible quality Crosstabulation
Count
11 1 1217 2 1 205 1 1 727 2 4 2 352 1 318 1 2 2 2380 5 8 7 100
PesticideColourConsistencyCountry of originTasteFibre
Rank7
Total
Do not know Pesticide NutritionGrowingprocess
Invisble quality
Total
Table A9.4 Cross tabulation between question fifteen and question twenty-one rank seven.