investor relations report 2q13 results - bradespar · (previ) – 30.0% and bonaire participações...
TRANSCRIPT

INVESTOR RELATIONS REPORT
2Q13 RESULTS
13,178,359.70
2Q13
EARNINGS RELEASE
1
1
2Q13 Earnings Release
São Paulo, Brazil, August 14, 2013 – BRADESPAR [BM&FBOVESPA: BRAP3 (ON), BRAP4 (PN);
LATIBEX: XBRPO (ON), XBRPP (PN)] announces its results for 2Q13.
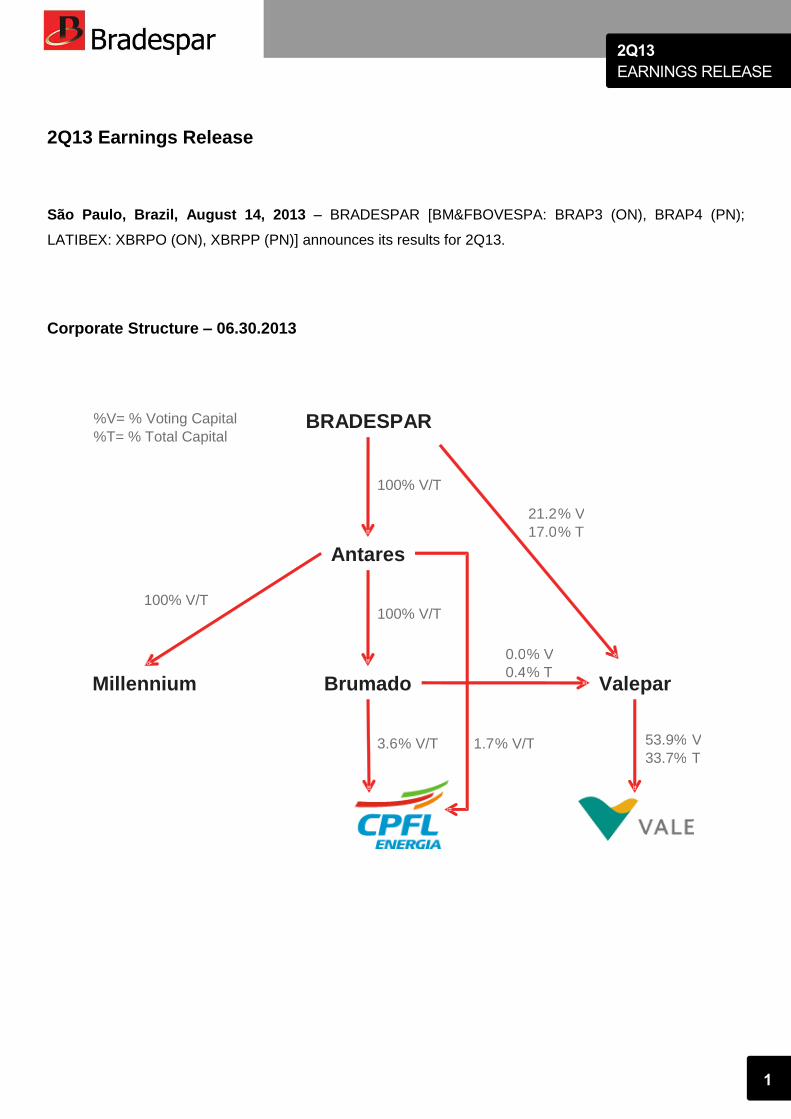
Corporate Structure – 06.30.2013
100% V/T
BRADESPAR
Antares
Brumado Millennium Valepar
100% V/T
100% V/T
3.6 % V/T 1.7 % V/T
21.2 % V 17.0 % T
53.9% V 33.7% T
%V= % Voting Capital %T= % Total Capital
0.0 % V 0.4 % T
2Q13
EARNINGS RELEASE
2
2
COMMENTS ON THE COMPANY´S PERFORMANCE
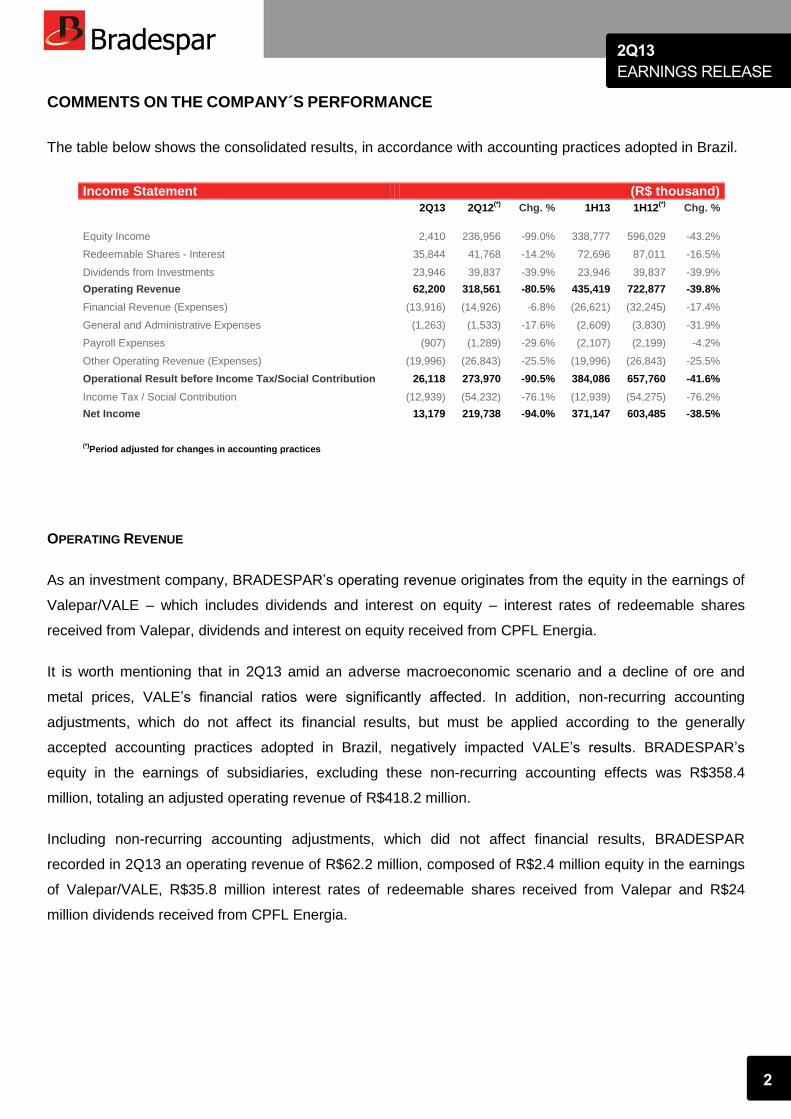
The table below shows the consolidated results, in accordance with accounting practices adopted in Brazil.
Income Statement (R$ thousand)
2Q13 2Q12
(*) Chg. % 1H13 1H12
(*) Chg. %
Equity Income 2,410 236,956 -99.0% 338,777 596,029 -43.2%
Redeemable Shares - Interest 35,844 41,768 -14.2% 72,696 87,011 -16.5%
Dividends from Investments 23,946 39,837 -39.9% 23,946 39,837 -39.9%
Operating Revenue 62,200 318,561 -80.5% 435,419 722,877 -39.8%
Financial Revenue (Expenses) (13,916) (14,926) -6.8% (26,621) (32,245) -17.4%
General and Administrative Expenses (1,263) (1,533) -17.6% (2,609) (3,830) -31.9%
Payroll Expenses (907) (1,289) -29.6% (2,107) (2,199) -4.2%
Other Operating Revenue (Expenses) (19,996) (26,843) -25.5% (19,996) (26,843) -25.5%
Operational Result before Income Tax/Social Contribution 26,118 273,970 -90.5% 384,086 657,760 -41.6%
Income Tax / Social Contribution (12,939) (54,232) -76.1% (12,939) (54,275) -76.2%
Net Income 13,179 219,738 -94.0% 371,147 603,485 -38.5%
(*)Period adjusted for changes in accounting practices
OPERATING REVENUE
As an investment company, BRADESPAR’s operating revenue originates from the equity in the earnings of
Valepar/VALE – which includes dividends and interest on equity – interest rates of redeemable shares
received from Valepar, dividends and interest on equity received from CPFL Energia.
It is worth mentioning that in 2Q13 amid an adverse macroeconomic scenario and a decline of ore and
metal prices, VALE’s financial ratios were significantly affected. In addition, non-recurring accounting
adjustments, which do not affect its financial results, but must be applied according to the generally
accepted accounting practices adopted in Brazil, negatively impacted VALE’s results. BRADESPAR’s
equity in the earnings of subsidiaries, excluding these non-recurring accounting effects was R$358.4
million, totaling an adjusted operating revenue of R$418.2 million.
Including non-recurring accounting adjustments, which did not affect financial results, BRADESPAR
recorded in 2Q13 an operating revenue of R$62.2 million, composed of R$2.4 million equity in the earnings
of Valepar/VALE, R$35.8 million interest rates of redeemable shares received from Valepar and R$24
million dividends received from CPFL Energia.
2Q13
EARNINGS RELEASE
3
3
FINANCIAL RESULT
BRADESPAR’s financial expenses/income came to R$13.9 million in 2Q13, lower than 2Q12, mainly due to
interest rates of BRADESPAR’s debentures, calculated based on interbank deposit rate (CDI), which
dropped from 2.1% in 2Q12 to 1.8% in 2Q13, impacted by a reduction of benchmark interest rate (SELIC)
in the period.
In the first half of 2013, financial expenses/income was R$26.6 million, down 17.4% on 1H12.
PAYROLL, GENERAL AND ADMINISTRATIVE EXPENSES
In 2Q13, payroll expenses amounted to R$907,000, compared to R$1.3 million in 2Q12. In the first half of
2013, payroll expenses came to R$2.1 million, down 4.2% on same period last year.
General and administrative expenses totaled R$1.3 million in 2Q13 and R$2.6 million in 1H13, down 17.6%
and 31.9% respectively, in the year-on-year comparison.
NET INCOME FOR THE PERIOD
BRADESPAR’s adjusted net income, excluding non-recurring accounting effects was R$369.2 million in
2Q13.
At VALE, in the same period, these non-recurring accounting adjustments include foreign exchange and
monetary losses, currency swap losses, among other, totaling R$6.1 billion, negatively impacting
BRADESPAR’s equity in the earnings of subsidiaries by R$356.0 million.
Considering non-recurring accounting adjustments, which did not affect financial results, BRADESPAR’s
net income was R$13.2 million in 2Q13.
2Q13
EARNINGS RELEASE
4
4
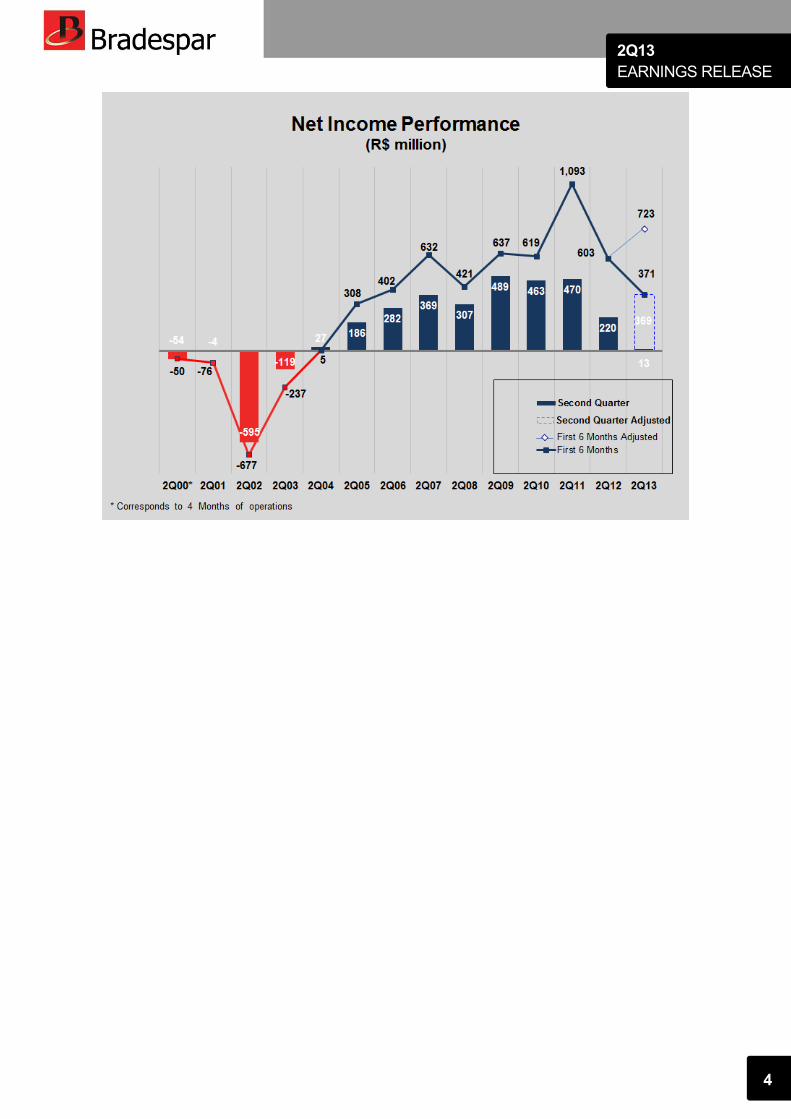
* Corresponds to 4 Months of operations
636
269
2Q13
EARNINGS RELEASE
5
5
COMMENTS ON OPERATIONAL INVESTEES
VALE
Among the world’s leading mining companies, VALE is present in more than 30 countries, distributed in five
continents. World leader in the production or iron ore and pellets, the company also operates in the
logistics, coal, manganese, copper and fertilizer segments. Vale is also the world’s second largest nickel
producer, which can be applied in the stainless steel and alloy industries to manufacture aircraft, vehicles,
mining equipment and energy, batteries, among others.
It is worth mentioning that VALE, in July 2013, obtained an installation environmental license for the
Carajás S11D (S11D) iron ore project, a worldwide project of higher quality and lower cost of the global
industry. S11D is the largest project in Vale’s history and also in the iron ore industry, which foresees
investments of nearly US$20 billion. With its startup as of 2017, VALE will reinforce its worldwide leadership
in the iron ore market in volume, cost and quality, thus, this project is a relevant leverage to create value
and increase production capacity.
VALE trades on the BM&FBOVESPA (VALE3 and VALE5), the New York Stock Exchange (NYSE) (VALE
and VALE.P), the NYSE Euronext Paris (VALE3 and VALE5), the Latibex (XVALO and XVALP) and the
Hong Kong Stock Exchange (HKEx) (6210 and 6230).
Adjusted net income, excluding non-recurring effects, came to R$6.9 billion in 2Q13. Including the
accounting adjustments, which do not affect VALE’s financial results, net income was R$832 million.
VALE’s main highlights in 2Q13, in comparison with 2Q12, were:
Operating revenue of R$ 23.4 billion (-6.8%);
Adjusted EBITDA of R$ 10.3 billion (+1.9%); and
Adjusted Net income of R$ 6.9 billion (-14.4%).
CPFL ENERGIA
CPFL Energia is a holding company that generates distributes, and commercializes electricity in Brazil
through its subsidiaries in both the regulated and free markets. It is also largest private group in the
Brazilian electricity segment.
2Q13
EARNINGS RELEASE
6
6
CPFL Energia’s shares are traded at BM&FBOVESPA Novo Mercado and at the New York Stock
Exchange (“NYSE”) through ADRs Level III, which evidences its adhesion to the highest corporate
governance standards.
Control of CPFL is shared between VBC Energia S.A. (Camargo Corrêa) – 24.4%, BB Carteira Livre I FIA
(Previ) – 30.0% and Bonaire Participações S.A. and Energia São Paulo FIP (Funcesp, Petros, Sistel and
Sabesprev) – 15.1% jointly. The remaining 30.5% corresponds to the free float, 5.3% of which is held by
BRADESPAR.
2Q13
EARNINGS RELEASE
7
7
CAPITAL MARKET
BRADESPAR’s shares are traded under the symbols BRAP3 (ON) and BRAP4 (PN). It’s preferred shares
are included in the Ibovespa, the BM&FBOVESPA’s most important index, comprising the Brazilian
market’s most liquid companies. Thanks to its excellent corporate governance model, BRADESPAR’s
shares are listed on Level 1 of the Stock Exchange and are included in the Corporate Governance Index
(IGC).
In order to expanding its trading options and increase the liquidity of its shares on the international market,
BRADESPAR’s shares are also listed in euros on the Latibex, the Madrid Stock Exchange’s Latin American
Companies Market through the Depositary Receipt Program (DRP).
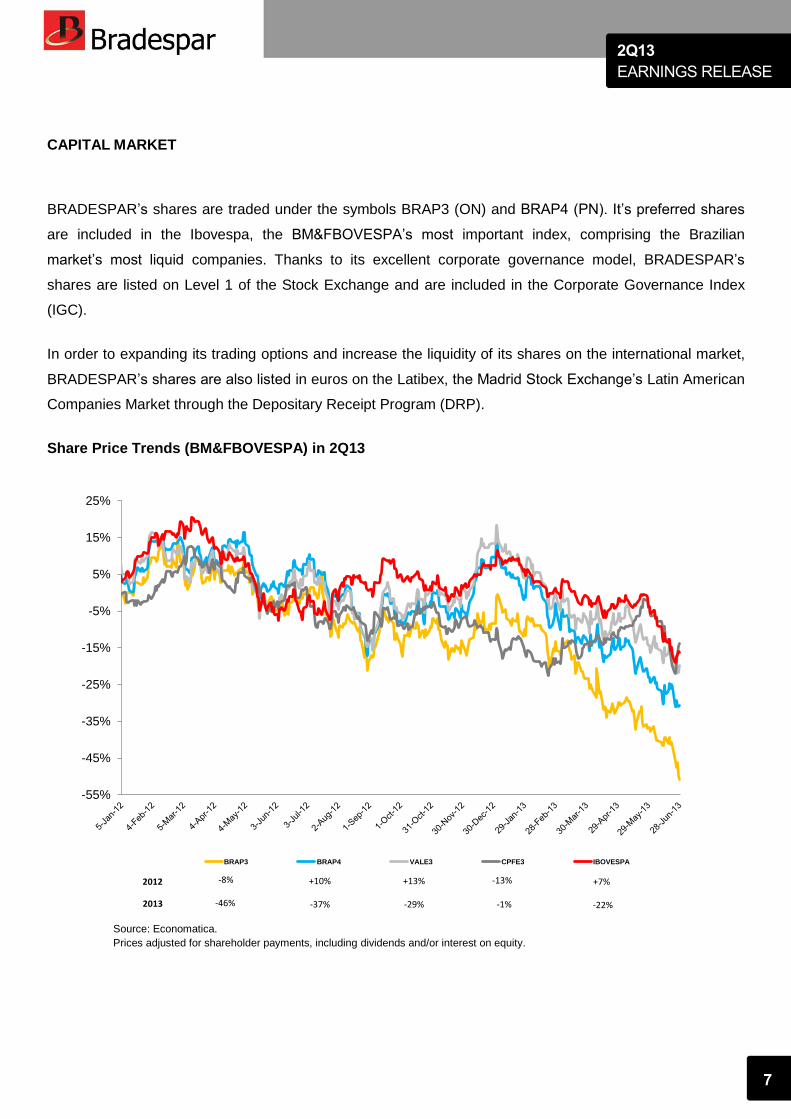
Share Price Trends (BM&FBOVESPA) in 2Q13
Source: Economatica.
Prices adjusted for shareholder payments, including dividends and/or interest on equity.
-55%
-45%
-35%
-25%
-15%
-5%
5%
15%
25%
BRAP3 BRAP4 VALE3 CPFE3 IBOVESPA
-8% +10% +13% -13% +7%
2013 -46% -37% -29% -1% -22%
2012
2Q13
EARNINGS RELEASE
8
8
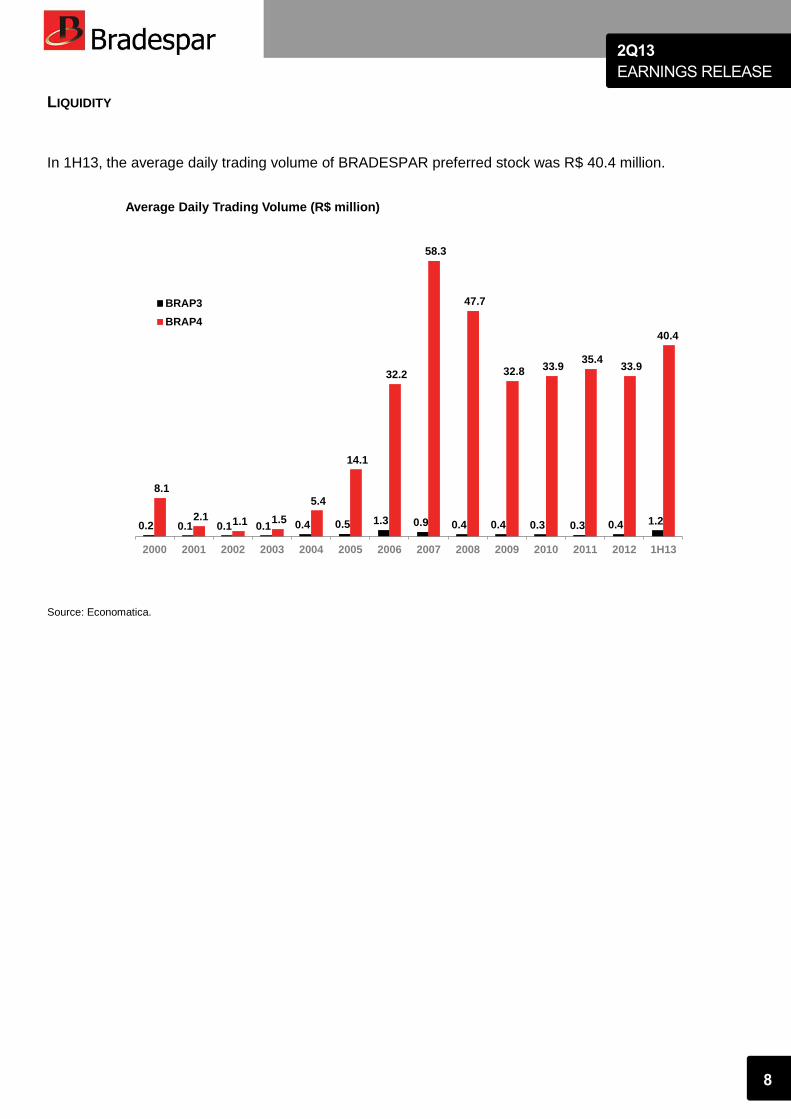
LIQUIDITY
In 1H13, the average daily trading volume of BRADESPAR preferred stock was R$ 40.4 million.
Source: Economatica.
0.2 0.1 0.1 0.1 0.4 0.5 1.3 0.9 0.4 0.4 0.3 0.3 0.4 1.2
8.1
2.1 1.1 1.5
5.4
14.1
32.2
58.3
47.7
32.8 33.9 35.4
33.9
40.4
2000 2001 2002 2003 2004 2005 2006 2007 2008 2009 2010 2011 2012 1H13
Average Daily Trading Volume (R$ million)
BRAP3
BRAP4
2Q13
EARNINGS RELEASE
9
9
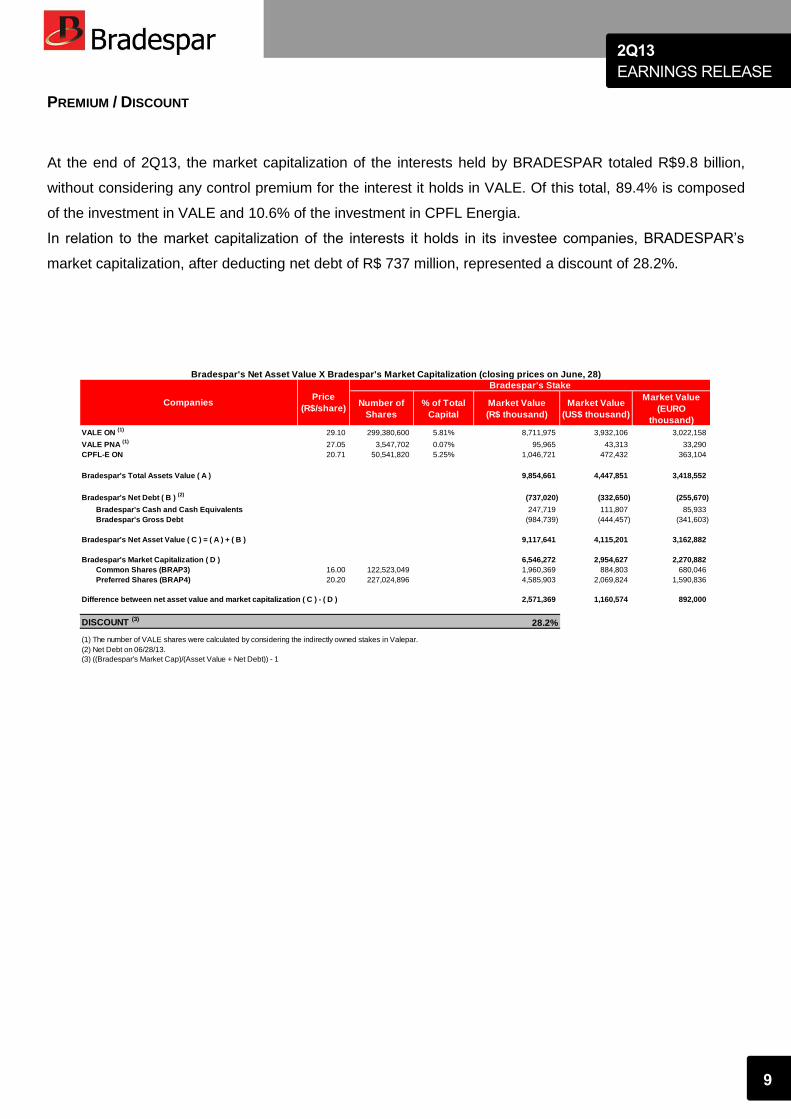
PREMIUM / DISCOUNT
At the end of 2Q13, the market capitalization of the interests held by BRADESPAR totaled R$9.8 billion,
without considering any control premium for the interest it holds in VALE. Of this total, 89.4% is composed
of the investment in VALE and 10.6% of the investment in CPFL Energia.
In relation to the market capitalization of the interests it holds in its investee companies, BRADESPAR’s
market capitalization, after deducting net debt of R$ 737 million, represented a discount of 28.2%.
Number of
Shares
% of Total
Capital
Market Value
(R$ thousand)
Market Value
(US$ thousand)
Market Value
(EURO
thousand)
VALE ON (1)
29.10 299,380,600 5.81% 8,711,975 3,932,106 3,022,158
VALE PNA (1)
27.05 3,547,702 0.07% 95,965 43,313 33,290
CPFL-E ON 20.71 50,541,820 5.25% 1,046,721 472,432 363,104
Bradespar's Total Assets Value ( A ) 9,854,661 4,447,851 3,418,552
Bradespar's Net Debt ( B ) (2)
(737,020) (332,650) (255,670)
Bradespar's Cash and Cash Equivalents 247,719 111,807 85,933
Bradespar's Gross Debt (984,739) (444,457) (341,603)
Bradespar's Net Asset Value ( C ) = ( A ) + ( B ) 9,117,641 4,115,201 3,162,882
Bradespar's Market Capitalization ( D ) 6,546,272 2,954,627 2,270,882
Common Shares (BRAP3) 16.00 122,523,049 1,960,369 884,803 680,046
Preferred Shares (BRAP4) 20.20 227,024,896 4,585,903 2,069,824 1,590,836
Difference between net asset value and market capitalization ( C ) - ( D ) 2,571,369 1,160,574 892,000
DISCOUNT (3)
28.2%
(1) The number of VALE shares were calculated by considering the indirectly owned stakes in Valepar.
(2) Net Debt on 06/28/13.
(3) ((Bradespar's Market Cap)/(Asset Value + Net Debt)) - 1
CompaniesPrice
(R$/share)
Bradespar's Stake
Bradespar's Net Asset Value X Bradespar's Market Capitalization (closing prices on June, 28)

2Q13
EARNINGS RELEASE
10
10
The discount between BRADESPAR’s net asset value and its market capitalization, which stood at 8.9% in
June 2012, increased to 15.1% in December 2012 and reached 28.2% at the end of June 2013.
Note: Discount on last business day of each month.
8.9% 8.8%
11.4%12.7% 12.9%
15.7%15.1%
13.7% 13.8%
16.6%
21.4%22.3%
28.2%
Ju
n-1
2
Ju
l-12
Au
g-1
2
Sep
-12
Oct-
12
No
v-1
2
De
c-1
2
Jan
-13
Feb
-13
Ma
r-1
3
Ap
r-13
Ma
y-1
3
Ju
n-1
3
Discount between BRADESPAR’s Net Asset Value and Market Capitalization
2Q13
EARNINGS RELEASE
11
11
SUBSEQUENT EVENTS
FIFTH ISSUE OF DEBENTURES
On July 4, 2013, BRADESPAR conducted its fifth issue of debentures, non convertible into shares, in the
total amount of R$1 billion, in a single series to mature in 732 days, as of the issue date totaling 100,000
debentures, with unit value of R$10,000.00. Debentures will earn interest at 105.3% of accumulated
variation of DIs (one-day interbank deposits) daily average rates - “over extra group”, calculated and
released by CETIP (OTC Clearing House), basis of 252 business days, expressed as annual percentage
(“DI Rate”), incurred on the debentures’ unit face value.
FINANCIAL SETTLEMENT OF THE THIRD ISSUE OF DEBENTURES SECOND SERIES
On July 4, 2013, the maturity date of the third issue of debentures second series, BRADESPAR made full
redemption by applying the funds raised through the fifth issue of debentures.
FINANCIAL SETTLEMENT OF THE FOURTH ISSUE OF DEBENTURES
On July 4, 2013, the maturity date of the fourth issue of debentures, BRADESPAR made full redemption by
applying the funds raised through the fifth issue of debentures.
2Q13
EARNINGS RELEASE
12
12
IR CONTACT
For further information, please contact the Investor Relations Department:
Luiz Maurício Leuzinger
Renato da Cruz Gomes
Gustavo Bonetti
Daniel Picerni Sarmento
Phone: +55 11 2178-6300
Fax: +55 11 2178-6315
E-mail: [email protected]
Web site: www.bradespar.com

2Q13
EARNINGS RELEASE
13
13
APPENDIX – BALANCE SHEET AND FINANCIAL INFORMATION
Income Statement (R$ thousand)
2Q13 2Q12
(*) Chg. % 1H13 1H12
(*) Chg. %
Equity Income 2,410 236,956 -99.0% 338,777 596,029 -43.2%
Redeemable Shares - Interest 35,844 41,768 -14.2% 72,696 87,011 -16.5%
Dividends from Investments 23,946 39,837 -39.9% 23,946 39,837 -39.9%
Operating Revenue 62,200 318,561 -80.5% 435,419 722,877 -39.8%
Financial Revenue (Expenses) (13,916) (14,926) -6.8% (26,621) (32,245) -17.4%
General and Administrative Expenses (1,263) (1,533) -17.6% (2,609) (3,830) -31.9%
Payroll Expenses (907) (1,289) -29.6% (2,107) (2,199) -4.2%
Other Operating Revenue (Expenses) (19,996) (26,843) -25.5% (19,996) (26,843) -25.5%
Operational Result before Income Tax/Social Contribution 26,118 273,970 -90.5% 384,086 657,760 -41.6%
Income Tax / Social Contribution (12,939) (54,232) -76.1% (12,939) (54,275) -76.2%
Net Income 13,179 219,738 -94.0% 371,147 603,485 -38.5%
(*)Period adjusted for changes in accounting practices

2Q13
EARNINGS RELEASE
14
14
ASSETS (R$ thousand)
06.30.2013 06.30.2012
CURRENT 1,214,052 934,069
Cash and Cash Equivalents 248,960 219,386
Dividends Receivable - Redeemable Shares 22,635 27,791
Interest on Equity Receivable 592,069 506,828
Preferred Shares Redeemable 349,970 179,740
Other Amounts 418 324
NON-CURRENT ASSETS 10,106,434 10,455,291
Long Term 1,759,410 2,328,515
Preferred Shares Redeemable 553,697 903,667
Financial Assets Available for Sale 1,046,721 1,283,762
Recoverable Taxes 137,198 140,919
Judicial Deposits 21,794 167
Investments 7,650,606 7,715,339
Investments (Presumed Reserve) 696,389 411,403
Fixed Assets 29 34
TOTAL 11,320,486 11,389,360
LIABILITIES (R$ thousand)
06.30.2013 06.30.2012
CURRENT 1,028,964 511,176
Provision for Dividends and Interest on Equity 4,443 109,028
Debentures Payable 985,650 321,743
Provision for Income Tax and Social Contribution 12,887 54,025
Other Obligations 25,984 26,380
NON-CURRENT LIABILITIES 747,459 1,345,815
Debentures Payable - 566,450
Provision for Income Tax and Social Contribution 445,571 526,165
Provision and Legal Obligations 301,888 253,200
SHAREHOLDERS’ EQUITY 9,544,063 9,532,369
Capital Stock 4,100,000 3,900,000
Profit Reserve 3,945,248 3,888,545
Adjustment to equity evaluation 1,338,949 1,139,997
Accrued Profit 379,877 603,827
Interest on Equity/Dividends Interim -220,011 -
TOTAL 11,320,486 11,389,360