investor relations presentation · british colombia 162 128 27% united states 4 6 -33% total hydro...
TRANSCRIPT

Innergex Renewable Energy
Investor Relations PresentationQ1 2020
Innergex Renewable Energy
DISCLAIMER
This document was prepared by Innergex solely for use of presenting the Innergex Q1 2020 Results published on May 12, 2020.This document is not to be reproduced nor distributed, in whole or in part, by any person other than the Corporation. TheCorporation takes no responsibility for the use of these materials by any person.
The information contained in this document has not been subject to independent verification and no representation, warranty orundertaking, express or implied, is made as to, and no reliance may be placed on, the fairness, accuracy, completeness orcorrectness of the information or opinions contained herein.
Neither the Corporation nor its officers or employees shall be held liable for any loss arising from any use of this document or itscontents or otherwise arising in connection with this document.
This presentation contains certain statements of future expectations or forward-looking statements. Although Innergex believes itsexpectations are based on reasonable assumptions, these forward-looking statements are subject to numerous risks anduncertainties, which could cause actual results to differ materially from those anticipated in these forward-looking statements. Fora detailed description of these risks and uncertainties, please refer to the “Risk Factor” section of Innergex’s Annual Report andAnnual Information Form. Subject to regulatory requirements, Innergex does not undertake to publicly update or revise any ofthese forward-looking statements.
In the event of any discrepancies between the information contained in this document and the public documents, the latter shallprevail. This document does not constitute an offer to sell or an invitation or solicitation of an offer to subscribe for or purchase anysecurities, and this shall not form the basis for or be used for any such offer or invitation or other contract or engagement in anyjurisdiction.
2

Innergex Renewable Energy
1. About Innergex2. Business Updates3. Q1 2020 Financial Highlights4. Corporate Strategy5. Annexes
TABLE OF CONTENTS
3

Innergex Renewable Energy
1. About Innergex2. Business Updates3. Q1 2020 Financial Highlights4. Corporate Strategy5. Annexes
Innergex Renewable Energy
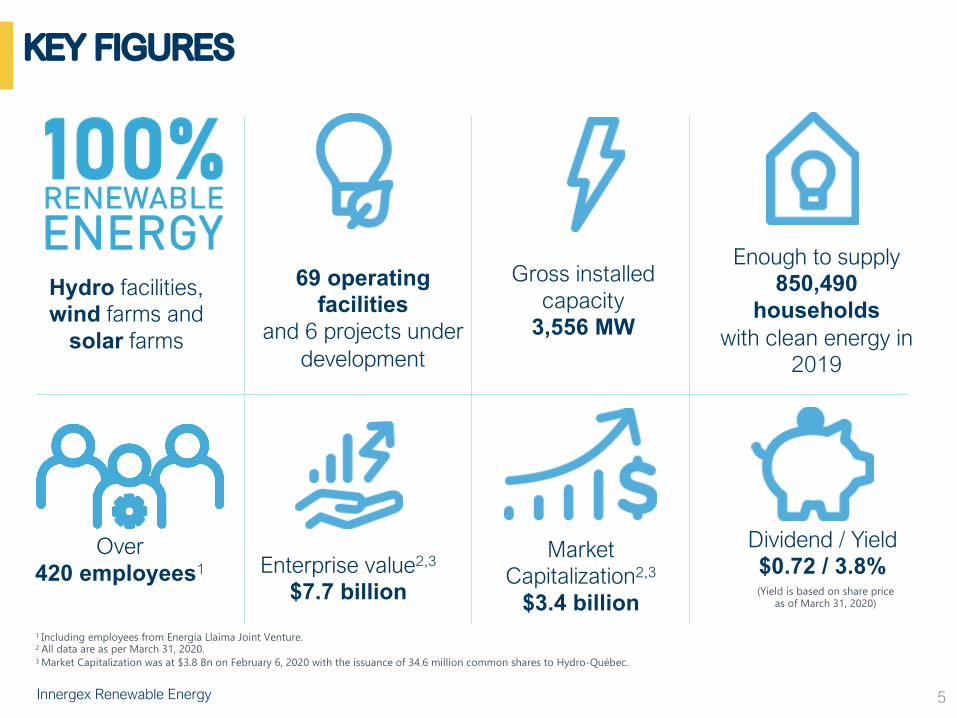
KEY FIGURES
Enterprise value2,3
$7.7 billion
Over420 employees1
Gross installed capacity
3,556 MW
Market Capitalization2,3
$3.4 billion
Dividend / Yield$0.72 / 3.8%
69 operating facilities
and 6 projects under development
Hydro facilities,wind farms and
solar farms
Enough to supply850,490
householdswith clean energy in
2019
5
1 Including employees from Energía Llaima Joint Venture.2 All data are as per March 31, 2020.3 Market Capitalization was at $3.8 Bn on February 6, 2020 with the issuance of 34.6 million common shares to Hydro-Québec.
(Yield is based on share price as of March 31, 2020)
Innergex Renewable Energy
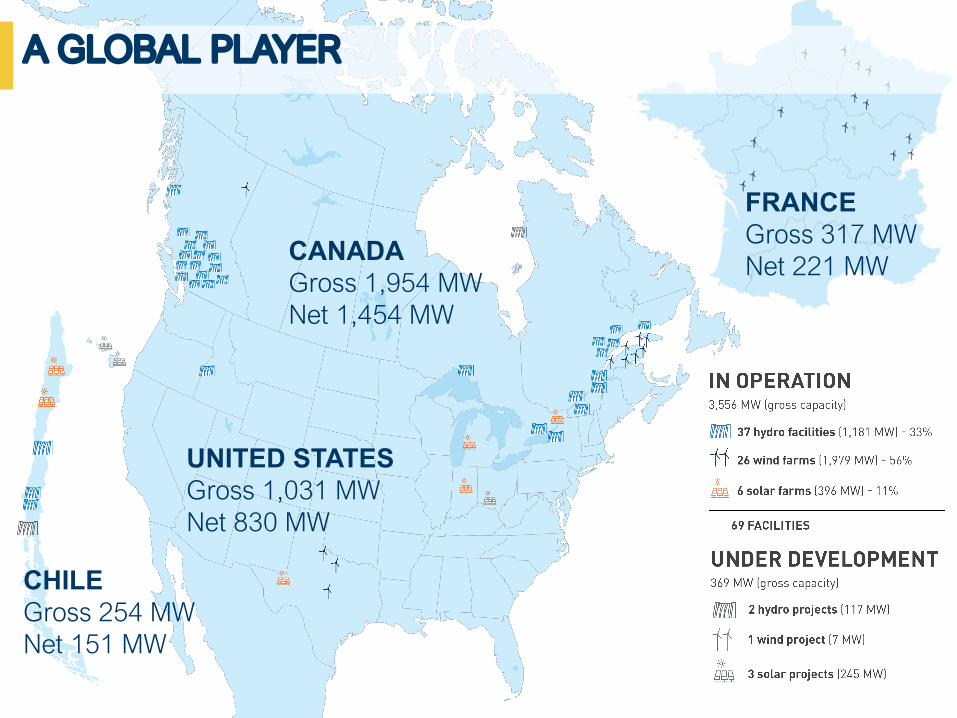
CHILEGross 254 MWNet 151 MW
CANADAGross 1,954 MWNet 1,454 MW
UNITED STATESGross 1,031 MWNet 830 MW
A GLOBAL PLAYER
FRANCEGross 317 MW Net 221 MW

Innergex Renewable Energy
OUR STORY
Founding of Innergex in Canada
First hydro facilityin Quebec
(Saint-Paulin)
First IPO(TSX: INE)
First acquisition in Quebec
(Montmagny)
Founding of Cartier Wind Energy and first acquisition
in the U.S.First wind farm in
Quebec
1990 1999 2003 2005
1994 2000 2004 2006
Innergex becomes Innergex Renewable
Energy Inc.
Acquisition of our first solar farm(Stardale)
First partnership(RCM Rivière-du-Loup)
First acquisition in France
Acquisition of AlterraPower Corp, Cartier Wind Farms, and Energía Llaima (50%), Chile
Sale of its Icelandic assets and commissioning of its largest
solar and wind farms in Texas
2010 2013 2018 2020
2011 2016 2019
First hydro facility in Ontario(Batawa)
First hydro facility in B. C. (Rutherford Creek)
7
Strategic alliance with Hydro-Québec and acquisition of Salvador solar farm in Chile

Innergex Renewable Energy
BUILDING A BETTER WORLD WITH RENEWABLE ENERGY
8
We believethat renewable energy is part of the solution
to climate change.
We generate value for our employees, our
shareholders,our partners and our host communities.
We are a team of passionate individuals
who build strong partnerships with local
communities.
Planet ProsperityPeople
With a sustainable business model that balances People, our Planet and Prosperity.
Innergex Renewable Energy
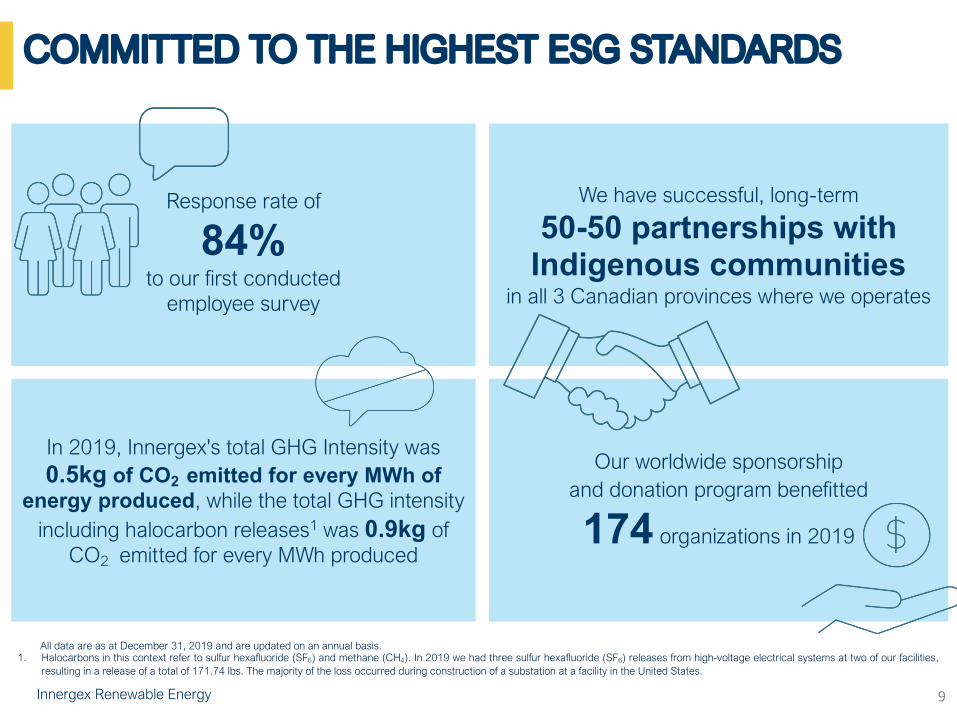
COMMITTED TO THE HIGHEST ESG STANDARDS
We have successful, long-term
50-50 partnerships with Indigenous communities
in all 3 Canadian provinces where we operates
Our worldwide sponsorship and donation program benefitted
174 organizations in 2019
9
Response rate of
84% to our first conducted
employee survey
All data are as at December 31, 2019 and are updated on an annual basis.1. Halocarbons in this context refer to sulfur hexafluoride (SF6) and methane (CH4). In 2019 we had three sulfur hexafluoride (SF6) releases from high-voltage electrical systems at two of our facilities,
resulting in a release of a total of 171.74 lbs. The majority of the loss occurred during construction of a substation at a facility in the United States.
In 2019, Innergex's total GHG Intensity was 0.5kg of CO2 emitted for every MWh of
energy produced, while the total GHG intensity including halocarbon releases1 was 0.9kg of
CO2 emitted for every MWh produced

Innergex Renewable Energy
WITH LONG-TERM AGREEMENTS, ACCRETIVE ACQUISITIONS…
Young assets with a weighted average age of approximately
7.3 years
< 10 years 37%
> 20 years25%
10-20 years38%
1. Remaining weighted average life of PPAs, excluding projects under construction and in development, before consideration of renewaloptions.
2. Average based on Gross LT average production.3. Adjusted EBITDA is not a recognized measure under IFRS and therefore may not be comparable to the one presented by other
issuers. Please refer to the "Non-IFRS Measures" section of this presentation for more information.
10
Our business forecast is sound and steady
Commissioning of Foard City and Phoebe expected to contribute
$60.5M in Revenues and $39.8M in Adj. EBITDA3
(first 5-year average)
PPA REMAINING TERMS1
One of the longest average contract duration in the renewable sector
15.1 years2

Innergex Renewable Energy
…AND A WELL-BALANCED CAPITAL STRUCTURE
11
Project-level debt
52%
Convertible debentures
4%
Corporate debt3%
Tax Equity Financing
5%
Common equity at market value
34%
Preferred shares2%
3,60
4
4,19
0
6,51
6
6,37
2
6,63
5
2,50
7
3,25
0
4,70
9
4,69
2
4,27
4
0
2,000
4,000
6,000
8,000
2016 2017 2018 2019 31-Mar-20
ASSETS AND DEBTS ($M)
Total assets Long-term debt and convertible debentures
ASSETS AND DEBT ($M)
S&P Investment Grade Credit Rating
BBB-
96% of the outstanding debt is fixed or hedged
Revolving credit facilities supported by
12 unencumbered assets
DEBT STRUCTURE
CAPITAL STRUCTURE
Long-term debt and borrowings
Amount ( ‘000 CAD $)
Maturity
Revolving credit facility 25,000 2023
Subordinated unsecured 5-year term loan
150,000 2025-2026
Project loans 3,523,082 2024-2064
Tax equity financing 358,531 -
Debentures 279,438 2025-2026
TOTAL 4,336,051 -

Innergex Renewable Energy
WE HAVE A PROVEN TRACK RECORD OF CONSISTENT GROWTH
12
1 On a continued basis.2 Adjusted EBITDA proportionate is not a recognized measure under IFRS and therefore may not be comparable to those presented by other issuers.Please refer to the Non-IRFS section of this presentation.3 Market capitalization includes preferred shares.
POWER GENERATED (GWH) PRODUCTION AS A % OF LTA1PROPORTIONATE ADJUSTED EBITDA2 ($M)
$1,612.3 $1,669.0
$1,759.1 $2,445.4
$3,417.4
1,000
2,000
3,000
4,000
2016 2017 2018 2019 31-Mar-20
MARKET CAPITALIZATION3
$0.64$0.66
$0.68$0.70
$0.72
$0.50
$0.60
$0.70
$0.80
2016 2017 2018 2019 31-Mar-20
DIVIDEND
216299 352 409
90
224309
428
517
116
2016 2017 2018 2019 31-Mar-20
Ad. EBITDA JV PTCs
$M
0 2000 4000 6000 8000
20032004200520062007200820092010201120122013201420152016201720182019
31-Mar-20
Actual Production (MW) LTA (MW)
93%96%
GWh
Average 2003-202099%

Innergex Renewable Energy
1. About Innergex2. Business Updates3. Q1 2020 Financial Highlights4. Corporate Strategy5. Annexes
13

Innergex Renewable Energy
2020 SIGNIFICANT EVENTS
14
$661M equity Private Placement by Hydro-Québec in Innergex
Hydro-Québec becomes Innergex’s main shareholder with 19.9%
ownershipAccretive use of proceeds by Innergex
Strengthened balance sheet and increased financial flexibility for future growth
$500M initial commitment by Hydro-Québec to co-invest with Innergex
STRATEGIC ALLIANCE PRIVATE PLACEMENT
The strategic alliance was announced on February 6, 2020
Innergex Renewable Energy
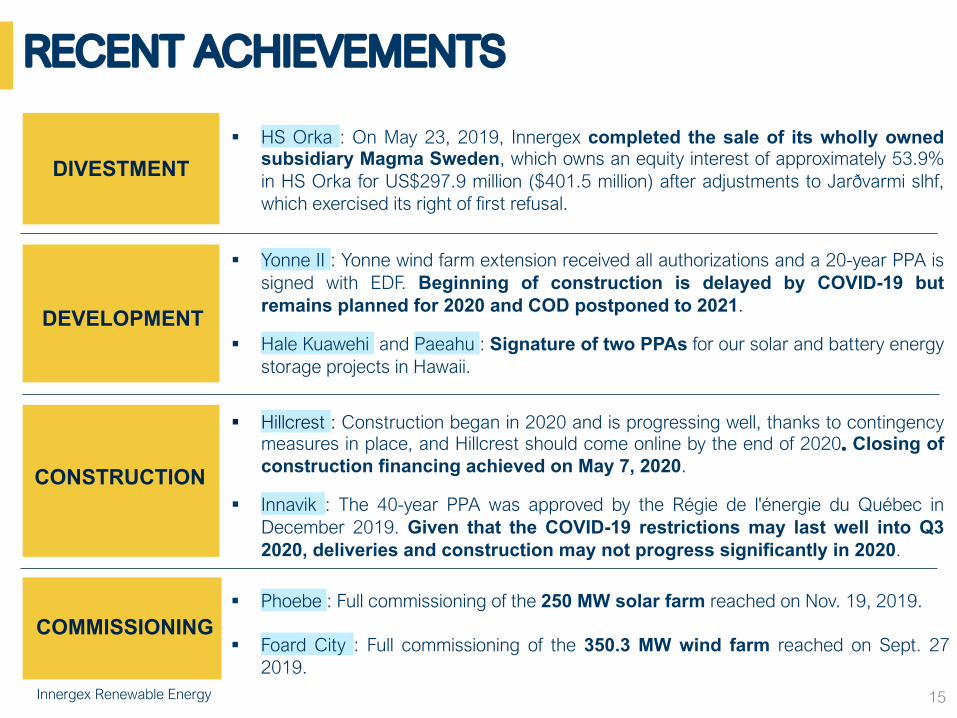
RECENT ACHIEVEMENTS
§ Hillcrest : Construction began in 2020 and is progressing well, thanks to contingencymeasures in place, and Hillcrest should come online by the end of 2020. Closing ofconstruction financing achieved on May 7, 2020.
§ Innavik : The 40-year PPA was approved by the Régie de l'énergie du Québec inDecember 2019. Given that the COVID-19 restrictions may last well into Q32020, deliveries and construction may not progress significantly in 2020.
CONSTRUCTION
§ Yonne II : Yonne wind farm extension received all authorizations and a 20-year PPA issigned with EDF. Beginning of construction is delayed by COVID-19 butremains planned for 2020 and COD postponed to 2021.
§ Hale Kuawehi and Paeahu : Signature of two PPAs for our solar and battery energystorage projects in Hawaii.
DEVELOPMENT
§ Phoebe : Full commissioning of the 250 MW solar farm reached on Nov. 19, 2019.
§ Foard City : Full commissioning of the 350.3 MW wind farm reached on Sept. 272019.
COMMISSIONING
§ HS Orka : On May 23, 2019, Innergex completed the sale of its wholly ownedsubsidiary Magma Sweden, which owns an equity interest of approximately 53.9%in HS Orka for US$297.9 million ($401.5 million) after adjustments to Jarðvarmi slhf,which exercised its right of first refusal.
DIVESTMENT
15

Innergex Renewable Energy
DEVELOPMENT PIPELINE
Name Type Capacity Location Status Expected COD
PROJECTS UNDER CONSTRUCTION
Innavik 7.5 MWQuebec, Canada 40-year PPA signed, site mobilization ongoing 2022
Hillcrest 200 MW Ohio, USAPPA signed and construction is progressing well. Construction financing closed on May 7, 2020 2020
PROJECTS IN DEVELOPMENT
Hale Kuawehi 30 MW Hawaii, USA PPA approved, obtain permits 2022
Paeahu 15 MW Hawaii, USA The PUC's PPA review process is ongoing 2022
Frontera 109 MW Chile The financing process is progressing 2022
Yonne II 7 MW France PPA signed and COD postponed to 2021 2021
PROSPECTIVE PROJECTS
Portfolio of projects
≈150 MW France Obtain permits 2021-2022
Solar projects in Hawaii
35 MW Hawaii, USATwo projects advanced to the Final Award Group and PPA negotiations are underway 2023
Solar projects USA Early stages
16
Innergex Renewable Energy
1. About Innergex2. Business Update3. Q1 2020 Financial Highlights4. Corporate Strategy5. Annexes
17

Innergex Renewable Energy
PRODUCTION DRIVEN BY FRENCH WIND AND COMMISSIONING OF FOARD AND PHOEBE: +28%
18
Production1 (In GWh)Three-Month Period
Ended March 312020 2019 Change
HYDROQuebec 121 135 -10%Ontario 23 24 -4%British Colombia 162 128 27%United States 4 6 -33%TOTAL HYDRO 310 293 6%
WINDQuebec 640 782 -18%France 277 223 24%United States2 328 - -TOTAL WIND 1,245 1,005 24%
SOLAROntario 6 8 -25%United States3 119 3 -TOTAL SOLAR 125 11 -TOTAL 1,680 1,309 28%1. Some facilities are treated as joint ventures and associates and accounted for using the equity method; their revenues are not included in the Corporation’s consolidated revenues and, for consistency, their electricity production figures have been excluded from the production table.2. Foard City was commissioned on September 27, 2019.3. Phoebe was commissioned on November 19, 2019.
Innergex Renewable Energy
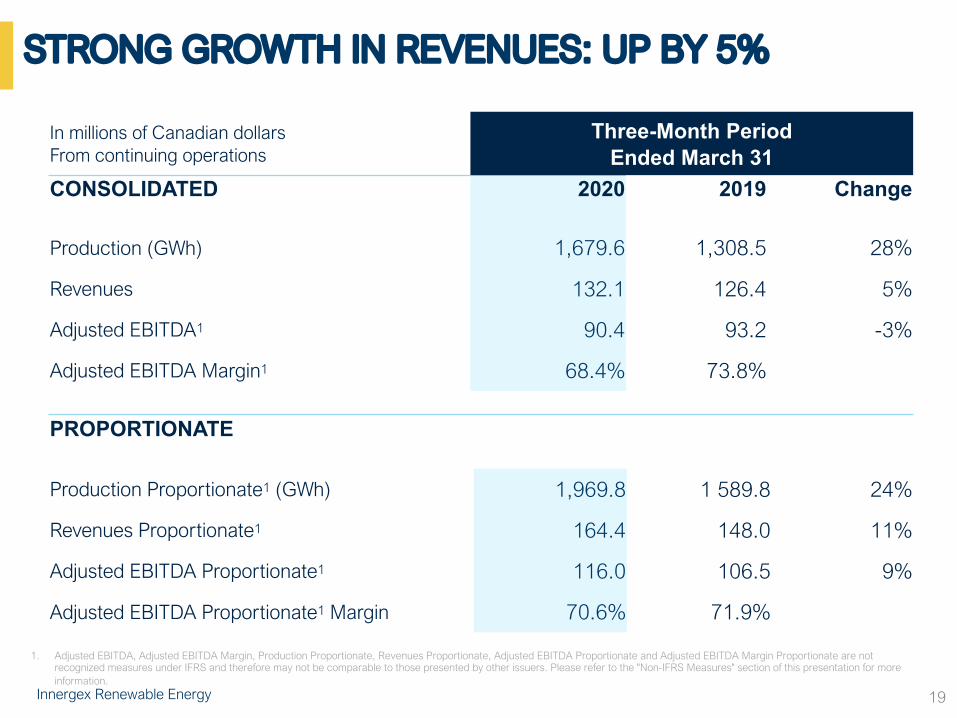
In millions of Canadian dollarsFrom continuing operations
Three-Month PeriodEnded March 31
CONSOLIDATED 2020 2019 Change
Production (GWh) 1,679.6 1,308.5 28%
Revenues 132.1 126.4 5%
Adjusted EBITDA1 90.4 93.2 -3%
Adjusted EBITDA Margin1 68.4% 73.8%
1. Adjusted EBITDA, Adjusted EBITDA Margin, Production Proportionate, Revenues Proportionate, Adjusted EBITDA Proportionate and Adjusted EBITDA Margin Proportionate are not recognized measures under IFRS and therefore may not be comparable to those presented by other issuers. Please refer to the "Non-IFRS Measures" section of this presentation for more information.
PROPORTIONATE
Production Proportionate1 (GWh) 1,969.8 1 589.8 24%
Revenues Proportionate1 164.4 148.0 11%
Adjusted EBITDA Proportionate1 116.0 106.5 9%
Adjusted EBITDA Proportionate1 Margin 70.6% 71.9%
STRONG GROWTH IN REVENUES: UP BY 5%
19
Innergex Renewable Energy
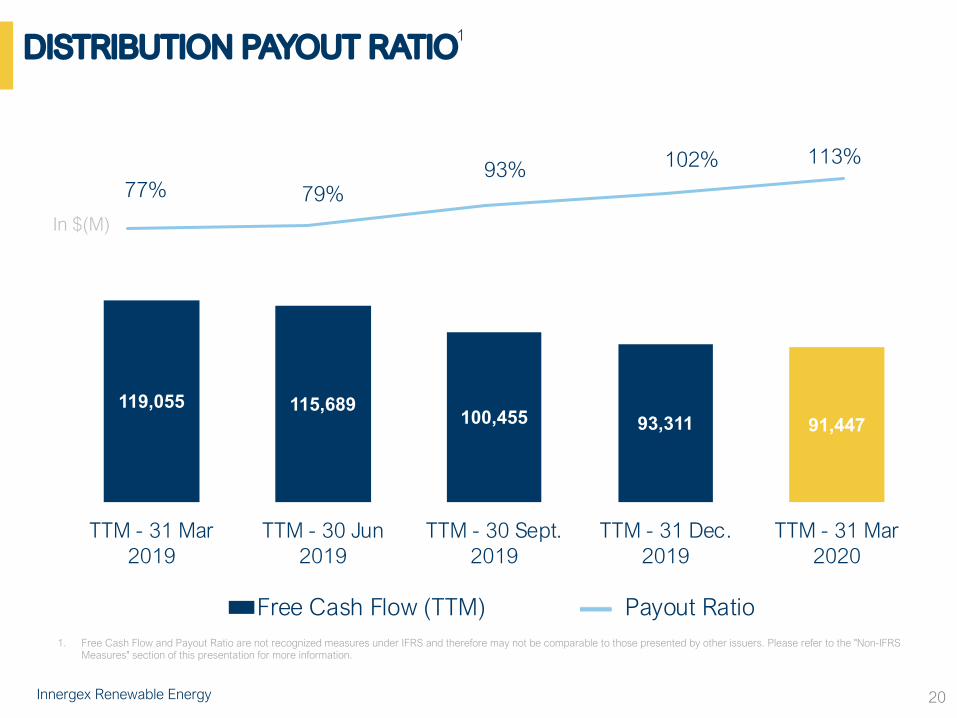
DISTRIBUTION PAYOUT RATIO
20
1. Free Cash Flow and Payout Ratio are not recognized measures under IFRS and therefore may not be comparable to those presented by other issuers. Please refer to the "Non-IFRS Measures" section of this presentation for more information.
1
119,055 115,689 100,455 93,311 91,447
TTM - 31 Mar2019
TTM - 30 Jun2019
TTM - 30 Sept.2019
TTM - 31 Dec.2019
TTM - 31 Mar2020
Free Cash Flow (TTM) Payout Ratio
In $(M)
77% 79%93% 102% 113%
Innergex Renewable Energy
1. About Innergex2. Business Updates3. Q1 2020 Financial Highlights4. Corporate Strategy5. Annexes

Innergex Renewable Energy 22
Leverage expertise and innovation to maximize returns from our high-quality assets
Optimize operationsIncrease diversification of the Corporation’sactivities and assets
Diversify activities
Become an expert in deploying energystorage technologies
Build expertiseFocus growth on current markets and targetopportunities in neighbouring ones
Grow responsibly
2020-2025 STRATEGIC PLANSupported by a strong partnership with
Innergex Renewable Energy
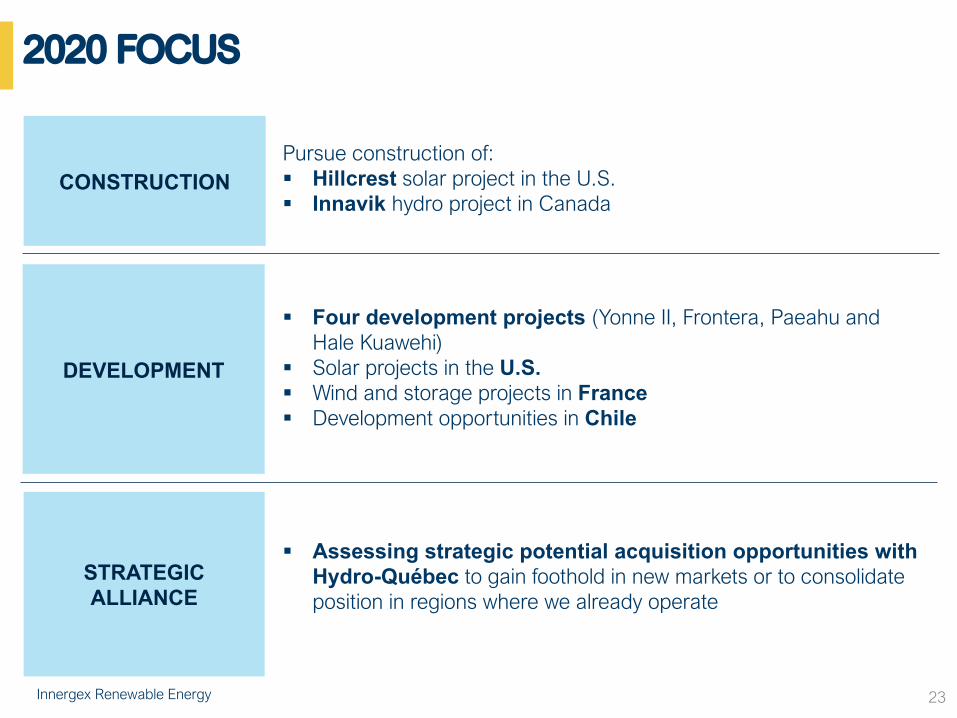
2020 FOCUS
23
STRATEGIC ALLIANCE
§ Assessing strategic potential acquisition opportunities with Hydro-Québec to gain foothold in new markets or to consolidate position in regions where we already operate
DEVELOPMENT
CONSTRUCTION
§ Four development projects (Yonne II, Frontera, Paeahu and Hale Kuawehi)
§ Solar projects in the U.S. § Wind and storage projects in France § Development opportunities in Chile
Pursue construction of: § Hillcrest solar project in the U.S. § Innavik hydro project in Canada

Innergex Renewable Energy
2020 PROJECTED FINANCIAL PERFORMANCE1
2019YEAR-END RESULTS 2020 PROJECTIONS
Power Generated (GWh) 6,509.6 approx. + 25%
Revenues 557.0 approx. +10%
Adjusted EBITDA2 409.2 approx. +5%
Adjusted EBITDA proportionate2 516.8 approx. +10%
1. Projected financial performance based on the continued operations.2. Adjusted EBITDA and Adjusted EBITDA Proportionate are not recognized measures under IFRS and therefore may not be
comparable to those presented by other issuers. Please refer to the "Non-IFRS Measures" section of this presentation for more information.
24
Innergex Renewable Energy
1. About Innergex2. Business Updates3. Q1 2020 Financial Highlights4. Corporate Strategy5. Annexes
25

Innergex Renewable Energy
CAUTIONARY STATEMENTS
FORWARD-LOOKING INFORMATIONTo inform readers of the Corporation's future prospects, this document contains forward-looking information within the meaning of applicablesecurities laws (“Forward-Looking Information”). Forward-Looking Information can generally be identified by the use of words such as“approximately”, “may”, “will”, "could", “believes", “expects", “intends”, "should", “plans”, “potential”, "project", “anticipates”, “estimates”,“scheduled” or “forecasts”, or other comparable terminology that state that certain events will or will not occur. It represents the projectionsand expectations of the Corporation relating to future events or results as of the date of this presentation. It includes future-oriented financialinformation such as expected production, projected revenues, projected Adjusted EBITDA, projected Adjusted EBITDA Proportionate,projected Free Cash Flow and estimated project costs, to inform readers of the potential financial impact of expected results, of the expectedcommissioning of Development Projects, of the potential financial impact of the acquisitions, of the Corporation's ability to sustain currentdividends and dividend increases and of its ability to fund its growth. Such information may not be appropriate for other purposes.
The material risks and uncertainties that may cause actual results or performance to be materially different from current expressed Forward-Looking Information are referred to in the Corporation's Annual Information Form under the “Risk Factors” section and include, withoutlimitation: the ability of the Corporation to execute its strategy of building shareholder value; its ability to raise additional capital and the state ofcapital markets; liquidity risks related to derivative financial instruments; variability in hydrology, wind regimes, solar irradiation and geothermalresources; delays and cost overruns in the design and construction of projects, uncertainty surrounding the development of new facilities;variability of installation performance and related penalties; and the ability to secure new power purchase agreements or to renew existingones on equivalent terms and conditions.
Although the Corporation believes that the expectations and assumptions on which Forward-Looking Information is based are reasonable,readers of this document are cautioned not to rely unduly on this Forward-Looking Information since no assurance can be given that it willprove to be correct. The Corporation does not undertake any obligation to update or revise any Forward-Looking Information, whether as aresult of events or circumstances occurring after the date of this document, unless required by legislation.
26
Innergex Renewable Energy
CAUTIONARY STATEMENTS
NON-IFRS MEASURESAdjusted EBITDA, Adjusted EBITDA Proportionate, Adjusted EBITDA Margin, Revenues proportionate, Free Cash Flow, Payout Ratio andAdjusted Net Loss from continuing operations are not measures recognized by International Financial Reporting Standards (IFRS) and have nomeaning prescribed by it. References in this document to “Adjusted EBITDA” are to net earnings (loss) from continuing operations to whichare added (deducted) provision (recovery) for income tax expenses, finance cost, depreciation and amortization, other net expenses, share of(earnings) loss of joint ventures and associates and unrealized net (gain) loss on financial instruments. References in this document to"Adjusted EBITDA Margin" are to Adjusted EBITDA divided by revenues. References in this document to "Adjusted EBITDA Proportionate" areto Adjusted EBITDA plus Innergex's share of Adjusted EBITDA of the joint ventures and associates. References to "Adjusted Net Loss fromcontinuing operations" are to net earnings or losses from continuing operations of the Corporation, to which the following elements are added(subtracted): unrealized net (gain) loss on financial instruments; realized (gain) loss on financial instruments; income tax expense (recovery)related to the above items; and the share of unrealized net (gain) loss on derivative financial instruments of joint ventures and associates, netof related tax. Innergex uses derivative financial instruments to hedge its exposure to various risks. Innergex believes that the presentation ofthese measures enhance the understanding of the Corporation's operating performance.
References to “Free Cash Flow” are to cash flows from operating activities before changes in non-cash operating working capital items, lessmaintenance capital expenditures net of proceeds from disposals, scheduled debt principal payments, preferred share dividends declared andthe portion of Free Cash Flow attributed to non-controlling interests, plus or minus other elements that are not representative of theCorporation's long-term cash generating capacity, such as transaction costs related to realized acquisitions (which are financed at the time ofthe acquisition), realized losses or gains on derivative financial instruments used to hedge the interest rate on project-level debt or theexchange rate on equipment purchases. References to “Payout Ratio” are to dividends declared on common shares divided by Free CashFlow. Readers are cautioned that Adjusted EBITDA and Adjusted EBITDA Proportionate should not be construed as an alternative to netearnings as determined in accordance with IFRS and Free Cash Flow should not be construed as an alternative to cash flows from operatingactivities, as determined in accordance with IFRS.
Innergex believes that these indicators are important, as they provide management and the reader with additional information about theCorporation's production and cash generation capabilities, its ability to sustain current dividends and dividend increases and its ability to fundits growth. These indicators also facilitate comparison of results over different periods.
27
Innergex Renewable Energy
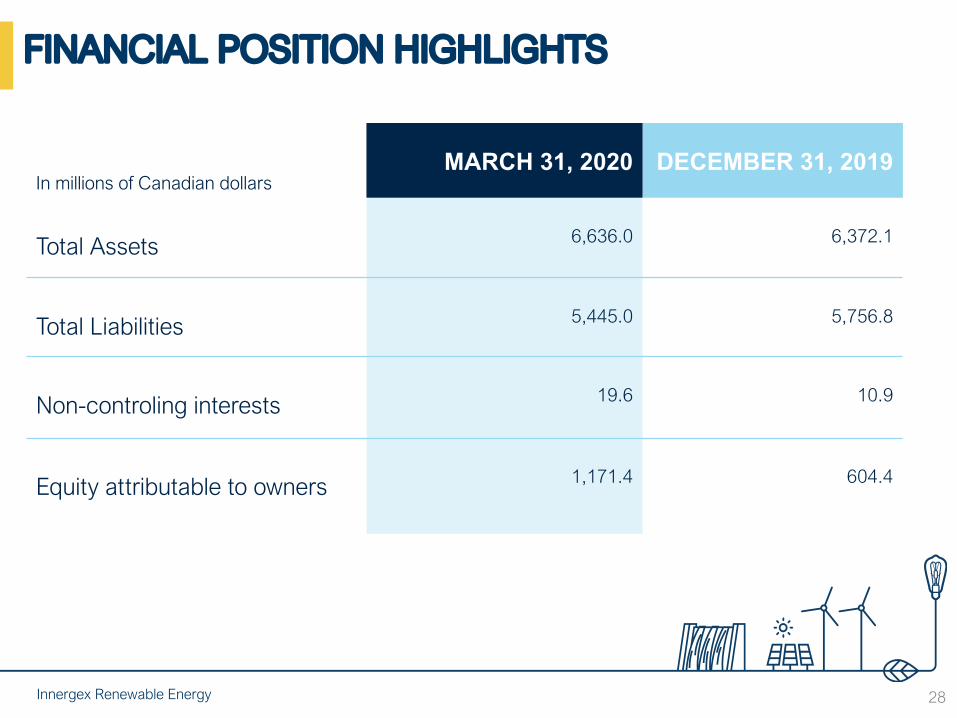
FINANCIAL POSITION HIGHLIGHTS
In millions of Canadian dollarsMARCH 31, 2020 DECEMBER 31, 2019
Total Assets 6,636.0 6,372.1
Total Liabilities 5,445.0 5,756.8
Non-controling interests 19.6 10.9
Equity attributable to owners 1,171.4 604.4
28
Innergex Renewable Energy
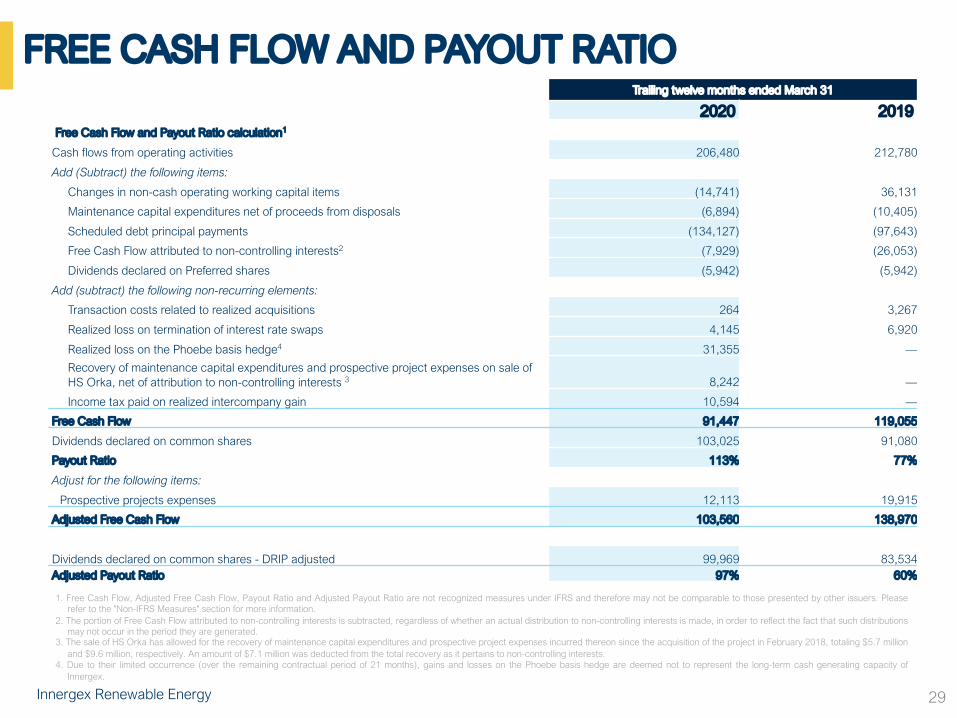
FREE CASH FLOW AND PAYOUT RATIO
29
Trailing twelve months ended March 31
2020 2019Free Cash Flow and Payout Ratio calculation1
Cash flows from operating activities 206,480 212,780
Add (Subtract) the following items:
Changes in non-cash operating working capital items (14,741) 36,131
Maintenance capital expenditures net of proceeds from disposals (6,894) (10,405)
Scheduled debt principal payments (134,127) (97,643)
Free Cash Flow attributed to non-controlling interests2 (7,929) (26,053)
Dividends declared on Preferred shares (5,942) (5,942)
Add (subtract) the following non-recurring elements:
Transaction costs related to realized acquisitions 264 3,267
Realized loss on termination of interest rate swaps 4,145 6,920
Realized loss on the Phoebe basis hedge4 31,355 —
Recovery of maintenance capital expenditures and prospective project expenses on sale of HS Orka, net of attribution to non-controlling interests 3 8,242 —
Income tax paid on realized intercompany gain 10,594 —
Free Cash Flow 91,447 119,055
Dividends declared on common shares 103,025 91,080
Payout Ratio 113% 77%
Adjust for the following items:
Prospective projects expenses 12,113 19,915
Adjusted Free Cash Flow 103,560 138,970
Dividends declared on common shares - DRIP adjusted 99,969 83,534Adjusted Payout Ratio 97% 60%
1. Free Cash Flow, Adjusted Free Cash Flow, Payout Ratio and Adjusted Payout Ratio are not recognized measures under IFRS and therefore may not be comparable to those presented by other issuers. Pleaserefer to the "Non-IFRS Measures" section for more information.
2. The portion of Free Cash Flow attributed to non-controlling interests is subtracted, regardless of whether an actual distribution to non-controlling interests is made, in order to reflect the fact that such distributionsmay not occur in the period they are generated.
3. The sale of HS Orka has allowed for the recovery of maintenance capital expenditures and prospective project expenses incurred thereon since the acquisition of the project in February 2018, totaling $5.7 millionand $9.6 million, respectively. An amount of $7.1 million was deducted from the total recovery as it pertains to non-controlling interests.
4. Due to their limited occurrence (over the remaining contractual period of 21 months), gains and losses on the Phoebe basis hedge are deemed not to represent the long-term cash generating capacity ofInnergex.

Innergex Renewable Energy
OPERATING FACILITIES - HYDROINNERGEX RENEWABLE ENERGY INC PROJECT
Location (City, Country)Gross capacity
(MW)Ownership
(%)Contract expiry
Magpie QC 40.6 70.0% 2032St-Paulin QC 8.0 100% 2034Windsor QC 5.5 100% 2036Chaudière QC 24.0 100% 2039Portneuf-1 QC 8.0 100% 2021Portneuf-2 QC 9.9 100% 2021Portneuf-3 QC 8.0 100% 2021Montmagny QC 2.1 100% 2021Sainte-Marguerite - (SM-1) QC 8.5 50.0% 20181
Sainte-Marguerite - (SM-1A) QC 22.0 50.0% 2027Glen Miller ON 8.0 100% 2025Batawa ON 5.0 100% 2029NON-WHOLLY OWNEDRutherford Creek BC 49.9 100% 2024Ashlu Creek BC 49.9 100% 2039Fitzsimmons Creek BC 7.5 100% 2050Northwest Stave River BC 17.5 100% 2053Miller Creek BC 33.0 100% 2023Brown Lake2 BC 7.2 100% 2058Tretheway Creek BC 21.2 100% 2055Cayoose (North Walden)2 BC 16.0 51.0% 2058Big Silver Creek BC 40.6 100% 2056Upper Lillooet BC 81.4 100% 2056Boulder Creek BC 25.3 100% 2056JOINT VENTUREDouglas Creek BC 27.0 50.0% 2049Fire Creek BC 23.0 50.0% 2049Lamont Creek BC 27.0 50.0% 2049Stokke Creek BC 22.0 50.0% 2049Tipella Creek BC 18.0 50.0% 2049Upper State River Creek BC 33.0 50.0% 2049Kwoiek Creek BC 49.9 50.0% 2053Horseshoe Bend ID 9.5 100% 2030East Toba BC 147.7 40.0% 2045Montrose Creek BC 88.0 40.0% 2045Jimmie Creek BC 62.0 51.0% 2056Umbata Falls ON 23.0 49.0% 2049Guayacan CL 12.0 34.7% -Mampil CL 55.0 50.0% 2020Peuchen CL 85.0 50.0% 2020
30
1 Sainte-Marguerite PPA is being renegotiated.2 PUC's PPA review process is ongoing.

Innergex Renewable Energy
OPERATING FACILITIES - WIND
31
INNERGEX RENEWABLE ENERGY INC
Location (City, Country) Gross capacity (MW)
Ownership (%)
Contract expiry
Carleton QC 109.5 100% 2028Baie-des-Sables QC 109.5 100% 2026Anse-à-Valleau QC 100.5 100% 2027Montagne Sèche QC 58.5 100% 2031Gros Morne I QC 100.5 100% 2032Gros Morne II QC 111.0 100% 2032Mesgi'g Ugju's'n (MU) QC 150.0 50.0% 2036Porcien FR 10.0 69.5% 2024Longueval FR 10.0 69.5% 2024Antoigné FR 8.0 69.5% 2025Valottes FR 12.0 69.5% 2025Bois D'Anchat (Binas) FR 10.0 69.5% 2029Beaumont (Park P) FR 25.0 69.5% 2029Bois des Cholletz FR 11.8 69.5% 2030Montjean FR 12.0 69.5% 2031Theil Rabier FR 12.0 69.5% 2031Yonne FR 44.0 69.5% 2031Vaite FR 38.9 69.5% 2032Rougemont-1 FR 36.1 69.5% 2032Rougemont-2 FR 44.5 69.5% 2032Plan de Fleury FR 22.0 69.5% 2032Les Renardieres FR 21.0 69.6% 2032Foard City TX 350.0 100% 2031JOINT VENTUREViger-Denonville QC 24.6 50.0% 2033Dokie BC 144.0 25.5% 2036Shannon TX 204.0 50.0% 2029Flat Top TX 200.0 51.0% 2031
Phoebe TX 250.0 100.0% 2031Kokomo IN 6.0 90.0% 2036Salvador CL 68.0 100.0% -Spartan MI 10.5 100.0% 2042Stardale ON 27.0 100.0% 2032JOINT VENTUREPampa Elvira CL 34.0 27.5% -
OPERATING FACILITIES - SOLAR
Innergex Renewable Energy
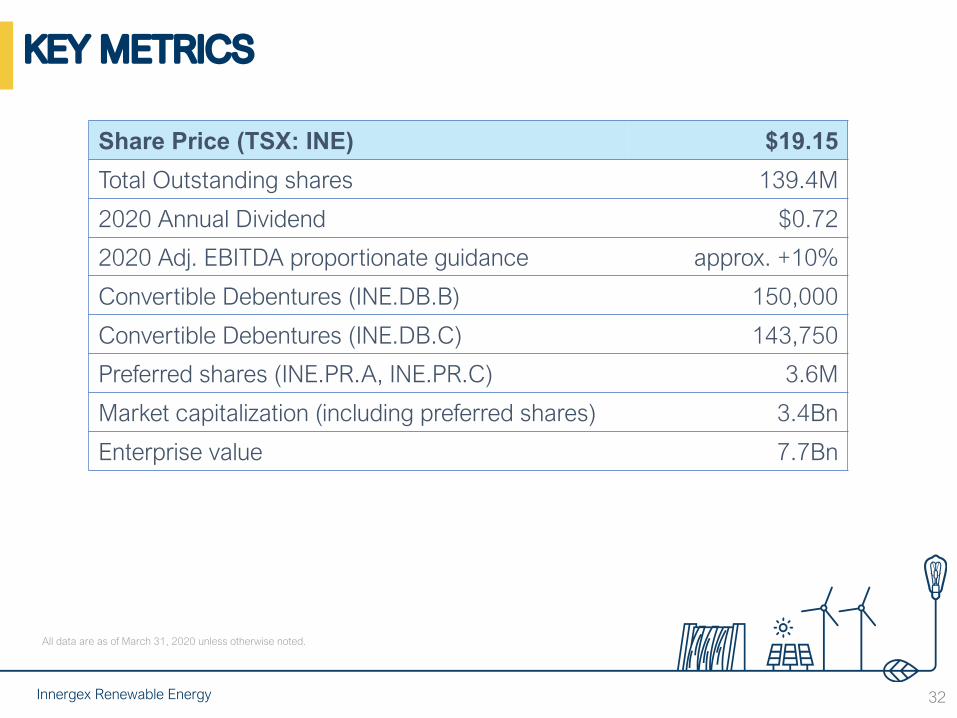
KEY METRICS
Share Price (TSX: INE) $19.15Total Outstanding shares 139.4M
2020 Annual Dividend $0.72
2020 Adj. EBITDA proportionate guidance approx. +10%
Convertible Debentures (INE.DB.B) 150,000
Convertible Debentures (INE.DB.C) 143,750
Preferred shares (INE.PR.A, INE.PR.C) 3.6M
Market capitalization (including preferred shares) 3.4Bn
Enterprise value 7.7Bn
All data are as of March 31, 2020 unless otherwise noted.
32

Innergex Renewable Energy
TO CONTACT US
Tel: 450 928-25501225 Saint-Charles Street WestLongueuil, QuébecJ4K 0B9
33