investor presentation - scatec solarpresentation_february+2018.pdf · this presentation does not...
TRANSCRIPT
Investor presentationFebruary 2018
Our values
• Predictable
• Driving results
• Changemakers
• Working together

Disclaimer
The following presentation is being made only to, and is only directed at, persons to whom such presentation maylawfully be communicated (’relevant persons’). Any person who is not a relevant person should not rely, act or makeassessment on the basis of this presentation or anything included therein.
The following presentation may include information related to investments made and key commercial terms thereof,including future returns. Such information cannot be relied upon as a guide to the future performance of suchinvestments. The release, publication or distribution of this presentation in certain jurisdictions may be restricted by law,and therefore persons in such jurisdictions into which this presentation is released, published or distributed shouldinform themselves about, and observe, such restrictions.
This presentation does not constitute an offering of securities or otherwise constitute an invitation or inducement to anyperson to underwrite, subscribe for or otherwise acquire securities in Scatec Solar ASA or any company within theScatec Solar Group. This presentation contains statements regarding the future in connection with the Scatec SolarGroup’s growth initiatives, profit figures, outlook, strategies and objectives as well as forward looking statements andany such information or forward-looking statements regarding the future and/or the Scatec Solar Group’s expectationsare subject to inherent risks and uncertainties, and many factors can lead to actual profits and developments deviatingsubstantially from what has been expressed or implied in such statements.
2
Introduction

Fully integrated business model
tailored for emerging markets1
Strong project pipeline supporting
further growth in attractive markets5
Strong global demand for PV
accelerates growth in opportunities 2
Solid asset base and a significant
self funding capacity4
Excellent track record in capturing
value from complex PV projects3
Generating and capturing PV value in emerging markets
NYTT BILDE
4

Our focus: Large scale PV and 20+ year cash flows
5
IN OPERATION
322 MW
BACKLOG
789 MW
# POWER
PLANTS
12
UNDER
CONSTRUCTION
394 MW

A solid PV track record on a growth trajectory
Czech South Africa ASYV Agua Fria
20 MW 190 MW 9 MW 60 MW 43 MW 197 MW 162 MW
Czech Republic South Africa Rwanda Honduras Jordan Malaysia Brazil
716 MW in operation and under construction:
Installation track record (MW):
• 15 years of experience
• 60+ projects in 10 countries
6
Jordan Malaysia Apodi
41 49 58105
182268
386
559 602 602
996
2007 2008 2009 2010 2011 2012 2013 2014 2015 2016 2017

A growing and diversified asset portfolio
7
1
2
5
3 4
6 159
10
In operation
Czech Republic 20 MW
South Africa 190 MW
ASYV, Rwanda 9 MW
Agua Fria, Honduras 60 MW
Jordan 43 MW
Total 322 MW
Under construction
Malaysia 197 MW
Honduras (phase I) 35 MW
Brazil 162 MW
Total 394 MW
Projects in backlog
Egypt 400 MW
South Africa 258 MW
Malaysia, Redsol 40 MW
Mozambique 40 MW
Mali 33 MW
Total 789 MW
Grand total 1,505 MW
1
2 3 4
5
6
9
13
10
7
7
12
14
8
11
11
8
12 14
15
13

Guidance and growth targets
Return and margin targets:
• Average equity return of 15% after tax on investments in new solar power plants
• Project development and construction (D&C) gross margins averaging 15%
Financial targets:
• 2018 O&M revenues of NOK 70-80 million and EBITDA margins of 40-45%
• 2018 cash flow to SSO equity from 322 MW in operation: NOK 160-180 million
• Annual cash flow to SSO equity from 1.5 GW in operation: NOK 430 - 480 million
8
Growth target (MWs)
394
745
322
789
In operation Under
construction
OpportunitiesBacklog Target end
’18: In
operation
and under
construction
Pipeline
2,800
1,300-1,500

The integrated business model
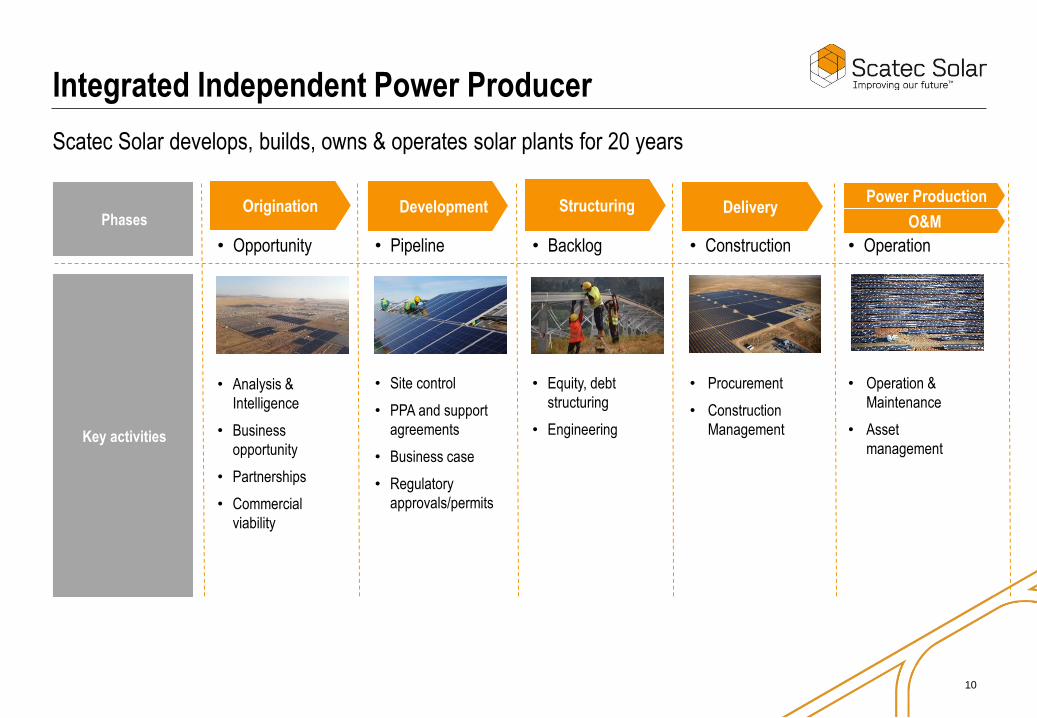
Origination Development Structuring DeliveryPower Production
O&M
• Operation• Construction• Backlog• Pipeline• Opportunity
• Operation &
Maintenance
• Asset
management
• Procurement
• Construction
Management
• Equity, debt
structuring
• Engineering
• Site control
• PPA and support
agreements
• Business case
• Regulatory
approvals/permits
• Analysis &
Intelligence
• Business
opportunity
• Partnerships
• Commercial
viability
Phases
Key activities
Scatec Solar develops, builds, owns & operates solar plants for 20 years
Integrated Independent Power Producer
10

11
Developmentmargin
Constructionmargin
O&M margin NPV powerproduction
Optimizeperformance
Cost of capital Residual value Total value
Long term asset ownership:• Generates steady long term cash flows
• Eliminates ‘friction losses’
• Active asset management to enhance
value of portfolio
Project development & construction:
• Provides access to attractive project pipeline
• Generates D&C margins that can be
reinvested as equity in projects
The integrated model captures the full project value

Scatec Solar
O&M / EPC
Single Purpose
Vehicle
State owned
utility
Our business model and typical project structure
Project financing
Scatec SolarEquity co-
investors
State government
• EPC contract
• O&M contract
• Asset Management
contract
Loan agreements
• Sovereign guarantee
• Concession agreement
PPA
agreement
Land lease
agreements
Land ownersShareholders agreement
Simplified illustration of company structure and main contracts in place
World Bank/others
• Political risk insurance
(when relevant)
100% 39%-100%
12
Copyright: Scatec Solar ASA
www.scatecsolar.com • [email protected]
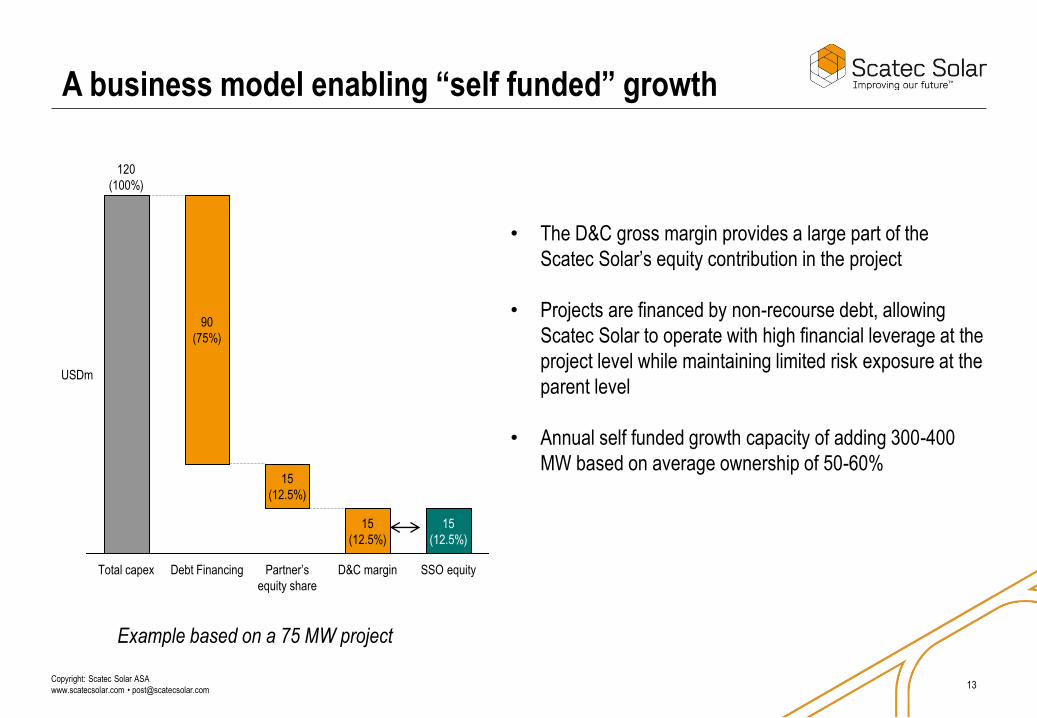
A business model enabling “self funded” growth
• The D&C gross margin provides a large part of the
Scatec Solar’s equity contribution in the project
• Projects are financed by non-recourse debt, allowing
Scatec Solar to operate with high financial leverage at the
project level while maintaining limited risk exposure at the
parent level
• Annual self funded growth capacity of adding 300-400
MW based on average ownership of 50-60%
15
(12.5%)
15
(12.5%)
Total capex
120
(100%)
Debt Financing D&C margin
15
(12.5%)
90
(75%)
USDm
Partner’s
equity share
SSO equity
Example based on a 75 MW project
13
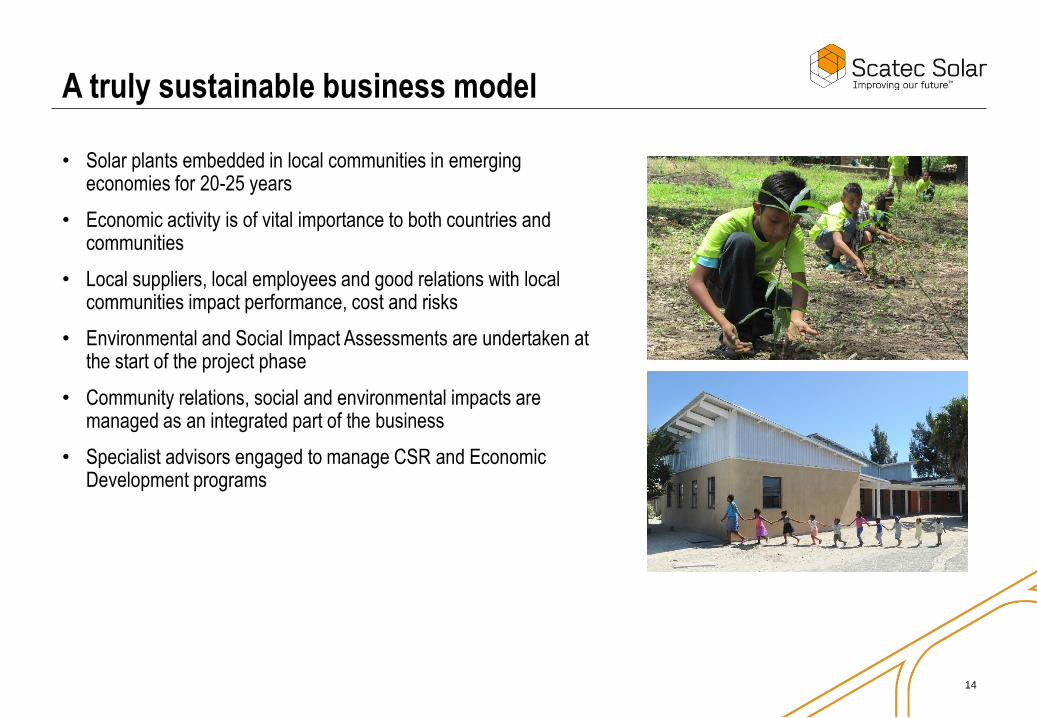
A truly sustainable business model
• Solar plants embedded in local communities in emerging economies for 20-25 years
• Economic activity is of vital importance to both countries and communities
• Local suppliers, local employees and good relations with local communities impact performance, cost and risks
• Environmental and Social Impact Assessments are undertaken at the start of the project phase
• Community relations, social and environmental impacts are managed as an integrated part of the business
• Specialist advisors engaged to manage CSR and Economic Development programs
14

Project backlog, pipeline & opportunities

Copyright: Scatec Solar ASA
www.scatecsolar.com • [email protected]
Impressive cost reductions and growth in demand
Source: Bloomberg New Energy Finance, Q4 2017 PV Market Outlook
56
2016
75
94
2015 2018
92
20192017
107
45
2014
China
USA
Rest of world Japan
India Europe
Annual installed volume - GW
3.24
2010
1.80
2016
0.92
1.49
20182012
1.14
2014
-74%
0.85
2020
ModuleOther
Inverter
Balance of plant
Installation
* Utility Scale: System cost will vary from market to market depending on system size, market maturity, bankability etc.
Total system cost (USD / Watt) *
16

Copyright: Scatec Solar ASA
www.scatecsolar.com • [email protected]
Partnering with Governments and Development banks
• As cost of solar continues to decline - governments are looking to solar to cover their power needs and grow the economy
• Governments in emerging economies finds private/public partnerships very attractive implementation model (IPPs)
• Converts capex to opex
• Development banks and private players provides funding
• Kick-starting the market with build up of solar know-how /employment
• Multilateral development banks typically with a long standing presence and experience in the county
• Important lender to governments for infrastructure projects
• Non-recourse project finance lending
• High standards on Environment, Social, Governance
• Project structures and contracts designed to mitigate risk (political financial, compliance etc)
• Creates business opportunities
• Reduces risks of Scatec Solar’s investments significantly
17

SSO develops 3.5 GW of opportunities globally
Legend
• Backlog (789 MW)
• Pipeline (745 MW)
• Opportunities (~2,800 MW)
Market Characteristics
• Solid solar irradiation
• Strong clean energy demand
• Renewable programmes
supporting growth
• Active support from project
finance banks and DFIs
• Credible local partners
Project Development
18

Copyright: Scatec Solar ASA
www.scatecsolar.com • [email protected]
Project update: Malaysia & Brazil
Malaysia, 197 MW
• 25 year PPA with TNB
• SSO 100%*
• Capex: USD 293 million
• Project finance: USD 234 million
Brazil, 162 MW
• 20 year PPA with CCEE
• SSO 44%, Statoil 44%, Apodi 12%
• Capex: USD 215 million
• Project finance: USD 140 million
Status
• Civil works approaching completion on
all three sites
• Mechanical installation started
• Grid connection planned sequentially
during 1H 2018
Status
• Civil works approaching completion
• Mechanical installation will commence
soon
• Grid connection planned during 2H 2018

Copyright: Scatec Solar ASA
www.scatecsolar.com • [email protected]
Project update: Egypt & Honduras
Honduras, 35 MW, phase 1
• 20 year PPA with ENEE
• SSO 70%, Norfund 30%
• Capex: 80 MUSD
• Project finance: USD 50 million
Status
• Project experienced civil unrest
• Construction work will continue in
close corporation with Honduran
authorities
• Some impact on cost and schedule
Egypt, 400 MW
• 25 year PPA with EETC
• SSO 51%, Norfund 24%, Africa50 25%
• Capex: USD 445 million
• Project finance: USD 335 million
Status
• Financial close in October 2017
• Common infrastructure in completion
• Construction start during 1H 2018

Copyright: Scatec Solar ASA
www.scatecsolar.com • [email protected]
Project update: South Africa, Mozambique & Mali
Mozambique, 40 MW
• 25 year PPA with EDM
• SSO 52.5%, Norfund 22.5%, EDM 25%
• Capex: USD 76 million
• Project finance: USD 62 million
Status
• Currently finalizing project loan and
guarantee agreements
Status
• Working to close out remaining
conditions precedent of the loan to
reach financial close
Mali, 33 MW
• 25 year PPA with Energie du Mali
• SSO 51%, IFC 30%, Africa Power 19%
• Capex: USD 56 million
• Project finance: USD 42 million
South Africa, 258 MW
• 20 year PPA with ESKOM
• SSO 42%, Norfund 18%, BEEE Trust 40%
• Capex: USD 315 million
• Project finance: USD 260 million
Status
• Preparing with IPP Office and
lenders for financial close

Outlook in South Africa
Project Development
Political situation
• ANC selected pro-business Cyril Ramaphosa as new
party leader in December 2017
• Immediate effects of the leadership change
– Currency: ZAR strengthened to best level in 2.5 years
– Corruption: Prosecution of State Capture actors
– Eskom: New board and acting CEO
Future solar potential
• Integrated Resource Plan (IRP) sets volume, technology
mix and pace of new generation capacity
• 1st iteration was IRP 2010-2030 included 8.4 GW of PV
• 2nd draft IRP indicates annual addition of at least 1 GW of
PV from 2022 onwards based on conservative demand
and PV costs forecasts
Development of Proposed Integrated Resource Plan, 2020 - 2035
0
1000
2000
3000
4000
5000
6000
Tota
l capacity
added
MW
PV Wind Landfill
Gas - Peaking (OCGT) Gas - Fast Response (Engines) Gas - Mid Merit (CCGT)
22

Scatec Solar’s position in South Africa
Project Development
REIPPP Programme
• 258 MW in Upington
– Awarded preferred bidder status in 2015
– Approved by Board of Eskom
– Awaiting formal sign-off by Ministry
• 430 MW in pipeline
– Validity of bid bonds extended to 31 March 2018
Project opportunity portfolio
• Additional 400 MW of projects
• High irradiation, good interconnection situation
Future potential
• Tenders
• Private PPAs in the C&I space
– Wheeling to multi-site off-takers
– Site-based generation for self-consumption
Projects in operation
Round 4 projects
Pipeline and opportunities
CAPE TOWN
SOUTH
AFRICA
UPINGTON
PORT
ELIZABETH
BLOEMFONTEIN
NAMIBIA
23

Building position in South East Asia
Malaysia
• RSS 3 to be launched
• Projects from previous auctions
• Bi-lateral and private PPAs in region
Vietnam
• 4+ GW annual new capacity needed
• FiT in place; PV competitive with coal
• Negotiating first 50 MW project
Bangladesh
• Urgent need for new capacity
• First 50 MW project awaiting approval
Myanmar:
• 70 MW project proposal submitted
Project Development
Current Scatec Solar projects
• 35.49 MYR/MWh PPA price
• Capex of ~ 50 mUSD
• SSO to fund 100% equity
• ~75% leverage
• Target financial close end 2018
40 MW RedSol projectRegional strategy
PERA
K
TERENGGA
NU
KUALA LUMPUR
MALAYSI
A
KEDA
H
MELAK
A
24

Financials

Copyright: Scatec Solar ASA
www.scatecsolar.com • [email protected]
Q4’17 - Consolidated & proportionate financials
Consolidated financials (NOK million) SSO proportionate financials (NOK million)
438
922
165143153
500
1008783106
461
5847
-11
66
Q2 17 Q3 17Q1 17Q4 16 Q4 17
EBITRevenues EBITDA
281
655
279276
363
207
595
217222
294
148
534
151160
210
Q4 17Q3 17Q1 17Q4 16 Q2 17
EBITDARevenues EBIT

Copyright: Scatec Solar ASA
www.scatecsolar.com • [email protected]
Solid financial results across segments
Fourth quarter 2017
(NOK million)
Power
Production100% basis
Power
ProductionSSO share*
Operation &
MaintenanceSSO share*
Development &
ConstructionSSO share*
CorporateSSO share*
Total
Revenues and other income 285 125 15 294 4 438
Gross margin 285 125 15 38 4 182
EBITDA 249 107 4 10 -15 106
Operating profit (EBIT) 174 68 4 9 -15 66
EBIT (%) 61% 54% 27% 3% - 15%
27
Proportionate financials
Full year 2017
(NOK million)
Power
Production100% basis
Power
ProductionSSO share*
Operation &
MaintenanceSSO share*
Development &
ConstructionSSO share*
CorporateSSO share*
Total
Revenues and other income 1,120 532 69 1,054 13 1,668
Gross margin 1,120 532 69 442 13 1,056
EBITDA 973 454 28 361 -50 792
Operating profit (EBIT) 663 298 27 358 -51 632
EBIT (%) 59% 56% 39% 34% - 38%
(*) SSO share adjusted based on Scatec Solar’s ownership in the subsidiaries

Copyright: Scatec Solar ASA
www.scatecsolar.com • [email protected]
Scatec Solar’s share of cash flow to equity
Last twelve months (NOKm)SSO proportionate share of cash flow to equity*
(*) Cash flow to equity is defined as EBITDA less normalised (i.e. average over each calendar year) loan and net interest repayments, less
normalised income tax payments. The definition implies changes in net working capital and investing activities are excluded from the figure.
Interest paid on corporate bond
44 41 304229
183
Q3 17Q4 16 Q1 17 Q2 17 Q4 17
Corporate Power production
Operation & MaintenanceDevelopment & Construction
Total 23 7 20 216 22 208 104 265
130 143
76
167
148
2015 2016 2017
-63 -65

Copyright: Scatec Solar ASA
www.scatecsolar.com • [email protected]
A solid financial position
• Cash position of NOK 2,863 million of which NOK
688 million at the group level
• Group* book equity strengthened to NOK 2,072 million – equity ratio of 74%
• Successful refinance of the 2018 Bond – new NOK 750 million bond with 4 year tenor
Financial position (NOKm)
NOKm
Consolidated SSO prop.
Share
Group
level**
Cash 2,863 1,880 688
Interest bearing
liabilities*-7,221 -3,894 -741
Net debt -4,358 -2,013 -53
*) Total interest bearing liabilities does not include shareholder loans to project companies
(**) As per definitions of “Recourse Group”, “Recourse Equity” and “Equity to capitalisation ratio” in senior bond agreement
As of 31.12.2016 As of 31.12.2017
7,075 7,075 10,240 10,240
5 253
7 418
509
935
1 313
1 887
5 5916 580
1 484
3 661
0
1 000
2 000
3 000
4 000
5 000
6 000
7 000
8 000
9 000
10 000
Assets Equity & Liabilities Assets Equity & Liabilities
Non-current liabilities Current liabilities Equity Non-current assets Current assets

Copyright: Scatec Solar ASA
www.scatecsolar.com • [email protected]
2017 - movement of free cash at group level
30
151
16765
477
73
227
291
688
304151
16765
477
73
227
291
Net
proceeds
from equity
issue
373
Distributions
from
operating
power plants
22
Cash flow
to equity
Corporate
229
Dvidend
distribution
Cash flow to
equity O&M
Cash flow to
equity D&C
Project
Development
capex
End 2016 Project
equity
End 2017Working
Capital/other
Net
proceeds
from bond
issue
NOK million Brazil, Malaysia
and Egypt
Development of
project backlog
and pipeline
Net WC construction projects
Copyright: Scatec Solar ASA
www.scatecsolar.com • [email protected]
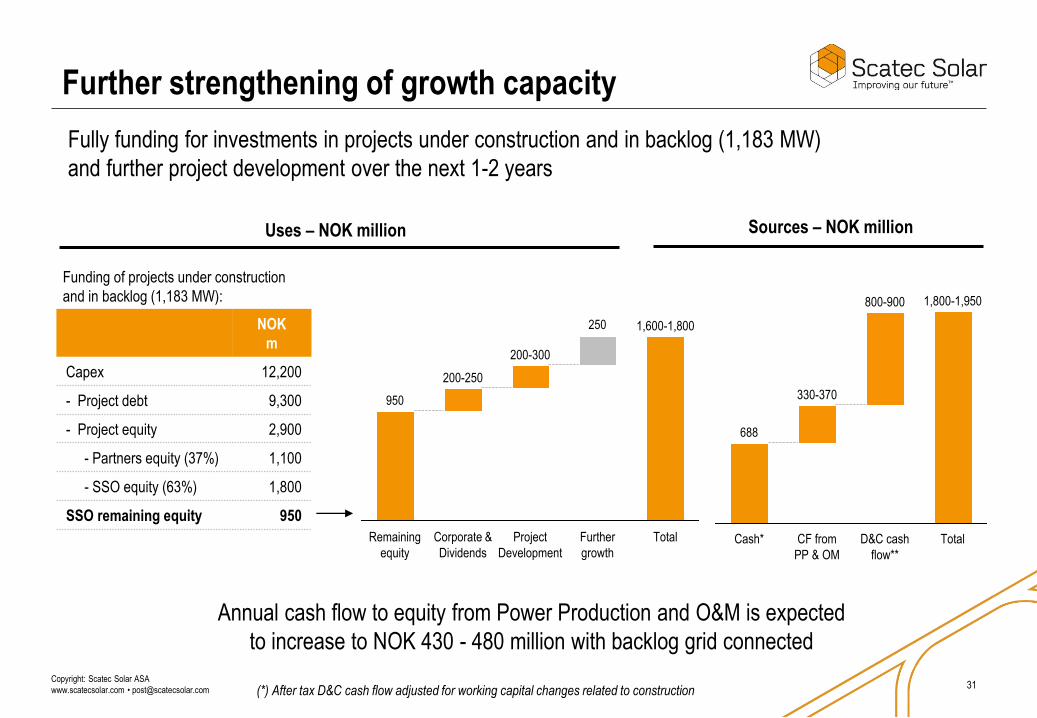
Further strengthening of growth capacity
NOK
m
Capex 12,200
- Project debt 9,300
- Project equity 2,900
- Partners equity (37%) 1,100
- SSO equity (63%) 1,800
SSO remaining equity 950
31
Fully funding for investments in projects under construction and in backlog (1,183 MW)
and further project development over the next 1-2 years
(*) After tax D&C cash flow adjusted for working capital changes related to construction
Uses – NOK million
Annual cash flow to equity from Power Production and O&M is expected
to increase to NOK 430 - 480 million with backlog grid connected
250
950
Total
1,600-1,800
Further
growth
Project
Development
200-300
Corporate &
Dividends
Remaining
equity
200-250
688
800-900
D&C cash
flow**
330-370
Cash* CF from
PP & OM
Total
1,800-1,950
Sources – NOK million
Funding of projects under construction
and in backlog (1,183 MW):

Outlook

Guidance and growth targets
Return and margin targets:
• Average equity return of 15% after tax on investments in new solar power plants
• Project development and construction (D&C) gross margins averaging 15%
Financial targets:
• 2018 O&M revenues of NOK 70-80 million and EBITDA margins of 40-45%
• 2018 cash flow to SSO equity from 322 MW in operation: NOK 160-180 million
• Annual cash flow to SSO equity from 1.5 GW in operation: NOK 430 - 480 million
33
Growth target (MWs)
394
745
322
789
In operation Under
construction
OpportunitiesBacklog Target end
’18: In
operation
and under
construction
Pipeline
2,800
1,300-1,500

Copyright: Scatec Solar ASA
www.scatecsolar.com • [email protected]
Focus on project delivery and pipeline development
• Emerging markets continue to present themselves with attractive opportunities
• Further expansion of our portfolio will benefit from our strong partnerships
• Very high construction activity in 2018 and 2019
• Capital Markets Day to be held May 30, 2018
34

Our values
• Predictable
• Driving results
• Changemakers
• Working together
Thank you