investor presentation - agilysys.com relations...our actual results and financial condition may...
TRANSCRIPT
Investor Presentation December 2017

TECHNOLOGY | INNOVATION | SOLUTIONS
Forward-looking Statements & Non-GAAP Financial Information
Forward-Looking Language
This presentation contains "forward-looking statements" within the meaning of the safe harbor provisions of the U.S. Private Securities Litigation Reform Act of 1995. Forward-looking statements can be identified by words such as: "anticipate," "intend," "plan," "goal," "seek," "believe," "project," "estimate," "expect," "strategy," "future," "likely," "may," "should," "will" and similar references to future periods. Examples of forward-looking statements include, among others, statements we make regarding guidance relating to revenue and adjusted earnings from operations, and expected results of strategic and operating initiatives, such as revenue growth, cash balances and improvements in operational efficiency and profitability.
Forward-looking statements are neither historical facts nor assurances of future performance. Instead, they are based only on our current beliefs, expectations and assumptions regarding the future of our business, future plans and strategies, projections, anticipated events and trends, the economy and other future conditions. Because forward-looking statements relate to the future, they are subject to inherent uncertainties, risks and changes in circumstances that are difficult to predict and many of which are outside of our control. Our actual results and financial condition may differ materially from those indicated in the forward-looking statements. Therefore, you should not rely on any of these forward-looking statements. Important factors that could cause our actual results and financial condition to differ materially from those indicated in the forward-looking statements include, among others, our ability to achieve operational efficiencies and meet customer demand for products and services and the risks described in the Company's filings with the Securities and Exchange Commission, including the Company's reports on Form 10-K and Form 10-Q, which may be accessed at www.sec.gov or www.agilysys.com.
Any forward-looking statement made by us in this presentation is based only on information currently available to us and speaks only as of the date on which it is made. We undertake no obligation to publicly update any forward-looking statement that may be made from time to time, whether written or oral, whether as a result of new information, future developments or otherwise.
Use of Non-GAAP Financial Information
To supplement the unaudited condensed consolidated financial statements presented in accordance with U.S. GAAP in this presentation, certain non-GAAP financial measures as defined by the SEC rules are used. These non-GAAP financial measures include adjusted EBITDA and adjusted earnings from operations. Management believes that such information can enhance investors' understanding of the company's ongoing operations. See the accompanying table below for a reconciliation of adjusted EBITDA and adjusted earnings from operations to the most closely related GAAP measure.
2
WHO WE ARE AND WHAT WE DO

TECHNOLOGY | INNOVATION | SOLUTIONS
We Provide Leading Hospitality Solutions
4
Lodging Solutions ~251k rooms at 9/30/17
+3% since 9/30/16
F&B Solutions ~42k end points at 9/30/17
+13% since 9/30/16
WELL-ESTABLISHED POINT-OF-SALE 58%
of Revenue
24% of Revenue
DOCUMENT MANAGEMENT
9% of Revenue
INVENTORY & PROCUREMENT
2% of Revenue
7% of Revenue
rGUEST PRODUCTS: STAY, BUY, PAY, SEAT & ANALYZE
WELL-ESTABLISHED PROPERTY MANAGEMENT
Note: Revenue contribution figures represent percentage for the trailing twelve months ended September 30, 2017

TECHNOLOGY | INNOVATION | SOLUTIONS
Gaming
Hotels, Resorts and Cruise
Food Service
Restaurants, Universities, Stadia and Healthcare
We Serve Leading Hospitality Brands
5
Food Service
Restaurants, Universities, Stadia and Healthcare

TECHNOLOGY | INNOVATION | SOLUTIONS
Continuing Cycle of Demand for Agilysys Products
•Guests Increasingly Demand New Technology Enabled Access and Ease of Use
•Growing Competition for Guest Loyalty Requires New Guest Experience Solutions
• Few Vendors Focused Solely on Hospitality & Large Enough to Meet Enterprise Needs
6
Dining Experience
Lodging Experience
HOTEL
Discover
Imagine
Book
Arrive
Depart
Reflect and
Share
Enjoy
Pay
Consume
Inspire
Guest
TECHNOLOGY | INNOVATION | SOLUTIONS
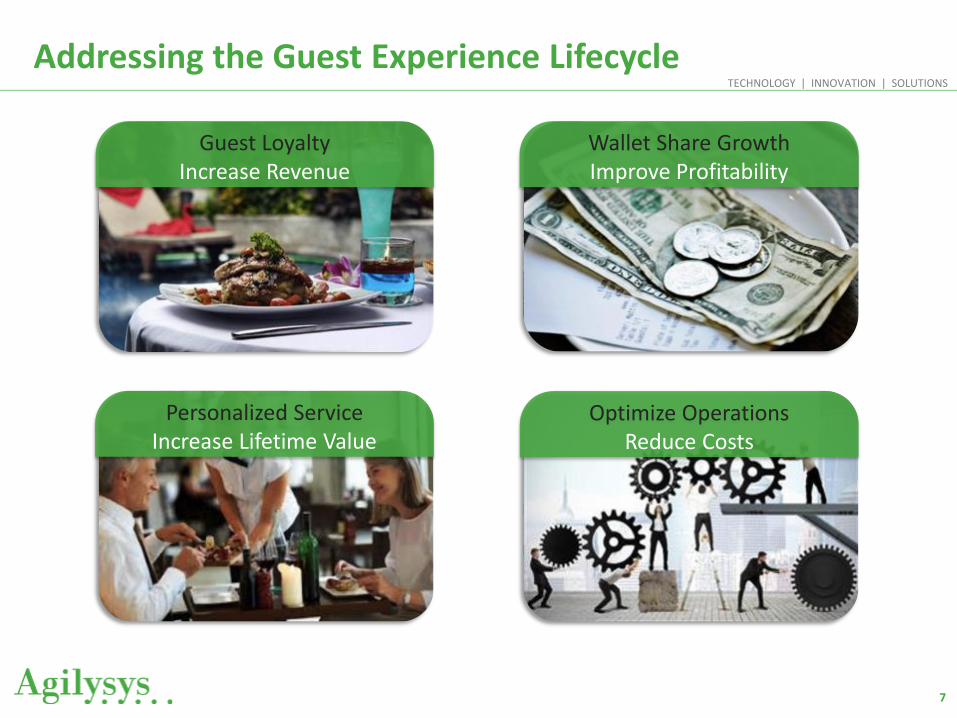
Addressing the Guest Experience Lifecycle
7
Optimize Operations Reduce Costs
Personalized Service Increase Lifetime Value
Guest Loyalty Increase Revenue
Wallet Share Growth Improve Profitability

TECHNOLOGY | INNOVATION | SOLUTIONS
Agilysys Products
8
rGuest Well-Established Partner
Food & Beverage
Lodging
Cross-Functional
TECHNOLOGY | INNOVATION | SOLUTIONS
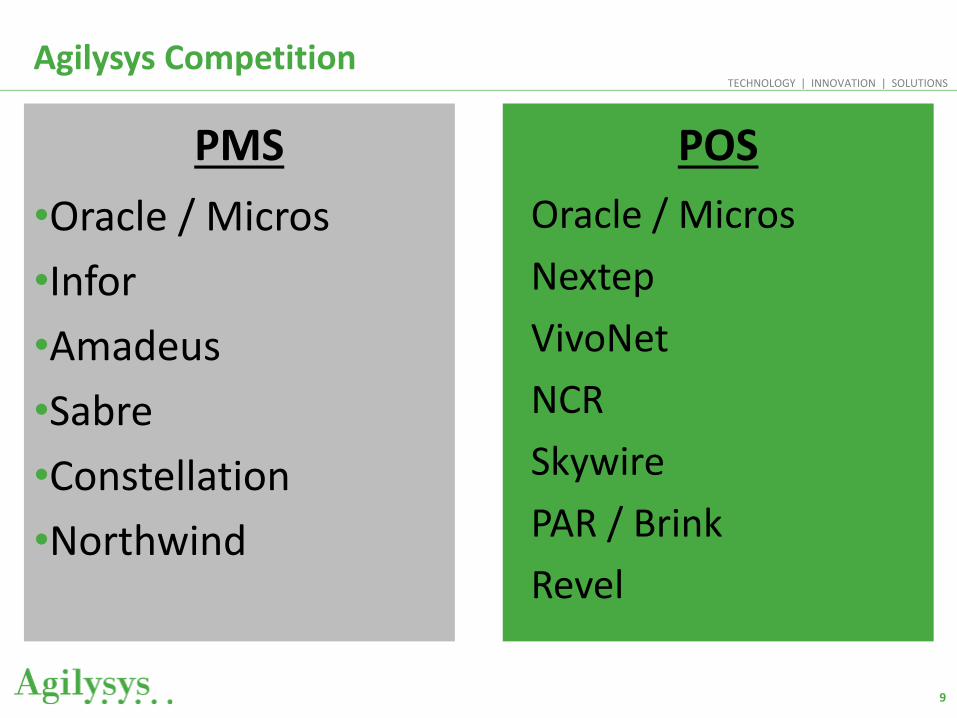
Agilysys Competition
PMS
•Oracle / Micros
•Infor
•Amadeus
•Sabre
•Constellation
•Northwind
9
POS
•Oracle / Micros
•Nextep
•VivoNet
•NCR
•Skywire
•PAR / Brink
•Revel

TECHNOLOGY | INNOVATION | SOLUTIONS
What Makes Agilysys Different?
Market-leading hospitality knowledge coupled with top technology talent
Competitive Strengths
Scalability
Only vendor of our size with enterprise infrastructure combined with the
agility to meet unique customer needs
Scalability & Enterprise Structure
Scalability
Only industry we address; proven service and satisfaction has led to
industry-leading average customer life of over ten years
Hospitality Industry Focused
Scalability Only vendor with end to end solutions and rGuest hospitality platform as a
service (PaaS) to tie all guest preferences together
Single View of the Guest Scalability
Handle disconnected scenarios for weeks at a time POS customers never
miss a sale
Offline Capabilities
Scalability
Maintenance and professional services team members come from line level roles within the industries we serve
Deep industry Experience
10

TECHNOLOGY | INNOVATION | SOLUTIONS
HELP OUR CUSTOMERS INCREASE
THEIR REVENUE AND PROFITABILITY
THROUGH IMPROVED GUEST
EXPERIENCE AND LOYALTY
WITH DEDICATION TO PAST, PRESENT &
FUTURE CUSTOMER INVESTMENTS IN
OUR PRODUCTS AND SERVICES.
Agilysys Mission
11

TECHNOLOGY | INNOVATION | SOLUTIONS
Senior Management Leading New Growth Vision
12
TONY PRITCHETT Chief Financial Officer Tony was appointed Chief Financial Officer in June 2017, prior to which he served as the company’s interim Chief Financial Officer. Pritchett is a certified public accountant who joined Agilysys in 2012 as controller of the Retail Solutions Group and subsequently served as the company’s Controller and as Senior Director of Operations. Prior to joining Agilysys, he served as the controller of Cypress Communications. He has also served as Director of Financial Reporting at PGI and worked for Grant Thornton’s assurance practice. Pritchett graduated from the University of Georgia in 2005 with a Bachelor of Business Administration degree in accounting along with a Master of Accountancy.
LARRY STEINBERG Senior Vice President and Chief Technology Officer Larry was named Senior Vice President and Chief Technology Officer in 2012. Prior to joining Agilysys, Steinberg was a Development Manager for Microsoft, where he focused on automation, interoperability, cross-platform initiatives, and cloud and datacenter management solutions. Before joining Microsoft, he was Chief Technology Officer of Engyro Corp., with responsibilities for strategic technology initiatives, product development and solution services delivery.
RAMESH SRINIVASAN President and Chief Executive Officer Ramesh was appointed President and Chief Executive Officer of Agilysys in January 2017. He is an accomplished CEO with demonstrated leadership success in technology, enterprise software and general management across multiple industries, and brings an impressive track record of multiple turnaround successes which have resulted in rapid and sustainable long-term growth and significant increases in shareholder value. Prior to his appointment as President and CEO, Ramesh served as CEO of Ooyala Inc. in Santa Clara, California, and was previously President and CEO of Innotrac Corporation, a leading eCommerce Fulfillment Services provider which merged with eBay Enterprise. Before joining Innotrac, he spent the previous nine years of his professional career at Bally Technologies, Inc. where he was promoted to President & CEO and member of the Board of Directors in December 2012.
PRAKASH BHAT Vice President and Managing Director (India) Prakash is an IIT, Madras and IIM, Ahmedabad alumnus with 30+ years of practical experience in technology and general management. He has an impressive track record of having been involved in building new companies from the ground-up and creating a strong market presence for established organizations in new locations. Prior to joining Agilysys., Prakash served as VP & Executive Director of Radial Omnichannel Technologies India Pvt. Ltd. where he was instrumental in setting up a wholly-owned India Subsidiary. Prakash had earlier spent 9 successful years at Bally Technologies India – during which time the organization grew from 2 to about 1,200 employees in India. Prakash played multiple roles during his stint at Bally India, including managing technology teams, Project Management, Product Management, HR, IT, Finance and Accounts. Other organizations that Prakash has worked with include Accenture, iNautix, and Infosys. Prakash is also the Honorary Secretary & Treasurer of a Charitable Trust.
TECHNOLOGY | INNOVATION | SOLUTIONS
Senior Management Leading New Growth Vision
13
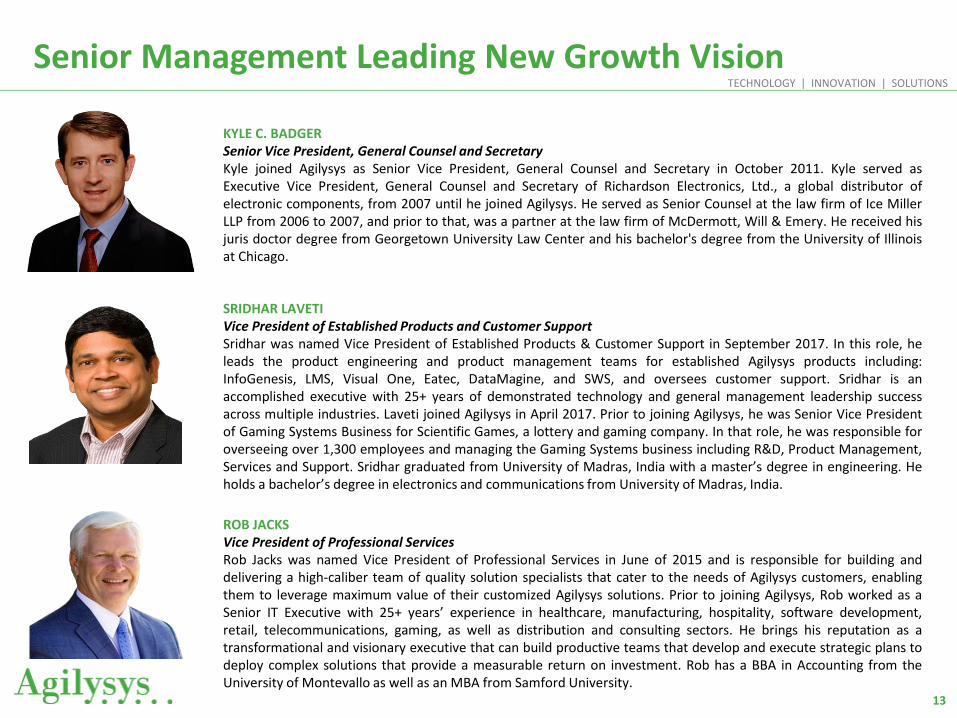
SRIDHAR LAVETI Vice President of Established Products and Customer Support Sridhar was named Vice President of Established Products & Customer Support in September 2017. In this role, he leads the product engineering and product management teams for established Agilysys products including: InfoGenesis, LMS, Visual One, Eatec, DataMagine, and SWS, and oversees customer support. Sridhar is an accomplished executive with 25+ years of demonstrated technology and general management leadership success across multiple industries. Laveti joined Agilysys in April 2017. Prior to joining Agilysys, he was Senior Vice President of Gaming Systems Business for Scientific Games, a lottery and gaming company. In that role, he was responsible for overseeing over 1,300 employees and managing the Gaming Systems business including R&D, Product Management, Services and Support. Sridhar graduated from University of Madras, India with a master’s degree in engineering. He holds a bachelor’s degree in electronics and communications from University of Madras, India.
ROB JACKS Vice President of Professional Services Rob Jacks was named Vice President of Professional Services in June of 2015 and is responsible for building and delivering a high-caliber team of quality solution specialists that cater to the needs of Agilysys customers, enabling them to leverage maximum value of their customized Agilysys solutions. Prior to joining Agilysys, Rob worked as a Senior IT Executive with 25+ years’ experience in healthcare, manufacturing, hospitality, software development, retail, telecommunications, gaming, as well as distribution and consulting sectors. He brings his reputation as a transformational and visionary executive that can build productive teams that develop and execute strategic plans to deploy complex solutions that provide a measurable return on investment. Rob has a BBA in Accounting from the University of Montevallo as well as an MBA from Samford University.
KYLE C. BADGER Senior Vice President, General Counsel and Secretary Kyle joined Agilysys as Senior Vice President, General Counsel and Secretary in October 2011. Kyle served as Executive Vice President, General Counsel and Secretary of Richardson Electronics, Ltd., a global distributor of electronic components, from 2007 until he joined Agilysys. He served as Senior Counsel at the law firm of Ice Miller LLP from 2006 to 2007, and prior to that, was a partner at the law firm of McDermott, Will & Emery. He received his juris doctor degree from Georgetown University Law Center and his bachelor's degree from the University of Illinois at Chicago.

TECHNOLOGY | INNOVATION | SOLUTIONS
OBSESSIVELY CUSTOMER CENTRIC
ENGINEERING DRIVEN COMPANY
IN EVERY MARKET WE SERVE
Go To Market Strategy
14

TECHNOLOGY | INNOVATION | SOLUTIONS
Strategic Initiatives to Deliver the Vision
INCREASED PRODUCT DEVELOPMEMENT VELOCITY
GREATER PROCESS EFFICIENCIES
EMPLOYEE & LEADERSHIP DEVELOPMENT
PROFITABLE REVENUE GROWTH
DIFFERENTIATING PRODUCT BREADTH
INTERNATIONAL EXPANSION
OBSESSIVE CUSTOMER CENTRICITY
INNOVATION AND EXECUTION
GOALS
15

TECHNOLOGY | INNOVATION | SOLUTIONS
India Development Center
Delhi
Chennai
Kolkata Mumbai
Pune
Bengaluru
Hyderabad
Kanpur Ahmedabad
IDC
• 34,000 Square Feet
• 330 Employee Capacity
• ~165 Already Onboard
• Full Capacity by June 2018
•Other Tenants – Amazon, Cisco, Citi, GE
16
FINANCIAL OVERVIEW
TECHNOLOGY | INNOVATION | SOLUTIONS
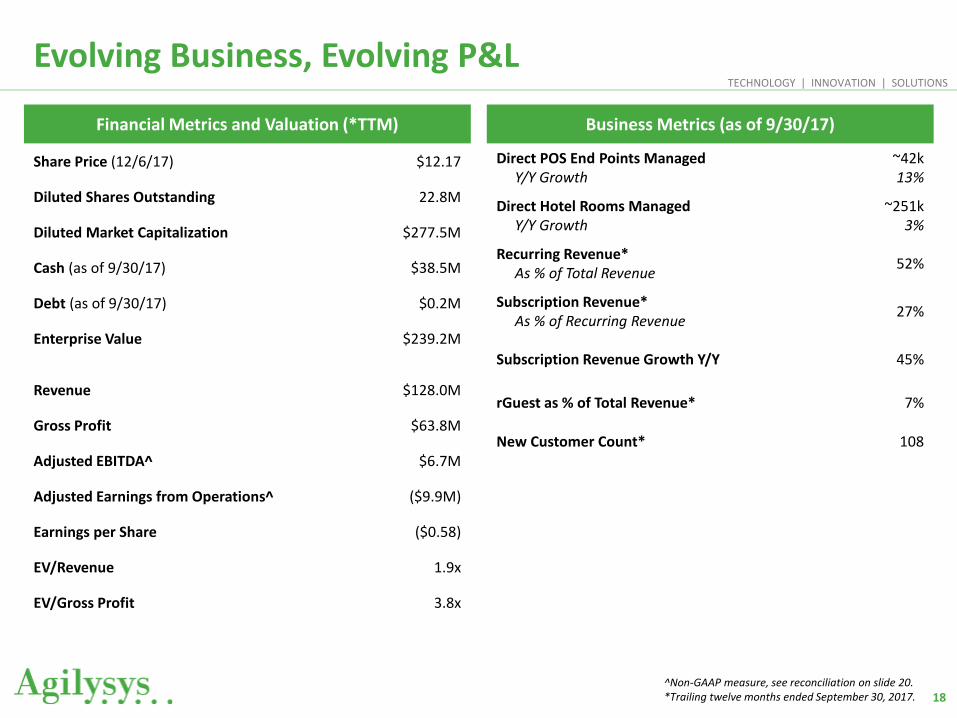
Evolving Business, Evolving P&L
Financial Metrics and Valuation (*TTM)
Share Price (12/6/17) $12.17
Diluted Shares Outstanding 22.8M
Diluted Market Capitalization $277.5M
Cash (as of 9/30/17) $38.5M
Debt (as of 9/30/17) $0.2M
Enterprise Value $239.2M
Revenue $128.0M
Gross Profit $63.8M
Adjusted EBITDA^ $6.7M
Adjusted Earnings from Operations^ ($9.9M)
Earnings per Share ($0.58)
EV/Revenue 1.9x
EV/Gross Profit 3.8x
Business Metrics (as of 9/30/17)
Direct POS End Points Managed Y/Y Growth
~42k 13%
Direct Hotel Rooms Managed Y/Y Growth
~251k 3%
Recurring Revenue* As % of Total Revenue
52%
Subscription Revenue* As % of Recurring Revenue
27%
Subscription Revenue Growth Y/Y 45%
rGuest as % of Total Revenue* 7%
New Customer Count* 108
^Non-GAAP measure, see reconciliation on slide 20. *Trailing twelve months ended September 30, 2017. 18
TECHNOLOGY | INNOVATION | SOLUTIONS
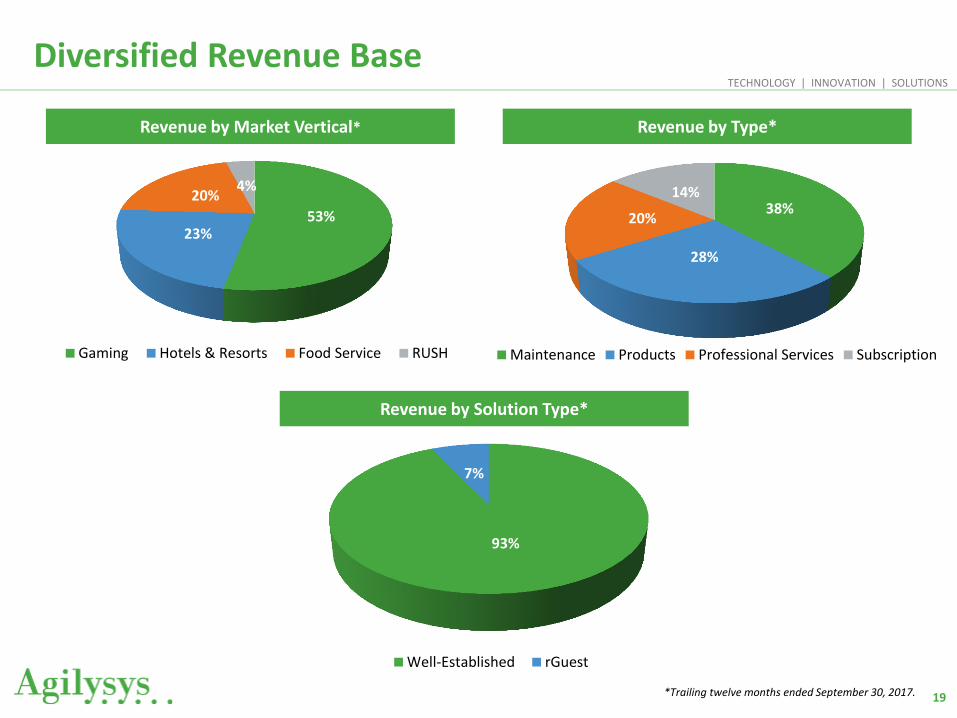
Diversified Revenue Base
53% 23%
20% 4%
Gaming Hotels & Resorts Food Service RUSH
38%
28%
20%
14%
Maintenance Products Professional Services Subscription
93%
7%
Well-Established rGuest
Revenue by Market Vertical* Revenue by Type*
Revenue by Solution Type*
*Trailing twelve months ended September 30, 2017. 19
TECHNOLOGY | INNOVATION | SOLUTIONS
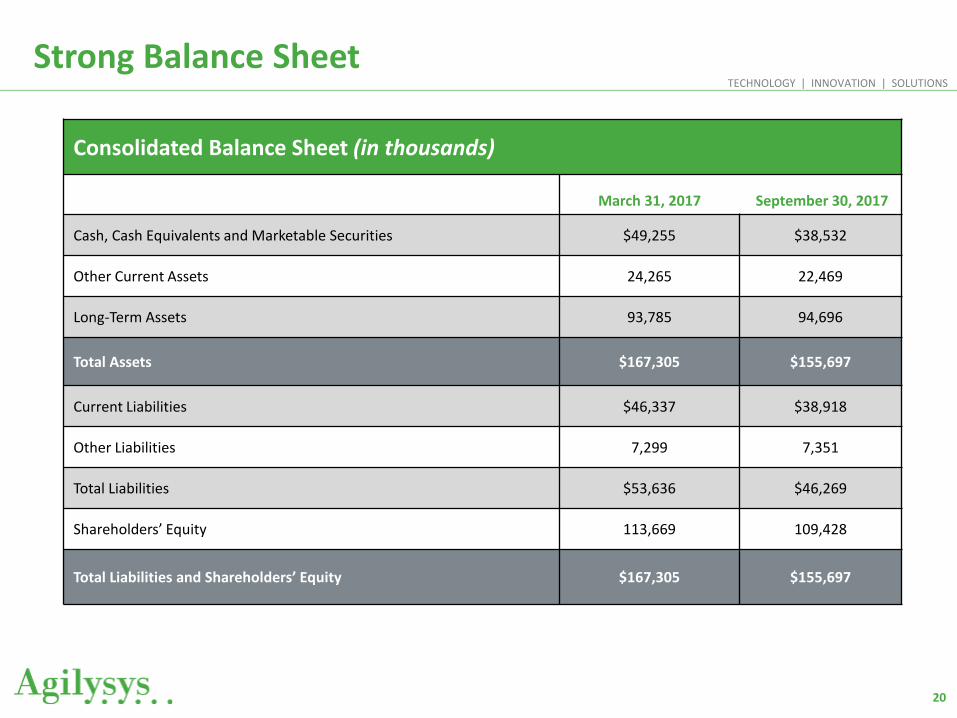
Strong Balance Sheet
20
Consolidated Balance Sheet (in thousands)
March 31, 2017 September 30, 2017
Cash, Cash Equivalents and Marketable Securities $49,255 $38,532
Other Current Assets 24,265 22,469
Long-Term Assets 93,785 94,696
Total Assets $167,305 $155,697
Current Liabilities $46,337 $38,918
Other Liabilities 7,299 7,351
Total Liabilities $53,636 $46,269
Shareholders’ Equity 113,669 109,428
Total Liabilities and Shareholders’ Equity $167,305 $155,697
TECHNOLOGY | INNOVATION | SOLUTIONS
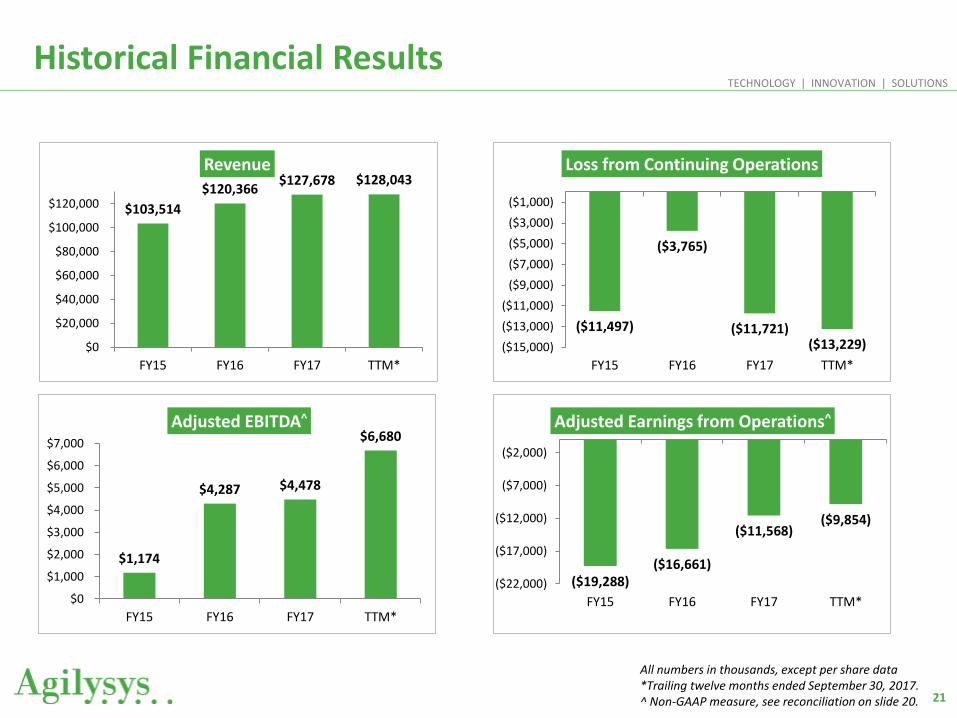
Historical Financial Results
21
All numbers in thousands, except per share data *Trailing twelve months ended September 30, 2017. ^ Non-GAAP measure, see reconciliation on slide 20.
$103,514
$120,366 $127,678 $128,043
$0
$20,000
$40,000
$60,000
$80,000
$100,000
$120,000
FY15 FY16 FY17 TTM*
Revenue
($19,288) ($16,661)
($11,568) ($9,854)
($22,000)
($17,000)
($12,000)
($7,000)
($2,000)
FY15 FY16 FY17 TTM*
Adjusted Earnings from Operations^
$1,174
$4,287 $4,478
$6,680
$0
$1,000
$2,000
$3,000
$4,000
$5,000
$6,000
$7,000
FY15 FY16 FY17 TTM*
Adjusted EBITDA^
($11,497)
($3,765)
($11,721) ($13,229) ($15,000)
($13,000)
($11,000)
($9,000)
($7,000)
($5,000)
($3,000)
($1,000)
FY15 FY16 FY17 TTM*
Loss from Continuing Operations

TECHNOLOGY | INNOVATION | SOLUTIONS
Non-GAAP Reconciliation
22 *Trailing twelve months ended September 30, 2017.
TTM* 2017 2016 2015
Net loss (13,229)$ (11,721)$ (3,765)$ (11,497)$
Income tax expense (benefit) 296 236 6 (1,054)
Loss before taxes (12,933) (11,485) (3,759) (12,551)
Depreciation of fixed assets 2,528 2,409 2,199 2,225
Amortization of intangibles 1,664 1,392 1,243 3,461
Amortization of developed technology 9,340 8,012 1,022 1,294
Interest income (153) (147) (63) (62)
EBITDA (b) 446 181 642 (5,633)
Share-based compensation 3,905 2,427 3,405 3,141
Restructuring, severance and other charges 2,334 1,561 283 1,482
Asset write-offs and other fair value adjustments - - 180 1,836
Other non-operating (income) expense (5) 224 (491) 146
Legal settlements - 85 268 203
Adjusted EBITDA (a) 6,680$ 4,478$ 4,287$ 1,174$
Capital expenditures (4,992) (4,158) (5,900) (4,650)
Capitalized software development costs (11,542) (11,888) (15,048) (15,813)
Adjusted Earnings from Operations (c) (9,854)$ (11,568)$ (16,661)$ (19,288)$
(a) Adjusted EBITDA, a non-GAAP financial measure, is defined as income before income taxes, interest expense (net of interest income),
depreciation and amortization (including amortization of developed technology), and excluding charges relating to i) legal settlements,
ii) restructuring, severance, and other charges, iii) asset write-offs and other fair value adjustments, iv) share-based compensation, and
v) other non-operating (income) expense
(b) EBITDA is defined as net income before income taxes, interest expense, depreciation and amortization
(c) Adjusted Earnings from Operations, a non-GAAP financial measure, is defined as Adjusted EBITDA,
less capital expenditures and capitalized software development costs
AGILYSYS, INC.
RECONCILIATION OF NET LOSS TO ADJUSTED EARNINGS FROM OPERATIONS
(UNAUDITED)
(In thousands)
Twelve Months Ended
March 31

TECHNOLOGY | INNOVATION | SOLUTIONS
TTM* FY17 FY16 FY15
Operating activities
Loss from continuing operations (13,229)$ (11,721)$ (3,765)$ (11,497)$
Non cash adjustments, restructuring, legal settlements 17,638 14,110 7,741 10,117
Changes in assets & liabilities (2,439) 1,044 3,242 (806)
Net cash provided by (used in) operating activities 1,970 3,433 7,218 (2,186)
Investing activities
Capital expenditures (4,992) (4,158) (5,900) (4,650)
Capitalized developed software (11,542) (11,888) (15,048) (15,813)
Investments 2,180 2,181 (65) 1,771
Acquistions - - - (2,941)
Net cash used in investing activities (14,354) (13,865) (21,013) (21,632)
Net cash used in financing activities (770) (847) (577) (401)
-
Effect of exchange rate 57 (74) (87) (280)
-
Decrease in cash & cash equivalents (13,097) (11,353) (14,459) (24,499)
Cash & cash equivalents - beginning of period 51,630 60,608 75,067 99,566
Cash & cash equivalents - end of period 38,533$ 49,255$ 60,608$ 75,067$
Cash Flow
23 *Trailing twelve months ended September 30, 2017.

TECHNOLOGY | INNOVATION | SOLUTIONS
Hospitality Market
24
APAC $1.36B
28%
EMEA $1.36B
29%
NA $1.72B
36%
SA $0.35B
7%
ARR Market Opportunity $4.79 Billion
POS $3.18B
66%
PMS $1.61B
34%
ARR Product Opportunity Billions
Agilysys Revenue ~ $128.0M*
*Trailing twelve months ended September 30, 2017.

TECHNOLOGY | INNOVATION | SOLUTIONS
Estimated 10% - 20% Four-Year Revenue Growth CAGR
25
130
150
170
190
210
230
250
270
290
FY18 FY19 FY20 FY21 FY22
Revenue Possibilities
20% CAGR 15% CAGR 10% CAGR
Adjusted Earnings from Operations 10%-15% of
Revenue in FY2020 is Possible

Contact:
Richard Land / Norberto Aja JCIR
(212) 835-8500 [email protected]
Tony Pritchett Chief Financial Officer
(770) 810-7941 [email protected]