investor presentation q3-2013 results 31, 2013 safe harbor statement this presentation contains...
TRANSCRIPT

October 31, 2013
INVESTOR PRESENTATION
Q3-2013 RESULTS

October 31, 2013
SAFE HARBOR STATEMENT
This presentation contains statements about management's future expectations, plans and prospects of our business that
constitute forward-looking statements, which are found in various places throughout the press release, including , but not
limited to, statements relating to expectations of orders, net sales, product shipments, backlog, expenses, timing of
purchases of assembly equipment by customers, gross margins, operating results and capital expenditures. The use of
words such as “anticipate”, “estimate”, “expect”, “can”, “intend”, “believes”, “may”, “plan”, “predict”, “project”, “forecast”,
“will”, “would”, and similar expressions are intended to identify forward looking statements, although not all forward looking
statements contain these identifying words. The financial guidance set forth under the heading “Outlook” constitutes forward
looking statements. While these forward looking statements represent our judgments and expectations concerning the
development of our business, a number of risks, uncertainties and other important factors could cause actual developments
and results to differ materially from those contained in forward looking statements, including the discovery of weaknesses in
our internal controls and procedures, our inability to maintain continued demand for our products; the impact on our
business of potential disruptions to European economies from euro zone sovereign credit issues; failure of anticipated
orders to materialize or postponement or cancellation of orders, generally without charges; the volatility in the demand for
semiconductors and our products and services; failure to adequately decrease costs and expenses as revenues decline,
loss of significant customers, lengthening of the sales cycle, incurring additional restructuring charges in the future, acts of
terrorism and violence; inability to forecast demand and inventory levels for our products, the integrity of product pricing and
protect our intellectual property in foreign jurisdictions; risks, such as changes in trade regulations, currency fluctuations,
political instability and war, associated with substantial foreign customers, suppliers and foreign manufacturing operations;
potential instability in foreign capital markets; the risk of failure to successfully manage our diverse operations; those
additional risk factors set forth in Besi's annual report for the year ended December 31, 2012 and other key factors that
could adversely affect our businesses and financial performance contained in our filings and reports, including our statutory
consolidated statements. We are under no obligation to (and expressly disclaim any such obligation to) update or alter our
forward-looking statements whether as a result of new information, future events or otherwise.
2

October 31, 2013
TABLE OF CONTENTS
I. Key Highlights
II. Financial Review
III. Strategic Highlights
IV. Outlook
V. Summary
3

October 31, 2013
I. KEY HIGHLIGHTS
4

October 31, 2013
KEY FINANCIAL HIGHLIGHTS Q3 AND YTD-13
5
• € 65.4 million:
• -9.7% vs. Q2-13
• -12.3% vs. Q3-12
Revenue
• € 48.2 million:
• -41.7% vs. Q2-13
• -1.1% vs. Q3-12
Orders
• € 4.4 million in Q3-13 vs. € 6.5 million in Q2-13 and € 4.3 million in Q3-12
Net Income
• Net cash of € 56.0 million. -€ 0.2 million vs. Q2-13
• Debt down € 2.4 million vs. Q2-13 to € 22.5 million
Liquidity
Strong profit performance in Q3-13 despite assembly equipment downturn due to improved
operating efficiency. Q4-13 order outlook improving
• € 201.9 million:
• -7.1% vs. 2012
Revenue
• € 194.7 million:
• -13.1% vs. 2012
Orders
• € 14.7 million vs. € 14.6 million in 2012
• Restructuring charges of € 0.7 million YTD-13 vs. € 0.3 million YTD-12
Net Income
• Net cash -€ 3.2 million vs. 2012. Reflects € 6.1 million dividend increase YOY
Liquidity
Q3-13 YTD-13

October 31, 2013
2010-2013 QUARTERLY BOOK TO BILL RATIO
6
Mar 10 Jun 10 Sept 10 Dec 10 Mar 11 Jun 11 Sept 11 Dec 11 Mar 12 Jun 12 Sept 12 Dec 12 Mar 13 Jun 13 Sept 13
Besi 1.72 1.49 0.88 0.55 0.97 0.92 0.99 0.78 1.51 1.05 0.65 0.92 1.00 1.14 0.74
Assembly Market 1.51 1.35 0.81 0.86 1.01 0.92 0.81 1.02 1.28 1.11 0.53 0.92 1.08 1.26 0.68
1.51
0.65
1.14
0.74
1.28
0.53
1.26
0.68
0.50
0.75
1.00
1.25
1.50
1.75
• Besi’s order trends highly correlated to assembly equipment industry
• Industry characterized recently by strong growth in H1 followed by weaker H2
• Current year follows same pattern
Assembly
Market
Besi
Source: Semi Oct 2013

October 31, 2013
OPERATIONAL PROGRESS YIELDS INCREASED
EFFICIENCY
7
217
202
6.7%
7.3%
5.0%
7.0%
9.0%
11.0%
13.0%
15.0%
100
125
150
175
200
225
2012 YTD 2013 YTD
Net
Marg
in %
€ m
illi
on
s
Revenue Net Income Margin
OPEX
Headcount
Effective Tax Rate
34.2% 20.4%
1,615 1,493
€ 65.3 MM € 62.1 MM
-7.6%
-13.8%
-4.8%

October 31, 2013
II. FINANCIAL REVIEW
8

October 31, 2013
REVENUE/ORDER TRENDS
9
Q3-13 vs. Q2-13
• Revenue: € 65.4 million (-9.7%)
• Lower die attach sales for high end smart phone
and tablet applications
• Industry weakness/customer push-outs
• Low end of guidance (flat to -10.0%)
• Orders: € 48.2 million (-41.7%)
• Across all product lines
• -€ 35.5 million (67.1%) subcontractors
• +€ 1.0 million (3.4%) IDMs
• Asian subcontractors held off on new capacity
• Better than Q3/Q2-12 trend (46.5% decline)
Q3-13 vs. Q3-12
• Revenue: -€ 9.2 million (-12.3%)
• Orders: -€ 0.5 million (-1.1%)
YTD-13 vs. YTD-12
• Revenue: -€ 15.5 million (-7.1%)
• Lower sales of multi module die attach systems
for high end smart phones
• Partial offset: increased epoxy, flip chip and
molding equipment sales for low to mid range
smart phone/tablet applications
Quarterly Trends
YTD Trends
55.8
87.0
74.6
56.3
64.0 72.4
65.4
84.2 91.1
48.7 52.0
63.9
82.7
48.2
0
20
40
60
80
100
Q1-2012 Q2-2012 Q3-2012 Q4-2012 Q1-2013 Q2-2013 Q3-2013
(eu
ro in
mill
ion
s)
Revenue Orders
217.4 201.9
224.1
194.7
0
50
100
150
200
250
2012 2013
(eu
ro in
mill
ion
s)
Revenue Orders

October 31, 2013
€0
€50
€100
€150
€200
€250
15%
20%
25%
30%
35%
40%
45%
50%
2012 2013
Gro
ss M
arg
in
Revenue Gross Margin Adj. Gross Margin*
GROSS MARGIN TRENDS
Q3-13 vs. Q2-13
• 39.2% vs. 40.4%
• Lower revenue
• Partial offset:
• Lower freight + European personnel costs
• Forex benefit: Increase in euro and US dollar
vs. Malaysian ringgit
• Low end of guidance (39-41%)
Q3-13 vs. Q3-12
• 39.2% vs. 40.3% in Q3-12
• 12.3% revenue decrease
• Partial offset: Lower materials, freight and
overhead costs
YTD-13 vs. YTD-12
• 39.8% vs. 40.6%
• 7.1% revenue decrease
• Partial offset: lower materials, freight and
overhead costs
10
* Excludes restructuring charges
Quarterly Trends
YTD Trends
€0
€20
€40
€60
€80
€100
0%
5%
10%
15%
20%
25%
30%
35%
40%
45%
50%
Q1-2012 Q2-2012 Q3-2012 Q4-2012 Q1-2013 Q2-2013 Q3-2013
Gro
ss M
arg
in
Revenue Gross Margin Adj. Gross Margin*
39.4% 41.5% 40.3% 37.7% 39.6% 40.4% 39.2%
40.6% 39.8%

October 31, 2013
OPERATING EXPENSE TRENDS
Q3-13 vs. Q2-13
• € 0.9 million lower opex (-4.3%)
• Absence of € 0.6 million restructuring costs
• Reduced warranty and personnel costs
• Better than guidance (€ 20.3 million)
Q3-13 vs. Q3-12
• € 2.5 million lower opex (-11.1%)
• Lower personnel and travel expenses
YTD-13 vs. YTD-12
• € 3.2 million lower opex (-4.9%)
• Ongoing cost reduction efforts
• Headcount down 7.6% vs. Q3-12
• Partial offset: € 1.4 million lower net R&D
capitalization and € 0.5 million higher
restructuring charges
11
Quarterly Trends
13.2 16.1 15.5 14.5 14.1 13.7 14.2
6.4
6.9 6.8 6.7 6.8 6.7 5.9
0.3 1.4 0.2 0.6 0.0
0
5
10
15
20
25
Q1-2012 Q2-2012 Q3-2012 Q4-2012 Q1-2013 Q2-2013 Q3-2013
(euro
in m
illio
ns)
SG&A R&D Restructuring
Quarterly Trends
YTD Trends
44.8 42.0
20.2 19.3
0.3 0.8
0
20
40
60
80
100
2012 2013
(euro
in m
illio
ns)
SG&A R&D Restructuring
65.3 62.1
19.6 23.0 22.6 22.6 21.1 21.0 20.1

October 31, 2013
NET INCOME TRENDS
• Quarterly net income trends reflect
industry and seasonal volatility
• YTD results reflect improved operating
efficiency
• Significant leverage in operating model
• Quarterly opex have ranged between
€ 20-23 million over past 8 quarters
• Declined to € 20.1 million in Q3-13
0.2
10.0
4.3
1.2
3.8
6.5
4.4
0
2
4
6
8
10
12
Q1-12 Q2-12 Q3-12 Q4-12 Q1-13 Q2-13 Q3-13
(eu
ro in
mill
ion
s)
Net Income
14.6 14.7
0
4
8
12
16
20
2012 2013
(eu
ro in
mill
ion
s)
Net Income
Quarterly Trends
YTD Trends
12

October 31, 2013
LIQUIDITY TRENDS
Net Cash 70.4 49.4 59.2 79.5 64.2 56.2 56.0
Q3-13 vs. Q2-13
• Net cash down € 0.2 million to
€ 56.0 million
Q3-13 vs. Q3-12
• Net cash -€ 3.2 million due primarily to:
• € 6.1 million additional cash dividends
Q3-13/Q2-13 Cash Movements
Sources of cash
• € 3.2 million cash from operations
• € 2.5 million cash on hand
Principal uses of cash
• -€ 2.1 million net debt payments
• -€ 2.0 million capitalized R&D
• -€ 0.8 million capex
13
Quarterly Trends
93.5
77.3
89.8
106.4
91.9
81.1 78.5
23.1 27.9
30.6 26.9 27.7
24.9 22.5
0
20
40
60
80
100
120
Q1-12 Q2-12 Q3-12 Q4-12 Q1-13 Q2-13 Q3-13
(eu
ro in
mill
ion
s)
Cash Debt

October 31, 2013
III. STRATEGIC HIGHLIGHTS
14
October 31, 2013
STRATEGIC PRIORITIES
15
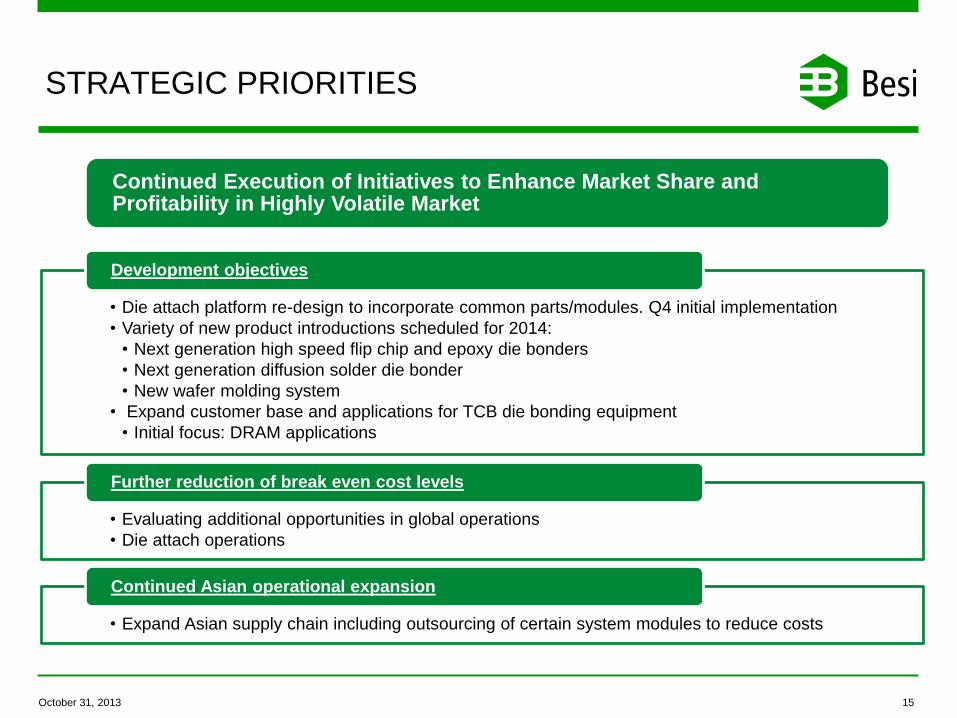
Continued Execution of Initiatives to Enhance Market Share and Profitability in Highly Volatile Market
• Die attach platform re-design to incorporate common parts/modules. Q4 initial implementation
• Variety of new product introductions scheduled for 2014:
• Next generation high speed flip chip and epoxy die bonders
• Next generation diffusion solder die bonder
• New wafer molding system
• Expand customer base and applications for TCB die bonding equipment
• Initial focus: DRAM applications
Development objectives
• Evaluating additional opportunities in global operations
• Die attach operations
Further reduction of break even cost levels
• Expand Asian supply chain including outsourcing of certain system modules to reduce costs
Continued Asian operational expansion

October 31, 2013
IV. OUTLOOK
16

October 31, 2013
Q4-2013 GUIDANCE
17
• Sequential revenue down approximately 20%
• Gross margins between 38% - 40%
• Opex flat to down approximately 5%
• Anticipate a profitable quarter
• Capex of approximately € 2 million
• Positive outlook for Q4 sequential order development
Revenue Gross Margin Operating Expenses* Capex
Q3 Q4 Q3 Q4 Q3 Q4 Q3 Q4
€ 65.4 39.2% € 20.1 € 0.8
40%
-
38%
Down
20%
* Excluding restructuring
+€ 1.2 million
Flat to Down
5%

October 31, 2013
ASSEMBLY EQUIPMENT MARKET TRENDS
18
• Since 2010 rebound, assembly market has been trending lower
• However, 18%+ growth anticipated in 2014
2.1
4.7
4.4
4.03.8
4.5
-27.1%
-9.4%-3.4%
17.7%
-6.8%
124.0%
0
1
2
3
4
5
6
2009 2010 2011 2012 2013E 2014E
-40%
10%
60%
110%
160%
Assembly Equipment Market Size YoY Growth Rate
Source: VLSI October 2013, as revised

October 31, 2013
V. SUMMARY
19

October 31, 2013
SUMMARY
Strong Q3-13 Profit Despite
Downturn
Seasonal Industry Patterns
and Quarterly Volatility Continue
Operating Efficiency Has
Improved
Introducing Next Generation
Products in 2014
Strategic Initiatives Offer
Upside Potential
Positive Q4 Order Outlook.
Optimistic About 2014
20

October 31, 2013
FINANCIAL CALENDAR
20/22-Nov-13 Morgan Stanley: TMT Conference, Barcelona, Spain
21-Nov-13 ABN AMRO Benelux Equities Conference, New York, USA
10-Dec-13 ESN: European Conference, London, United Kingdom
7-Mar-14
Rabobank: Telecom, Media and Technology Investor Conference,
Amsterdam, the Netherlands
21