investor presentation - chinabankchinabank.ph/pdf/chib-ir-2q2015.pdfthis presentation may not be...
TRANSCRIPT

0 0
Investor Presentation

1 1
This presentation has been prepared by China Banking Corporation solely for your information and for use at the
presentation by the Bank and has not been independently verified.
This presentation may not be reproduced, redistributed or passed on, directly or indirectly, to any other person or
published, in whole or in part, by any medium or for any purpose. “Presentation” means this document, any oral
presentation, the question and answer session and any written or oral material discussed or distributed at the meeting
where this presentation is made. By attending such meeting, or by accepting a copy of this presentation, you
acknowledge and agree to be bound by the following limitations and (1) will hold in confidence the information
contained herein; (2) will not distribute or reproduce this presentation, in whole or in part; (3) are (a) outside the United
States, (b) accustomed to receiving the type of information contained in this presentation and (c) a person into whose
possession this presentation may be lawfully delivered in accordance with the laws of the jurisdiction in which it is
located.
The information included in this presentation is current as of the date hereof and is subject to updating, completion,
revision and amendment, and such information may change materially. No person is under any obligation to update or
keep current the information contained in the presentation, and any opinions expressed in relation thereto are subject
to change without notice. This presentation should not be construed as legal, tax investment or other advice.
Investor Relations
Alexander C. Escucha, Senior Vice President and Head of Investor and Corporate Relations
28/F, Equitable Tower
8751 Paseo De Roxas, Makati City
Phone (632) 885-5601
E-mail: [email protected]
Legal Disclaimer

2 2
Company Profile
Sector Overview
Key Investment Merits
Financial Highlights
Management & Board of Directors
Q&A
Agenda

3 3
Company Profile
4 4
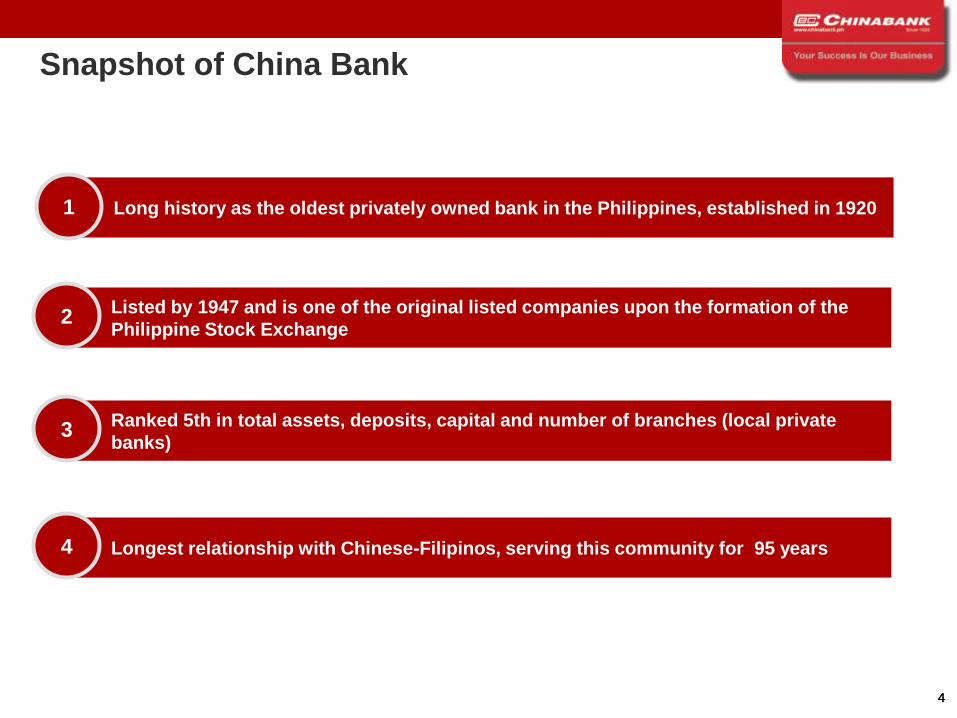
Snapshot of China Bank
Long history as the oldest privately owned bank in the Philippines, established in 1920 1
Listed by 1947 and is one of the original listed companies upon the formation of the
Philippine Stock Exchange 2
Ranked 5th in total assets, deposits, capital and number of branches (local private
banks) 3
Longest relationship with Chinese-Filipinos, serving this community for 95 years 4
5 5
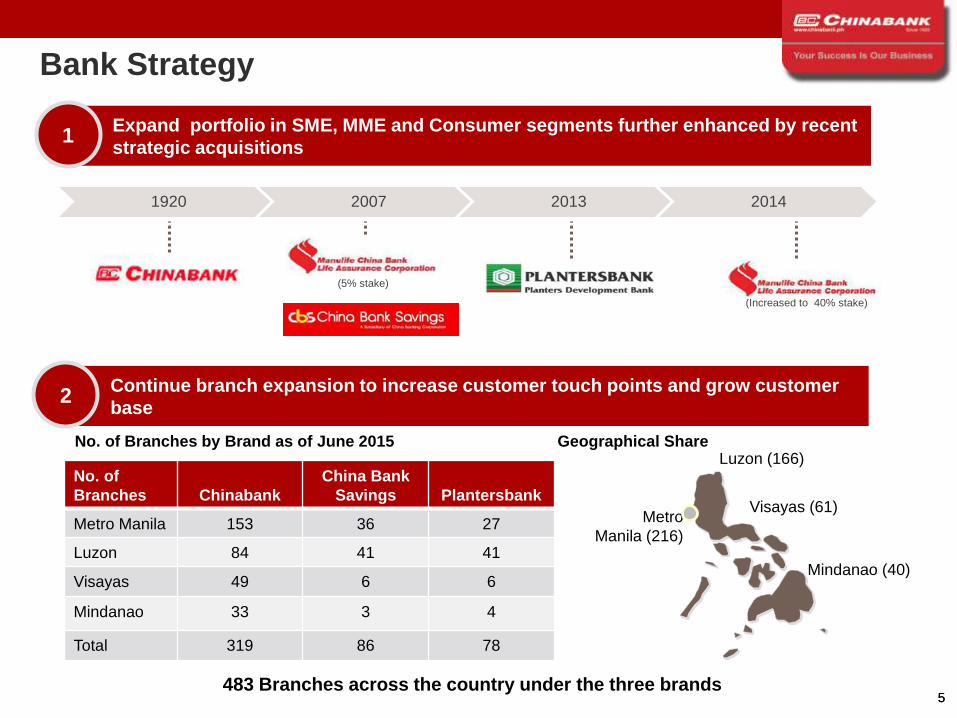
No. of
Branches Chinabank
China Bank
Savings Plantersbank
Metro Manila 153 36 27
Luzon 84 41 41
Visayas 49 6 6
Mindanao 33 3 4
Total 319 86 78
Visayas (61) Metro
Manila (216)
Luzon (166)
Mindanao (40)
Geographical Share
1920 2007 2013 2014
(Increased to 40% stake)
Bank Strategy
No. of Branches by Brand as of June 2015
483 Branches across the country under the three brands
Expand portfolio in SME, MME and Consumer segments further enhanced by recent
strategic acquisitions 1
Continue branch expansion to increase customer touch points and grow customer
base 2
(5% stake)

66
Comprehensive Financial Services Platform
China Bank’s organization anchored on three engines of growth:
Relationship Banking
Retail Banking Business
Lending Segment
Financial Capital Markets and Investment
Savings Banks and Other Business Units
China Bank Savings, Inc.
Manulife-China Bank Life Assurance Corporation
(MCBLife)
Focused growth aims to accelerate business expansion and to ensure efficient client servicing and product delivery
Planters Development Bank
China Bank Insurance Brokers, Inc.
1 2 3
Investment Banking
Private Banking
Treasury
Branch Banking
BinondoBusiness
Center
Institutional Banking
Commercial Banking
Corporate Banking
Consumer Banking
- Consumer Banking
- Remittance Business
- Credit CardTrust

7 7
Sector Overview

8 8
External vulnerabilities are low and policy space is flexible in Philippines and the rest of Asia
Macroeconomic Environment (1/4)
Source: Moody’s Investors Service as of February 2015
Emerging Market Sovereign External Vulnerability Summary Heatmap
Vulnerability Indicators Policy Space
Moody's Sovereign
Credit Rating
Current Account
Balance
(%GDP 2015F)
Enternal
Vulnerability
Indicator
(2015F)
Gross
Borrowing
Requirement
(%GDP, 2015F)
Government
Foreign
Currency
Debt/Total
Government Debt
CPI Inflation,
(Dec/Dec
%, 2015F)
General
Government
Debt
(%GDP, 2015F)
Loan to
Deposits
(%, 1H 2014)
ASIA
China Aa3 Stable 1.5% 19.6% 6.1% 0.5% 3.0% 33.8% 71.0%
India Baa3 Stable -2.0%
77.1%
77.1% 11.3% 6.3% 6.5% 64.2% 83.0%
Indonesia Baa3 Stable -2.7% 57.7%
3.8%
3.8% 45.3% 5.2% 25.6%
91%
91.0%
Korea Aa3 Stable 3.6%
44.4%
44.4% 2.6% na 2.5%
36.9%
36.9% 103.0%
Malaysia A3 Positve 2.7% 112.4%
9.3%
9.3% 2.6% 4.1% 53.6% 88.0%
Pakistan Caa1 Stable -1.6% 112.1% 30.6% 33.1% 8.0% 65.1% na
Philippines Baa2 Stable 3.2%
31.4%
31.4% 6.6% 35.3% 4.0%
38.7%
38.7% 66.0%
Taiwan Aa3 Stable 11.4%
42.6%
42.6% 5.8% 1.9% 42.8% 84.0%
Thailand Baa1 Stable -0.8%
44.6%
44.6% 8.5% 2.1% 2.6%
33.4%
33.4% 96.0%
Vietnam B1 Stable 4.4%
42.6%
42.6% na 41.9% 5.5%
45.8%
45.8% 84.0%
EMERGING MARKET (MEDIAN VALUE)
EM Asia Baa1 Stable 2.1%
44.5%
44.5% 6.6% 19.7% 4.1% 40.8% 84.0%
Latin America Ba1 Stable -2.6% 98.5%
6.9%
6.9% 42.5% 3.2%
35.5%
35.5% 101.0%
EMEA A3 Stable 0.9%
79.8%
79.8% 8.2%
22.8%
22.8% 3.2%
31.2%
31.2% 101.0%
Minimal vulnerability, considerable flexibility Moderate vulnerability, moderate flexibility Elevated vulnerability, diminished flexibility
9 9
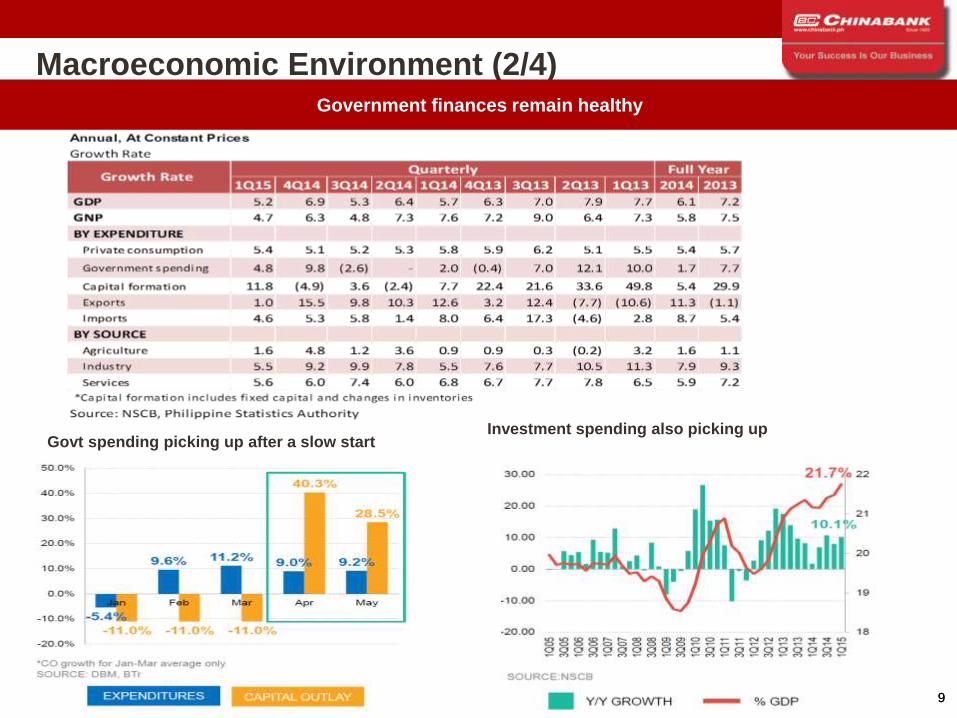
Macroeconomic Environment (2/4) Government finances remain healthy
Govt spending picking up after a slow start Investment spending also picking up

10 10
Macroeconomic Environment (3/4)
Benign inflation environment due to slow increase in food prices and downward adjustments in petroleum prices and electricity rates
July Inflation at 0.8%
Amid strong external position and significant improvement in macroeconomic fundamentals
Strongest sovereign credit ratings for PHL
Resilient Overseas Filipino (OF) Remittances
Stable growth on the back of a sustained demand for skilled Filipino
manpower and continuous efforts of financial institutions for overseas
expansion
Reserves are adequate to cover 10.6 months worth of
imports of goods and payments of services and income

11 11
Macroeconomic Environment (4/4)
* Real lending rate is the difference between the average bank lending rate and inflation Source: BSP, Inflation Report
Interest rates
BSP bucked global trend of monetary easing
- volatile in 2013, increasing in 2014 and steady 2015
Real Lending rate rose to 2.7% in June - due to continuous decline in inflation
Monetary policy & Reserve requirements kept steady
12 12
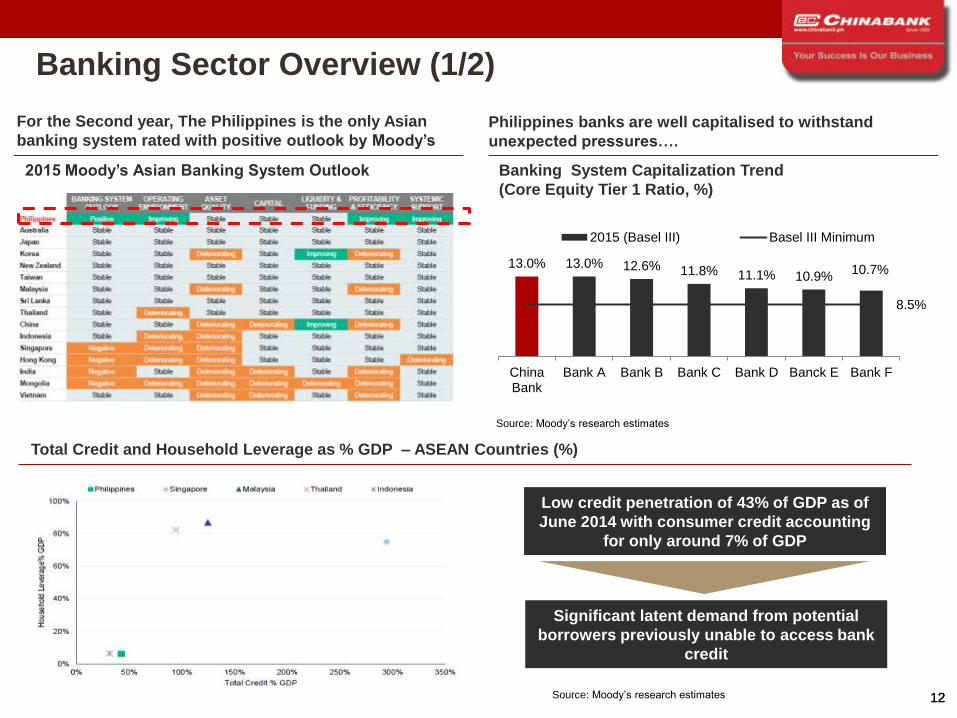
Banking Sector Overview (1/2)
Banking System Capitalization Trend
(Core Equity Tier 1 Ratio, %)
Source: Moody’s research estimates 12
For the Second year, The Philippines is the only Asian
banking system rated with positive outlook by Moody’s
13.0% 13.0% 12.6% 11.8% 11.1% 10.9% 10.7%
8.5%
ChinaBank
Bank A Bank B Bank C Bank D Banck E Bank F
2015 (Basel III) Basel III Minimum
2015 Moody’s Asian Banking System Outlook
Low credit penetration of 43% of GDP as of
June 2014 with consumer credit accounting
for only around 7% of GDP
Total Credit and Household Leverage as % GDP – ASEAN Countries (%)
Significant latent demand from potential
borrowers previously unable to access bank
credit
Philippines banks are well capitalised to withstand
unexpected pressures….
Source: Moody’s research estimates

13 13
Banking Sector Overview (2/2)
Financial Metrics of Philippine Banks (June 2015)
China Bank overtook RCBC as top 5 private bank in terms of Total Assets and Number of Branches
Amt Amt Amt Amt
(in P Bn) (in P Bn) (in P Bn) (in P Bn)
BDO 1,886 17.38% 1,227 21.97% 1,520 18.29% 180 15.42% 13.23% 13.54% 892
MBT 1,630 15.02% 806 14.43% 1,206 14.50% 190 16.25% 10.97% 13.26% 938
BPI 1,414 13.04% 824 14.76% 1,199 14.42% 146 12.48% 13.00% 12.90% 825
PNB 617 5.68% 328 5.87% 456 5.49% 96 8.18% 7.20% 7.50% 662
CHIB 476 4.38% 287 5.13% 400 4.81% 54 4.62% 8.67% 9.08% 483
RCBC 470 4.34% 270 4.83% 322 3.88% 62 5.32% 9.30% 8.93% 450
SECB 441 4.07% 203 3.63% 258 3.10% 51 4.35% 18.83% 17.22% 257
UBP 357 3.29% 165 2.95% 266 3.20% 52 4.46% 10.70% 3/ 13.70% 270
EW 205 1.89% 132 2.36% 158 1.90% 30 2.57% 8.00% 10.60% 410
Gov't Banks 1,556 14.34% 552 9.88% 1,249 15.03% 117 10.03%
LBP 1,091 10.06% 402 7.20% 954 11.48% 75 6.38% 18.74% 2/ 16.54% 2/ 352
DBP 464 4.28% 150 2.68% 294 3.54% 42 3.63% 9.20% 2/ 7.13% 2/ 97
Foreign Banks 984 9.07% 467 8.36% 626 7.53% 89 7.57%
Other Local Banks 813 7.50% 325 5.82% 653 7.85% 102 8.75%
TOTAL 10,849 100% 5,586 100% 8,313 100% 1,169 100%1/
data from SEC 17-Q
2/data from Published SOC
3/ UBP ROE Computed
Institution
ASSETS2/ NET LOANS2/ DEPOSITS2/ CAPITAL2/ ROE1/
BranchesMkt Share
(%)
Mkt Share
(%)
Mkt Share
(%)
Mkt Share
(%)
Jan-Jun
'15
Jan-Jun
'14
14 14
Key Investment Merits

15 15
Key Investment Merits
5
4
3
1
2 6
7 Established
strength in Affluent
Filipino-Chinese
business segment
Strong
balance sheet
with
sustainable
growth
Well diversified
loan portfolio with
quality assets
Strong and
improving capital
levels
Well positioned for
growth with
diversified income
stream, effective cost
management ,
extensive distribution
network and scalable
infrastructure
Strong support
from SM Group
and Experienced
management
Sustained
delivery o f
Shareholder
Returns

16 16
Established Strength in Affluent Filipino-
Chinese Business Segment
Loyal and highly valuable customer
base
Predominantly focused on the
SME/MME segments
Multi-generational relationships Agile and entrepreneurial mindset
Sustainable and profitable niche client relationships
1

17 17
255 258 315
399 405 389 409 2 4
9
15 21 18
24 45
50 46
2010 2011 2012 2013 2014 Jun-14 Jun-15
China Bank (CBC) China Bank Savings (CBS) Planters Development Bank (PDB)
94 67 70
112 84 86 97
117 145
190
221 290 264 289 46 50
64
81
97 108
93
Securities/Treasury Assets Net Loans Others
Strong Balance Sheet with Sustainable
Growth (1/3)
471
257 262
479
414
324
457
2
Steady Increase in Assets Through Sustainable Organic Growth and Strategic Inorganic Expansions
YoY: 5%
CAGR:16%
Total Assets (PHP in B)
18 18
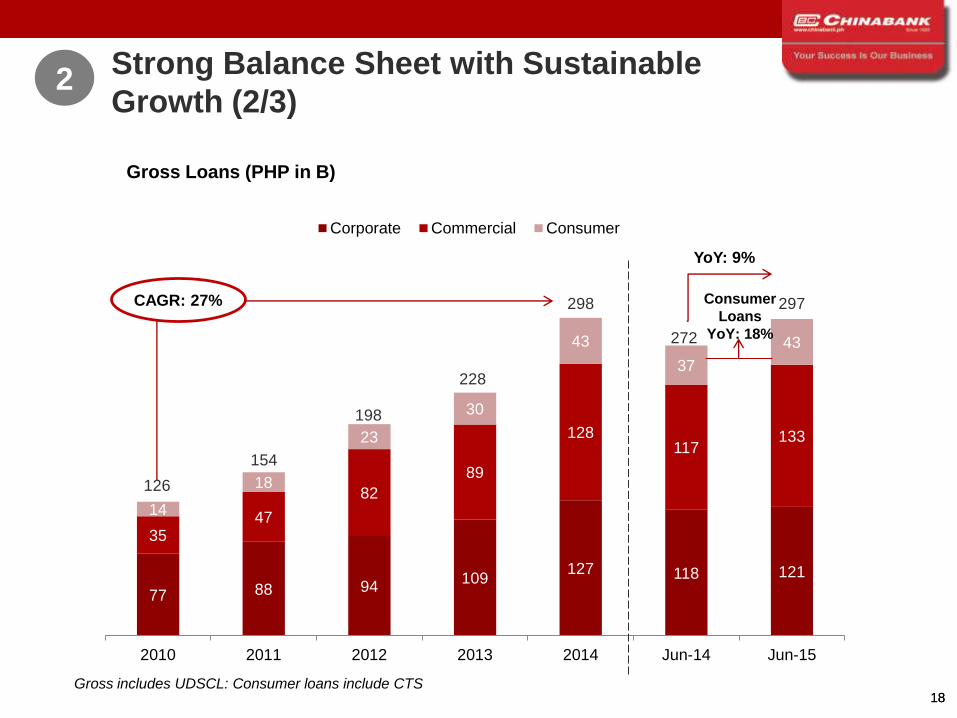
Strong Balance Sheet with Sustainable
Growth (2/3)
Gross Loans (PHP in B)
2
77 88 94 109
127 118 121
35 47
82
89
128 117
133
14
18
23
30
43
37
43
2010 2011 2012 2013 2014 Jun-14 Jun-15
Corporate Commercial Consumer
126
154
198
228
298
272
297 CAGR: 27%
YoY: 9%
Gross includes UDSCL: Consumer loans include CTS
Consumer
Loans
YoY: 18%

19 19
70 82 90 137
179 164 188 89 86
128
146
147 161 141
53 48
54
71
73 63 70
2010 2011 2012 2013 2014 Jun-14 Jun-15
CASA High Cost FCDU
Peso Deposits (PHP in B)
Loan-to-Deposit (%)
Strong Balance Sheet with Sustainable
Growth (3/3) 2
Funding (PHP in B)
213 216
272
354
399 388
399 CAGR: 17%
YoY: 3%
160 167
218
283
327 325 330
2010 2011 2012 2013 2014 Jun-14 Jun-15
49 67 70 62 73 68 72
Peso CASA as % Total Peso Deposits (%)
44 49 42 48 55 50 57
20 20
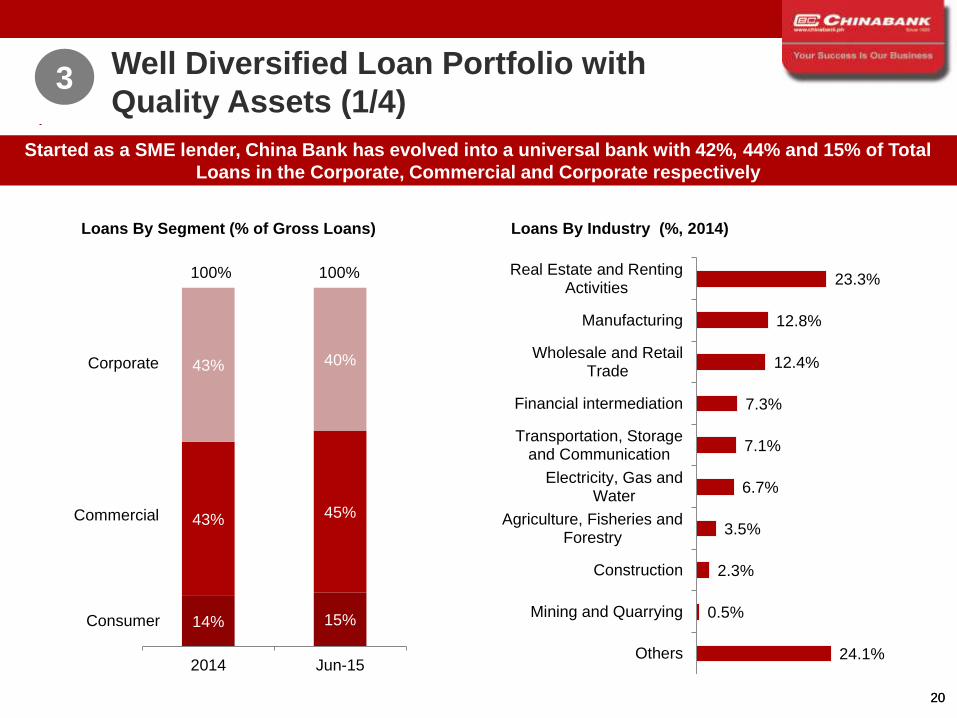
Loans By Industry (%, 2014)
24.1%
0.5%
2.3%
3.5%
6.7%
7.1%
7.3%
12.4%
12.8%
23.3%
Others
Mining and Quarrying
Construction
Agriculture, Fisheries andForestry
Electricity, Gas andWater
Transportation, Storageand Communication
Financial intermediation
Wholesale and RetailTrade
Manufacturing
Real Estate and RentingActivities
Well Diversified Loan Portfolio with
Quality Assets (1/4) 3
Loans By Segment (% of Gross Loans)
14% 15%
43% 45%
43% 40%
2014 Jun-15
Consumer
Commercial
Corporate
100% 100%
Started as a SME lender, China Bank has evolved into a universal bank with 42%, 44% and 15% of Total
Loans in the Corporate, Commercial and Corporate respectively
21 21
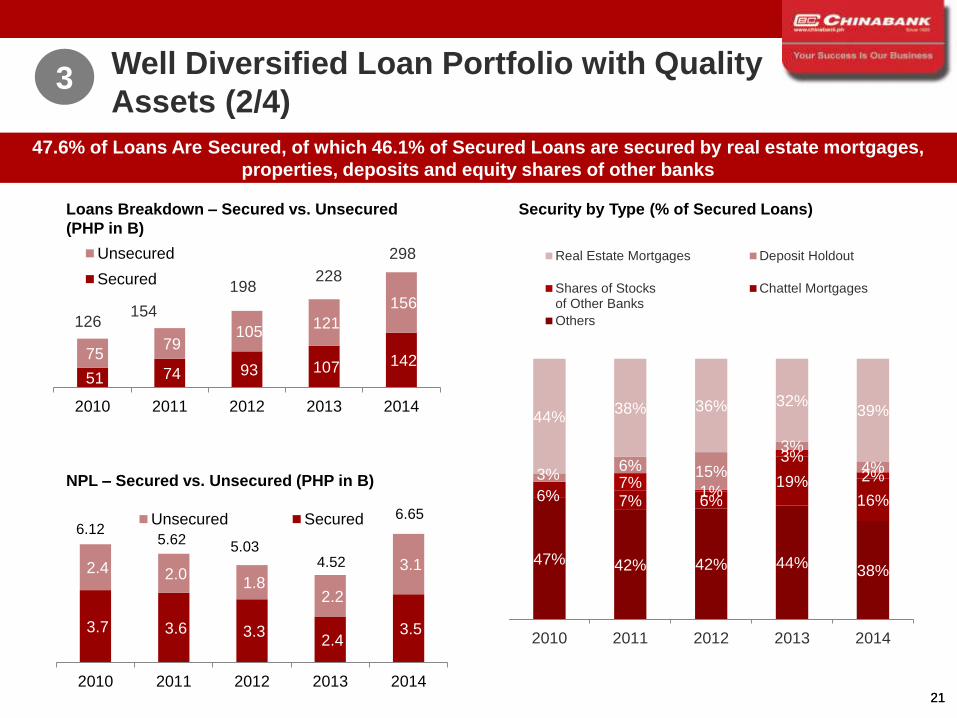
NPL – Secured vs. Unsecured (PHP in B)
6.12 5.62
5.03 4.52
6.65
Loans Breakdown – Secured vs. Unsecured
(PHP in B)
51 74 93 107 142 75 79
105 121
156
2010 2011 2012 2013 2014
Unsecured
Secured
Security by Type (% of Secured Loans)
126 154
198 228
298
Well Diversified Loan Portfolio with Quality
Assets (2/4) 3
47.6% of Loans Are Secured, of which 46.1% of Secured Loans are secured by real estate mortgages,
properties, deposits and equity shares of other banks
47% 42% 42% 44% 38%
6% 7% 6%
19%
16% 7%
1%
3%
2% 3% 6% 15%
3%
4%
44% 38% 36% 32%
39%
2010 2011 2012 2013 2014
Real Estate Mortgages Deposit Holdout
Shares of Stocksof Other Banks
Chattel Mortgages
Others
3.7 3.6 3.3 2.4
3.5
2.4 2.0 1.8
2.2
3.1
2010 2011 2012 2013 2014
Unsecured Secured

22 22
NPA and NPL Ratios (%) - Group
Well Diversified Loan Portfolio with Quality
Assets (3/4) 3
Continuous improvement in assets and loan provisions and steady coverage
7.9% 6.6%
5.6%
4.2% 3.8% 3.6% 3.7%
2.2% 3.0% 3.0% 3.2%
6.5% 5.8%
5.2% 4.1%
3.9% 2.9% 2.6% 2.0% 2.2% 3.0% 2.5%
2006 2007 2008 2009 2010 2011 2012 2013 2014 Jun-14 Jun-15
96.9% 91.2% 92.1%
122.2% 128.9% 134.7% 134.9% 146.6%
101.3% 99.1% 92.6%
2006 2007 2008 2009 2010 2011 2012 2013 2014 Jun-14 Jun-15
Loan Loss Coverage Ratio (%) - Group
Parent at
128.18%

23 23
Source: BSP and Company data
Credit Cost (%)
The Result: A Credit Cost That is Consistently Lower Than Industry Year Over Year
Well Diversified Loan Portfolio with Quality
Assets (4/4) 3
0.00%
0.10%
0.20%
0.30%
0.40%
0.50%
0.60%
0.70%
0.80%
0.90%
1.00%
2007 2008 2009 2010 2011 2012 2013 2014 1Q2015 1S2015
China Bank Average of universal and commercial banks in the Philippines

24 24
Strong and Improving Capital Levels
The Only Major Bank without Hybrid Tier-2 Notes Issuances to comply with Basel II Capital Requirement
4
Total Equity (PHP in B)
23.6%
16.0%
13.5% 12.8%
16.6% 17.8%
16.0% 15.4% 14.8% 16.2%
14.5%
22.0%
15.1% 12.6%
11.9%
15.7% 17.0% 15.2% 14.6% 14.0% 14.8%
13.6%
18.5% 15.9% 15.7% 16.0%
17.3%
17.7% 19.0% 18.9%
16.7% 16.7% 17.0%
Capital Adequacy Ratio (CAR) Tier-1 Ratio Industry Average CAR
25 27 26 30
35 39 42 45
57 55 59
2006 2007 2008 2009 2010 2011 2012 2013 2014 Jun-14 Jun-15
P8BN stock rights in
2014
Basel II
implementation

25 25
8,633 8,552 8,062 9,936
14,089
6,789 7,423
1,587 1,503 1,602
1,577
1,813
866 993
1,751 1,469 2,916
1,905
535
202 346
1,348 1,221
1,275 1,679
2,411
895 709
2010 2011 2012 2013 2014 Jun-14 Jun-15
Net Interest Income Fee Income Trading & Securities Others
Operating Income by Income Type (PHP in M)
13,319 12,744
13,856
15,097
18,848
8,752
Well Positioned for Growth Diversified
Income Stream… (1/3) 5
CAGR: 9.1%
YoY: 8.22%
9,471

26 26
…Effective Cost Management…(2/3) 5
Despite massive expansion, cost parameters compare well with its peers in the Philippines
Cost to Income – Philippine Banks (%, 2014)
Cost to Average Assets – Philippine Banks
(%, 2014)
68.1% 64.5% 62.2% 60.1% 60.0% 56.1% 54.6% 48.2% 47.3%
BankA
BankB
ChinaBank
BankC
BankD
BankE
BankF
BankG
BankH
5.41%
3.24% 3.15% 2.74% 2.74% 2.65% 2.49% 2.33%
1.51%
BankA
BankB
BankC
BankD
BankE
ChinaBank
BankG
BankH
BankH
53.5% 55.2% 59.2% 59.0% 62.2% 65.0% 63.5%
2010 2011 2012 2013 2014 Jun-14 Jun-15
Cost to Income – China Bank (%)
2.90% 2.71% 2.82% 2.41% 2.65% 2.61% 2.54%
2010 2011 2012 2013 2014 Jun-14 Jun-15
Cost to Average Assets – China Bank (%)

27 27
5th Largest Distribution Network in the Philippines
(No. of Branches, as of 30 June 2015) Ongoing Network Expansion Plan
(No. of Branches and ATMs)
Robust and Scalable Infrastructure Platform
…and Extensive Distribution Network and
Scalable Infrastructure Platform (3/3) 5
938 892 825
662
483 450 410
270 257
BankA
BankB
BankC
BankD
ChinaBank
BankE
BankF
BankG
BankH
314 319 364 384 404 424 484 78 86
151 158 165 172 180
78 78
661 676 801 842 883 925 967
2014 Jun-15 2015F 2016F 2017F 2018F 2019F
PDB CBS CHB ATMs
470 483 515 542 569 596 664
28 28
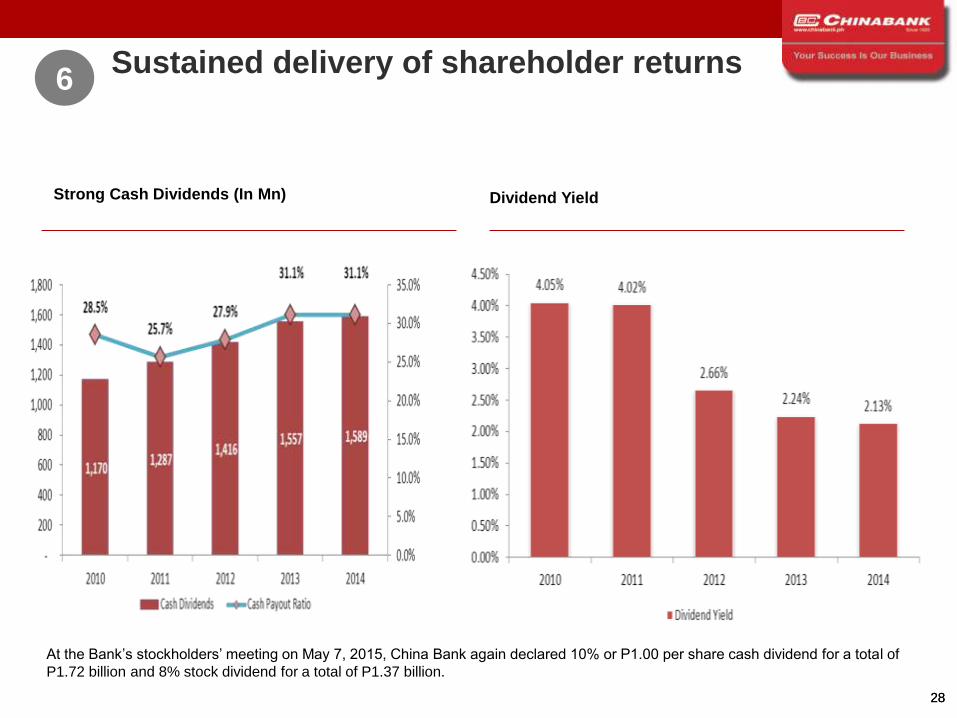
Strong Cash Dividends (In Mn)
Sustained delivery of shareholder returns 6
Dividend Yield
At the Bank’s stockholders’ meeting on May 7, 2015, China Bank again declared 10% or P1.00 per share cash dividend for a total of
P1.72 billion and 8% stock dividend for a total of P1.37 billion.

29 29
Shareholding Support from SM Group
Retail Financial Services
Property
Mutually Beneficial to the SM Group’s ecosystem of merchants,
suppliers and contractors
Priority rights to place branches and ATMs in SM shopping malls
Superior network locations for opening mini-branches in SM
Group’s Savemore supermarkets
Access to SM Group’s retail network to promote new products
such as its upcoming payment cards products
Distinct Benefits for China Bank as a
member of the SM Group
Strong Support from SM Group and
Experienced Management Team (1/3)
27%
10%
26%
37%
% Shareholding in China Bank
100%
(SMIC@17%)
7
Sy Group and
SM Group
Foreign
Shareholders
Dee Group
Others

30 30
Highly respected senior management
team in the industry…
…with over 20 years of Industry
experience on average…
…and successful track record of
managing acquisitions and achieving
financial results …
Strong Support from SM Group and
Experienced Management Team (2/3) 7

31 31
Recipient of the Bell Award for Corporate Governance for the 3rd
consecutive year by PSE
Recipient of Gold Award for Outstanding company from Institute of
Corporate Directors (ICD)
Asia’s Outstanding Company on Corp Governance
awarded by Corporate Governance Asia
Strong Support from SM Group and
Experienced Management Team (3/3) 7
• Award top 5 listed companies, out of 260
• Only bank among top 5 (2012, 2013 and 2014)
• Gold (2011 and 2012)
• Ranked among the top 50 publicly-listed companies in the ASEAN
Corporate Governance Scorecard Country Reports and Assessments
2013-2014
…The Result: Recognition of China Bank’s Strength in Corporate Governance

32 32
Financial Performance Highlights

33 33
Financial Highlights (1/2)
Income Statement(In Millions)
FY 2013 FY 2014 Amt % Jun-14 Jun-15 Amt %
Net interest Income 9,936 14,089 4,153 41.8 6,789 7,423 634 9.3
Non-Interest Income 5,160 4,759 (401) (7.8) 1,963 2,048 85 4.3
Total Operating Income 15,096 18,848 3,752 24.9 8,752 9,471 719 8.2
Total Operating Expenses 9,321 12,170 2,849 30.6 5,876 6,266 390 6.6
Income before Income Tax 5,775 6,678 903 15.6 2,876 3,205 329 11.4
Provision for Income Tax 675 1,565 890 131.9 672 691 19 2.8
Net Income 5,100 5,113 13 0.3 2,204 2,514 310 14.1
Attributable to:
Equity Holders of the Parent Bank 5,103 5,116 13 0.3 2,226 2,514 289 13.0
Non-contorlling Interest (3) (3) - - (22) (0) 21 (97.9)
Ratios:
Net Interest Margin (%) 3.00 3.30 3.18 3.36
Cost-to-Income Ratio (%) 59.00 62.22 65.01 63.46
Cost To Assets Ratio (%) 2.41 2.65 2.61 2.54
Return on Average Equity (%) 11.30 9.91 9.08 8.67
Return on Average Assets (%) 1.50 1.12 0.98 1.06
Change Change
34 34
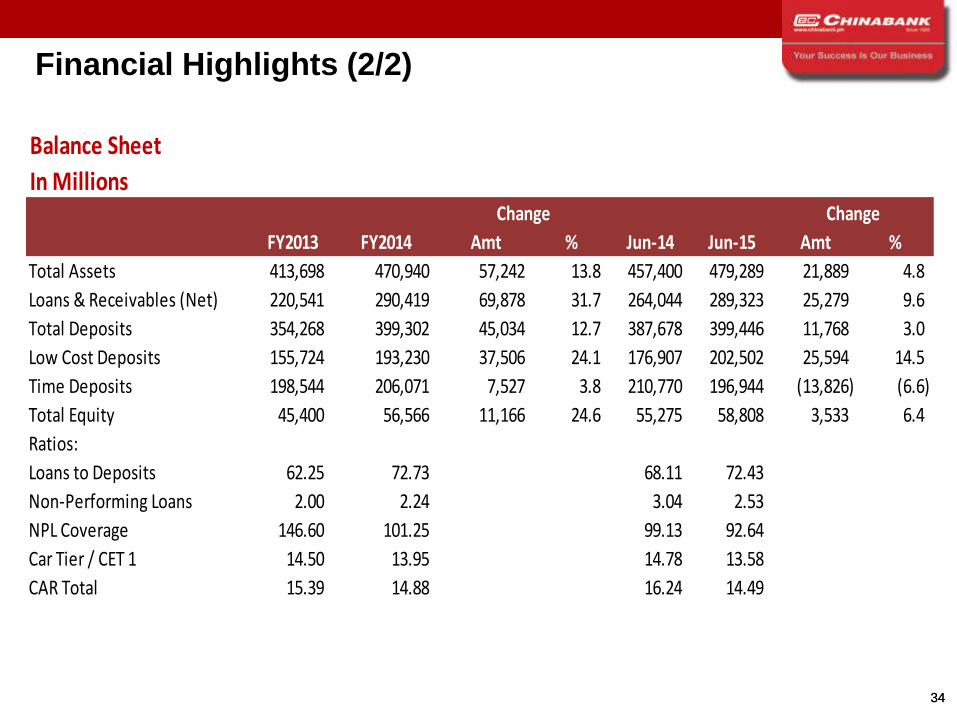
Financial Highlights (2/2)
Balance Sheet
In Millions
FY2013 FY2014 Amt % Jun-14 Jun-15 Amt %
Total Assets 413,698 470,940 57,242 13.8 457,400 479,289 21,889 4.8
Loans & Receivables (Net) 220,541 290,419 69,878 31.7 264,044 289,323 25,279 9.6
Total Deposits 354,268 399,302 45,034 12.7 387,678 399,446 11,768 3.0
Low Cost Deposits 155,724 193,230 37,506 24.1 176,907 202,502 25,594 14.5
Time Deposits 198,544 206,071 7,527 3.8 210,770 196,944 (13,826) (6.6)
Total Equity 45,400 56,566 11,166 24.6 55,275 58,808 3,533 6.4
Ratios:
Loans to Deposits 62.25 72.73 68.11 72.43
Non-Performing Loans 2.00 2.24 3.04 2.53
NPL Coverage 146.60 101.25 99.13 92.64
Car Tier / CET 1 14.50 13.95 14.78 13.58
CAR Total 15.39 14.88 16.24 14.49
Change Change
35 35
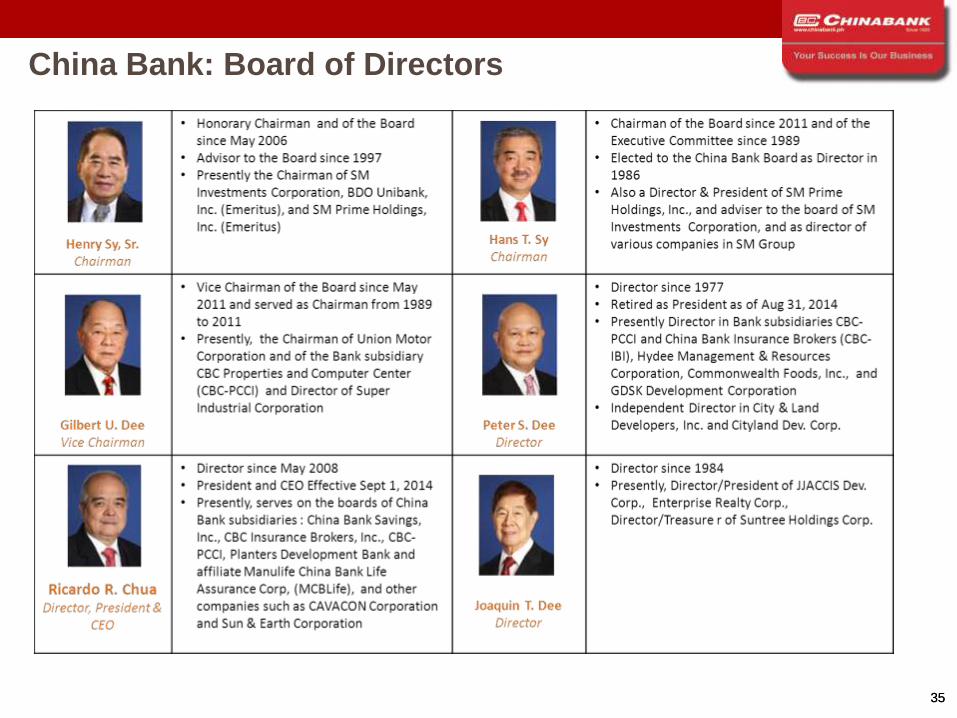
China Bank: Board of Directors

36 36
China Bank: Board of Directors

37 37
China Bank: Management

38 38
China Bank: Management

39 39
Q&A