investor presentation november 2020 1 the landing, lake tahoe
TRANSCRIPT

1The Landing, Lake Tahoe Investor Presentation | November 2020

2
Forward Looking Statements Certain statements made during this presentation are forward-looking statements that are subject to risks and uncertainties. Forward-looking statements generally include the words “believe,” “expect,” “anticipate,” “plan,” “estimate,” “project,” “will,”“intend” or other similar expressions. Forward-looking statements include, without limitation, statements regarding, industry outlook, results of operations, cash flows, business strategies, growth and value opportunities, capital and other expenditures, financing plans, expense reduction initiatives and projected dispositions.
Factors that could cause actual results to materially differ from those contained in the forward-looking statements include, without limitation, national and local economic and business conditions, including the impact of COVID-19 on occupancy rates at the Company’s hotels and the demand for hotel products and services, and those risks and uncertainties discussed in the most recent Annual Report on Form 10-K, quarterly reports on Form 10-Q and current reports on Form 8-K, which DiamondRock Hospitality Company (the “Company”) has filed with the Securities and Exchange Commission, all of which you should carefully review. The forward-looking statements made are based on our beliefs, assumptions and expectations of future performance, taking into account all information currently available to the Company. Actual results could differ materially from the forward-looking statements made in this presentation. The forward-looking statements made in this presentation are subject to the safe harbor of the Private Securities Litigation Reform Act of 1995.
Any forward-looking statement speaks only as of the date on which it is made. Although the Company believes the expectations reflected in such forward-looking statements are based upon reasonable assumptions, it can give no assurance that the expectations will be attained or that any deviation will not be material. All information in this presentation is as of the date of this presentation, and the Company undertakes no obligation to update any forward-looking statement to conform the statement to actual results or changes in the Company's expectations.
This presentation contains statistics and other data that has been obtained or compiled from information made available by third-party service providers and believed to be reliable, but the accuracy and completeness of the information is not assured. The Company has not independently verified any such information.

3
Key Takeaways
2345
$435MM of Available Liquidity(1)
Q3 Burn Rate 14% Better Than Q2 Burn Rate
Sweeping Agreement With Marriott International
25 Months of Cash Runway(1)
27 of 30 Hotels Currently Open (88% of Rooms)
(1) As of 9/30/2020

4
Recent Events
August 2020
• Closed on $110MM public offering of 8.25% Series A cumulative redeemable preferred
shares ($25 par value, 4.4 million shares). Net proceeds of $106MM
• Signed agreement with Marriott to:
• Convert five brand-managed hotels into franchises by the end of 2020
• Rebrand Vail Marriott into Luxury Collection hotel in 2021
• Established franchise termination right at The Lexington, Autograph
• Up-brand JW Marriott Cherry Creek to Luxury Collection at our option
September 2020
• Reopened Chicago Marriott (1,200 rooms) and Westin Boston (793 rooms)
October 2020• Total Revenues up 17% over September Results
• Preliminary October Profitability• 19 Hotels GOP Positive vs. 18 Hotels in September• 12 Hotels EBITDA Positive vs. 11 Hotels in September

5
30% Resort
Frenchman's Reef
14% Boston
14% Chicago
11% New York
11% Other CBD
4% San Francisco
4% Other
4% San Diego4%
Washington DC
3% Denver
2019 FINANCIAL SUMMARY(1)
Hotels (Rooms) 31 Hotels (>10K Rooms)
Total Revenue $932.1MM
Room Revenue $656.3MM
Hotel EBITDA Margin 29.6%
Outstanding Debt $1.09B
Net Debt/EBITDA 3.7x
.(1) As of and for the year ended 12/31/2019. Reconciliations provided in appendix(2) As of 9/30/2020(3) Weighted by 2019 Actual EBITDA(4) Other CBD includes Burlington Hilton, Salt Lake City Marriott, and Worthington Renaissance.(5) Based on 2016 actual EBITDA (6) Includes independent hotels, Luxury, Autograph and Renaissance collection properties, and Vail Marriott Resort
HIGH QUALITY BRANDS(3)URBAN AND RESORT HOTELS IN TOP MARKETS(3)
(4)
DiamondRock at a Glance
(5)
55%34%
11%
Lifestyle
TOP TIER PORTFOLIO
$242$225
$209 $206 $204 $196$182
$153$126 $125 $116
PEB HST DRH SHO XHR PK HT RLJ INN CLDT APLE
(6)
2020 YTD ADR(2)
6
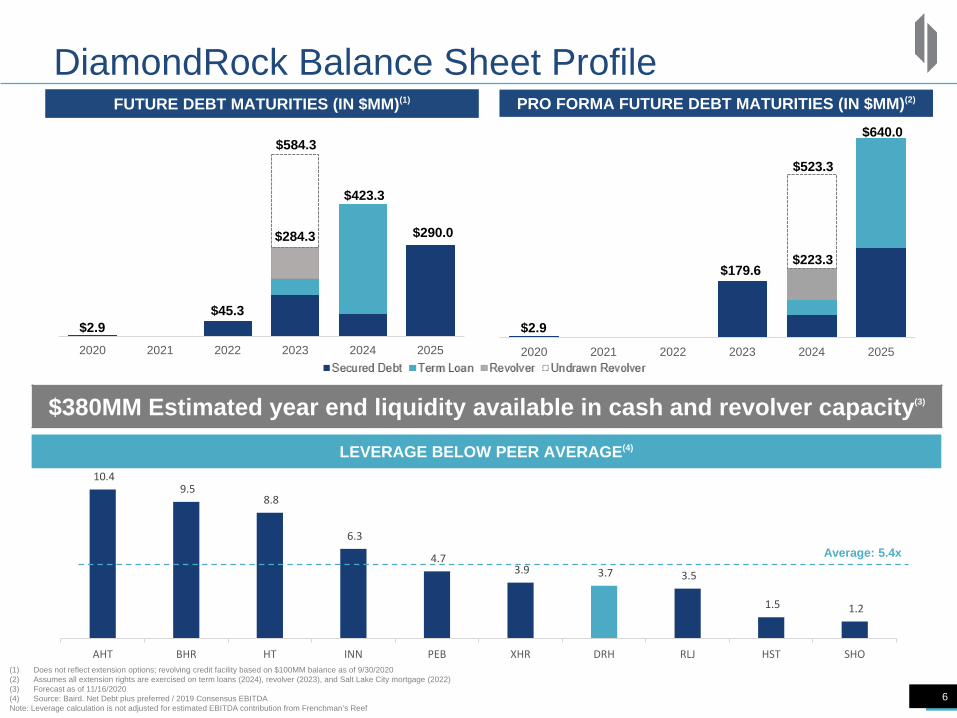
DiamondRock Balance Sheet Profile
6
2020 2021 2022 2023 2024 2025
10.4 9.5
8.8
6.3
4.7 3.9 3.7 3.5
1.5 1.2
AHT BHR HT INN PEB XHR DRH RLJ HST SHO
LEVERAGE BELOW PEER AVERAGE(4)
(1) Does not reflect extension options; revolving credit facility based on $100MM balance as of 9/30/2020(2) Assumes all extension rights are exercised on term loans (2024), revolver (2023), and Salt Lake City mortgage (2022)(3) Forecast as of 11/16/2020(4) Source: Baird. Net Debt plus preferred / 2019 Consensus EBITDANote: Leverage calculation is not adjusted for estimated EBITDA contribution from Frenchman’s Reef
FUTURE DEBT MATURITIES (IN $MM)(1)
Average: 5.4x
$2.9$45.3
$284.3
$423.3
$290.0
$584.3
2020 2021 2022 2023 2024 2025
$380MM Estimated year end liquidity available in cash and revolver capacity(3)
PRO FORMA FUTURE DEBT MATURITIES (IN $MM)(2)
$2.9
$179.6$223.3
$523.3
$640.0
7Renaissance Charleston Historic District
OPERATIONS UPDATE

8
New Franchise/Management Deal with Marriott
Vail Marriott Mountain Resort
On 8/31/20, DRH entered into an agreement with Marriott to alter several
brand and management contracts. Selected terms:
Franchise ConversionsThe following hotels will be converted from brand-managed to franchised properties with agreed to renovation scope and timeline:• Atlanta Marriott Alpharetta• Salt Lake City Marriott Downtown • The Lodge at Sonoma• Charleston Renaissance • Courtyard Manhattan 5th Avenue
Up-Branding• The Vail Marriott Mountain Resort entered into a new
franchise agreement to be branded as a Luxury Collection Hotel subject to renovation completion
• JW Marriott Cherry Creek franchise agreement extended and amended to allow for the conversion to a Luxury Collection Hotel if certain conditions are met
The Lexington HotelThe franchise agreement for The Lexington Hotel has been amended to provide termination right in 2021, subject to certain conditions
Note: Refer to 8-K filed 8/31/20 here for additional terms

9
Encumbered(1)
Short Term Agreements Driving Value
9 Hotels
Note: Based on 2019 EBITDA(1) Agreements terminable at will.
33%
29%Unencumbered
2019 2020
Highest percent of terminable agreements among any full-service lodging REIT peer
Only two long term management agreements in DRH portfolio
10
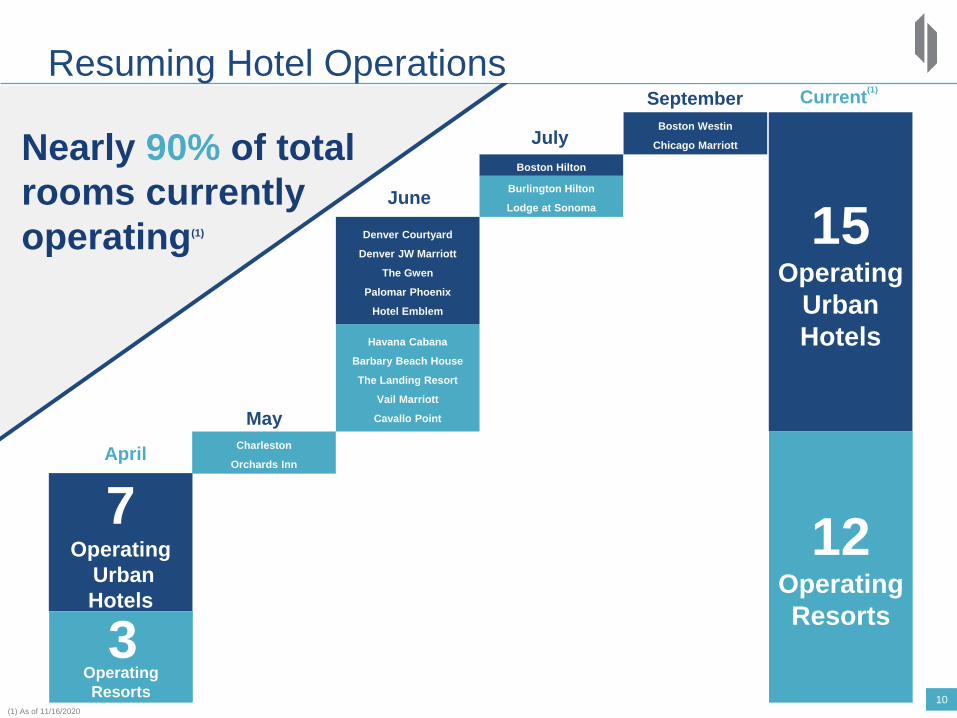
Current(1)
7Operating
Urban Hotels
15Operating
Urban Hotels
April
May
June
JulyNearly 90% of total rooms currently operating(1)
12Operating Resorts
Operating Resorts
3
Charleston
Orchards Inn
Havana Cabana
Barbary Beach House
The Landing Resort
Vail Marriott
Cavallo Point
Denver Courtyard
Denver JW Marriott
The Gwen
Palomar Phoenix
Hotel Emblem
Burlington Hilton
Lodge at Sonoma
Boston Hilton
Boston Westin
Chicago Marriott
SeptemberResuming Hotel Operations
(1) As of 11/16/2020

1111
5 7 10 14 14 18 19
April May June July August September October
Rebuilding Profitability
Number of Hotels with
Positive GOP
Number of Hotels with
Positive EBITDA2 4 6 6 8 10 12
April May June July August September October
(1)
(1)
(1) Preliminary Results

12
Mitigating Cash Burn and Extending RunwayQuarterly Operating Metrics
Q2 2020A Q3 2020A Improvement
Occupancy 8.5% 18.6% +119% Better
Average Daily Rate $175.75 $201.81 +15% Better
RevPAR $14.99 $37.55 +151% Better
Total Revenue $20.4MM $50.1MM +146% Better
Monthly Burn Rate ($MMs)
Q2 2020A Q3 2020A Improvement Q4 2020E(1)
Hotel Net Operating Loss 10.7 8.4 +21% Better
Corporate G&A Expenses 1.8 1.4
Corporate Burn Rate 12.4 9.8 +21% Better 8.0 - 8.5
Debt Service 5.1 4.1 4.7
Preferred Dividends(2)
- 0.8 0.8
Capital Expenditures(3) 3.0 3.0 3.0
Total Monthly Cash Burn 20.6 17.7 +14% Better 16.5 – 17.0
Total Liquidity $364MM $435MM +20% Better ~$380MM
Expected Runway 18 Months 25 Months +39% Better 22 - 23 Months
(1) Internal forecast as of 11/16/2020(2) Preferred dividends are shown on a proforma basis for Q3 2020(3) Assumes capital expenditure of $36MM per year or $3MM per month

13
$1,252 $1,309
$1,803 $1,867 $2,007
DRH XHR PEB PK SHO
(12.4)(11.5) (10.9)
(10.0)
(17.5)(16.5)
(15.5)(14.4)
Jun-20 Jul-20 Aug-20 Sep-20 Dec-20E
Hotel NOI +Corporate G&A Cash Burn Before CapEx
Cash Burn Steadily ImprovingDRH Rolling Three Month Burn Rate(1)
Average Monthly AFFO Burn Rate Per Key(2)
(3)
(1) In thousands(2) Second and third quarter AFFO per key per month. (3) Third Quarter Adjusted AFFO excludes noncash income tax valuation allowance recognized in the quarter of $12.4 million
(8.0) - (8.5)
(13.5) - (14.0)

14
0%
10%
20%
30%
40%
50%
60%
70%
80%
90%
Mar Apr May Jun Jul Aug Sep Oct
2020 Total Portfolio 2020 Open Portfolio 2020 Open Resorts
Hotel Occupancy Gradually RebuildingTrailing 7 Day Average Portfolio Occupancy
43.2%
24.4%21.4%

15
Group Cancellations SlowingFour Weeks Ending

16Hotel Emblem
GROWTH OPPORTUNITIES

17
Select Service
Positioned To Capitalize Upon Distress On The Horizon
Percent of Loans By Original Loan-to-Value
65-70% >70%
Full Service 17% 13%
Resorts 54% 15%
$98 Billion in 8,500+
CMBS Hotel Loans
11
11Full Serviceand Resorts
2020-2023 Maturities:$24 Billion
(over 2,000 loans)
Source: Trepp and Wells Fargo Securities, LLC
18
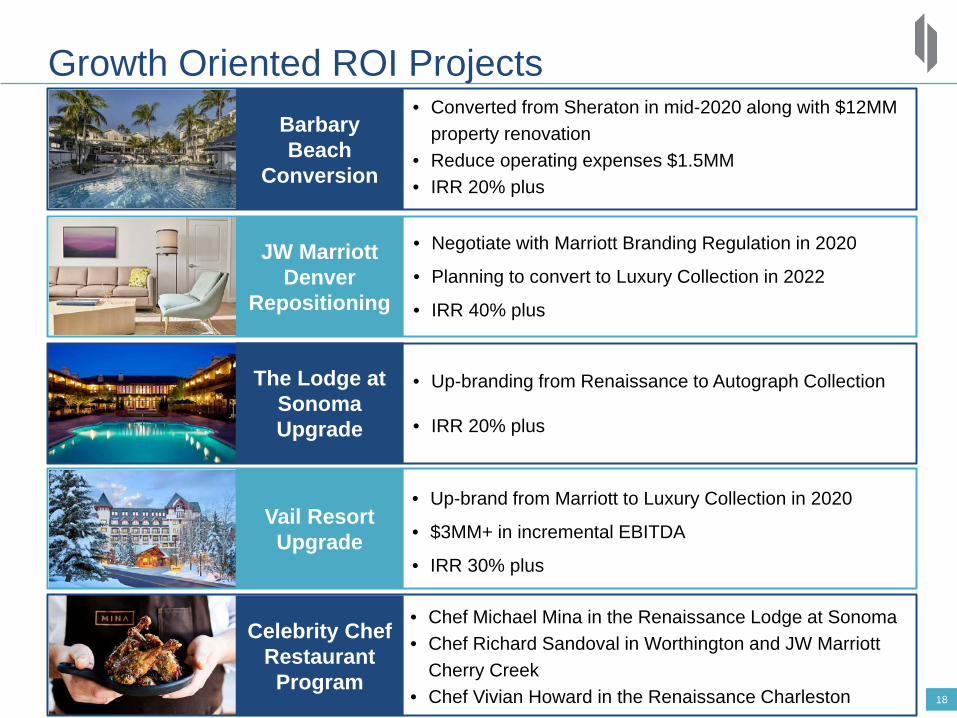
Growth Oriented ROI ProjectsBarbary Beach
Conversion
Celebrity Chef Restaurant Program
The Lodge at Sonoma Upgrade
JW Marriott Denver
Repositioning
Vail Resort Upgrade
• Chef Michael Mina in the Renaissance Lodge at Sonoma• Chef Richard Sandoval in Worthington and JW Marriott
Cherry Creek• Chef Vivian Howard in the Renaissance Charleston
• Converted from Sheraton in mid-2020 along with $12MM property renovation
• Reduce operating expenses $1.5MM• IRR 20% plus
• Negotiate with Marriott Branding Regulation in 2020
• Planning to convert to Luxury Collection in 2022
• IRR 40% plus
• Up-branding from Renaissance to Autograph Collection
• IRR 20% plus
• Up-brand from Marriott to Luxury Collection in 2020
• $3MM+ in incremental EBITDA
• IRR 30% plus

19
ROI Projects Drive Shareholder ValueUPCOMING ROI PROJECTS
SHADOW PIPELINE
DRH has identified ~$25-$30MM of additional potential ROI projects
(1) Estimated Capital Spend and Estimated Incremental EBITDA based upon management proformas(2) Estimated Incremental Value is calculated by applying a 10.0x multiple to Estimated Incremental EBITDA(3) Estimated IRR is calculated assuming a 3-year stabilization period and a 10.0x terminal multiple
Property Project EstimatedCapital Spend(1)
EstimatedIncremental
EBITDA(1)
EstimatedIncremental
Value(2)
Estimated IRR(3)
Boston Hilton Downtown 29 Additional Guestrooms $6.0 $1.0 $10.0 33%
Hilton Burlington F&B Renovation $1.5 $0.4 $4.0 59%
Chicago Gwen Rooftop Event Space $1.0 $0.2 $2.0 42%
Barbary Beach House Key West Beach Restaurant and Event Space $1.6 $0.6 $6.0 82%
The Landing Resort & Spa Additional 17 Keys and Resort Enhancements $7.8 $1.2 $12.0 29%
Sedona - Orchards Inn Reposition as Cliffs at L'Auberge $21.4 $2.6 $26.0 18%
Total $39.3 $6.0 $60.0 29%
Property Project Timing
Courtyard Midtown East Property Repositioning and Rooftop Bar 2022
Palomar Phoenix Lustre Rooftop Bar Re-concept 2022
Cavallo Point Convert unused Jail Building to F&B Outlet 2022
Sedona - L'Auberge Laundry Facility and Spa Upgrade 2022
Sedona - Orchards Inn 89Agave Additions 2022

20
CORPORATE CITIZENSHIP
Cavallo Point, the Lodge at Golden Gate Bridge

21
Responsible Corporate Citizen
GRESB Annual Results ISS ESG Rankings(2) ISS-ESG Corporate
Ranking
Environmental
Social
Governance
2016 2017 2018 2019
DRH GRESB Score 50 53 75 81
Peer Score Average(1) 51 57 58 69
Index to Peer Score Average 98% 93% 129% 117%
CurrentlyRanked
#2of 174 US Real Estate Companies
DiamondRock ranks in the top 5% of the Worldwide Real Estate Sector, earning an ISS
ESG Prime designation
(1) Lodging Peer Average is based on 17 Lodging Companies including 10 REITs(2) ISS will not provide Quality Ranking of peer set to DRH without enrolling in their advisory services, however score is relative to peer set


APPENDIX
Havana Cabana Key West

24
Research Demonstrates Small Resorts Outperform
• According to CBRE/PKF research study, small resorts(1) have:
• Less downside risk due to larger stream of reliable non-rooms revenue
• Preserved the most ADR through the recession of the early 2000s
• Achieved superior levels of ADR growth since 2009 to all other market classes
REVPAR CAGR FROM 1987 - 2017
Total US: 3.1%
Source: CBRE Hotels Research. (1) Collection of non-golf resorts with less than 200 rooms
4.2%
3.1%
4.0%
3.3%
3.8%
0.0%
0.5%
1.0%
1.5%
2.0%
2.5%
3.0%
3.5%
4.0%
4.5%
1Small Resorts Upper Upscale Luxury All Resorts All Urban Hotels

25
DRH Lifestyle & Independent Strategy
RATIONALE FOR TARGETING LIFESTYLE HOTELS, INDEPENDENTS, & SOFT BRANDS
Target allocation will be achieved through acquisitions of
lifestyle hotels, independents and soft brands and
dispositions of traditional boxes
Lifestyle, Independent,
and Soft Brands 33%
Traditional Brands
66%
Lifestyle, Independents,
and Soft Brands 22%
Traditional Brands
78%
(1) Independent, lifestyle and soft brand hotels include the Havana Cabana, Cavallo Point, Hotel Emblem, L’Auberge de Sedona, Orchards Inn, The Landing, Palomar Phoenix, Shorebreak Hotel, the Lexington and The Gwen. Soft brands, including Autograph and Luxury Collection, are included as lifestyle / boutique. Based on 2019A EBITDA for all properties except Frenchman’s Reef and Havana Cabana where 2016A used due to closure. Pro forma for full year for acquisitions.
CURRENT ALLOCATION(1)
TARGET ALLOCATION
Balances DRH’s
existing portfolio
Greater opportunity
for smaller deals
Reduces reliance
on traditional brands
Cultural shift toward
experiential travel
26
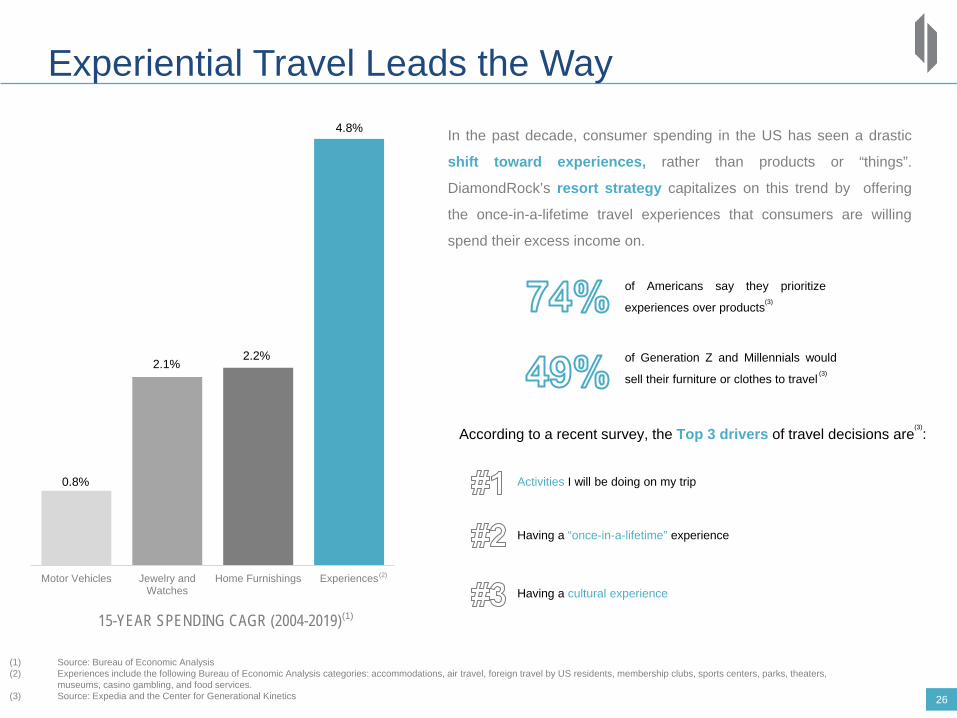
Experiential Travel Leads the Way
Motor Vehicles Jewelry andWatches
Home Furnishings Experiences
15-YEAR SPENDING CAGR (2004-2019)
0.8%
2.1%2.2%
4.8% In the past decade, consumer spending in the US has seen a drastic
shift toward experiences, rather than products or “things”.
DiamondRock’s resort strategy capitalizes on this trend by offering
the once-in-a-lifetime travel experiences that consumers are willing
spend their excess income on.
(1) Source: Bureau of Economic Analysis(2) Experiences include the following Bureau of Economic Analysis categories: accommodations, air travel, foreign travel by US residents, membership clubs, sports centers, parks, theaters,
museums, casino gambling, and food services. (3) Source: Expedia and the Center for Generational Kinetics
of Americans say they prioritize
experiences over products
of Generation Z and Millennials would
sell their furniture or clothes to travel
According to a recent survey, the Top 3 drivers of travel decisions are :
Activities I will be doing on my trip
Having a “once-in-a-lifetime” experience
Having a cultural experience
(1)
(2)
(3)
(3)
(3)
27
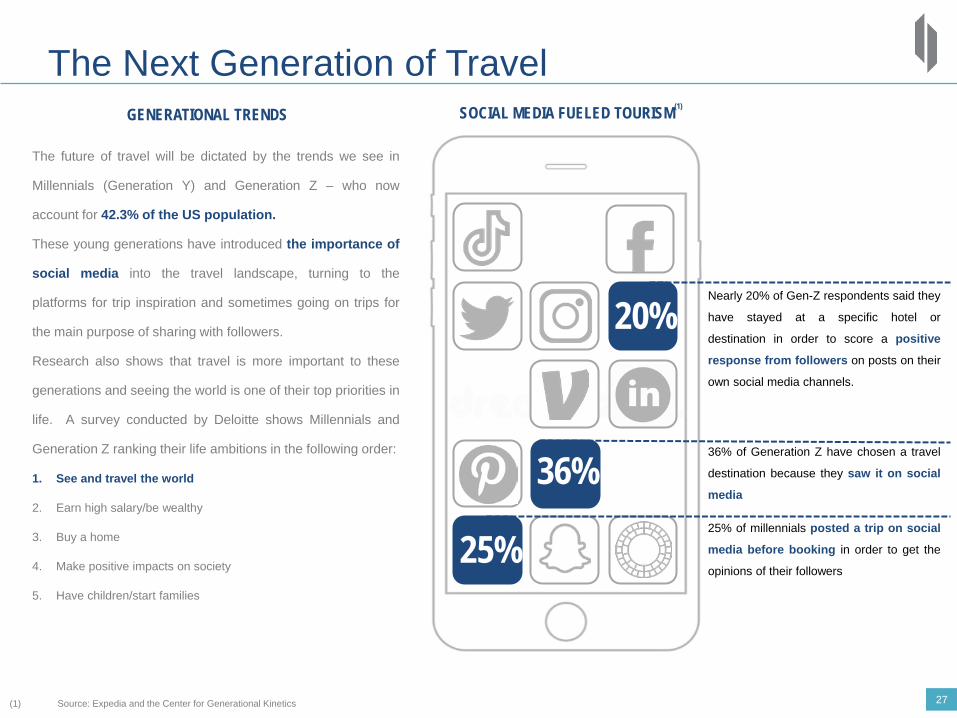
The Next Generation of Travel
20%Nearly 20% of Gen-Z respondents said they
have stayed at a specific hotel or
destination in order to score a positive
response from followers on posts on their
own social media channels.
25%25% of millennials posted a trip on social
media before booking in order to get the
opinions of their followers
SOCIAL MEDIA FUELED TOURISM(1)
(1) Source: Expedia and the Center for Generational Kinetics
36%36% of Generation Z have chosen a travel
destination because they saw it on social
media
The future of travel will be dictated by the trends we see in
Millennials (Generation Y) and Generation Z – who now
account for 42.3% of the US population.
These young generations have introduced the importance of
social media into the travel landscape, turning to the
platforms for trip inspiration and sometimes going on trips for
the main purpose of sharing with followers.
Research also shows that travel is more important to these
generations and seeing the world is one of their top priorities in
life. A survey conducted by Deloitte shows Millennials and
Generation Z ranking their life ambitions in the following order:
1. See and travel the world
2. Earn high salary/be wealthy
3. Buy a home
4. Make positive impacts on society
5. Have children/start families
GENERATIONAL TRENDS

28
Resort Thesis Already Proven SuccessfulEBITDA Multiple @ EBITDA Increase
Investment ($MM) Purchase YE 2019 $MM
Burlington Hilton $64 16.5x 8.9x $3.9
Charleston Renaissance $43 11.9x 7.0x $2.9
Fort Lauderdale Westin $167 14.8x 10.7x $5.5
Havana Cabana $54 12.2x 15.8x ($0.5)
The Landing Resort & Spa $44 17.8x 25.9x ($0.7)
Sedona - L'Auberge $67 15.8x 8.6x $3.6
Sedona - Orchards Inn $31 13.7x 14.2x ($0.1)
Shorebreak $63 14.6x 11.5x $1.5
Sonoma Renaissance $40 10.7x 5.7x $4.0
Vail Marriott Mountain Resort $96 13.4x 8.7x $6.2
Total Resort $668 14.2x 9.9x $26.3
Note: Figures exclude Frenchman’s Reef, Cavallo Point and Barbary Beach House as these assets are either repositioned or currently under construction.
29
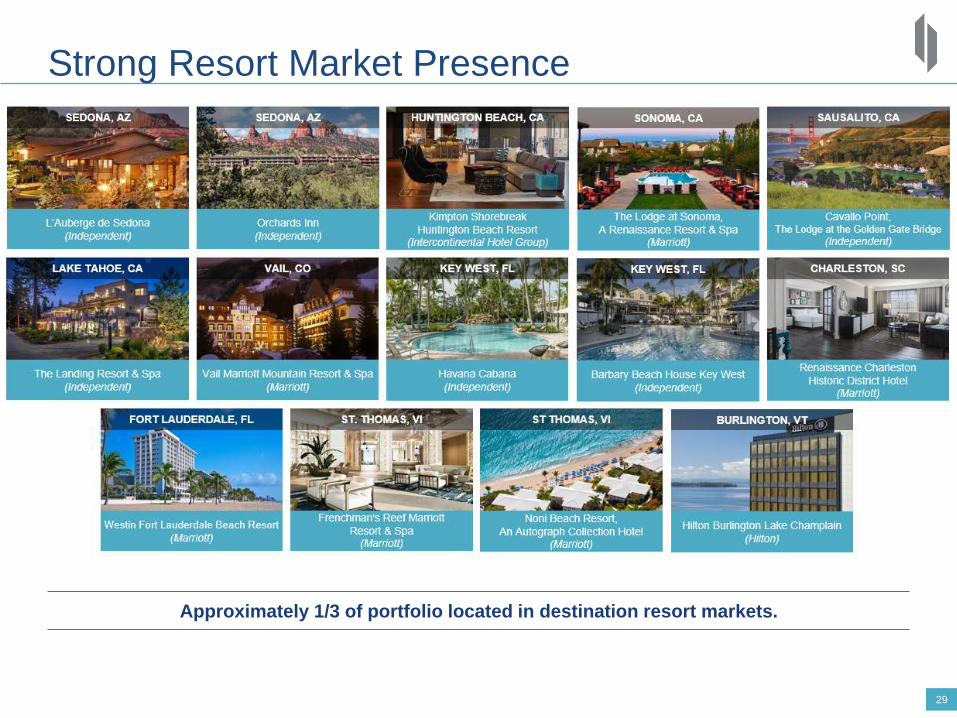
Strong Resort Market Presence
Approximately 1/3 of portfolio located in destination resort markets.

30Approximately 2/3 of portfolio located in top, gateway markets.
High Quality Portfolio in Key Gateway Markets

31
Non GAAP MeasuresThe Company considers the following non-GAAP financial measures to be useful to investors as key supplemental measures of operating performance: EBITDA, EBITDAre, Adjusted EBITDA, Hotel EBITDA and Hotel Adjusted EBITDA. These measures should not be considered in isolation or as a substitute for measures of performance in accordance with U.S. GAAP. EBITDA, EBITDAre, Adjusted EBITDA, Hotel EBITDA and Hotel Adjusted EBITDA, as calculated by us, may not be comparable to other companies that do not define such terms exactly as the Company.
EBITDA represents net income (calculated in accordance with U.S. GAAP) excluding: (1) interest expense; (2) provision for income taxes, including income taxes applicable to sale of assets; and (3) depreciation and amortization. The Company computes EBITDAre in accordance with the National Association of Real Estate Investment Trusts ("Nareit") guidelines. Nareit defines EBITDAre as EBITDA plus or minus losses or gains on the disposition of depreciated property, including gains/losses on change of control, impairment write-downs of depreciated property and of investments in unconsolidated affiliates caused by a decrease in value of depreciated property in the affiliate, and adjustments to reflect the entity's share of EBITDAre of unconsolidated affiliates.
Hotel EBITDA represents net income excluding: (1) interest expense, (2) income taxes, (3) depreciation and amortization, (4) corporate general and administrative expenses and (5) hotel acquisition costs. We believe that Hotel EBITDA provides our investors a useful financial measure to evaluate our hotel operating performance, excluding the impact of our capital structure (primarily interest), our asset base (primarily depreciation and amortization), and our corporate-level expenses (corporate expenses and hotel acquisition costs). We believe that excluding the effect of corporate-level expenses provides a more complete understanding of the operating results over which individual hotels and third-party management companies have direct control. We believe property-level results provide investors with supplemental information on the ongoing operational performance of our hotels and effectiveness of the third-party management companies operating our business on a property-level basis.
We adjust EBITDAre and Hotel EBITDA when evaluating our performance because we believe that the exclusion of certain additional items described below provides useful supplemental information to investors regarding our ongoing operating performance and that the presentation of Adjusted EBITDA and Hotel Adjusted EBITDA when combined with U.S. GAAP net income, EBITDAre, and Hotel EBITDA, is beneficial to an investor's complete understanding of our consolidated and property-level operating performance. Hotel Adjusted EBITDA margins are calculated as Hotel Adjusted EBITDA divided by total hotel revenues. We adjust EBITDAre and Hotel EBITDA for non-cash lease expense and other amortization, cumulative effects of a change in accounting principle, gains or losses from early extinguishment of debt, hotel acquisition costs, severance costs, hotel manager transition items and certain other items that we consider outside the ordinary course of business and that we do not believe reflect the ongoing performance of the Company or our hotels. Such items may include, but are not limited to, the following: pre-opening costs incurred with newly developed hotels; lease preparation costs incurred to prepare vacant space for marketing; management or franchise contract termination fees; gains or losses from legal settlements; costs incurred related to natural disasters; and gains on property insurance claim settlements, other than income related to business interruption insurance.
Reconciliations of net income (loss) to EBITDA, EBITDAre, Adjusted EBITDA and Hotel EBITDA can be found in the Company’s earnings press releases.

32
Pro Forma Net Debt / 2019 EBITDA Reconciliation
Note: $ in thousands. (1) Assumed in connection with the acquisition of the Hotel Palomar Phoenix on March 1, 2018.
As of December 31, 2019Actual
Principal BalanceSalt Lake City Marriott Downtown mortgage loan $53,273Westin Washington D.C. City Center mortgage loan 60,550The Lodge at Sonoma, a Renaissance Resort & Spa mortgage loan 26,963Westin San Diego mortgage loan 61,851Courtyard Manhattan / Midtown East mortgage loan 81,107Renaissance Worthington mortgage loan 80,904JW Marriott Denver at Cherry Creek mortgage loan 61,253Boston Westin mortgage loan 190,725New Market Tax Credit loan (1) 2,943
Unamortized debt issuance costs (3,240)Total mortgage and other debt, net of unamortized debt issuance costs 616,329
Unsecured term loan 50,000Unsecured term loan 350,000
Unamortized debt issuance costs (1,230)Unsecured term loans, net of unamortized debt issuance costs 398,770
Senior unsecured credit facility 75,000
Total debt, net of unamortized debt issuance costs $1,090,099
Cash and cash equivalents 122,524
Net debt 967,575Adjusted EBITDA 260,409Net Debt / Adjusted EBITDA 3.7x

33
EBITDA and Hotel Adjusted EBITDA Reconciliation
Note: $ in thousands. (1) Represents legal and professional fees and other costs incurred at Frenchman's Reef as a result of Hurricane Irma that are not covered by insurance.(2) Represents payments made to unionized employees under a voluntary buyout program at the Lexington Hotel New York, which are classified within other hotel expenses on the consolidated statement of operations.(3) Consists of (a) manager transition costs of $0.8 million related to the L'Auberge de Sedona, Orchards Inn Sedona and The Landing Resort and Spa, (b) pre-opening costs of $0.5 million related to the reopening of the Hotel Emblem, (c) pre-
opening costs of $2.7 million related to the reopening of Frenchman's Reef, and (d) $2.5 million related to the pending termination of the franchise agreement for Sheraton Suites Key West.(4) Amounts represent the operating results of Frenchman's Reef for all periods presented, Havana Cabana Key West for January 1 to March 31, 2019 and the comparable period of 2018 and Hotel Emblem from September 1, 2019 to
December 31, 2019 and the comparable period of 2018.
Year Ended December 31,2019
Net income $184,211Interest expense 46,584Income tax expense 22,028Real estate related depreciation and amortization 118,110
EBITDA $370,933Corporate expenses 28,231Interest and other income, net (1,197)Loss on early extinguishment of debt 2,373
Professional fees related to Frenchman's Reef (1) 17,822
Severance costs (2) –Gain on property insurance settlement (144,192)
Hotel EBITDA $273,970Non-cash lease expense and other amortization 7,013
Hotel manager transition and pre-opening items (3) 6,460Hotel Adjusted EBITDA $287,443
Hotel Adjusted EBITDA from closed hotels (4) ($11,161)Comparable Hotel Adjusted EBITDA $276,282Revenues 938,091
Hotel revenues from closed hotels (4) ($6,013)Comparable Revenues $932,078Comparable Hotel Adjusted EBITDA Margin 29.6%

34
2019 Adjusted EBITDA ReconciliationYear Ended December 31,
2019
Net (loss) income 184,211
Interest expense 46,584
Income tax (benefit) expense 22,028
Real estate related depreciation and amortization 118,110
EBITDA/EBITDAre 370,933
Non-cash lease expense and other amortization 7,013
Professional fees and pre-opening costs related to Frenchman's Reef (1) 17,822
Hotel manager transition costs and pre-opening items (2) 6,460
Gain on property insurance settlement (144,192)
Loss on early extinguishment of debt 2,373
Adjusted EBITDA $260,409
Note: $ in thousands. (1) Represents legal and professional fees and other costs incurred at Frenchman's Reef as a result of Hurricane Irma that are not covered by insurance.(2) Consists of (a) manager transition costs of $0.8 million related to the L'Auberge de Sedona, Orchards Inn Sedona and The Landing Resort and Spa, (b) pre-opening costs of $0.5 million related to the reopening of the Hotel Emblem,
(c) pre-opening costs of $2.7 million related to the reopening of Frenchman's Reef, and (d) $2.5 million related to the pending termination of the franchise agreement for Sheraton Suites Key West.