investor presentation - july 2006...
TRANSCRIPT

Investor Presentation
July 2006

Mariner Overview – Balance, Efficient Growth, Opportunity
Pro-forma Proved Reserves (Bcfe) as of 12/31/05:
Pro-forma proved reserves 68% gas; 56% developed
Pro-forma reserves to production ratio of 6.8
3-year reserve replacement: 280%
3-year rolling reserve replacement cost: $1.70/Mcfe
3-year average production expense of $0.92/Mcfe
~1,000,000+ net acres (pro-forma);
~ 450,000+ net undeveloped acres (pro-forma)
100+ prospects in inventory (pro-forma)
Access to 7,000+ blocks of recent vintage 3-D seismic data
NYSE Listed – Symbol: ME
SEC PV-10 Bcfe ($MM)
Proved 644 $3,052Probables 337 $1,712
Shelf49%
West Texas32%
Deepwater19%
Pro-formaProved Reserves
Shelf48%
West Texas17%Deepwater
35%
Pro-formaProbable Reserves

Combined Asset Base
Pro-formaProved Reserves
West Texas32%
Shelf49%
Deepwater19%

Moderate risk exploration in GOM— > 7,000 blocks recent vintage 3-D seismic— Experienced exploration team with proven track record— ~1,000,000+ net acres / 450,000+ net undeveloped acres— Shelf, deep shelf, deepwater opportunities
Utilize SSTB expertise to enhance value
Steady, methodical infill drilling opportunities, primarily Spraberry
> 30,000 net acres, 600+ potential locations
Pursue opportunistic acquisitions (not compelled to acquire)
Create operating efficiencies
Focus on rate of return
Strategy – Growth Through the Drillbit with Moderate Risk Profile
Gulf of Mexico
Corporate
West Texas

West Texas15%
Gulf of Mexico
85%
2%
57%41%
2006 Capital Expenditures
By Region By Category
2006 Drilling Budget includes 30-40 wells in the Gulf of Mexico— ~50% on conventional shelf wells, ~25% on deepwater and ~25% deep shelf
Onshore we expect to drill in excess of 100 wells
ExplorationExploitation &Development
Other
Total 2006 CAPEX = $464 Million*
* Excludes $33 million of hurricane repairs expected to be reimbursed from insurance proceeds

Hedged69.3%
Unhedged30.7%
2005 2006
• 15.16 Bcfe @ $5.67 – $6.59 /Mmbtu• 836 MBbls @ $29.01 – $31.53 / Bbl
• 26.15 Bcfe @ $6.43 – $6.98 / Mmbtu• 1,133 MBbls @ $62.88 – $64.50 / Bbl
Risk Management
Hedged38-42%
Unhedged58-62%

Offshore

Exploration Track Record

2006 Gulf of Mexico Drilling Program

2006 Gulf of Mexico Rig Commitments
Noble – Lorris Bouzigard
Pride Missouri
Diamond – Ocean America
Current contract thru March 2007 for $230M/dayRig contract renewed April 2006 for April 2007 thru March 2008 New contract extension rate – variable, averaging $400M/day for 12 monthsMariner retaining 7 of 12 monthsWorks in water depths to 5,000 feet
Current rate – $140M/dayNew contract extension rate –$172.5M/day in May 2006 for 15 monthsMariner retaining 10 of 15 monthsOption to extend exercisable until December 2006Rig will be upgraded in mid-2006 to work in 4,000 feet of water (currently capable of 2,350 feet)
250’ mat cantilever jack-upUnder contract thru February 2007 for $90M/dayContract price adjusts quarterly
Deepwater
Shelf

Gulf of Mexico – Total Net Acreage(1)
0
200
400
600
800
1,000
1,200
1,400
CPE EPL SGY REM NFX ME APC APA WTI
Acr
eage
(in
000s
)
Shelf Deepwater
132
434
300
1,149
842
948894
500
51%
95%
20%
18%
20%21%
1,118
6%4%
1%
___________________________1. Acreage data as of 4/1/06 per Energy Graphics2. Pro-forma Forest Oil GOM acquisition3. Pro-forma Kerr-McGee GOM acquisition
(2) (3)

Gulf of Mexico Lease Expirations 2006-09
2006-07 Expirations: 2,411
2008-09 Expirations: 1,473

Offshore – Shelf

Three dedicated development teams, with one engineer and two geo-scientists per team. Expect to have a fourth team by year-end.
Completed transfer of Forest seismic data as of July 1, 2006. Also acquired new data which is under review by the explorationists and yielding new ideas.
To date, 45 well exploitation/exploration opportunities identified in 17 different blocks. Three are currently drilling.
Continue to optimize offshore logistics operations.— Reduce number of transportation loops, e.g. helicopters and boats.— Convert platforms to unmanned status where appropriate.— Contract of operational services.
Thus far, exposed to three preferential purchase rights, two of which have closed and one of which is being negotiated.
Completed two PHAs as platform operator and are currently negotiating a third.
FST Gulf of Mexico Update

FST GOM Asset Base – Current Growth Opportunities
Eugene Island Area• 3-5 exploitation opportunities• Operator: Mariner
South Marsh Area• 7 exploitation opportunities• Operator: Mariner
West Cameron Area• 8 exploitation opportunities• Operator: Mariner
South Marsh 66Hurricane repair status• 4 MMcfe/d expected on Oct 06• Operator: Mariner
South Pass 24Hurricane repair status• 12 MMcfe/d on as of Jun 06• 6 MMcfe/d additional expected on Sept 06• 9 exploitation opportunities• Operator: Mariner
Grand Isle 76Hurricane repair status• 4 MMcfe/d expected on Aug 06• Operator: Mariner

ME + FST GOM Production Pre-Katrina/Rita to Present
0
50
100
150
200
250
300
350
25-A
ug-05
31-A
ug-05
30-S
ep-05
31-O
ct-05
30-N
ov-05
31-D
ec-05
31-Ja
n-06
28-Feb
-06
31-M
ar-06
30-A
pr-06
31-M
ay-06
30-Ju
n-06
Date
MM
cfe/
d
Forest GOM Forest Hurricane Shut-In
Mariner Mariner Hurricane Shut-In
Forest Transaction closed 3/2/06
~23Mmcfe/d
~20Mmcfe/d
Katrina8/29/05
Rita9/24/05

Offshore – Deepwater

Mariner Asset Base Map with D/W Salt Outline

Major Deepwater Fields (Conventional Amplitude)

Major Deepwater Fields/Discoveries (Sub Salt)

Major Deepwater Fields/Discoveries (Ultra DW – Foldbelt )

Deepwater Operations Expertise

Swordfish (VK 917, 961, 962)
SWORDFISH PROJECT DEVELOPMENT2 Oil Wells, 1 Gas Well
13.25-Mile Subsea Tieback to Spar
NEPTUNE SPAR
1930’ WD
INFIELDUMBILICAL
UMBILICAL
VK 961 #14617’ WD
VK 962 #14617’ WD
VK 917 #14310’ WD
6” PIPE-IN-PIPEOIL FLOWLINE
6” GAS FLOWLINE SUBSEAFLOWMETER

NW Nansen (EB 558/602)
•WI OwnershipEB 602: Kerr McGee 67% (Operator)
Mariner 33%
EB 558: Kerr McGee 50% (Operator)Mariner 50%
•Water Depth 3,500’
•Development Four well oil & gas subsea tieback to Kerr McGee Nansen spar (EB 602)
•Current Status•3 Successful wells drilledto date in EB 602
•EB 558#2 currently drilling•Well completions and subsea equipment planned for 2007
•Estimated first production by 1Q’08
NW Nansen

NW Nansen (EB 602) Map and Well Log

Bass Lite (AT 426)
•WI Ownership Mariner 42.19% (Operator)
•Water Depth 6,650’
•Development Planned gas subsea tieback 56miles to Williams’ Devils Tower Spar (MC 773)
•Current Status•Initial Discovery – Jan 2001•Drill appraisal well 2007•Project sanctioned Jan 2006•Estimated first production
•2008•Est. 100+ MMcfe/d (gross)
Bass Lite

Bass Lite – Structure Map and Well Log
Gross Pay Interval500 Feet (238’ Net)

Bass Lite Regional Setting53 M
iles
50 Mile
s
Atwater Valley Hub MC 920
Bass Lite Project
2 Subsea Gas Wells
Tie Back (56 Miles)
to Devils Tower

King Kong (GC 472/473)
King Kong
•WI Ownership ENI 52% (Operator)Mariner 48%
•Water Depth 3,850’
•Development Three well gas subsea ENI Allegheny TLP (GC 254)
•Current Status•GC 472#3 drilling
•Est. online 3Q06•GC 473#2ST1 successful
•Online 2Q06 32 MMcf/D•

King Kong / Yosemite – Exploration / Exploitation Opportunities
Booked Probable Behind Pipe GC 516
Yosemite II: GC 516#2: Planned Exploration Well
Booked Probable Side Track location GC 473
King Kong IIGC 472#3: Planned Exploration Well
Booked Probable Side Track location GC 473
King Kong IIGC 472#3: Planned Exploration Well

Rigel (MC 208, 252, 296)
•WI Ownership Dominion 52.5% (Operator)Mariner 22.5%
•Water Depth 5,200’
•Development One well gas subsea tieback 12 miles to ChevTex GeminiManifold (MC 292)
•Current Status•Online 1Q’06
•80 MMcf/D (Gross)
Rigel
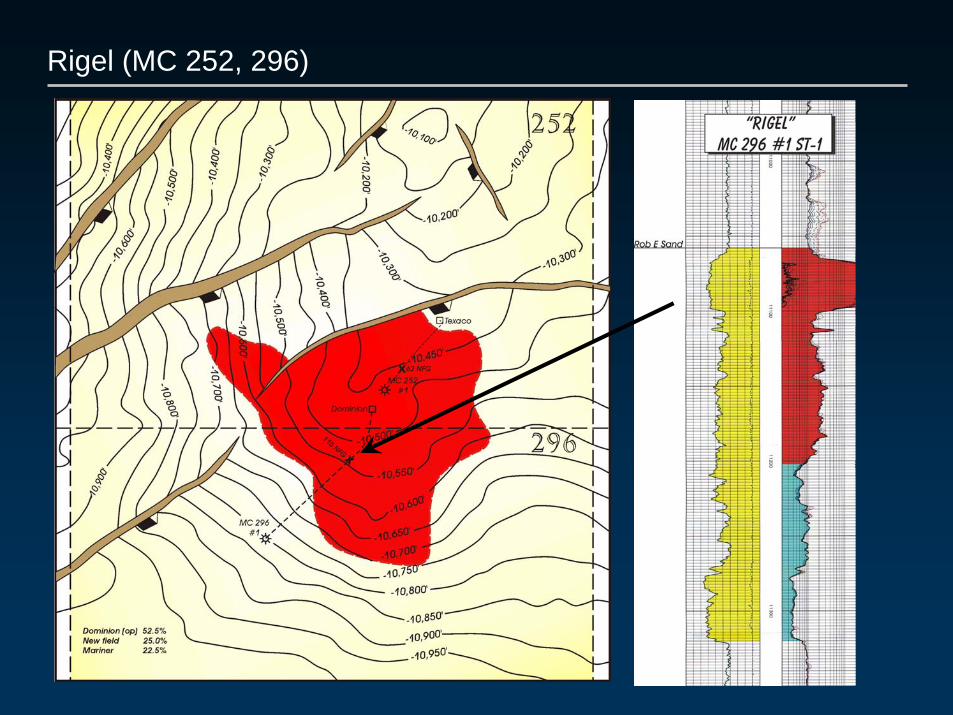
Rigel (MC 252, 296)

Pluto II (MC 674, 718)
•WI Ownership Mariner 51% (Operator)
•Water Depth 2,900’
•Development One well gas subsea tieback 31miles to Marathon SP89”B” platform
•Current Status•Under re-development•Well drilled and completed•Repair production facilities•Estimated first production:
•3Q’06•50 MMcf/D & 250 BCPD (Gross)
Pluto II
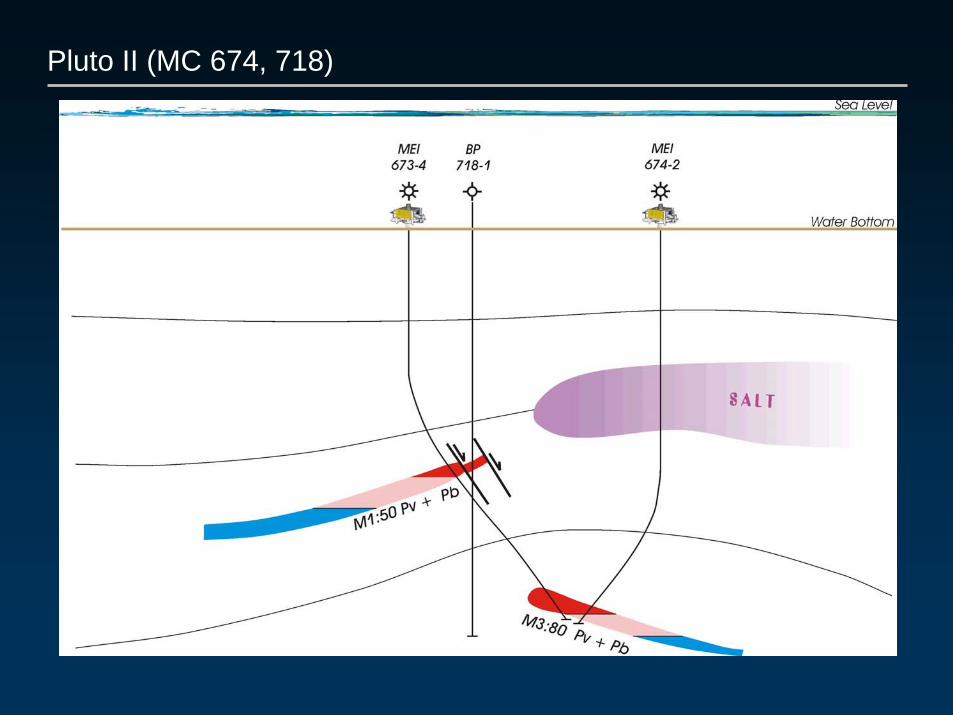
Pluto II (MC 674, 718)

Reservoir Seismic Traverse
Proved
Probable
Expl Potential
Sand Pv Pb Cum % PbC 6.9 18.5 19.1 66%B 22.7 42.2 46.3 44%A 3.8 5.2
BC
ASAND
Example of Deepwater Probable Reserve Conversion
Note: WesternGeco granted permission to present data derived from multi-client digital seismic data under license to Mariner Energy, Inc.

Black Widow Reserve Category Conversion
PvPb
Ps

King Kong/Yosemite• Discovered in 2000• 1st Production: 1Q02• 1-2 Exploitation Offsets• Operator: Mariner/ENI
-
Impact Projects Provide Near Term Growth
Daniel Boone• Discovered in 2003• Operator: W&T Offshore
Bass Lite• Discovered in 2001• Project Sanctioned in Jan 2006• 1st Production: Est. 2008• Operator: Mariner
Rigel• Discovered in 2003• 1st Production: March 2006• Operator: Dominion
LaSalle/Nansen• Discovered in 2001• SSTB to NW Nansen • 4 Exploration / Exploitation Prospects
• 3 out of 3 successes to date• Operator: Kerr-McGee
Pluto• Redrilled in 1Q05• SSTB to SP89• 1st Production: Est. 2Q06• Operator: Mariner

West Texas

West Texas Operations
West Texas operations provide stable cash flow and long lived reserves
Significant growth in 2005— Proved reserves increased 90% to
205 Bcfe
— Net production increased 65% to 17.8 MMcfe per day
— Producing wells increased 158% to 487
— Net acres increased 116% to 31,199
100% success rate over last 3 years with more than 170 wells drilled
Our acreage contains a large inventory of infill drilling opportunities
Represents 32% of proved reserves; 16% of PV10 and 17% of probables
• 62,209 Gross Acres
• 31,199 Net Acres
• Primarily Dev. Drilling– 600 potential locations

Spraberry Aldwell Unit
Drilling Program2002 – 2003 51 wells…………........2004 54 wells……………….2005 66 locations…………..100% success in 2002-05 drilling programs
Surrounded by production on all sides
Mariner has infill drilled more than 170 wells from 3Q02 thru 4Q05 with a 100% success rate
Mariner achieves economies of scale— Turnkey contracts— Simultaneous drilling / completion of
multiple wells— Field-wide costs reductions— Improved oil and gas processing and
marketing contracts— Volume discounts on service and
supply costs

12,045 14,226
31,199
12,045
05,000
10,00015,00020,00025,00030,00035,000
2002 2003 2004 2005
(Net Acres)
Net Acreage Position Proved Reserves
Net December Production Proved and Potential Well Locations
90115
205
65
0255075
100125150175200225
2002 2003 2004 2005
(Bcfe)
9.613.8
24.4
4.4
0.0
5.0
10.0
15.0
20.0
25.0
30.0
2002 2003 2004 2005
(MMcfe/d)
0250500750
1,0001,2501,5001,7502,000
2002 2003 2004 2005
# of wells
Proved Developed Proved Undeveloped Potential
1,500+
347260186
West Texas Performance Summary
77% CAGR
47% CAGR

Performance

$/McfeRolling 3-Yr Production Costs**
$0.93
$0.76
$1.11
$0.92
0.00
0.25
0.50
0.75
1.00
1.25
2002 2003 2004 2005
$/McfeRolling 3-Yr Res Repl Costs
$1.71 $1.70 $1.77
$1.48
0.0
0.5
1.0
1.5
2.0
2.5
2002 2003 2004 2005
%
101
245184
444
050
100150200250300350400450500
2002 2003 2004 2005
Reserves Replacement Rate
Bcfe
202
644
237206
0
100
200
300
400
500
600
700
2002 2003 2004 2005PF
MMcfe/dProved Reserves Daily Production
$MMEBITDA*/Capex
*Includes $26MM for non-cash stock compensationfor the twelve months ended December 31, 2005.
80
10391
109
0
20
40
60
80
100
120
2002 2003 2004 2005
Reserves subsequently soldIncludes 308 Bcfe acquired from Forest Oil Corporation
130
177
100114 149
83106
0
50
100
150
200
250
300
2002 2003 2004 2005
338
Historical Performance
280% 3-yr average
$0.92 3-yr average
EBITDACapex
**Includes lease operating expenses and transportation expenses.
253
Acquisitions

$1.77 $1.70$1.48
$0.00
$0.50
$1.00
$1.50
$2.00
$2.50
$3.00
2003 2004 2005
($/Mcfe)
Efficient Operating Track Record
Rolling 3-year Reserve Replacement (1) (2) Rolling 3-year Reserve Replacement Cost (1) (2) (3)
PUD Conversion (2) (4)
172%
280%
218%
0%
50%
100%
150%
200%
250%
300%
2003 2004 2005
(%)
27.3
6.02.3
0
5
10
15
20
25
30
2003 2004 2005
(Bcfe)
Proved Revisions (2)
32%
56%
44%
0%
20%
40%
60%
2003 2004 2005
(%)
___________________________1. Per John S. Herold.2. Does not include Forest GOM.3. Does not include future development costs which were approximately $387 million as of 12/31/05.4. Internal: Change in PD plus production for the year vs. PUD at beginning of year.

$1.06 $1.07 $1.08$1.17
$1.35
$0.92
$0.00$0.20$0.40$0.60$0.80$1.00$1.20$1.40$1.60
ME CPE WTI EPL SGY BDE
($/Mcfe)
$1.70$2.30
$3.34$3.71
$5.52
$0.00
$1.00
$2.00
$3.00
$4.00
$5.00
$6.00
CPE ME WTI BDE EPL SGY
($/Mcfe)
14%
149% 158%
203%
280%
94%
0%
50%
100%
150%
200%
250%
300%
CPE SGY EPL WTI BDE ME
(%)
Efficient Operating Track Record
Rolling 3-year Reserve Replacement (4) Rolling 3-year Reserve Replacement Costs (2)(4)
Rolling 3-year Production Costs ($/Mcfe) (3)(4)
(1)
(1)(1)
NM
___________________________1. Does not include Forest GOM.2. Does not include future development costs which for Mariner were approximately $387 million as of 12/31/05.3. Includes lease operating expense and transportation expense.4. Source: John S. Herold; SEC filings.

Diverse portfolio of development, exploitation, and exploration opportunities in 3 geographic basins— Gulf of Mexico portfolio encompasses shelf, deep shelf, and deepwater opportunities— West Texas assets are long-lived with extensive development potential
Moderate risk profile
Three-year reserve replacement rate: 280%
Three-year rolling reserve replacement costs: $1.70/Mcfe
~1,000,000+ net acres
> 7,000 blocks recent vintage 3-D seismic data
Impact projects in the pipeline
Subsea tieback expertise adds value
Large scale GOM lease expirations
Rigs under contract enable drilling of prospect inventory and access to outside generated projects
The Case for Mariner
Balance
Opportunity
Efficient Growth

This presentation has been prepared by Mariner and includes information from other sources believed by Mariner to be reliable. This presentation speaks only as of the date hereof, and Mariner disclaims any obligation to update the information provided herein. No representation or warranty, express or implied, is made to the accuracy or completeness of the information set forth herein.
This presentation contains statements, estimates and projections that may reflect various assumptions made by Mariner which may or may not prove to be correct. Statements that address performance, developments or events that are expected to occur in the future (including statements related to earnings, capital expenditures and operating results) are forward-looking statements. The forward-looking statements provided herein are based on the current belief of Mariner based on currently available information, as to the outcome and timing of future events. Mariner cautions that its future natural gas and liquids production, revenues and expenses and other forward-looking statements are subject to all of the risks and uncertainties normally incident to the exploration for and development and production and sale of oil and gas. These risks include, but are not limited to, price volatility, inflation or lack of availability of goods and services, environmental risks, drilling and other operating risks, regulatory changes, the uncertainty inherent in estimating future oil and gas production or reserves, and other risks as described in the Annual Report on Form 10-K for the fiscal year ended December 31, 2005, and other documents filed by Mariner with the SEC. Any of these factors could cause the actual results and plans of Mariner to differ materially from those in the forward-looking statements.
The guidance estimates set forth herein contain assumptions that Mariner believes are reasonable. These estimates are based on information that is available as of the date of this presentation. Mariner is not undertaking any obligation to update these estimates as conditions change or as additional information becomes available. There can be no assurance that any of the guidance estimates can or will be achieved.
The SEC has generally permitted oil and gas companies, in their filings with the SEC, to disclose only proved reserves that a company has demonstrated by actual production or conclusive formation tests to be economically and legally producible under existing economic and operating conditions. Mariner uses the terms “probable,” “possible” and “non-proved” reserves, reserve “potential” or “upside” or other descriptions of volumes of reserves potentially recoverable through additional drilling or recovery techniques that the SEC’s guidelines may prohibit it from including in filings with the SEC. These estimates are by their nature more speculative than estimates of proved reserves and accordingly are subject to substantially greater risk of being actually realized by the company.
Disclaimer

Appendix

Mariner Management Team
Sr VPCXO
Mike van den Bold(19 years)
Sr VPCorporate Development
Jesus Melendrez(25 years)
VPCFO
Rick Lester(31 years)
Sr VPGeneral Counsel
Teresa Bushman(20 years)
Sr VPShelf & OnshoreJudd Hansen
(27 years)
COODalton Polasek
(30 years)
VPDeepwater
Cory Loegering(28 years)
ChairmanCEO
Scott Josey(25 years)
VPReserves & Economics
Rick Molohon(29 years)

Experienced Management
Chairman since August 2001 and CEO since October 2002Over 25 years of operations, finance and management in the energy industry1982 - 93 Texas Oil and Gas Corp.; 1993 - 95 & 2000 - 02 Enron; 1995 - 00 Sagestone Capital
Scott D. JoseyChairman, CEO and President
Dalton F. Polasek, Jr.Chief Operating Officer
Joined Mariner in October 2001 Over 30 years of experience in the oil and gas industry spanning reservoirengineering, engineering management, planning and business development 1975 - 83 Amoco; 1983 - 91 Mark Prod. Co.; 1991 - 94 General Atlantic; 1994 - 96 SMR Energy; 1996 - 01 Basin Exploration
Rick G. LesterVice President and CFO
Joined Mariner in October 2004 Over 31 years of industry experience and is a Certified Public AccountantPreviously EVP and CFO of Contour Energy Company and VP and CFO of Domain Energy and its Tenneco Ventures predecessor
Mike van den BoldSr. Vice President and
Chief Exploration Officer
Joined Mariner in July 2000Over 19 years of experience in the oil and gas industry spanning exploration and development geoscienceBegan has career with British Petroleum and is a Certified Petroleum Geologist

Experienced Management
Cory L. LoegeringVice President of
Deepwater
Joined Mariner in 1990 Previously held positions including VP of Petroleum Engineering and Director of Deepwater Development1982 - 89 Tenneco; 1977 began with Conoco
Jesus G. MelendezSr. Vice President of
Corporate Development
Joined Mariner in July 2003 Over 25 years experience in the oil and gas industry spanningcorporate development, finance and engineering1980 - 92 Exxon; 1992 - 97 & 2000 - 03 Enron; 1997 - 00 TXU
Teresa G. BushmanSr. Vice President and
General Counsel
Joined Mariner in June 2003 Previously employed by Enron most recently as Assistant General Counsel representing the Energy Capital Resources groupPrior to Enron, Ms. Bushman was a partner with Jackson Walker, LLP in Houston
Judd A. HansenSr. Vice President ofShelf and Onshore
Joined Mariner in February 2002Over 27 years of experience in conducting operations in the oil and gas industry1978 - 83 Shell; 1983 - 86 Mark Prod. Co.; 1986 – 91 Ladd Petroleum;1991 - 97 Greenhill Petroleum; 1997 - 01 Basin Exploration
Richard A. MolohonVice President of
Reserves & Economics
Joined Mariner in January 1995 Over 29 years of experience in the oil and gas industry covering production, reservoir, development, exploration, contracts, basin studies, business development, and acquisition1977 - 80 Amoco; 1980 - 90 Tenneco Oil Co.; 1990 – 95 General Atlantic