investor presentation for personal use only...2018/06/12 · investor presentation for personal use...
TRANSCRIPT

Locality Planning Energy Holdings LTD (ASX:LPE) Trading as Locality Planning Energy Pty. Ltd. Telephone 1800 040 168 ACN 147 867 301 T1. 306, 55 Plaza Parade, Maroochydore QLD 4558 www.localityenergy.com.au AER E14005
12 June 2018 ASX Announcement
INVESTOR PRESENTATION
Locality Planning Energy Holdings Limited (ASX: LPE) (the Company) encloses its latest Company presentation showcasing the past, present and future growth of the Company.
Highlights
• Revenues have grown 100% year-on-year over the past 3 years
• LPE’s product offering broadened to now service all strata communities
• Customer trajectory and energy under management to increase significantly in the coming years
• LPE’s gross profit margin forecast to increase in coming years due to operational scaling.
Ends
About Locality Planning Energy Holdings Limited (LPE)
LPE’s wholly owned subsidiary Locality Planning Energy Pty Ltd, holds an Australian Energy Regulator (AER) Authority to sell electricity and utility services to residential, commercial and industrial customers throughout the National Energy Market. LPE specialises in electricity sales to strata communities, both existing and new developments; generating significant savings on electricity delivered to strata communities.
LPE’s unique purchasing model is matched against 5 to 10 year supply contracts providing LPE with consistent recurring revenues. LPE is transforming the electricity supply industry by providing an intelligent solution to help its customers reduce high electricity costs, with no risk and no upfront cost. LPE is at the forefront of innovative electricity supply with a commitment to the integration of technology to provide the highest savings and consumer advocacy to its customers.
For
per
sona
l use
onl
y

INVESTORPRESENTATION
June 2018
For
per
sona
l use
onl
y

2. DISCLAIMER
This presentation contains summary information about Locality Planning Energy Holdings Limited (LPE) and is current as of 30May 2018. The information in this presentation is general background information and does not purport to be complete.
This presentation is not investment or financial product advice (nor tax, accounting or legal advice) and is not intended to beused for the basis of making an investment decision. The information contained in this presentation has been prepared withouttaking into account the objectives, financial situation or needs of individuals. Investors should obtain their own advice beforemaking any investment decision.
LPE has prepared this document based on information available to it at the time of preparation. No representation or warranty,express or implied, is made as to the fairness, accuracy or completeness of the information, opinions and conclusionscontained in this presentation.
This presentation contains certain “forward-looking statements”. Forward looking statements can generally be identified by theuse of forward looking words such as, “expect”, “should”, “could”, “may”, “predict”, “plan”, “will”, “believe”, “forecast”,“estimate”, “target” and other similar expressions. Indications of, and guidance on, future earnings and financial position andperformance are also forward-looking statements. Forward-looking statements, opinions and estimates provided in thispresentation are based on assumptions and contingencies which are subject to change without notice, as are statements aboutmarket and industry trends, which are based on interpretations of current market conditions.
Forward-looking statements including projections, guidance on future earnings and estimates are provided as a general guideonly and should not be relied upon as an indication or guarantee of future performance. This presentation contains statementsthat are subject to risk factors associated with LPE. It is believed that the expectations reflected in these statements arereasonable, but they may be affected by a range of variables which could cause actual results or trends to differ materially.
LPE disclaim any intent or obligation to publicly update any forward looking statements, whether as a result of new information,future events and results or otherwise.
To the maximum extent permitted by law, LPE, their related bodies corporate (as that term is defined in the Corporations Act2001 (Cth)) and the officers, directors, employees, advisers and agents of those entities do not accept any responsibility orliability including, without limitation, any liability arising from fault or negligence on the part of any person, for any loss arisingfrom the use of the presentation or its contents or otherwise arising in connection with it.
For
per
sona
l use
onl
y

3. INVESTMENT SUMMARY
Valuation levels on these projections are attractive.
$
LPE is a high-growth, small-cap Australian listed energy retailer. Its business is focused on providing electricity and utility services to strata communities. Ending the financial year with an annualised revenue run rate of approximately $40M.
Revenues have grown at a rate of 100% year on year over the last 3 years. Management expects growth to remain strong. The company has introduced a Direct Market Access product to compliment its Embedded Network and other utility service solutions.
For strata communities 30 units and larger, LPE’s Embedded Network offering results in consumer savings of 25-35%. Leveraging its sales force and market goodwill, LPE has introduced a Direct Market Customer product, nearly tripling the company’s addressable market.
LPE’s business model is secure, scalable and profitable. As it builds out its network during this high-growth phase, a working capital deficit results from a payables/receivables mismatch and making instalment sales of Embedded Networks.
The company anticipates reaching overall cash flow breakeven and profitability in the next few years.
For
per
sona
l use
onl
y

4. CAPITAL STRUCTURE
Capital Structure June 2018
ASX Code LPE
Total shares on issue 2,510.54 M
Share price $0.018
Market Capitalisation – Fully Diluted $45M
Held by Founders and Management
1,505,513,858
59.97 %
Held in top 40 (excluding Founders and Management)
518,365,161
20.65 %
Others(excluding Founders and Management)
486,657,368
19.38 %
Top 10 Holders June 2018
MR BEN JAMES CHESTER 16.78%
MR DAMIEN IAN GLANVILLE 16.78%
PETTETT PTY LTD 16.53%
JARWILL PTY LTD 7.44%
NATIONAL NOMINEES LIMITED 4.53%
HSBC CUSTODY NOMINEES (AUSTRALIA) LIMITED 3.24%
DEFENDER EQUITIES PTY LTD 1.80%
J P MORGAN NOMINEES AUSTRALIA LIMITED 0.81%
WOODVILLE SUPER PTY LIMITED 0.79%
FERNSHA PTY LIMITED 0.79%
-
2,000,000
4,000,000
6,000,000
8,000,000
10,000,000
12,000,000
0.0000.0050.0100.0150.0200.0250.0300.0350.0400.0450.050
Janu
ary
Febr
uary
Mar
chA
pril
May
June
July
Aug
ust
Sep
tem
ber
Oct
ober
Nov
embe
rD
ecem
ber
Janu
ary
Febr
uary
Mar
chA
pril
May
June
July
Aug
ust
Sep
tem
ber
Oct
ober
Nov
embe
rD
ecem
ber
Stock Performance 2 Years
Volume AVG Daily Levelised Monthly Average
Executive Directors – Shares in Escrow
On 14 February 2018, CEO Damien Glanville and COO Ben Chester placed 91% of their holdings, or 800M shares, into Voluntary Escrow for 12 months.
For
per
sona
l use
onl
y
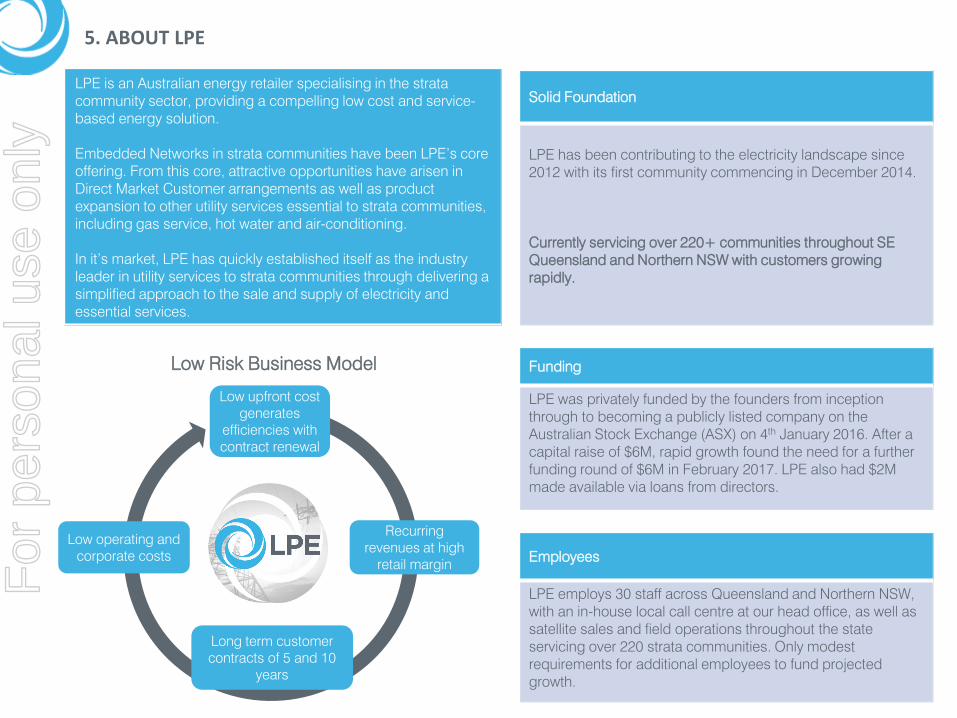
Solid Foundation
LPE has been contributing to the electricity landscape since 2012 with its first community commencing in December 2014.
Currently servicing over 220+ communities throughout SE Queensland and Northern NSW with customers growing rapidly.
Employees
LPE employs 30 staff across Queensland and Northern NSW, with an in-house local call centre at our head office, as well as satellite sales and field operations throughout the state servicing over 220 strata communities. Only modest requirements for additional employees to fund projected growth.
LPE is an Australian energy retailer specialising in the strata community sector, providing a compelling low cost and service-based energy solution.
Embedded Networks in strata communities have been LPE’s core offering. From this core, attractive opportunities have arisen in Direct Market Customer arrangements as well as product expansion to other utility services essential to strata communities, including gas service, hot water and air-conditioning.
In it’s market, LPE has quickly established itself as the industry leader in utility services to strata communities through delivering a simplified approach to the sale and supply of electricity and essential services.
Funding
LPE was privately funded by the founders from inception through to becoming a publicly listed company on the Australian Stock Exchange (ASX) on 4th January 2016. After a capital raise of $6M, rapid growth found the need for a further funding round of $6M in February 2017. LPE also had $2M made available via loans from directors.
Low upfront cost generates
efficiencies with contract renewal
Recurring revenues at high
retail margin
Long term customer contracts of 5 and 10
years
Low operating and corporate costs
Low Risk Business Model
5. ABOUT LPEF
or p
erso
nal u
se o
nly

6. CORE PRODUCT OFFERING
LPE OFFERS 5 PRODUCTS FORSTRATA COMMUNITIES
Electricity ServicesEmbedded Networks are the most efficient way for medium and large strata communities to save on electricity costs.• Depending on size, savings range from 25-35% below any Direct Market Customer arrangement. This represents a minimum
saving of $250 per annum per consumer versus any other supply method. • LPE is the leader in supplying electricity through an Embedded Network and provides the safest consumer service available.• LPE currently has over 220+ strata communities representing ~177GWh of annual electricity sales.• The company expects a minimum annual growth of 100GWh per annum for the next 3 years.
Direct Market Customers are the normal supply mechanism for the supply of electricity to individual lots in the market. They are standard retail offerings that are available to all consumers and do not require any infrastructure build-out. • The difference in LPE’s Direct Market Customer (DMC) offering is that it is a specialist in strata communities. Its agreements,
terms and services are tailored for strata communities, thus delivering a specialist service at the best price.• DMC’s have a faster and simpler sales cycle, with negligible upfront costs for new customers. Unlike other retailers who employ
a one-to-one sales strategy in this segment, LPE will maintain its one-to-many sales cycle by targeting only (smaller) strata customers.
• The company projects 6,000 service points (equivalent to ~27GWh) by end of 2018, estimated to grow to 27,000 by end of 2020.
• DMC margins to LPE are similar to Embedded Networks, but customers have lower switching costs and the average customer life may be shorter.
Utility Services Serviced Hot water | Gas Service Supply | Central Air-conditioning LPE has provided these other serviced utilities from inception. Growth in these segments is accelerating as geographic and customer bases expand, with an ever-growing high demand for these services. These utility services maintain margins equal to electricity. With LPE’s current operational platform there is no additional core operational expenditure requirements to servicethese opportunities. • The company anticipates strong additions to the base revenue from these service offerings. • Utility services augment contract lengths with operational plant contracts extending to 10 years.
For
per
sona
l use
onl
y

7. LARGE TARGET MARKET OF $2.6 BILLION
Industrial54.0%
SME27.5%
Residential18.5%
LPE’s focus market is medium and high density strata residential communities. Ultimately LPE sells electricity and in response to customer demand the company has broadened its market from Embedded Networks to include Direct Market Customers in strata communities.
Australian Energy Market Is worth $37 Billion annually SME
$1 Billion worth of SME electricity sales are inside Strata or Density Buildings
Residential$1.7 Billion worth of Residential electricity sales are inside Strata
Embedded Networks$941 Million worth of electricity sales are inside properties, both residential and commercial, that have or are eligible for an Embedded Network.
Direct Market CustomersThere are $1.77 Billion worth of electricity opportunities inside Strata, both residential and commercial, that are not specifically serviced.
$1.711Billion
$1.017Billion
$941Million
$1.77Billion
Strata S
egment
For
per
sona
l use
onl
y

8. CORPORATE TIMELINE
Personal FundsPersonal Loans
Directors and Founders
2012 2014 2015 2016 2017 2018
RTO listingRaise of $6 million
January 2016
Public Raise $6 millionFebruary 2017
Initial $10 millionDebt Facility
January 2018Director Loans$2 million
October 2016
Minor Debt FacilityProof of Concept
Launch First Community
Operational Cash flow
Positive
Financial year is July 1 – June 30
• LPE continue to build operational credibility having serviced the strata market for over 4 years• Revenue and customer trajectory modelled to more than double in the coming years based on
current growth rates only• Operational team in place and costs steady as only minimal additions to personnel required to
achieve 450GWh of energy under management target• LPE well positioned to take advantage of any value adding acquisitions to accelerate growth
For
per
sona
l use
onl
y
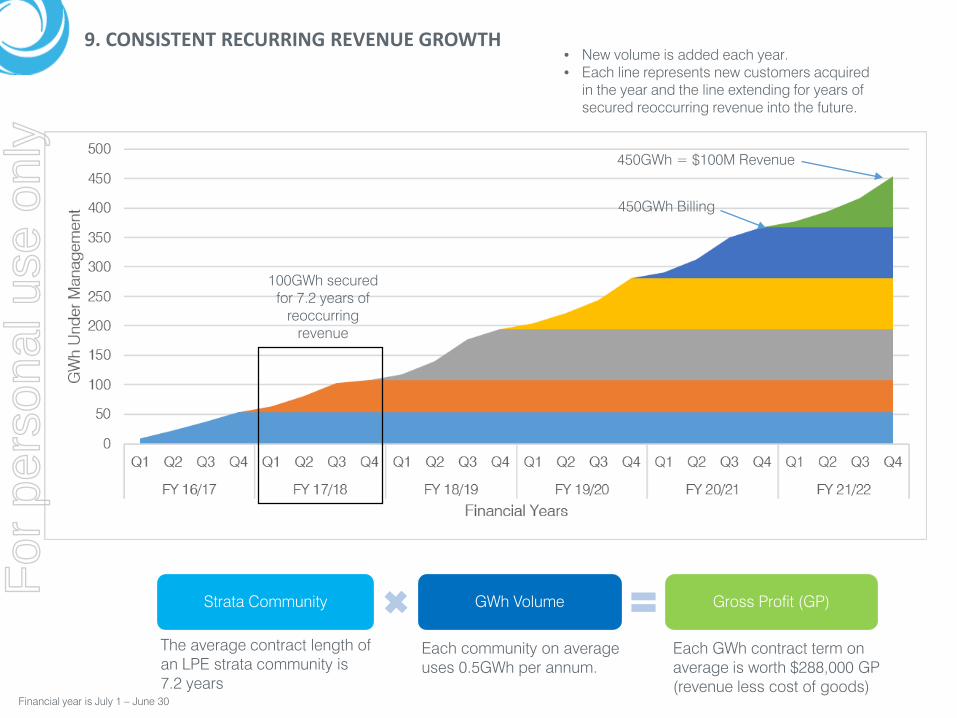
450GWh Billing
450GWh = $100M Revenue
9. CONSISTENT RECURRING REVENUE GROWTH• New volume is added each year.• Each line represents new customers acquired
in the year and the line extending for years of secured reoccurring revenue into the future.
The average contract length of an LPE strata community is 7.2 years
Each community on average uses 0.5GWh per annum.
Strata Community GWh Volume Gross Profit (GP)
Each GWh contract term on average is worth $288,000 GP (revenue less cost of goods)
100GWh secured for 7.2 years of
reoccurring revenue
Financial year is July 1 – June 30
For
per
sona
l use
onl
y

10. DIRECT MARKET CUSTOMERS LEVERAGE STRATA FOCUS AND TRIPLE ADDRESSABLE MARKET
Without moving from its key ‘niche’ marketplace, LPE intends to expand its reach with an additional product line in order to maintain its leading position and the first mover advantage it has developed in this sector.
Simply adding an additional product line increases LPE’s addressable market by $1.7billion or 180%.
Currently LPE has secured 4.2% of the embedded market.
Embedded Networks$941 Million worth of electricity sales are inside this sector of strata, both residential and commercial, that have or are eligible for an Embedded Network both.• This is LPE’s backbone and specialty.• Nature of strata communities means it is a long sales
cycle but results in long-lasting customer base of 5-10 years.
• Also misses 70% of the strata market due to lack of enough units to make economics compelling.
Direct Market Customers• Expanding into this product line adds $1.7 Billion
worth of electricity opportunities to the sector of strata that are not specifically serviced via Embedded Networks.
• This leverages LPE’s existing salesforce, relationships and goodwill in the market.
$941 Million
$1.7 BillionFor
per
sona
l use
onl
y

11. COMPELLING CONSUMER PROPOSITION
Embedded Networks• LPE’s specialty and driver of growth so far. • $941 Million worth of electricity sales are
inside this sector of strata, both residential and commercial, that have or are eligible for an Embedded Network.
• LPE provides a flat rate, with 100% of the network cost reduction providing the consumer savings.
• Retail Margins are consistent at ~18-20%.
Direct Market Customers• Expanding this product line into a consumer direct
base adds $1.7 billion worth of electricity opportunities to the sector of strata where Embedded Networks are not viable.
• LPE provides a flat rate and not an inflated value that is discounted.
• Dedicated service capabilities for strata.• Retail gross margins to LPE are similar to those
received from Embedded Networks at ~18-20%.
0.0%
10.0%
20.0%
30.0%
40.0%
50.0%
60.0%
70.0%
80.0%
90.0%
100.0%
Standard RetailDiscounted Offering
LPE Direct MarketOffering
LPE EmbeddedOffering
Per
cent
age
of S
tand
ard
Ele
ctric
ity O
fferin
g
Environmental Polices Wholesale Regulated Networks Retail Margin
Savings of up to
31%
Fixed Federal Charges
Wholesale Energy Cost
Reduced Network
Cost
Gross / Retail
Margin
For
per
sona
l use
onl
y

12. PRODUCT EXPANSION REVENUE FORECAST
Embedded NetworksLPE sees very strong and continual growth in the Embedded Network product space. The past 12 months has seen consistent increases of 6.65 GWh per month. Gross profit is forecast at $40,000 per GWh per year.
Direct Market CustomersLPE is taking a conservative approach to forecasting uptake in the Direct Market Customer product with estimated net growth of 4GWh per month.
64.7%
35.3%
EMBEDDED NETWORK
DIRECT MARKET
Forecast Market Segment Mix at end of 2021
050
100150200250300350400450500
FY 16/17 FY 17/18 E FY 18/19 E FY 19/20 E FY 20/21 E
Tota
l GW
h
Forecast Product Mix
Recurring Revenue New Direct Volume New Embedded Volume
Difference in CustomersOnce a customer is with LPE there is no difference in the service they receive.
The Embedded Network platform creates a longer-term customer benefit and longer contract life.
Direct Market Customer acquisition is low time and cost per customer.
Both customer groups represent similar value in per customer revenue and margin.
Financial year is July 1 – June 30
For
per
sona
l use
onl
y

13. FULLY FUNDED CAPITAL ASSET GROWTH THROUGH DEBT FACILITY
Facility Detail• Initial facility is for $10 million• Interest rate is 7.9%.• Security is based on company guarantee for each
capital asset deployment on an asset-by-asset basis (no fixed and floating charge over company.)
• Ongoing term principal at 5 years.
Debt Overview• The debt facility is to be utilised for capital asset deployment,
prior to this LPE has used cash from equity. Utilisation of this facility will have a positive effect on the cash position.
• This facility provides LPE with a forward runway of 36 months at an accelerated rate of delivery (including an increase in available funds).
$-
$200,000
$400,000
$600,000
$800,000
$1,000,000
$1,200,000
Q1 Q2 Q3 Q4 Q1 Q2 Q3 Q4 Q1 Q2 Q3 Q4 Q1 Q2 Q3 Q4 Q1 Q2 Q3 Q4 Q1 Q2
FY 16/17 FY 17/18 FY 18/19 FY 19/20 FY 20/21 FY 21/22
Qua
rterly
Spe
nd
Infrastructure Spending – Debt Facility Utilisation
Debt Facility Kick in
$10 Million Equity / Retained Earnings Spend
on capital
Graph : Spend on Network infrastructure Capital to date and future contribution with the drawdown capacity of the debt facility out to $10 million in deployed debt for future embedded network projects.
For
per
sona
l use
onl
y

14. FINANCIAL FORECAST
Shown in $ millions FY 18/19 E FY 19/20 E FY 20/21 E
Gross Revenue $44.2 $79.7 $115.2
Cost of Goods $34.4 $63.6 $92.8
Gross Profit $9.80 $16.0 $22.4
Margin % 22% 20% 19%
Operational Expenses $9.10 $11.3 $13.0
Profit (NPAT) $0.68 $4.65 $8.20
Note. LPE have $5.78 million carry forward tax losses / Financial year is July 1 – June 30
$0
$1,000,000
$2,000,000
$3,000,000
$4,000,000
$5,000,000
$6,000,000
$7,000,000
$8,000,000
$9,000,000
$0
$20,000,000
$40,000,000
$60,000,000
$80,000,000
$100,000,000
$120,000,000
$140,000,000
FY 18/19 FY 19/20 FY 20/21
Pro
fit
Cost ofGoodsGrossRevenueProfit(NPAT)
• Current growth trajectory modelled in forecast with company profitability expected to be reached in 2020• Gross revenues and costs of goods are currently decreasing and are expected to fluctuate over the coming
years. Whilst these metrics will be effected, gross profit and NPAT outlined below will not adjust. Percentage margins will increase/decrease based on these market fluctuations.
• Operational expenses steady as only minor additions to personnel required to achieve 450GWh target• Any acquisitions made is expected to accelerate and boost profitability
For
per
sona
l use
onl
y

15. LPE COMPARES FAVOURABLY TO INDUSTRY BENCHMARKS
$1,735
$1,401
$952
Worst Case MarketAverage
LPE
Energy Affordability Annual Electricity Bill
4.87%
2.56%
0.002%
Worst Case MarketAverage
LPE
Debt Levels -Customers Repaying Debt
3.87%
1.14% 0.01%
Worst Case MarketAverage
LPE
Disconnections for Non-payment
7.65%
4.30%2.90%
Worst Case MarketAverage
LPE
Bills as Percentage of Income (Based on low income median)
1.64%
0.97%
0
Worst Case MarketAverage
LPE
Customers in Hardship Plans
$1.20 $185
$471
Worst Case MarketAverage
LPE
Savings over Standard Market Energy Offers
This indicates LPE has the best value proposition in the market.
Due to LPE maintaining low costs to consumers we have lower debt levels.
Due to LPE maintaining low costs to consumers we have an almost zero
disconnection rate.
This indicator is highly relevant as LPE’s core market is in lower or fixed income range
demographic.
LPE has never had the requirement to enter a customer into the Hardship Plan due to the
lower cost service.
A clear indication of the market comparison in absolute amounts of the LPE Value
Proposition.
Statistics taken from AER retail market performance report 2017
For
per
sona
l use
onl
y
16. EXPERIENCED EXECUTIVE TEAM
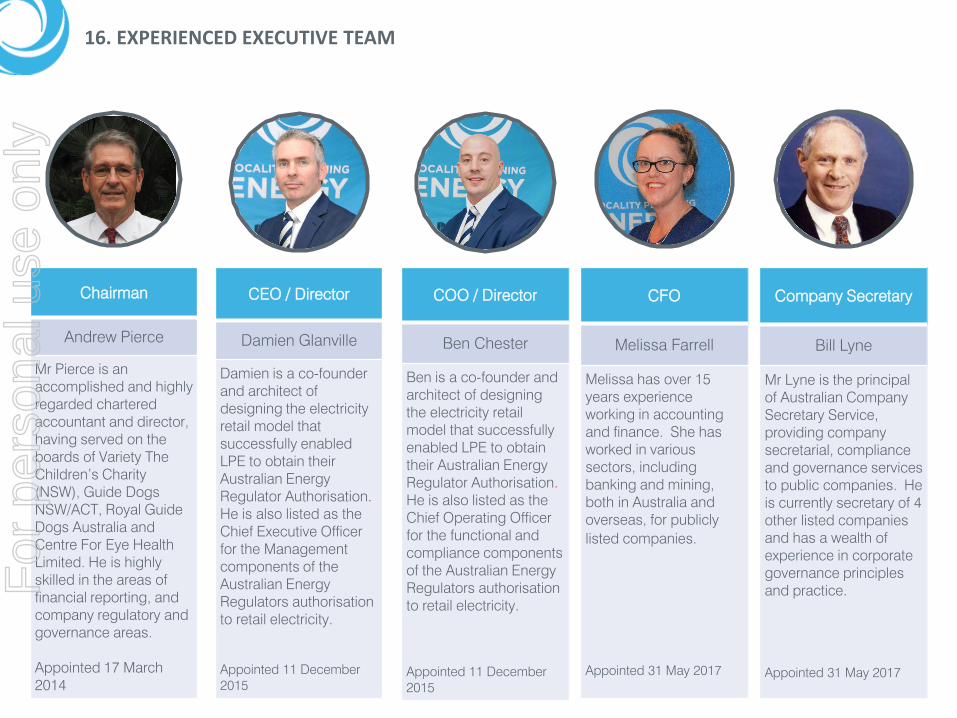
Chairman
Andrew Pierce
Mr Pierce is an accomplished and highly regarded chartered accountant and director, having served on the boards of Variety The Children’s Charity (NSW), Guide Dogs NSW/ACT, Royal Guide Dogs Australia and Centre For Eye Health Limited. He is highly skilled in the areas of financial reporting, and company regulatory and governance areas.
Appointed 17 March 2014
CEO / Director
Damien Glanville
Damien is a co-founder and architect of designing the electricity retail model that successfully enabled LPE to obtain their Australian Energy Regulator Authorisation. He is also listed as the Chief Executive Officer for the Management components of the Australian Energy Regulators authorisation to retail electricity.
Appointed 11 December 2015
COO / Director
Ben Chester
Ben is a co-founder and architect of designing the electricity retail model that successfully enabled LPE to obtain their Australian Energy Regulator Authorisation. He is also listed as the Chief Operating Officer for the functional and compliance components of the Australian Energy Regulators authorisation to retail electricity.
Appointed 11 December 2015
Company Secretary
Bill Lyne
Mr Lyne is the principal of Australian Company Secretary Service, providing company secretarial, compliance and governance services to public companies. He is currently secretary of 4 other listed companies and has a wealth of experience in corporate governance principles and practice.
Appointed 31 May 2017
CFO
Melissa Farrell
Melissa has over 15 years experience working in accounting and finance. She has worked in various sectors, including banking and mining, both in Australia and overseas, for publicly listed companies.
Appointed 31 May 2017
For
per
sona
l use
onl
y

17. CONTACT US
Phone: 1800 040 168Email: [email protected]
Address:Suite 306, Tower 1, 55 Plaza Parade, MaroochydoreQueensland 4558, Australia
For
per
sona
l use
onl
y

ANNEXURE A – CONNECTION TYPE FUNDAMENTALS
Embedded Network Direct Market Customers
Embedded Networks create a single point of connection to an entire community behind a single point (Parent Meter). This aggregation of network connections is how the network saving benefit is provided.
Direct Market Customers sells electricity directly to each lot. This is the normal supply mechanism for the majority of electricity supply.
For
per
sona
l use
onl
y

ANNEXURE B – GEOGRAPHIC RANGE
Queensland
Population: 4,558,312
Total Households: 1,656,837
Strata Communities: 75,642
Strata Households: 351,249
Far North (Cairns, Townsville)
Population: 496,800
Strata Communities: 8,244
Strata Households: 38,887
Mid North (Mackay, Rockhampton, Bundaberg)
Population: 717,000
Strata Communities: 11,898
Strata Households: 56,123
South East (Harvey Bay to NSW Border)
Population: 3,344,512
Strata Communities: 55,500
Strata Households: 261,792
New South Wales
Population: 7,480,228
Total Households: 2,590,171
Strata Communities: 159,224
Strata Households: 836,641
Northern Rivers / North Coast
Population: 1,351,700
Strata Communities: 28,732
Strata Households: 88,930
Greater Sydney
Population: 4,666,928
Strata Communities: 99,200
Strata Households: 307,042
South Coast (Wollongong to Border)
Population: 536,100
Strata Communities: 11,395
Strata Households: 35,271
Map not to scale and is indicative of areas only.Source ABS – Housing Data - Urban Centres and Localities (UCLs) and Significant Urban Areas (SUAs)*Note NSW figures exclude some regional areas
For
per
sona
l use
onl
y

ANNEXURE C –NATIONAL ENERGY MARKETF
or p
erso
nal u
se o
nly