investor presentation february 2012 - mol … and data contained in this presentation and the...
TRANSCRIPT

INVESTOR PRESENTATION
February 2012
DISCLAIMER
"T"This presentation and the associated slides and discussion contain forward-looking statements. These statements are naturallysubject to uncertainty and changes in circumstances. Those forward-looking statements may include, but are not limited to,th di it l l d it l dit h fl t i d bt d d d i ti di lthose regarding capital employed, capital expenditure, cash flows, costs, savings, debt, demand, depreciation, disposals,dividends, earnings, efficiency, gearing, growth, improvements, investments, margins, performance, prices, production,productivity, profits, reserves, returns, sales, share buy backs, special and exceptional items, strategy, synergies, tax rates,trends, value, volumes, and the effects of MOL merger and acquisition activities. These forward-looking statements are subjectto risks uncertainties and other factors which could cause actual results to differ materially from those expressed or implied byto risks, uncertainties and other factors, which could cause actual results to differ materially from those expressed or implied bythese forward-looking statements. These risks, uncertainties and other factors include, but are not limited to developments ingovernment regulations, foreign exchange rates, crude oil and gas prices, crack spreads, political stability, economic growth andthe completion of ongoing transactions. Many of these factors are beyond the Company's ability to control or predict. Giventhese and other uncertainties, you are cautioned not to place undue reliance on any of the forward-looking statements contained, y p y gherein or otherwise. The Company does not undertake any obligation to release publicly any revisions to these forward-lookingstatements (which speak only as of the date hereof) to reflect events or circumstances after the date hereof or to reflect theoccurrence of unanticipated events, except as maybe required under applicable securities laws.
Statements and data contained in this presentation and the associated slides and discussions, which relate to the performanceof MOL in this and future years, represent plans, targets or projections."
2

KEY FIGURESKEY FIGURES
bn USD EBITDA generation in 2011 (+18%), >70% from Upstream, >50% from international operation3
organic reserve replacement rate in last year2P reserves at 682 MMboe*
over
200%
Bboe Recoverable Resource Potential (WI) in 11 countriesmore than 50% in Kurdistan1.4
wells to be drilled in Kurdistan Region of Iraq in 2012-20139
t in European refinery ranking with the two largest assetshaving diesel gearing
Net debt / EBITDA ratio no additional financing need in 20121 4
top
5%
ExecutiveNet debt / EBITDA ratio, no additional financing need in 2012CAPEX should be fully financed by operating cash-flow
year MOL is in the Dow Jones Sustainability World Index
1.4
2nd
e summ
ary
3
uniquely in the region2nd
*MOL estimate

UPSTREAM-DRIVEN, INTEGRATED COMPANYOver 50% international contribution to USD 3bn EBITDA in 2011Over 50% international contribution to USD 3bn EBITDA in 2011
REGION EBITDA 2011 DATA 2011
► Field development driven growth in short ► 682 Mmboe* SPE 2P
GROWTH DRIVERS & COMPETITIVE ADVANTAGE
Ups
trea
m
p gterm (RUS)► Transforming of existing exploration assets to production in the mid term (KAZ)► Long term growth based on exploration-
reserves► 219%* organic reserve replacement ratio► 147 mboepd production► Production in 8,
led strategy (Kurdistan Region of Iraq)exploration in 12 countries
► Largest assets with high net cash margin► 5 refineries, 470 thbpd
Dow
nstr
eam
margin ► Strong landlocked market position
with outstanding captive market► Maintain leading position & improve
profitability: efficiency improvement
► 20.5 Mtpa sales
► 1,600+ filling stations
► 2 petrochemical plants RefineryRefineryPetchemPetchem unitunit
am
and reshape smaller assets
► Gas Transmission: 5,560 km pipeline in
► Growing international transit► Good geographical position
Executive
Gas
Mid
stre
a
MMBF UGS
► Gas Storage capacity: 1.9 bcm
, p pHungary
► Good geographical position
► Secured EUR-base return on storage
e summ
ary
4
Previous pipeline developments
*MOL estimate
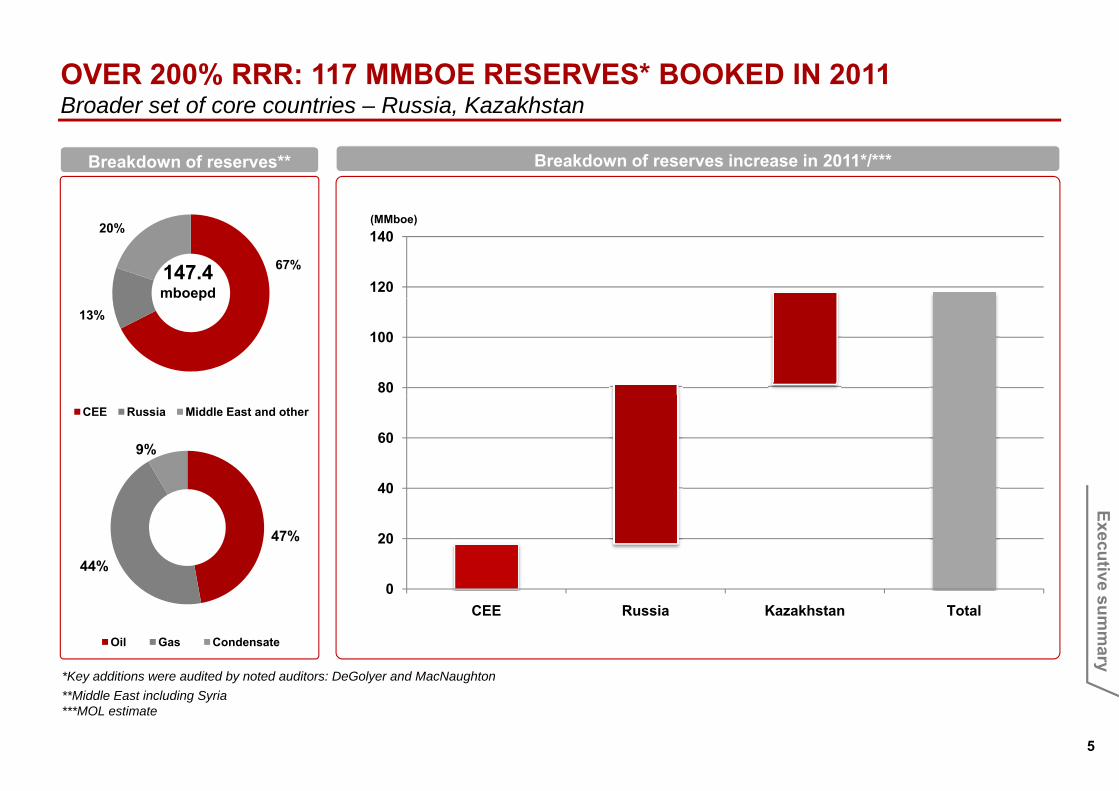
OVER 200% RRR: 117 MMBOE RESERVES* BOOKED IN 2011Broader set of core countries Russia KazakhstanBroader set of core countries – Russia, Kazakhstan
Breakdown of reserves increase in 2011*/***Breakdown of reserves**
120
140(MMboe)
67%
20%
147.4mboepd
80
10013%
p
40
609%
CEE Russia Middle East and other
0
20
40
47%
44%
Executive
0CEE Russia Kazakhstan Total
*Key additions were audited by noted auditors: DeGolyer and MacNaughton
Oil Gas Condensate
e summ
ary
5
**Middle East including Syria***MOL estimate

2012 PRODUCTION: 135 MBOEPD, IN NORMAL BUSINESS ENVIRONMENT3-4% production growth from 20143 4% production growth from 2014
Total hydrocarbon production by countries (mboepd)* Total hydrocarbon production by products (boepd)*
150 150150 150
100 100
50 50
-2012 2013 2014
02012 2013 2014
Executive
CEE Russia Middle East and other Oil Gas Condensate
Largest contributors Short term growth is expected from Russia
e summ
ary
6
*Middle East including Syria

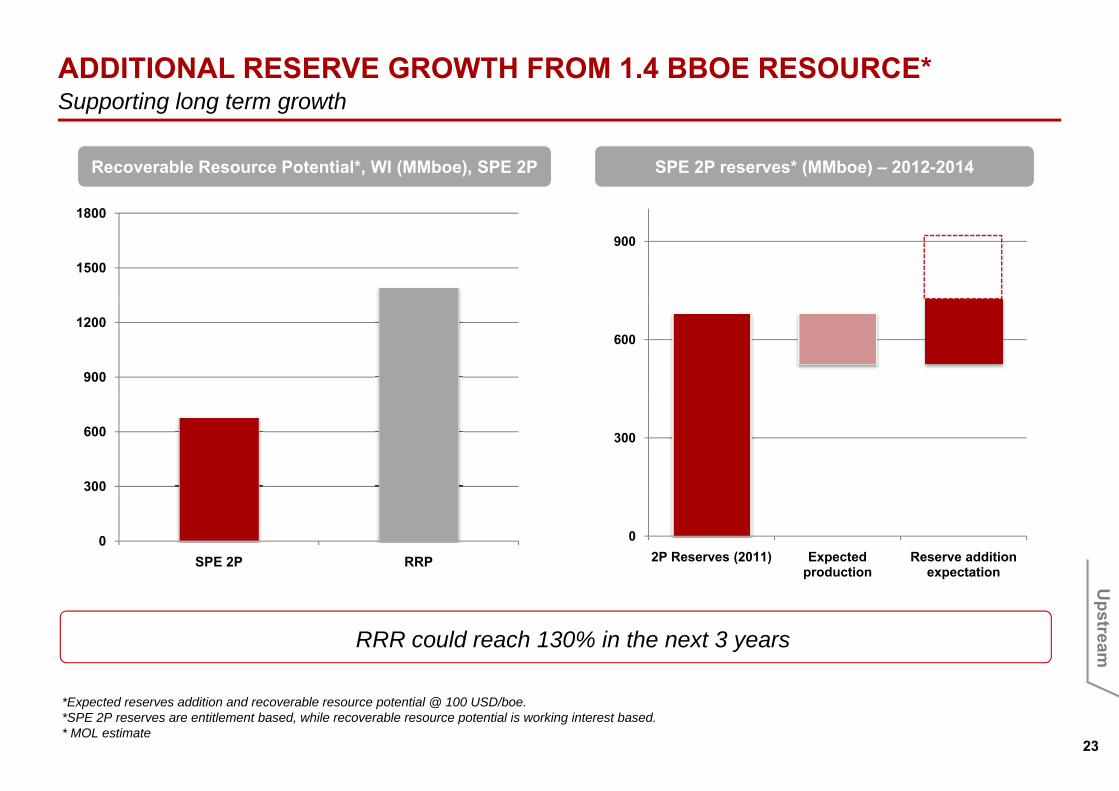
ADDITIONAL RESERVE GROWTH FROM 1.4 BBOE RESOURCE*Supporting long term growthSupporting long term growth
Recoverable Resource Potential*, WI (MMboe), SPE 2P SPE 2P reserves* (MMboe) – 2012-2014
900
1500
1800
600
900
1200
300
300
600
02P Reserves (2011) Expected
productionReserve addition
expectation
0SPE 2P RRP
Executive
Largest contributors
*Expected reserves addition and recoverable resource potential @ 100 USD/boe.
RRR could reach 130% in the next 3 years
e summ
ary
7
p p @*SPE 2P reserves are entitlement based, while recoverable resource potential is working interest based.* MOL estimate
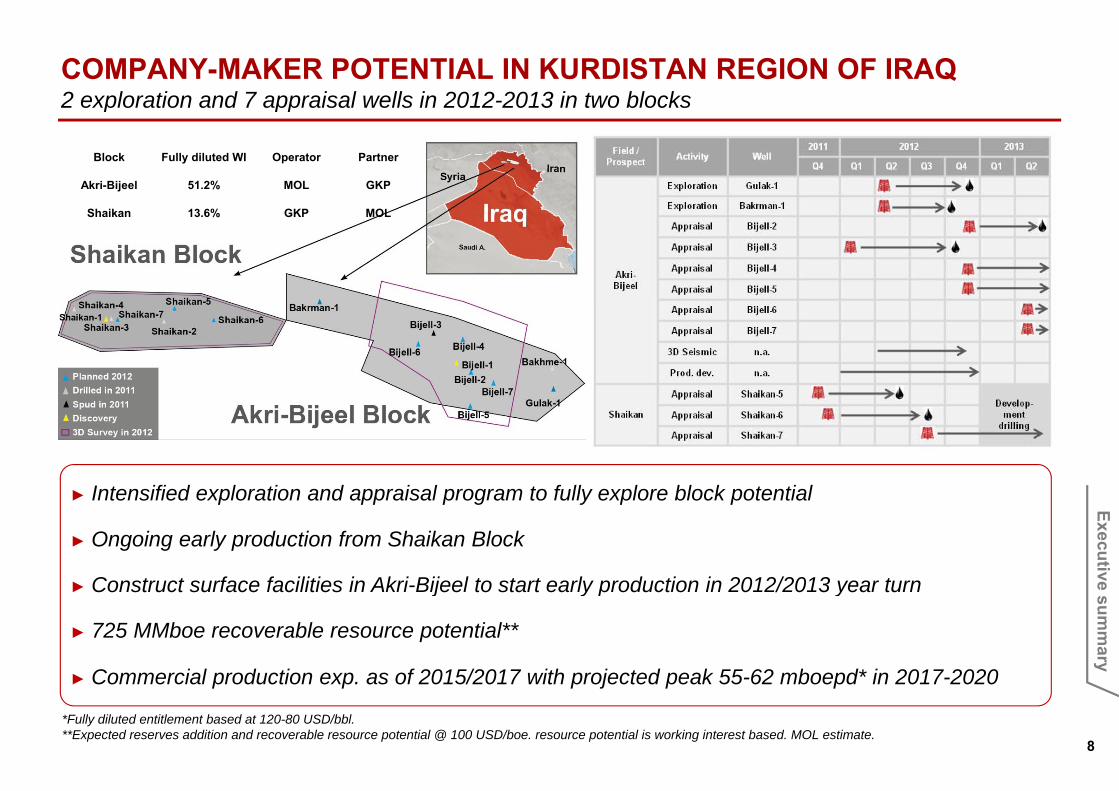
COMPANY-MAKER POTENTIAL IN KURDISTAN REGION OF IRAQ 2 exploration and 7 appraisal wells in 2012-2013 in two blocks2 exploration and 7 appraisal wells in 2012 2013 in two blocks
Block Fully diluted WI Operator Partner
Akri-Bijeel 51.2% MOL GKP
Shaikan 13.6% GKP MOL
► Intensified exploration and appraisal program to fully explore block potential
Largest contributors
► Intensified exploration and appraisal program to fully explore block potential
► Ongoing early production from Shaikan Block
► Construct surface facilities in Akri-Bijeel to start early production in 2012/2013 year turn
ExecutiveLargest contributors ► Construct surface facilities in Akri Bijeel to start early production in 2012/2013 year turn
► 725 MMboe recoverable resource potential**
► Commercial production exp. as of 2015/2017 with projected peak 55-62 mboepd* in 2017-2020
e summ
ary
8
p p p j p p
*Fully diluted entitlement based at 120-80 USD/bbl.**Expected reserves addition and recoverable resource potential @ 100 USD/boe. resource potential is working interest based. MOL estimate.
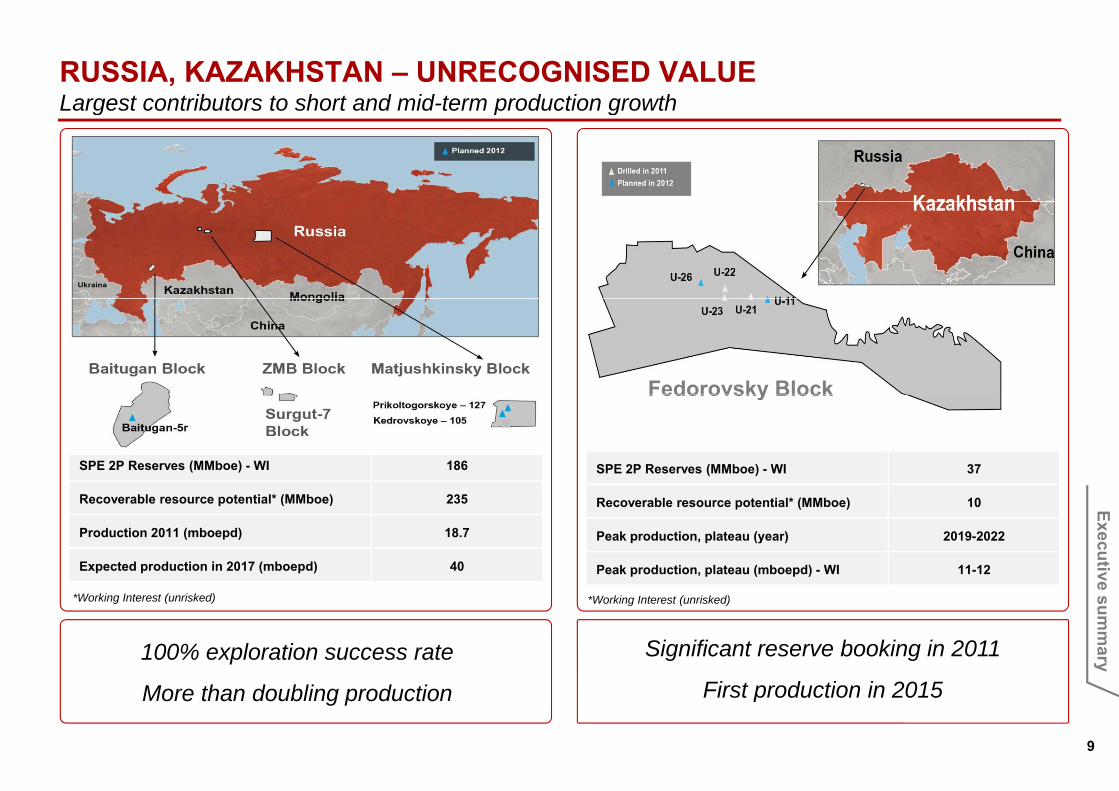
RUSSIA, KAZAKHSTAN – UNRECOGNISED VALUE Largest contributors to short and mid-term production growthLargest contributors to short and mid-term production growth
Largest contributors Fedorovsky Block
SPE 2P Reserves (MMboe) - WI 37SPE 2P Reserves (MMboe) - WI 186
Fedorovsky Block
Recoverable resource potential* (MMboe) 10
Peak production, plateau (year) 2019-2022
Peak production, plateau (mboepd) - WI 11-12
Recoverable resource potential* (MMboe) 235
Production 2011 (mboepd) 18.7
Expected production in 2017 (mboepd) 40
Executive
Largest contributors Largest contributors 100% exploration success rate
M th d bli d ti
*Working Interest (unrisked)
Significant reserve booking in 2011
First production in 2015
*Working Interest (unrisked)
e summ
ary
9
More than doubling production First production in 2015
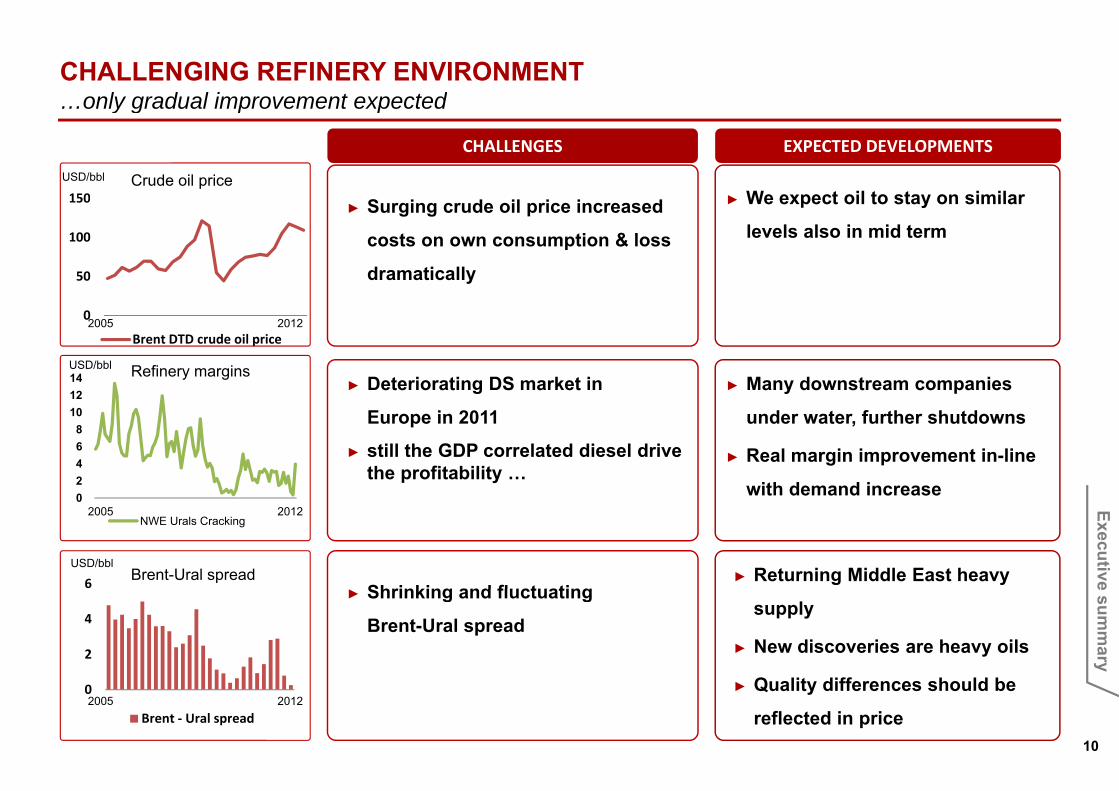
CHALLENGING REFINERY ENVIRONMENTonly gradual improvement expected…only gradual improvement expected
150
USD/bbl
S i d il i i d ► We expect oil to stay on similarCrude oil price
CHALLENGES EXPECTED DEVELOPMENTS
50
100
150► Surging crude oil price increased
costs on own consumption & loss
dramatically
► We expect oil to stay on similar
levels also in mid term
► Deteriorating DS market in 1214 Refinery marginsUSD/bbl
► Many downstream companies
0
Brent DTD crude oil price2005 2012
► still the GDP correlated diesel drive the profitability …
Europe in 2011
2468
1012
under water, further shutdowns
► Real margin improvement in-line
with demand increase0
NWE Urals Cracking
with demand increase
Shrinking and fluctuating► Returning Middle East heavy 6 Brent-Ural spread
USD/bbl
2005 2012 Executive
► Shrinking and fluctuating
Brent-Ural spread supply
► New discoveries are heavy oils
► Quality differences should be0
2
4
e summ
ary
10
► Quality differences should be
reflected in price0
Brent ‐ Ural spread2005 2012

DEMAND SUFFERS FROM ECONOMIC CRISIS, BUT…long term growth potential remains in the region…long term growth potential remains in the region
Gasoline demand changein %
SHORT TERM CRISIS EFFECT LONG TERM POTENTIAL REMAINS
Car penetration curve
► GRADUAL 500
600
700
800
ItalyFrance
AustriaGermany
C h RPoland
1,00
0 in
habi
tant
5
10
15
Gasoline demand changein % Car penetration curve
► Regional car penetration is still well bellow EU
IMPROVEMENT IN DIESEL PER CAPITA COMSUMPTION WITH
GDP GROWTH0
100
200
300
400 Czech Rep.
SlovakiaCroatia
RussiaRomania
Serbia
China
PakistanIndia HUNGARY
Car
s pe
r
10
-5
0
5average
► Room for additional gasoline demand
Hungary
0 5000 10000 15000 20000 25000 30000 35000 40000 45000
GDP per Capita (PPP in USD)
700
-102005 2006 2007 2008 2009 2010 2011
Domestic markets CEE region
Diesel demand changein % Diesel consumption per capita
300400500600700
5
10
15 ► GDP growth potential of the region remains
liter
/ ca
pita
Executive
0100200
-5
0
5
Domestic markets CEE region
► Significant additional diesel demand is expected in the CEE
e summ
ary
11
CEE North West Europe-102005 2006 2007 2008 2009 2010 2011
Domestic markets CEE region
Source: Woodmac and MOL estimates.

INCREASE EFFICIENCY AND IMPROVE PROFITABILITY by optimization of assets and processes on Group level…by optimization of assets and processes on Group level
Reinforce Regional Downstream by utilising all
I.) Value Chain Optimization
► Improved crude selection
O d d d ti i fi isynergies of integrated operation
► On demand production in refineries
► Maintain petrochemical integration
Net Cash Margin ranking of European refineries*(2010)
Bratislava8
II.) Asset Management
► Selective organic growth projects: Butadiene, LDPE, Rijeka
► Improve or reshape less efficient assets (Croatian downstream, IES)
L i ti & R t il t k ti i ti t ti k t
2
4
6
8Danube
RijekaMantova
► Logistics & Retail network optimization to serve captive market
► Focus on Energy Management to reduce OPEX
‐4
‐2
0
SisakIII.) Market management
► Make or buy – own production vs local purchase
► Capture additional sales margin with higher wholesale &retail *Source: Woodmac.
Executive
IV.) Resource and process efficiency
► Comprehensive efficiency programAim to reach break even ti i C ti till 2014
e summ
ary
12
► Decrease OPEX via process optimizationoperation in Croatia till 2014
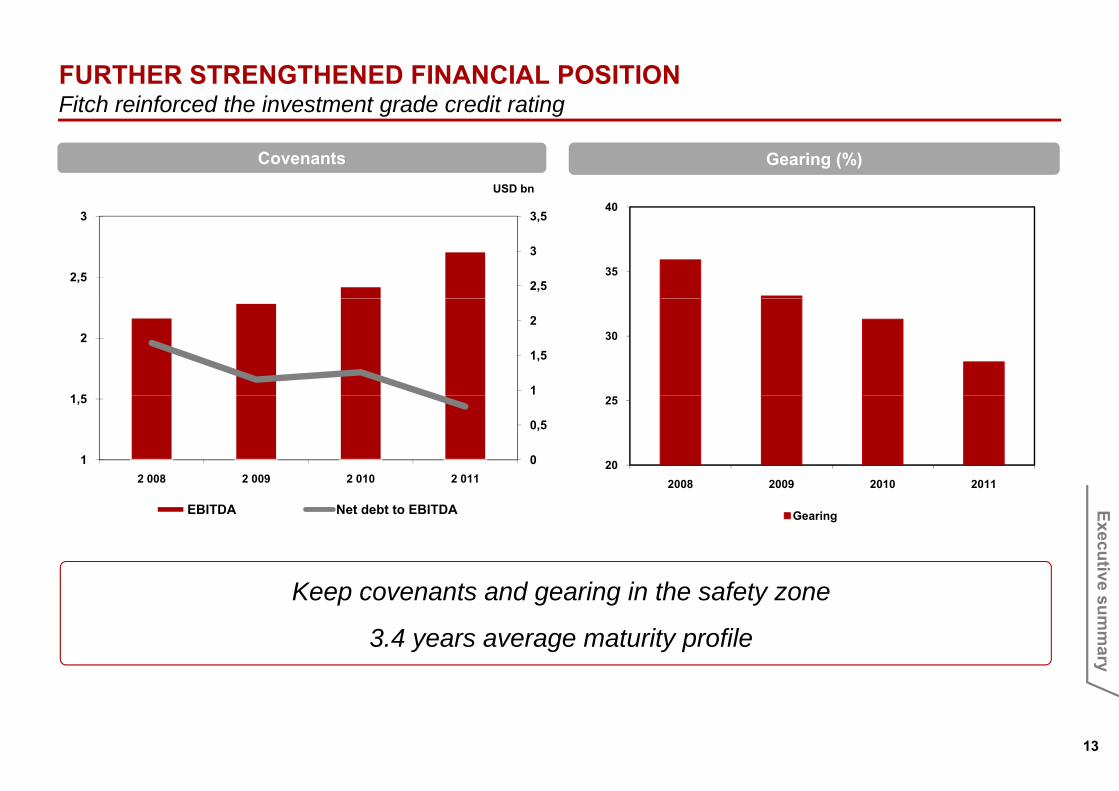
FURTHER STRENGTHENED FINANCIAL POSITIONFitch reinforced the investment grade credit rating
Covenants
Fitch reinforced the investment grade credit rating
USD bn
Gearing (%)
2,5
3
3,5
2,5
3
35
40
1
1,5
2
1 5
2 30
0
0,5
1
1,5
2 008 2 009 2 010 2 01120
25
2008 2009 2010 2011
EBITDA Net debt to EBITDA
Keep covenants and gearing in the safety zone
Gearing
Executive
Largest contributors Keep covenants and gearing in the safety zone
3.4 years average maturity profile
e summ
ary
13

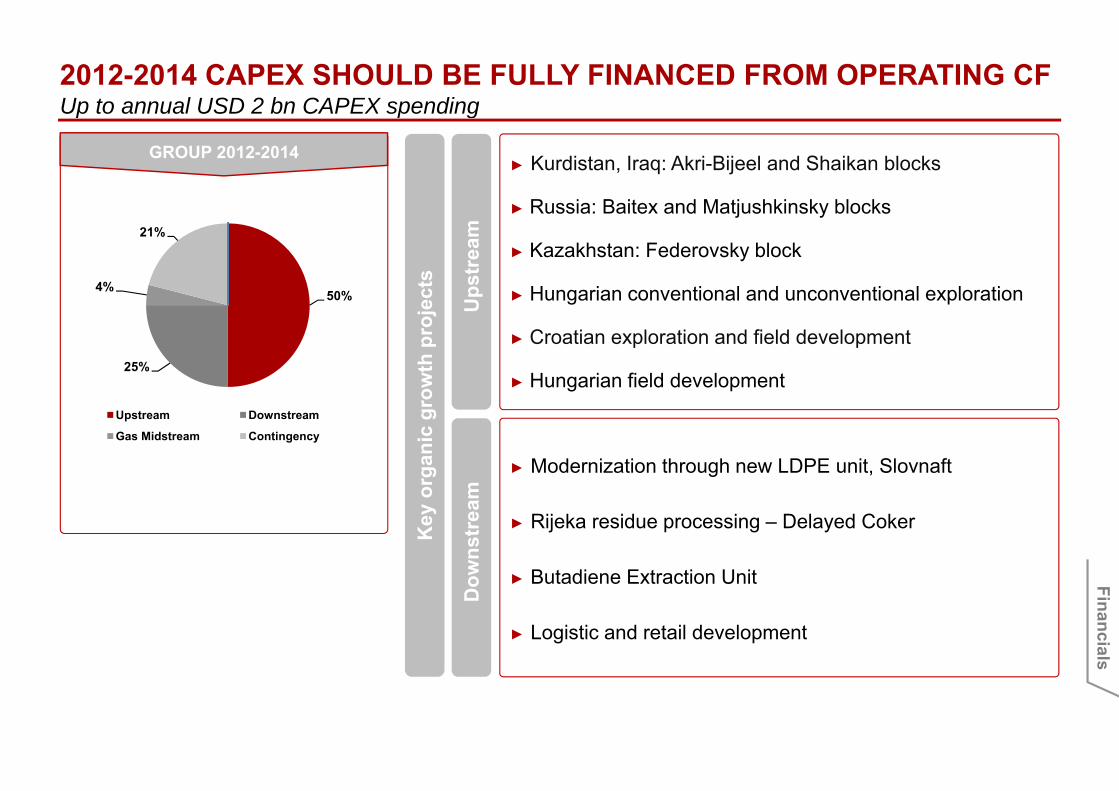
2012-2014 CAPEX SHOULD BE FULLY FINANCED FROM OPERATING CFUp to annual USD 2 bn CAPEX spending
► Kurdistan, Iraq: Akri-Bijeel and Shaikan blocks
R i B it d M tj hki k bl k
GROUP 2012‐2014
Up to annual USD 2 bn CAPEX spending
► Russia: Baitex and Matjushkinsky blocks
► Kazakhstan: Fedorovsky block
► Hungarian conventional and unconventional explorationpstr
eam
50%4%
21%
cts
► Hungarian conventional and unconventional exploration
► Croatian exploration and field development
► Hungarian field development
U50%
25%
owth
pro
je
m► Modernization through new LDPE unit, Slovnaft
Upstream Downstream
Gas Midstream Contingencyor
gani
c gr
o
Dow
nstr
eam
► Rijeka residue processing – Delayed Coker
► Butadiene Extraction Unit
Key
o Executive
D
► Logistic and retail development
e summ
ary
14

MOL is committed to Sustainable DevelopmentSUSTAINABILITY IS A TOP PRIORITY IN MOL GROUPThe only CEE company in Dow Jones Sustainability Index
position taken among European refineries in CO2-efficiency*Top 20% Climate Change
The only CEE company in Dow Jones Sustainability Index
decrease in lost-time injury frequency (LTIF) since 200644%Health & Safety
teams from 62 countries participated in MOL’s online competition aiming to attract best talents596Human Capital
recycling/reuse rate achieved in waste management 56%Environment
mn USD social investment projects in 2010 to supportlocal communities in the field of education, health, environment and culture~10Communities
Executive
average customer satisfaction level in Wholesalein core markets89%Economic sustainability
e summ
ary
15*excluding INA’s refineries
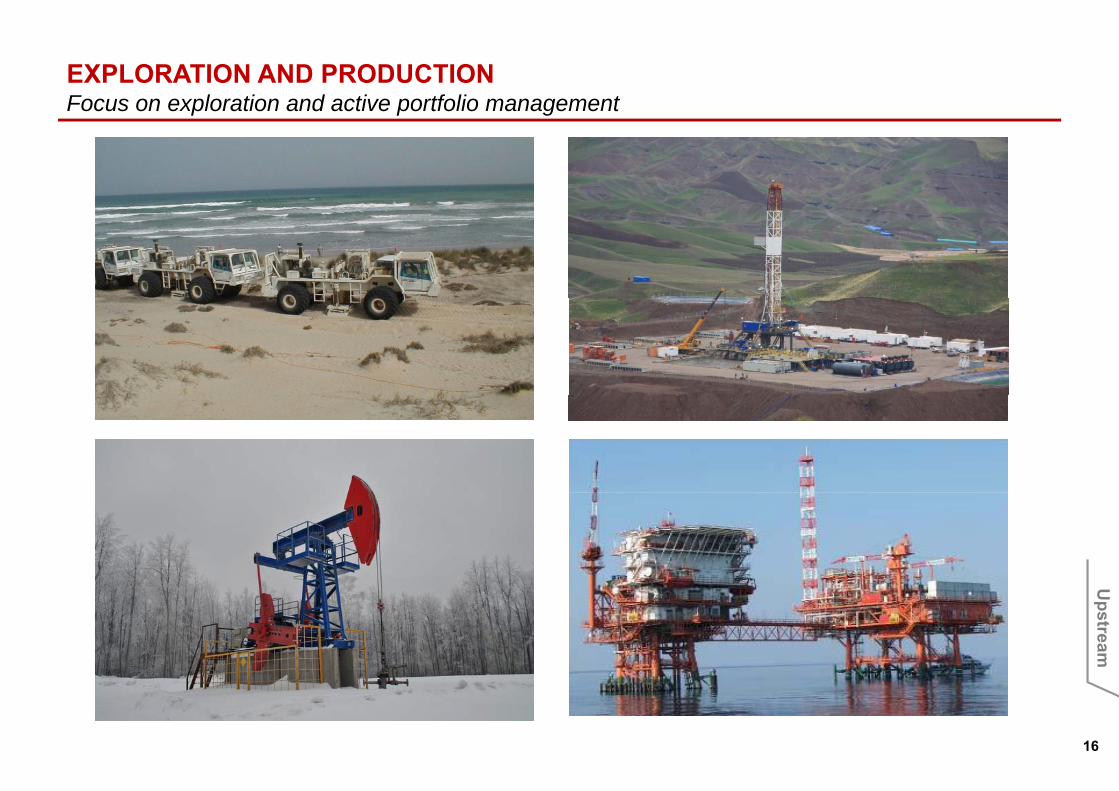
EXPLORATION AND PRODUCTIONFocus on exploration and active portfolio managementFocus on exploration and active portfolio management
Upstream
16

UPSTREAM – 75 YEARS EXPERIENCE AND OUTSTANDING EXPLORATION SUCCESS RATECompetitive advantagesCompetitive advantages
KEY STRENGTHS TO BUILD UPON
► Promising E&P portfolio
OUTSTANDING EXPLORATION SUCCESS RATE (2008-2011)
35No. of wells
► Organic growth on existing exploration portfolio
► Proven track record in successful portfolio development and project execution
1015202530
67%60%
► Leading European low cost on-shore producer
► MOL and INA complementary skill base
1930 1940 1950 1960 1970 1980 1990 201020092008200720062005
05
CEE InternationalTotal drillings Successful drilling
2011
Predeccessor of MOL started to explore hydrocarbons in the begining of 1930’ in Hungary
Using EOR/IOR techniques since 1970
1930 1940 1950 1960 20021970 1980 1990 201020092008200720062005 2011
First international production (Kazakhstan, 1993)
MOL built up a sizeable international portfolio
Increased multinational E&P portfolioIncreased multinational E&P portfolioand workforce with INA
Major project execution: the consortium, led by MOL provide 7-8% gas consumption of Pakistan
Major discoveries in Kurdistan Region of Iraq and Kazakhstan(2008-2010)
Upstream
1717
( )
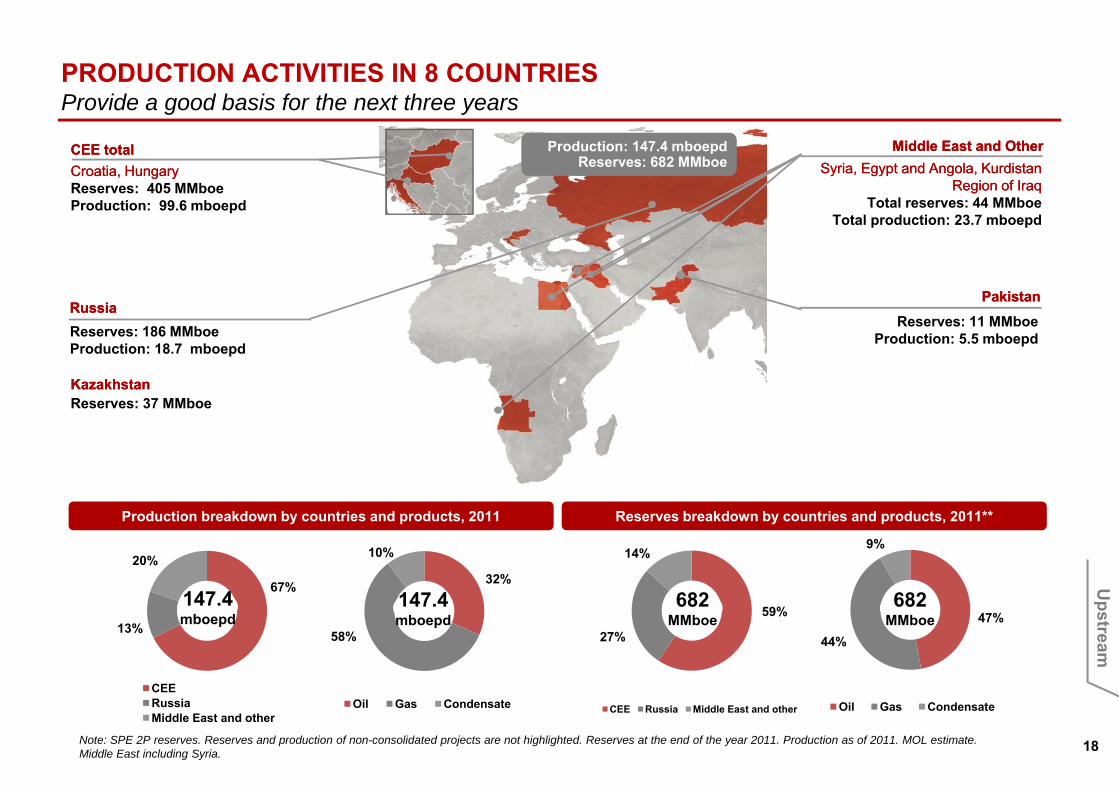
PRODUCTION ACTIVITIES IN 8 COUNTRIES Provide a good basis for the next three yearsProvide a good basis for the next three years
Croatia, HungaryCroatia, HungaryReserves: 405 MMboeP d ti 99 6 b d
CEE CEE totaltotal MiddleMiddle EastEast and and OtherOtherSyriaSyria, , EgyptEgypt and Angola, and Angola, KurdistanKurdistan
RegionRegion of of IraqIraqTotal reserves: 44 MMboe
Production: 147.4 mboepdReserves: 682 MMboe
Production: 99.6 mboepd
PakistanPakistan
Total reserves: 44 MMboeTotal production: 23.7 mboepd
Reserves: 186 MMboeProduction: 18.7 mboepd
Reserves: 11 MMboeProduction: 5.5 mboepd
PakistanPakistanRussiaRussia
KazakhstanKazakhstanReserves: 37 MMboe
Production breakdown by countries and products, 2011 Reserves breakdown by countries and products, 2011**
9%
67%
20%32%
10% 14%
47%
44%
67%
13%
CEE
58%
59%
27%
147.4mboepd
147.4mboepd
682MMboe
682MMboe
Upstream
18Note: SPE 2P reserves. Reserves and production of non-consolidated projects are not highlighted. Reserves at the end of the year 2011. Production as of 2011. MOL estimate.Middle East including Syria.
Oil Gas CondensateCEERussiaMiddle East and other
Oil Gas Condensate CEE Russia Middle East and other

1,4 BBOE* EXPLORATION POTENTIAL OF CURRENT ASSETSto secure organic mid-term growth
KazakhstanKazakhstan
RussiaRussia
to secure organic mid-term growthCEE onshore, offshore, CEE onshore, offshore, unconventionalunconventional
Matjushkinskiy, Surgut-7, Baitex BlocksHungary, Croatia, RomaniaHungary, Croatia, Romania
245280
KazakhstanKazakhstan
PakistanPakistan
Fedorovskoye Block
T l K k M l &Kurdistan Region of IraqKurdistan Region of Iraq 40
725 Tal, Karak, Margala & Margala North Blocks
Other InternationalOther International
Egypt Syria CameroonEgypt Syria Cameroon
Akri-Bijeel, Shaikan Blocks
110
725
Egypt, Syria, CameroonEgypt, Syria, Cameroon, , Angola, OmanAngola, Oman
Estimated recoverable resource potential*MMboe
Increasing exploration activity with new focus areas Recoverable resource potential*, MMboe (2012-2014)
USD mn Exploration CAPEXExploration CAPEX
160180200
1200
1500
20406080
100120140
0
300
600
900M
Mbo
e Upstream
19*Working Interest (unrisked). Exploration potential of current assets at the end of 2011.
02000 2001 2002 2003 2004 2005 2006 2007 2008 2009 2010 2011
International Hungary
0Kurdistan CEE CIS Pakistan Other Total Resources

UPSTREAM - POSITIONING AS A STRONG GROWTH PILLAR OF MOL GROUP Exploration-led strategy increasing reserve and maintaining production at elevated levelsExploration-led strategy, increasing reserve and maintaining production at elevated levels
I.) Dynamic exploration strategy
► Competency based target setting
IV.) Active management of the portfolio
► Most of our existing prospects will be drilled within three years
► Opening towards higher impact elements, aiming to add further elements to the portfolio
► a geographically and life-cycle-wise
► Continuous monitoring of inorganic growth opportunities
DevelopmentAA
SSP TP T
KZKZKKSS KAKA
CEE – Exploration Russian exploration (M)
Pakistan – Karak block
Kurdistan Region of Iraq – Akri Bijeel block
CECERDRD
EBITDA
CAPEX
P P AA
RERE
Discovery
Appraisal
MaturityOO
KKAA R R OO ZMBZMB
KZKZ
The majority of value creation RERE
P TP T
Kurdistan Region of Iraq – SShaikan block
Pakistan – Tal block
Russia – MOL’s operated portfolio
Kazakhstan
R R OO
KZKZ
KSKSUpstream cash cycleP P AA
CECE
j yhappens in exploration phase however the risk is also higher.
Dominantly geological, technical, political risks during the different phases
while marketability risk also appears
Time
AA
OO
ZMBZMB
Kazakhstan
Russia Development – Matyushinsky, Baitex
Russia – ZMB
CEE Onshore production
CEE Adriatic offshore
RDRD
y ppTime
SS Syria – Hayan block
III.) Focus on field development with short-term impactII.) Transforming of existing exploration assets to
production in the mid term
Upstream
2020
production in the mid-term

OVER 200% RRR: 117 MMBOE RESERVES* BOOKED IN 2011Broader set of core countries Russia KazakhstanBroader set of core countries – Russia, Kazakhstan
Breakdown of reserves increase in 2011*/***Breakdown of reserves**
120
140(MMboe)
67%
20%
147.4mboepd
80
10013%
p
40
609%
CEE Russia Middle East and other
0
20
40
47%
44%0
CEE Russia Kazakhstan Total
*Key additions were audited by noted auditors: DeGolyer and MacNaughton
Oil Gas Condensate
Upstream
21
**Middle East including Syria***MOL estimate

2012 PRODUCTION: 135 MBOEPD, IN NORMAL BUSINESS ENVIRONMENT3-4% production growth from 20143 4% production growth from 2014
Total hydrocarbon production by countries (mboepd)* Total hydrocarbon production by products (boepd)*
150 150150 150
100 100
50 50
-2012 2013 2014
02012 2013 2014
CEE Russia Middle East and other Oil Gas Condensate
Largest contributors Short term growth is expected from Russia
Upstream
22
*Middle East including Syria
ADDITIONAL RESERVE GROWTH FROM 1.4 BBOE RESOURCE*Supporting long term growthSupporting long term growth
Recoverable Resource Potential*, WI (MMboe), SPE 2P SPE 2P reserves* (MMboe) – 2012-2014
900
1500
1800
600
900
1200
300
300
600
02P Reserves (2011) Expected
productionReserve addition
expectation
0SPE 2P RRP
Largest contributors RRR could reach 130% in the next 3 years
Upstream
23
*Expected reserves addition and recoverable resource potential @ 100 USD/boe. *SPE 2P reserves are entitlement based, while recoverable resource potential is working interest based.* MOL estimate

KEY UPSTREAM PROJECTS
Upstream
24
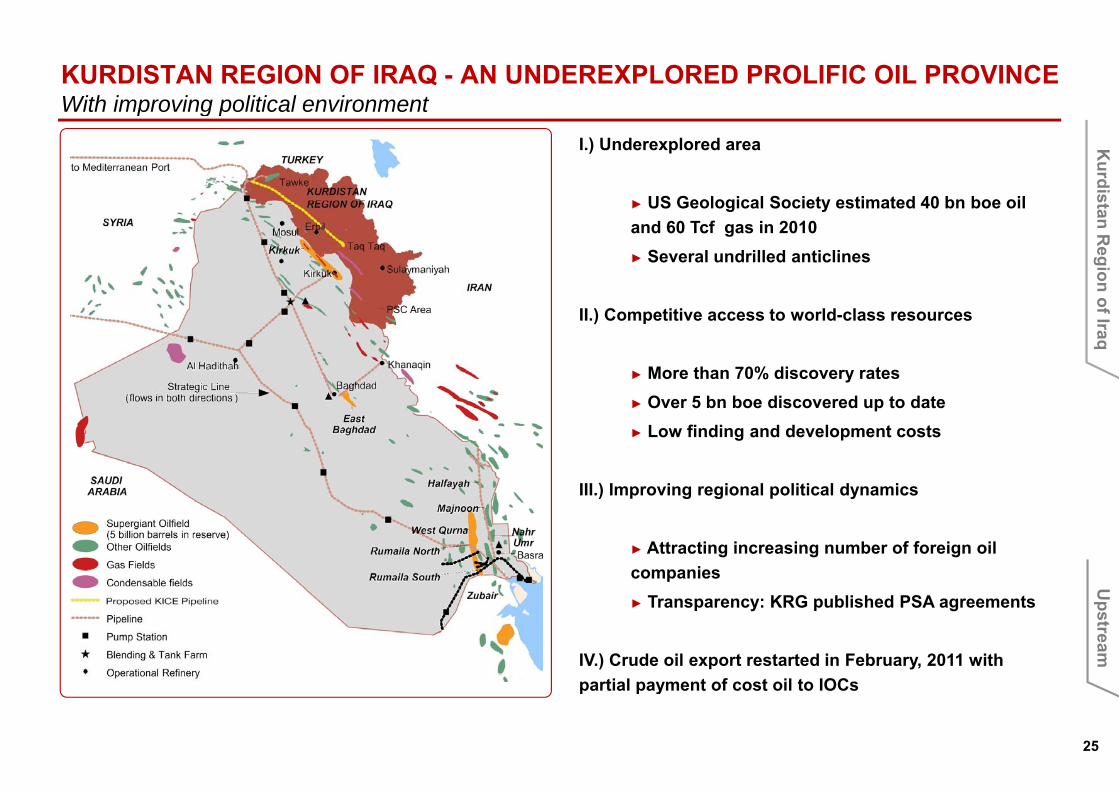
KURDISTAN REGION OF IRAQ - AN UNDEREXPLORED PROLIFIC OIL PROVINCE With improving political environmentWith improving political environment
I.) Underexplored area
► US Geological Society estimated 40 bn boe oil
Kurdis
► US Geological Society estimated 40 bn boe oil and 60 Tcf gas in 2010► Several undrilled anticlines
stanR
egion o
II.) Competitive access to world-class resources
► More than 70% discovery rates
of Iraq
► Over 5 bn boe discovered up to date► Low finding and development costs
III ) Improving regional political dynamicsIII.) Improving regional political dynamics
► Attracting increasing number of foreign oil companies ► Transparency: KRG published PSA agreements
IV.) Crude oil export restarted in February, 2011 with partial payment of cost oil to IOCs
Upstream
25
partial payment of cost oil to IOCs
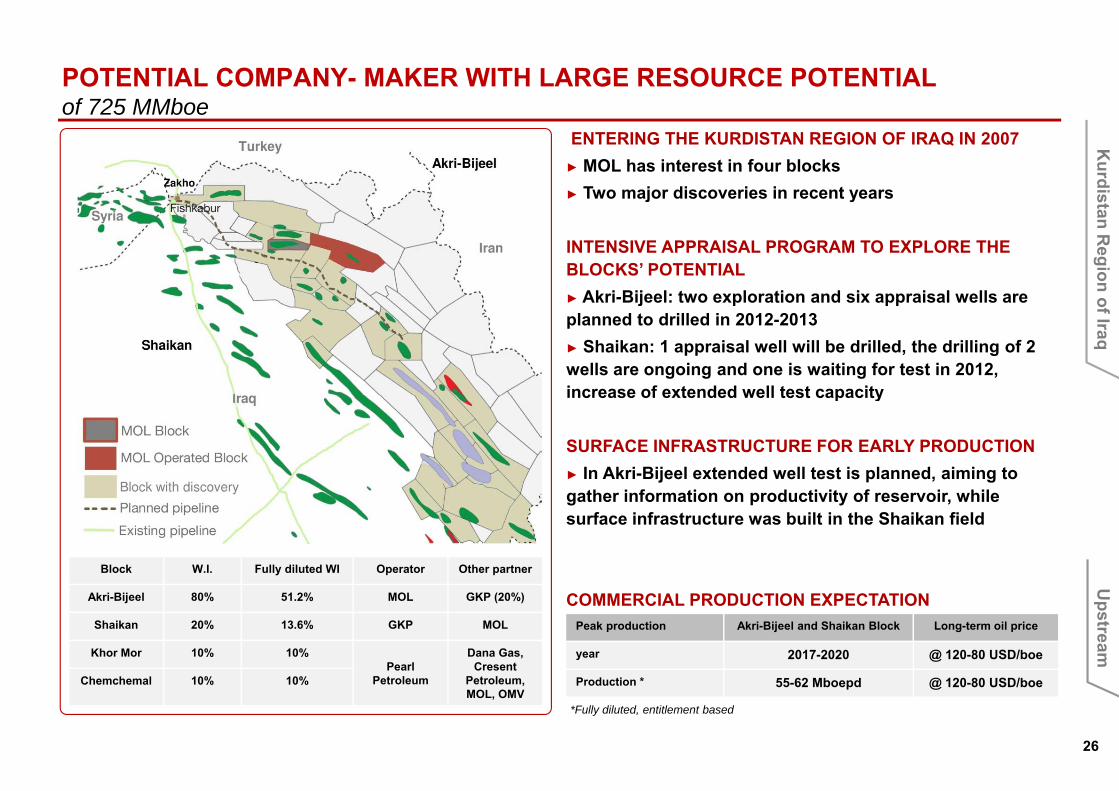
POTENTIAL COMPANY- MAKER WITH LARGE RESOURCE POTENTIALof 725 MMboeof 725 MMboe
ENTERING THE KURDISTAN REGION OF IRAQ IN 2007► MOL has interest in four blocks► Two major discoveries in recent years
Kurdisj y
INTENSIVE APPRAISAL PROGRAM TO EXPLORE THE BLOCKS’ POTENTIAL► Akri-Bijeel: two exploration and six appraisal wells are
stanR
egion o► Akri-Bijeel: two exploration and six appraisal wells areplanned to drilled in 2012-2013► Shaikan: 1 appraisal well will be drilled, the drilling of 2 wells are ongoing and one is waiting for test in 2012, increase of extended well test capacity
of Iraq
increase of extended well test capacity
SURFACE INFRASTRUCTURE FOR EARLY PRODUCTION► In Akri-Bijeel extended well test is planned, aiming to
th i f ti d ti it f i hilgather information on productivity of reservoir, while surface infrastructure was built in the Shaikan field
Block W.I. Fully diluted WI Operator Other partner
COMMERCIAL PRODUCTION EXPECTATIONAkri-Bijeel 80% 51.2% MOL GKP (20%)
Shaikan 20% 13.6% GKP MOL
Khor Mor 10% 10%Pearl
Petroleum
Dana Gas, Cresent
Petroleum, Chemchemal 10% 10%
Peak production Akri-Bijeel and Shaikan Block Long-term oil price
year 2017-2020 @ 120-80 USD/boe
Production * 55-62 Mboepd @ 120-80 USD/boe
Upstream
26
,MOL, OMV
55 62 Mboepd @ 120 80 USD/boe
*Fully diluted, entitlement based

TWO MAJOR DISCOVERIES IN THE LAST YEARS Shaikan and Akri Bijeel
HIGHLIGHTS
► In 2010 the Bijell-1 exploratory well showed very promising case hole test results from Jurassic formations with a daily test production of 3,700barrels of oil and 100 boe of gas, which gave the Group the prospect of a fields with an in place volume of 2.4 billions of barrels (OIIP).
Shaikan and Akri Bijeel
Kurdis
► The Shaikan Block is the scene of intense drilling after the discovery in 2009 of several billion barrels’ worth of heavy oil-in-place.
► After the discoveries was announced, the Kurdistan Regional Government gave permission to start the appraisal program of the fields.
stanR
egion o
SHAIKAN-1 BIJELL-1 SHAIKAN-3 SHAIKAN-2 BEKHME-1 SHAIKAN-4
SHAIKAN-5
SHAIKAN-6
► The preparation works for Extended well test were started in October 2010 for Shaikan discovery, and in 2011 for the Bijell-1 discovery.
of Iraq
1000m
SPUD27 April,
2009
SHAIKAN DISCOVERYAugust, 2009
2009 2010 2011
SPUD11 December,
2009
BIJELLDISCOVERYMarch, 2010
SPUD2 September,
2010
SPUD1 December,
2010
SPUD23 March,
2011
SPUD21 May,
2011
SPUDOct, 2011
SPUDDec, 2011
2000m
3000m
4000m
TOTAL DEPTH2,950m
November, 2009
TOTAL DEPTH1,518m
December, 2010
TOTAL DEPTH EXPECTED EST. EST.
MILESTONES
5000mTOTAL DEPTH
4,377mNovember, 2010
O3,300m
August, 2011TOTAL DEPTH
5,000mOctober ,2011
CTD:
3,400m
STD:
3,500m
STD:
3,800m
Upstream
27
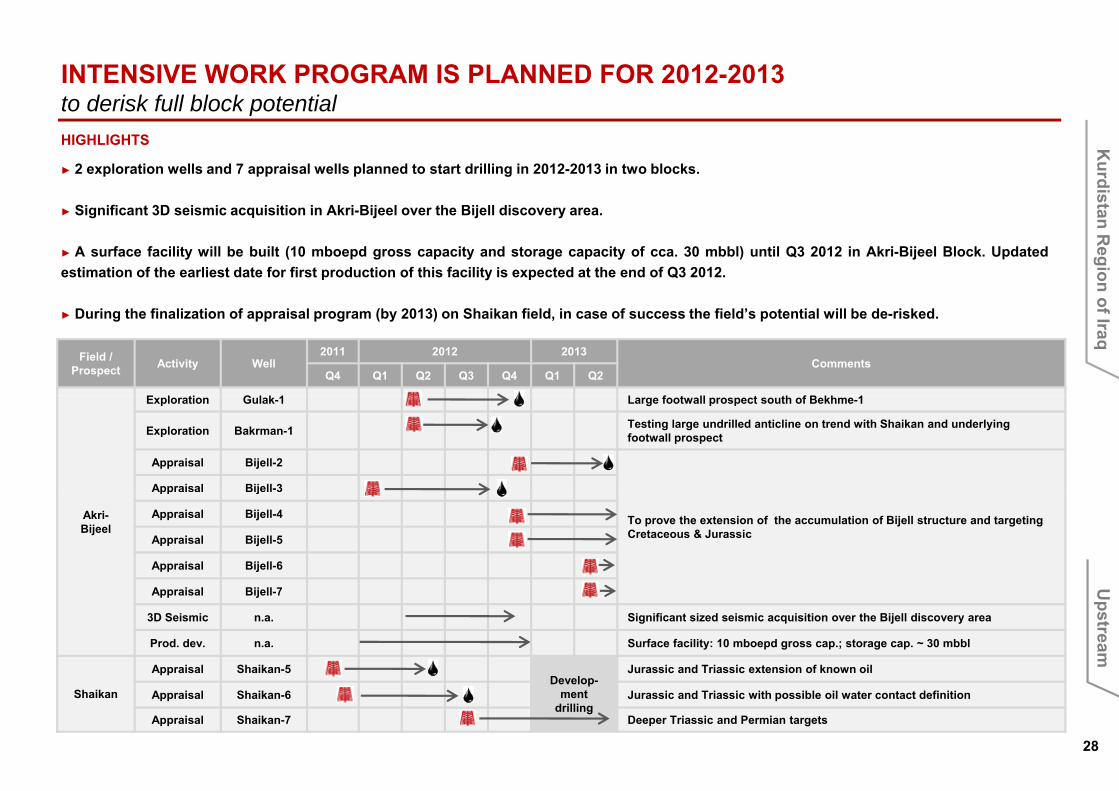
INTENSIVE WORK PROGRAM IS PLANNED FOR 2012-2013 to derisk full block potentialto derisk full block potentialHIGHLIGHTS
► 2 exploration wells and 7 appraisal wells planned to start drilling in 2012-2013 in two blocks.
Kurdis
► Significant 3D seismic acquisition in Akri-Bijeel over the Bijell discovery area.
► A surface facility will be built (10 mboepd gross capacity and storage capacity of cca. 30 mbbl) until Q3 2012 in Akri-Bijeel Block. Updatedestimation of the earliest date for first production of this facility is expected at the end of Q3 2012.
stanR
egion o
Field / Prospect Activity Well
2011 2012 2013Comments
Q4 Q1 Q2 Q3 Q4 Q1 Q2
► During the finalization of appraisal program (by 2013) on Shaikan field, in case of success the field’s potential will be de-risked.
of Iraq
Exploration Gulak-1 Large footwall prospect south of Bekhme-1
Exploration Bakrman-1 Testing large undrilled anticline on trend with Shaikan and underlying footwall prospect
Appraisal Bijell-2
Appraisal Bijell-3
Akri-Bijeel
To prove the extension of the accumulation of Bijell structure and targeting Cretaceous & Jurassic
pp j
Appraisal Bijell-4
Appraisal Bijell-5
Appraisal Bijell-6
A i l Bij ll 7Appraisal Bijell-7
3D Seismic n.a. Significant sized seismic acquisition over the Bijell discovery area
Prod. dev. n.a. Surface facility: 10 mboepd gross cap.; storage cap. ~ 30 mbbl
Appraisal Shaikan-5Develop-
Jurassic and Triassic extension of known oil
Upstream
28
Shaikanp
ment drilling
Appraisal Shaikan-6 Jurassic and Triassic with possible oil water contact definition
Appraisal Shaikan-7 Deeper Triassic and Permian targets

PLANNED WORK PROGRAM FOR 2012PLANNED WORK PROGRAM FOR 2012
Kurdisstan
Region oof Iraq
Upstream
29
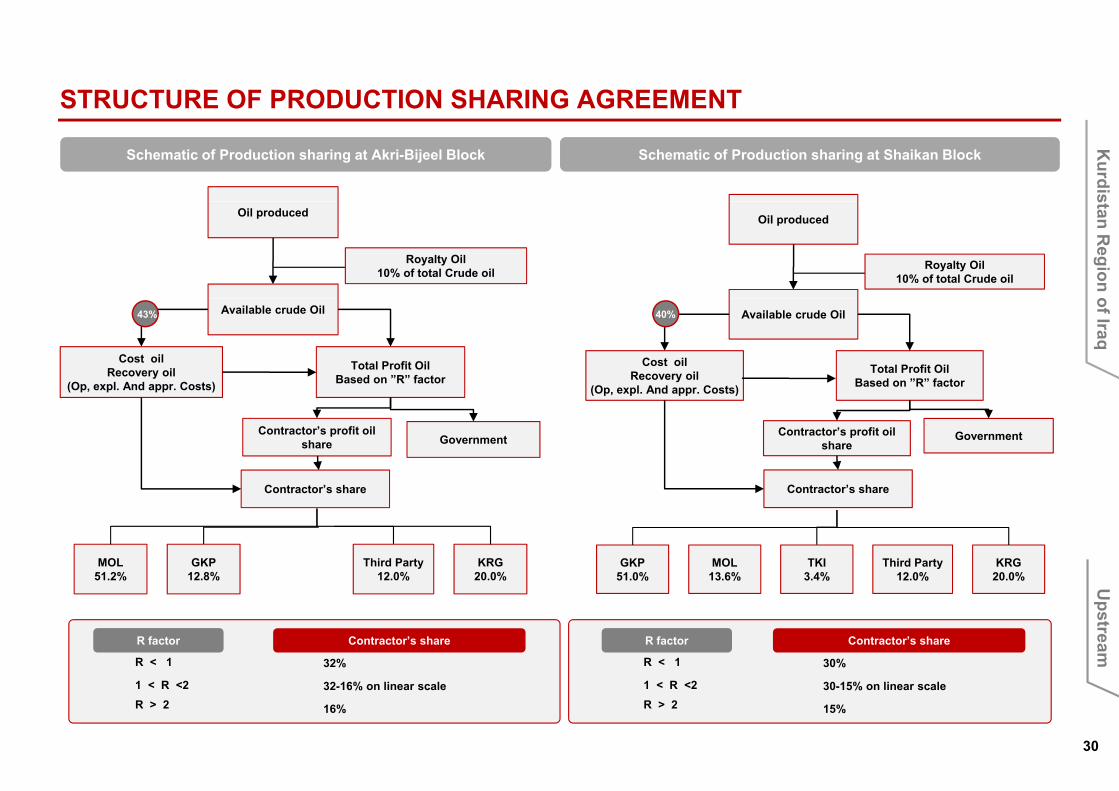
STRUCTURE OF PRODUCTION SHARING AGREEMENTSTRUCTURE OF PRODUCTION SHARING AGREEMENT
Schematic of Production sharing at Akri-Bijeel Block Schematic of Production sharing at Shaikan Block
Kurdis
Oil produced
Royalty Oil10% of total Crude oil
Oil produced
Royalty Oil10% of total Crude oil
stanR
egion o
Available crude Oil
Cost oilRecovery oil
(Op, expl. And appr. Costs)
Total Profit OilBased on ”R” factor
Available crude Oil
Cost oilRecovery oil
(Op, expl. And appr. Costs)
Total Profit OilBased on ”R” factor
43% 40%
of Iraq
Contractor’s profit oil share Government
( p, p pp )
Contractor’s profit oil share
Government
Contractor’s share Contractor’s share
MOL51.2%
GKP12.8%
Third Party12.0%
KRG20.0%
GKP51.0%
MOL13.6%
TKI3.4%
Third Party12.0%
KRG20.0%
Contractor s share Contractor s share
Contractor’s shareR factor
R < 1 30%
1 < R <2 30 15% on linear scale
Contractor’s shareR factor
R < 1 32%
1 < R <2 32 16% on linear scale
Upstream
30
1 < R <2 30-15% on linear scale
15%R > 21 < R <2 32-16% on linear scale
16%R > 2

RUSSIA – CORE COUNTRY WITH SHORT AND MID TERM PRODUCTION GROWTHIntensive work program in the coming yearsIntensive work program in the coming years
EXPERIENCES► Primary target region: Volga-Ural, Western Siberia►10 years experience ensures technical capability in field development-rejuvenation and exploration
FOUR BLOCKS IN DIFFERENT PROJECT PHASES –SIGNIFICANT UNDEVELOPED RESOURCE/RESERVE
► ZMB: developed field (mature) cash cow”
Russia
► ZMB: developed field (mature) – „cash-cow”► Baitugan field: under development – low risk, exploration► Matyushkinsky block: under development and intensive exploration
2P reserves (2011): 186 MMboeProduction (2011): 18.7 mboepd
intensive exploration► Surgut-7: exploration block
INTENSIFICATION OF PRODUCTION ( ) p
Estimated recoverable resource potential: 235 MMboeExpected production in 2017: 40 mboepd
OPERATIONAL COST REDUCTION
POSITIVE CHANGE IN LEGISLATION (60/66)Block W.I. Operator Other partner
ZMB 50% Russneft MOL (50%) 2012-2014► Our plan to spend USD 150-200 mn CAPEX yearly for field development and exploration.► It is expected that MOL will drill yearly 50-60 production and injection wells and yearly 2 3 exploration wells in the
ZMB 50% Russneft MOL (50%)
Baitugan 100% MOL -
Matjushkinsky 100% MOL -
Surgut-7 100% MOL -
Upstream
31
and injection wells and yearly 2-3 exploration wells in the next 3 years*Working Interest (unrisked)

MATYUSHINSKY BLOCK Exploration upside: 7 10 prospects
BAITEX BLOCKSignificant reserves accessible for production
Russia
Legend
Oil field
Block boundary
Exploration upside: 7-10 prospects Significant reserves accessible for production
RussiaOil pipeline
Gas pipeline
Transneft pipeline
Russia
The Komalkariver
Road
0 10 20 30 40 50km
0 10 20 30 miles
Baitugan FieldBaitugan OTU
The Baltuganriver
Acquired by MOL plc in Dec, 2006Operator : MOL, 100%2P reserves: 112 MMbbl (2011)2011 production: 4.8 mboepdOil quality: 26 0 API
Acquired by MOL plc in April, 2007Operator: MOL, 100%2P reserves: 28 MMbbl (2011)2011 production: 3.3 mboepdOil quality: 34 0 API
Planned pipeline in 2012 (40km)Further pipeline construction
Central Processing StationTransneft pipeline is located 90 km from the Central Processing Station.
Transneft pipeline is located on Western part of the field, The field is connected tothe oil pipeline .
Oil wellOil gathering unit
License area border
Transneft pipeline
Upstream
32
Oil quality: 26 API
Area: Western Siberia, with sizable acreage (3,200 km2) Area: Volga-Ural region (70 km2)
Oil quality: 34 API g

MATYUSHINSKY BLOCK Exploration upside: 7 10 prospects
BAITEX BLOCKSignificant reserves accessible for productionExploration upside: 7-10 prospects
COMPLEX BLOCK► Sizeable acreage► Producing assets: 46 production and 8 injection wells in two fields► However in recent years MOL found three oil fields and identified 7-10
INTENSIVE DEVELOPMENT RESULTED RESERVES BOOKING► An intense construction and investment program was launched in 2007 with the goal of fully rehabilitating the field (more than 200 production and injection wells)
Significant reserves accessible for production
► However in recent years MOL found three oil fields and identified 7 10 prospects which will be further explored in the next years
INTENSIVE DEVELOPMENT TO RAMP UP PRODUCTION► 100% exploration success rate with three wells
Oil d ti f 0 6 b d (2007) t 4 4 b d (Q4 2011)
injection wells)► Oil production increased from 1.8 mboepd (2007) to 4.9 mboepd (Q4 2011). ► Due to newly gained data during the production intensification, the closing SPE 2P reserves significantly (81%) increased in 2011 y-o-y
DECLINING COSTS OF OPERATION IN THE RECENT YEARS
Russia
► Oil production up from 0.6 mboepd (2007) to 4.4 mboepd (Q4 2011) ► It is expected that MOL will drill yearly 20-30 production wells to increase production, pipeline construction (40 km)
HUGE EXPLORATION POTENTIAL
DECLINING COSTS OF OPERATION IN THE RECENT YEARS► Baituganskoye oilfield is located in one of Russia’s most developed oil and gas province► Shallow, compact field with developed infrastructure support low energy and operational costs
Ledovoye 101 (M)Kvartovoye-11 (M)
Prikoltogorskoye (M) Baitugan-5r (B)
Kedrovoye (M)
Verkhne Laryeganskoy (M)
► Due to the sizeable acreage at least 7-10 undrilled prospects► MOL plans to drill 2-3 exploration wells yearly UPSIDE POTENTIAL
► Further exploration potential in deeper zones
7-10.th Exploration
ll (M B)
1000m
Ledovoye-101 (M)
SPUDFebruary,
2008
2008 2010 2012SPUDApril, 2008
Prikoltogorskoye (M), Baitugan-5r (B)
SPUDFebr, 2012
SPUDMarch, 2012
SPUDFebruary,
2013
2009 2011 2013 2014
Verkhne Laryeganskoy (M)
SPUDApril, 2011
Verkhne
wells (M,B)
SPUDNov, 2012
1000m
3000m
TOTAL DEPTH
LedovoyeDISCOVERY
July, 2008
TOTAL DEPTH
KvartovoyeDISCOVERYNovember,
2008EXPECTED
TD:EST.TD:
EST.TD:
TOTAL DEPTH2860m
Verkhne Laryeganskoye
DISCOVERYAug, 2011
EST.TD:
It is expected that MOL will drill 100-150 production and injection wells to increase
significantly the production level in the next three years.
Upstream
33
DEPTH2722mMarch, 2008
DEPTH3054mJune, 2008
TD:2900-3500m
TD:3365m 2960mMay, 2011 2960m
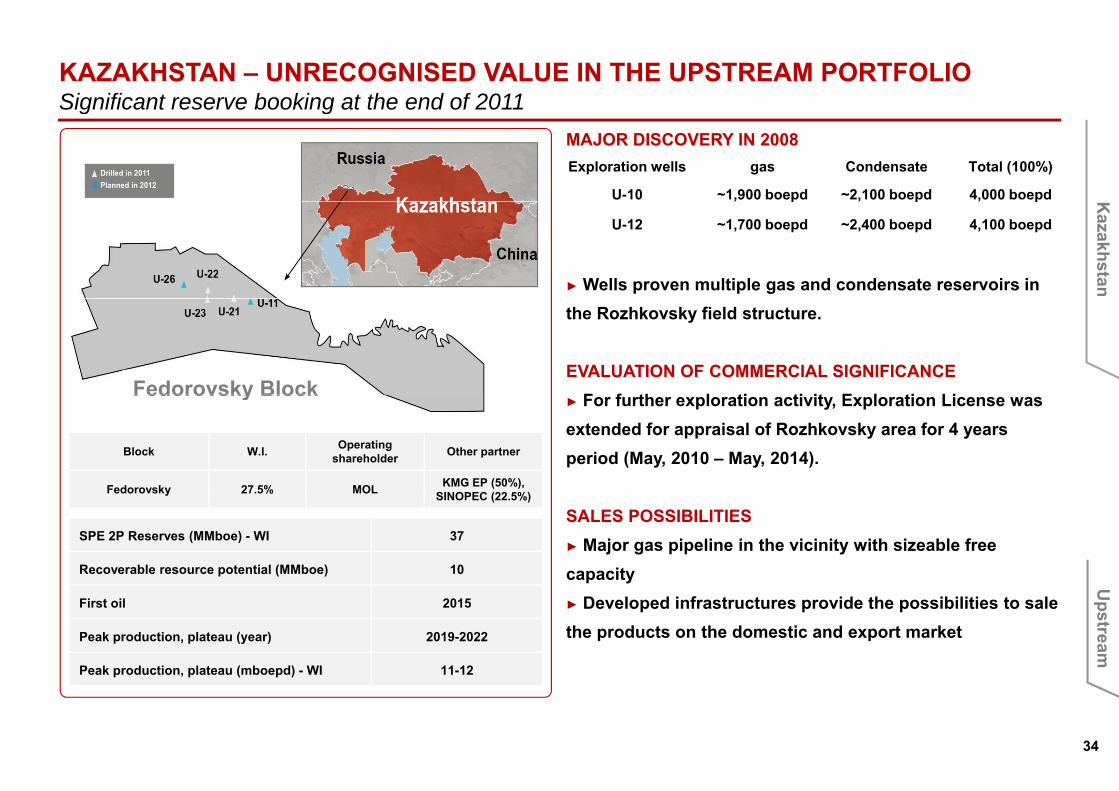
KAZAKHSTAN – UNRECOGNISED VALUE IN THE UPSTREAM PORTFOLIOSignificant reserve booking at the end of 2011
Exploration wells gas Condensate Total (100%)
U-10 ~1,900 boepd ~2,100 boepd 4,000 boepd
Significant reserve booking at the end of 2011MAJOR DISCOVERY IN 2008
, p , p , p
U-12 ~1,700 boepd ~2,400 boepd 4,100 boepd
► Wells proven multiple gas and condensate reservoirs in
Kazakhstan
the Rozhkovsky field structure.
EVALUATION OF COMMERCIAL SIGNIFICANCEF f th l ti ti it E l ti LiFedorovsky Block
► For further exploration activity, Exploration License was extended for appraisal of Rozhkovsky area for 4 years period (May, 2010 – May, 2014).Block W.I. Operating
shareholder Other partner
Fedorovsky 27.5% MOL KMG EP (50%), SINOPEC (22 5%)
Fedorovsky Block
SALES POSSIBILITIES► Major gas pipeline in the vicinity with sizeable free capacity
Fedorovsky 27.5% MOL SINOPEC (22.5%)
SPE 2P Reserves (MMboe) - WI 37
Recoverable resource potential (MMboe) 10
► Developed infrastructures provide the possibilities to sale the products on the domestic and export market
First oil 2015
Peak production, plateau (year) 2019-2022
Peak production, plateau (mboepd) - WI 11-12
Upstream
34
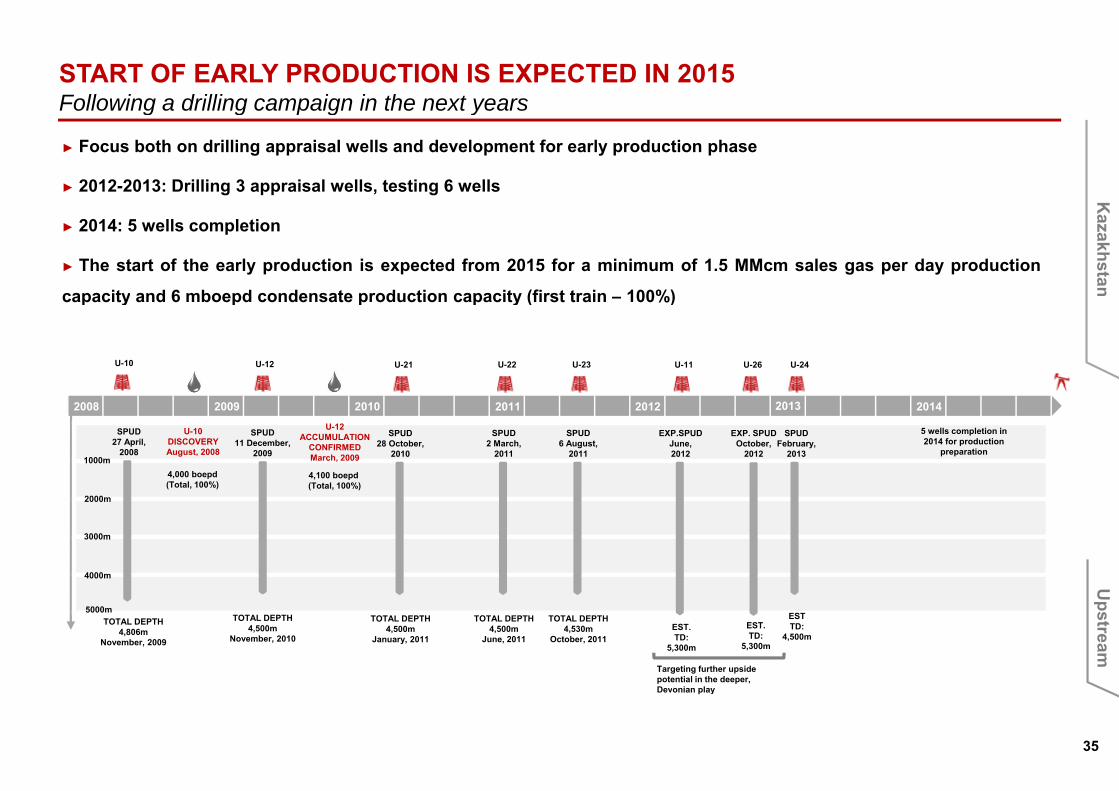
START OF EARLY PRODUCTION IS EXPECTED IN 2015 Following a drilling campaign in the next yearsFollowing a drilling campaign in the next years
► Focus both on drilling appraisal wells and development for early production phase
► 2012-2013: Drilling 3 appraisal wells, testing 6 wells
► 2014: 5 wells completion
► The start of the early production is expected from 2015 for a minimum of 1.5 MMcm sales gas per day production
capacity and 6 mboepd condensate production capacity (first train – 100%)
Kazakhstan
capacity and 6 mboepd condensate production capacity (first train – 100%)
U-10 U-12 U-21 U-11 U-26 U-24U-22 U-23
1000m
SPUD27 April,
2008
U-10 DISCOVERYAugust, 2008
2008 2010 2012
SPUD11 December,
2009
U-12ACCUMULATION
CONFIRMEDMarch, 2009
SPUD28 October,
2010
EXP.SPUDJune, 2012
EXP. SPUDOctober,
2012
SPUDFebruary,
2013
2009 2011 2013 2014
SPUD2 March,
2011
SPUD6 August,
2011
4,000 boepd(Total, 100%)
4,100 boepd(Total, 100%)
5 wells completion in 2014 for production
preparation
2000m
3000m
4000m
5000mTOTAL DEPTH
4,806mNovember, 2009
TOTAL DEPTH4,500m
November, 2010
TOTAL DEPTH4,500m
January, 2011
ESTTD:
4,500mEST.TD:
5,300m
EST.TD:
5,300m
TOTAL DEPTH4,500m
June, 2011
TOTAL DEPTH4,530m
October, 2011
Targeting further upside potential in the deeper,
Upstream
35
Devonian play

PAKISTAN – INTENSIVE SIMULTANEOUS ACTIVITY FROM EXPLORATION TO PRODUCTIONOutstanding exploration success over the last 11 yearsOutstanding exploration success over the last 11 years
TAL BLOCK
► The aim is to continue appraisal activity on recent
di i (M iKh l M i M k i E ddiscoveries (MamiKhel, Maramzai, Makori East and
Tolanj) and to continue exploration of remaining
potential of the block.
Increase reserve base and production in the next years
Pakistan
► Increase reserve base and production in the next years
► Increase capacity of the surface facilities to be able to
handle growing production
2P reserves (2011): 11 MMboeProduction (2011): 5.5 mboepd
KARAK BLOCK
► Oil discovery in Q4 2011 (1,700 bbl/d; - 100% WI)
► 2012-2013: tie-in of well to early production, drilling ofEstimated recoverable resource potential* targeted 40 MMboeEstimated peak production*: 17-18 mboepd between 2017-2020
► 2012 2013: tie in of well to early production, drilling of
1 appraisal well
MARGALA AND MARGALA NORTHBlock W.I. Operator Other partner
Tal 10% (expl.) MOL PPL, OGDCL,
*Working Interest (unrisked)
► Interpretation of ongoing 2D seismics
► In case of prospectivity, drilling of 1 exploration well
8.42% (dev.) POL, GHPL
Karak 40% Mari Gas MOL (40%)
Margala, MN 70% MOL POL (30%)
Upstream
36
Working Interest (unrisked)
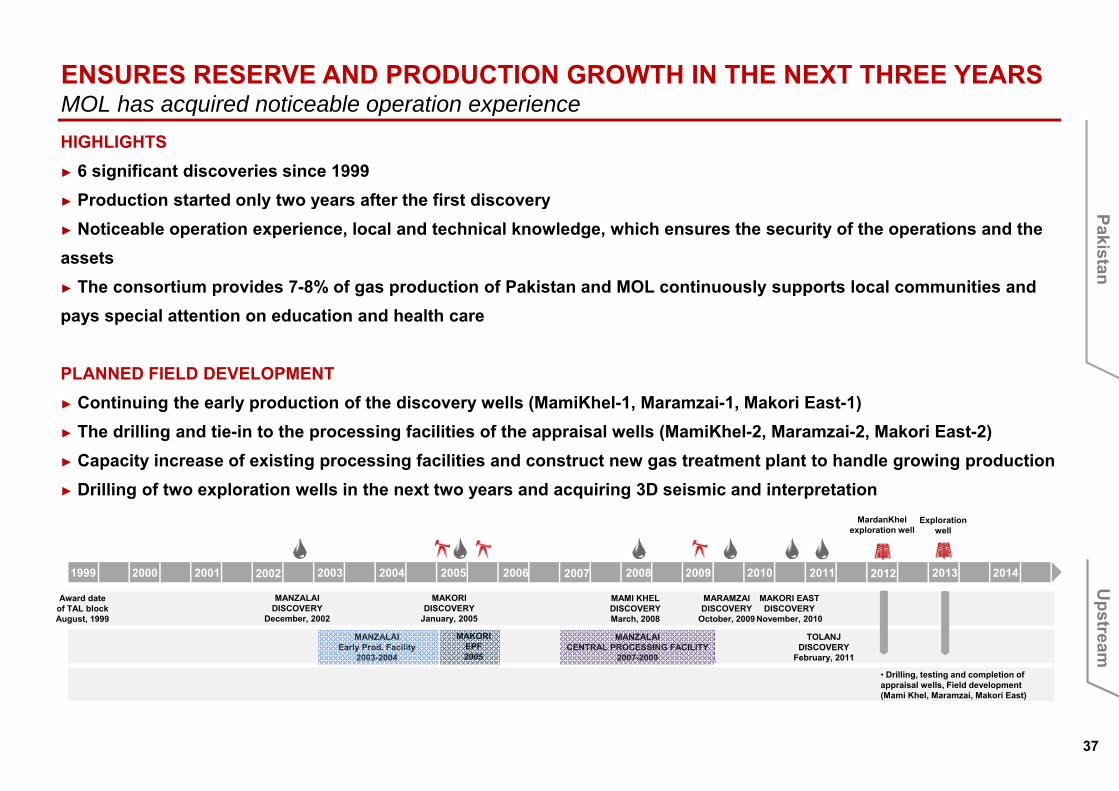
ENSURES RESERVE AND PRODUCTION GROWTH IN THE NEXT THREE YEARS MOL has acquired noticeable operation experienceHIGHLIGHTS► 6 significant discoveries since 1999► Production started only two years after the first discovery
MOL has acquired noticeable operation experience
► Production started only two years after the first discovery► Noticeable operation experience, local and technical knowledge, which ensures the security of the operations and the assets ► The consortium provides 7-8% of gas production of Pakistan and MOL continuously supports local communities and
Pakistan
pays special attention on education and health care
PLANNED FIELD DEVELOPMENT► Continuing the early production of the discovery wells (MamiKhel-1, Maramzai-1, Makori East-1)► The drilling and tie-in to the processing facilities of the appraisal wells (MamiKhel-2, Maramzai-2, Makori East-2) ► Capacity increase of existing processing facilities and construct new gas treatment plant to handle growing production► Drilling of two exploration wells in the next two years and acquiring 3D seismic and interpretation
1999
MardanKhelexploration well
2000 2001 2002 2003 2004 2005 2006 2007 2008 2009 2010 2011 2012 2013 2014
Exploration well
► Drilling of two exploration wells in the next two years and acquiring 3D seismic and interpretation
Award date of TAL blockAugust, 1999
MANZALAIDISCOVERY
December, 2002
MAKORIDISCOVERY
January, 2005
MAMI KHELDISCOVERYMarch, 2008
MARAMZAIDISCOVERY
October, 2009
MAKORI EASTDISCOVERY
November, 2010
TOLANJDISCOVERY
February, 2011
MANZALAIEarly Prod. Facility
2003-2004
MAKORIEPF2005
MANZALAICENTRAL PROCESSING FACILITY
2007-2009
• Drilling, testing and completion of appraisal wells Field development
Upstream
37
appraisal wells, Field development (Mami Khel, Maramzai, Makori East)

CEE: MAXIMIZE RECOVERY RATES FROM EXISTING FIELDS AND MITIGATE DECLINE RATEOnshore and offshore field development (2012)Onshore and offshore field development (2012)
FIELD DEVELOPMENTS AND EOR/IOR PROJECTS
► ~130 producing fields
CEEp g
► 14 field developments in progress
► 20 new field development projects
E -Developm
► EOR project implementation in the next years
► 20-25 new field development projects,
20 25 MMb dditi l t ti l
ment
FIELD DEVELOPMENTS AND EOR/IOR PROJECTS
► close to 60 producing fields
► 20-25 MMboe additional reserve potential2011 reserves* (SPE 2P): 405 MMboeProduction (2011): 99.6 mboepdCAPEX (2012): USD 255 mn
► close to 60 producing fields
► 5 new wells (three new wells and two new reentry wells)
► EOR project implementation on Ivanic and Zutica fields:
► Close to USD 100 mn investments in the next 3 years► Close to USD 100 mn investments in the next 3 years
► Increasing total production volume by 3.4 million tons
of oil and 600 million cubic meters of gas in the
following 2 decades (total: 28 MMboe) by
Upstream
38
g ( ) y
*MOL estimate

280 MMBOE TARGETED RECOVERABLE RESOURCE POTENTIAL CEE exploration (2012) – outstanding success ratio in the region
► Number of licenses, acreage exposure: 33; 37,400 km2
► 2012: 13 conventional and 3 tight gas (unconventional) drillings and tests
CEE exploration (2012) outstanding success ratio in the region
CE
► 2 3D seismic measurements► Exploration expenditure for 2012 (USD mn): ~USD 133 mn► Plan to secure acreage position in the next years as majority of the licenses will expire by 2013
E -Exploratiexpire by 2013
► Number of licenses, acreage exposure: 5; 41,876 km2
► Drilling 6 wells (included 1unconventional) and 1 well: Zalata-1 East in Hungary (INA 50%)
ion
(INA 50%).► Offshore-drilling: 3 wells are expected; Ilena-1 Dir, Ivna-1 (optional) and Irina SW (optional), study program to prepare following drilling campaign► Plan to regain the exploration licenses as INA remains the only entity currently in Croatia which has the necessary equipment experience knowledge and projects
► 70% MOL operator (after ratification by state), 30% Expert Petroleum ► Number of licenses acreage exposure: 3; 3 400 km2
Croatia, which has the necessary equipment, experience, knowledge and projects prepared ready to drill to accelerate exploration activities
► Number of licenses, acreage exposure: 3; 3,400 km2
► Blocks are located in the vicinity of successful Hungarian fields► Compulsory work program (2012-2014):
► 600 km of 2D seismic,
Upstream
39
► 1700km2 of 3D seismic ► 19 exploration wells (including unconventional well)

UNCONVENTIONAL: TEST COMMERCIAL PRODUCTION AT DERECSKE BASINDrilling an other exploration well to increase proven hydrocarbon volumeDrilling an other exploration well to increase proven hydrocarbon volume
Derecske Basin
TIGHT GAS PROJECT WAS INTENSIFIED IN 2010
► Drilling of two wells (Beru-4, Beru-3).
CEE -
1
B 1
Beru-4
Beru 6
2
2
Beru-ÉNy-1
Zala Basin
Drava Basin Makó Basin
Békés Basin ► MOL found (Beru-4) the expected formation in the targetzone with strong gas shows.
IN 2011-2012 THE FOCUS IS
i ) th b tt iti f th b i ith t t f
-Unconvent
2
3
Beru-1
Beru-2
Beru-M-1
Beru-3
Beru-6
Beru-7i.) the better position of the basin with test for
commerciality proved by fracturing (Beru-4)
ii.) and drilling to increase proved hydrocarbonvolume (Beru-6).
tional
( )
► The fracturing of the formation was finalized byHalliburton in Q4 2011. Well test and pilot production isexpected in H1 2012.
1 – Földes-East - Field analogyTargets of exploration program:2 – Structural prospects3 – Non - structural position
Beru-2 Drilled wells Beru-7 Planned wells
Beru-6 Well under drilling
Beru-4 Under FracturingBeru-ÉNy-1 Alternate plan
of Beru-7
► In 2012 the exploration program aims to continue theevaluation of unconventional potential with drilling of two(Beru-7, Beru-M-1) and testing of one (Beru-6) well.
IN CASE OF SUCCESSIN CASE OF SUCCESS
► In the next years MOL will explore the potential of thebasis, while in case of success production could startaround 2015-2017.
► MOL focuses on the smaller, but more promisingDerecske basin in the vicinity of already producingwells.
Upstream
40

SYRIA – IN LINE WITH SANCTIONS MAINTAINING ECONOMIC INTEREST Negative effects due to tightening sanctions and security issuesNegative effects due to tightening sanctions and security issues
TIGHTENING US AND EU SANCTIONS DURING 2011-2012► Embargo on Syrian oil export
Two production cuts in September and December 2011► Two production cuts in September and December 2011 in a sum of 2.8 mboepd due to the local requirements► The restrictive measures might have additional adverse effects.
Syria
Production (2011): 20.3 mboepd, NEGATIVE EFFECT OF THE RESTRICTIVE MEASURES► Encountering significant obstacles in the collection of
Hayan Block: development phase, 100% INA; operator
Aphamia Block: exploration phase, 100% INA
receivables from the Syrian partner for its share of hydrocarbon production; ► There has been no improvement in this situation since October 2011.
CURRENT SECURITY SITUATION► Adapting the numbers of its staff to the current security
EXPLORATION AND FIELD DEVELOPMENT
► Exploration activity started in 1998 and was completed in 2007.
First oil production started in 2005 on Jihar Field, first gas
production started in 2006 on Palmyra Field. ► Adapting the numbers of its staff to the current security situation: temporarily withdraw the employees who are not required for the continuation of the daily operations
PEAK PRODUCTION IN 2011
► Gas Treatment Plant operating from 2011, resulting in significant
increase in oil, condensate and gas production.
Upstream
41
DOWNSTREAMReinforce Regional Stronghold PositionReinforce Regional Stronghold Position
Dow
nstream
42

TWO LARGEST ASSETS WITH HIGH COMPLEXITYIntegrated operation in adjacent marketsIntegrated operation in adjacent markets
KEY STRENGTH
► Strong land-locked market presence – 21% motor fuel
market share in the CEE
► Region-wide Logistics, Wholesale and Retail network serve
the market - above 55% end-user share
Mantova
Bratislava
Danube
Sisak
Rij k
3%9%
23%4%
6%4%4%
LPGNaphthaMototre GasolineMiddle Distillates
y yi
eld
2012
E
over 80%hit dRijeka
48%
Fuel OilBitumenOtherOther chemical prds.
Refining Logistics
Ref
iner
y
Marketing
white prd.
Retail Network• 1,600+ FS• 3.5 Mt total fuel sales• Avrergae throughput: 2.7 Mlpa
RefiningWholesale
• 19 Mt external sales • 21% regional market share• Market leader in 4 countries
Logistics
Refinery Mtpa thbpd NCI
MOL Group 23.5 470 9.9
Danube 8 1 161 10 6
Marketing
D
g g p p• 18% captive market for refineries
1.5 Mt external sales volume
• 27% end-user sales
Petrochemicals
Capacity (ktpa) TVK SPC
Danube 8.1 161 10.6
Bratislava 6.1 122 11.5
Rijeka 4.5 90 9.1
Mantova 2 6 52 8 4
Key
fact
s
Logistics
ownstream
43
13% captive market for RefiningEthylene 660 220
Polymer 765 435
Mantova 2.6 52 8.4
Sisak 2.2 44 6.1
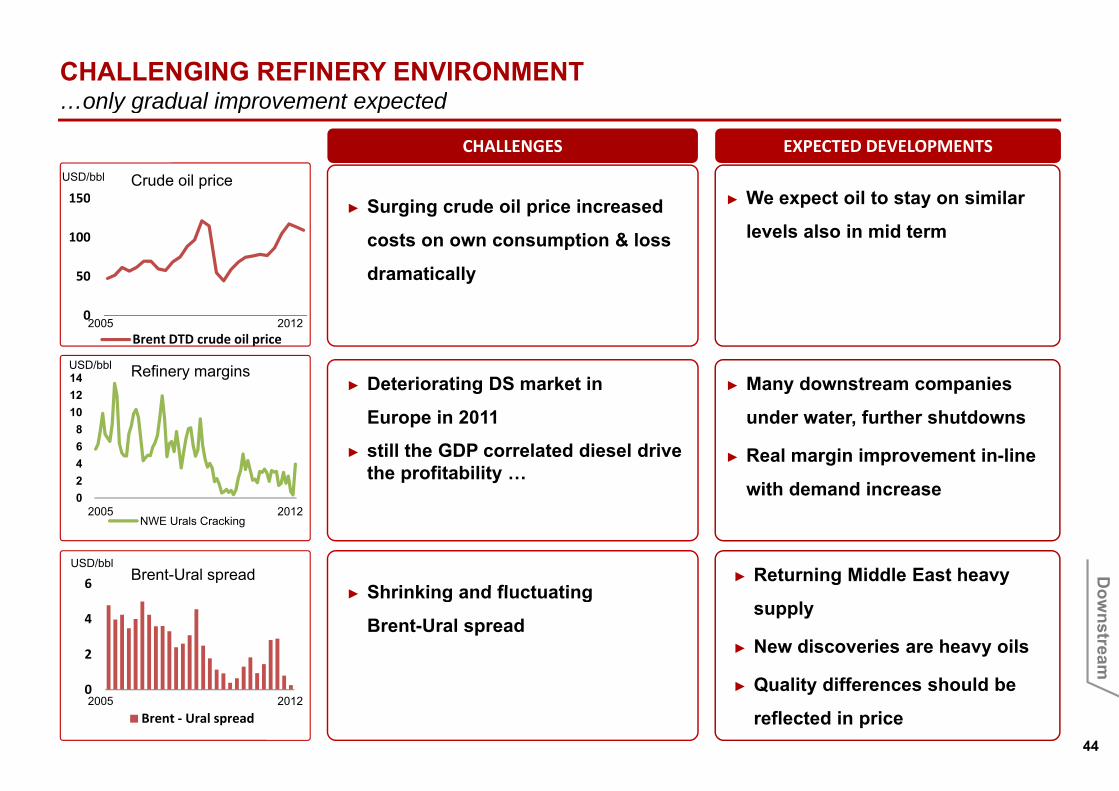
CHALLENGING REFINERY ENVIRONMENTonly gradual improvement expected…only gradual improvement expected
150
USD/bbl
S i d il i i d ► We expect oil to stay on similarCrude oil price
CHALLENGES EXPECTED DEVELOPMENTS
50
100
150► Surging crude oil price increased
costs on own consumption & loss
dramatically
► We expect oil to stay on similar
levels also in mid term
► Deteriorating DS market in 1214 Refinery marginsUSD/bbl
► Many downstream companies
0
Brent DTD crude oil price2005 2012
► still the GDP correlated diesel drive the profitability …
Europe in 2011
2468
1012
under water, further shutdowns
► Real margin improvement in-line
with demand increase0
NWE Urals Cracking
with demand increase
Shrinking and fluctuating► Returning Middle East heavy 6 Brent-Ural spread
USD/bbl
2005 2012
D
► Shrinking and fluctuating
Brent-Ural spread supply
► New discoveries are heavy oils
► Quality differences should be0
2
4
ownstream
44
► Quality differences should be
reflected in price0
Brent ‐ Ural spread2005 2012

DEMAND SUFFERS FROM ECONOMIC CRISIS, BUT…long term growth potential remains in the region…long term growth potential remains in the region
Gasoline demand changein %
SHORT TERM CRISIS EFFECT LONG TERM POTENTIAL REMAINS
Car penetration curve
► GRADUAL 500
600
700
800
ItalyFrance
AustriaGermany
C h RPoland
1,00
0 in
habi
tant
5
10
15
Gasoline demand changein % Car penetration curve
► Regional car penetration is still well bellow EU
IMPROVEMENT IN DIESEL PER CAPITA COMSUMPTION WITH
GDP GROWTH0
100
200
300
400 Czech Rep.
SlovakiaCroatia
RussiaRomania
Serbia
China
PakistanIndia HUNGARY
Car
s pe
r
10
-5
0
5average
► Room for additional gasoline demand
Hungary
0 5000 10000 15000 20000 25000 30000 35000 40000 45000
GDP per Capita (PPP in USD)
700
-102005 2006 2007 2008 2009 2010 2011
Domestic markets CEE region
Diesel demand changein % Diesel consumption per capita
300400500600700
5
10
15 ► GDP growth potential of the region remains
liter
/ ca
pita
D
0100200
-5
0
5
Domestic markets CEE region
► Significant additional diesel demand is expected in the CEE
ownstream
45
CEE North West Europe-102005 2006 2007 2008 2009 2010 2011
Domestic markets CEE region
Source: Woodmac and MOL estimates.
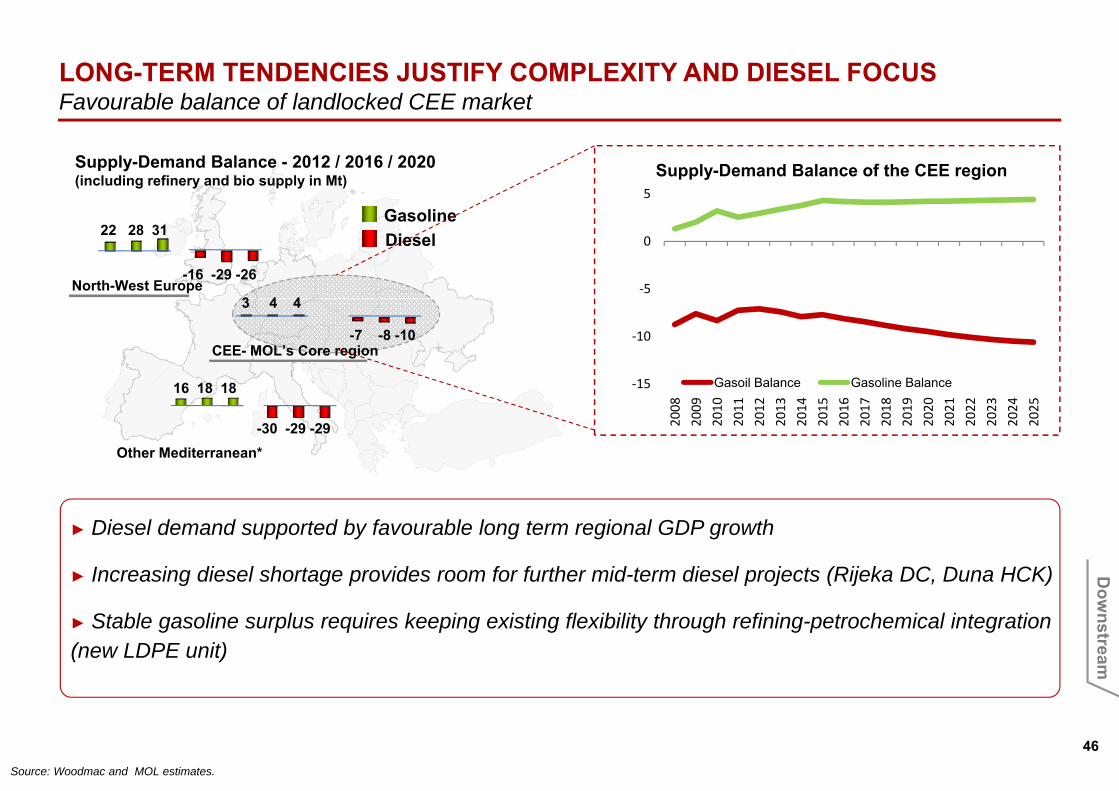
LONG-TERM TENDENCIES JUSTIFY COMPLEXITY AND DIESEL FOCUSFavourable balance of landlocked CEE marketFavourable balance of landlocked CEE market
5
Supply-Demand Balance - 2012 / 2016 / 2020(including refinery and bio supply in Mt) Supply-Demand Balance of the CEE region
‐5
0
North-West Europe
GasolineDiesel22 28 31
-16 -29 -26
3 4 4
‐15
‐10
Gasoil Balance Gasoline Balance
CEE- MOL’s Core region
3 4 4
-7 -8 -10
16 18 18
2008
2009
2010
2011
2012
2013
2014
2015
2016
2017
2018
2019
2020
2021
2022
2023
2024
2025
Other Mediterranean*-30 -29 -29
► Diesel demand supported by favourable long term regional GDP growth
► Increasing diesel shortage provides room for further mid-term diesel projects (Rijeka DC, Duna HCK) D
Largest contributors
► Stable gasoline surplus requires keeping existing flexibility through refining-petrochemical integration (new LDPE unit)
ownstream
46Source: Woodmac and MOL estimates.
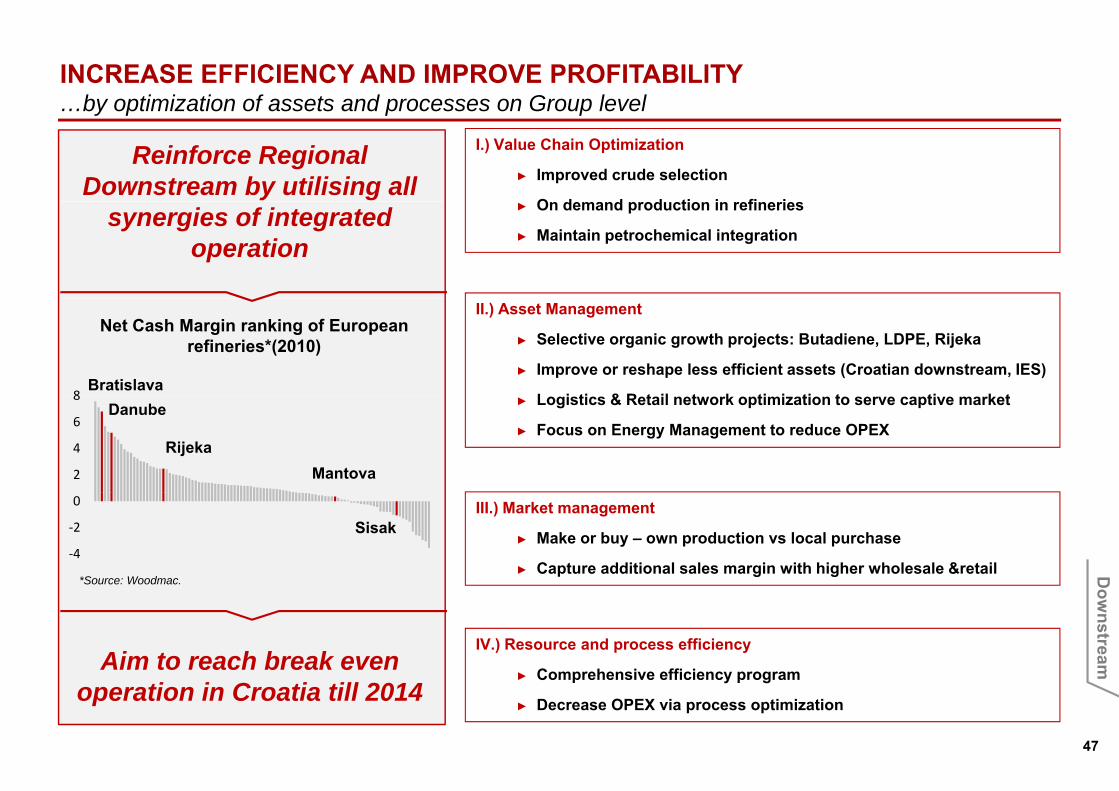
INCREASE EFFICIENCY AND IMPROVE PROFITABILITY by optimization of assets and processes on Group level…by optimization of assets and processes on Group level
Reinforce Regional Downstream by utilising all
I.) Value Chain Optimization
► Improved crude selection
O d d d ti i fi isynergies of integrated operation
► On demand production in refineries
► Maintain petrochemical integration
Net Cash Margin ranking of European refineries*(2010)
Bratislava8
II.) Asset Management
► Selective organic growth projects: Butadiene, LDPE, Rijeka
► Improve or reshape less efficient assets (Croatian downstream, IES)
L i ti & R t il t k ti i ti t ti k t
2
4
6
8Danube
RijekaMantova
► Logistics & Retail network optimization to serve captive market
► Focus on Energy Management to reduce OPEX
‐4
‐2
0
SisakIII.) Market management
► Make or buy – own production vs local purchase
► Capture additional sales margin with higher wholesale &retail *Source: Woodmac.
D
IV.) Resource and process efficiency
► Comprehensive efficiency program
ownstreamAim to reach break even
ti i C ti till 2014
47
► Decrease OPEX via process optimizationoperation in Croatia till 2014

SELECTIVE INVESTMENTS TO MAINTAIN LEADING POSITION…and improve profitability…and improve profitability
LOGISTICS AND RETAIL INVESTMENTS Growth in high margin captive market
Largest contributors ► New logistics, depots ensure better market reach
► Retail investments focuses on growth markets and sites with favourable position
SELECTIVE PETROCHEMICAL DEVELOPMENTS Ensure flexibility & capture profitable niche segment
Largest contributors
Exploit high margin butadiene market
► New 130 ktpa butadiene unit: caa. EUR 100 mn CAPEX; ~EUR 50 mn EBITDA improvement
Maintain synergies from Refining – Petrochemicals integration
► Shut down 3 old subscale LDPE units new 220 ktpa LDPE unit CAPEX: cca EUR 260 mn► Shut down 3 old, subscale LDPE units, new 220 ktpa LDPE unit, CAPEX: cca EUR 260 mn
► Increased flexibility - higher naphtha off-take from refineries (plus cca. 120 ktpa)
Aim to reach break-even operation till 2014 with gradual improvementCROATIAN DOWNSTREAM D
Largest contributors
► Short term efficiency actions: OPEX cut, logistics & retail network rationalization► On-demand operation of refineries
N i li ti b t fi i f fl ibl ti ti
p g p ownstream
48
► New pipeline connection between refineries for flexible, synergetic operation► Preparation for residue disruption (new Coker unit)

FOCUSING ON MOST PROFITABLE SALES IN KEY LANDLOCKED COUNTRIESCapturing regional growth opportunities by differentiated geographic focusCapturing regional growth opportunities by differentiated geographic focus
FOCUS ON PRINCIPAL EXTENSIVE GROWTH AREAS
► ‘Hold fast’: maintain market share in HUN, ITA, while increase in SK, regain in CRO and BIH, , , g
► ‘Go for it’: further growth on key export markets AUT, CZ, expansion in West-ROM, SRB, SLO
► ‘Keep up’: maintain and build up market presence on markets ensuring optimum flexibility to refining assets
HARMONIZED DEVELOPMENT OF LOGISTICS, COMMERCIAL AND RETAIL TO SUPPORT SALES► Focus on growing markets & keep leading position in domestic countries
D b ttl ki th l i ti t
Largest contributors
► Increasing retail presence on growth markets
INCREASE RETIAL NETWORK EFFICIENCY
► Debottlenecking the logistics system
► Greenfield investments
► Opportunistic network acquisitions
► Improve brand perception & increase non-fuel revenue D
► Increase avr. throughput per site to 3.0 Mlpa► Dispose inefficient sites
ownstream
49
Keep and strenghten locational benefit: margin-driven sales optimization with end-user focus

Financials
FFinancials
50
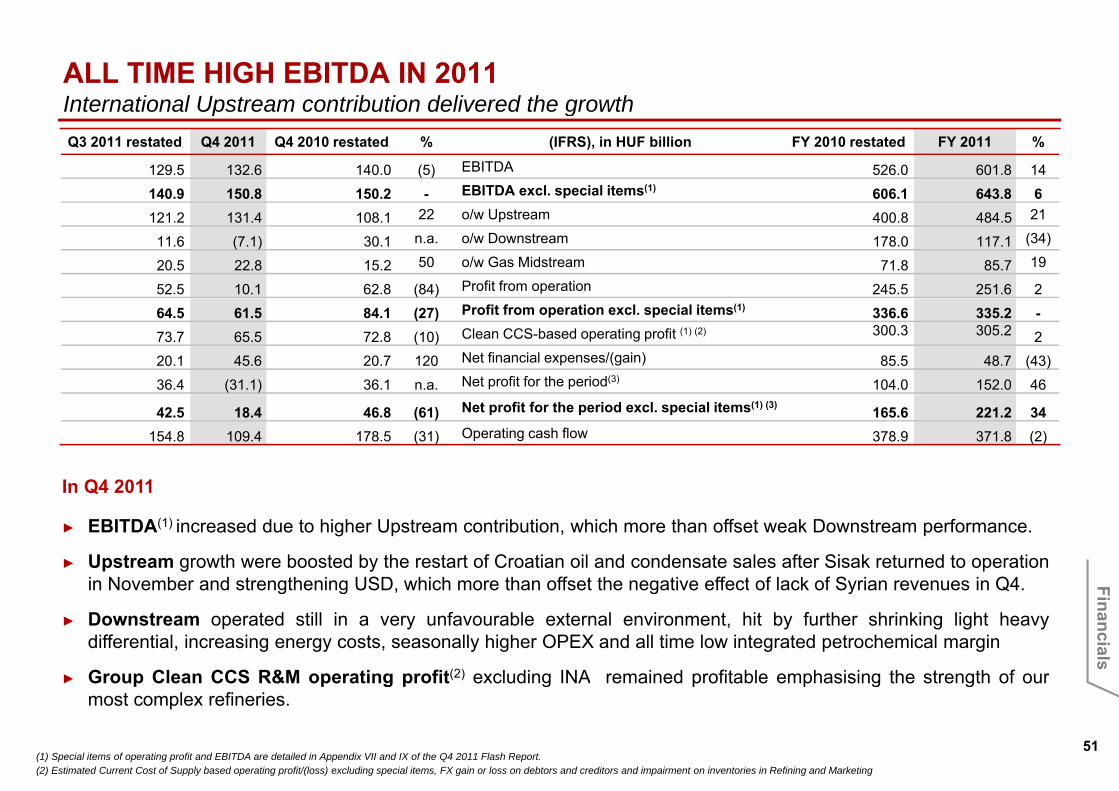
ALL TIME HIGH EBITDA IN 2011 International Upstream contribution delivered the growthInternational Upstream contribution delivered the growthQ3 2011 restated Q4 2011 Q4 2010 restated % (IFRS), in HUF billion FY 2010 restated FY 2011 %
129.5 132.6 140.0 (5) EBITDA 526.0 601.8 14140.9 150.8 150.2 - EBITDA excl. special items(1) 606.1 643.8 6121.2 131.4 108.1 22 o/w Upstream 400.8 484.5 21
11.6 (7.1) 30.1 n.a. o/w Downstream 178.0 117.1 (34)
20.5 22.8 15.2 50 o/w Gas Midstream 71.8 85.7 19
52.5 10.1 62.8 (84) Profit from operation 245.5 251.6 264.5 61.5 84.1 (27) Profit from operation excl. special items(1) 336.6 335.2 -73.7 65.5 72.8 (10) Clean CCS-based operating profit (1) (2) 300.3 305.2 220.1 45.6 20.7 120 Net financial expenses/(gain) 85.5 48.7 (43)36.4 (31.1) 36.1 n.a. Net profit for the period(3) 104.0 152.0 46
In Q4 2011
42.5 18.4 46.8 (61) Net profit for the period excl. special items(1) (3) 165.6 221.2 34154.8 109.4 178.5 (31) Operating cash flow 378.9 371.8 (2)
In Q4 2011
► EBITDA(1) increased due to higher Upstream contribution, which more than offset weak Downstream performance.
► Upstream growth were boosted by the restart of Croatian oil and condensate sales after Sisak returned to operationin November and strengthening USD, which more than offset the negative effect of lack of Syrian revenues in Q4. Fin November and strengthening USD, which more than offset the negative effect of lack of Syrian revenues in Q4.
► Downstream operated still in a very unfavourable external environment, hit by further shrinking light heavydifferential, increasing energy costs, seasonally higher OPEX and all time low integrated petrochemical margin
► Group Clean CCS R&M operating profit(2) excluding INA remained profitable emphasising the strength of our
Financials
51
p p g p g p p g gmost complex refineries.
(1) Special items of operating profit and EBITDA are detailed in Appendix VII and IX of the Q4 2011 Flash Report.(2) Estimated Current Cost of Supply based operating profit/(loss) excluding special items, FX gain or loss on debtors and creditors and impairment on inventories in Refining and Marketing

FURTHER STRENGTHENED FINANCIAL POSITIONFitch reinforced the investment grade credit rating
Covenants
Fitch reinforced the investment grade credit rating
USD bn
Gearing (%)
2,5
3
3,5
2,5
3
35
40
1
1,5
22 30
0
0,5
1
1
1,5
2 008 2 009 2 010 2 01120
25
2008 2009 2010 2011
EBITDA Net debt to EBITDA
Keep covenants and gearing in the safety zone
Gearing
F
Largest contributors Keep covenants and gearing in the safety zone
3.4 years average maturity profile
Financials
52

2012 CAPEX: STRONG FOCUS ON UPSTREAMUp to USD 2 bn CAPEX spendingUp to USD 2 bn CAPEX spending
12% 21%
UPSTREAM (2012) DOWNSTREAM (2012)
3%13%
MOL GROUP (2012)
25%
5%
4%
47%
3%
21%
17%
16%
Hungary Croatia
60%19%
Refining and Marketing
37%
Upstream Downstream
► Strict control on maintenance; focus► Increasing share of exploration: speed
Kurdistan, Iraq RussiaSyria PakistanOther
RetailPetrochemicalsGas Midstream C&O
P t ti l i t t th h i
L t t ib t
► Strict control on maintenance; focus on safe operation
► Improve flexibility and extend value chain in Petchem
► Increasing share of exploration: speed up in Kurdistan Region of Iraq
► Exploration with international focus is targeting reasonable resource base
► Potential investment on the horizon
► Conservative and flexible approach
F
Largest contributors ► Increase retail presence and logistic developments to secure enduser market
► Focus on developments in Russia, Kazakhstan and Pakistan
► Mitigating natural decline in the CEE
Financials
53
region

2012-2014 CAPEX SHOULD BE FULLY FINANCED FROM OPERATING CFUp to annual USD 2 bn CAPEX spending
► Kurdistan, Iraq: Akri-Bijeel and Shaikan blocks
R i B it d M tj hki k bl k
GROUP 2012‐2014
Up to annual USD 2 bn CAPEX spending
► Russia: Baitex and Matjushkinsky blocks
► Kazakhstan: Federovsky block
► Hungarian conventional and unconventional explorationpstr
eam
50%4%
21%
cts
► Hungarian conventional and unconventional exploration
► Croatian exploration and field development
► Hungarian field development
U50%
25%
owth
pro
je
m► Modernization through new LDPE unit, Slovnaft
Upstream Downstream
Gas Midstream Contingencyor
gani
c gr
o
Dow
nstr
eam
► Rijeka residue processing – Delayed Coker
► Butadiene Extraction Unit
Key
o
F
D
► Logistic and retail development
Financials
54

NO PRESSURE FOR FURTHER FINANCING IN 2012Stable maturity profile more than EUR 2 bn available liquidity
3000
Stable maturity profile, more than EUR 2 bn available liquidity
2000
2500
2014
2013
1500
2016
2014
mn
EUR
500
1000m
500
0
Deposits Undrawn facilities Available liquidity 2012 2013 2014
F
-1000
-500
Financials
55
2012-2014 CAPEX SHOULD BE FULLY FINANCED FROM OPERATING CFUp to annual USD 2 bn CAPEX spending
► Kurdistan, Iraq: Akri-Bijeel and Shaikan blocks
R i B it d M tj hki k bl k
GROUP 2012-2014
Up to annual USD 2 bn CAPEX spending
► Russia: Baitex and Matjushkinsky blocks
► Kazakhstan: Federovsky block
► Hungarian conventional and unconventional explorationpstr
eam
50%4%
21%
cts
► Hungarian conventional and unconventional exploration
► Croatian exploration and field development
► Hungarian field development
U50%
25%
owth
pro
je
m► Modernization through new LDPE unit, Slovnaft
Upstream Downstream
Gas Midstream Contingencyor
gani
c gr
o
Dow
nstr
eam
► Rijeka residue processing – Delayed Coker
► Butadiene Extraction Unit
Key
o
F
D
► Logistic and retail development
Financials

NATURAL HEDGE POSITION IN FXUSD and EUR denominated business mixUSD and EUR denominated business mix
► Both in Upstream and Downstream operating cash flow is mainly driven by USD and EUR 3%
Total debt – YE 2011
► CAPEX is also linked mainly to USD, EUR27%
► Weaker local currencies is slightly beneficial70%
► FX structure of indebtedness naturally decreases the above exposures
EUR USD HUF and other currency
FFinancials
57

APPENDIX
AAppendix
58

ALL TIME HIGH EBITDA IN 2011 International Upstream contribution delivered the growthInternational Upstream contribution delivered the growthQ3 2011 restated Q4 2011 Q4 2010 restated % (IFRS), in HUF billion FY 2010 restated FY 2011 %
129.5 132.6 140.0 (5) EBITDA 526.0 601.8 14
140.9 150.8 150.2 ‐ EBITDA excl. special items(1) 606.1 643.8 6
121.2 131.4 108.1 22 o/w Upstream 400.8 484.5 21
11.6 (7.1) 30.1 n.a. o/w Downstream 178.0 117.1 (34)
20.5 22.8 15.2 50 o/w Gas Midstream 71.8 85.7 19
52.5 10.1 62.8 (84) Profit from operation 245.5 251.6 2
64.5 61.5 84.1 (27) Profit from operation excl. special items(1) 336.6 335.2 ‐
73.7 65.5 72.8 (10) Clean CCS‐based operating profit (1) (2) 300.3 305.2 2
20.1 45.6 20.7 120 Net financial expenses/(gain) 85.5 48.7 (43)
36.4 (31.1) 36.1 n.a. Net profit for the period(3) 104.0 152.0 46
In Q4 2011
42.5 18.4 46.8 (61) Net profit for the period excl. special items(1) (3) 165.6 221.2 34
154.8 109.4 178.5 (31) Operating cash flow 378.9 371.8 (2)
In Q4 2011
► EBITDA(1) increased due to higher Upstream contribution, which more than offset weak Downstream performance.
► Upstream growth were boosted by the restart of Croatian oil and condensate sales after Sisak returned to operationin November and strengthening USD, which more than offset the negative effect of lack of Syrian revenues in Q4. Ain November and strengthening USD, which more than offset the negative effect of lack of Syrian revenues in Q4.
► Downstream operated still in a very unfavourable external environment, hit by further shrinking light heavydifferential, increasing energy costs, seasonally higher OPEX and all time low integrated petrochemical margin
► Group Clean CCS R&M operating profit(2) excluding INA remained profitable emphasising the strength of our
Appendix
59
p p g p g p p g gmost complex refineries.
(1) Special items of operating profit and EBITDA are detailed in Appendix VII and IX of the Q4 2011 Flash Report.(2) Estimated Current Cost of Supply based operating profit/(loss) excluding special items, FX gain or loss on debtors and creditors and impairment on inventories in Refining and Marketing
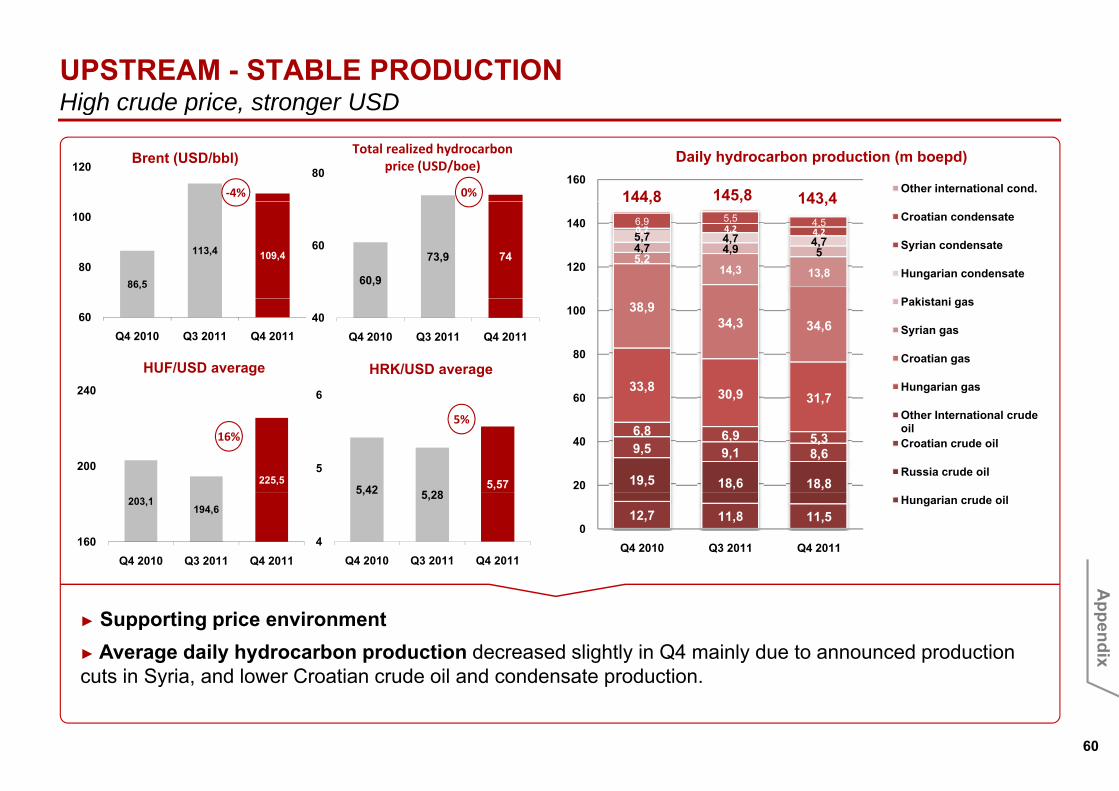
UPSTREAM - STABLE PRODUCTIONHigh crude price stronger USD
160
Daily hydrocarbon production (m boepd)
Other international cond.
High crude price, stronger USD
120 Brent (USD/bbl)
‐4%
80
Total realized hydrocarbonprice (USD/boe)
0% 145,8144,8 143,4
5,214,3 13,8
4,7 4,9 55,7 4,7 4,70,7 4,2 4,26,9 5,5 4,5
120
140 Croatian condensate
Syrian condensate
Hungarian condensate
P ki t i86,5
113,4 109,480
100
60,9
73,9 7460
,144,8 143,4
33,8 30 9 31 7
38,934,3 34,6
60
80
100Pakistani gas
Syrian gas
Croatian gas
Hungarian gas HUF/USD average
240
60Q4 2010 Q3 2011 Q4 2011
40Q4 2010 Q3 2011 Q4 2011
6
HRK/USD average
19,5 18,6 18,8
9,5 9,1 8,6
6,8 6,9 5,3
30,9 31,7
20
40
60Other International crude oilCroatian crude oil
Russia crude oil
16
225,5200
5,42 5 285,57
5
6
5%16%
12,7 11,8 11,50
Q4 2010 Q3 2011 Q4 2011
Hungarian crude oil 203,1194,6
160Q4 2010 Q3 2011 Q4 2011
5,42 5,28
4Q4 2010 Q3 2011 Q4 2011
A
► Supporting price environment► Average daily hydrocarbon production decreased slightly in Q4 mainly due to announced production cuts in Syria, and lower Croatian crude oil and condensate production.
Appendix
60
y p

UPSTREAM RESULT WAS RECORD HIGH IN Q4UPSTREAM RESULT WAS RECORD HIGH IN Q4…
EBITDA* (HUF bn)
Positive effects of
► Restart of Croatian oil and condensate sales to Si k (b k t ti i N b )131 4
120
130
140
+8%
Sisak (back to operation in November)
► Strengthening USD against HUF108,1
121,2131,4
100
110
Q4 2010 Q3 2011 Q4 2011
were moderated by negative effects of
► Lack of Syrian revenues90
100
Operating profit* (HUF bn)
- ► Lack of Syrian revenues
► Severe impact of regulated Hungarian natural gas price for household costumers
► Slight production decrease82,4 81,3
8770
80
907%
A► Slight production decrease60
Q4 2010 Q3 2011 Q4 2011
Appendix
61* Excluding special items
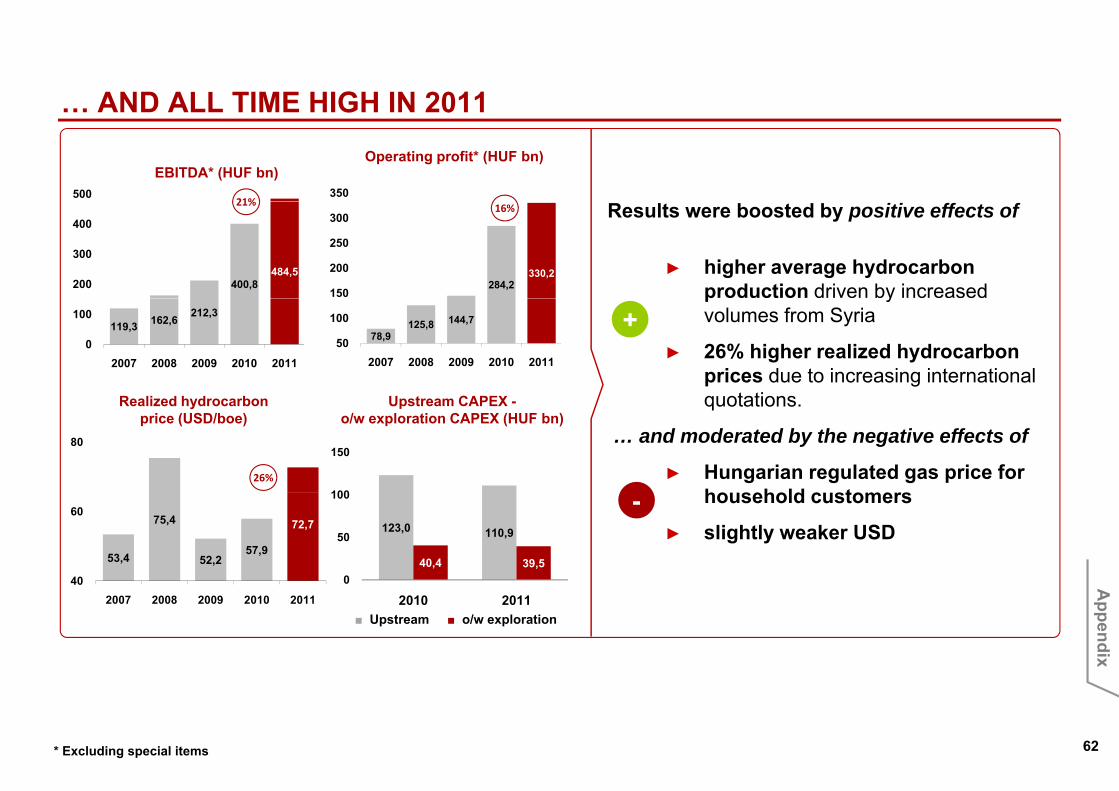
AND ALL TIME HIGH IN 2011… AND ALL TIME HIGH IN 2011
350
Operating profit* (HUF bn)
500
EBITDA* (HUF bn)
21%
284,2330,2
150
200
250
300 Results were boosted by positive effects of
► higher average hydrocarbon production driven by increased 400,8
484,5200
300
40016%21%
78,9125,8 144,7
50
100
2007 2008 2009 2010 2011
p yvolumes from Syria
► 26% higher realized hydrocarbon prices due to increasing international
t ti
119,3 162,6212,3
0
100
2007 2008 2009 2010 2011
+
quotations.
… and moderated by the negative effects of
► Hungarian regulated gas price for h h ld t
80
Realized hydrocarbonprice (USD/boe)
100
150
Upstream CAPEX -o/w exploration CAPEX (HUF bn)
26%
household customers
► slightly weaker USD53,4
75,4
52,257,9
72,7
40
60 -123,0 110,9
40,4 39,50
50
100
A
2007 2008 2009 2010 2011 2010 2011■ Upstream ■ o/w exploration
Appendix
62* Excluding special items
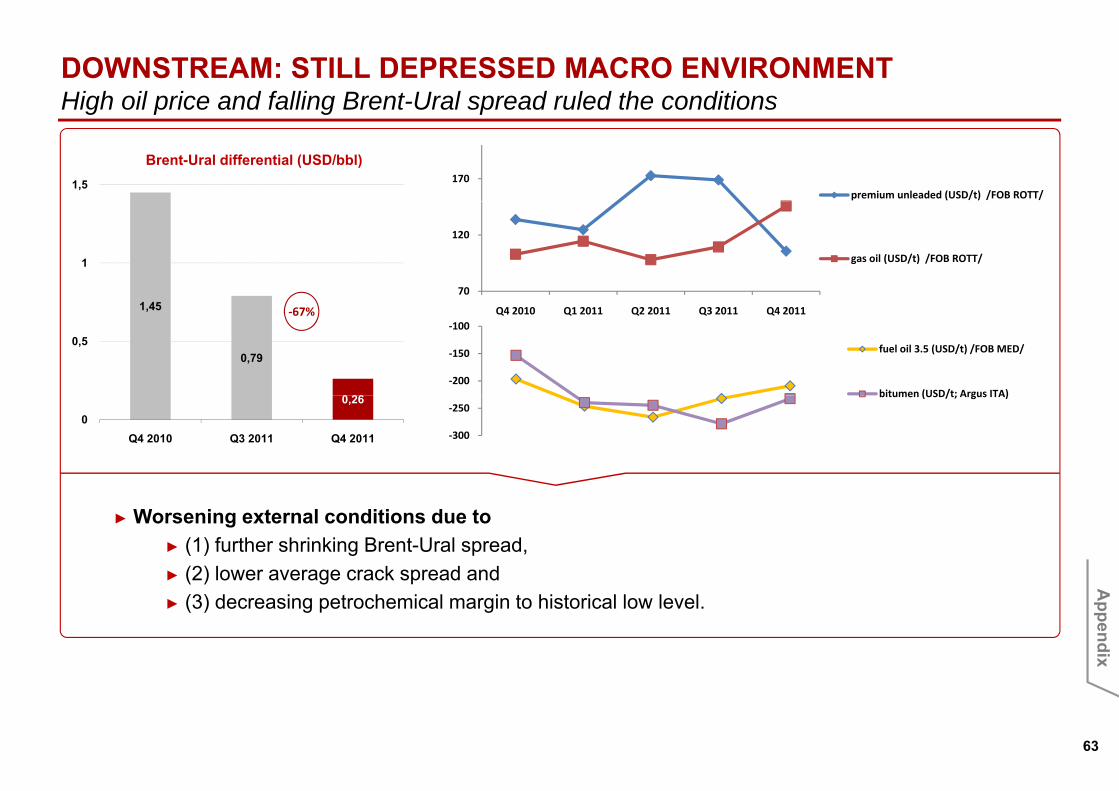
DOWNSTREAM: STILL DEPRESSED MACRO ENVIRONMENTHigh oil price and falling Brent-Ural spread ruled the conditionsHigh oil price and falling Brent Ural spread ruled the conditions
Brent-Ural differential (USD/bbl)1,5 170
premium unleaded (USD/t) /FOB ROTT/
1
70
120
gas oil (USD/t) /FOB ROTT/
1,45
0,79
0 26
0,5
Q4 2010 Q1 2011 Q2 2011 Q3 2011 Q4 2011
‐200
‐150
‐100
fuel oil 3.5 (USD/t) /FOB MED/
bitumen (USD/t; Argus ITA)
‐67%
0,26
0Q4 2010 Q3 2011 Q4 2011 ‐300
‐250bitumen (USD/t; Argus ITA)
► Worsening external conditions due to ► (1) further shrinking Brent-Ural spread, ► (2) lower average crack spread and A
► (3) decreasing petrochemical margin to historical low level.
Appendix
63
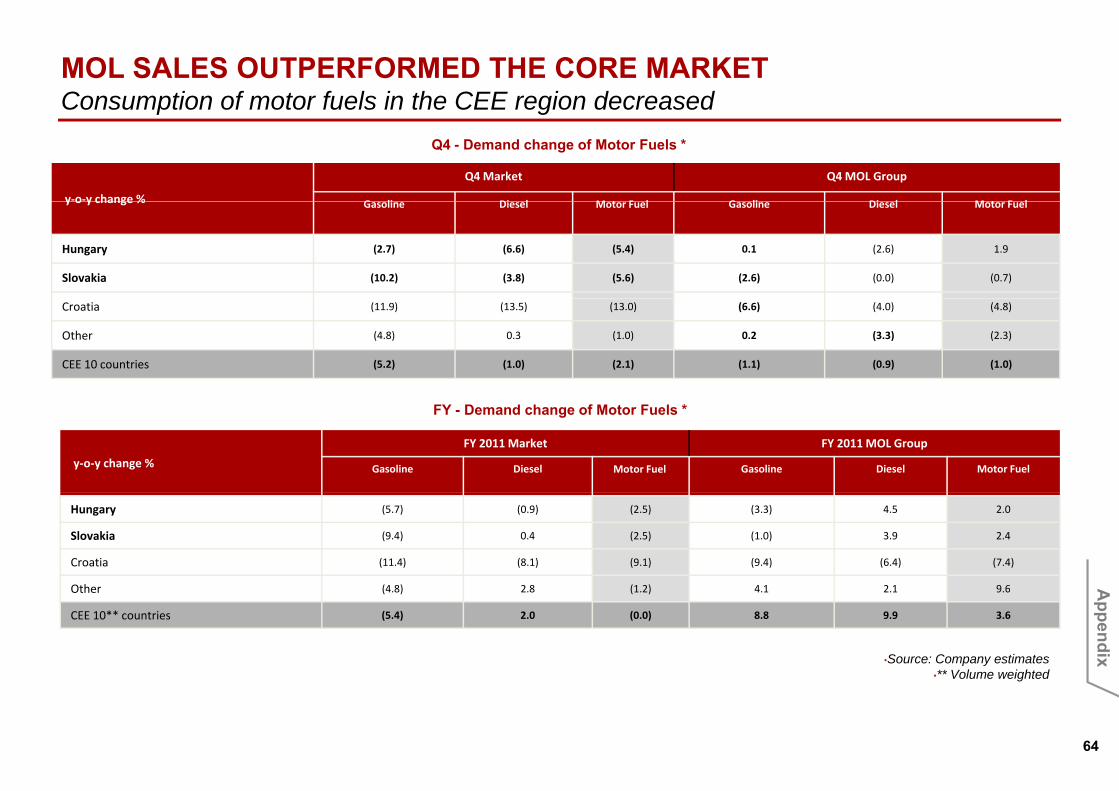
MOL SALES OUTPERFORMED THE CORE MARKETConsumption of motor fuels in the CEE region decreased
y‐o‐y change %
Q4 Market Q4 MOL Group
G li Di l M t F l G li Di l M t F l
Q4 - Demand change of Motor Fuels *
Consumption of motor fuels in the CEE region decreased
y o y change % Gasoline Diesel Motor Fuel Gasoline Diesel Motor Fuel
Hungary (2.7) (6.6) (5.4) 0.1 (2.6) 1.9
Slovakia (10.2) (3.8) (5.6) (2.6) (0.0) (0.7)
Croatia (11.9) (13.5) (13.0) (6.6) (4.0) (4.8)
Other (4.8) 0.3 (1.0) 0.2 (3.3) (2.3)
CEE 10 countries (5.2) (1.0) (2.1) (1.1) (0.9) (1.0)
y‐o‐y change %
FY 2011Market FY 2011 MOL Group
Gasoline Diesel Motor Fuel Gasoline Diesel Motor Fuel
FY - Demand change of Motor Fuels *
Hungary (5.7) (0.9) (2.5) (3.3) 4.5 2.0
Slovakia (9.4) 0.4 (2.5) (1.0) 3.9 2.4
Croatia (11.4) (8.1) (9.1) (9.4) (6.4) (7.4)
Other (4 8) 2 8 (1 2) 4 1 2 1 9 6 AOther (4.8) 2.8 (1.2) 4.1 2.1 9.6
CEE 10** countries (5.4) 2.0 (0.0) 8.8 9.9 3.6
•Source: Company estimates•** Volume weighted
Appendix
64

DOWNSTREAM in Q4 2011 – SUFFERED FROM EXTERNAL ENVIRONMENTClean CCS R&M profit** excluding INA is still positive
External refined product and petrochemical sales (Mt)
Clean CCS R&M profit excluding INA is still positive
DownstreamEBITDA* (HUF bn)
30 6
EBITDA* turned to negative
► challenging Downstream environment
30,1
11 610
20
30
5,3 5,4 5,24
6‐3%
► challenging Downstream environment
► seasonally higher operating costs (energy
and maintenance costs)
-
11,6
-7,1
-10
0
Q4 2010 Q3 2011 Q4 2011
, 5,2
2Q4 2010 Q3 2011 Q4 2011
CCS-based** R&M operating profit –MOL excl. INA (HUF bn)
CCS-based** R&M operating profit -Group (HUF bn)
► seasonally weaker retail sales
… just slightly moderated by internal efforts
7 710,55
10-8,8 -1,2
-29
-20
-10
0 ► efforts to maintain sales margin +‐60%
A7,7
4,2
0Q4 2010 Q3 2011 Q4 2011
-30Q4 2010 Q3 2011 Q4 2011
* Excluding special item
Appendix
65
Excluding special item** Excluding special items, forex gains on debtors and creditors and impairment on inventories
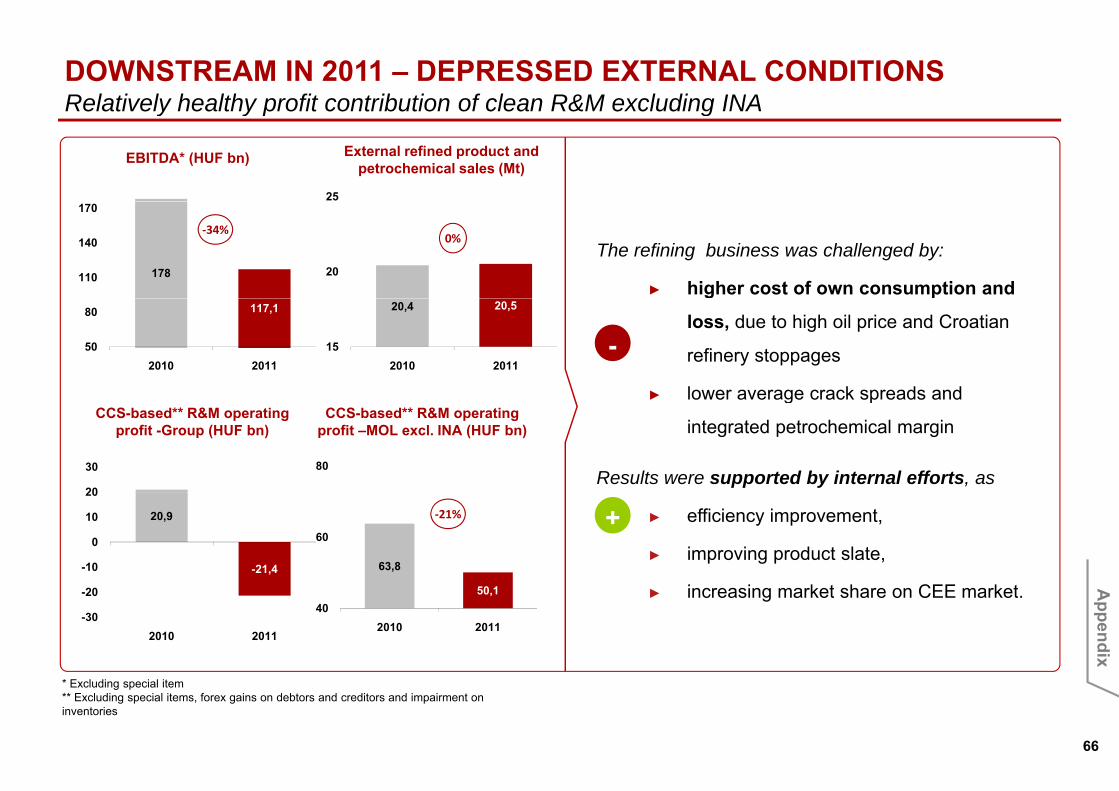
DOWNSTREAM IN 2011 – DEPRESSED EXTERNAL CONDITIONSRelatively healthy profit contribution of clean R&M excluding INA
25
External refined product and petrochemical sales (Mt)
Relatively healthy profit contribution of clean R&M excluding INA
EBITDA* (HUF bn)
The refining business was challenged by:
► higher cost of own consumption and 20178110
140
170
‐34%0%
loss, due to high oil price and Croatian
refinery stoppages
► lower average crack spreads and
20,4 20,5
152010 2011
117,1
50
80
2010 2011-
► lower average crack spreads and
integrated petrochemical margin
Results were supported by internal efforts, as
CCS-based** R&M operating profit –MOL excl. INA (HUF bn)
20
30
CCS-based** R&M operating profit -Group (HUF bn)
80
► efficiency improvement,
► improving product slate,
► increasing market share on CEE market
20,9
-21,4
20
-10
0
10
20
63,8
50 1
60+‐21%
A
► increasing market share on CEE market.
* Excluding special item
-30
-20
2010 2011
50,140
2010 2011
Appendix
66
Excluding special item** Excluding special items, forex gains on debtors and creditors and impairment on inventories
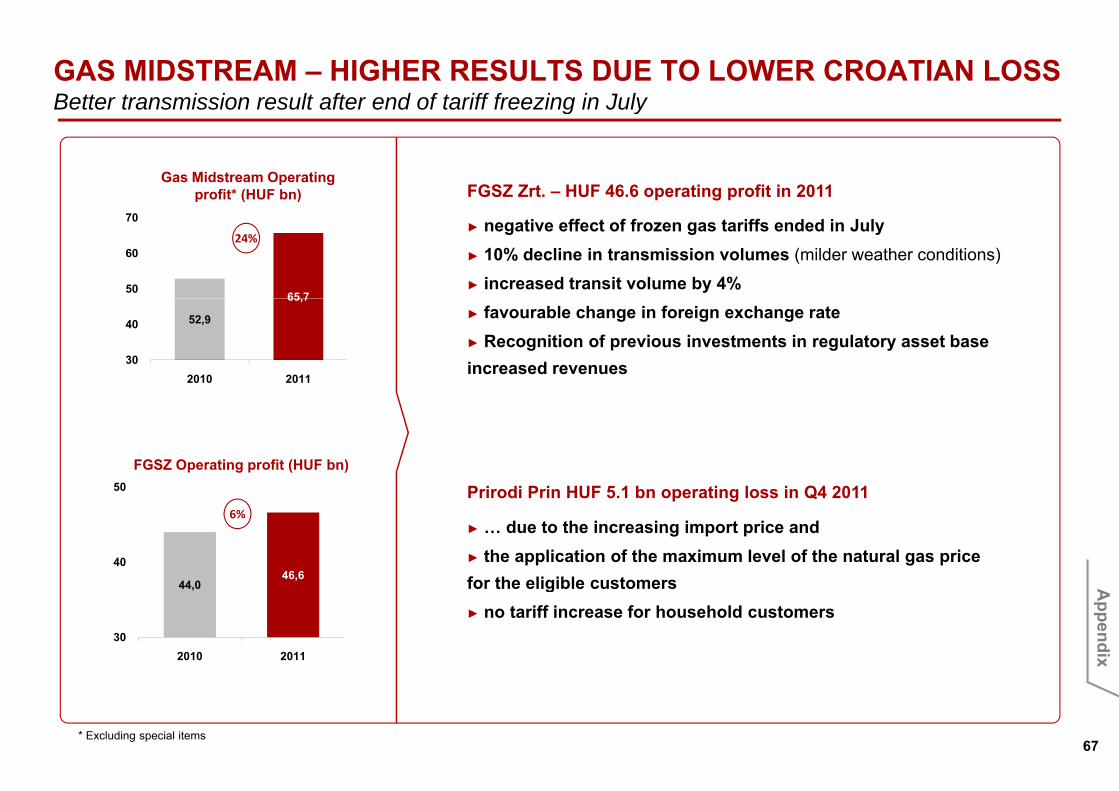
GAS MIDSTREAM – HIGHER RESULTS DUE TO LOWER CROATIAN LOSSBetter transmission result after end of tariff freezing in JulyBetter transmission result after end of tariff freezing in July
FGSZ Zrt. – HUF 46.6 operating profit in 2011Gas Midstream Operating
profit* (HUF bn)
► negative effect of frozen gas tariffs ended in July► 10% decline in transmission volumes (milder weather conditions)
► increased transit volume by 4%65 7
50
60
70
p ( )
24%
► favourable change in foreign exchange rate► Recognition of previous investments in regulatory asset base increased revenues
52,9
65,7
30
40
2010 2011
FGSZ Operating profit (HUF bn)50 Prirodi Prin HUF 5 1 bn operating loss in Q4 2011
44,046,6
40
Prirodi Prin HUF 5.1 bn operating loss in Q4 2011
► … due to the increasing import price and ► the application of the maximum level of the natural gas price for the eligible customers
6%
A,
302010 2011
g► no tariff increase for household customers
Appendix
67* Excluding special items
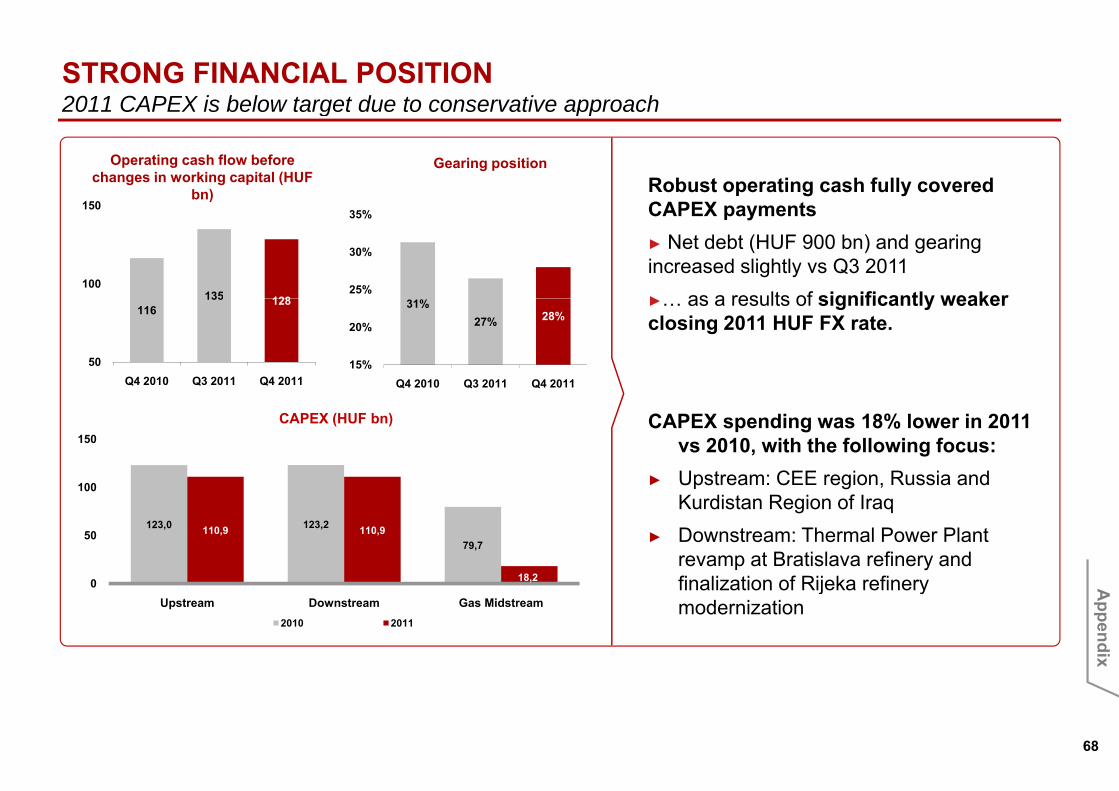
STRONG FINANCIAL POSITION2011 CAPEX is below target due to conservative approach2011 CAPEX is below target due to conservative approach
Robust operating cash fully covered C
Gearing position
150
Operating cash flow before changes in working capital (HUF
bn)CAPEX payments► Net debt (HUF 900 bn) and gearing increased slightly vs Q3 2011► as a results of significantly weaker25%
30%
35%
135 128100
150)
►… as a results of significantly weaker closing 2011 HUF FX rate.
31%27% 28%
15%
20%
Q4 2010 Q3 2011 Q4 2011
116135 128
50Q4 2010 Q3 2011 Q4 2011
CAPEX spending was 18% lower in 2011 vs 2010, with the following focus:
► Upstream: CEE region, Russia and 100
150CAPEX (HUF bn)
Kurdistan Region of Iraq► Downstream: Thermal Power Plant
revamp at Bratislava refinery and finalization of Rijeka refinery
123,0 123,2
79,7110,9 110,9
18,20
50
Afinalization of Rijeka refinery modernizationUpstream Downstream Gas Midstream
2010 2011
Appendix
68