investor presentation - edelweissfin
TRANSCRIPT

Edelweiss Financial Services Limited
Q3FY20 Earnings Update
Contents
2
Quarterly Performance Highlights 1
Liquidity Management
2 Business Performance Highlights
3
Balance Sheet Highlights4
ESG at Edelweiss5
Quarterly Performance Highlights – Q3FY20
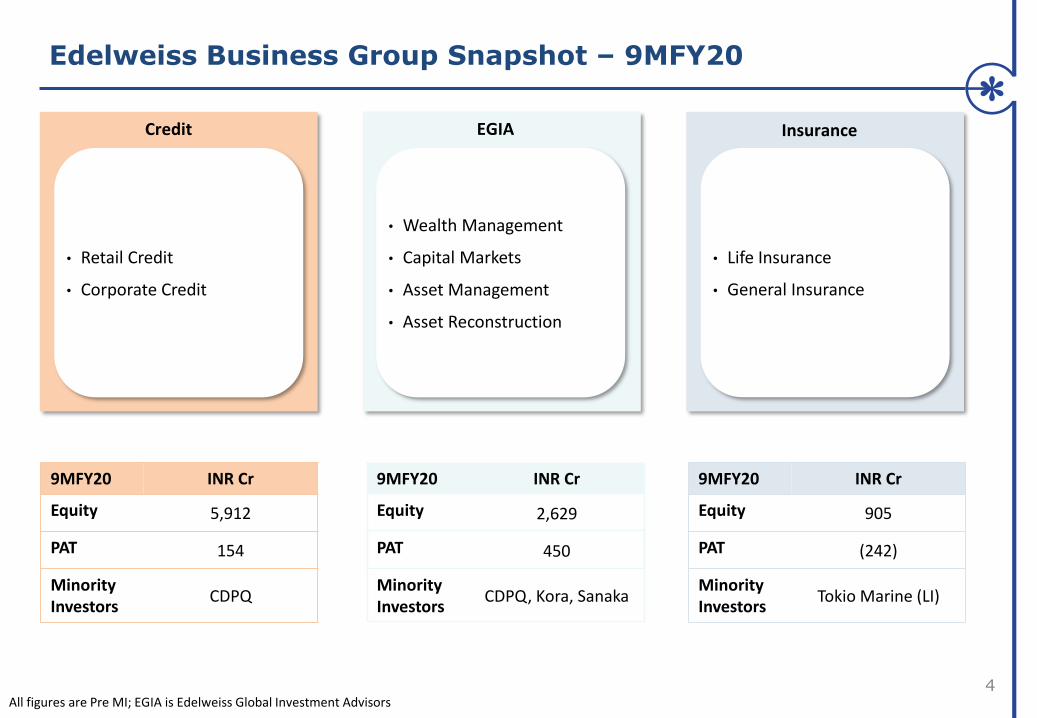
9MFY20 INR Cr
Equity 2,629
PAT 450
Minority Investors
CDPQ, Kora, Sanaka
4
Credit EGIA Insurance
• Wealth Management
• Capital Markets
• Asset Management
• Asset Reconstruction
9MFY20 INR Cr
Equity 5,912
PAT 154
Minority Investors
CDPQ
• Retail Credit
• Corporate Credit
• Life Insurance
• General Insurance
9MFY20 INR Cr
Equity 905
PAT (242)
Minority Investors
Tokio Marine (LI)
All figures are Pre MI; EGIA is Edelweiss Global Investment Advisors
Edelweiss Business Group Snapshot – 9MFY20

5
BVPS Basic EPS
Ex-Insurance Net Worth Ex-Insurance PAT
₹ 348 Cr
Balance Sheet EOP
₹ 48,193 Cr₹ 7,221 Cr
Edelweiss At a Glance – 9MFY20
PAT and Net Worth numbers are post MI
(FV ₹1)
₹ 87.1(FV ₹1)
₹ 2.25

INR Cr EOP Equity Profit after Tax
Total Pre Minority 10,163 35
Credit 5,912 7
EGIA ARC 2,225 113
EGIA Advisory 404 38
Insurance 905 (88)
BMU & Corporate 717 (35)
Minority Interest (MI) 2,418 19
Total Consolidated Post MI 7,745 17
Total Ex-Insurance Post MI 7,221 74
6Equity includes investment by CDPQ of INR 1,040 Cr, Kora Management of INR 177 Cr and Sanaka Capital of INR 117 Cr
Financial Snapshot – Q3FY20
7
Comfortable Equity Position
• Received first tranche of ~INR 300 Cr from Kora Management and Sanaka Capital against their committed investment
• Debt Equity Ratio declined further to 2.9x; Capital adequacy ratio stood at 21.4%
Improvement in Overall Liquidity
• Overall Liquidity stood at ~INR 10,300 Cr which is 22% of balance sheet; Includes undrawn bank lines of ~INR 700 Cr
• Repaid borrowings of INR 5,100 Cr during the quarter
Asset Management AUM grew at 42% YoY
• Received capital commitment of INR 1,750 Cr in Completion financing fund launched with MeritzGroup; Deployed ~INR 1,400 Cr as on Q3FY20 from the fund
• Mutual Fund AUM doubled to INR 24,100 Cr; Raised ~INR 12,400 Cr in Bharat Bond ETF - India’s first Corporate Bond ETF. We now rank 16th in the Mutual Fund industry
1
2
3
Q3FY20 Overview
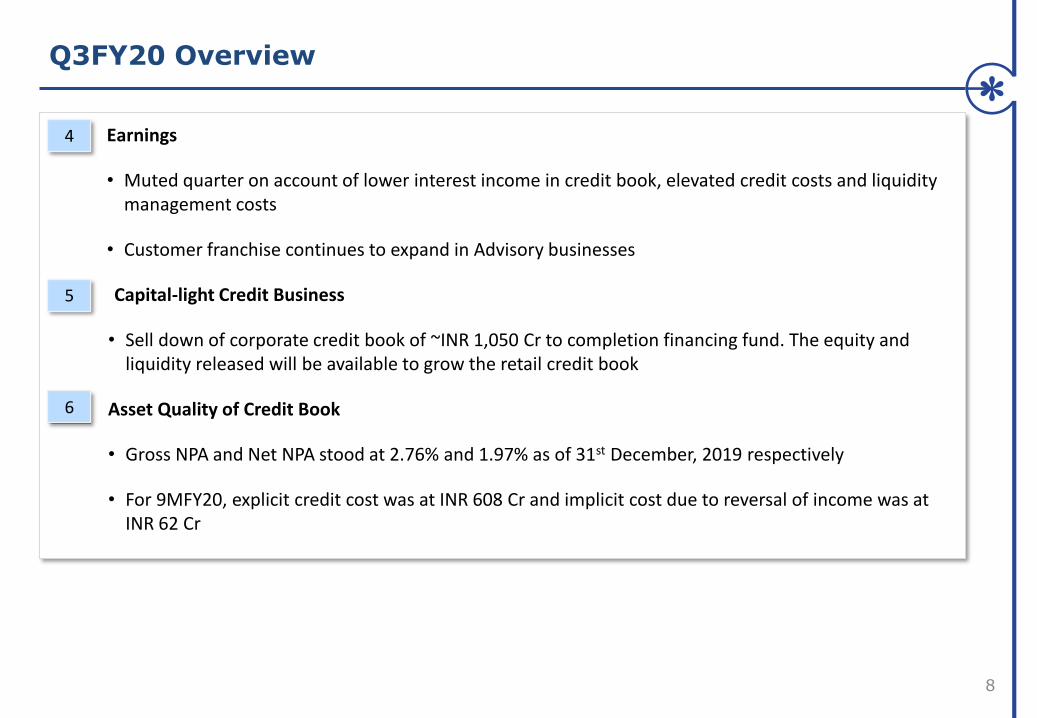
8
Earnings
• Muted quarter on account of lower interest income in credit book, elevated credit costs and liquidity management costs
• Customer franchise continues to expand in Advisory businesses
Capital-light Credit Business
• Sell down of corporate credit book of ~INR 1,050 Cr to completion financing fund. The equity and liquidity released will be available to grow the retail credit book
Asset Quality of Credit Book
• Gross NPA and Net NPA stood at 2.76% and 1.97% as of 31st December, 2019 respectively
• For 9MFY20, explicit credit cost was at INR 608 Cr and implicit cost due to reversal of income was at INR 62 Cr
4
5
6
Q3FY20 Overview
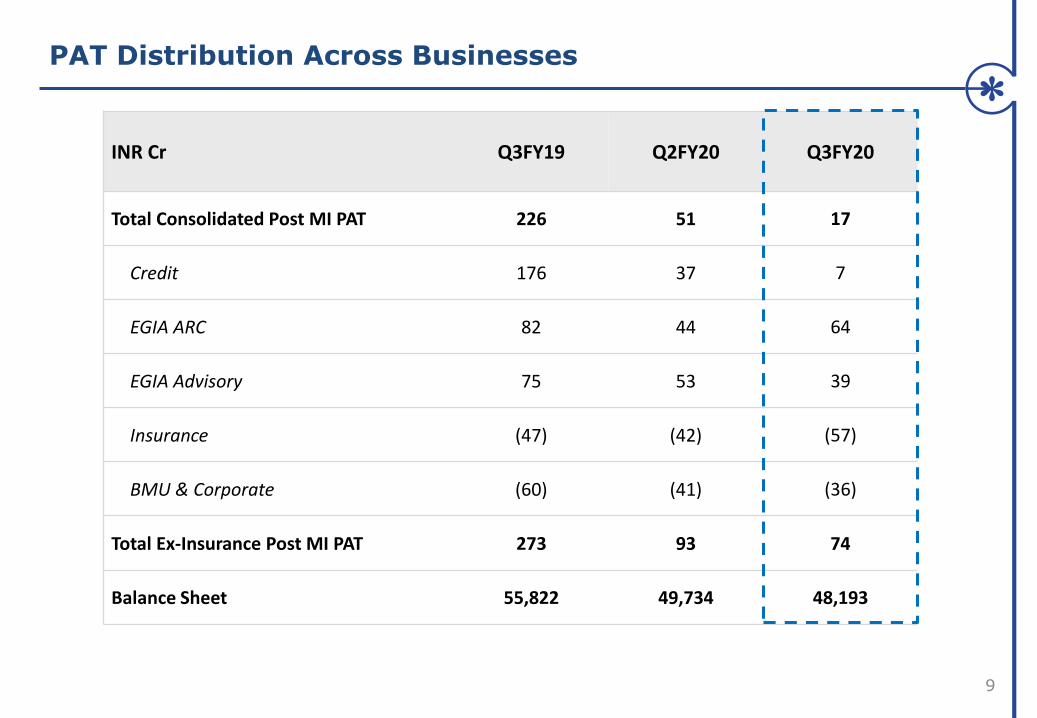
9
INR Cr Q3FY19 Q2FY20 Q3FY20
Total Consolidated Post MI PAT 226 51 17
Credit 176 37 7
EGIA ARC 82 44 64
EGIA Advisory 75 53 39
Insurance (47) (42) (57)
BMU & Corporate (60) (41) (36)
Total Ex-Insurance Post MI PAT 273 93 74
Balance Sheet 55,822 49,734 48,193
PAT Distribution Across Businesses
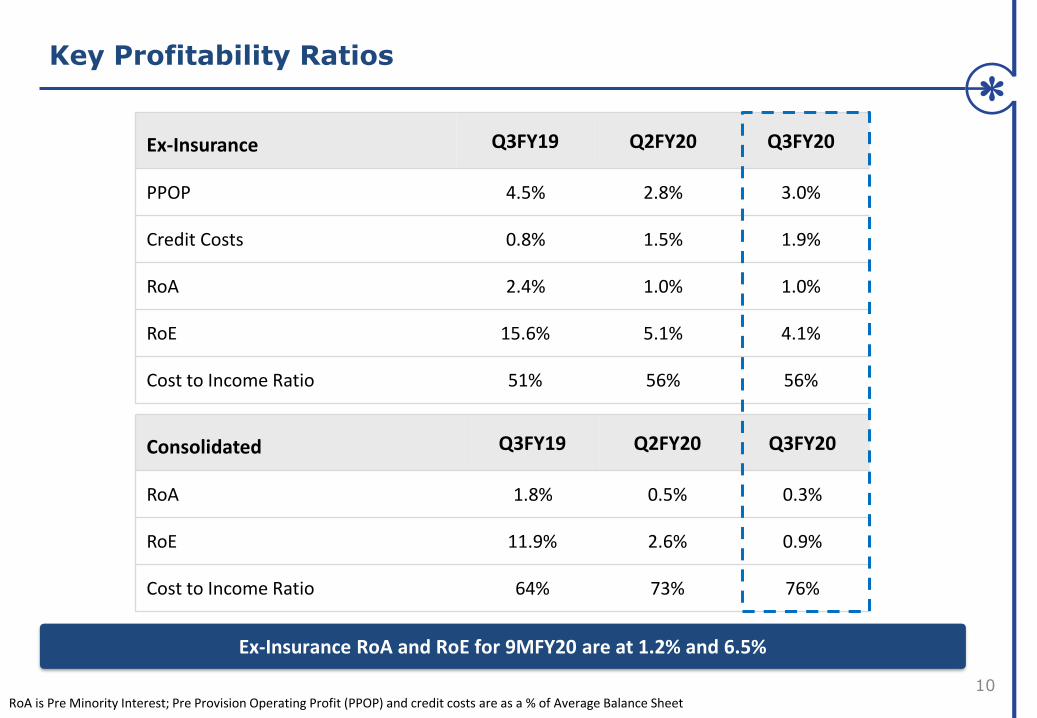
Key Profitability Ratios
10
Ex-Insurance Q3FY19 Q2FY20 Q3FY20
PPOP 4.5% 2.8% 3.0%
Credit Costs 0.8% 1.5% 1.9%
RoA 2.4% 1.0% 1.0%
RoE 15.6% 5.1% 4.1%
Cost to Income Ratio 51% 56% 56%
Consolidated Q3FY19 Q2FY20 Q3FY20
RoA 1.8% 0.5% 0.3%
RoE 11.9% 2.6% 0.9%
Cost to Income Ratio 64% 73% 76%
RoA is Pre Minority Interest; Pre Provision Operating Profit (PPOP) and credit costs are as a % of Average Balance Sheet
Ex-Insurance RoA and RoE for 9MFY20 are at 1.2% and 6.5%
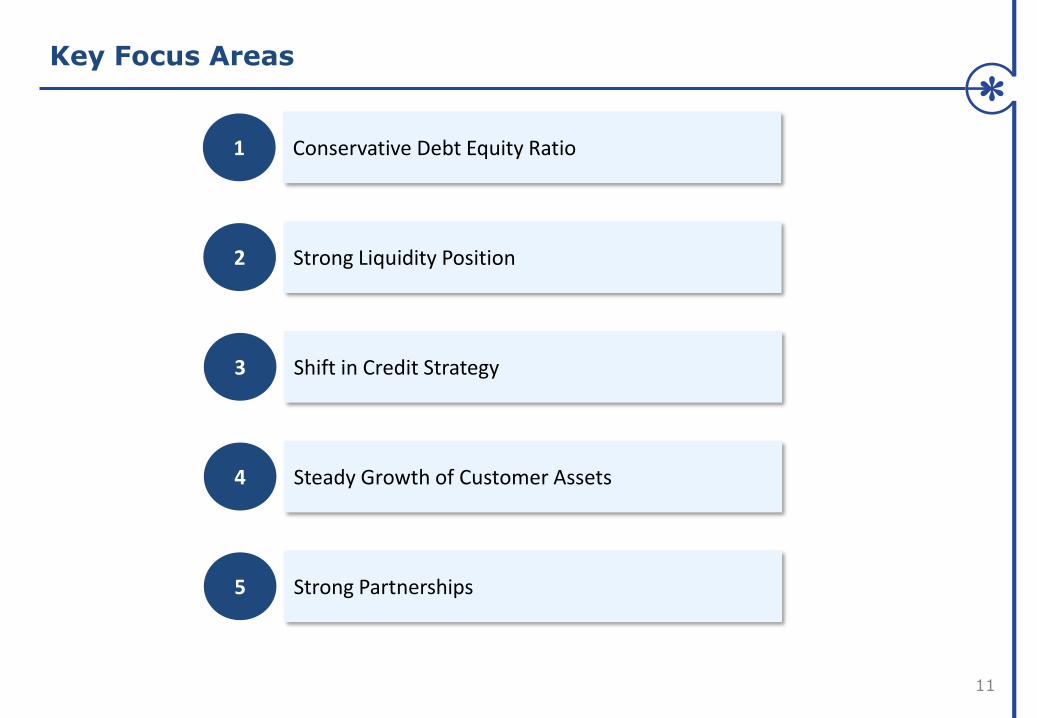
Key Focus Areas
11
1 Conservative Debt Equity Ratio
2 Strong Liquidity Position
3 Shift in Credit Strategy
4 Steady Growth of Customer Assets
5 Strong Partnerships
12
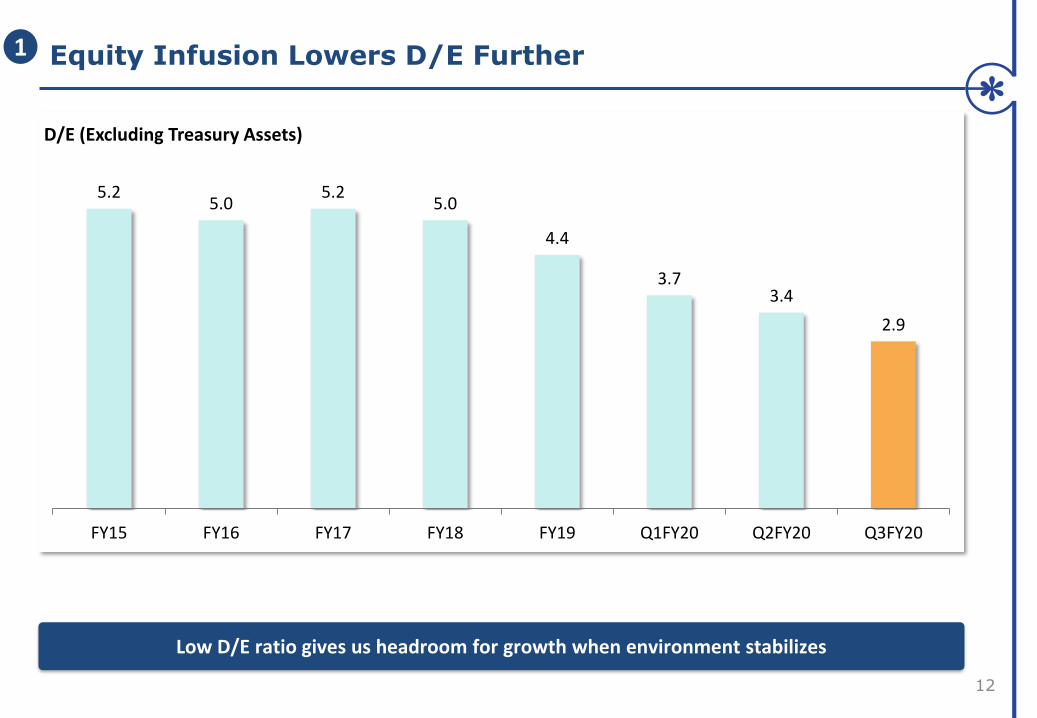
5.25.0
5.25.0
4.4
3.73.4
2.9
FY15 FY16 FY17 FY18 FY19 Q1FY20 Q2FY20 Q3FY20
D/E (Excluding Treasury Assets)
Equity Infusion Lowers D/E Further
Low D/E ratio gives us headroom for growth when environment stabilizes
1

Improvement in Overall Liquidity
13
2.3x
2.0x 1.9x
2.8x
Q4FY19 Q1FY20 Q2FY20 Q3FY20
Liquidity Available/3 Month Repayments
23%22% 22%
28%
Q4FY19 Q1FY20 Q2FY20 Q3FY20
Liquidity Available as a % of Total Borrowings
Key Highlights
• Transfer of wholesale mortgage book to Completion Financing Fund has generated liquidity of INR 750 Cr
• Raised ~INR 500 Cr through Retail NCD issuance which was oversubscribed; Total retail NCD issuance over the last 12 months of INR 1,600 Cr
• Raised long-term debt of ~INR 1,250 Cr in our Asset Reconstruction business
• Generated net liquidity of ~INR 1,000 Cr via Essar Steel resolution
2
14
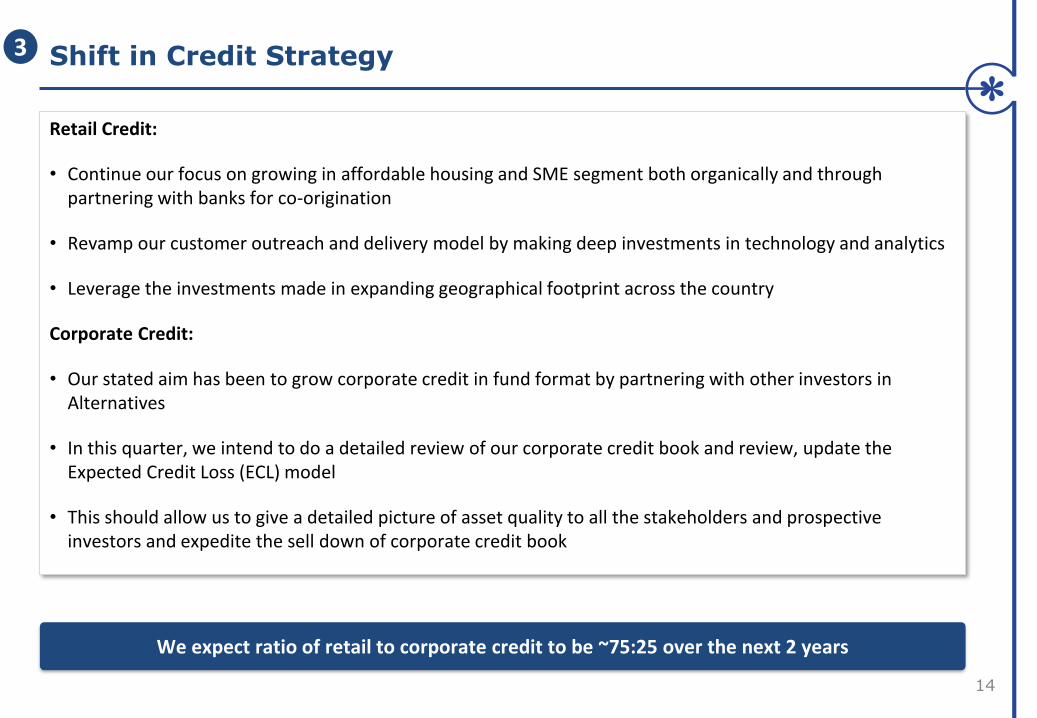
Shift in Credit Strategy
We expect ratio of retail to corporate credit to be ~75:25 over the next 2 years
3
Retail Credit:
• Continue our focus on growing in affordable housing and SME segment both organically and through partnering with banks for co-origination
• Revamp our customer outreach and delivery model by making deep investments in technology and analytics
• Leverage the investments made in expanding geographical footprint across the country
Corporate Credit:
• Our stated aim has been to grow corporate credit in fund format by partnering with other investors in Alternatives
• In this quarter, we intend to do a detailed review of our corporate credit book and review, update the Expected Credit Loss (ECL) model
• This should allow us to give a detailed picture of asset quality to all the stakeholders and prospective investors and expedite the sell down of corporate credit book

Customer Assets have Grown Despite Credit Dislocation
15
Customer Assets
Assets under Advice (Wealth Management)
14%
11%
217,900
111,200
YoY GrowthAs on 31st December, 2019 (rounded off to nearest 100) INR Cr
Funds under Management (Asset Management) 42%
Assets under Custody & Clearing 24%
Edelweiss contribution has been excluded from Asset Reconstruction (ARC assets) and Funds under Management (Asset Management)
ARC AUM declined on account of Essar Steel resolution
50,200
22,000
Asset Reconstruction (ARC) Assets under Management (10%)34,500
The franchise remains strong across all our advisory businesses
4

Strategic Investors and Partners in Edelweiss Group
16
CDPQ Tokio Marine Allianz
Bank of Singapore
5
Edelweiss Global Investment Advisors (EGIA)
Overview

Edelweiss Global Investment Advisors
Wealth Management Asset Management
• UHNI & Family Office Advisory
• Affluent business
• Asset Services
• Institutional Equities
• ECM, DCM & Advisory
• Alternative Asset Management
• Mutual Fund
• Asset Reconstruction
18
• Amongst the top 3 Wealth
Management players in India
• Dominant Capital Markets practice
• Market leadership in Alternative
Asset Management
• India’s largest Asset Reconstruction
Company
Customer Assets ~ INR 2.2 Trillion in EGIA
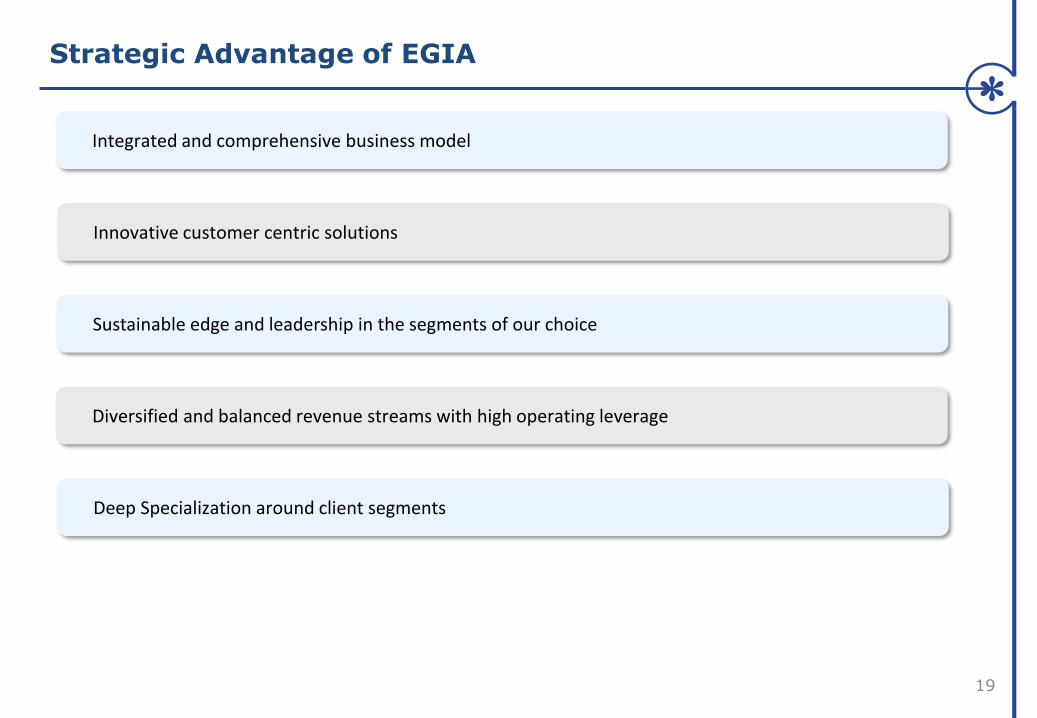
Strategic Advantage of EGIA
19
Integrated and comprehensive business model
Innovative customer centric solutions
Sustainable edge and leadership in the segments of our choice
Diversified and balanced revenue streams with high operating leverage
Deep Specialization around client segments

Key Imperatives to Achieve Strategic Objectives
20
Continue to focus on customer obsession to drive innovation
Technology driven platform to deliver superior customer experience and drive cost efficiencies
Further strengthen processes for maintaining highest standards of governance and risk management
With these measures, we will continue to remain market dominant in each of the businesses

5,000
18,200
28,30035,800
50,200
FY16 FY17 FY18 FY19 Q3FY20
29,500
60,300
90,100106,000 111,200
FY16 FY17 FY18 FY19 Q3FY20
Significant Scale Established in the Last Few Years
21
Wealth Management AuA (INR Cr) Asset Management AUM (INR Cr)
ARC AUM (INR Cr) Asset under Custody (INR Cr)
25,200
34,70037,800 39,200
34,500
FY16 FY17 FY18 FY19 Q3FY20
1,200
4,700
12,700
19,90022,000
FY16 FY17 FY18 FY19 Q3FY20
Edelweiss contribution has been excluded from Asset Reconstruction (ARC assets) and Funds under Management (Asset Management)
Customer Assets
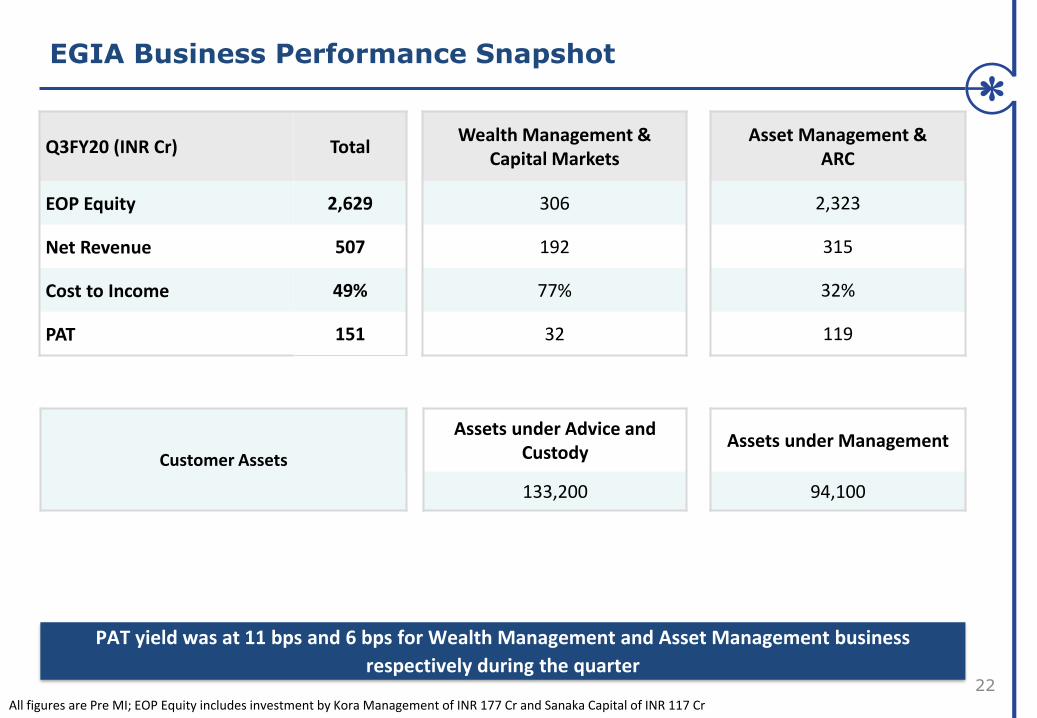
EGIA Business Performance Snapshot
22
Q3FY20 (INR Cr) Total Wealth Management &
Capital MarketsAsset Management &
ARC
EOP Equity 2,629 306 2,323
Net Revenue 507 192 315
Cost to Income 49% 77% 32%
PAT 151 32 119
Assets under Advice and Custody
Assets under Management
133,200 94,100
All figures are Pre MI; EOP Equity includes investment by Kora Management of INR 177 Cr and Sanaka Capital of INR 117 Cr
PAT yield was at 11 bps and 6 bps for Wealth Management and Asset Management business
respectively during the quarter
23
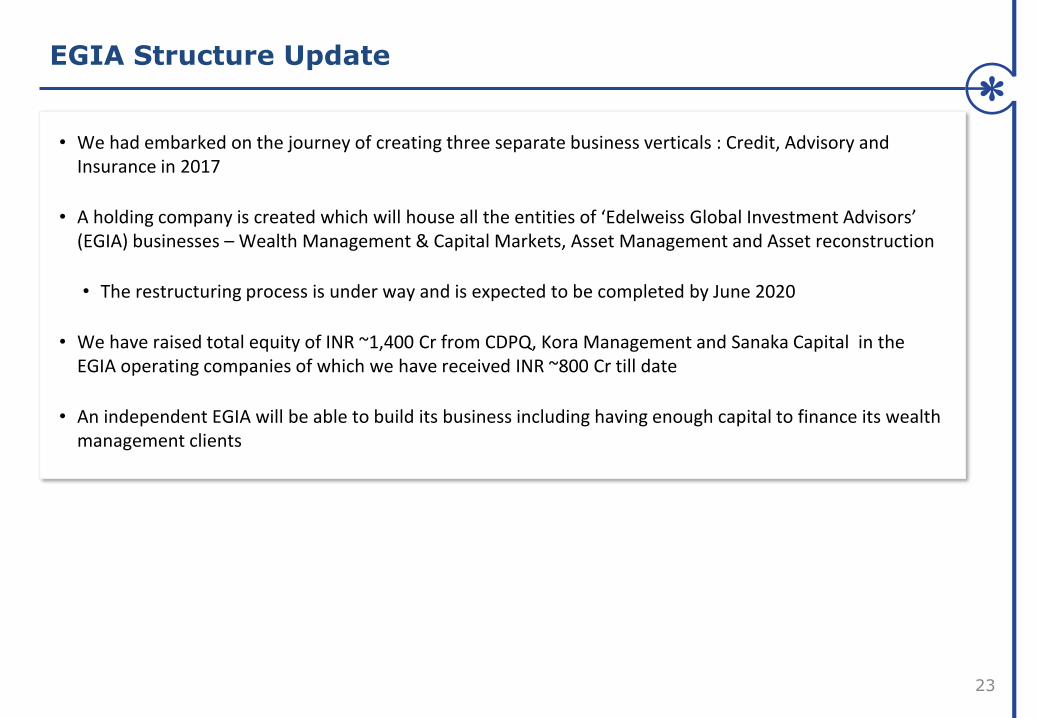
• We had embarked on the journey of creating three separate business verticals : Credit, Advisory and Insurance in 2017
• A holding company is created which will house all the entities of ‘Edelweiss Global Investment Advisors’ (EGIA) businesses – Wealth Management & Capital Markets, Asset Management and Asset reconstruction
• The restructuring process is under way and is expected to be completed by June 2020
• We have raised total equity of INR ~1,400 Cr from CDPQ, Kora Management and Sanaka Capital in the EGIA operating companies of which we have received INR ~800 Cr till date
• An independent EGIA will be able to build its business including having enough capital to finance its wealth management clients
EGIA Structure Update

Edelweiss Global Investment Advisors
Wealth Management . Capital Markets
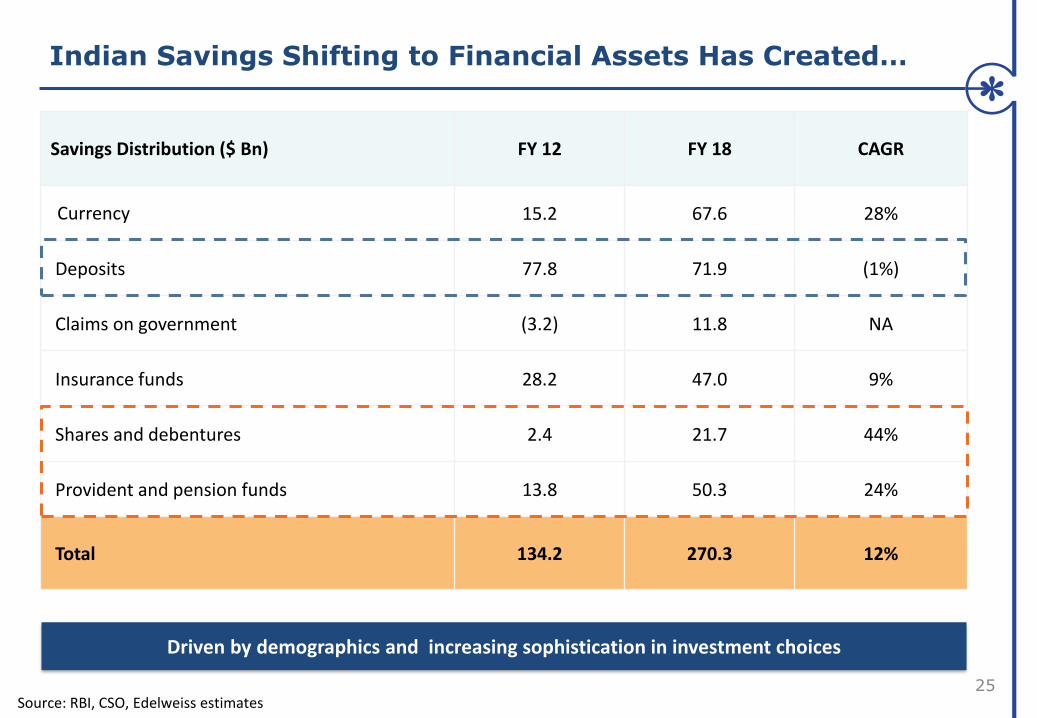
Indian Savings Shifting to Financial Assets Has Created…
25
Driven by demographics and increasing sophistication in investment choices
Savings Distribution ($ Bn) FY 12 FY 18 CAGR
Currency 15.2 67.6 28%
Deposits 77.8 71.9 (1%)
Claims on government (3.2) 11.8 NA
Insurance funds 28.2 47.0 9%
Shares and debentures 2.4 21.7 44%
Provident and pension funds 13.8 50.3 24%
Total 134.2 270.3 12%
Source: RBI, CSO, Edelweiss estimates
26
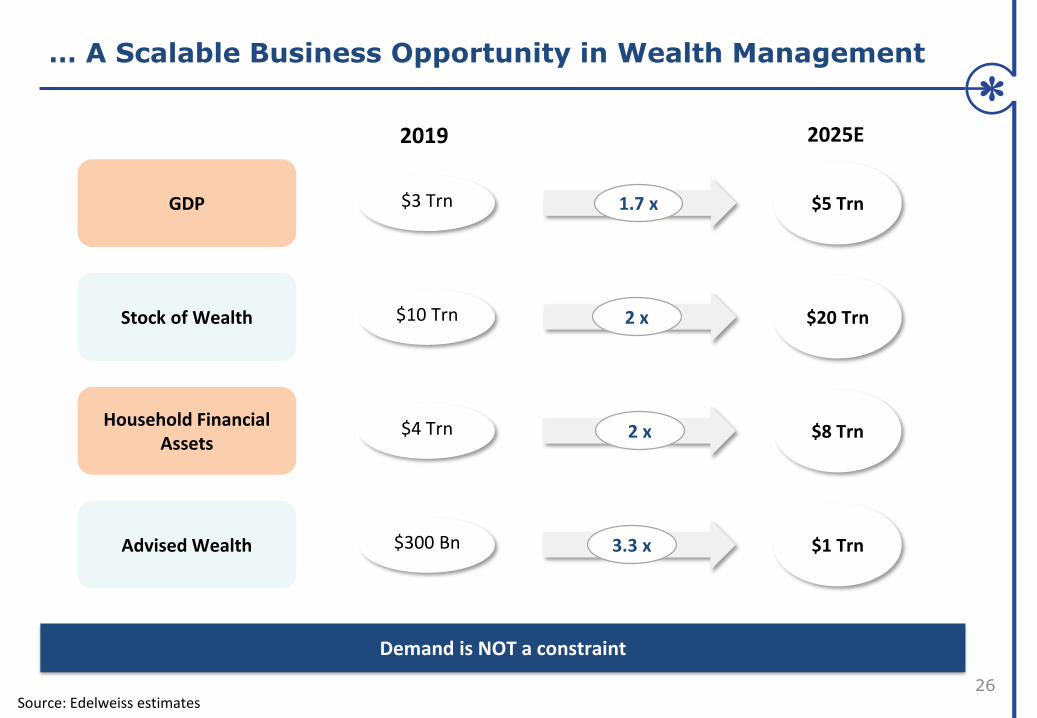
Household Financial Assets
Advised Wealth
$4 Trn
$300 Bn
$8 Trn
$1 Trn3.3 x
2 x
GDP
Stock of Wealth
$3 Trn
$10 Trn
$5 Trn
$20 Trn
2025E2019
2 x
1.7 x
Source: Edelweiss estimates
… A Scalable Business Opportunity in Wealth Management
Demand is NOT a constraint
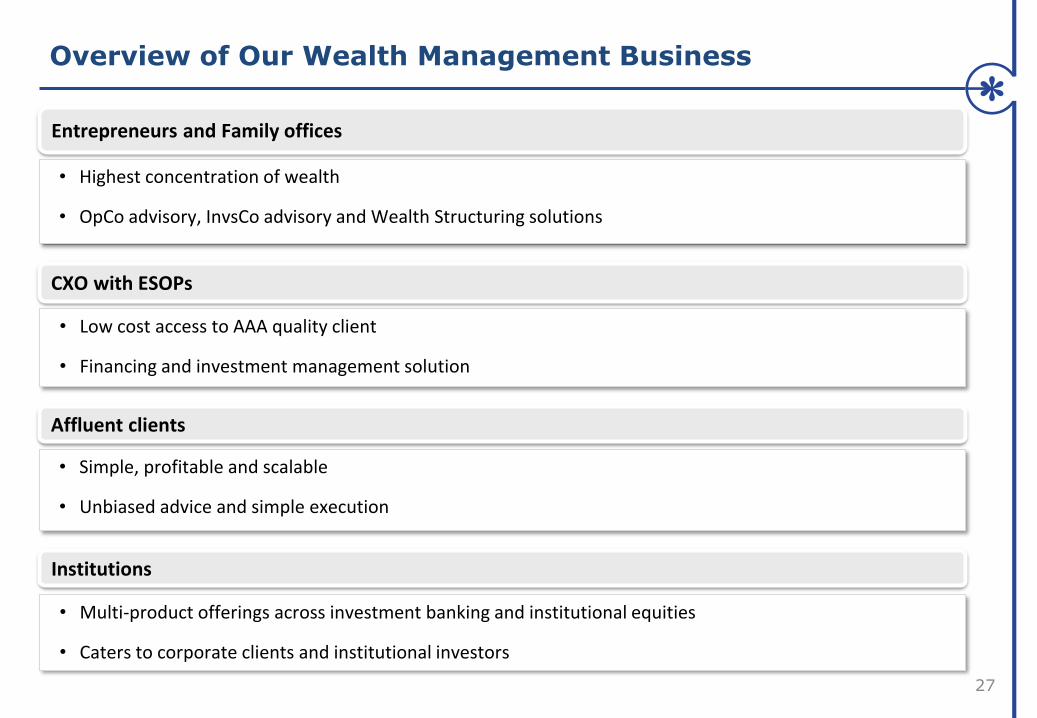
Overview of Our Wealth Management Business
27
Entrepreneurs and Family offices
• Highest concentration of wealth
• OpCo advisory, InvsCo advisory and Wealth Structuring solutions
Affluent clients
• Simple, profitable and scalable
• Unbiased advice and simple execution
• Low cost access to AAA quality client
• Financing and investment management solution
CXO with ESOPs
Institutions
• Multi-product offerings across investment banking and institutional equities
• Caters to corporate clients and institutional investors
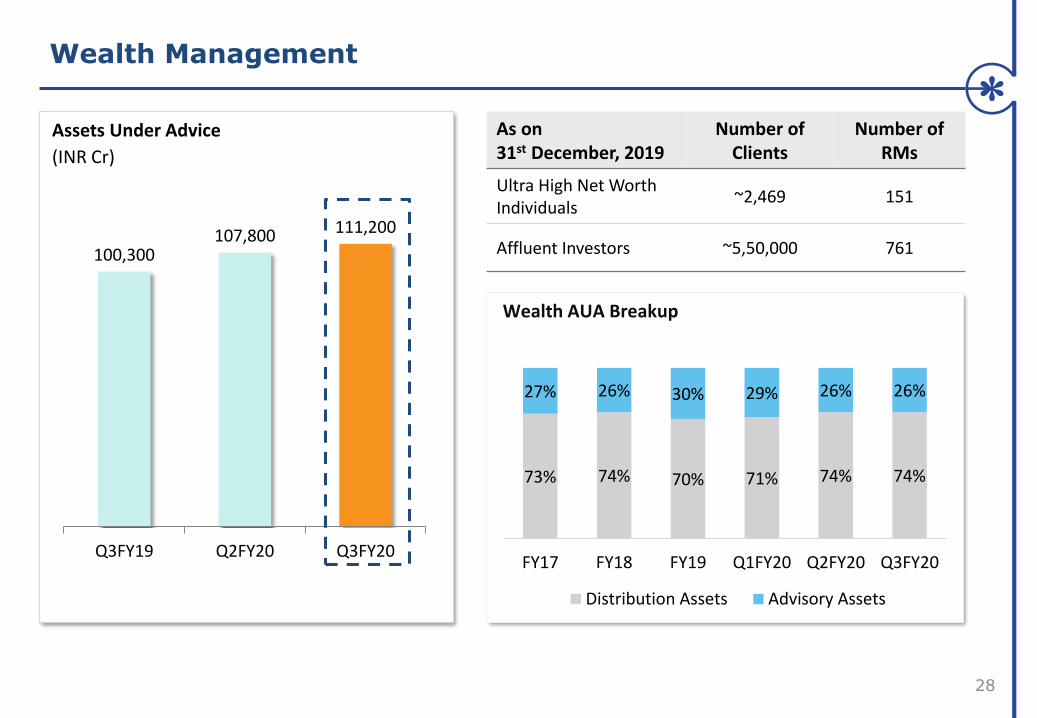
28
As on31st December, 2019
Number of Clients
Number of RMs
Ultra High Net Worth Individuals
~2,469 151
Affluent Investors ~5,50,000 761
96,300
73% 74% 70% 71% 74% 74%
27% 26% 30% 29% 26% 26%
FY17 FY18 FY19 Q1FY20 Q2FY20 Q3FY20
Distribution Assets Advisory Assets
Wealth AUA Breakup
Assets Under Advice
(INR Cr)
100,300107,800 111,200
Q3FY19 Q2FY20 Q3FY20
Wealth Management
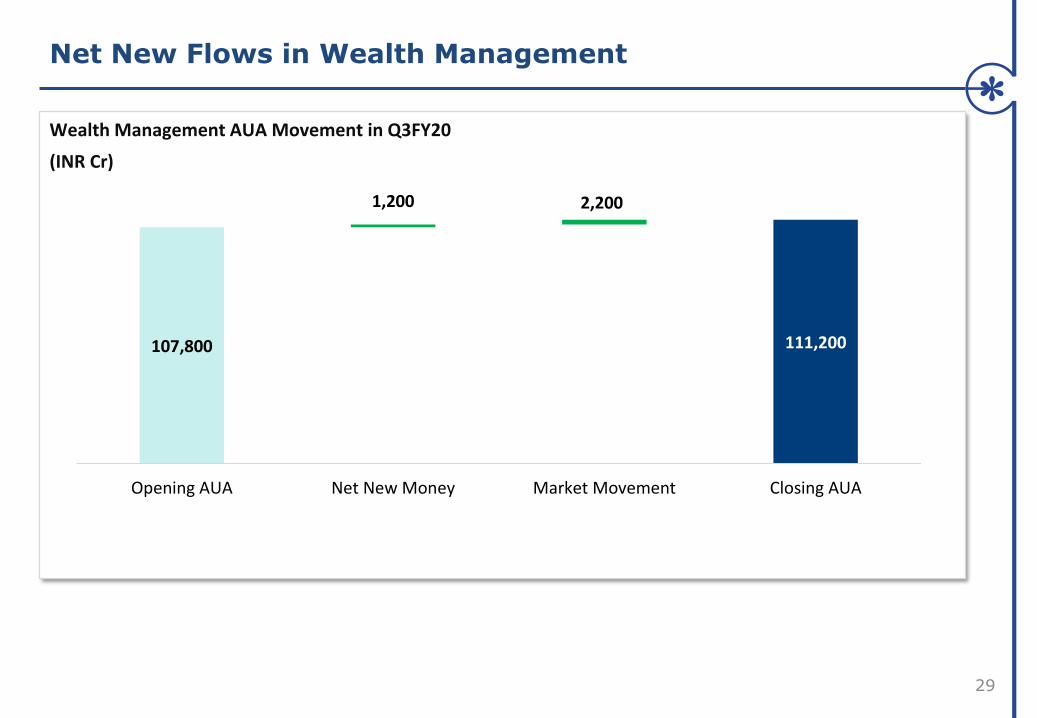
Net New Flows in Wealth Management
29
101,100
107,800
1,200 2,200
111,200
Opening AUA Net New Money Market Movement Closing AUA
Wealth Management AUA Movement in Q3FY20
(INR Cr)
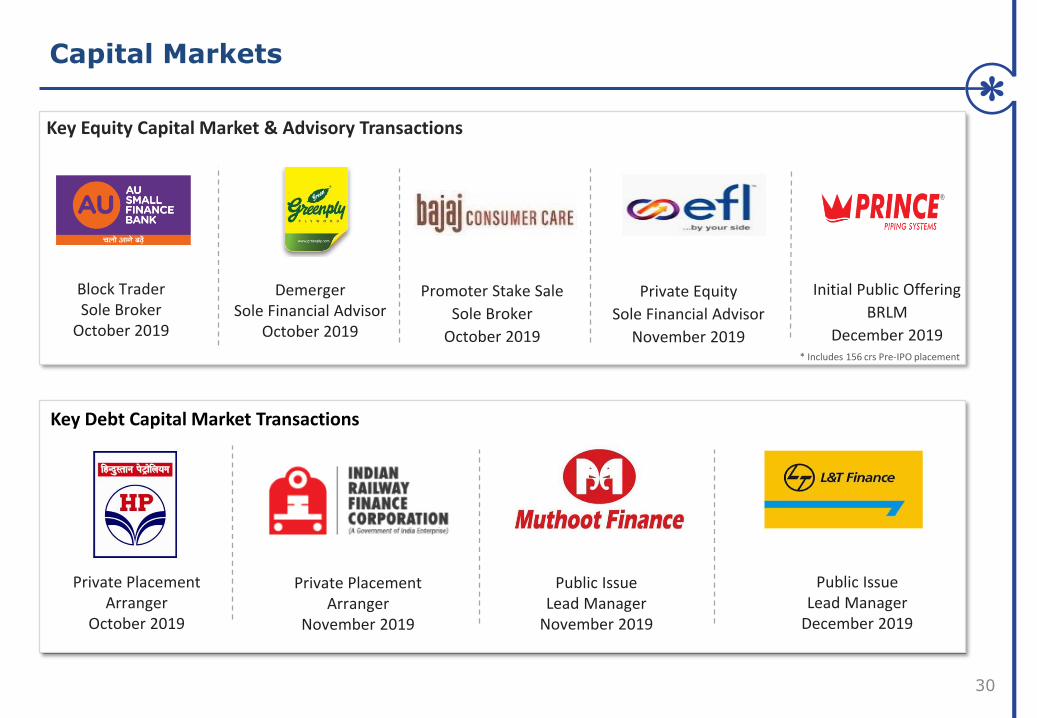
Capital Markets
30
Key Equity Capital Market & Advisory Transactions
Initial Public Offering
BRLM
December 2019
DemergerSole Financial Advisor
October 2019
Block TraderSole Broker
October 2019
* Includes 156 crs Pre-IPO placement
Promoter Stake Sale
Sole Broker
October 2019
Private Equity
Sole Financial Advisor
November 2019
Key Debt Capital Market Transactions
Private PlacementArranger
October 2019
Private PlacementArranger
November 2019
Public IssueLead Manager
November 2019
Public IssueLead Manager
December 2019

Edelweiss Global Investment Advisors
Asset Management . Asset Reconstruction Business
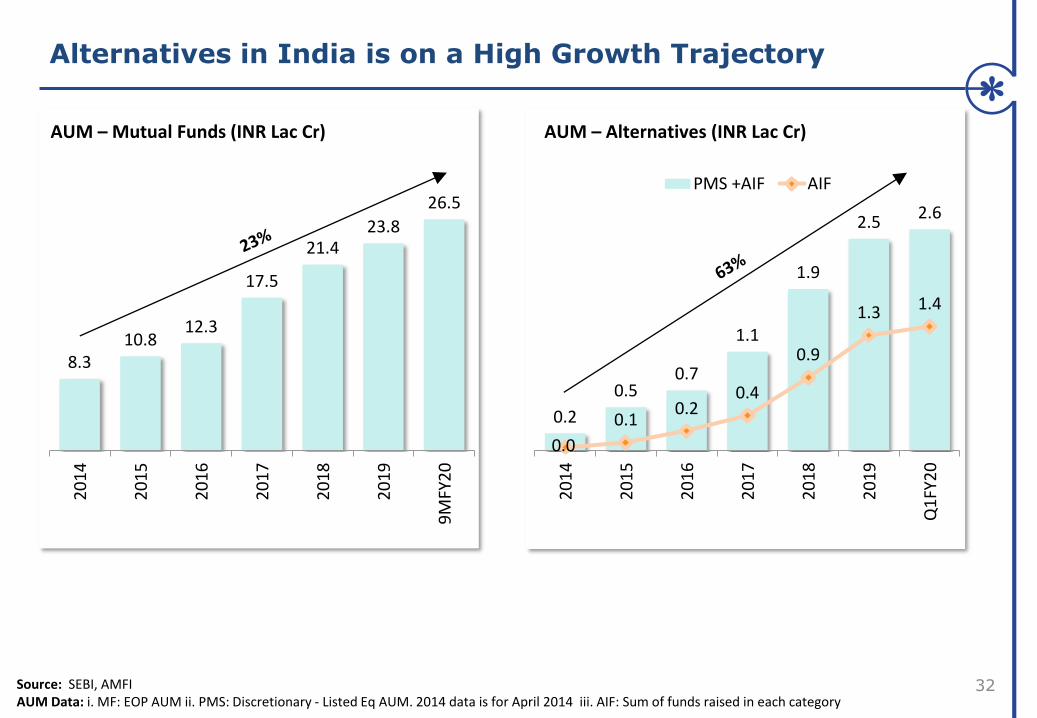
Alternatives in India is on a High Growth Trajectory
32
AUM – Mutual Funds (INR Lac Cr)
8.310.8
12.3
17.5
21.423.8
26.5
20
14
20
15
20
16
20
17
20
18
20
19
9M
FY2
0
AUM – Alternatives (INR Lac Cr)
0.2
0.5 0.7
1.1
1.9
2.5 2.6
0.0
0.10.2
0.4
0.9
1.3 1.4
20
14
20
15
20
16
20
17
20
18
20
19
Q1
FY2
0
PMS +AIF AIF
Source: SEBI, AMFIAUM Data: i. MF: EOP AUM ii. PMS: Discretionary - Listed Eq AUM. 2014 data is for April 2014 iii. AIF: Sum of funds raised in each category

What Is Driving Growth In Alternatives?
33
Re
turn
Risk
FD ~3.5% - 7%
Alternatives
~10% - 16%Mutual Funds
~8% - 14%
• Globally yields have come down
• India offers superior yields
• There is an increased appetite for yield amongst
domestic investors
Global demand Domestic demand
India bank FD sometimes
offers less than Gsec returns
Alternatives offer superior risk adjusted returns with diversification
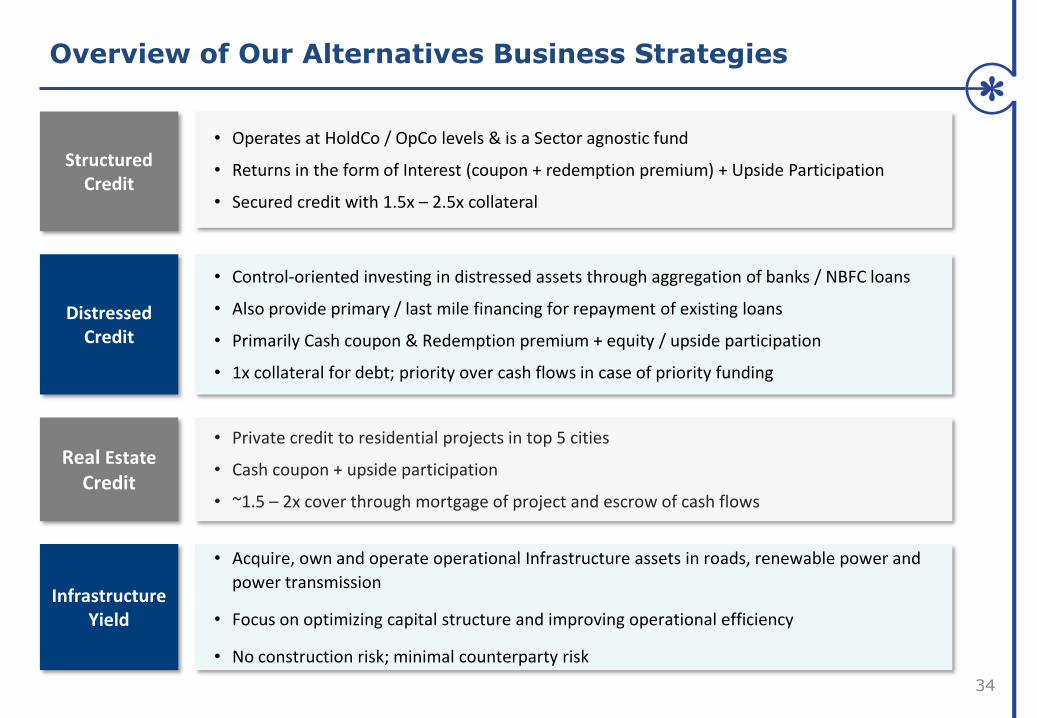
Overview of Our Alternatives Business Strategies
• Operates at HoldCo / OpCo levels & is a Sector agnostic fund
• Returns in the form of Interest (coupon + redemption premium) + Upside Participation
• Secured credit with 1.5x – 2.5x collateral
Structured Credit
• Control-oriented investing in distressed assets through aggregation of banks / NBFC loans
• Also provide primary / last mile financing for repayment of existing loans
• Primarily Cash coupon & Redemption premium + equity / upside participation
• 1x collateral for debt; priority over cash flows in case of priority funding
Distressed Credit
• Private credit to residential projects in top 5 cities
• Cash coupon + upside participation
• ~1.5 – 2x cover through mortgage of project and escrow of cash flows
Real Estate
Credit
• Acquire, own and operate operational Infrastructure assets in roads, renewable power and
power transmission
• Focus on optimizing capital structure and improving operational efficiency
• No construction risk; minimal counterparty risk
Infrastructure Yield
34
11,100 11,000
24,1006,100 5,200
5,400
Q3FY19 Q2FY20 Q3FY20
Mutual Fund Mutli Strategy Funds and PMS
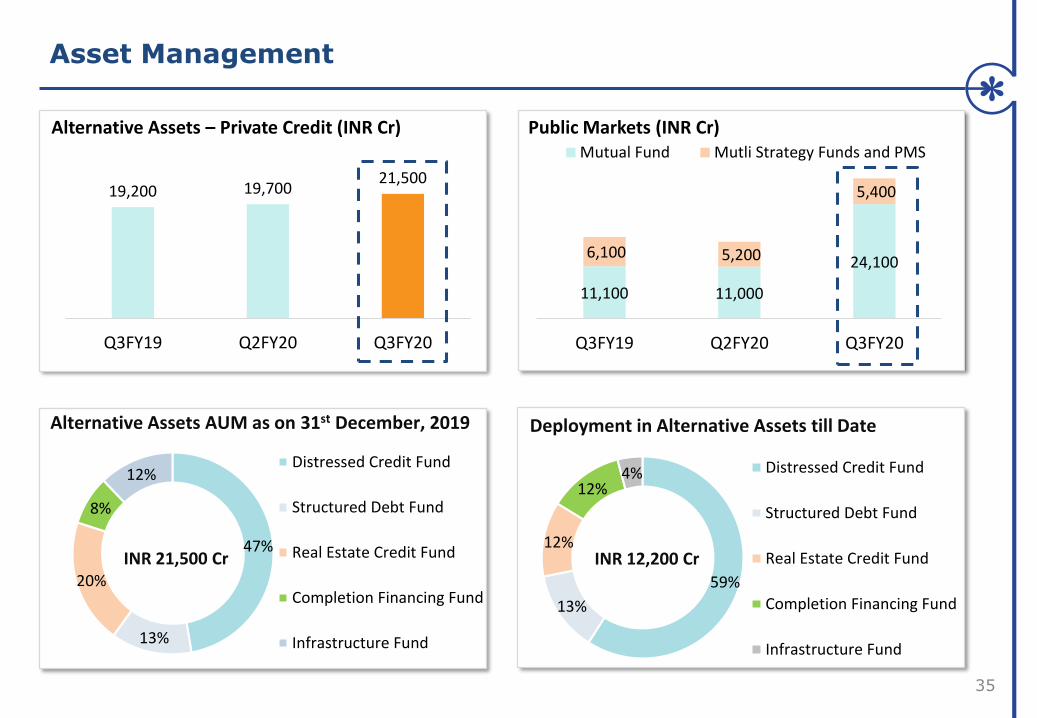
Asset Management
35
59%
13%
12%
12%4% Distressed Credit Fund
Structured Debt Fund
Real Estate Credit Fund
Completion Financing Fund
Infrastructure Fund
47%
13%
20%
8%
12%Distressed Credit Fund
Structured Debt Fund
Real Estate Credit Fund
Completion Financing Fund
Infrastructure Fund
19,200 19,70021,500
Q3FY19 Q2FY20 Q3FY20
Alternative Assets – Private Credit (INR Cr) Public Markets (INR Cr)
Alternative Assets AUM as on 31st December, 2019
INR 21,500 Cr
Deployment in Alternative Assets till Date
INR 12,200 Cr
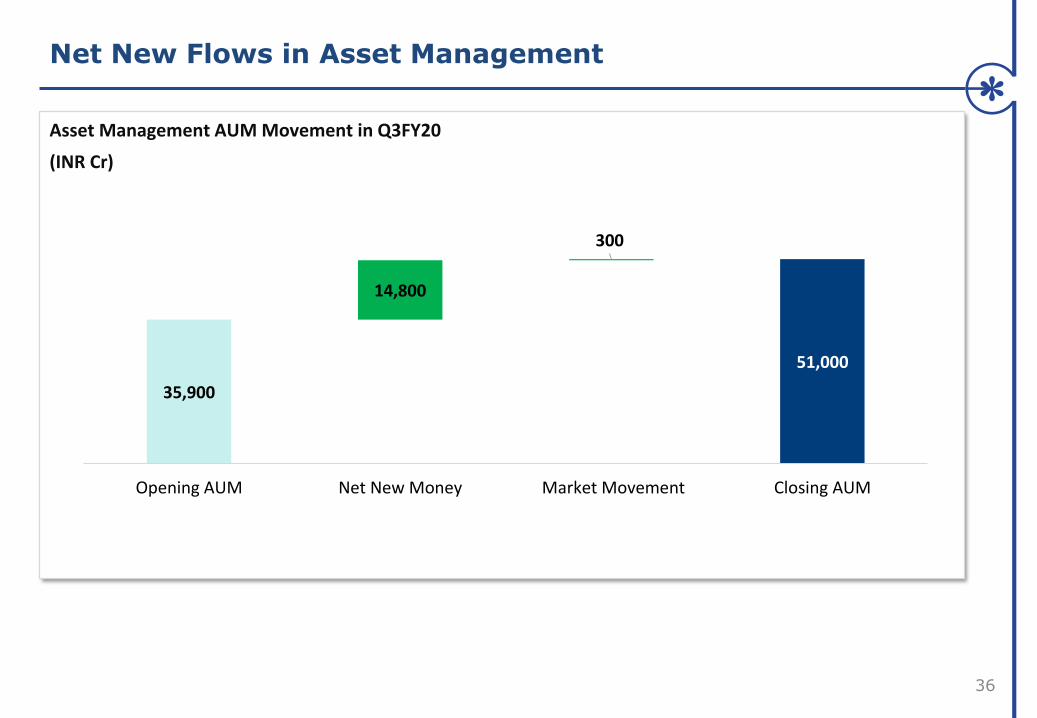
35,900
14,800
300
51,000
Opening AUM Net New Money Market Movement Closing AUM
Net New Flows in Asset Management
36
Asset Management AUM Movement in Q3FY20
(INR Cr)

6,800 8,800 8,600
38,30038,200
34,500
Q3FY19 Q2FY20 Q3FY20
Edelweiss Contribution Investors Contribution
677 1,0822,574
7,019
10,003
FY16 FY17 FY18 FY19 9MFY20
26%
52%
22%Equity
Debt
Participatory NCDs
Asset Reconstruction Overview
37
AUM
(INR Cr)
ARC Recoveries
(INR Cr)
Funding profile of Edelweiss’s Contribution in ARC
(INR Cr)
INR 8,600 Cr
ARC pipeline remains robust
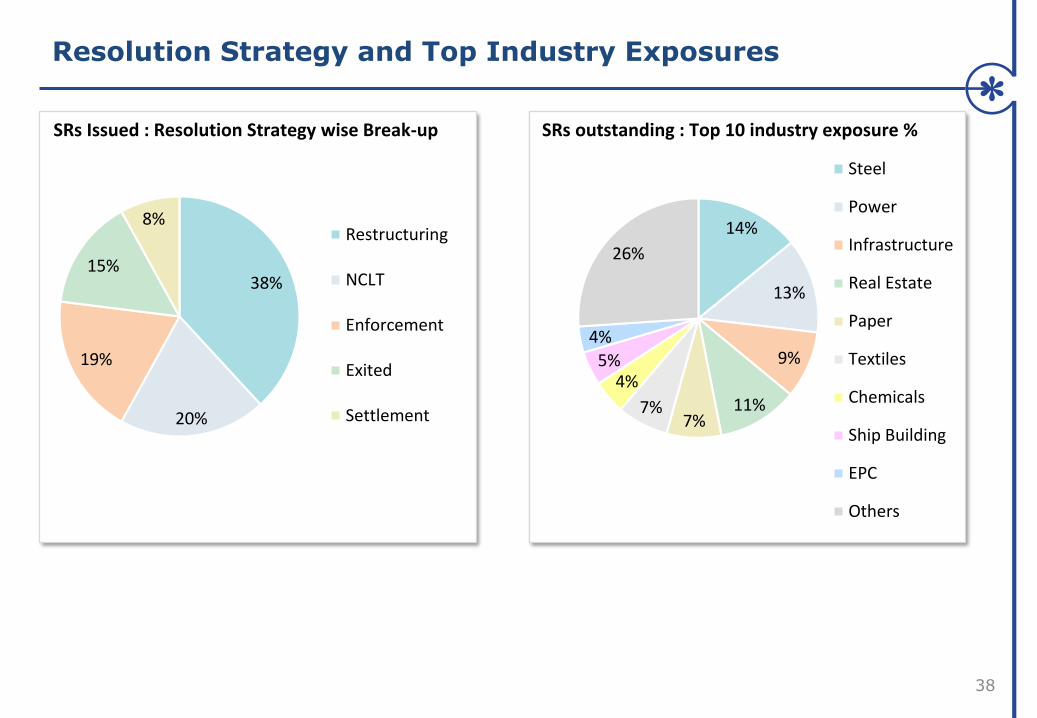
14%
13%
9%
11%7%
7%
4%5%
4%
26%
Steel
Power
Infrastructure
Real Estate
Paper
Textiles
Chemicals
Ship Building
EPC
Others
38%
20%
19%
15%
8%Restructuring
NCLT
Enforcement
Exited
Settlement
Resolution Strategy and Top Industry Exposures
38
SRs outstanding : Top 10 industry exposure %SRs Issued : Resolution Strategy wise Break-up
Credit Business
Retail Credit . Corporate Credit

While There Is Enough Liquidity in The System..
40
-5
0
5
10
15
20
25
30
35
Jan 04 Jan 06 Jan 08 Jan 10 Jan 12 Jan 14 Jan 16 Jan 18 Jan 20
(%, Y
oY)
RBI durable liquidity
RBI’s durable liquidity is the sum of FX assets and G-sec purchases by RBI. For DeMon period (Nov 2016– Nov 2018), we have used 2 year CAGR
At Decadal High
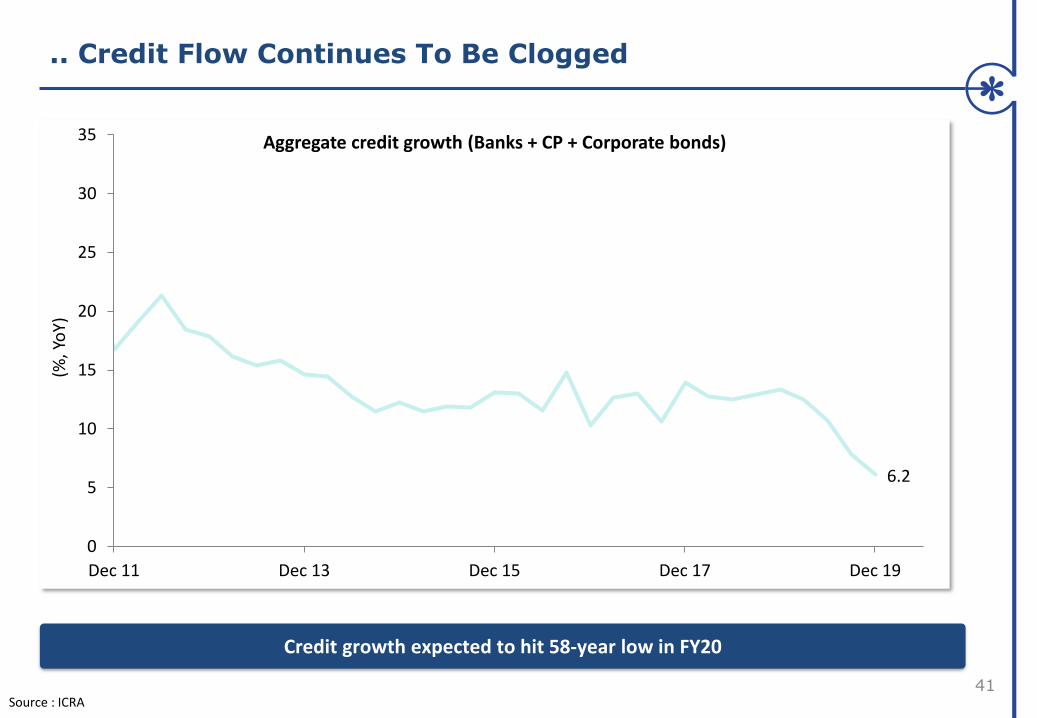
.. Credit Flow Continues To Be Clogged
41
6.2
0
5
10
15
20
25
30
35
Dec 11 Dec 13 Dec 15 Dec 17 Dec 19
(%, Y
oY)
Aggregate credit growth (Banks + CP + Corporate bonds)
Credit growth expected to hit 58-year low in FY20
Source : ICRA
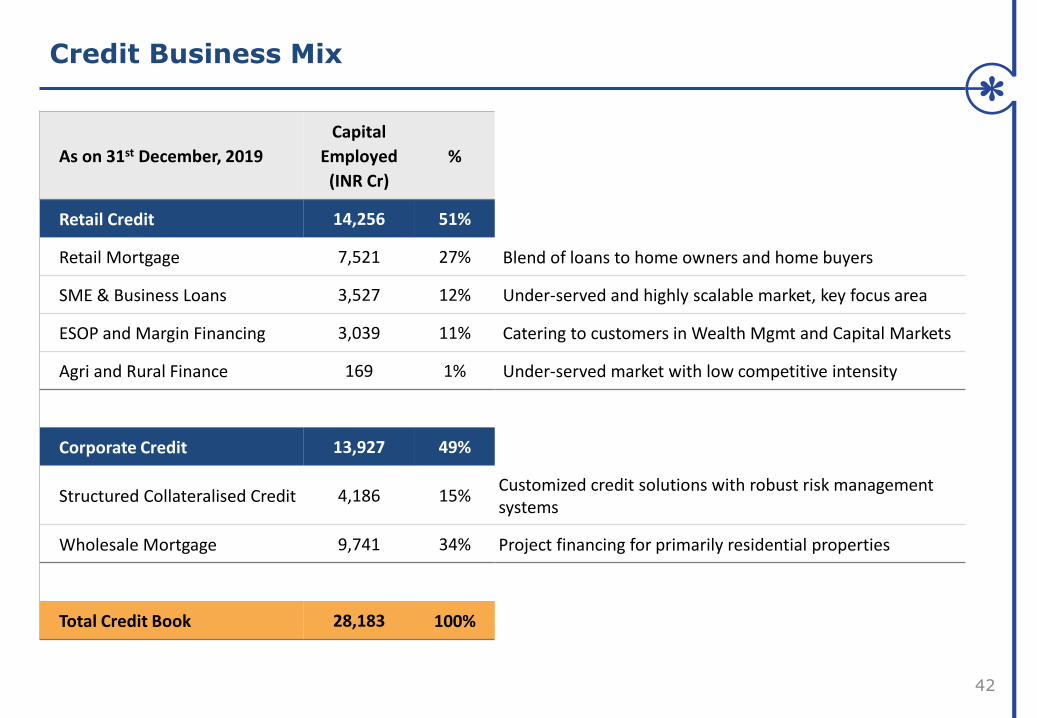
Credit Business Mix
42
As on 31st December, 2019
Capital
Employed
(INR Cr)
%
Retail Credit 14,256 51%
Retail Mortgage 7,521 27% Blend of loans to home owners and home buyers
SME & Business Loans 3,527 12% Under-served and highly scalable market, key focus area
ESOP and Margin Financing 3,039 11% Catering to customers in Wealth Mgmt and Capital Markets
Agri and Rural Finance 169 1% Under-served market with low competitive intensity
Corporate Credit 13,927 49%
Structured Collateralised Credit 4,186 15%Customized credit solutions with robust risk management systems
Wholesale Mortgage 9,741 34% Project financing for primarily residential properties
Total Credit Book 28,183 100%
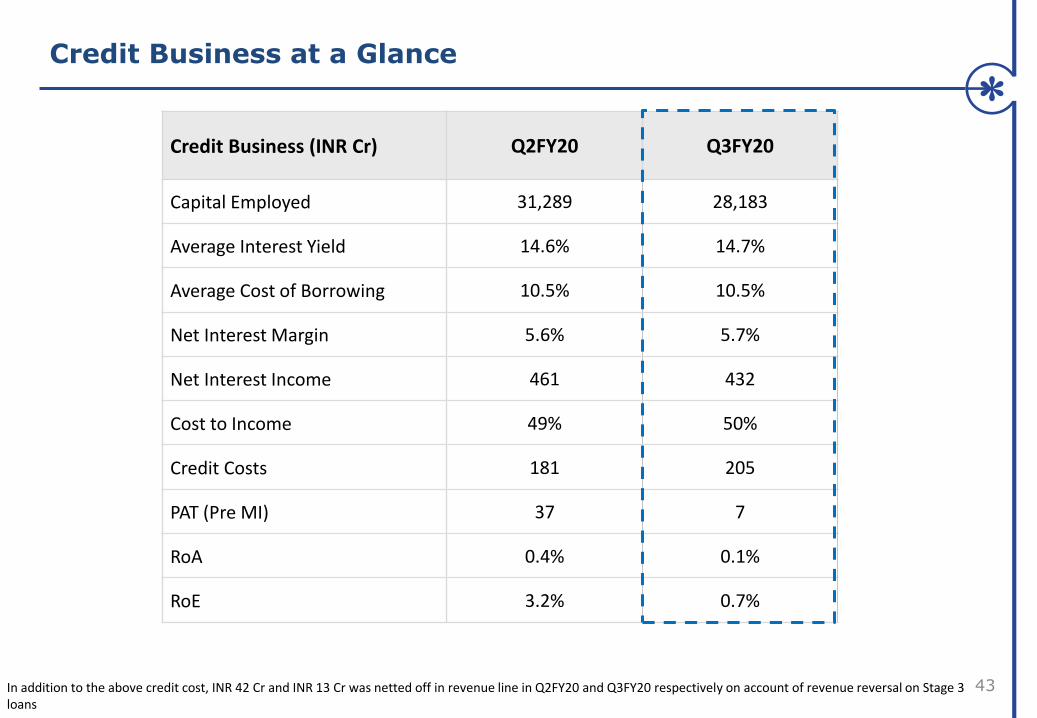
Credit Business at a Glance
43
Credit Business (INR Cr) Q2FY20 Q3FY20
Capital Employed 31,289 28,183
Average Interest Yield 14.6% 14.7%
Average Cost of Borrowing 10.5% 10.5%
Net Interest Margin 5.6% 5.7%
Net Interest Income 461 432
Cost to Income 49% 50%
Credit Costs 181 205
PAT (Pre MI) 37 7
RoA 0.4% 0.1%
RoE 3.2% 0.7%
In addition to the above credit cost, INR 42 Cr and INR 13 Cr was netted off in revenue line in Q2FY20 and Q3FY20 respectively on account of revenue reversal on Stage 3 loans
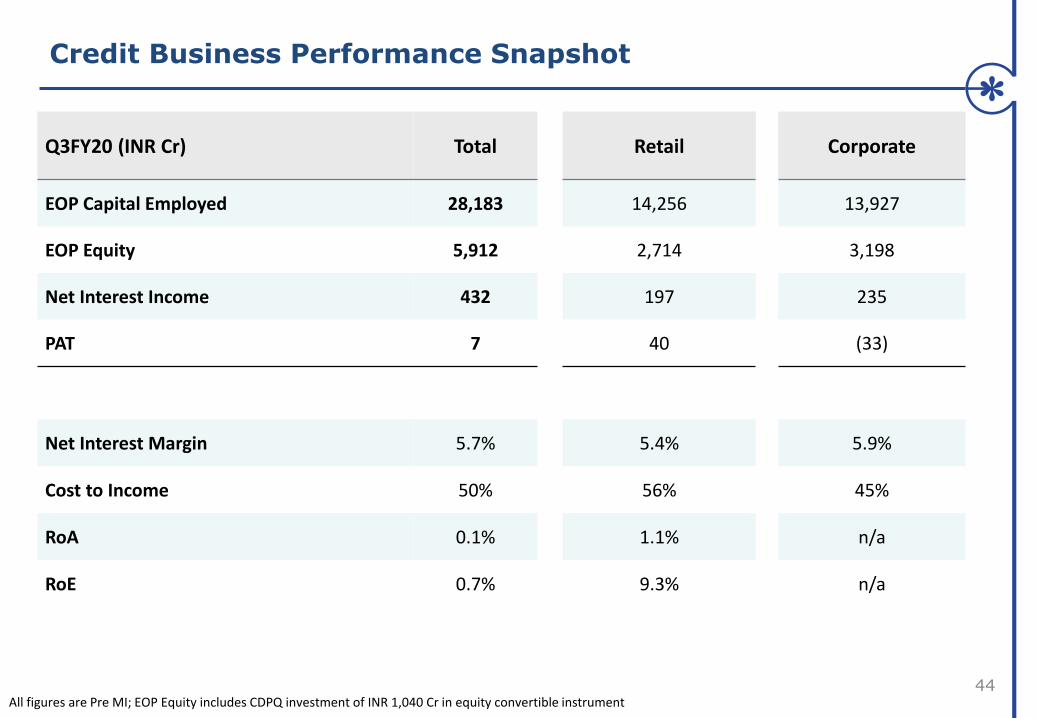
Credit Business Performance Snapshot
44
Q3FY20 (INR Cr) Total Retail Corporate
EOP Capital Employed 28,183 14,256 13,927
EOP Equity 5,912 2,714 3,198
Net Interest Income 432 197 235
PAT 7 40 (33)
All figures are Pre MI; EOP Equity includes CDPQ investment of INR 1,040 Cr in equity convertible instrument
Net Interest Margin 5.7% 5.4% 5.9%
Cost to Income 50% 56% 45%
RoA 0.1% 1.1% n/a
RoE 0.7% 9.3% n/a
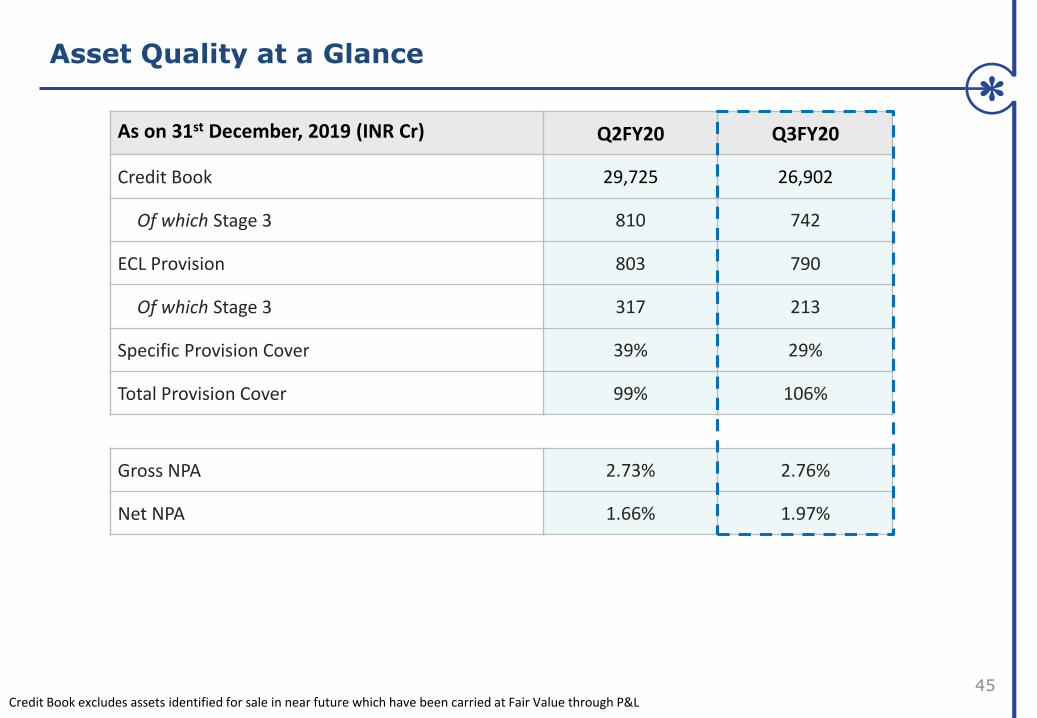
Asset Quality at a Glance
45
As on 31st December, 2019 (INR Cr) Q2FY20 Q3FY20
Credit Book 29,725 26,902
Of which Stage 3 810 742
ECL Provision 803 790
Of which Stage 3 317 213
Specific Provision Cover 39% 29%
Total Provision Cover 99% 106%
Gross NPA 2.73% 2.76%
Net NPA 1.66% 1.97%
Credit Book excludes assets identified for sale in near future which have been carried at Fair Value through P&L
46
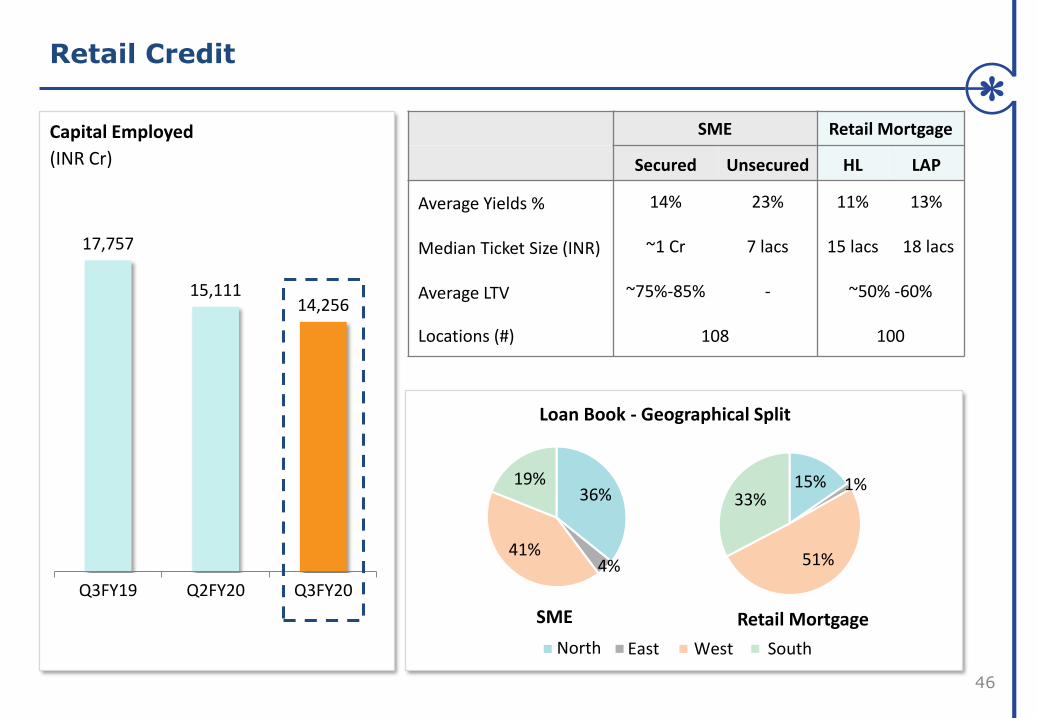
36%
4%41%
19% 15% 1%
51%
33%
Loan Book - Geographical Split
SME Retail Mortgage
North East West South
SME Retail Mortgage
Secured Unsecured HL LAP
Average Yields % 14% 23% 11% 13%
Median Ticket Size (INR) ~1 Cr 7 lacs 15 lacs 18 lacs
Average LTV ~75%-85% - ~50% -60%
Locations (#) 108 100
Capital Employed
(INR Cr)
17,757
15,11114,256
Q3FY19 Q2FY20 Q3FY20
Retail Credit

84%
16%
Ticket Size less than 1 Cr
Others
47
# of housing units in Wholesale Mortgage book
Structured Collateralised
Credit
Wholesale Mortgage
Average Yields % 15% - 17% 17% - 19%
Portfolio Granularity 56 accounts 128 projects
Typical Ticket size INR 100-125 Cr
Capital Employed
(INR Cr)
17,798
16,178
13,927
Q3FY19 Q2FY20 Q3FY20
Corporate Credit
48
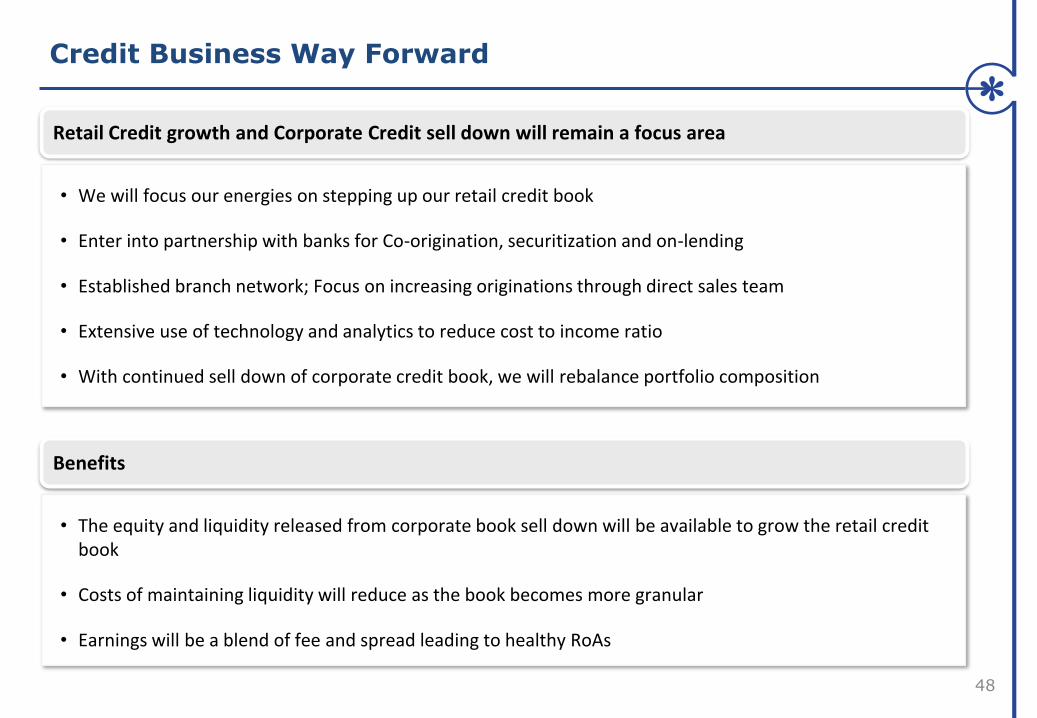
• We will focus our energies on stepping up our retail credit book
• Enter into partnership with banks for Co-origination, securitization and on-lending
• Established branch network; Focus on increasing originations through direct sales team
• Extensive use of technology and analytics to reduce cost to income ratio
• With continued sell down of corporate credit book, we will rebalance portfolio composition
• The equity and liquidity released from corporate book sell down will be available to grow the retail credit book
• Costs of maintaining liquidity will reduce as the book becomes more granular
• Earnings will be a blend of fee and spread leading to healthy RoAs
Benefits
Retail Credit growth and Corporate Credit sell down will remain a focus area
Credit Business Way Forward

Insurance Business
Life Insurance . General Insurance
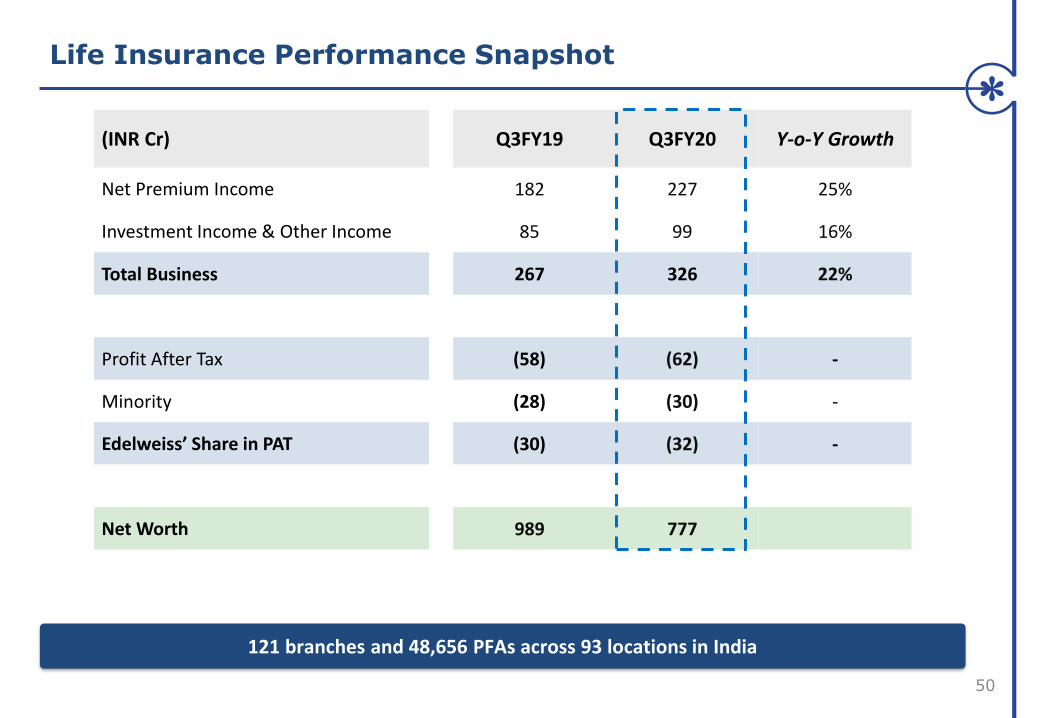
Life Insurance Performance Snapshot
50
(INR Cr) Q3FY19 Q3FY20 Y-o-Y Growth
Net Premium Income 182 227 25%
Investment Income & Other Income 85 99 16%
Total Business 267 326 22%
Profit After Tax (58) (62) -
Minority (28) (30) -
Edelweiss’ Share in PAT (30) (32) -
Net Worth 989 777
121 branches and 48,656 PFAs across 93 locations in India
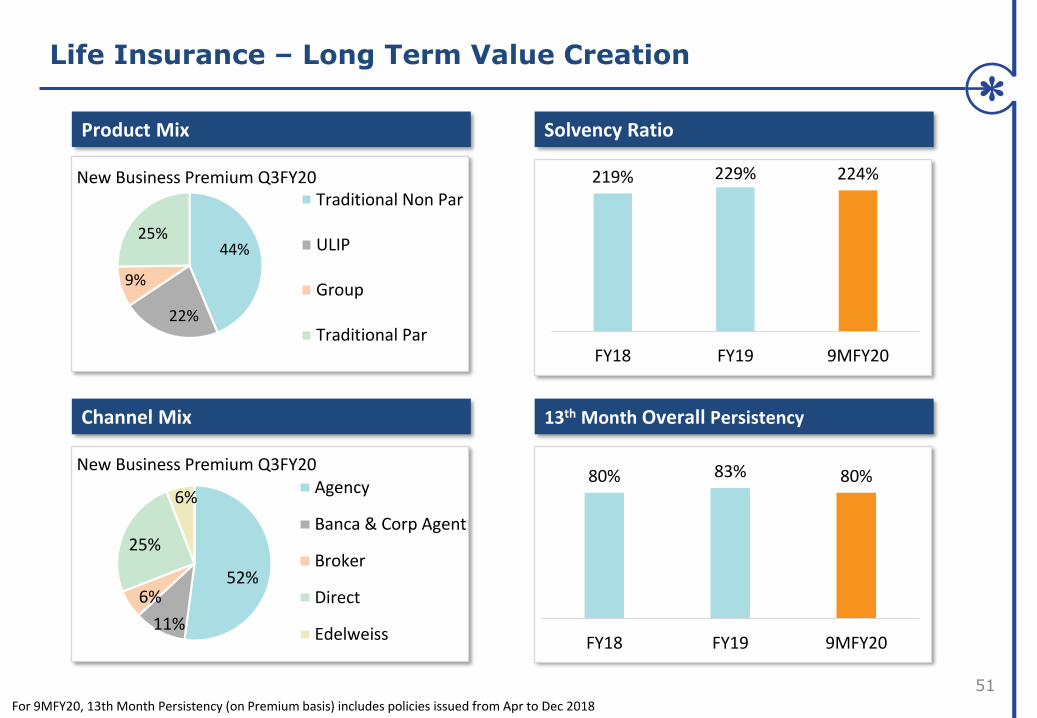
44%
22%
9%
25%
New Business Premium Q3FY20Traditional Non Par
ULIP
Group
Traditional Par
219% 229% 224%
FY18 FY19 9MFY20
80% 83% 80%
FY18 FY19 9MFY20
Life Insurance – Long Term Value Creation
51
Product Mix
52%
11%
6%
25%
6%
New Business Premium Q3FY20Agency
Banca & Corp Agent
Broker
Direct
Edelweiss
Solvency Ratio
Channel Mix 13th Month Overall Persistency
For 9MFY20, 13th Month Persistency (on Premium basis) includes policies issued from Apr to Dec 2018

Life Insurance Scaling Rapidly
52
Collected Individual Annual Premium Equivalent CAGR growth since FY17
Number of Policies Issued (Individual business )(in 000)
39%
20% 18%
Edelweiss TokioLife Insurance
Peer Set Industry
15 18
20
Q3FY18 Q3FY19 Q3FY20
Source : Life Insurance Council, Q3FY20 Financials
• Collected Individual Annual Premium Equivalent (APE) for Q3FY20 stood at INR 87 Cr
• Gross premium at INR 239 Cr growth of 26% YoY
• Embedded Value at INR 1,411 Cr as on 31st December, 2019
• Set a new Guinness World Record for collecting the highest number of pledges for organ donation in a single day with 54,626 pledges
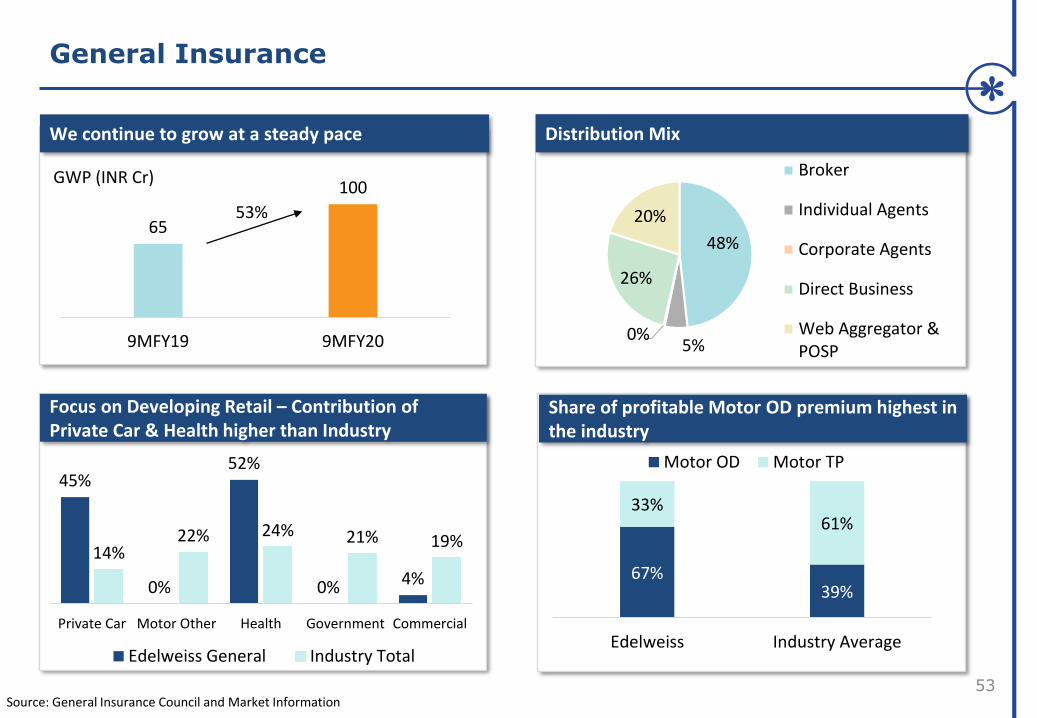
General Insurance
53
We continue to grow at a steady pace
65
100
9MFY19 9MFY20
53%
Distribution Mix
48%
5%0%
26%
20%
Broker
Individual Agents
Corporate Agents
Direct Business
Web Aggregator &POSP
45%
0%
52%
0% 4%
14%22% 24% 21% 19%
Private Car Motor Other Health Government Commercial
Chart Title
Edelweiss General Industry Total
67%39%
33%61%
Edelweiss Industry Average
Chart Title
Motor OD Motor TP
Source: General Insurance Council and Market Information
GWP (INR Cr)
Share of profitable Motor OD premium highest in the industry
Focus on Developing Retail – Contribution of Private Car & Health higher than Industry

Liquidity Management
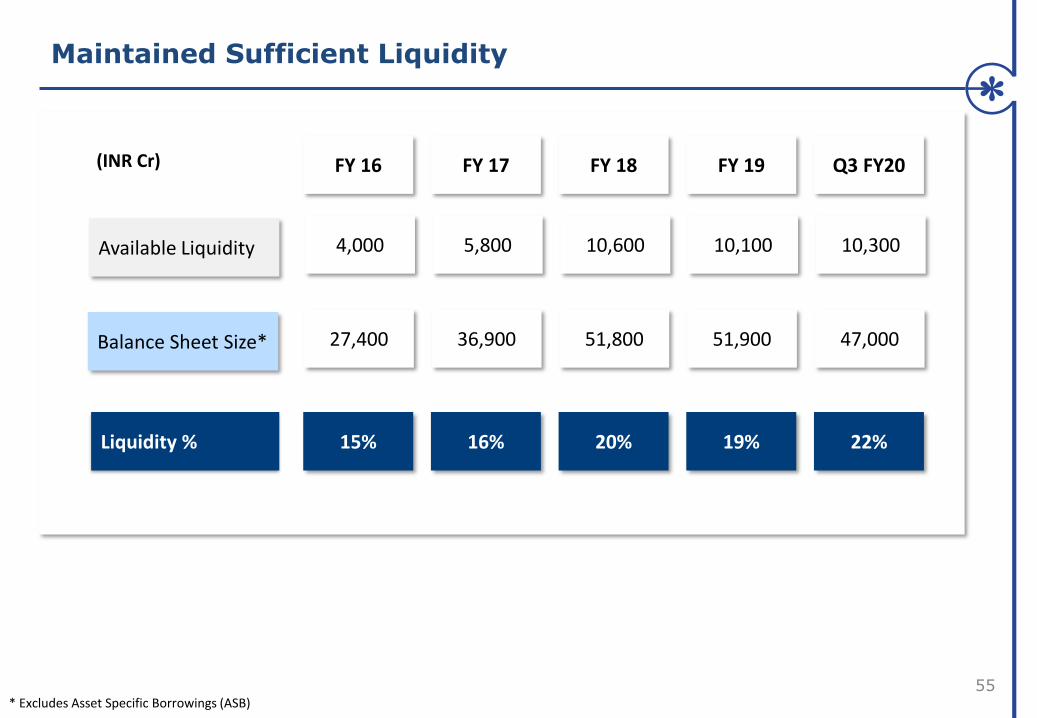
Maintained Sufficient Liquidity
55* Excludes Asset Specific Borrowings (ASB)
Balance Sheet Size*
Liquidity %
Available Liquidity
27,400
15%
4,000
36,900
16%
5,800
51,800
20%
10,600
51,900
19%
10,100
47,000
22%
10,300
FY 16 FY 17 FY 18 FY 19 Q3 FY20(INR Cr)

56
Particulars (INR Cr) Q4FY20 Q1FY21 Q2FY21 Q3FY21
Opening Available Liquidity (A) 10,300 9,600 9,100 10,000
Inflows
Asset EMIs and Repayments 2,500 1,800 1,700 1,700
Securitization 500 1,000 1,000 500
Fresh Borrowings 2,000 1,700 2,500 3,500
Total Inflows (B) 5,000 4,500 5,200 5,700
Outflows
Total Borrowings Repayments 3,700 3,000 2,300 4,500
Fresh disbursements 2,000 2,000 2,000 2,000
Total Outflows (C) 5,700 5,000 4,300 6,500
Closing Available Liquidity (A+B-C) 9,600 9,100 10,000 9,200
Cash Flow Plan
Numbers are rounded off to nearest 100s

..With Assets in each Tenor Range Adequately Covering the
Liabilities
57
Upto 1 year 16,300
1-3 years 14,800
3 years+ 15,900
Assets Liabilities
14,100
12,600
10,100
Gap
2,200
2,200
5,800
Total gap represents our equity base
3 years+ liabilities exclude Equity; Assets and Liabilities exclude ASB
(INR Cr)
Balance Sheet Highlights

Diversified Borrowing Profile By Instruments…
59
23,034 31,581 44,761
29% 27%17%
3% 1%
31%29%
39%
40%41%
40% 44% 44%
57% 58%
FY16 FY17 FY18 FY19 Q3 FY20
Total Borrowings
(INR Cr)
Bank Loans
NCDs
CPs
43,201 36,848
Borrowings exclude CBLO for all the above periods
Q3FY20 excludes investment in Equity Convertible instruments by CDPQ of INR 1,040 Cr, Kora Management of INR 177 Cr and Sanaka Capital of INR 117 Cr

6% 7% 12% 13%20%
41%44% 33%
16%10%
17%16%
12%
24%27%
36% 33%43% 47% 43%
FY16 FY17 FY18 FY19 Q3 FY20
…And By Source
60
Total Borrowings
(INR Cr)23,034 31,581 44,761 43,201
Retail
Bank
MF
PF, Insurance &
FIs
36,848
Borrowings exclude ASB for all the above periods
Q3FY20 excludes investment in Equity Convertible instruments by CDPQ of INR 1,040 Cr, Kora Management of INR 177 Cr and Sanaka Capital of INR 117 Cr

Healthy Percentage of Long Term Borrowings
61
44%
54%
61%63% 62%
FY16 FY17 FY18 FY19 Q3 FY20
% of Total Borrowings (excl ASB)
Average residual tenure of long term borrowings is 3.7 years

Positive ALM Across Durations
62
% o
f A
sset
s an
d L
iab
iliti
es
• BMU manages ALM under the aegis of Asset Liability Committee
2%
24% 28%36%
67%
100%
2%
16% 20%
32%
58%
100%
Asset SpecificBorrowing
0-3 months 3-6 months 6-12 months 1-3 years 3+ years
Assets Liabilities
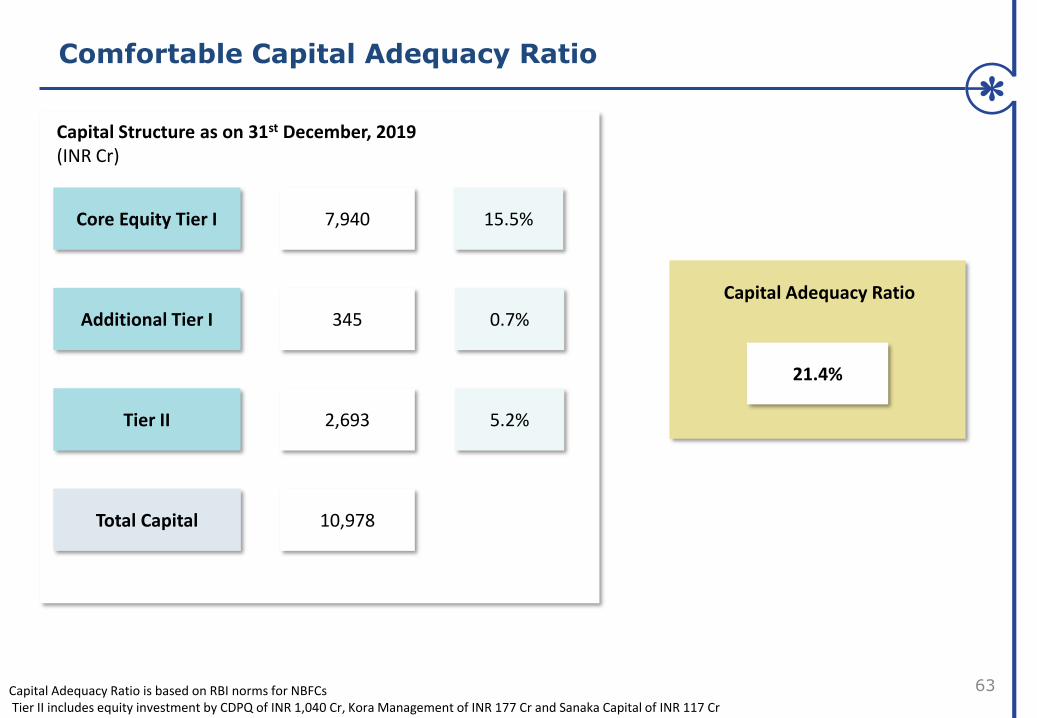
Comfortable Capital Adequacy Ratio
63
Core Equity Tier I
Additional Tier I
Tier II
Capital Structure as on 31st December, 2019(INR Cr)
7,940
345
2,693
Total Capital 10,978
Capital Adequacy Ratio
21.4%
Capital Adequacy Ratio is based on RBI norms for NBFCsTier II includes equity investment by CDPQ of INR 1,040 Cr, Kora Management of INR 177 Cr and Sanaka Capital of INR 117 Cr
15.5%
0.7%
5.2%
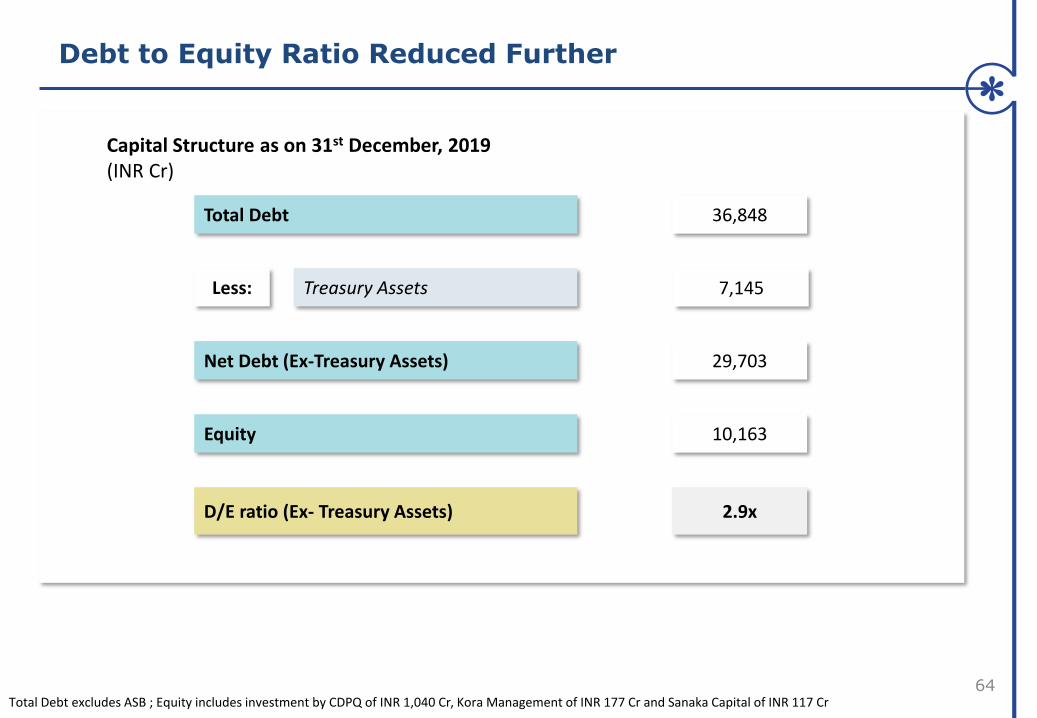
Debt to Equity Ratio Reduced Further
64
Capital Structure as on 31st December, 2019(INR Cr)
36,848
10,163
2.9x
Total Debt
Equity
D/E ratio (Ex- Treasury Assets)
7,145Treasury AssetsLess:
29,703Net Debt (Ex-Treasury Assets)
Total Debt excludes ASB ; Equity includes investment by CDPQ of INR 1,040 Cr, Kora Management of INR 177 Cr and Sanaka Capital of INR 117 Cr
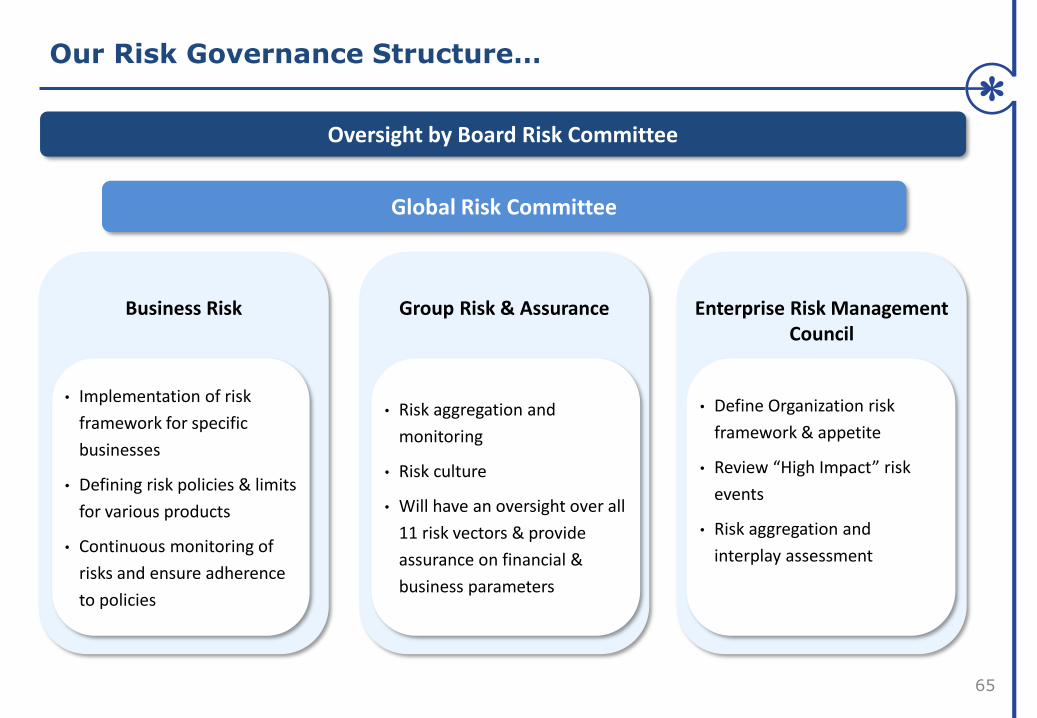
Our Risk Governance Structure…
65
Oversight by Board Risk Committee
Business Risk Group Risk & Assurance Enterprise Risk Management Council
• Define Organization risk
framework & appetite
• Review “High Impact” risk
events
• Risk aggregation and
interplay assessment
• Implementation of risk
framework for specific
businesses
• Defining risk policies & limits
for various products
• Continuous monitoring of
risks and ensure adherence
to policies
Global Risk Committee
• Risk aggregation and
monitoring
• Risk culture
• Will have an oversight over all
11 risk vectors & provide
assurance on financial &
business parameters

…Ensures Prudent Risk Management and Responsible Growth
66
Technology Risk
Operational & Process Risk
People Risk Fraud RiskPhysical
Infrastructure Risk
Credit Risk Liquidity Risk Market Risk Regulatory Risk
Business RiskReputational
Risk
Enterprise risk management approach: 11 Risk Framework
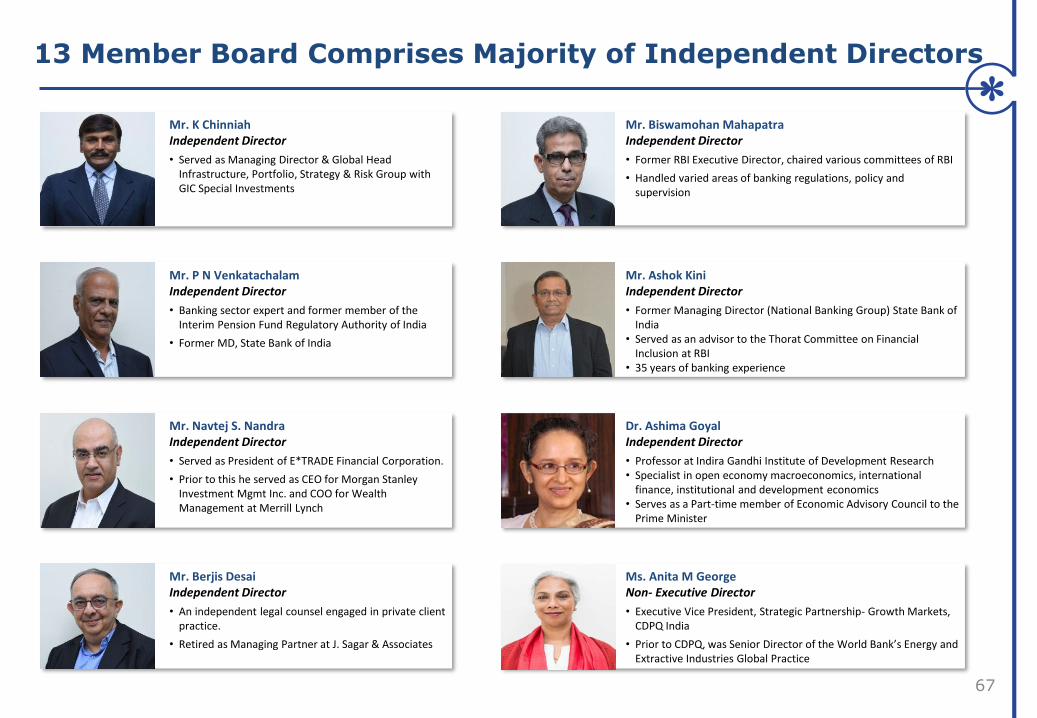
13 Member Board Comprises Majority of Independent Directors
67
Mr. Biswamohan MahapatraIndependent Director
• Former RBI Executive Director, chaired various committees of RBI
• Handled varied areas of banking regulations, policy and supervision
Mr. K ChinniahIndependent Director
• Served as Managing Director & Global Head Infrastructure, Portfolio, Strategy & Risk Group with GIC Special Investments
Mr. Ashok KiniIndependent Director
• Former Managing Director (National Banking Group) State Bank of India
• Served as an advisor to the Thorat Committee on Financial Inclusion at RBI
• 35 years of banking experience
Mr. P N VenkatachalamIndependent Director
• Banking sector expert and former member of the Interim Pension Fund Regulatory Authority of India
• Former MD, State Bank of India
Dr. Ashima GoyalIndependent Director
• Professor at Indira Gandhi Institute of Development Research• Specialist in open economy macroeconomics, international
finance, institutional and development economics• Serves as a Part-time member of Economic Advisory Council to the
Prime Minister
Mr. Navtej S. Nandra Independent Director
• Served as President of E*TRADE Financial Corporation.
• Prior to this he served as CEO for Morgan Stanley Investment Mgmt Inc. and COO for Wealth Management at Merrill Lynch
Ms. Anita M GeorgeNon- Executive Director
• Executive Vice President, Strategic Partnership- Growth Markets, CDPQ India
• Prior to CDPQ, was Senior Director of the World Bank’s Energy and Extractive Industries Global Practice
Mr. Berjis DesaiIndependent Director
• An independent legal counsel engaged in private client practice.
• Retired as Managing Partner at J. Sagar & Associates
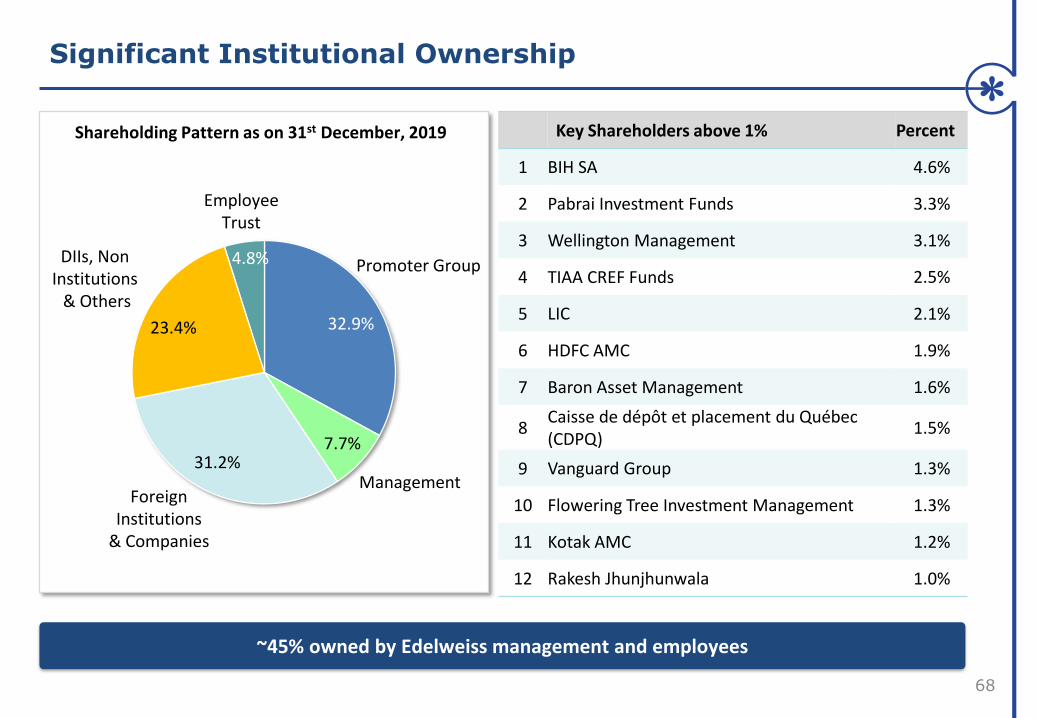
Significant Institutional Ownership
68
32.9%
7.7%31.2%
23.4%
4.8%
Foreign Institutions
& Companies
Promoter Group DIIs, Non Institutions
& Others
Employee Trust
Shareholding Pattern as on 31st December, 2019 Key Shareholders above 1% Percent
1 BIH SA 4.6%
2 Pabrai Investment Funds 3.3%
3 Wellington Management 3.1%
4 TIAA CREF Funds 2.5%
5 LIC 2.1%
6 HDFC AMC 1.9%
7 Baron Asset Management 1.6%
8Caisse de dépôt et placement du Québec (CDPQ)
1.5%
9 Vanguard Group 1.3%
10 Flowering Tree Investment Management 1.3%
11 Kotak AMC 1.2%
12 Rakesh Jhunjhunwala 1.0%
Management
~45% owned by Edelweiss management and employees
ESG at Edelweiss

Our Framework is based on the United Nations Sustainable
Development Goals
70
People Focused Goals
Planet Focused Goals
No Poverty, Zero Hunger & Economic Growth
Quality Education Gender Equality
Affordable & Clean Energy Responsible Consumption Climate Support
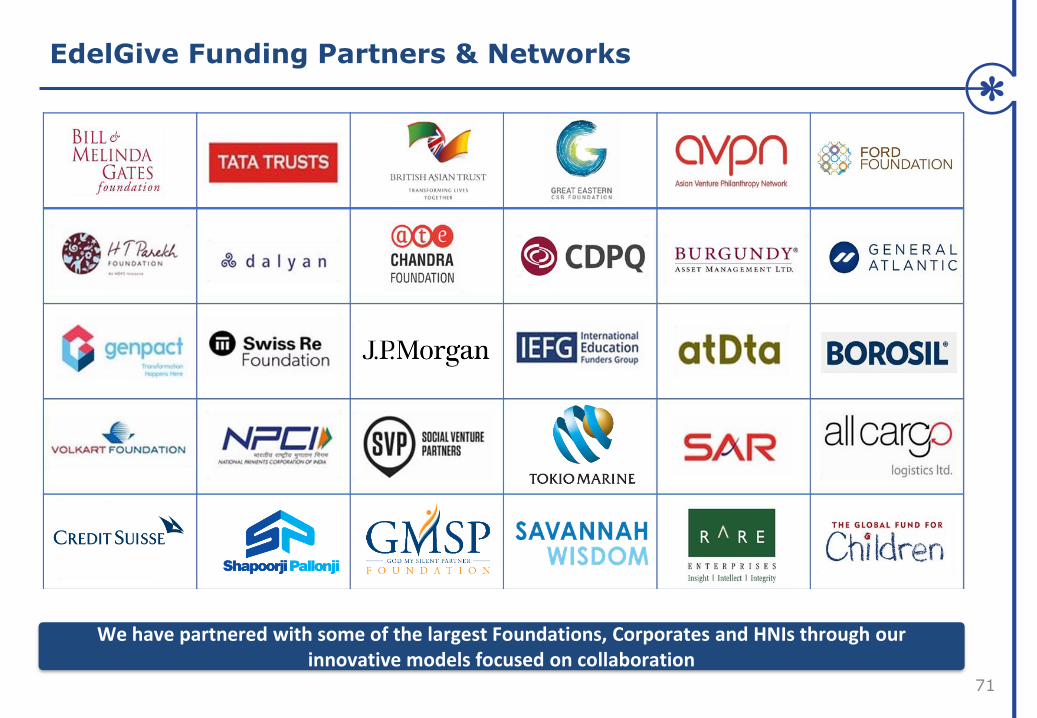
EdelGive Funding Partners & Networks
71
We have partnered with some of the largest Foundations, Corporates and HNIs through our innovative models focused on collaboration

42NGO Partners
Edelweiss Wins National CSR Award
72
45Active Grants
109Districts across
14 States
21Co-funded
Grants
INR 59.2 Cr*committed
72
EdelGive Foundation’s commitment to Achieving the SDGs (Cumulative till date)
• 19,65,275 Children supported
• 45,607 Teaching professionals trained
• 11,828 Schools
• 1,075 acres of land under irrigation
• 5,884 Individuals trained
• 68 Watershed Structures Repaired/Built
• 8 FPO/FPC Strengthened
• 1,87,886 Women supported
• 1,329 Grassroot leaders developed
• 360 Males engaged
Employee Engagement
(Cumulative till date)
• 70%+ Edelweiss Employees Engaged
• 39,000+ Man-hours of volunteering
• 110 skilled volunteering projects
INR 16.3 Cr INR 5.2 Cr INR 16.9 Cr
Committed YTD FY20
*INR 20.7 Cr committed under partnership
Quality Education
No PovertyGender Equality
Safe Harbour
73
DISCLAIMER :
This presentation and the discussion may contain certain words or phrases that are forward - looking statements, which are tentative, based on current expectations ofthe management of Edelweiss Financial Services Ltd. or any of its subsidiaries and associate companies (“Edelweiss”). Actual results may vary from the forward-lookingstatements contained in this presentations due to various risks and uncertainties. These risks and uncertainties include the effect of economic and political conditions inIndia and outside India, volatility in interest rates and in the securities market, new regulations and Government policies that may impact the businesses of Edelweiss aswell as the ability to implement its strategy. The information contained herein is as of the date referenced and Edelweiss does not undertake any obligation to updatethese statements. Edelweiss has obtained all market data and other information from sources believed to be reliable or are its internal estimates unless otherwise stated,although its accuracy or completeness can not be guaranteed. The presentation relating to business wise financial performance, ex-insurance numbers, balance sheet,asset books of Edelweiss and industry data herein is reclassified/regrouped based on Management estimates and may not directly correspond to publisheddata.Compliance with IndAs requires accrued interest to be clubbed with the principal amount of Borrowings, unlike IGAAP wherein this amount was classified separatelyunder Other Liabilities.In this presentation, for the purpose of consistency and comparability with prior periods, Balance Sheet size and relevant ratios are calculated on thebasis of the principal amount of Borrowings.The numbers have also been rounded off in the interest of easier understanding. Numbers have been re-casted, whereverrequired. PAT ex-insurance is excluding Minority Interest. Unless specified all PAT numbers are Post MI. Prior period figures have been regrouped/reclassified wherevernecessary. FY18, FY19 and FY20 Numbers are as per IndAS whereas the rest are as per IGAAP. All information in this presentation has been prepared solely by thecompany and has not been independently verified by anyone else.This presentation is for information purposes only and does not constitute an offer or recommendation to buy or sell any securities of Edelweiss. This presentation alsodoes not constitute an offer or recommendation to buy or sell any financial products offered by Edelweiss. Any action taken by you on the basis of the informationcontained herein is your responsibility alone and Edelweiss or its directors or employees will not be liable in any manner for the consequences of such action taken byyou. Edelweiss and/or its directors and/or its employees may have interests or positions, financial or otherwise, in the securities mentioned in this presentation.
Edelweiss Financial Services Limited Corporate Identity Number: L99999MH1995PLC094641For more information, please visit www.edelweissfin.com
NOTES:
Slide 9 : Balance sheet is on net basis; General insurance loss of INR 26 Cr in Q3FY20
Slide 10,43,44 : RoE is calculated excluding investment of equity convertible instrument by CDPQ of INR 1,040 Cr, Kora Management of INR 177 Cr and Sanaka Capital of INR 117 Cr
Slide 8,45 : GNPA is as per RBI prudential norms; Stage 3 Credit Book and ECL Provision correspond to GNPA and specific provision taken respectively
Slide 15,21,22,28,29,35,36,37 : AUM, AUA and AUC is rounded off to nearest 100
Slide 22,44,50 : Business wise financial performance numbers are on fully loaded cost basis with allocation of Group Enterprise costs
Slide 52 : Embedded value (EV) is calculated on market consistent basis
Slide 63 : Risk weighted assets is 85.6% of Gross Assets of INR 59,955 Cr
Slide 68 : Key institutional shareholders: Holding of known affiliates have been clubbed together for the purpose of this information