investor presentation - amazon web servicessite/presentation/hea… · •innovative & valuable...
TRANSCRIPT

Investor Presentation
NASDAQ: HEARAugust 2019

SAFE HARBOR STATEMENT
Forward-Looking InformationThis presentation includes forward-looking information and statements within the meaning of the federal securities laws. Except for historical information contained in this release, statements in this release may constitute forward-looking statements regarding assumptions, projections, expectations, targets, intentions or beliefs about future events. Statements containing the words “may”, “could”, “continue”, “would”, “should”, “believe”, “expect”, “anticipate”, “plan”, “goal”, “estimate”, “accelerate”, “target”, “project”, “intend” and similar expressions constitute forward-looking statements. Forward-looking statements involve known and unknown risks and uncertainties, which could cause actual results to differ materially from those contained in any forward-looking statement. Forward-looking statements are based on management’s current belief, as well as assumptions made by, and information currently available to, management. While the Company believes that its expectations are based upon reasonable assumptions, there can be no assurances that its goals and strategy will be realized. Numerous factors, including risks and uncertainties, may affect actual results and may cause results to differ materially from those expressed in forward-looking statements made by the Company or on its behalf. Some of these factors include, but are not limited to, risks related to the substantial uncertainties inherent in the acceptance of existing and future products, the difficulty of commercializing and protecting new technology, the impact of competitive products and pricing, general business and economic conditions, risks associated with the expansion of our business including the implementation of any businesses we acquire, the integration of such businesses within our internal control over financial reporting and operations, our indebtedness, the Company’s liquidity, and other factors discussed in our public filings, including the risk factors included in the Company’s most recent Annual Report on Form 10-K, Quarterly Report on Form 10-Q and the Company’s other periodic reports. Except as required by applicable law, including the securities laws of the United States and the rules and regulations of the Securities and Exchange Commission, the Company is under no obligation to publicly update or revise any forward-looking statement after the date of this release whether as a result of new information, future developments or otherwise. This presentation also contains trademarks and trade names that are property of their respective owners.
Non-GAAP Financial MeasuresThis presentation contains certain financial measures, including adjusted EBITDA and adjusted net income, that the Securities and Exchange Commission defines as “non-GAAP financial measures.” Management believes that such non-GAAP financial measures, when read in conjunction with the Company's reported results, can provide useful supplemental information for investors analyzing period-to-period comparisons of the Company's results. “Adjusted Net Income” is defined as net income excluding integration and transaction costs related to the acquisition of the ROCCAT business and excluding the effect of the mark-to-market requirement of the financial instrument obligation. “Adjusted EBITDA” is defined by the Company as net income (loss) before interest, taxes, depreciation and amortization, stock-based compensation (non-cash), and certain special items that we believe are not representative of core operations (e.g., the integration and transaction costs related to the ROCCAT acquisition and the mark-to-market adjustment for the financial instrument obligation and). These non-GAAP financial measures are presented because management uses non-GAAP financial measures to evaluate the Company’s operating performance, to perform financial planning, and to determine incentive compensation. Therefore, the Company believes that the presentation of non-GAAP financial measures provides useful supplementary information to, and facilitates additional analysis by, investors. The presented non-GAAP financial measures exclude items that management does not believe reflect the Company’s core operating performance because such items are inherently unusual, non-operating, unpredictable, non-recurring, or non-cash. See a reconciliation of non-GAAP results for the three and six months ended June 30, 2019 and 2018 in the appendix.
© 2019 Turtle Beach Corporation. All Rights Reserved.
2

WHO WE ARE
• Key player in vibrant $152 billion gaming market
• Market leader in gaming headsets for 10 years running (40+% revenue share)¹
• Expanded into gaming keyboards & mice via ROCCAT acquisition
• Strong brand with high consumer loyalty
• Full line of differentiated products
• Innovative & valuable patent portfolio
• Critical accessory provider to esports fans & players
• Global distribution & partnerships
• Expanded growth opportunities going forward
31. The NPD Group/Retail Tracking Service/Video Games/Dollars/U.S. & Canada/Jan 2010-Dec 2018 & Jan-July 2019
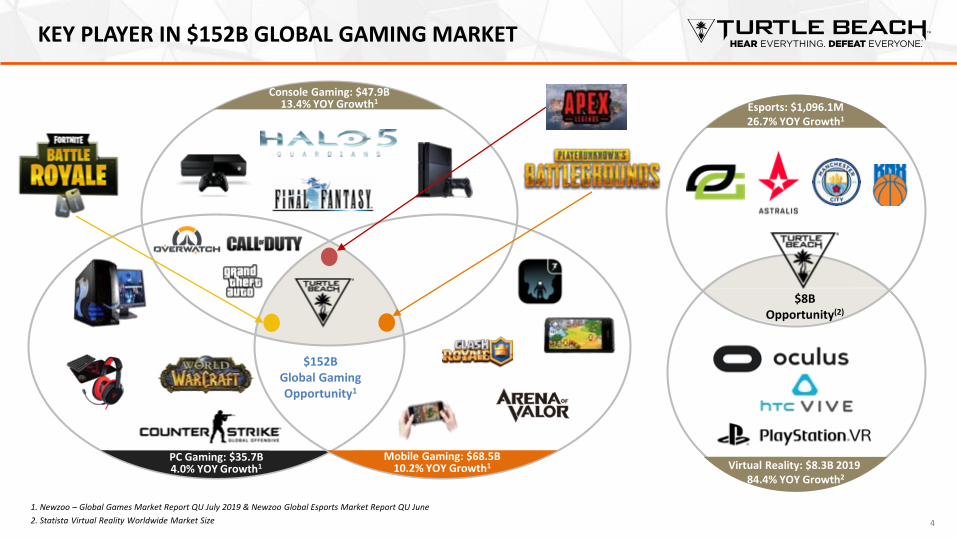
KEY PLAYER IN $152B GLOBAL GAMING MARKET
4
PC Gaming: $35.7B4.0% YOY Growth1
Mobile Gaming: $68.5B10.2% YOY Growth1
Console Gaming: $47.9B13.4% YOY Growth1
$152BGlobal Gaming Opportunity1
Esports: $1,096.1M26.7% YOY Growth1
Virtual Reality: $8.3B 201984.4% YOY Growth2
$8B Opportunity(2)
1. Newzoo – Global Games Market Report QU July 2019 & Newzoo Global Esports Market Report QU June
2. Statista Virtual Reality Worldwide Market Size
AUDIO HEADSETS ARE A CRITICAL ACCESSORY FOR GAMERS
5
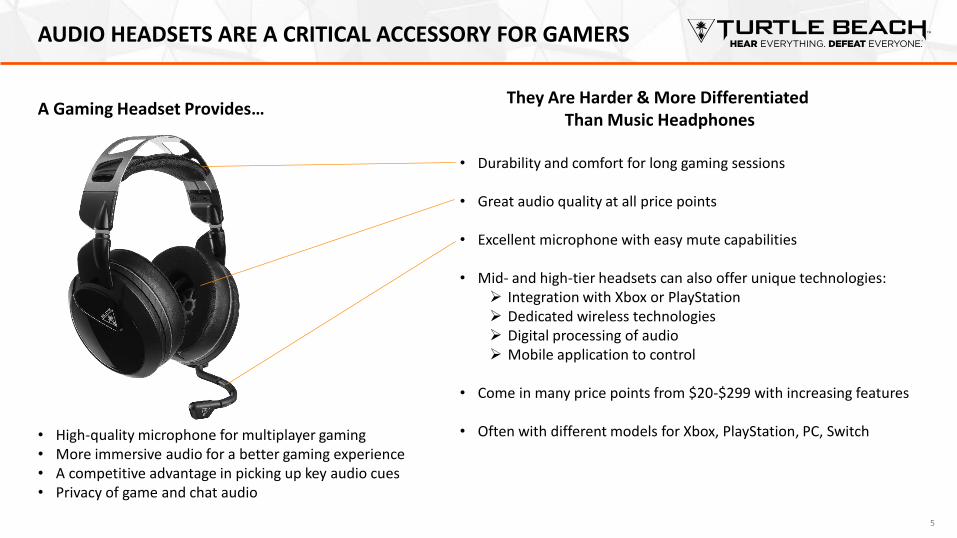
A Gaming Headset Provides…
• High-quality microphone for multiplayer gaming• More immersive audio for a better gaming experience• A competitive advantage in picking up key audio cues• Privacy of game and chat audio
They Are Harder & More DifferentiatedThan Music Headphones
• Durability and comfort for long gaming sessions
• Great audio quality at all price points
• Excellent microphone with easy mute capabilities
• Mid- and high-tier headsets can also offer unique technologies:➢ Integration with Xbox or PlayStation➢ Dedicated wireless technologies➢ Digital processing of audio➢ Mobile application to control
• Come in many price points from $20-$299 with increasing features
• Often with different models for Xbox, PlayStation, PC, Switch

CONSOLE HEADSETS ARE LARGEST GAMING ACCESSORY SEGMENT
6
Global Gaming Accessory Market $3,934M1
1. Newzoo 2019 Peripheral Market estimates – updated July 2019, to be finalized in September 2019
2. Newzoo Global Esports Market Report QU June and Global Games Market Report QU July
Americas and Europe are 70%+ of the market
Console Headsets are $1.3B Addressable MarketWith 821M+ Gamers and 188M Esports Fans in the
Americas and Europe2
Console Headsets$1,292M
PC Headsets$1,372M
Mice$598M
Keyboards$671M
Sales 80%+ Brick & Mortar Retail Driven3
3. Turtle Beach estimates 80+% of North American console headset sales are via brick & mortar retailers
Where Consumers Can Try The Headsets

THE LEADER IN CONSOLE GAMING HEADSETS FOR 10 YEARS RUNNING
7
#1 GAMING HEADSETPROVIDER FOR XBOX & PLAYSTATION
HIGHER REVENUE SHARE THAN NEXT 4 PLAYERS COMBINED
1. Counts only patents related to headsets (not including additional patents from ROCCAT and HyperSound)Source: The NPD Group/Retail Tracking Service/Video Games/Dollars/U.S. & Canada/January-December 2018
6 OF TOP 10 SELLERSOVERALL ARE TURTLE BEACH
All 5 OF TOP 5 SELLERSOVERALL ARE TURTLE BEACH 91 ISSUED PATENTS
51 Pending1
280K+ POINTS OF DISTRIBUTION42 Countries
STRONG BRAND & REPUTATIONAmong Gamers, Retailers, Gaming Industry
PRODUCT FOR EVERY GAMEREntry Level to Professional
PRODUCT INNOVATIONSAnd Unique Features - Many patented
STRONG PARTNERSHIPSWith Leading Esports Teams & Influencers
OVER 10 YEARS EXPERIENCEGaming Headsets and with Xbox & PlayStation
WHY & HOW:

MSRP:$99.95
GREAT HEADSETS FOR EVERY LEVEL OF CONSOLE GAMER
ASP TB Key FeaturesSample Products
• Windows Sonic & DTS 7.1 surround sound• Active noise-cancellation• Bluetooth connectivity w/app-based control• Superhuman Hearing• Leatherette ear cushions
• Windows Sonic & Turtle Beach surround sound• Direct wireless connection to Xbox One• Superhuman Hearing
• High-quality 40mm speakers• High-sensitivity flip-to-mute mic• Synthetic leather ear cushions
• Pro-grade game & chat audio performance• Patented ProSpecs glasses-friendly design• Cooling gel-infused memory foam ear cushions• Bluetooth connectivity w/app-based control• Superhuman Hearing• Swappable deco-plates
> $150
$100 - $150
$50 - $100
< $50
8
Entry-Level Gamer
< 4 hours per week
Casual Gamer4-6 hours per week
Enthusiast Gamer
7-15 hours per week
Core Gamer16+ hours per week
Esports
• Innovative open earcup• Reversible left-right design
MSRP:$149.95
MSRP:$249.95
MSRP:$79.95
MSRP:$49-59.95
MSRP:$39.95
MSRP:$19.95
• Amplified audio with mic monitoring and bass-boost• Metal-reinforced headband• Memory foam ear cushions
• Audio EQ settings• 50mm drivers• Patented ProSpecs glasses-friendly design
Chat Headset
Full Headset
Amplified Headset
Audio Features
Wireless Headset
ANC and Bluetooth
Pro-levelHeadset
Major Step-Ups
New 2019

9
WE HAVE EXPANDED INTO PC HEADSETS TO INCREASE OUR TAM
Americas and Europe are over 70% of the market
2nd Largest Segment In $3.9B Accessory Market
Console Headsets$1,292M
PC Headsets$1,575M
Mice$597M
Keyboards$684M
And Have The Largest Share of the Combined Markets
1. Newzoo 2019 Peripheral Market estimates – updated July, to be finalized in
September 2019
Global Gaming Accessory Market $3,934M1
Console Headsets$1,292M
PC Headsets$1,372M
Mice$598M
Keyboards$671M
Source: The NPD Group, Inc./Retail Tracking Service/Video Games/Console Accessories/Dollars/U.S./January-December 2018Source: The NPD Group, Inc., U.S. Retail Tracking Service, PC Headset/PC Microphone, Gaming Designed, Headset Only (No Standalone Microphone), Based on Dollars, Jan.-Dec. 2018
MSRP:$49.95
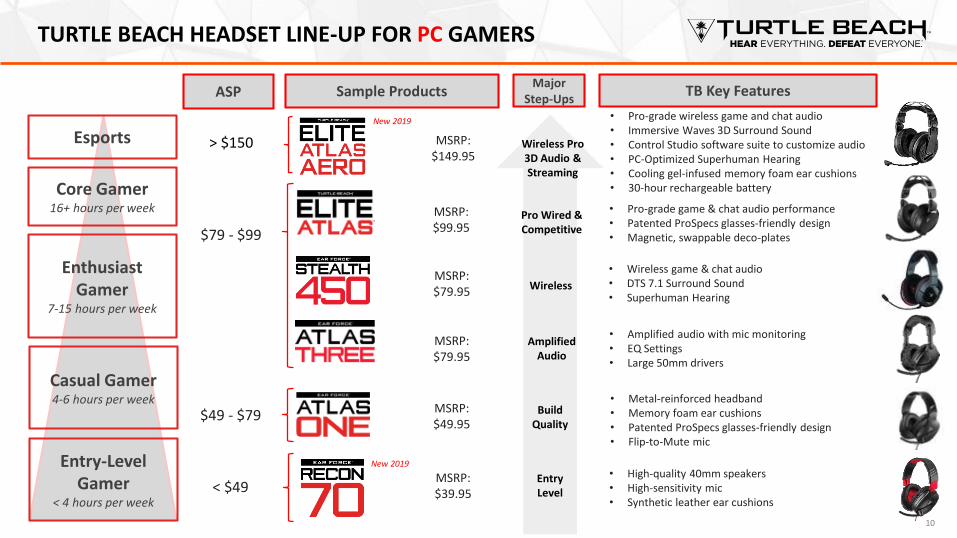
TURTLE BEACH HEADSET LINE-UP FOR PC GAMERS
10
MSRP:$79.95
ASP Sample Products
• High-quality 40mm speakers• High-sensitivity mic• Synthetic leather ear cushions
$79 - $99
$49 - $79
< $49
Entry-Level Gamer
< 4 hours per week
Casual Gamer4-6 hours per week
Enthusiast Gamer
7-15 hours per week
Core Gamer16+ hours per week
Esports
MSRP:$79.95
MSRP:$99.95
MSRP:$39.95
• Metal-reinforced headband• Memory foam ear cushions• Patented ProSpecs glasses-friendly design• Flip-to-Mute mic
Entry Level
AmplifiedAudio
Pro Wired & Competitive
Major Step-Ups
Build Quality
Wireless
> $150 MSRP:$149.95
Wireless Pro 3D Audio & Streaming
New 2019
TB Key Features
• Wireless game & chat audio• DTS 7.1 Surround Sound• Superhuman Hearing
• Pro-grade game & chat audio performance• Patented ProSpecs glasses-friendly design• Magnetic, swappable deco-plates
• Amplified audio with mic monitoring• EQ Settings• Large 50mm drivers
• Pro-grade wireless game and chat audio• Immersive Waves 3D Surround Sound• Control Studio software suite to customize audio• PC-Optimized Superhuman Hearing• Cooling gel-infused memory foam ear cushions• 30-hour rechargeable battery
New 2019

TURTLE BEACH ACQUIRED ROCCAT IN MAY 2019
• Hamburg & Taipei-based provider of PC mice, keyboards, headsets & software with strong brand in Germany
• Full line of mice & keyboards with unique innovations, integrated lighting & associated PC software
• Product & engineering personnel with deep experience & innovations in PC mice & keyboards
• PC experienced sales & marketing personnel including coverage in major Asian countries
• Proforma 2018: ~$25M net revenues, positive EBITDA & gross margins in mid 30’s%¹
111. Financials are estimated based upon structure where ROCCAT functions stand-alone vs. today’s structure which is highly integrated with distributor/owner

ACQUISITION SIGNIFICANTLY EXPANDS ADDRESSABLE MARKET
12
Console Headsets$1,292M
PC Headsets$1,372M
Mice $598M
Keyboards$671M
GLOBAL GAMING ACCESSORY MARKET $3,934M Turtle Beach Portfolio¹ ROCCAT Portfolio¹
9 MiceIncluding 7 RGB Models
$29 - $139 MSRP
8 KeyboardsIncluding 4 RGB Models
$79-$159 MSRP
5 HeadsetsIncluding 1 USB/RGB Wired Model
& 1 Earbud Model$29-$119 MSRP
5 HeadsetsIncluding 1 USB Wireless Model
& 3 new Atlas models$39-$99 MSRP
21 HeadsetsIncluding 4 Wireless Models,
2 Pro esports Models& 2 Earbud Models
$19-$249 MSRP
48 Active Core Models in PortfolioSource for market sizes: Newzoo Report 2019 Peripheral Market estimates1. Reflects core models, not all SKUs or products are included.
HistoricTB Addressable
Market -Goal is to Continue
Leadership
Additional Addressable Market with
ROCCAT –Goal is to Build
Incremental $100M
Business

GAMING MOUSE LINE-UP FOR EVERY LEVEL OF PC GAMER
13
ASP Sample Products
• Titan click technology for exceptional precision• Durable Omron switches• 2D Titan mousewheel
$70 - $99
$30 - $49Entry-Level
Gamer< 4 hours per week
Competitive Gamer
16+ hours per week
MSRP:$49.99
Improved click mechanism
Evolutionary coating
Core USP ROCCAT Key Features
MSRP:$69.99
MSRP:$69.99
MSRP:$39.99
Entry Level
Owl-Eye optical sensor
New 2019
New 2019• Textured side grips• 16k DPI Sensor
• Owl-Eye sensor• Competitive lightweight 88g• 2D Titan mousewheel
• 16k DPI Sensor Owl-Eye sensor• Titan click technology for exceptional precision• High-Comfort ergonomic shape
Enthusiast Gamer
4-15 hours per week
Wireless
> $100
MSRP:$99.99
Wireless & Docking station
MSRP:$149.99
$60 - $99
MSRP:$79.99
Enhanced RGB Illumination
New 2019
• 7 light areas• Tri-button thumb zone• 4D Titan mousewheel• Owl-Eye Sensor
• Up to 50h of wireless gaming• Titan click technology for exceptional precision• High-Comfort ergonomic shape• Owl-Eye wireless sensor
• 14 ergonomic mouse buttons• Owl-Eye sensor• X-Celerator analog paddle + Fin Switch
MSRP:$59.99
Ambidextrous• Additional quick-fire buttons• 2D Titan mousewheel• Versatile shape (left and right-handed use)

GAMING KEYBOARD LINE-UP FOR EVERY LEVEL OF PC GAMER
14
MSRP:$129.99
ASP Sample Products
• Precise midway travel actuation point• Configurable RBG illumination• Tuning wheel for on-the-fly control• Two color variants
$100 - $149
$79 - $99Casual Gamer4-6 hours per week
Enthusiast Gamer
7-15 hours per week
Core Gamer16+ hours per week
MSRP:$99.99
• Per-key illumination in blue• All keys remappable• Tactile switches with 1.8mm actuation point
Membranical Keystroke
RGB Illumination
Additional Comfort
Core USP
Mechanical Titan Switch
> $150
MSRP:$159.99
Color variant
ROCCAT Key Features
• Removable ergonomic palm rest• Anodized aluminum top plate• Reduced bounce time for faster click
• RGB per-key illumination with 16.8m colors• ROCCAT Easy-Shift technology• 1.8m cable
• Firmware for improved click recognition• Ultra-light key caps• Unique switch design with dust resistant housing• Mixer-style media keys for easy control
MSRP:$149.99
MSRP:$159.99
New 2019
Competitive Gamer
16+ hours per week
Linear Titan switch
• Linear switch technology for highly competitive gamers
MSRP:$159.99
New 2019
> $150
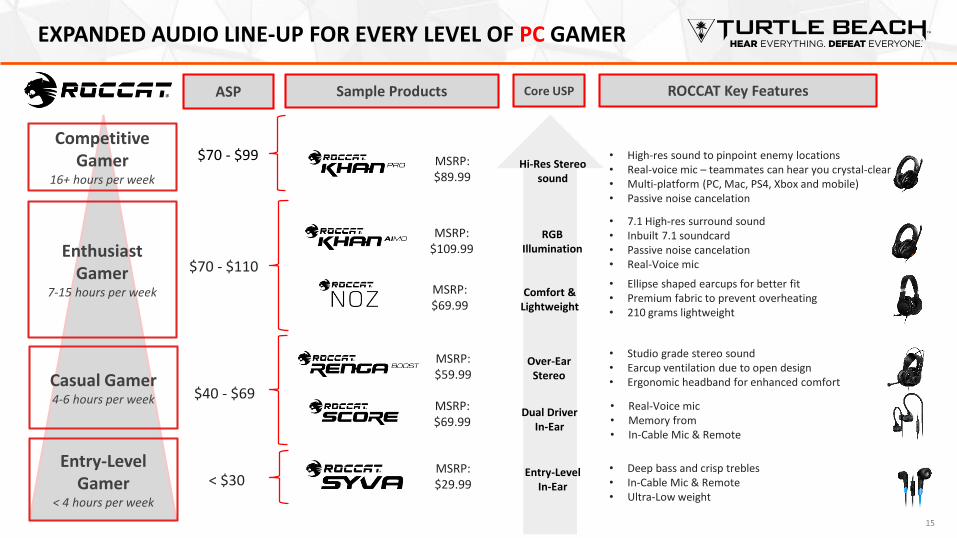
• Ellipse shaped earcups for better fit• Premium fabric to prevent overheating• 210 grams lightweight
EXPANDED AUDIO LINE-UP FOR EVERY LEVEL OF PC GAMER
15
MSRP:$69.99
ASP Sample Products
• Deep bass and crisp trebles• In-Cable Mic & Remote• Ultra-Low weight
$40 - $69
< $30Entry-Level
Gamer< 4 hours per week
Casual Gamer4-6 hours per week
Enthusiast Gamer
7-15 hours per week
Competitive Gamer
16+ hours per week
MSRP:$29.99
• Real-Voice mic• Memory from• In-Cable Mic & Remote
Entry-Level In-Ear
Over-Ear Stereo
RGB Illumination
Core USP
Dual DriverIn-Ear
$70 - $99
MSRP:$109.99
Hi-Res Stereo sound
ROCCAT Key Features
• 7.1 High-res surround sound• Inbuilt 7.1 soundcard• Passive noise cancelation• Real-Voice mic
• Studio grade stereo sound• Earcup ventilation due to open design• Ergonomic headband for enhanced comfort
• High-res sound to pinpoint enemy locations• Real-voice mic – teammates can hear you crystal-clear • Multi-platform (PC, Mac, PS4, Xbox and mobile)• Passive noise cancelation
MSRP:$59.99
MSRP:$89.99
$70 - $110
Comfort & Lightweight
MSRP:$69.99

16
WE PARTNER WITH LEADING TEAMS, INFLUENCERS & EVENTS
Titles shown represent games played by our partner esports teams and influencers and do not indicate a partnership with the publisher
Official Audio Partner –EA Sports FIFA 19 Champions Cup
Exclusive Gaming Partner –Jay Z’s Made In America Festival
Castro_1021 (#1 FIFA Streamer)
Dr Disrespect (3.5M+ Subs)
Mae (1M+ Reach)
Ali-A (21M+ Subs) Siefe (Top 5 on Mixer)
Josh Hart (New Orleans Pelicans)
Romelu Lukaku(Football Superstar)
PJ Washington(Charlotte Hornets)
Kevin Porter Jr. (Cleveland Cavaliers)
MrSavage (3.5M+ Reach)
MrBBoy45 (2.5M+ Reach)
BL355UR (900k+ Reach)
Houston Outlaws – Franchise team in Activision Blizzard’s OWL
Astralis – 3-time Major Champions and top CS:GO team
2018 FINANCIALS AND 2019 OUTLOOK
17
QUARTERLY FINANCIAL OVERVIEW
1. See appendix for a reconciliation of non-GAAP measures.
18
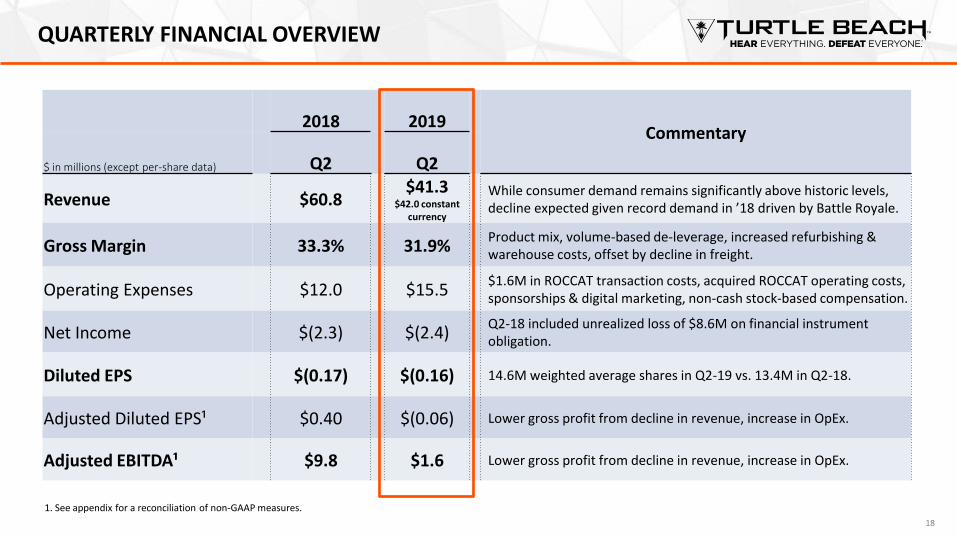
2018 2019Commentary
$ in millions (except per-share data) Q2 Q2
Revenue $60.8$41.3
$42.0 constant currency
While consumer demand remains significantly above historic levels, decline expected given record demand in ’18 driven by Battle Royale.
Gross Margin 33.3% 31.9%Product mix, volume-based de-leverage, increased refurbishing & warehouse costs, offset by decline in freight.
Operating Expenses $12.0 $15.5$1.6M in ROCCAT transaction costs, acquired ROCCAT operating costs, sponsorships & digital marketing, non-cash stock-based compensation.
Net Income $(2.3) $(2.4)Q2-18 included unrealized loss of $8.6M on financial instrument obligation.
Diluted EPS $(0.17) $(0.16) 14.6M weighted average shares in Q2-19 vs. 13.4M in Q2-18.
Adjusted Diluted EPS¹ $0.40 $(0.06) Lower gross profit from decline in revenue, increase in OpEx.
Adjusted EBITDA¹ $9.8 $1.6 Lower gross profit from decline in revenue, increase in OpEx.
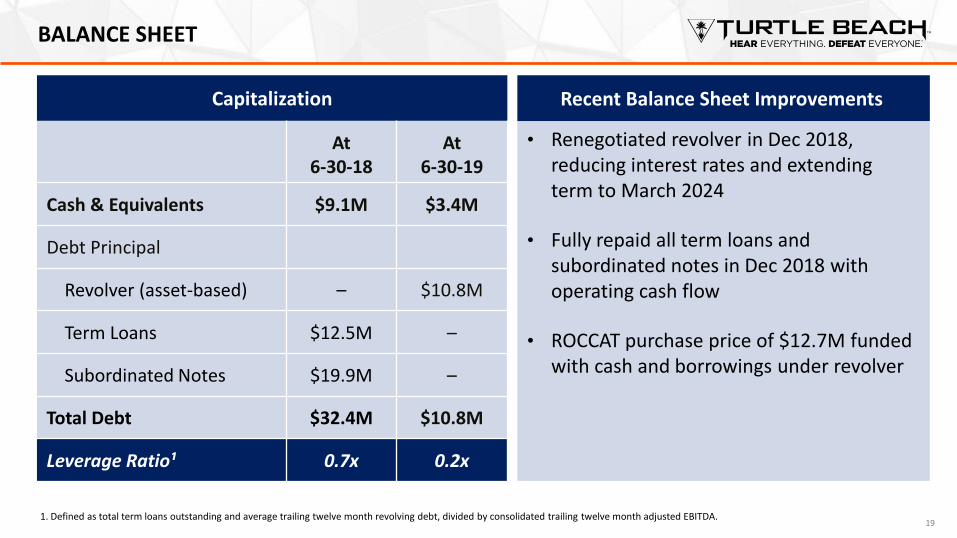
Recent Balance Sheet Improvements
• Renegotiated revolver in Dec 2018, reducing interest rates and extending term to March 2024
• Fully repaid all term loans and subordinated notes in Dec 2018 with operating cash flow
• ROCCAT purchase price of $12.7M funded with cash and borrowings under revolver
BALANCE SHEET
19
Capitalization
At 6-30-18
At6-30-19
Cash & Equivalents $9.1M $3.4M
Debt Principal
Revolver (asset-based) – $10.8M
Term Loans $12.5M –
Subordinated Notes $19.9M –
Total Debt $32.4M $10.8M
Leverage Ratio¹ 0.7x 0.2x
1. Defined as total term loans outstanding and average trailing twelve month revolving debt, divided by consolidated trailing twelve month adjusted EBITDA.

ANTICIPATED CONSOLE HEADSET MARKET DYNAMICS IN 2019
0
2
4
6
8
10
12
14
2017 2018 2019 Model 2020+
20
Incremental Battle Royale Driven
Headset Sales
Simplified Market Model¹US & Canada Console Gaming Headset Sell-ThroughMillions of Units
9.0
14.7
“Normal” Headset
SalesWithout
Battle RoyaleImpact
11.8Assuming 50% of incremental
2018 users replace or
upgrade in 2019
1. This is a highly simplified market model to illustrate overall dynamics - actual market dynamics are much more complex than shownSource: The NPD Group/Retail Tracking Service/Video Games/Dollars/U.S. & Canada
Installed base of console headset users grew significantly in 2018 driven by Battle Royale games
Recent survey results indicate consumer intent to upgrade/replace <24-month cycle (with wide distribution around that average)
Biggest drivers of potential increase from 2019 model estimates are:• Faster upgrade/replace cycle among new headset users• Discount console prices in last holiday before new gen consoles• Stronger slate of Q4 games or major games going “free” model
Biggest drivers of potential decrease from 2019 model estimates are:• Slower upgrade/replace cycle among new headset users• Weaker slate of Q4 games than expected• Market slowdown due to new console announcements
Market sell-in revenues (sales) will vary from sell-through units based on channel inventory adjustments to hold weeks-of-supply and ASP of product sales
+30%
“Normal” Headset
SalesBased on
Larger Installed Base of Users

UNCHANGED 2019 OUTLOOK¹
21
2019 Comments
Net Revenue
$240M-$248M
Market assumptions as outlined on right; modest reduction in market share vs. 2018 but higher than 2017 and 2016.
Gross Margin
33%-34%Reduced operating leverage, one-time ROCCAT charges; tariff impact offset by COGS savings and/or wholesale price increases.
GAAP EPS²
$0.70-$0.90
$12M-$14M incremental OpEx for ROCCAT, including estimated $3M in ROCCAT transaction & integration costs, 10% tax rate.
Adj. EPS² $0.90-$1.10
Excludes transaction & integration costs related to ROCCAT acquisition, currently estimated to be ~$3M in 2019, and gain on a financial instrument obligation.
Diluted Shares
15.7M
Adj. EBITDA
$27M-$31M
Includes some incremental spend and investments for holiday and to advance 2020 position.
1. Guidance effective on August 8, 2019.2. Include $1.2M in costs for purchase accounting step-ups on acquired ROCCAT inventory.
Overall Console Headset Market Assumptions:
• Influx of new gaming headset users and upgrade/replace cycle reflect normal historical patterns (no “Fortnite effect” added)
• Console prices are discounted in final holiday before new launches creating holiday sales as % of full year sales similar to last transition (2012)
• Holiday AAA game launches are weaker than 2018 but COD: Modern Warfare launch is very strong
• Pending 10% tariffs, which impact headsets starting September 1 (if they remain in place), are mitigated sufficiently to not have major impact in 2019

REVENUE PROFILE
22
$163 $174$149
$287
$240-$248
$0
$50
$100
$150
$200
$250
$300
$350
2015 2016 2017 2018 2019E
Company Revenues (1)
Millions
Channel Inventory Adjustments
1. Company net revenues = wholesale revenues so not directly comparable to retail revenues in the chart on the right – shown just for perspective given channel inventory impacts on company net revenues.2. Console headsets only - The NPD Group/Retail Tracking Service/Video Games/Dollars/U.S. & Canada/CY2015, CY2016, CY2017, CY2018, and Trailing Twelve Months July 2018-June 2019. 3. Guidance effective only as of August 8, 2019.
(3)
Company Product Retail Sell-Through in US & Canada Markets (2)
Millions
$174 $179 $175
$322
$282
$0
$50
$100
$150
$200
$250
$300
$350
2015 2016 2017 2018 TTM June2019
EBITDA PROFILE
23
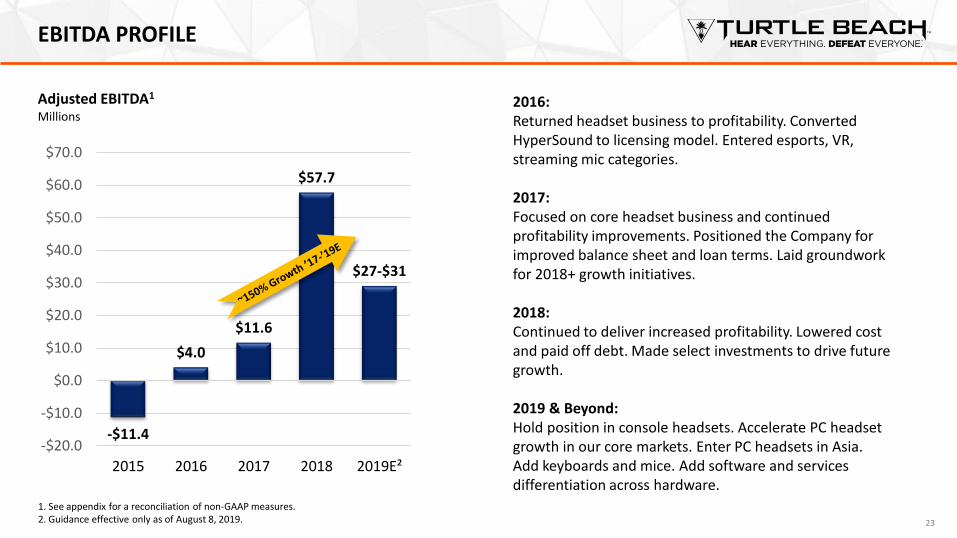
-$11.4
$4.0
$11.6
$57.7
$27-$31
-$20.0
-$10.0
$0.0
$10.0
$20.0
$30.0
$40.0
$50.0
$60.0
$70.0
2015 2016 2017 2018 2019E²
Adjusted EBITDA1
Millions2016:Returned headset business to profitability. Converted HyperSound to licensing model. Entered esports, VR, streaming mic categories.
2017:Focused on core headset business and continued profitability improvements. Positioned the Company for improved balance sheet and loan terms. Laid groundwork for 2018+ growth initiatives.
2018:Continued to deliver increased profitability. Lowered cost and paid off debt. Made select investments to drive future growth.
2019 & Beyond:Hold position in console headsets. Accelerate PC headset growth in our core markets. Enter PC headsets in Asia. Add keyboards and mice. Add software and services differentiation across hardware.
1. See appendix for a reconciliation of non-GAAP measures.2. Guidance effective only as of August 8, 2019.

STRONG FREE CASH FLOW GROWTH
24
-$19.8
-$1.3
$5.2
$51.1
$23-$27
-$30.0
-$20.0
-$10.0
$0.0
$10.0
$20.0
$30.0
$40.0
$50.0
$60.0
2015 2016 2017 2018 2019E²
Strong free cash flow generation:
• Allowed the Company to pay down all long-term debt
• Expected to enable continued growth investments
• Allowed for April ’19 announcement of a share buyback of up to $15M over the next two years
• Repurchased ~156,000 shares for $1.5M (average of $9.62 per share) in Q2-19
• Acquired ROCCAT for $12.7M at closing with operating cash and borrowings under revolving credit facility
Free Cash Flow1
Millions
1. Free cash flow defined as consolidated adjusted EBITDA less capital expenditures, less cash interest.2. Estimated based on guidance effective only as of August 8, 2019.
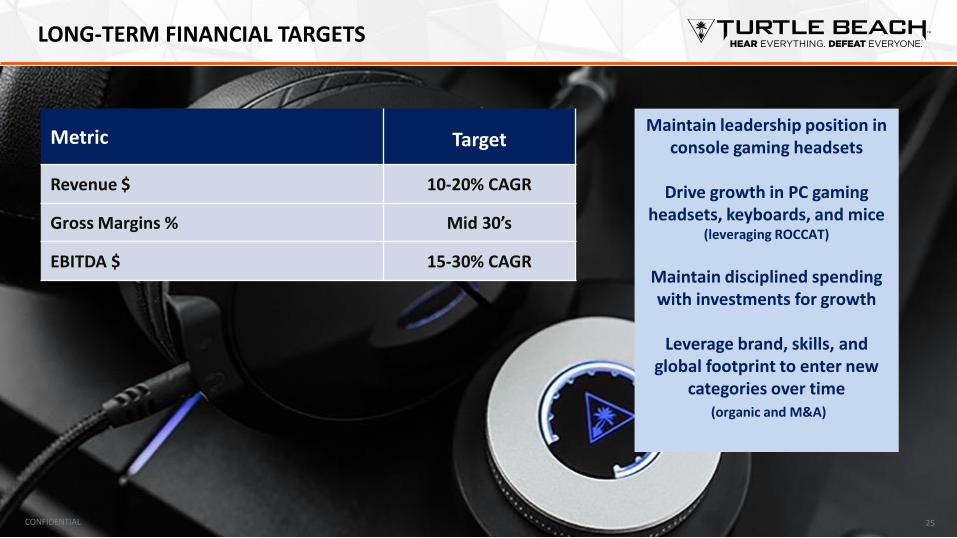
LONG-TERM FINANCIAL TARGETS
CONFIDENTIAL 25
Metric Target
Revenue $ 10-20% CAGR
Gross Margins % Mid 30’s
EBITDA $ 15-30% CAGR
Maintain leadership position in console gaming headsets
Drive growth in PC gaming headsets, keyboards, and mice
(leveraging ROCCAT)
Maintain disciplined spending with investments for growth
Leverage brand, skills, and global footprint to enter new
categories over time(organic and M&A)
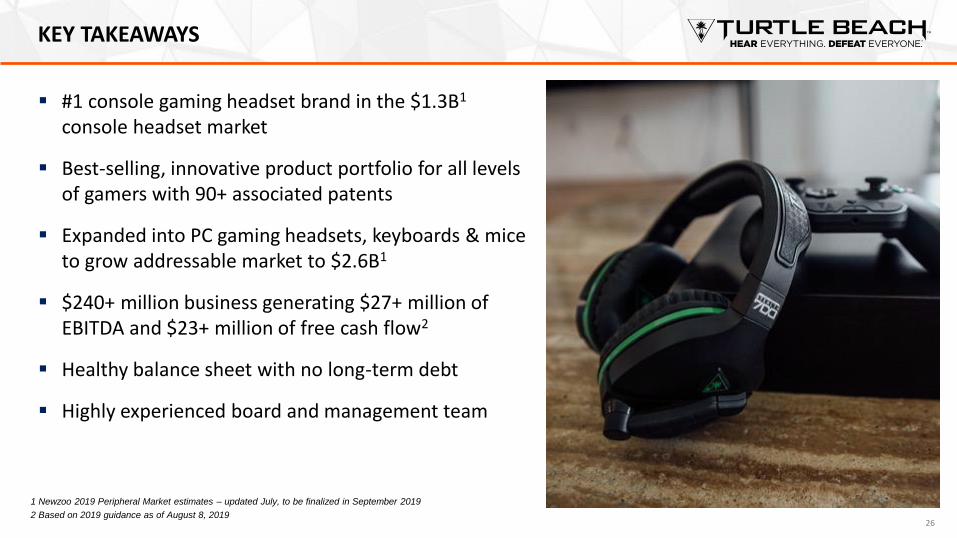
KEY TAKEAWAYS
▪ #1 console gaming headset brand in the $1.3B1
console headset market
▪ Best-selling, innovative product portfolio for all levels of gamers with 90+ associated patents
▪ Expanded into PC gaming headsets, keyboards & mice to grow addressable market to $2.6B1
▪ $240+ million business generating $27+ million of EBITDA and $23+ million of free cash flow2
▪ Healthy balance sheet with no long-term debt
▪ Highly experienced board and management team
26
1 Newzoo 2019 Peripheral Market estimates – updated July, to be finalized in September 2019
2 Based on 2019 guidance as of August 8, 2019

Investor Relations: Media Contact:Cody Slach, Sean McGowan Maclean MarshallGateway Turtle Beach Corporation949.574.3860 858.914.5093 [email protected] [email protected]
APPENDIX
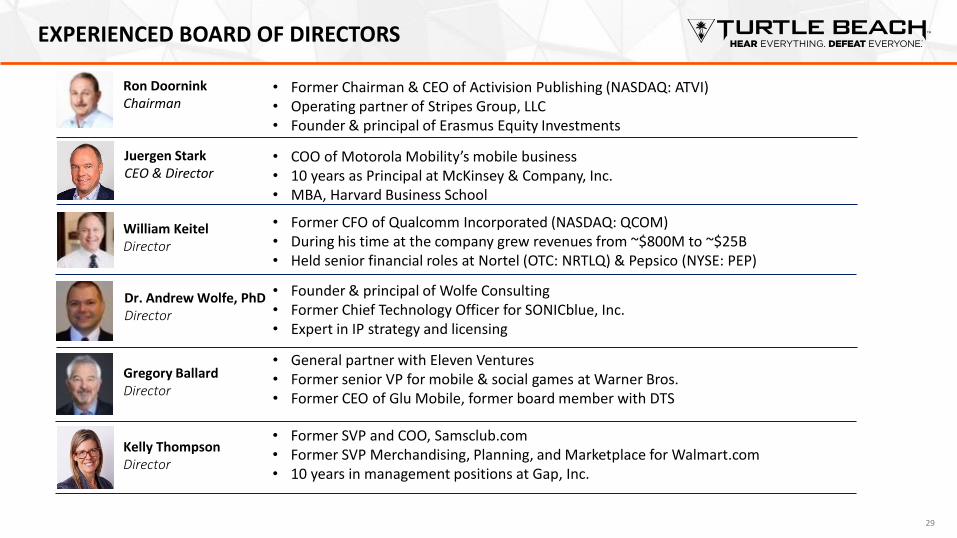
EXPERIENCED BOARD OF DIRECTORS
29
• Former Chairman & CEO of Activision Publishing (NASDAQ: ATVI)• Operating partner of Stripes Group, LLC• Founder & principal of Erasmus Equity Investments
Ron DoorninkChairman
Juergen StarkCEO & Director
• COO of Motorola Mobility’s mobile business• 10 years as Principal at McKinsey & Company, Inc.• MBA, Harvard Business School
William KeitelDirector
• Former CFO of Qualcomm Incorporated (NASDAQ: QCOM)• During his time at the company grew revenues from ~$800M to ~$25B• Held senior financial roles at Nortel (OTC: NRTLQ) & Pepsico (NYSE: PEP)
Dr. Andrew Wolfe, PhDDirector
• Founder & principal of Wolfe Consulting• Former Chief Technology Officer for SONICblue, Inc.• Expert in IP strategy and licensing
Gregory BallardDirector
• General partner with Eleven Ventures• Former senior VP for mobile & social games at Warner Bros.• Former CEO of Glu Mobile, former board member with DTS
Kelly ThompsonDirector
• Former SVP and COO, Samsclub.com• Former SVP Merchandising, Planning, and Marketplace for Walmart.com• 10 years in management positions at Gap, Inc.

EXPERIENCED MANAGEMENT TEAM
30
Juergen StarkCEO
John HansonCFO
Cris Keirn SVP, Global Sales
Matt SeymourVP, Product Management
Megan Wynne General Counsel
• COO of Motorola Mobility’s mobile business
• 10 years as principal at McKinsey & Company
Joe StachulaCTO & VP Development
Andrew LilienVP of Marketing
Jose RosadoSVP Global Operations
Scott RankinVP Global Logistics
• 20+ years in consumer electronics
• 12 years at Plantronics engineering audio headsets
• 20+ years of brand, consumer & retail marketing experience
• Past experience at ESPN, Fleer Trading Cards & National Media Group
• Former Sr. Director, Global Supply Chain Operations for HP
• 22 years of supply chain management with Motorola, On Semiconductor, HP, Cisco
• 20+ years of logistics, transportation & operations experience
• 11+ years at Turtle Beach
• EVP & CFO at Dialogic
• CFO at One Communications Corp
• Led headset transition as VP of business planning & strategy
• 17 years with Motorola in product management, operations, quality & customer relations
• 20+ years in the Consumer Electronics industry• Previously with Sony leading television portfolio
planning & development, product marketing
• 5 years with I-Flow, a Kimberly-Clark Health Care Company
• 13 years with Morris Polich & Purdy law firm
• Founder of ROCCAT GmbH and CEO for 12 years
• VP Europe for RAZER
• Professional gamer and founder of MTW esports teamRene KorteGeneral Manager, PC Products

SHARE COUNT BRIDGE
31
Weighted average diluted shares outstanding – Q2 2018 13,401
Weighted average common shares issued in exchange for Series B preferred stock 330
Weighted average common shares issued upon exercise of stock options and warrants 899
Weighted average common shares repurchased (44)
Weighted average diluted shares outstanding – Q2 2019 14,586
Estimated weighted average diluted shares outstanding – 2019 15,700
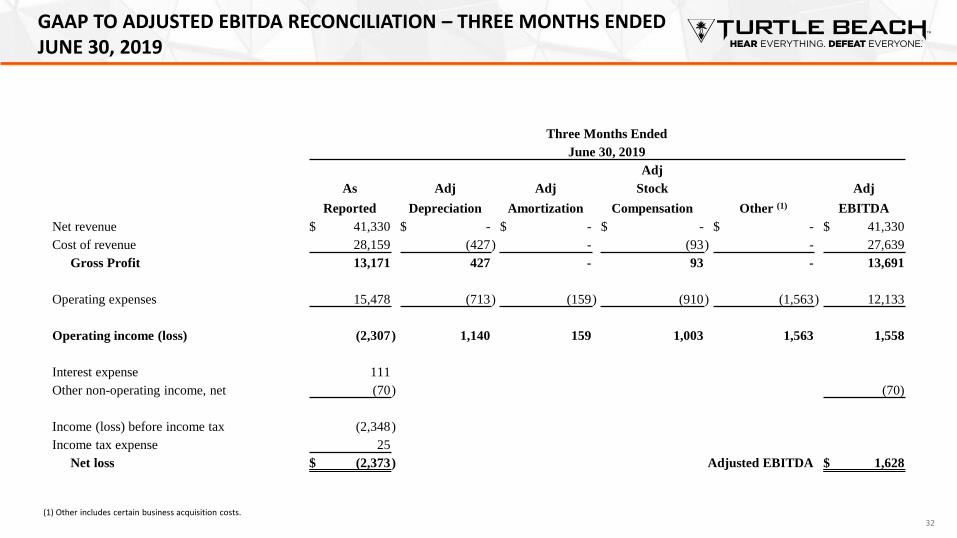
GAAP TO ADJUSTED EBITDA RECONCILIATION – THREE MONTHS ENDED JUNE 30, 2019
32(1) Other includes certain business acquisition costs.
Three Months Ended
June 30, 2019
Adj
As Adj Adj Stock Adj
Reported Depreciation Amortization Compensation Other (1) EBITDA
Net revenue $ 41,330 $ - $ - $ - $ - $ 41,330
Cost of revenue 28,159 (427) - (93) - 27,639
Gross Profit 13,171 427 - 93 - 13,691
Operating expenses 15,478 (713) (159) (910) (1,563) 12,133
Operating income (loss) (2,307) 1,140 159 1,003 1,563 1,558
Interest expense 111
Other non-operating income, net (70) (70)
Income (loss) before income tax (2,348)
Income tax expense 25
Net loss $ (2,373) Adjusted EBITDA $ 1,628

GAAP TO ADJUSTED EBITDA RECONCILIATION – THREE MONTHS ENDED JUNE 30, 2018
33(1) Other includes unrealized gain (loss) on financial instrument obligation.
Three Months Ended
June 30, 2018
Adj
As Adj Adj Stock Adj
Reported Depreciation Amortization Compensation Other (1) EBITDA
Net revenue $ 60,805 $ - $ - $ - $ - $ 60,805
Cost of revenue 40,528 (110) - (313) - 40,105
Gross Profit 20,277 110 - 313 - 20,700
Operating expenses 12,008 (1,146) (77) (286) - 10,499
Operating income 8,269 1,256 77 599 - 10,201
Interest expense 1,258
Other non-operating income, net 9,029 (8,619) 410
Income (loss) before income tax (2,018)
Income tax expense 300
Net loss $ (2,318) Adjusted EBITDA $ 9,791

GAAP TO ADJUSTED DILUTED EPS RECONCILIATION – THREE MONTHS ENDED JUNE 30TH
34
Three Months Ended
June 30,
2019
June 30,
2018
Net Income (Loss)
GAAP Net Income (Loss) $ (2,373) $ (2,318)
Adjustments, net of tax:
Loss (gain) on financial instrument obligation - 8,619
Acquisition integration costs 1,477 -
Non-GAAP Earnings $ (896) $ 6,301
Diluted Earnings Per Share
GAAP- Diluted $ (0.16) $ (0.17)
Gain on financial instrument obligation - 0.57
Acquisition integration costs 0.10 -
Non-GAAP- Diluted $ (0.06) $ 0.40

GAAP TO ADJUSTED EBITDA RECONCILIATION – FULL YEARS
35
December 31, 2018 December 31, 2017 December 31, 2016 December 31, 2015
Consolidated
Net Income (Loss) 39,190 (3,248) (87,182) (82,907)
Depreciation 3,954 4,075 5,066 5,901
Amortization of intangibles 303 349 4,128 2,015
Interest 5,335 7,916 7,447 5,099
Taxes 1,737 593 (387) 2,393
Stock Compensation 1,877 1,430 3,960 5,897
Restructuring Expense - 533 664 399
Goodwill Impairment - - 63,236 49,822
Business Transaction Expense - (79) 7,079 -
Unrealized loss on financial instrument obligation 5,291 - - -
Adj EBITDA 57,687 11,567 4,011 (11,381)