investor presentation - amazon s3...investor presentation | second quarter 2014 5 the company’s...
TRANSCRIPT

Investor PresentatIonsecond Quarter 2014

company overview
Business overview
country overviews
understanding the Business
consolidated Financial
Performance
Glossary of commonly used terms
Key sharehold-er Information in a nutshell
corporate structure and Governance
02
20
38
09
28
46
18
34
Outline

I. company overview

Investor PresentatIon | second Quarter 2014 3
GB auto is leveraging its brand equity, its regional presence, and the strength of its network to expand across the automotive value chain
•Passenger cars in egypt, Iraq, Libya, algeria
•cv&ce in egypt, Libya•Motorcycles and
three-Wheelers in egypt
•tires in egypt, Iraq, Libya, Jordan, algeria
•expanding bus offer-ings
•seeking new regional expansions
•seeking new repre-sentations
•Passenger cars•commercial vehicles •Motorcycles and
three-Wheelers
•expand to support operations in new regional markets
•In egypt, new retail operations will distribute tires, tire parts, batteries and lubricants
•GB Lease: financial leasing
•Mashroey: microfinance
•drive: consumer finance and factoring
•Haram tourism transport (Htt): operational leasing
•Increase customer reach
•diversify product portfolios
•Bus body manufacturing
•trailers and super structures
•Manufacturing of bus body on new chassis has begun in the GB Polo facility and more models are on their way
•Passenger car com-pletely Knocked down (cKd) assembly
•Motorcycles and three-Wheelers Knocked down as-sembly
•assembly of addition-al Pc and cv models and potentially value added products
cur
rent
ly:
nex
t s
tep
s:
after-sales servicesFinancingManufacturing sales and distribution
assembly

Investor PresentatIon | second Quarter 2014 4
GB auto’s operations are segmented across six primary lines of business
75.5% 8.2% 7.3% 3.8% 5.1% 0.1%75.5% 8.2% 7.3% 3.8% 5.1% 0.1%75.5% 8.2% 7.3% 3.8% 5.1% 0.1%75.5% 8.2% 7.3% 3.8% 5.1% 0.1%75.5% 8.2% 7.3% 3.8% 5.1% 0.1%75.5% 8.2% 7.3% 3.8% 5.1% 0.1%
Passenger Cars
2Q14 Group revenue contribution
2Q14 Group revenuecontribution
Motorcycles & Three-Wheelers
•assembly and dis-tribution of imported completely-knocked-down (cKd) kits with a production capacity of around 70,000 units per year for the egyptian market
•distribution of imported completely-built-up (cBu) vehicles across footprint
•after-sales service and distribution of spare parts
•Financing options provided through drive in egypt
•Markets: egypt, Iraq, algeria, Libya
•distribution of motorcy-cles and three-wheelers (“tuk-tuks”)
•after-sales service and distribution of spare parts
•Financing options pro-vided through Mashroey
•Market: egypt
Commercial Vehicles & Construction Equipment
Financing Businesses OthersTires
2Q14 Group revenue contribution
2Q14 Group revenue contribution
2Q14 Group revenue contribution
2Q14 Group revenue contribution
•assembly and distribu-tion of trucks
•Bus-body manufac-turing; distribution of buses
•Manufacturing and dis-tribution of superstruc-tures and trailers
•distribution of con-struction and farming equipment
•after-sales service and distribution of spare parts
•Markets: egypt, Libya
•distribution of pas-senger car, van, truck, construction equipment and bus tires
•Markets: egypt, Iraq, Libya, algeria, Jordan
•GB auto’s Financing Businesses offer financ-ing in all segments of the market
•GB Lease provides fi-nancing for commercial vehicle and corporate lease clients
•Mashroey finances the purchase of motor-cycles, tuk-tuks, Yto tractors and motor tricycles
•drive offers consumer financing of passenger cars and factoring of auto and non-auto products
•Htt provides opera-tional leasing
•Market: egypt
•the Pre-owned ve-hicles division is rolling out a Western-style pre-owned car operation
•the Lubricants busi-ness distributes Gaz-prom neft-Lubricants in egypt
•the retail division will operate retail after-sales outlets to dis-tribute tires, tire parts, batteries, parts and lubricants, and will also offer related services in select locations
•Market: egypt
Investor PresentatIon | second Quarter 2014 5
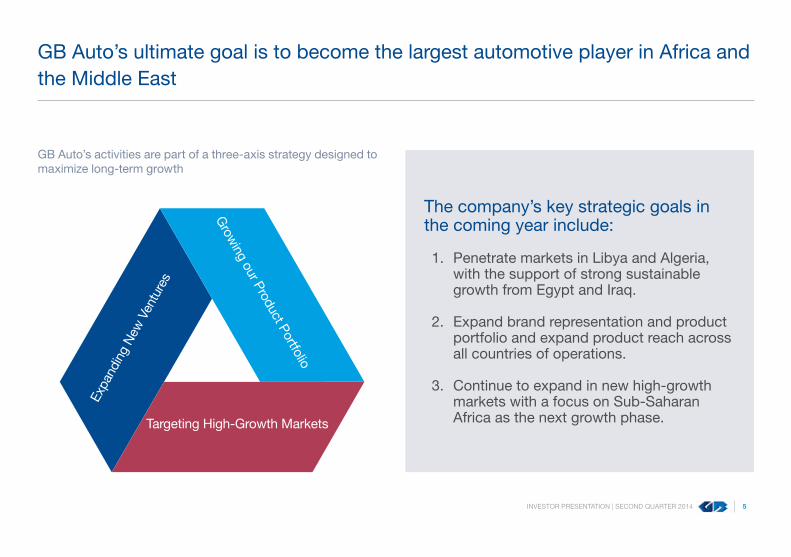
the company’s key strategic goals in the coming year include:
1. Penetrate markets in Libya and algeria, with the support of strong sustainable growth from egypt and Iraq.
2. expand brand representation and product portfolio and expand product reach across all countries of operations.
3. continue to expand in new high-growth markets with a focus on sub-saharan africa as the next growth phase.
GB auto’s activities are part of a three-axis strategy designed to maximize long-term growth
GB auto’s ultimate goal is to become the largest automotive player in africa and the Middle east
expa
ndin
g n
ew v
entu
res
targeting High-Growth Markets
Grow
ing our Product Portfolio

Investor PresentatIon | second Quarter 2014 6
Where we see the opportunity…
•Maintain leadership in passenger car market
•Fill in product gaps•capitalize on expansions already made
and in-progress in after-sales•support sales through financing options
•Penetrate the Libyan passenger car market
•create after-sales network based on the successful egyptian model
•Potential expansion of GB auto’s product range
•enter select sub-saharan african mar-kets with a strong product range that addresses pent-up demand in tradition-ally under-served industry segments
EgyPT
LiBya
iraq
aLgEriaaFriCa
•continue to grow market share•continue to expand after-sales network
to support sales, solidify market pres-ence and increase profitability
•Potential expansion of GB auto’s product range
•Penetrate the algerian passenger car market
•augment passenger car sales with a wide range of tire brands
•Potential expansion of GB auto’s product range
Management’s future plans focus on regional and product expansions

Investor PresentatIon | second Quarter 2014 7
•enters into an exclusive agreement to import and distribute Mazda vehicles in egypt•enters a Jv to distribute Hyundai vehicles in Iraq •Becomes the exclusive distributor of Yokohama tires in egypt •GB auto’s Le 1 billion bond issue is well received by the market (1.3x over-subscribed)
GB auto has evolved significantly over the past five years20
1220
1320
1120
10
TO-DaTE iN 2014
•Launches key brand representations in algeria and Libya•completes the GB academy and begins instruction •signs an agreement with chery to distribute the Karry micro-microbus •Wins Geely International corporation’s ‘2012 Best new distribution’ award•a GB auto engineer wins the gold medal in the engine system support category at Hyun-
dai Motor corporation’s (HMc) World skill olympic competition
•announces a strategic partnership with Geely automobile Holding Ltd of china •Becomes the exclusive distributor of Iveco bus chassis in egypt•consumer finance venture drive begins operations•acquires the exclusive right to distribute Zc rubber’s Westlake tires in the egyptian market•Inaugurates the newly revamped state-of-the-art Prima plant
•completes construction of new paint facilities in the Greater cairo area, more than dou-bling capacity
•opens first after-sales facility in Iraq•Places in the top 50 companies on the Hawakamah Institute for corporate Governance’s
s&P Hawkamah environment, social, and corporate Governance (esG) Pan arab Index
•acquires distribution rights for Good-year tires in algeria
•enters into an exclusive strategic alliance to distribute Gazprom neft-Lubricants
•GB auto’s Pre-owned vehicles division is rolling-out a Western-style pre-owned car operation in egypt, with operations beginning in mid-March 2014

Investor PresentatIon | second Quarter 2014 8
2Q10 2Q11 2Q12 2Q13 2Q14 2Q10 2Q11 2Q12 2Q13 2Q14 2Q10 2Q11 2Q12 2Q13 2Q14 2Q10 2Q11 2Q12 2Q13 2Q14
3,081.5
2,167.72,177.81,857.7
1,739.8
398.0
260.0259.6214.7
235.6124.9
165.2
130.9153.8
5,749.2
4,249.73,890.2
3,156.03,066.3
759.6
577.9446.0
364.4
427.0
413.6
302.3257.6
200.1274.0
87.963.4
76.558.1
146.4
1H10 1H11 1H12 1H13 1H141H10 1H11 1H12 1H13 1H141H10 1H11 1H12 1H13 1H141H10 1H11 1H12 1H13 1H14
39.9
16.1
58.350.5
77.7
217.5
2Q Five-Year Progression of Key Indicators(all figures in LE million)
Gross Profit eBIt net Incomerevenues
GB auto consistently reports strong performance in key indicators
Gross Profit eBIt net Incomerevenues
1H Five-Year Progression of Key Indicators(all figures in LE million)

II. understanding the Business

Investor PresentatIon | second Quarter 2014 10
GB auto is on its way to becoming a major regional player and has secured key representations in key regional markets
egypt
Passenger cars
commercial vehicles & construction equipment
Motorcycles & three-Wheelers
Financing Businesses
others
tires
Libya
Passenger cars
commercial vehicles & construction equipment
tires
Iraq
Jordan
tires
algeria
Passenger cars
tires
tires
Passenger cars

Investor PresentatIon | second Quarter 2014 11
FY08 FY09 FY10 FY11 FY12 FY13 1H14
198,800
133,165
192,848
158,926144,204 133,760
92,187
>1.6L 1.5L -1.6L
<1.3L 1.3-1.5L
14.8% 5.6%
35.1%
44.4%
ALGERIA 7,500
JORDAN 6,000
LIBYA 13,300
IRAQ 3,750
EGYPT 2,700
GDP per Capita (USD)Country
32*
77
290
165
114
the egyptian passenger car market is showing early signs of recovery, and the long-term outlook is strong
Management has focused cKd assembly on models in the largest market segment
Pc Market, annual sales Pc Market segmentation, 1H14
sources: automotive Marketing Information council (aMIc); World Bank, Business Monitor International, cIa World Fact Book, GB auto research
Management anticipates substantial future growth on the back of relatively low penetration rates per 1,000 people, as shown here:
the egyptian passenger car market’s fundamentals are strong, and will continue to be so in the years to come
*Please note that this figure refers to passenger cars only, while the motorization figures of the other countries in this graphic refer to cars, buses, and freight vehicles but do not include two-wheelers.

Investor PresentatIon | second Quarter 2014 12
gB auto is the leading market player
with a 30.1% market share in 1H14
(across all brands)
Largest national distribution
and after-sales service network
PC revenue for Egyptian activities reached
LE 2,700.2 million in 1H14
geely has become the 4th best-selling brand nationwide with 8.5% market
share in 1H14
Egypt
Location of GB auto distribution and after-sales Facilities
under constructioncurrently operating
1H14 Market share of Key Players*
* Source: Automotive Marketing Information Council (AMIC). Please note that AMIC figures are based on individual companies willingly contributing / reporting their sales and that GB Auto cannot check the full accuracy of these or guarantee that all companies operating in Egypt report to AMIC
GB auto dominates the local market on the back of its unmatched distribution and after-sales network, wide product offering, and positioning as the “best-value-for-money” product
Hyundai
Nissan
Chevrolet
Geely
Toyota 1H12
1H13
1H14
n/a
16.4%
7.0%
5.5%8.5%
14.1%
11.8%
7.5%
n/a
4.1%
15.9%
n/a
33.5% 20.8%
21.3%

Investor PresentatIon | second Quarter 2014 13
• Performance of this line of business in 1H14 was quite damp as a result of the unfortunate ban on the import of motor-cycles and three-wheelers. In light of the expiration of the ban in late 2Q the sales rate of three-wheelers had returned to normal by the close of 2Q14, and the remainder of 2014 promises to be quite strong and revenues and gross profits were also up in the quarter.
• the company reduced prices to encourage sales, and management expects to see volume growth and margins at normal levels in the coming period.
GB auto offers a wide product range within this busi-ness segment
data on egypt’s three-wheeler market overall is not reliable; however, it is clear that the market has enjoyed particularly robust growth in the past several years, especially following the intro-duction of Mashroey microfinancing in late 2010
GB auto’s three Wheeler sales volume
the Motorcycles & three-Wheelers segment has resumed operations and demand for these products remains strong
FY09 FY10 FY11 FY12 FY13
61,722
40,80542,592
68,52760,801
1H14
36,714

Investor PresentatIon | second Quarter 2014 14
an ongoing lack of economic clarity has dampened the light & medium trucks markettruck Market sales volume (excluding pickup trucks)
the bus market remains volatile, but its long-term fundamentals are soundBus Market sales volume (excluding microbus)
egypt’s commercial vehicle market is recovering but remains volatile pending a sustained uptick in infrastructure and corporate spending
Pickup Truck Light TruckMedium Truck Heavy Truck
2.7%19.6%
4.2%
73.4%
Microbus MinibusMidibus Maxibus
88.9%
1.6% 2.3%7.2%
Light & Medium Trucks
Heavy Trucks
3Q122Q12 4Q12 1Q13 2Q13 3Q13 4Q13 1Q14 2Q14 3Q122Q12 4Q12 1Q13 2Q13 3Q13 4Q13 1Q14 2Q140
500
1,000
1,500
2,000
2,500
3,000
3,500
0
200
400
600
800
1,000
GB auto recently launched the Karry seven-seater, opening the door to a promising segment
the largest segment of the truck market, the pick-up truck, is absent from GB auto’s product range for now
Source: Automotive Marketing Information Council (AMIC)
truck Market segmentation, 1H14 Bus Market segmentation, 1H14

Investor PresentatIon | second Quarter 2014 15
• unit sales of trucks are up 99.1% Y-o-Y in 2Q14, in line with the market-wide uptick in truck sales
• Management is exploring the opportunity to fill the product gaps in this segment
• unit sales rose 75.0% Y-o-Y in 2Q14
• corporate and govern-ment spending continues to improve with ambitious infrastructure projects in the works as the overall economy begins to pick up
• Management is exploring op-tions to expand this segment in new markets in north africa and the Middle east
• unit sales of tractors rose 35.7% Y-o-Y in 2Q14
• With the growth and modernization of egypt’s agricultural sector, manage-ment expects to see tractor sales perform quite well going forward, especially as our micro-financing arm has begun financing tractor sales
• unit sales of trailers rose more than three-fold Y-o-Y in 2Q14, driven by the boom in infrastructure spending and egypt’s slow-but-steady return to economic stability
• a focus on exports should be the next step
• unit sales of buses rose 168.2% Y-o-Y in 2Q14, as the market continues to improve and GB auto’s new products have been warmly received
• GB Polo continues to focus on building a strong export pipeline to the Gcc
• the recent introduction of the Karry, a seven-seater, closed a key gap in GB auto’s product portfolio
Buses trucks trailersconstruction equipment tractors
the cv & ce line of business continues to report strong performance at all divisions; management is confident that margins are sustainable at their current rates, and that this line of business will continue delivering growth
Investor PresentatIon | second Quarter 2014 16
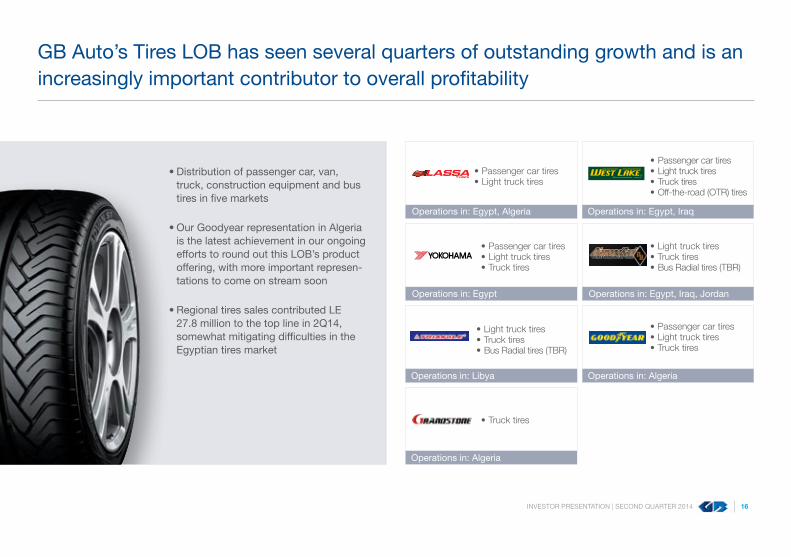
•distribution of passenger car, van, truck, construction equipment and bus tires in five markets
•our Goodyear representation in algeria is the latest achievement in our ongoing efforts to round out this LoB’s product offering, with more important represen-tations to come on stream soon
•regional tires sales contributed Le 27.8 million to the top line in 2Q14, somewhat mitigating difficulties in the egyptian tires market
•Passengercartires•Lighttrucktires
•Lighttrucktires•Trucktires•BusRadialtires(TBR)
•Passengercartires•Lighttrucktires•Trucktires
•Passengercartires•Lighttrucktires•Trucktires•Off-the-road(OTR)tires
operations in: Libya operations in: algeria
operations in: egypt
operations in: egypt, Iraqoperations in: egypt, algeria
•Lighttrucktires•Trucktires•BusRadialtires(TBR)
operations in: egypt, Iraq, Jordan
GB auto’s tires LoB has seen several quarters of outstanding growth and is an increasingly important contributor to overall profitability
•Passengercartires•Lighttrucktires•Trucktires
operations in: algeria
•Trucktires

Investor PresentatIon | second Quarter 2014 17
•Finances consumer purchases of pas-senger cars as well as factoring
•Has recorded 83% growth in its sales y-o-y and anticipates a further boost from GB auto’s Pre-owned vehicles line
•drive continued to expand its pres-ence from GB auto’s showrooms to the company’s independent dealer network, and covers retail purchases of brands that are not exclusive to GB auto
•extends lease finance to a diverse asset base: commercial vehicles, cor-porate fleets and other asset classes
•Focuses on risk diversification by as-set class, industry sector and clients
•operates leading prudent risk man-agement practices with respect to provisions and risk recognition
•now ranked as egypt’s 2nd largest leasing company (as ranked by total contracts value as at February, Ytd), as declared by the egyptian Financial supervisory authority (eFsa)
•Micropayments venture, which finances the sale of GB auto’s Bajaj-branded mo-torcycles and three-wheelers and non-GB auto motor tricycles, in addition to GB auto’s Yto-branded tractors, minivans, and pre-owned tuk-tuks on credit terms to low income consumers
•In early 1H14, Mahroey added animal feedstock (also on credit basis) to its product lines to diversify its portfolio
•network of 65 branches nationwide
GB auto’s Financing Businesses are contributing more to the company’s overall profitability, driven by the diversity of their portfolios

III. Key shareholder Information In a nutshell

Investor PresentatIon | second Quarter 2014 19
Saudi Arabia
Egypt
United States
South Africa
United Kingdom
Rest of Europe
Rest of World
34.5%
14.9%
11.5%
16.6%
11.2%
7.9%3.4%
GB auto stock Performance
Geographic distribution of the Free Float
a closer look at our shareholding structure as of 30 June 2014
GB auto’s shareholding structure
Free Float
Ghabbour Family
60%
40%
GB auto is focused on the long-term sustainability of the business and its ability to deliver to shareholders

Iv. appendix
a. Business overview

Investor PresentatIon | second Quarter 2014 21
total Passenger car sales activity (all Brands and Markets)
Passenger car Financial Performance (1/2)
2Q12 2Q13 2Q14% Change
2Q13 v 2Q14 HY12 HY13 HY14% Change
HY13 v HY14
CBU Sales Volume (Units) 13,736 8,939 11,536 29.1% 23,821 17,794 22,123 24.3%CKD Sales Volume (Units) 4,646 7,472 9,769 30.7% 9,833 12,305 19,278 56.7%Total Sales Volume (Units) 18,382 16,411 21,305 29.8% 33,654 30,099 41,401 37.5%Sales Revenue (LE million) 1,667.6 1,538.5 2,235.2 45.3% 2,933.5 2,916.9 4,143.4 42.0%Gross Profit (LE million) 165.3 146.2 239.8 64.0% 278.0 331.4 457.2 37.9%Gross Profit Margin (%) 9.9% 9.5% 10.7% 1.2 9.48% 11.4% 11.0% -0.3After-Sales Revenue (LE million) 58.6 78.1 91.6 17.2% 107.0 153.2 176.3 15.1%After-Sales Gross Profit (LE million) 20.7 29.3 31.0 6.0% 34.9 56.7 57.1 0.6%After-Sales Gross Profit Margin (%) 35.3% 37.5% 33.9% -3.6 32.7% 37.0% 32.4% -4.7Total Passenger Car Revenues (LE million) 1,726.2 1,616.7 2,326.8 0.4 3,040.5 3,070.1 4,319.7 40.7%Total Passenger Car Gross Profit (LE million) 185.9 175.5 270.9 0.5 312.9 388.2 514.3 32.5%Passenger Car Gross Margin (%) 10.8% 10.9% 11.6% 0.8 10.3% 12.6% 11.9% -0.7

Investor PresentatIon | second Quarter 2014 22
Breakdown of units sold, all brands and markets*
Passenger car revenue Breakdown by segment
Passenger car Financial Performance (2/2)
Hyundai Egypt
Geely Libya
Hyundai Iraq
Geely Egypt
After-SalesMazda Egypt
2Q13 2Q14
47.6
%
48.3
%
3.4%
34.9
%
3.9%0.8%
49.0
%
48.6
%
4.8%
13.6%
32.9
%
11.3%
2Q12
CBU
CKD
2Q12
2Q13
2Q14
7,4728,939
4,64613,736
9,76911,536
*Markets currently include Egypt, Iraq, Libya and Algeria; Iraq, Libya and Algeria are CBU only
0.7%

Investor PresentatIon | second Quarter 2014 23
two- and three-Wheelers Financial Performance (1/2)
2Q12 2Q13 2Q14% Change
2Q13 v 2Q14 HY12 HY13 HY14% Change
HY13 v HY14
Three-Wheeler Sales Volume (Units) 11,581 8,802 12,217 38.8% 19,362 25,573 23,476 -8.2%
Motorcycle Sales Volume (Units) 7,185 9,059 6,499 -28.3% 13,185 16,384 13,238 -19.2%
Total Sales Volume (Units) 18,766 17,861 18,716 4.8% 32,547 41,957 36,714 -12.5%
Sales Revenue (LE million) 209.2 199.1 241.0 21.0% 358.3 497.5 474.3 -4.7%
Gross Profit (LE million) 43.5 27.0 41.5 53.8% 75.6 77.4 86.8 12.2%
Gross Profit Margin (%) 20.8% 13.6% 17.2% 3.7 21.1% 15.6% 18.3% 2.7
After-Sales Revenue (LE million) 12.6 18.1 12.2 -32.5% 22.2 32.8 28.1 -14.1%
After-Sales Gross Profit (LE million) 3.2 4.2 2.4 -42.8% 4.9 7.4 4.8 -35.3%
After-Sales Gross Profit Margin (%) 25.4% 23.1% 19.6% -3.5 21.8% 22.6% 17.0% -5.6Total Motorcycle & Three-Wheeler Revenues (LE million) 221.8 217.2 253.2 16.6% 380.5 530.2 502.4 -5.25%Total Motorcycle & Three-Wheeler Gross Profit (LE million) 46.6 31.2 43.9 40.9% 80.5 84.8 91.6 8.0%Motorcycle & Three-Wheeler Gross Margin (%) 21.0% 14.4% 17.3% 3.0 21.2% 16.0% 18.2% 2.2

Investor PresentatIon | second Quarter 2014 24
Breakdown of units soldMotorcycles & three-Wheelers revenue Breakdown by segment
Motorcycles and three-Wheelers Financial Performance (2/2)
Three-Wheelers Motorcycles
After-Sales
2Q13 2Q14
5.7%
17.0
%
4.8%
67.6% 79.1%77.4%
8.3%
24.1%
16.1%
2Q12
Motorcycles
Three-Wheelers
2Q12
2Q13
2Q14
11,5817,185
9,059
12,2176,499
8,802
Investor PresentatIon | second Quarter 2014 25
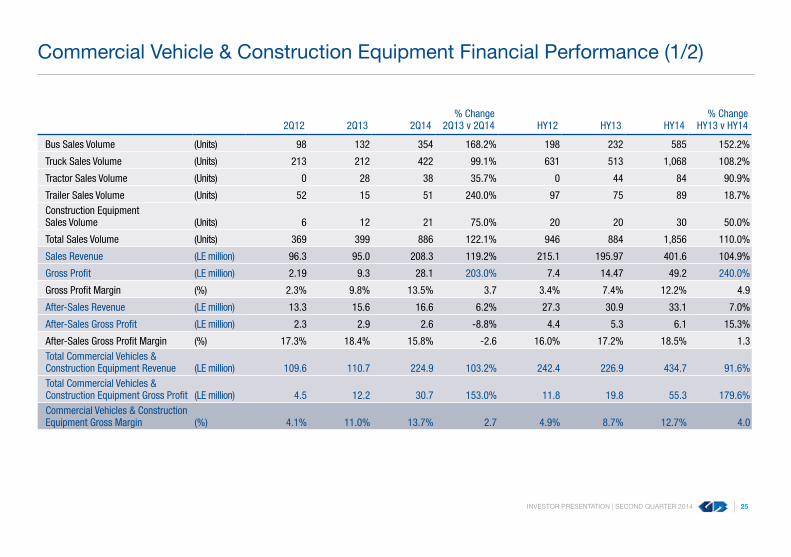
commercial vehicle & construction equipment Financial Performance (1/2)
2Q12 2Q13 2Q14% Change
2Q13 v 2Q14 HY12 HY13 HY14% Change
HY13 v HY14
Bus Sales Volume (Units) 98 132 354 168.2% 198 232 585 152.2%
Truck Sales Volume (Units) 213 212 422 99.1% 631 513 1,068 108.2%
Tractor Sales Volume (Units) 0 28 38 35.7% 0 44 84 90.9%
Trailer Sales Volume (Units) 52 15 51 240.0% 97 75 89 18.7%Construction Equipment Sales Volume (Units) 6 12 21 75.0% 20 20 30 50.0%
Total Sales Volume (Units) 369 399 886 122.1% 946 884 1,856 110.0%
Sales Revenue (LE million) 96.3 95.0 208.3 119.2% 215.1 195.97 401.6 104.9%
Gross Profit (LE million) 2.19 9.3 28.1 203.0% 7.4 14.47 49.2 240.0%
Gross Profit Margin (%) 2.3% 9.8% 13.5% 3.7 3.4% 7.4% 12.2% 4.9
After-Sales Revenue (LE million) 13.3 15.6 16.6 6.2% 27.3 30.9 33.1 7.0%
After-Sales Gross Profit (LE million) 2.3 2.9 2.6 -8.8% 4.4 5.3 6.1 15.3%
After-Sales Gross Profit Margin (%) 17.3% 18.4% 15.8% -2.6 16.0% 17.2% 18.5% 1.3Total Commercial Vehicles & Construction Equipment Revenue (LE million) 109.6 110.7 224.9 103.2% 242.4 226.9 434.7 91.6%Total Commercial Vehicles & Construction Equipment Gross Profit (LE million) 4.5 12.2 30.7 153.0% 11.8 19.8 55.3 179.6%Commercial Vehicles & Construction Equipment Gross Margin (%) 4.1% 11.0% 13.7% 2.7 4.9% 8.7% 12.7% 4.0

Investor PresentatIon | second Quarter 2014 26
Breakdown of units soldcommercial vehicles & construction equipment revenue Break-down by segment
commercial vehicle & construction equipment Financial Performance (2/2)
Buses
Trucks
Trailers
Tractors After-Sales
Construction Equipment
2Q13 2Q14
12.1%14.1%
7.4%
4.1%
12.0
%
6.9%
0.5%6.0%
5.8%
40.5% 45.2%36.9%
34.9%
33.7%
35.2%
4.2%
0.6%
2Q12
2Q12
2Q13
2Q14
98213
52 6
132212
1512
28
n/a
354422
5121
38
Buses
Tractors
Trailers
Trucks
Construction Equipment

Investor PresentatIon | second Quarter 2014 27
other Lines of Business Financial Performance
* Please note that the contribution of both Drive and Mashroey to the total revenues figures for the Financing Businesses excludes intercompany accounts with passenger cars (for Drive) and two and three-wheelers (for Mashroey).
2Q12 2Q13 2Q14% Change
2Q13 v 2Q14 HY12 HY13 HY14% Change
HY13 v HY14
Total Sales Revenues (LE million) 66.2 110.5 116.8 5.7% 131.09 221.8 208.4 -6.0%
Total Gross Profit (LE million) 10.4 16.7 19.1 14.9% 19.88 33.4 32.3 -3.3%
Gross Margin (%) 15.7% 15.1% 16.4% 1.3 15.17% 15.1% 15.5% 0.4
2Q12 2Q13 2Q14% Change
2Q13 v 2Q14 HY12 HY13 HY14% Change
HY13 v HY14
Total Sales Revenues* (LE million) 53.3 110.6 155.9 40.9% 94.1 195.8 278.7 42.3%
Total Gross Profit (LE million) 14.3 24.6 34.9 42.0% 25.6 52.1 69.2 32.8%
Gross Margin (%) 26.9% 22.2% 22.4% 0.2 27.2% 26.6% 24.8% -1.8
2Q12 2Q13 2Q14% Change
2Q13 v 2Q14 HY12 HY13 HY14% Change
HY13 v HY14
Transport Business Revenues (LE million) 0.8 2.1 0.7 -64.7% 1.7 4.9 1.8 -62.5%
Pre-Owned Vehicles Sales Revenue (LE million) - - 3.3 - - - 3.6 -
Total Sales Revenues (LE million) 0.8 2.1 4.0 92.9% 1.7 4.9 5.4 11.0%
Transport Business Gross Profits (LE million) -2.2 -0.1 -1.8 - -4.6 -0.4 -3.4 -
Pre-Owned Vehicles Gross Profit (LE million) - - 0.3 - - - 0.3 -
Total Gross Profit (LE million) -2.2 -0.1 -1.5 - -4.6 -0.4 -3.1 -
Gross Margin (%) - -3.6% -37.9% -34.3 - -7.4% -57.5% -50.0
tire summary Performance, all Brands and Markets
Financing Business summary Performance
others summary Performance

Iv. appendix
b. consolidated Financial Performance

Investor PresentatIon | second Quarter 2014 29
2Q12 2Q13 2Q14 HY12 HY13 HY14
Volu
me
(uni
ts)
Passenger Cars, Egypt 10,282 11,978 14,906 21,003 19,010 28,286
Passenger Cars, Iraq 8,100 4,433 6,204 12,651 11,089 11,533
Passenger Cars, Libya - - 195 - - 1,582
Three-Wheelers 11,581 8,802 12,217 19,362 25,573 23,476
Motorcycles 7,185 9,059 6,499 13,185 16,384 13,238
Buses 98 132 354 198 232 585
Trucks 213 212 422 631 513 1,068
Tractors 0 28 38 0 44 84
Trailers 52 15 51 97 75 89
Construction Equipment 6 12 21 20 20 30
Pre-Owned Vehicles - - 35 - - 41
rev
enue
(L
E m
illio
n)
Passenger Cars, Egypt 873.6 1,073.0 1,481.5 1,736.0 1,721.3 2,700.2
Passenger Cars, Iraq 852.6 543.6 824.8 1,304.5 1,348.7 1,505.9
Passenger Cars, Libya - - 19.1 - - 111.4
Motorcycles & Three-Wheelers 221.8 217.2 253.2 380.5 530.2 502.4
Commercial Vehicles & Construction Equipment
109.6 110.7 224.9 242.4 226.9 434.7
Tires 66.2 110.5 116.8 131.1 221.8 208.4
Financing Businesses 53.3 110.6 155.9 94.1 195.8 278.7
Others 0.8 2.1 4.0 1.7 4.9 5.4
Total Sales Revenue 2,177.8 2,167.7 3,081.5 3,890.2 4,249.7 5,749.2
sales summary

Investor PresentatIon | second Quarter 2014 30
2Q12 2Q13 2Q14 HY12 HY13 HY14
Gro
ss P
rofit
(L
e m
illio
n)
Passenger Cars, Egypt 106.2 139.2 189.9 203.1 250.8 349.5
Passenger Cars, Iraq 79.7 36.3 80.7 109.8 137.4 161.9
Passenger Cars, Libya - - -0.1 - - 3.0
Motorcycles & Three-Wheelers 46.6 31.2 43.9 80.5 84.8 91.6
Commercial Vehicles & Construction Equipment 4.5 12.2 30.7 11.8 19.8 55.3
Tires 10.4 16.7 19.1 19.9 33.4 32.3
Financing Businesses 14.3 24.6 34.9 25.6 52.1 69.2
Others -2.2 -0.1 -1.5 -4.6 -0.4 -3.1
Gross Profit 259.6 260.0 398.0 446.0 577.9 759.6
Gro
ss P
rofit
Mar
gin
(%)
Passenger Cars, Egypt 12.2% 13.0% 12.8% 11.7% 14.6% 12.9%
Passenger Cars, Iraq 9.4% 6.7% 9.8% 8.4% 10.2% 10.7%
Passenger Cars, Libya - - -0.5% - - 2.7%
Motorcycles & Three-Wheelers 21.0% 14.4% 17.3% 21.2% 16.0% 18.2%
Commercial Vehicles & Construction Equipment 4.1% 11.0% 13.7% 4.9% 8.7% 12.7%
Tires 15.7% 15.1% 16.4% 15.2% 15.1% 15.5%
Financing Businesses 26.9% 22.2% 22.4% 27.2% 26.6% 24.8%
Others - -3.6% -37.9% - -7.4% -57.5%
Gross Profit Margin 11.9% 12.0% 12.9% 11.5% 13.6% 13.2%
Gross Profit summary

Investor PresentatIon | second Quarter 2014 31
three Months ended six Months ended
(Le million) 2Q13 2Q14 % change HY13 HY14 % changePassenger cars revenues 1,616.7 2,326.8 43.9% 3,070.1 4,319.7 40.7%Motorcycles & three-Wheelers revenues 217.2 253.2 16.6% 530.2 502.4 -5.2%commercial vehicles & construction equipment revenues
110.7 224.9 103.2% 226.9 434.7 91.6%
tires revenues 110.5 116.8 5.7% 221.8 208.4 -6.0%Financing Businesses revenues 110.6 155.9 40.9% 195.8 278.7 42.3%other revenues 2.1 4.0 92.9% 4.9 5.4 11.0%total sales revenues 2,167.7 3,081.5 42.2% 4,249.7 5,749.2 35.3%total Gross Profit 260.0 398.0 53.1% 577.9 759.6 31.4%Gross Profit Margin (%) 12.0% 12.9% 0.9 13.6% 13.2% -0.4selling and Marketing -93.1 -111.7 20.0% -185.0 -214.0 15.7%administration expenses -53.9 -61.9 14.9% -100.5 -123.8 23.1%other operating Income (expenses) 8.8 10.6 19.5% 17.0 19.6 15.4%operating Profit 121.8 234.9 92.9% 309.4 441.4 42.7%operating Profit Margin (%) 5.6% 7.6% 2.0 7.3% 7.7% 0.4net Provisions and non-operating 3.1 -17.4 - -7.1 -27.8 291.9%eBIt 124.9 217.5 74.1% 302.3 413.6 36.8%eBIt Margin (%) 5.8% 7.1% 1.3 7.1% 7.2% 0.1Foreign exchange Gains (Losses) -4.3 -50.8 - -23.9 -68.7 187.7%net Finance cost -89.3 -88.6 -0.8% -167.6 -178.1 6.3%earnings Before tax 31.2 78.1 150.1% 110.9 166.8 50.5%Income taxes -0.1 -14.5 - -12.1 -31.7 161.4%net Profit Before Minority Interest 31.2 63.6 104.1% 98.7 135.1 36.8%Minority Interest -15.1 -23.7 57.5% -35.3 -47.2 33.7%net Income 16.1 39.9 147.6% 63.4 87.9 38.6%net Profit Margin (%) 0.7% 1.3% 0.6 1.5% 1.5% 0.0
Income statement

Investor PresentatIon | second Quarter 2014 32
Balance sheet
as of
(Le million) 31-dec-13 30-Jun-14 % changecash 1,085.1 1,329.7 22.5%net accounts receivable 875.5 1,180.0 34.8%Inventory 2,127.6 1,950.0 -8.3%assets Held For sale 313.1 313.1 0.0%other current assets 513.3 793.6 54.6%total current assets 4,914.6 5,566.5 13.3%net Fixed assets 1,710.5 1,770.3 3.5%Goodwill and Intangible assets 280.0 282.1 0.8%Lessor assets 502.2 774.9 54.3%Investment Property 3.1 3.1 0.0%other Long-term assets 204.4 247.6 21.2%total Long-term assets 2,700.2 3,078.0 14.0%total assets 7,614.9 8,644.5 13.5%short-term notes and debt 3,095.0 3,763.3 21.6%accounts Payable 1,373.4 1,123.7 -18.2%other current Liabilities 84.7 210.7 148.8%total current Liabilities 4,553.0 5,097.7 12.0%Long-term notes and debt 217.0 504.0 132.3%other Long-term Liabilities 217.8 318.2 46.1%total Long-term Liabilities 434.8 822.3 89.1%Minority Interest 611.5 631.3 3.2%common stock 131.1 131.1 0.0%shares Held With the Group -3.3 -3.3 0.0%Legal reserve 288.7 291.6 1.0%other reserves 1,089.5 1,109.8 1.9%retained earnings (Losses) 509.4 564.1 10.7%total shareholder’s equity 2,015.5 2,093.3 3.9%total Liabilities and shareholder’s equity 7,614.9 8,644.5 13.5%

Investor PresentatIon | second Quarter 2014 33
* refers to 12-month trailing eBItda
Key ratios FY 2013 2Q 2014
current ratio 1.08 1.09
net debt to equity 0.85 1.08
net debt to eBItda* 2.92 3.29
changes between FY13 and 2Q14
•Bottom-line growth continues to be weighed-down by currency challenges that translated into Le 51 million in foreign exchange expenses in 2Q14.
•total debt increased to Le 4.3 billion, up from Le 3.6 billion at the end of 1Q14, on the back of a shareholder loan, with the balance of the loan, including accrued interest, standing at eGP 497 as of 30 June 2014.
•Growth in total debt also reflects the strong growth of the Financing Businesses: debt related to these entities peaked at Le 539 million on the balance sheet as of 30 June.
•notably, strong sales in the quarter and careful order management have together seen inventory levels fall by Le 251 million to Le 1.9 billion, helping improve operational cash flows, which saw operations generate Le 21 million in cash in the second quarter compared with a net cashflow deficit of Le 279 million in the first quarter of the year.
Balance sheet summary

Iv. appendix
c. corporate structure and Governance

Investor PresentatIon | second Quarter 2014 35
1. dr. raouf Ghabbour, chairman of the Board of directors and chief executive officer, founded the Ghabbour Group of companies, which he began incepting in 1985. dr. Ghabbour began his career working in his family’s auto-related trading business, where he initially established himself in the tire division. Having quickly gained a commendable reputation in the market for his business savvy, dr. Ghabbour went on to acquire agency agreements from global oeMs, which he transformed into successful businesses. dr. Ghabbour has grown the company to a leading automotive assembler and distributor in the Middle east and north africa.
2. Mrs. amal ragheb, chief operating officer of Financing Businesses and chief credit risk officer, joined GB auto in october 2009 as chief operating officer of Financing Busi-nesses. she is responsible for all of the Group’s financing business activities — Leasing, Microfinance, consumer Finance and Factoring — and holds the position of executive chairman for each of the aforementioned entities. Mrs. ragheb is also the chief credit risk officer, in charge of all credit risk management policies and applications for the Group. a seasoned hands-on and results-oriented banker with a proven track record spanning over 33 years, Mrs. ragheb joined GB auto from Mashreq Bank, dubai / uae, where she held the position of senior vice President, risk Management for two years. While at Mashreq Bank, dubai / uae, Mrs. ragheb spearheaded new international growth initiatives, moving from its branch in egypt where she was ceo & country Manager for 4 years, during which time she restructured and revamped the bank, setting forth its future growth strategies in the country. Mrs. ragheb started her banking career with Bank of america where she spent 23 years, holding a series of positions in cairo and dubai. she rose to become Bank of america’s country Manager and ceo for egypt, as well as regional Manager for the Mena region, turkey, and africa, in which capacity she managed and set the Bank’s strategies for the subject markets and oversaw the Bank’s global business in the region. during her tenure at Bank of america, she was awarded the “deal team Honor of excellence,” as well as the “Best contact officer of the Year.”
3. Mrs. amani eskandar, chief Human resources officer, joined GB auto in 2014 and brings with her over 25 years of experience in egypt. Prior to joining GB auto, Mrs. eskandar was Group Human resources director at asec company for Mining “ascoM,” a position she had held since 2007. Previously, she was chief Human resources officer at al ah-ram Beverages company, “Heineken egypt,” from 1997 to 2006. Mrs. eskandar has a strong track record of utilizing and retaining high caliber talent and is a Business administra-tion graduate of Helwan university, Faculty of Foreign trade.
4. Mr. Bernd siffling, chief supply chain officer, joined GB auto in 2013 from abdel Latif Jameel, Ksa. Mr. siffling is a Mechanical engineering Graduate of the university of applied science in Karlsruhe, Germany, and has a post graduate qualification from the Institute of technology in Linkoeping, sweden. He has over 15 years’ experience in automotive sup-ply chain, Warehouse and Inventory Management, and worked until 2009 with Mercedes Benz in europe, asia and Ksa.
5. Mrs. Menatalla sadek, director of corporate Finance and Investments, joined GB auto in december 2011 to lead the creation of an in-house corporate finance department to screen, initiate and conclude merger and acquisition transactions as part of the company’s growth strategy. Mrs. sadek is also directing the firm’s investor relations activities. she is a member of the company’s executive committee and a regular attendee of the firm’s board meetings. Mrs. sadek brings with her more than a decade of experience in the investment field in egypt and europe. she was head of consumer goods research at regional investment bank Beltone Financial, where she was part of the team that helped take GB auto public. Previously, she was in sweden with standard & Poor’s european rating team, and was earlier assistant corporate Manager at Barclays Bank. sadek is a cFa charterholder.
6. Mr. Mohamed Zayan, chief Internal audit officer, has a degree in commerce and Business from Helwan university, is a us certified Internal auditor, and has attended postgradu-ate training at Insead and stanford university. Mr. Zayan worked for ceMeX between 2000 and 2008 in a variety of roles including Business Process and Internal control, Merger Integration, and sarbanes oxley implementation. He subsequently worked for elsewedy cables and then asec cement as Group Head of Internal audit.
Management Biographies (1/2)

Investor PresentatIon | second Quarter 2014 36
7. Mr. Mostafa el Mahdi, chief Financial officer, brings to GB auto 22 years of experience at KPMG, where he joined in 1990 before being promoted to Partner in 2001. While there, he was Head of the Manufacturing and consumer Market line of business and the responsible Partner for audit efficiency. Mr. el Mahdi has also worked as chief Internal auditor and advisor to the President of the Board of directors for IGI. He has extensive experience in restructuring projects and transaction services, including due diligence and mergers & acquisitions. Mr. el Mahdi holds a Bachelor of commerce degree with a focus in accounting from cairo university and is a Fellow of the egyptian society of accountants and audi-tors, as well as a Member of the american Institute of accounts and auditors.
8. Mr. Mostafa nagy, chief Information officer, joined GB auto from coca-cola Bottling company. He started with coca-cola in the It support team and was later promoted to lead the It team in egypt. He then assumed responsibility for Libya, and ended his time there as It director of egypt, Libya and Yemen. at coca-cola he was involved with complet-ing the business application portfolio, streamlining and aligning operations in line with the organization’s objectives. In Libya he revamped operations and established a hosted It service organization in egypt. He reengineered coca-cola Yemen’s business processes and implemented oracle e-Business suite there. Mr. nagy earned his Bachelor’s degree in engineering from alexandria university and did his engineering training with siemens KWu in Germany. He acquired his MBa with Majors in strategic Management and Information Management from the German university in cairo. Mr. nagy holds It and Management certifications and in 2008 was awarded the symantec eMea It visionary award.
9. Mr. nader Ghabbour, Group chief operating officer, started his career at GB auto as a showroom sales representative for the passenger car division. He worked his way up to run-ning the daily sales operations within the show room and later assumed the role of showroom sales supervisor and manager. Mr. Ghabbour’s managerial capabilities were proven when he took on the more strategic role of managing the business-to-business arm of the passenger car segment. He currently serves as the chief operating officer for the passen-ger car division, managing the passenger car sales and after sales functions, regional operations, and the 2- and 3-Wheeler operations. Mr. Ghabbour graduated with a Bachelor of arts in Business administration from Boston university.
10. Mr. osman sever, chief Business development officer, joined GB auto in 2009 to assume the chief operating officer-commercial vehicles Position. He assumed the chief Busi-ness development office role at the end of 2010 to coordinate and lead the growth strategy of GB auto. Mr. sever has dedicated his entire career to automotive industry, with more than 25 years of experience at renault turkey, Ford turkey and Karsan as in turkey in positions including sales, marketing, engineering and export areas. accordingly, Mr. sever has considerable exposure to Mena and international automotive markets. Prior to joining GB auto Mr. sever worked as General Manager in Bayraktar automotive, General Man-ager in tirsan as and deputy GM in Karsan. He holds a Bachelor of science in Mechanical engineering from Istanbul technical university and an MBa from Huron university.
11. Mr. ramez adeeb, Manufacturing director, joined GB auto in 1995, holding a number of positions and gaining experience in functions including planning, engineering, and quality control until he left the company in 2001 for a position as a project manager at rItec consultancy. Mr. adeeb rejoined GB auto in 2003, garnering additional experience in the segments of localization management, aggregate planning, sales technical support, industrial projects management and, finally, the group technical support directorship. Mr. adeeb graduated with a Bachelor’s degree from cairo university’s Mechanical engineering department in 1993. He served as a research assistant in rotor dynamics and vibration at cairo university from 1994-95. He earned an MBa in Marketing Management from the netherlands’ Maastricht school of Management in 2005.
12. Mr. Wafa tawfillis, chief executive officer of GB Polo, joined GB Polo in 2008 to assume the position of chief executive officer of GB Polo. Mr. tawfillis has dedicated most of his career to the bus building industry, with more than 20 years of experience in egypt and the united Kingdom. His background includes a diverse range of activities such as manu-facturing, supply chain and product support, with extensive experience in sales and marketing. Prior to joining GB Polo, Mr. tawfillis worked as director at Mcv – Bus & coaches in the united Kingdom, General Manager at Mcv egypt, and other positions in manufacturing, sales, after-sales and marketing. He holds a Bachelor of science in Mechanical engineering from Helwan university, egypt.
Management Biographies (2/2)

Investor PresentatIon | second Quarter 2014 37
1. dr. raouf Ghabbour, chairman of the Board of directors and chief executive officer, founded the Ghabbour Group of companies, which he began incepting in 1985. dr. Ghabbour began his career working in his family’s auto-related trading business, where he initially established himself in the tire division. Having quickly gained a commendable reputation in the market for his business savvy, dr. Ghabbour went on to acquire agency agreements from global oeMs, which he transformed into successful businesses. dr. Ghabbour has grown the company to a leading automotive assembler and distributor in the Middle east and north africa.
2. Mr. aladdin Hassouna saba, non-executive director, is the co-founder and chairman of Beltone Financial, a leading regional financial services institution operating in the fields of Investment Banking, asset Management, Private equity, Brokerage and equity research. Mr. saba is also a founding member of the egyptian Investment Management association, in addition to the egyptian capital Markets association. Mr. saba sits on the boards of the egyptian stock exchange, national Bank of egypt, as well as various corporations and investment funds.
3. Mr. Khaled Kandil, non-executive director, joins the Board of directors after serving GB auto as coo for Hyundai Motor corp operations. He joined the company from exxonMobil, where he was most recently vice-chairman of exxonMobil egypt and Managing director of exxonMobil Lubricants and specialties covering operations in north and east africa. He participated in the merger between the exxon and Mobil corporations as well as a number of market entry and exit projects in south america, south east asia and africa. a 32-year veteran of the oil and gas industry, in 1996 he headed a business reengineering project for the company’s egyptian operations after which he led the implementation of Mobil Lubri-cants’ integrated business strategy. this strategy saw the company become the market leader in less than one year, after being traditionally the third-ranked market player.
4. Mr. Mostafa el Mahdi, executive director and chief Financial officer, brings to GB auto 22 years of experience at KPMG, where he joined in 1990 before being promoted to Partner in 2001. While there, he was Head of the Manufacturing and consumer Market line of business and the responsible Partner for audit efficiency. Mr. el Mahdi has also worked as chief Internal auditor and advisor to the President of the Board of directors for IGI. He has extensive experience in restructuring projects and transaction services, including due diligence and mergers & acquisitions. Mr. el Mahdi holds a Bachelor of commerce degree with a focus in accounting from cairo university and is a Fellow of the egyptian society of accoun-tants and auditors, as well as a Member of the american Institute of accounts and auditors.
5. Mr. nader Ghabbour, executive director and Group chief operating officer, started his career at GB auto as a showroom sales representative for the passenger car division. He worked his way up to running the daily sales operations within the show room and later assumed the role of showroom sales supervisor and manager. Mr. Ghabbour’s managerial capabilities were proven when he took on the more strategic role of managing the business-to-business arm of the passenger car segment. He currently serves as the chief operating officer for the passenger car division, managing the passenger car sales and after-sales functions, regional operations, and the 2- and 3-Wheeler operations. Mr. Ghabbour graduated with a Bachelor of arts in Business administration from Boston university.
6. dr. Walid sulaiman abanumay, non-executive director, has been the Managing director of al-Mareefa al saudia company since 1997, where he oversees investments in both devel-oped and emerging markets. Mr. abanumay has held several executive roles: between February 1993 and January 1994, he was the General Manager of the Investment department of the abanumay commercial center; between november 1990 and February 1993, he worked in the treasury and corporate Banking department of saMBa. Mr. abanumay is a board member of several prominent companies, including: Madinet nasr for Housing and development (since 1998), raya Holding (since 2005), and Beltone Financial.
7. Mr. Yasser Hashem, non-executive director, is a Managing Partner of the renowned law firm, Zaki Hashem & Partners. a member of the egyptian Bar association since 1989, Mr. Hashem graduated from the american university in cairo with an undergraduate degree, and achieved his LLB in 1989 from cairo university.
Board of directors Biographies
Iv. appendix
d. country overviews

Investor PresentatIon | second Quarter 2014 39
Key Growth drivers
Significant gDP growth
Strategic Location
Large, Fast-growing Consumer Base
rapidly Forming Middle Class
availability of Consumer Finance
Low Motorization index
Sources: Business Monitor International, GB Auto Research
regional Market Growth drivers

Investor PresentatIon | second Quarter 2014 40
the International Monetary Fund is projecting that real GdP growth across the Mena region will increase from 1.9% growth in 2012 to 3.7% in 2014.
Gross domestic Product(us$ bn, market exchange rates)
Gross domestic Product(% change, year on year)
GB auto is active in some of the Mena region’s Most dynamic economies
Source: The Economist Intelligence Unit Country Report April 2014Source: The Economist Intelligence Unit Country Report April 2014
Saudi ArabiaIran
United Arab Emirates
EgyptIsrael
Algeria
Sudan
Iraq
Lebanon
Qatar
Tunisia
Kuwait
Syria
Morocco
Yemen
Libya
Jordan
Oman
Bahrain
QatarIraq
United Arab EmiratesMorocco
OmanBahrainYemen
IsraelAlgeriaKuwait
SudanJordan
Saudi ArabiaTunisiaEgypt
LebanonLibya
IranSyria
-6.0 -4.0 -2.0 0.0 2.0 4.0 6.0

Investor PresentatIon | second Quarter 2014 41
overall, the IMF reports that consumer inflation across the Mena region is moderate, and projects that it will decrease in the coming one to two years as the region continues its stabilization trend.
Mena consumers are releasing Pent-up demand
Gross domestic Product per Head(us$ ‘000;,market exchange rates)
consumer Prices(% change, year on year)
Saudi Arabia
Iran
United Arab Emirates
Egypt
Israel
Algeria
Sudan
Iraq
Lebanon
Qatar
Tunisia
Kuwait
Syria
Morocco
Yemen
Libya
Jordan
OmanBahrain
Saudi Arabia
Iran
United Arab Emirates
Egypt
Israel
Algeria
Sudan
Iraq
Lebanon
Qatar
Tunisia
Kuwait
Syria
Morocco
Yemen
Libya
Jordan
Oman
Bahrain
source: the economist Intelligence unit country report april 2014source: the economist Intelligence unit country report april 2014
70.5

Investor PresentatIon | second Quarter 2014 42
the economist Intelligence unit has concerns about egypt’s political situation and consumer confidence in the short-term. However, it expects that economic growth will begin accelerating in 2014/15, driven by improved stability and security which should boost domestic demand and foreign tourism. It furthermore antici-pates that the improved business envi-ronment would see long-delayed projects get under way. Finally, the eIu expects a softer egyptian pound in 2014/15 to con-tribute to stronger services and manufac-turing exports, further boosting economic growth. In hard numbers, the eIu projects that egypt is likely to see GdP growth of 2.0% in 2014, with steady increases each year until it reaches 5.5% in 2018.
egypt
2012 2013
nominal GdP (usd bn) 259.7 270.0
Population (mn) 82.0 83.6
real GdP growth (%) 2.2 2.2
average cPI Inflation (%) 8.7 6.9
trade Balance (in GdP, %) (12.3) (11.6)
FdI (usd bn) 2.1 1.0
Fiscal Balance (in GdP, %) (10.8) (13.5)
sources: International Monetary Fund, eFG Hermes research, GB auto company research
GB auto has reason to be optimistic
about egypt’s long-term prospects,
as the country has successfully
maintained its position as one of
the Mena region’s largest economies.
GB auto is confident of egypt’s Long-term Prospects
Investor PresentatIon | second Quarter 2014 43
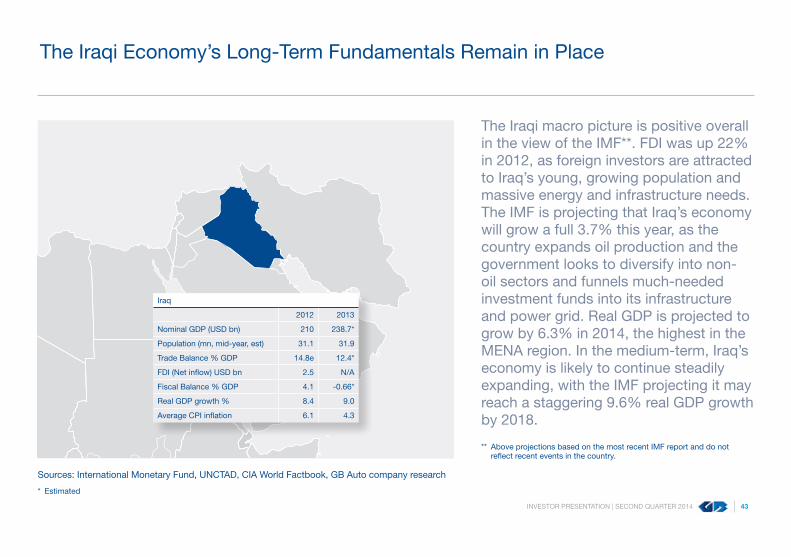
the Iraqi macro picture is positive overall in the view of the IMF**. FdI was up 22% in 2012, as foreign investors are attracted to Iraq’s young, growing population and massive energy and infrastructure needs. the IMF is projecting that Iraq’s economy will grow a full 3.7% this year, as the country expands oil production and the government looks to diversify into non-oil sectors and funnels much-needed investment funds into its infrastructure and power grid. real GdP is projected to grow by 6.3% in 2014, the highest in the Mena region. In the medium-term, Iraq’s economy is likely to continue steadily expanding, with the IMF projecting it may reach a staggering 9.6% real GdP growth by 2018.
Iraq
2012 2013
nominal GdP (usd bn) 210 238.7*
Population (mn, mid-year, est) 31.1 31.9
trade Balance % GdP 14.8e 12.4*
FdI (net inflow) usd bn 2.5 n/a
Fiscal Balance % GdP 4.1 -0.66*
real GdP growth % 8.4 9.0
average cPI inflation 6.1 4.3
sources: International Monetary Fund, unctad, cIa World Factbook, GB auto company research
* estimated
the Iraqi economy’s Long-term Fundamentals remain in Place
** above projections based on the most recent IMF report and do not reflect recent events in the country.

Investor PresentatIon | second Quarter 2014 44
Following up on a run-away 104.5% real GdP growth in 2012, the IMF** projects that Libya will see economic growth of 20.2% this year. accompanying this stellar growth story, consumer inflation is at very manageable levels. the IMF projects oil production to return to pre-2011 levels this year, while massive reconstruction efforts and strong private consumption should contribute to a relative growth of the non-hydrocarbon sector. the country is looking into privatizing nine major state-owned companies, including a truck trailer factory, and is currently in the process of amending its investment legislation to al-low unrestricted foreign ownership.
Libya
2012 2013*
nominal GdP (usd bn) 81.9 70.9
Population (mn, mid-year, est) 5.6 6.0
trade Balance % GdP 20.7e 19.2
FdI (net inflow) n/a n/a
average cPI inflation (%) 6.1 2.0
real GdP growth 104.5 20.2
Fiscal Balance % GdP 19.35 -5.41
sources: International Monetary Fund, unctad, cIa World Factbook, GB auto company research
* estimated
Libya’s Market is currently Facing challenges
** above projections based on the most recent IMF report and do not reflect recent events in the country.

Investor PresentatIon | second Quarter 2014 45
a business-friendly regime, abundant natural resources and active moderniza-tion of the country’s infrastructure have seen the algerian economy register steady growth. economic diversity is a key goal for algeria, as is job creation and continued social programs to help bolster the coun-try’s middle class. unlike some of its north african peers, algeria has demonstrated its ability to weather political headwinds by increasing social spending, while at the same time not significantly degrading its fiscal position. the government has re-cently been pursuing a responsible policy of fiscal consolidation which is expected to lead to disinflation. the government has also implemented a number of reforms to facilitate investment in non-hydrocarbon sectors, including the automotive sector.
Low consumer inflation and a
growing economy give GB auto reason to be
optimistic about algeria.
algeria
2012 2013*
nominal GdP (usd bn) 202.4 208.9
Population (mn) 36.5 36.9
avg Brent crude spot Price (usd/barrel)
112.0 107.0
real non-oil Growth (%) 2.0 4.4
Inflation (%) 8.9 6.0
trade Balance (in GdP, %) 10.0 4.6
ca Balance (in GdP, %) 6.1 0.3
sources: International Monetary Fund, eFG Hermes research, unctad, GB auto company research
* estimated
GB auto is optimistic about algeria’s Growth Prospects
Iv. appendix
e. Glossary of commonly used terms

Investor PresentatIon | second Quarter 2014 47
CKD: completely Knocked down. these are kits imported from the supplier and assembled in egypt, using the locally-mandated percentage of domestic parts.
CBU: completely Built up. this refers to vehicles that are imported fully-assembled.
LOB: Line of Business.
OEM: original equipment Manufacturer. For in-stance, Hyundai is the oeM of the Hyundai verna.
SKD: semi Knocked down. these are kits that arrive mostly assembled by the supplier; GB auto simply finishes the assembly.
Glossary of commonly used terms

Thank youir.ghabbourauto.com
Shareholder InformationReuters Code: AUTO.CABloomberg Code: AUTO.EY
Number of Shares Outstanding128,892,900
INVESTOR RELATIONSMenatalla Sadek, CFA
Corporate Finance and Investments Director
Hoda YehiaInvestor Relations Manager
Rania El ShenoufyInvestor Relations Analyst
Direct: +202 3910 0485Fax: +202 3539 0139
E-mail: [email protected]