investor presentation – july 27, 2015 - sec.gov · investor presentation – july 27, 2015 for...
TRANSCRIPT

Investor Presentation – July 27, 2015
Filed pursuant to Rule 497(a)File No. 333-205540
Rule 482 ad

Page 1
Important Information
Investor Presentation – July 27, 2015
Eagle Point Credit Company Inc. (the ”Company”) has a registration statement relating to one or more of its securities on file with the Securities and Exchange Commission ("SEC"). Any registration statement that has not yet been declared effective by the SEC, and any prospectus relating thereto, is not complete and may be changed. Any securities that are the subject of such a registration statement may not be sold until the registration statement filed with the SEC is effective. Investors should consider the Company’s investment objectives, risks, charges and expenses carefully before investing in securities of the Company. The applicable registration statement, which is on file with the SEC and publicly available on the EDGAR Database on the SEC website at http://www.sec.gov, contains this and other information about the Company and should be read carefully before investing. There is no guarantee that any of the goals, targets or objectives described in these materials will be achieved.
These materials are not advice, a recommendation or an offer to enter into any transaction with the Company or any of its affiliates. These materials are provided for informational purposes only and do not constitute an offer to sell securities of the Company. These materials are not soliciting an offer to buy such securities in any jurisdiction where the offer or sale is not permitted or would be unlawful prior to registration or qualification under the securities laws of such jurisdiction. Any such offer or solicitation will only be made through formal offering materials, including a prospectus (a copy of which may be obtained at the relevant time for free by visiting the EDGAR Database on the SEC website at www.sec.gov).
This presentation is solely for the use of the intended recipient(s). The information and its contents are the property of Eagle Point Credit Management LLC and/or the Company. Any unauthorized dissemination, copying or use of this presentation is strictly prohibited and may be in violation of law. This presentation is being provided for informational purposes only.
An investment in the Company is not appropriate for all investors. The investment program of the Company is speculative, entails substantial risk and includes investment techniques not employed by traditional mutual funds. An investment in the Company is not intended to be a complete investment program. Shares of closed-end investment companies, such as the Company, frequently trade at a discount from their net asset value, which may increase investors’ risk of loss. Past performance is not indicative of, or a guarantee of, future performance. The performance quoted represents past performance. Nothing herein shall be relied upon as a representation as to the future performance of the Company. Investment return and principal value of an investment will fluctuate, and shares, when sold, may be worth more or less than their original cost. The Company’s performance is subject to change since the applicable period’s end and may be lower or higher than the performance data shown.
Neither Eagle Point Credit Management LLC nor the Company provides legal, accounting or tax advice. Any statement regarding such matters is explanatory and may not be relied upon as definitive advice. Investors should consult with their legal, accounting and tax advisers regarding any potential investment. The information presented herein is as of the dates noted herein and is derived from financial and other information of the Company, and, in certain cases, from third party sources and reports (including reports of third party custodians, CLO managers and trustees) that have not been independently verified by the Company. As noted herein, certain of this information is estimated and unaudited, and therefore subject to change. We do not represent that such information is accurate or complete, and it should not be relied upon as such. This presentation does not purport to be complete and no obligation to update or revise such information is being assumed.
ABOUT EAGLE POINT CREDIT COMPANY
The Company is a publicly-traded, non-diversified, closed-end management investment company. The Company’s investment objective is to generate high current income and capital appreciation primarily through investment in equity and junior debt tranches of collateralized loan obligations. The Company is externally managed and advised by Eagle Point Credit Management LLC. The principals of Eagle Point Credit Management LLC are Thomas P. Majewski, Daniel W. Ko and Daniel M. Spinner.
FORWARD-LOOKING STATEMENTS
These materials may contain “forward-looking statements” within the meaning of the Private Securities Litigation Reform Act of 1995. Statements other than statements of historical facts included in these materials may constitute forward-looking statements and are not guarantees of future performance or results and involve a number of risks and uncertainties. Actual results may differ materially from those in the forward-looking statements as a result of a number of factors, including those described in the applicable prospectus and the Company’s other filings with the SEC. The Company undertakes no duty to update any forward-looking statement made herein. All forward-looking statements speak only as of the date hereof.

Page 2
Table of Contents
Investor Presentation – July 27, 2015
1. Executive Summary
2. CLO Market Overview
3. Investment Strategy and Process
4. Key Financial and Portfolio Statistics
5. Appendix

Page 3
Executive Summary 1.
Investor Presentation – July 27, 2015

Page 4
Executive Summary Company Overview
Investor Presentation – July 27, 2015
Distribution Rate (Common Shares)(5) � 12.0% annualized distribution rate (based on IPO price of $20 per common share)
Company � Eagle Point Credit Company Inc. (“ECC”)
� NYSE Ticker: ECC
IPO Date
� October 7, 2014
Total Equity Market Capitalization(1)
� $326.2 million ($174.4 million owned by Eagle Point and its affiliates)(2)
(1) Combined market capitalization of ECC and ECCA as of July 24, 2015. (2) Amount includes holdings of Eagle Point, its senior personnel and the Trident V Funds managed by Stone Point Capital LLC as of July 24, 2015. (3) Pro-Forma as adjusted for the issuance of 1,818,000 aggregate shares of preferred stock on May 13, 2015 and June 2, 2015 with an aggregate face value of $45.5 million. (4) ECC currently has no indebtedness outstanding. (5) Based on a distribution of $0.60 per common share payable on July 31, 2015 to common shareholders of record as of June 30, 2015. To date, a portion of such distribution has been a return of
capital as noted in the Company’s Section 19 notices available on its website (www.eaglepointcreditcompany.com). Not a guarantee of future distributions or yield.
Leverage (as of 3/31/15 Pro-Forma(3))
� Total Assets to Debt: N/A.(4) Must maintain Asset Coverage Ratio (“ACR”) of 300% for Debt.
� Total Assets to Preferred Equity: 670%. Must maintain ACR of 200% for Preferred Equity.
Adviser
� Eagle Point Credit Management LLC (“Eagle Point” or the “Adviser”)
Past performance is not indicative of, or a guarantee of, future performance. Future results may vary and may be higher or lower than those shown.

Page 5
Executive Summary Introduction to Eagle Point and Stone Point Capital LLC
Investor Presentation – July 27, 2015
History � Formed: In 2012, by Thomas Majewski and funds managed by Stone Point Capital LLC
� AUM: $1.0 billion(1)
� Investors/Clients: Institutional, high net worth and retail investors
Specialized and Experienced Manager
� Specialist asset manager: Exclusively focused on CLO securities and related investments
� Experience: Each member of the senior investment team is a CLO industry specialist who has been directly involved in the CLO market for the majority of his career
(1) As of June 30, 2015 and inclusive of capital commitments that were undrawn as of such date.
Leading Financial Services-Focused Private Equity Firm
� Exclusive focus on the financial services industry with a more than 25-year history of value creation
� Has raised six private equity funds with aggregate committed capital of approximately $13 billion (the Trident Funds)
Select Past and Current Portfolio Investments of Funds Managed by Stone Point Capital and the Stone Point Capital Platform

Page 6
Executive Summary Introduction to the Senior Investment Team
Investor Presentation – July 27, 2015
Years in Financial Services
Years in CLO
Industry
Background
Thomas Majewski Director and Chief Executive Officer, Eagle Point Credit Company Inc. Managing Partner, Eagle Point Credit Management LLC
19 15 Direct experience in the CLO market dating back to the late 1990s
� Longstanding experience as a CLO industry investment banker and investor
� Former Head of U.S. CLO banking at RBS Securities Inc. and of CLO banking at Merrill Lynch Pierce Fenner and Smith Inc.
� Former U.S. country head at AMP Capital / AE Capital, responsible for investing in credit, structured products, and other private assets on behalf of several Australian investors
Daniel Spinner, CAIA Portfolio Manager, Eagle Point Credit Management LLC
18 12 Direct experience in the CLO market dating back to the late 1990s
� Alternative asset management industry specialist with 18 years of experience advising, financing, and investing in alternative asset management firms and funds
� Former Investment Analyst at 1199SEIU Benefit and Pension Funds responsible for the private equity, special opportunities credit, and real estate portfolios
� Former Co-Founder of Structured Capital Partners, a financial holding company formed to invest in CLO and structured credit managers
Daniel Ko Portfolio Manager, Eagle Point Credit Management LLC
9 9 Direct experience in the CLO market dating back to 2006
� Specialized exclusively in structured finance throughout entire career
� Former Vice President at Bank of America Merrill Lynch in the CLO structuring group responsible for modeling the projected deal cash flows, negotiating deal terms with both debt and equity investors and coordinating the rating process

Page 7
Executive Summary ECC Highlights
Investor Presentation – July 27, 2015
Attractive Asset Class
� Eagle Point believes that CLO equity provides an efficient and attractive way to gain exposure to U.S. senior secured loans
Specialized Investment Team
� Eagle Point’s senior investment team is comprised of CLO industry specialists who have been directly involved in the CLO market for the majority of their careers
Differentiated Investment Strategy and Process
� ECC pursues a differentiated private equity style investment approach focused on proactively sourcing investment opportunities in CLO equity issued by leading CLO collateral managers
� ECC typically expects to take significant stakes in its CLO equity investments and to influence the key terms and conditions of such investments
Alignment of Interests
� Eagle Point and its affiliates have approximately $174.4 million invested in ECC and ECCA(1)
Track Record(2)
� Since its IPO, ECC has generated a higher total return than the Wells Fargo BDC Index and, on average, traded at a premium to NAV during a time in which BDCs have, on average based on the Wells Fargo BDC Index, traded at a discount to NAV
(1) Amount includes holdings of Eagle Point, its senior personnel and the Trident V Funds managed by Stone Point Capital LLC as of July 24, 2015.
(2) Past performance is not indicative of, or a guarantee of, future performance. See pages 8 and 9 for additional information on the total return of ECC and the Wells Fargo BDC Index and on the average price to book ratio of ECC versus BDCs over the period noted.

Page 8
$90
$95
$100
$105
$110
$115
10/7/14 11/24/14 1/11/15 2/28/15 4/17/15 6/4/15 7/22/15
ECC Wells Fargo BDC Index
Executive Summary ECC Performance Since IPO: Total Return vs. BDC Index Total Return
Investor Presentation – July 27, 2015
For the period October 7, 2014 – July 24, 2015, ECC generated a total return(1) of 10.42% versus -4.82% for the Wells Fargo BDC Index(2)
Value of $100 Invested (October 7, 2014 through July 24, 2015)
(1) Total return is calculated as the percent change in the value of $100 invested during the period and assumes that any dividends or distributions are reinvested. Past performance is not indicative of, or a guarantee of, future performance. Future results may vary and may be higher or lower than those shown.
(2) The Wells Fargo BDC Index is intended to measure the performance of all Business Development Companies (BDCs) that are listed on the New York Stock Exchange or NASDAQ and satisfy market capitalization and other eligibility requirements. Although ECC is not a BDC, BDCs generally invest in high yielding credit investments, as does ECC. In addition, similar to ECC, BDCs generally elect to be classified as a regulated investment company under the U.S. Internal Revenue Code of 1986, as amended, which generally requires an investment company to distribute its taxable income to shareholders.
Source: Bloomberg.
$110.42
$95.18

Page 9
85%
90%
95%
100%
105%
110%
115%
10/7/14 11/12/14 12/18/14 1/23/15 2/28/15 4/5/15 5/11/15 6/16/15 7/22/15
ECC Wells Fargo BDC Index
Executive Summary ECC Performance Since IPO: Price to Book Ratio versus BDC Index Price to Book Ratio
Investor Presentation – July 27, 2015
For the period October 7, 2014 – July 24, 2015, ECC traded at an average premium to book value of 6.3% at a time during which BDCs, on average based on the Wells Fargo BDC Index(2), traded at a discount to book value of -6.2%
Average: 106.3%
Price to Book Ratio(1) (October 7, 2014 through July 24, 2015)
(1) Price to book ratio is calculated as price per share divided by book value per share. Past performance is not indicative of, or a guarantee of, future performance. Future results may vary and may be
higher or lower than those shown. (2) The Wells Fargo BDC Index is intended to measure the performance of all Business Development Companies (BDCs) that are listed on the New York Stock Exchange or NASDAQ and satisfy market
capitalization and other eligibility requirements. Although ECC is not a BDC, BDCs generally invest in high yielding credit investments, as does ECC. In addition, similar to ECC, BDCs generally elect to be classified as a regulated investment company under the U.S. Internal Revenue Code of 1986, as amended, which generally requires an investment company to distribute its taxable income to shareholders.
Source: Bloomberg.
Average: 93.8%

Page 10
$24.75
$25.00
$25.25
$25.50
$25.75
$26.00
5/14/15 5/28/15 6/11/15 6/25/15 7/9/15 7/23/15
Executive Summary ECC Preferred Stock Performance Since Issue
Investor Presentation – July 27, 2015
ECCA Share Price Performance (May 14, 2015 through July 24, 2015)
$25.41
6/11/15 Ex Dividend Date for $0.23 Dividend(2)
7/13/15 Ex Dividend Date for $0.16 Dividend
ECC 7.75% Series A Term Preferred Stock (NYSE Ticker: ECCA) was issued at $25.00 and as of 7/24/15 was trading at $25.41 (a Yield to Worst of 7.12%) (1)
Past performance is not indicative of, or a guarantee of, future performance. Future results may vary and may be higher or lower than those shown.
(1) Yield to worst is the bond yield computed by using the lower of either the yield to maturity or the yield to call on every possible call date.
(2) This initial dividend is for the period from May 18, 2015 through June 30, 2015.
Source: Bloomberg.

Page 11
CLO Market Overview 2.
Investor Presentation – July 27, 2015

Page 12
CLO Market Overview The CLO Market is Large and is the Largest Source of Capital for the U.S. Senior Secured Loan Market
Investor Presentation – July 27, 2015
U.S. CLO Issuance ($ Billions)
Source: S&P Capital IQ.
Demand for Institutional Leveraged Loans (2014)
$9 $12 $16 $25
$53
$97 $89
$14 $1 $1
$12
$54
$83
$124
$31
$-
$25
$50
$75
$100
$125
2001 2002 2003 2004 2005 2006 2007 2008 2009 2010 2011 2012 2013 2014 1Q 2015
CLOs55%
Loan Mutual Funds19%
Hedge, Distressed and
High Yield Funds9%
Banks9%
Other Financial Institutions
8%

Page 13
CLO Market Overview CLO Equity has Generated Positive Historical Returns
Investor Presentation – July 27, 2015
Distribution of Projected CLO Equity IRRs for U.S. Cash Flow CLOs: 2002 – 2011 Vintages(1)
96%
4%
CLOs with positive equity returns
CLOs with negative equity returns
Based on its analysis, the Adviser believes that 96% of U.S. cash flow CLOs issued between 2002 and 2011 will have a positive return to the equity class
Positive IRRs over 15%
Positive IRRs up to 15%
Source: Eagle Point’s analysis of available market data of 500+ cash flow CLOs from vintage years 2002-2011.
(1) Projected IRRs are calculated at the CLO level net of all CLO-related expenses and are calculated based on certain underlying assumptions, which may under or over compensate for the impact, if any, of certain market factors and financial risk, such as lack of liquidity, macroeconomic factors and other similar factors. Such assumptions may not be reflective of actual market conditions in the past, present or future. These figures do not reflect any projections regarding ECC’s returns and all returns earned by ECC on its CLO investments will be reduced by ECC’s expenses and the Adviser’s fees. Actual performance of each CLO investment held by ECC will vary and such variance may be material and adverse, including the potential for full loss of principal. CLO investments involve multiple risks, including unhedged credit exposure to companies with speculative-grade ratings, the use of leverage and pricing volatility. Past performance is not indicative of, or a guarantee of, future performance.

Page 14
CLO Market Overview Eagle Point Believes that CLO Equity is an Attractive Asset Class
Investor Presentation – July 27, 2015
Why CLO Equity?
� Potential for strong absolute and risk-adjusted returns
� Expected shorter duration high-yielding credit investment with potential for high quarterly cash distributions
� Expected protection against rising interest rates(1)
� Expected low-to-moderate correlation with fixed income and equity
Our Competitive Advantage
� Specialist in CLO securities with a proven track record
� Methodical and rigorous investment process
(1) The Adviser expects CLO equity to provide some measure of protection against rising interest rates after LIBOR has increased above the average LIBOR floor on each CLO’s underlying assets. However, CLO equity is still subject to other forms of interest rate risk.

Page 15
Senior secured loans represent “pure” credit exposure
� Senior: Senior position in a company’s capital structure
� Secured: First lien security interest in a company’s assets
� Floating Rate: Mitigates interest rate risk associated with fixed rate bonds
� Low LTV: Senior secured loans often have a loan-to-value ratio of approximately 40% - 60%
Past performance is not indicative of, or a guarantee of, future performance.
• Cash
• Receivables
• Inventory
• Property
• Plant
• Equipment
• Brands/Logos
• Intangibles
• Subsidiaries
Senior Secured Loans• First priority pledge of
assets
Subordinated Bonds• Generally unsecured
Equity• Dividends restricted
while Senior Secured Loan is outstanding
Assets Liabilities and Equity % of Capital Structure
40% - 60%
10% - 20%
30% - 50%
CLO Market Overview Senior Secured Loans are the Raw Materials of CLOs
Investor Presentation – July 27, 2015
Representative Company Capital Structure
Reflects general market terms as of the date hereof; actual terms of any company will vary. Source: Moody’s Investor Service – Lessons from 1,000 Corporate Defaults.
Moody’s Average Recovery Rate (1988 -2011)
80.4%
48.4%
28.8%
0.0%
20.0%
40.0%
60.0%
80.0%
100.0%
Senior Secured Loans Senior Unsecured Bonds Subordinated Debt
Aver
age
Reco
very
Rat
e

Page 16
6.8%
11.2% 10.3% 8.9% 7.5% 8.3%5.3% 4.7% 4.9%
2.7% 1.1%
11.0%
5.6% 5.7%7.3%
1.9%
-28.8%
44.9%
10.0%
1.8%
9.4%6.2%
2.1% 2.1%
-40.0%
-30.0%
-20.0%
-10.0%
0.0%
10.0%
20.0%
30.0%
40.0%
50.0%
1992
1993
1994
1995
1996
1997
1998
1999
2000
2001
2002
2003
2004
2005
2006
2007
2008
2009
2010
2011
2012
2013
2014
1Q 2015
CLO Market Overview Since 1992, the CSLLI has Experienced Only One Year of Negative Returns
Investor Presentation – July 27, 2015
Credit Suisse Leveraged Loan Index (“CSLLI”) Annual Total Return(1)
(1) Source: Credit Suisse. The CSLLI is designed to mirror the investable universe of the $US-denominated leveraged loan market.
Positive Return from 1/1/08 to 12/31/09
Only 1 Down Year
Average Annualized Return: 5.9%
Past performance is not indicative of, or a guarantee of, future performance.

Page 17
CLO Market Overview CLOs are Securitizations of a Portfolio of Senior Secured Loans
Investor Presentation – July 27, 2015
ECC invests primarily in the equity and subordinated debt tranches of CLOs
Key CLO Structural Features
(1) Actively managed portfolio
(2) Match funded (i.e., limited refinancing risk)
(3) No mark to market triggers (i.e., no margin calls or forced sales)
(4) Equity optionality over debt for majority holder
Senior Debt Typically AAA rated
Subordinated Debt Various tranches typically rated from AA
to B
Equity Tranche Not rated
Primarily Floating Rate Collateral
Portfolio of primarily senior secured loans
Rated BB or B on average
Typically 5-8 year maturity
Primarily Floating Rate CLO Debt
Assets Liabilities + Equityssets ab t es qu ty
Representative CLO Summary Balance Sheet
Note: The CLO structure highlighted on this page is a hypothetical structure, and the structure of CLOs in which ECC invests may vary substantially from the example.

Page 18
CLO Market Overview Expected Shorter Duration High-Yielding Credit Investment
Investor Presentation – July 27, 2015
� Relative to certain other high-yielding investments such as mezzanine or subordinated debt, CLO equity is generally expected to have a shorter payback period with higher front-end-loaded quarterly cash flows
� On its CLO equity investments, the Adviser typically seeks investment opportunities where it expects to receive in excess of 20% annual return of face value during the early years of a CLO’s life
� Under normal market conditions, for primary market CLO equity investments, the Adviser typically expects ECC to recoup substantially all of its initial invested capital by years four to five

Page 19
Investment Strategy and Process 3.
Investor Presentation – July 27, 2015

Page 20
Investment Strategy and Process Private Equity Approach to Fixed Income Investing
Investor Presentation – July 27, 2015
Outperformance Relative to the CLO
Market(1)
�Proactive sourcing of investment opportunities
�Utilization of our methodical and rigorous investment analysis and due diligence process
�Involvement at the CLO formation and structuring stage
�Ongoing monitoring and stewardship
Objective
(1) In the primary CLO market, the Adviser seeks to invest in CLO securities that it believes have the potential to generate attractive risk-adjusted returns and to outperform other similar CLO securities issued within the respective vintage period.

Page 21
Key Financial and Portfolio Statistics 4.
Investor Presentation – July 27, 2015

Page 22
Key Financial and Portfolio Statistics Key Financial Statistics
Investor Presentation – July 27, 2015
(1) Reflects pro forma adjustment for issuance of preferred stock with aggregate face value of $45.5M. (2) Reflects the leverage limitations applicable to ECC under the Investment Company Act of 1940. (3) As disclosed in the press release issued by ECC on March 3, 2015. (4) As disclosed in the press release issued by ECC on July 1, 2015. Note: Complete Unaudited Q1 2015 financial statements are available on the Company's website (www.eaglepointcreditcompany.com).
Selected Unaudited Q1 2015 Balance Sheet StatisticsAs Adjusted for Q2 2015 Preferred Equity Issuance
Metric($ millions)
Total Assets $324.2 (1)
Payable for Securities Purchased $8.5Distribution Payable 8.3Other Liabilities 2.9Preferred Equity 45.5 (1)
Total Liabilities $65.2 (1)
Net Assets $259.1
Asset Coverage Ratios
Minimum Total Assets to Debt 300% (2)
Pro Forma Total Assets to Debt N/A
Minimum Total Assets to Preferred Equity 200% (2)
Pro Forma Total Assets to Preferred Equity 670% (1)
Select Unaudited Q1 and Q2 2015 Income Statement and Cash Flow Statistics
Metric($ millions)
Q1 Net Investment Income $5.4
Q1 Portfolio Cash Distributions Received $8.9 (3)
Q2 Portfolio Cash Distributions Received $17.1 (4)

Page 23
Key Financial and Portfolio Statistics Varied Exposure to Senior Secured Loans Across a Number of Key Metrics
Investor Presentation – July 27, 2015
� The Adviser seeks to construct a portfolio of CLO securities that provides varied exposure across a number of key categories, including the five categories listed below:
Q1 2015 Portfolio Asset Summary Statistics
1) Number of CLO and related investments 29 ($248.7 million fair value)(1)
2) Number and investment style of CLO collateral managers 18 different CLO collateral managers with varying
styles(2)
3) CLO vintage period 2012, 2013, 2014 and 2015(2)
June 2015 CLO Portfolio Characteristics Statistics
4) Number of borrowers underlying each CLO 1,048(3)
5) Industry type of a CLO’s underlying borrowers Largest exposure to any one industry: 9.2%(3)
(1) Unaudited, as of March 31, 2015. For the number of CLO and related investments, Income Notes and Subordinated Names of the same Issuer have been combined.
(2) Unaudited, as of March 31, 2015.
(3) The portfolio level data contained herein relates to the CLO equity and other unrated investments held by the Company as of June 30, 2015. The data is estimated and unaudited and derived from the June 2015 trustee reports, custody statements or other information received from underlying CLO collateral managers. This data is shown as of June 30, 2015 and may not be representative of current or future holdings.

Page 24
Key Financial and Portfolio Statistics Portfolio of Investments
Investor Presentation – July 27, 2015
As of March 31, 2015, ECC held 29 CLO and related investments managed by 18 different CLO collateral managers
Unaudited Consolidated Schedule of Investments as of March 31, 2015(1)
(1) Income Notes and Subordinated Notes of the same Issuer have been combined in the table above.
(2) CLO equity positions are entitled to recurring distributions which are generally equal to the remaining cash flow of payments made by underlying securities less contractual payments to debt holders and fund expenses. The effective yield indicated is based upon a current projection of the amount and timing of these recurring distributions in addition to the estimated amount of terminal principal payment. Such projections are periodically reviewed and adjusted. The effective yield and investment cost may ultimately not be realized.
Investment Type CLO Collateral Manager
Effective Yield(2) Fair Value
% of Total Portfolio
CLO EquityOctagon Investment Partners XIV, Ltd. Octagon Credit Investors, LLC 18.17% 11,684,013 4.70%Apidos CLO XIV CVC Credit Partners, LLC 15.34% 9,600,069 3.86%Babson CLO Ltd. 2013-II Babson Capital Management LLC 16.65% 10,798,735 4.34%Blue Mountain CLO 2013-2, Ltd. BlueMountain Capital Management LLC 15.45% 4,225,767 1.70%CIFC Funding 2013-I, Ltd. CIFC Asset Management LLC 14.85% 3,338,868 1.34%CIFC Funding 2013-II, Ltd. CIFC Asset Management LLC 14.79% 10,722,922 4.31%Octagon Investment Partners XVII, Ltd. Octagon Credit Investors, LLC 15.08% 9,747,628 3.92%OHA Credit Partners IX, Ltd. Oak Hil l Advisors, L.P. 12.13% 4,930,730 1.98%Sheridan Square CLO, Ltd. GSO / Blackstone Debt Funds Management LLC 17.31% 2,067,027 0.83%Symphony CLO XII, Ltd. Symphony Asset Management LLC 14.61% 3,273,392 1.32%THL Credit Wind River 2013-2 CLO Ltd. THL Credit Advisors LLC 7.68% 528,127 0.21%THL Credit Wind River 2013-2 CLO Ltd. THL Credit Advisors LLC 14.15% 8,443,441 3.40%Avery Point V CLO, Ltd. Sankaty Advisors, LLC 14.57% 7,295,729 2.93%CIFC Funding 2014, Ltd. CIFC Asset Management LLC 18.04% 11,023,735 4.43%CIFC Funding 2014-III, Ltd. CIFC Asset Management LLC 16.19% 4,181,605 1.68%CIFC Funding 2014-IV, Ltd. CIFC Asset Management LLC 14.11% 5,282,581 2.12%Flagship CLO VIII, Ltd. Deutsche Investment Management Americas Inc. 14.82% 23,432,041 9.43%Galaxy XVIII CLO, Ltd. PineBridge Investments LLC 13.12% 3,450,517 1.39%Halcyon Loan Advisors Funding 2014-3, Ltd. Halcyon Loan Management LLC 13.43% 4,776,384 1.92%Marathon CLO VI Ltd. Marathon Asset Management, L.P. 14.24% 2,869,469 1.15%Marathon CLO VII Ltd. Marathon Asset Management, L.P. 15.67% 9,779,114 3.93%Octagon Investment Partners XIX, Ltd. Octagon Credit Investors, LLC 15.76% 2,413,786 0.97%Octagon Investment Partners XX, Ltd. Octagon Credit Investors, LLC 13.45% 2,068,961 0.83%Regatta III Funding Ltd. Napier Park Global Capital LLC 12.29% 1,787,756 0.72%Voya CLO 2014-4, Ltd. Voya Alternative Asset Management LLC 15.28% 8,634,753 3.47%THL Credit Wind River 2014-3 CLO Ltd. THL Credit Advisors LLC 17.65% 12,223,427 4.92%
178,580,577 71.80%Loan Accumulation FacilitiesCutwater 2015-I, Ltd. Cutwater Investor Services Corp. 40,080,737 16.12%Marathon VIII Marathon Asset Management, L.P. 18,000,000 7.24%OFSI VIII OFS Capital Management, LLC 12,031,510 4.84%
70,112,247 28.20%Total investments at fair value as of March 31, 2015 248,692,824$ 100.00%

Page 25
Key Financial and Portfolio Statistics CLO Portfolio Characteristics: Summary Statistics
Investor Presentation – July 27, 2015
A summary of the collateral characteristics of the CLO equity and other unrated investments held by ECC is illustrated below:
Summary of Portfolio Characteristics(1)
Number of unique underlying borrowers 1,048
Largest exposure to any individual borrower 0.87%
Average individual borrower exposure 0.10%
Exposure to ten largest obligors 6.74%
Aggregate exposure to senior secured loans 96.96%
Weighted average stated spread 3.98%
Weighted average LIBOR floor 0.96%
Weighted average % of floating rate loans w/ LIBOR Floors 98.65%
Weighted average credit rating of underlying collateral B+/B
Weighted average junior OC cushion 4.96%
Weighted average market value of underlying collateral 98.81%
Weighted average maturity of underlying collateral 5.4 years
U.S. dollar currency exposure 100%
(1) The portfolio level data contained herein relates to the CLO equity and other unrated investments held by the Company as of June 30, 2015. The data is estimated and unaudited and derived from the June 2015 trustee reports, custody statements or other information received from CLO collateral managers. This data is shown as of June 30, 2015 and may not be representative of current or future holdings.
Page 26
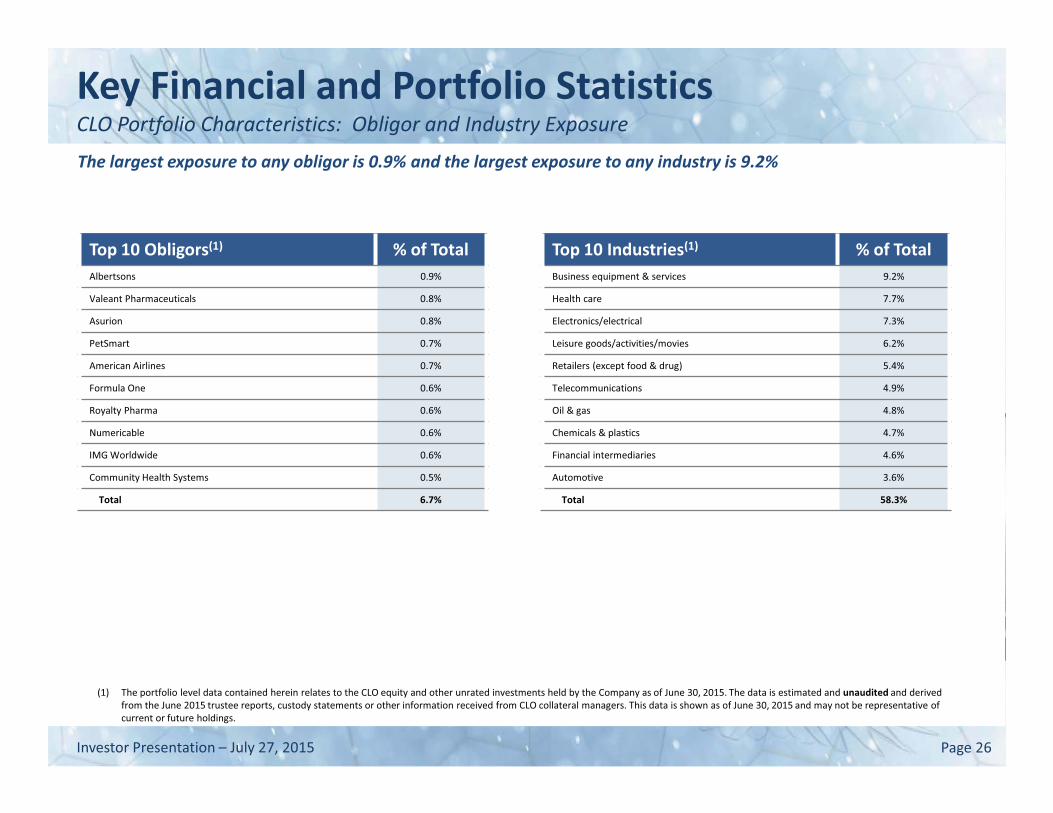
Key Financial and Portfolio Statistics CLO Portfolio Characteristics: Obligor and Industry Exposure
Investor Presentation – July 27, 2015
Top 10 Industries(1) % of Total Business equipment & services 9.2%
Health care 7.7%
Electronics/electrical 7.3%
Leisure goods/activities/movies 6.2%
Retailers (except food & drug) 5.4%
Telecommunications 4.9%
Oil & gas 4.8%
Chemicals & plastics 4.7%
Financial intermediaries 4.6%
Automotive 3.6%
Total 58.3%
Top 10 Obligors(1) % of Total Albertsons 0.9%
Valeant Pharmaceuticals 0.8%
Asurion 0.8%
PetSmart 0.7%
American Airlines 0.7%
Formula One 0.6%
Royalty Pharma 0.6%
Numericable 0.6%
IMG Worldwide 0.6%
Community Health Systems 0.5%
Total 6.7%
The largest exposure to any obligor is 0.9% and the largest exposure to any industry is 9.2%
(1) The portfolio level data contained herein relates to the CLO equity and other unrated investments held by the Company as of June 30, 2015. The data is estimated and unaudited and derived from the June 2015 trustee reports, custody statements or other information received from CLO collateral managers. This data is shown as of June 30, 2015 and may not be representative of current or future holdings.

Page 27
Key Financial and Portfolio Statistics CLO Portfolio Characteristics: Rating and Maturity Distributions
Investor Presentation – July 27, 2015
(1) The portfolio level data contained herein relates to the CLO equity and other unrated investments held by the Company as of June 30, 2015. The data is estimated and unaudited and derived from the June 2015 trustee reports, custody statements or other information received from CLO collateral managers. This data is shown as of June 30, 2015 and may not be representative of current or future holdings.
Rating Distribution of Obligors(1) Maturity Distribution of Obligors(1)
0.0% 0.2%2.2%
5.7%
13.9%
27.5%
36.5%
13.9%
0.0%
5.0%
10.0%
15.0%
20.0%
25.0%
30.0%
35.0%
40.0%
2015 2016 2017 2018 2019 2020 2021 2022-2024
% o
f Fu
nd
Exp
osu
re
Maturity
1.4%2.7%
5.7%
13.5%
20.7%
46.0%
8.5%
1.2%0.02% 0.3% 0.03%
0.0%
5.0%
10.0%
15.0%
20.0%
25.0%
30.0%
35.0%
40.0%
45.0%
50.0%
BBB- BB+ BB BB- B+ B B- CCC+ CCC CCC- D
% o
f Fun
d Ex
posu
re
S&P Issuer Rating

Page 28
Appendix 5.
Investor Presentation – July 27, 2015

Page 29
Appendix Additional Loan Market Statistics: Leverage Multiple (Debt to EBITDA)
Investor Presentation – July 27, 2015 29
Average Leverage Multiples of Large Corporate Loans1
Source: S&P Capital IQ.
1. Defined as issuers with EBITDA of more than $50 million. Prior to 2011, media and telecom deals were excluded. EBITDA adjusted for prospective cost savings or synergies.
5.4x
4.9x4.6x
4.2x4.0x 4.0x 4.0x
4.3x 4.3x4.4x
4.9x
3.7x
4.1x3.9x
4.4x4.6x
4.7x4.9x 4.9x
0.0x
1.0x
2.0x
3.0x
4.0x
5.0x
6.0x
1997 1998 1999 2000 2001 2002 2003 2004 2005 2006 2007 2008 2009 2010 2011 2012 2013 2014 Q12015
FLD/EBITDA SLD/EBITDA Other Sr Debt/EBITDA Sub Debt/EBITDA

Page 30
Appendix Additional Loan Market Statistics: Interest Coverage Multiple (EBITDA to Interest)
Investor Presentation – July 27, 2015
Average Interest Coverage Multiples of Large Corporate Loans1
Source: S&P Capital IQ.
1. Defined as issuers with EBITDA of more than $50 million. Prior to 2011, media and telecom deals were excluded. EBITDA adjusted for prospective cost savings or synergies.
3.0x3.2x
3.6x3.7x
4.0x
3.6x
3.1x 3.0x
3.9x 4.0x4.2x
4.0x3.9x
4.1x 4.1x
3.3x
0.0x
1.0x
2.0x
3.0x
4.0x
5.0x
2000 2001 2002 2003 2004 2005 2006 2007 2008 2009 2010 2011 2012 2013 2014 Q12015
EBITDA-Capex/Cash Interest EBITDA/Cash Interest

Page 31
Appendix Additional Loan Market Statistics: Annual Revenue Change (YoY) for Below I-Grade Companies
Investor Presentation – July 27, 2015
Annual Revenue Change (YoY) for Below Investment Grade Companies
Source: S&P Capital IQ.
16.9% 16.5%
11.1%
-4.9% -7.3%
-11.3%
-3.2%
12.9%
5.2%
8.0%
14.5% 13.7%
21.0%
18.0%
14.0% 14.0%
12.0%
9.1% 9.9%
8.9%
10.5% 9.3%
11.0% 13.5%
16.3%
12.4% 12.5% 13.6%
10.3%
-16.0%
-12.0%
-8.0%
-4.0%
0.0%
4.0%
8.0%
12.0%
16.0%
20.0%
24.0%
Revenues y/y

Page 32
Appendix Board of Directors
Investor Presentation – July 27, 2015
Board Member Committee Experience Independent Director
James R. Matthews 23 yrs experience
Chairman of Board (Since May 2014)
� Principal of Stone Point (since 2011), Eagle Point Director
� Prior to Stone Point, was Senior Managing Director and Co-Head of Private Equity at Evercore Partners and General Partner at Welsh Carson Anderson & Stowe
�
Thomas P. Majewski 19 yrs experience
Board Member (Since May 2014)
� Managing Partner at Eagle Point Credit Management (since 2012) and Director and CEO of Eagle Point Credit Company
� Prior to Eagle Point, was Head of U.S. CLO banking at RBS Securities Inc. and CLO banking at Merrill Lynch Pierce Fenner and Smith Inc.
�
Scott W. Appleby(2)
20+ yrs experience
Audit(1)
Nominating (Since May 2014)
� President of Appleby Capital, Inc. (since 2009)
� Prior experience at Deutsche Bank, Robertson Stephens, ABN Amro and Paine Webber �
Kevin F. McDonald 19+ yrs experience
Audit(1)
Nominating
(Since May 2014)
� Director of Business Development of Folger Hill Asset Management, LP (since December 2014)
� Co-founder and Principal of Taylor Investment Advisors, LP (since 2002), and CEO of Taylor Investment Advisors, LP (2006 to 2014). Previously, Vice President in the futures and options group at J.P. Morgan Securities
�
Paul E. Tramontano 30+ yrs experience
Audit(1)
Nominating
(Since May 2014)
� Founding member of Constellation Wealth Advisors LLC and Co-Chief Executive Officer (since 2007)
� Had spent 17 years at Citi Smith Barney as a Managing Director and Senior Advisor of Citi Family Office
�
Jeffrey L. Weiss(3)
25+ yrs experience
Audit(1)
Nominating
(Since May 2014)
� Private Investor as of 2012
� Previously, Global Head of Financial Institutions at Barclays and a Managing Director at Lehman Brothers
�
(1) Audit Committee comprised of 100% independent directors. (2) Mr. Appleby is Chair of the Nominating Committee. (3) Mr. Weiss is Chair of the Audit Committee.

Page 33
Company Information
Investor Presentation – July 27, 2015
Eagle Point Credit Company Inc.
20 Horseneck Lane Greenwich, Connecticut 06830
www.EaglePointCreditCompany.com
Investor Relations:
Ken Onorio [email protected]
(203) 340-8500