investor meetings - cerved company€¦ · investor meetings london, ... 11 years of tmt industry...
TRANSCRIPT

Investor Meetings
London, 17-18 September, 2014
CERVED INFORMATION SOLUTIONS S.p.A.
Disclaimer
1
This presentation and any materials distributed in connection herewith (together, the “Presentation”) do not constitute or form a part of, and should not be construed as, an offer for sale or subscription of or solicitation of any offer to purchase or subscribe for any securities, and neither this Presentation nor anything contained herein shall form the basis of, or be relied upon in connection with, or act as an inducement to enter into, any contract or commitment whatsoever. The information contained in this Presentation has not been independently verified and no representation or warranty, express or implied, is made as to, and no reliance should be placed on, the fairness, accuracy, completeness, reasonableness or correctness of the information or opinions contained herein. None of Cerved Information Solutions S.p.A., its subsidiaries or any of their respective employees, advisers, representatives or affiliates shall have any liability whatsoever (in negligence or otherwise) for any loss howsoever arising from any use of this document or its contents or otherwise arising in connection with this Presentation. The information contained in this Presentation is provided as at the date of this Presentation and is subject to change without notice.
Statements made in this Presentation may include forward-looking statements. These statements may be identified by the fact that they use words such as “anticipate”, “estimate”, “should”, “expect”, “guidance”, “project”, “intend”, “plan”, “believe”, and/or other words and terms of similar meaning in connection with, among other things, any discussion of results of operations, financial condition, liquidity, prospects, growth, strategies or developments in the industry in which we operate. Such statements are based on management’s current intentions, expectations or beliefs and involve inherent risks, assumptions and uncertainties, including factors that could delay, divert or change any of them. Forward-looking statements contained in this Presentation regarding trends or current activities should not be taken as a representation that such trends or activities will continue in the future. Actual outcomes, results and other future events may differ materially from those expressed or implied by the statements contained herein. Such differences may adversely affect the outcome and financial effects of the plans and events described herein and may result from, among other things, changes in economic, business, competitive, technological, strategic or regulatory factors and other factors affecting the business and operations of the company. Neither Cerved Information Solutions S.p.A. nor any of its affiliates is under any obligation, and each such entity expressly disclaims any such obligation, to update, revise or amend any forward-looking statements, whether as a result of new information, future events or otherwise. You should not place undue reliance on any such forward-looking statements, which speak only as of the date of this Presentation. It should be noted that past performance is not a guide to future performance. Please also note that interim results are not necessarily indicative of full-year results.

Today’s Presenters
Giovanni Sartor – Chief Financial Officer
5 years at Cerved
5 years of TMT industry experience
Prior experience: Seves Group, Nylstar (RP-Snia JV), Eni, Heinz
Education: MBA from Eni University; Statistics and Economics degree from University of Padua
Pietro Masera – Head of Corporate Development & Investor Relations
1 year at Cerved
11 years of TMT industry experience
Prior experience: CVC, Deutsche Bank, Bankers Trust, UBS, SEAT
Education: degree in Economics and Business Administration from the University of Bergamo
Gianandrea De Bernardis – Chief Executive Officer
8 years at Cerved
15 years of TMT industry experience
Prior experience: TeamSystem, AMPS, Boston Consulting Group, AT&T
Education: MBA from Bocconi University; Electronic Engineering degree from Polytechnic of Milan
2
Table of Contents
3
Investment Case 3
Overview 1
Appendices 4
Current Trading 2
4
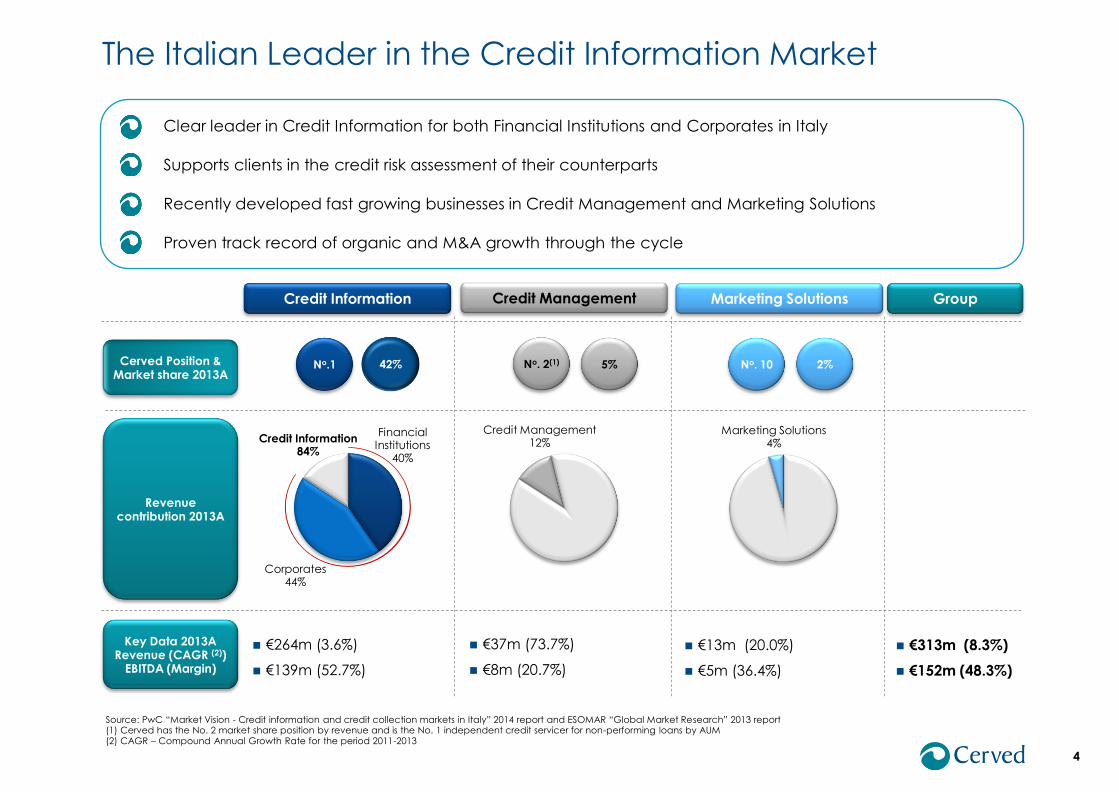
The Italian Leader in the Credit Information Market
Credit Information
€264m (3.6%)
€139m (52.7%)
Credit Information 84%
42% No.1
Credit Management
€37m (73.7%)
€8m (20.7%)
Credit Management 12%
5% No. 2(1)
Marketing Solutions
€13m (20.0%)
€5m (36.4%)
Marketing Solutions 4%
2% No. 10
Source: PwC “Market Vision - Credit information and credit collection markets in Italy” 2014 report and ESOMAR “Global Market Research” 2013 report (1) Cerved has the No. 2 market share position by revenue and is the No. 1 independent credit servicer for non-performing loans by AUM (2) CAGR – Compound Annual Growth Rate for the period 2011-2013
Group
Key Data 2013A Revenue (CAGR (2))
EBITDA (Margin)
€313m (8.3%)
€152m (48.3%)
Revenue contribution 2013A
Corporates 44%
Financial Institutions
40%
Cerved Position & Market share 2013A
Clear leader in Credit Information for both Financial Institutions and Corporates in Italy
Supports clients in the credit risk assessment of their counterparts
Recently developed fast growing businesses in Credit Management and Marketing Solutions
Proven track record of organic and M&A growth through the cycle
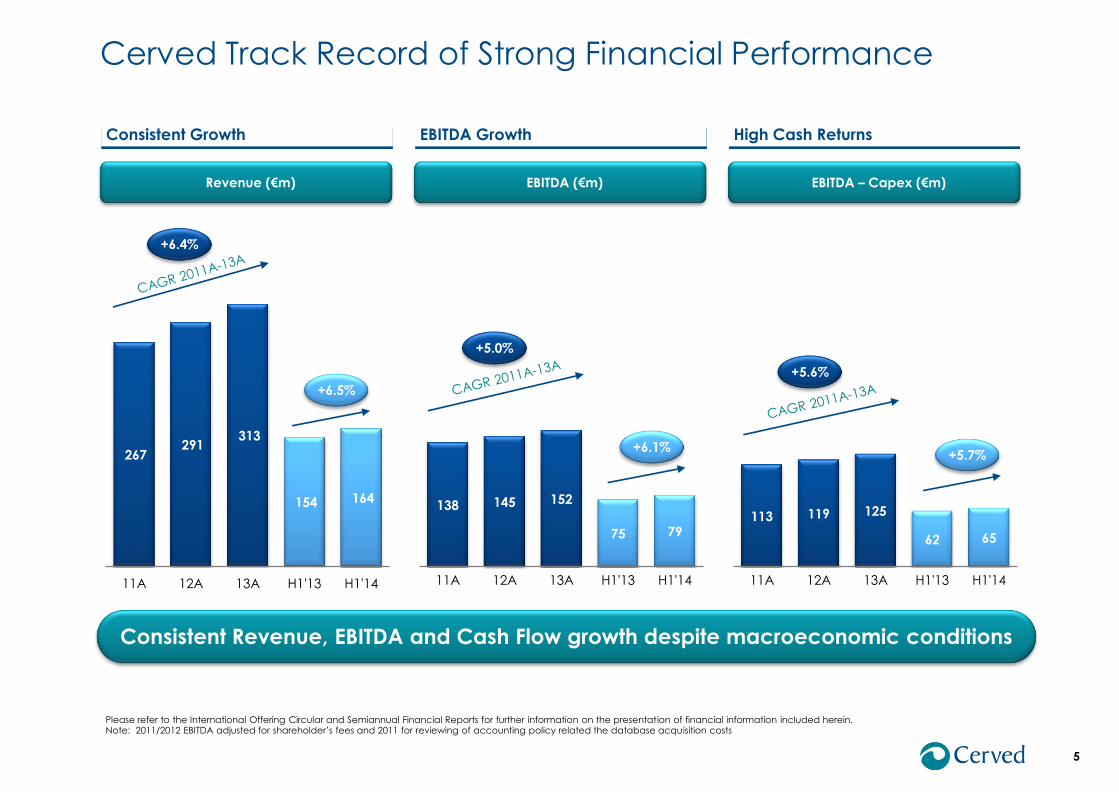
113 119 125
62 65
11A 12A 13A H1'13 H1'14
Cerved Track Record of Strong Financial Performance
5
Consistent Growth EBITDA Growth High Cash Returns
Revenue (€m) EBITDA (€m) EBITDA – Capex (€m)
Consistent Revenue, EBITDA and Cash Flow growth despite macroeconomic conditions
138 145 152
75 79
11A 12A 13A H1'13 H1'14
267 291
313
154 164
11A 12A 13A H1'13 H1'14
+6.4%
+6.5%
+5.0%
+6.1%
Please refer to the International Offering Circular and Semiannual Financial Reports for further information on the presentation of financial information included herein. Note: 2011/2012 EBITDA adjusted for shareholder’s fees and 2011 for reviewing of accounting policy related the database acquisition costs
+5.6%
+5.7%
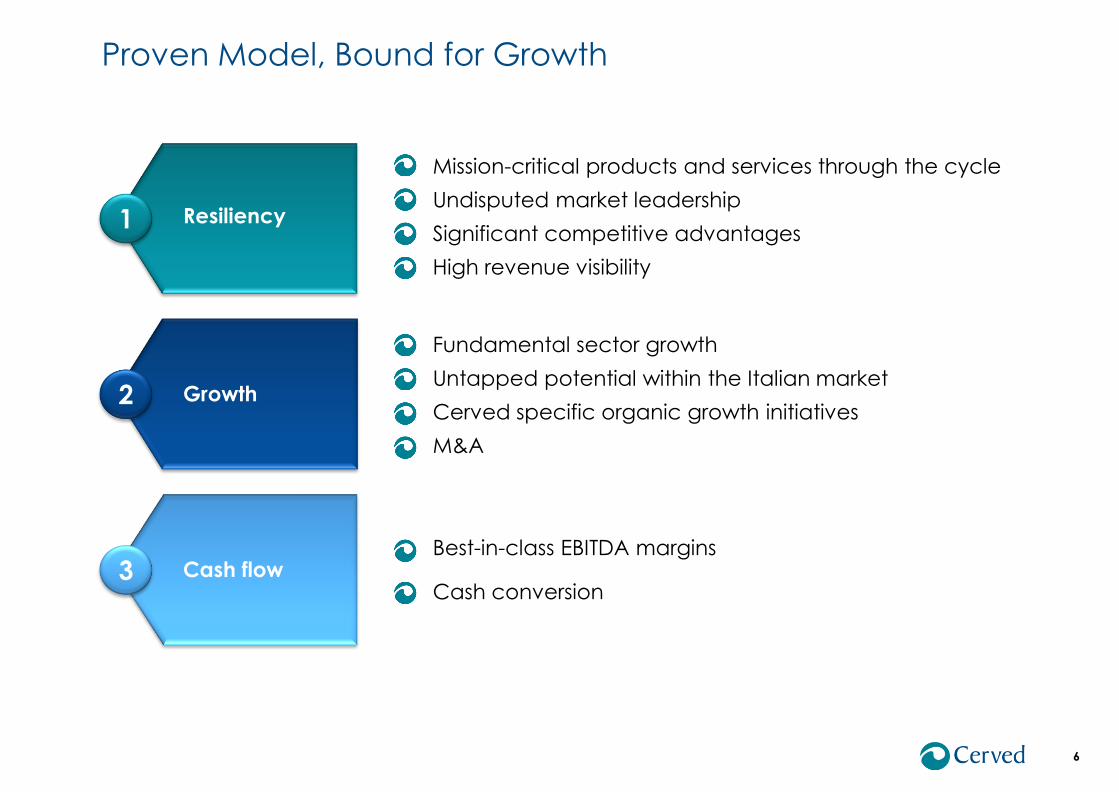
Proven Model, Bound for Growth
6
Mission-critical products and services through the cycle
Undisputed market leadership
Significant competitive advantages
High revenue visibility
Fundamental sector growth
Untapped potential within the Italian market
Cerved specific organic growth initiatives
M&A
Best-in-class EBITDA margins
Cash conversion
2 Growth
3 Cash flow
1 Resiliency
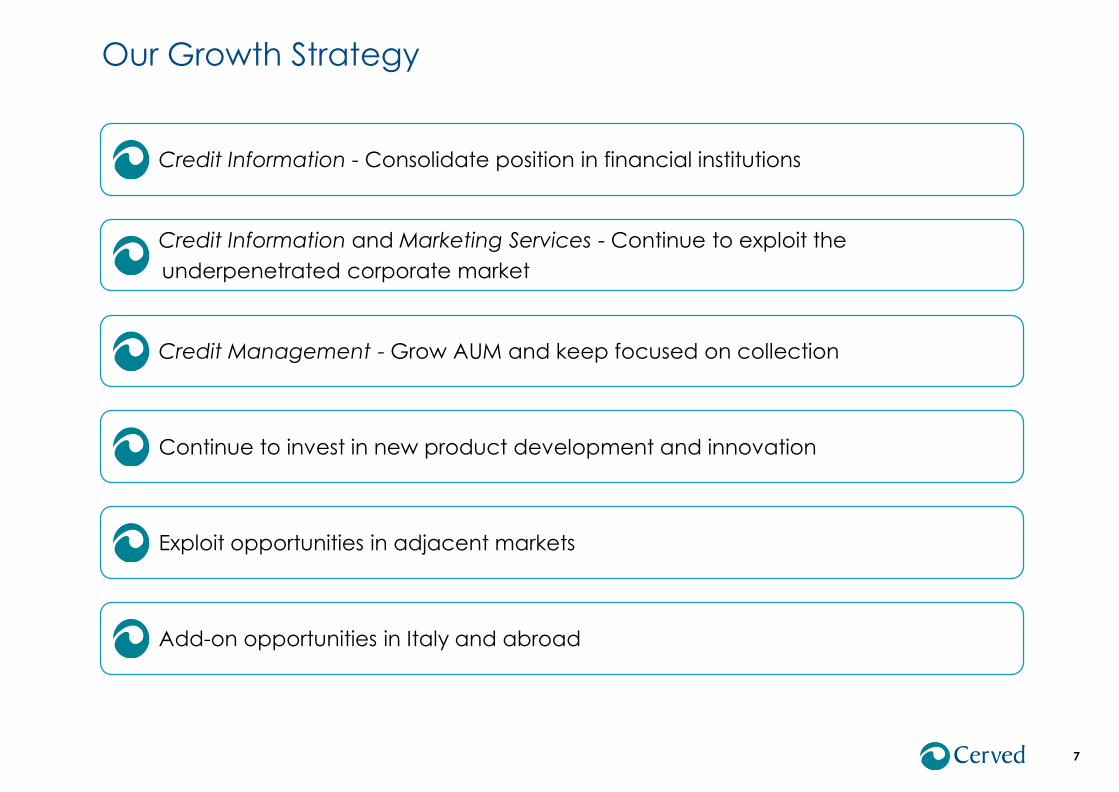
Our Growth Strategy
7
Credit Information - Consolidate position in financial institutions
Credit Information and Marketing Services - Continue to exploit the
underpenetrated corporate market
Exploit opportunities in adjacent markets
Credit Management - Grow AUM and keep focused on collection
Continue to invest in new product development and innovation
Add-on opportunities in Italy and abroad
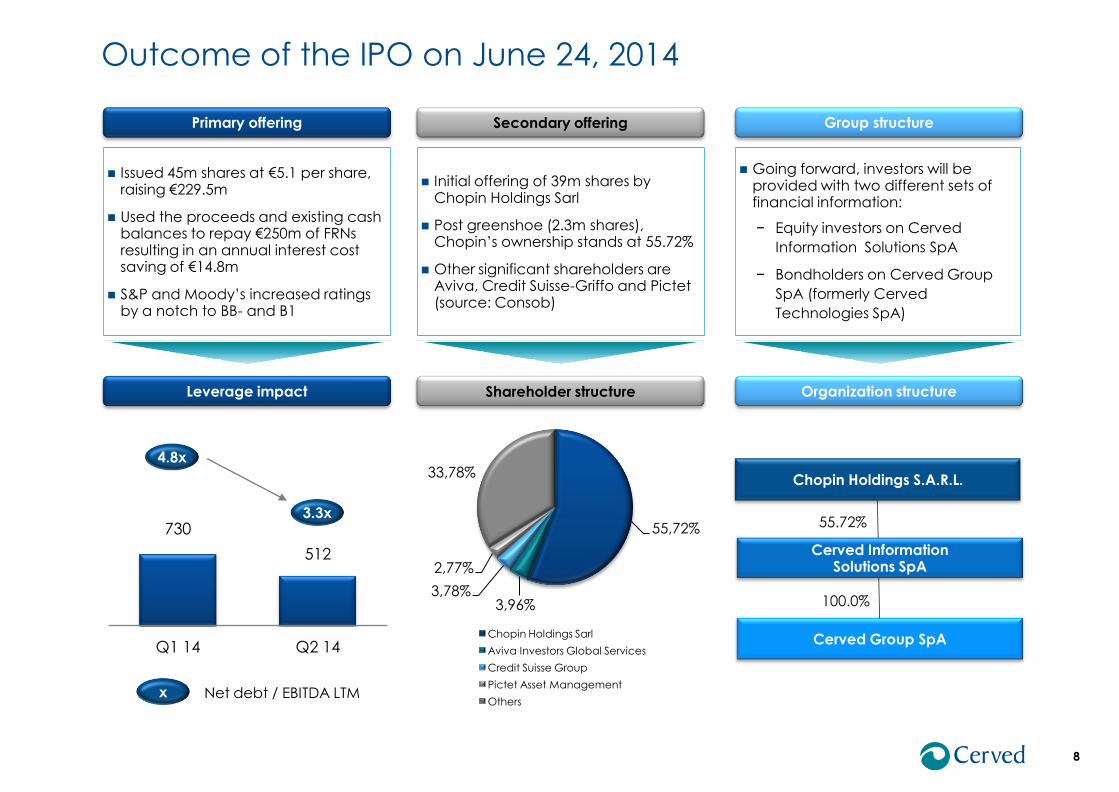
Outcome of the IPO on June 24, 2014
8
Group structure
Organization structure
Going forward, investors will be provided with two different sets of financial information:
− Equity investors on Cerved
Information Solutions SpA
− Bondholders on Cerved Group
SpA (formerly Cerved
Technologies SpA)
Cerved Group SpA
Chopin Holdings S.A.R.L.
Cerved Information Solutions SpA
55.72%
100.0%
Primary offering
Issued 45m shares at €5.1 per share, raising €229.5m
Used the proceeds and existing cash balances to repay €250m of FRNs resulting in an annual interest cost saving of €14.8m
S&P and Moody’s increased ratings by a notch to BB- and B1
Leverage impact
730
512
Q1 14 Q2 14
Net debt / EBITDA LTM
4.8x
x
3.3x 55,72%
3,96% 3,78%
2,77%
33,78%
Chopin Holdings Sarl
Aviva Investors Global Services
Credit Suisse Group
Pictet Asset Management
Others
Secondary offering
Shareholder structure
Initial offering of 39m shares by Chopin Holdings Sarl
Post greenshoe (2.3m shares), Chopin’s ownership stands at 55.72%
Other significant shareholders are Aviva, Credit Suisse-Griffo and Pictet (source: Consob)
Table of Contents
9
Investment Case 3
Overview 1
Appendices 4
Current Trading 2
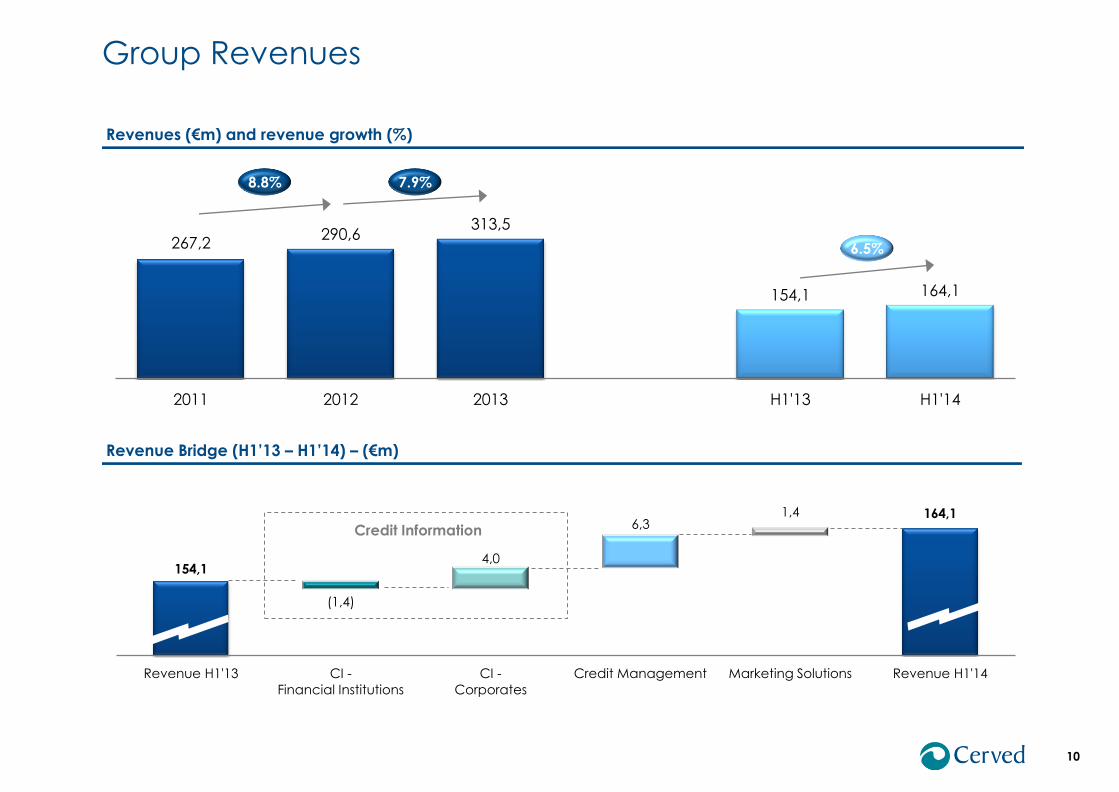
Group Revenues
10
Revenues (€m) and revenue growth (%)
267,2 290,6
313,5
154,1 164,1
2011 2012 2013 H1'13 H1'14
7.9% 8.8%
6.5%
Revenue Bridge (H1’13 – H1’14) – (€m)
154,1
164,1
(1,4)
4,0
6,3 1,4
Revenue H1'13 CI -
Financial Institutions
CI -
Corporates
Credit Management Marketing Solutions Revenue H1'14
Credit Information
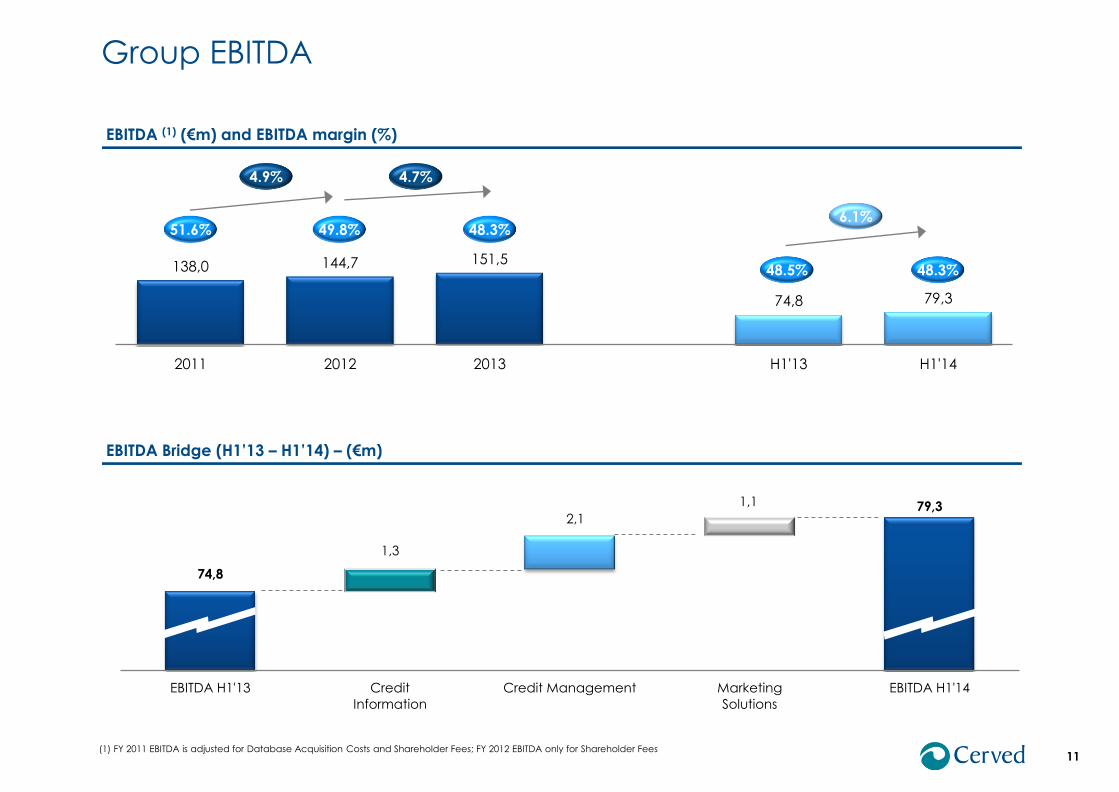
74,8
79,3
1,3
2,1
1,1
EBITDA H1'13 Credit
Information
Credit Management Marketing
Solutions
EBITDA H1'14
Group EBITDA
11
EBITDA Bridge (H1’13 – H1’14) – (€m)
EBITDA (1) (€m) and EBITDA margin (%)
138,0 144,7 151,5
74,8 79,3
2011 2012 2013 H1'13 H1'14
4.7% 4.9%
6.1% 48.3% 49.8% 51.6%
48.5% 48.3%
(1) FY 2011 EBITDA is adjusted for Database Acquisition Costs and Shareholder Fees; FY 2012 EBITDA only for Shareholder Fees
12
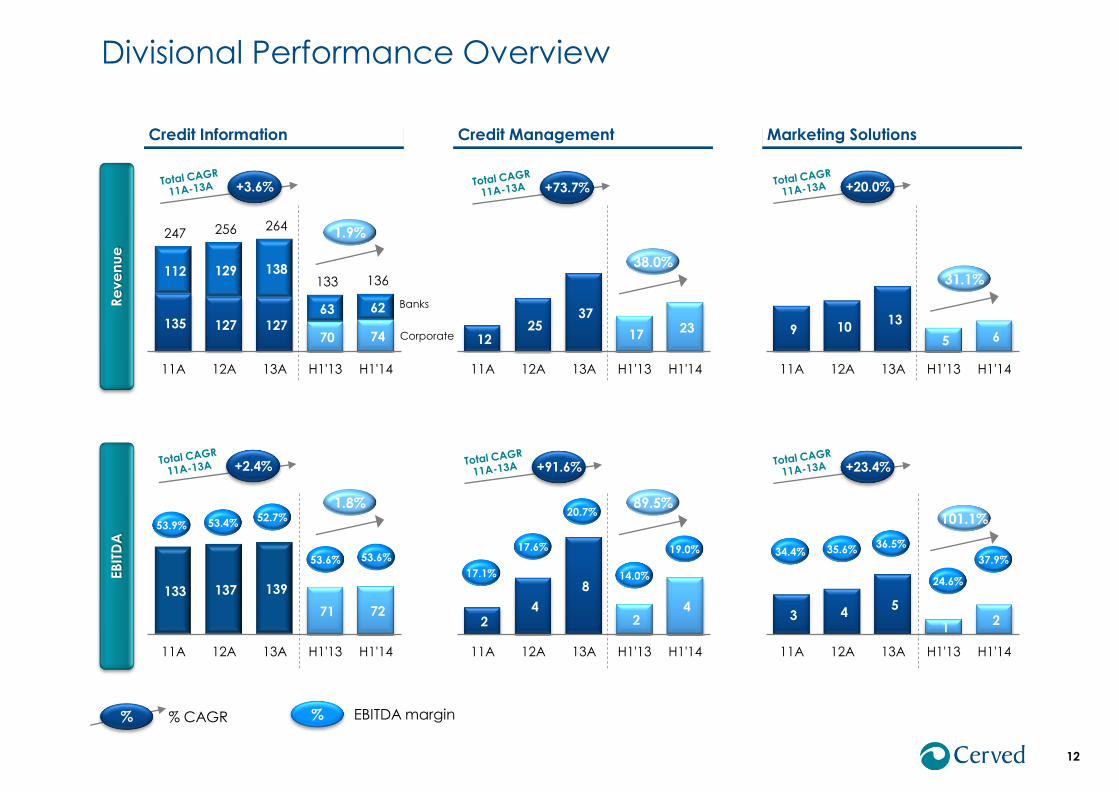
Credit Information Credit Management Marketing Solutions
135 127 127 70 74
112 129 138
63 62
247 256 264
133 136
11A 12A 13A H1'13 H1'14
+3.6%
Re
ve
nu
e
EB
ITD
A
133 137 139
71 72
11A 12A 13A H1'13 H1'14
12 25
37
17 23
11A 12A 13A H1'13 H1'14
2 4
8
2 4
11A 12A 13A H1'13 H1'14
9 10 13
5 6
11A 12A 13A H1'13 H1'14
3 4 5
1 2
11A 12A 13A H1'13 H1'14
34.4% 35.6% 36.5%
24.6%
% EBITDA margin % CAGR
Divisional Performance Overview
+73.7% +20.0%
+2.4% +91.6% +23.4%
37.9%
17.1%
17.6%
20.7%
14.0%
19.0%
53.9% 53.4% 52.7%
53.6% 53.6%
%
38.0%
31.1%
1.9%
89.5% 101.1%
1.8%
Banks
Corporate
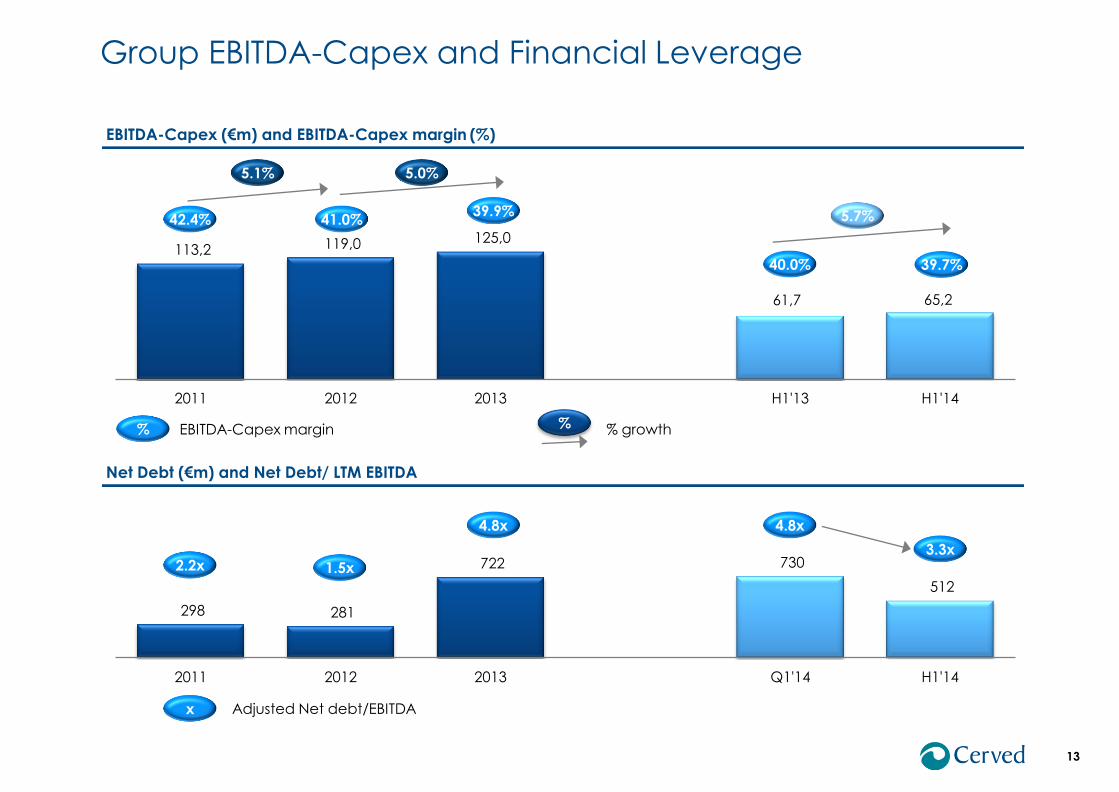
Group EBITDA-Capex and Financial Leverage
13
EBITDA-Capex (€m) and EBITDA-Capex margin (%)
61,7 65,2
113,2 119,0 125,0
2011 2012 2013 H1'13 H1'14
5.0% 5.1%
5.7% 39.9% 41.0% 42.4%
40.0% 39.7%
% EBITDA-Capex margin % % growth
Net Debt (€m) and Net Debt/ LTM EBITDA
298 281
722 730
512
2011 2012 2013 Q1'14 H1'14
2.2x 1.5x
4.8x
x Adjusted Net debt/EBITDA
4.8x
3.3x
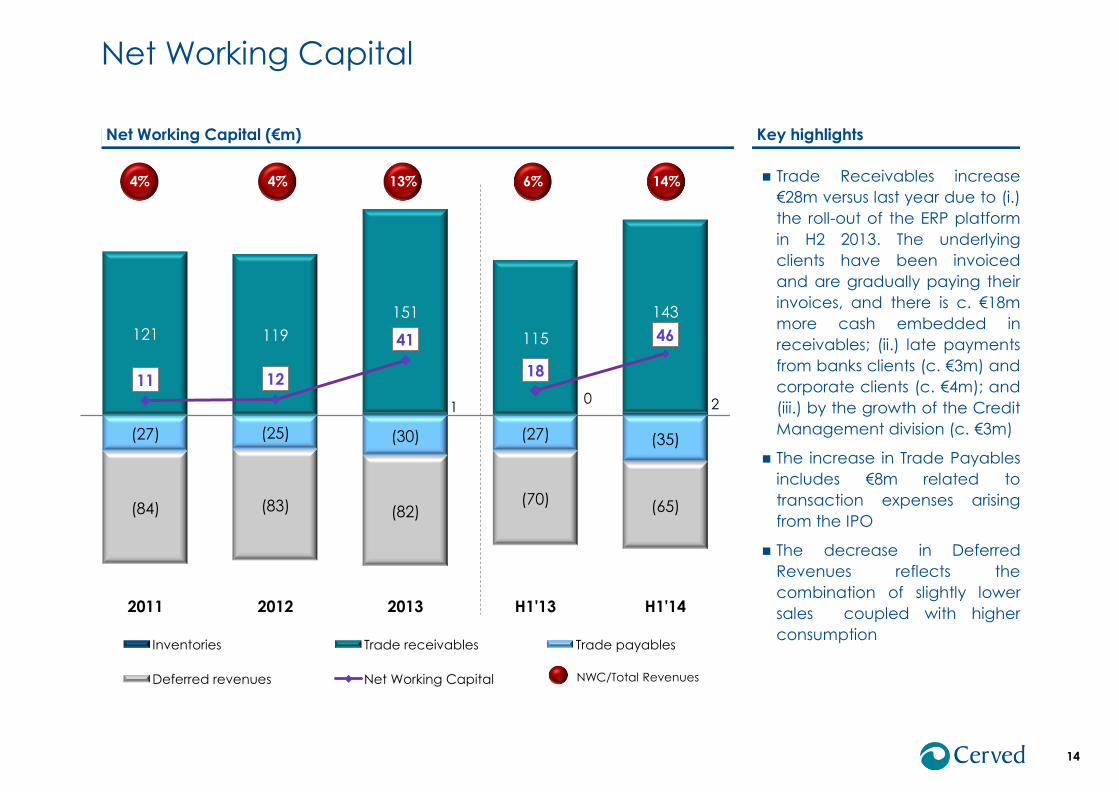
1 0 2
121 119
151
115
143
(27) (25) (30) (27) (35)
(84) (83) (82) (70) (65)
11 12
41
18
46
2011 2012 2013 H1'13 H1'14
Inventories Trade receivables Trade payables
Deferred revenues Net Working Capital
14
4% 4% 13%
NWC/Total Revenues
6% 14% Trade Receivables increase
€28m versus last year due to (i.)
the roll-out of the ERP platform
in H2 2013. The underlying
clients have been invoiced
and are gradually paying their
invoices, and there is c. €18m
more cash embedded in
receivables; (ii.) late payments
from banks clients (c. €3m) and
corporate clients (c. €4m); and
(iii.) by the growth of the Credit
Management division (c. €3m)
The increase in Trade Payables
includes €8m related to
transaction expenses arising
from the IPO
The decrease in Deferred
Revenues reflects the
combination of slightly lower
sales coupled with higher
consumption
Net Working Capital
Key highlights Net Working Capital (€m)
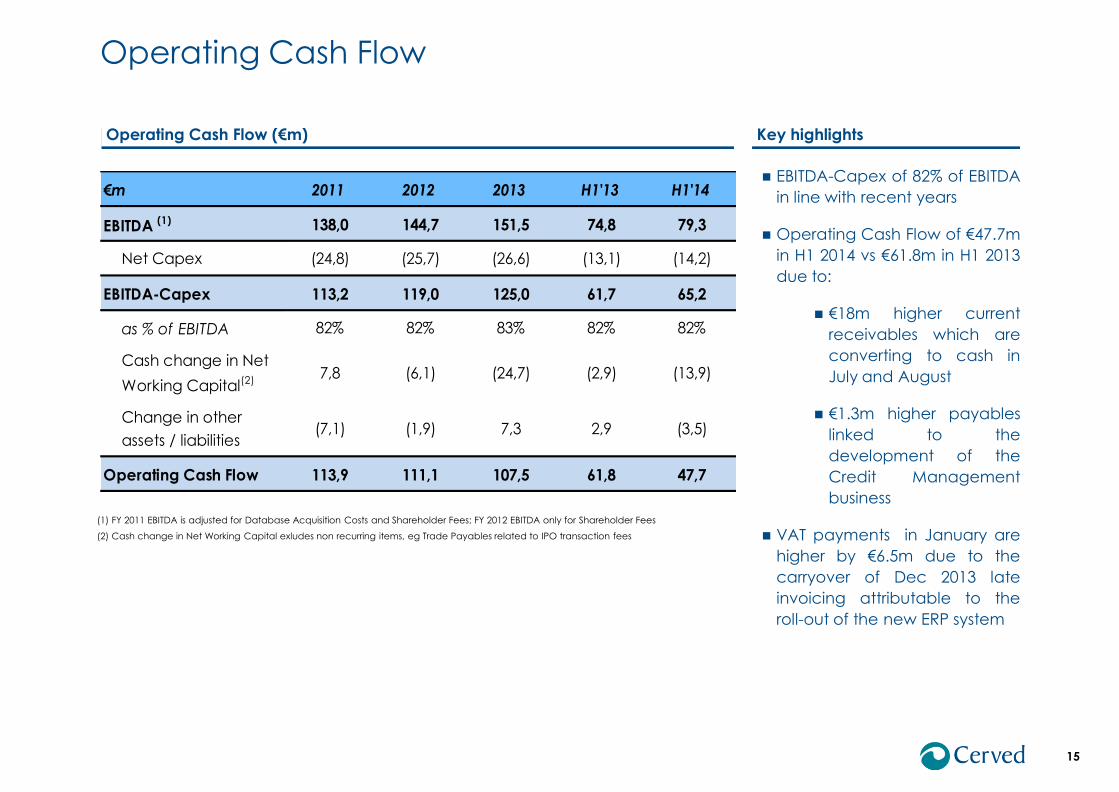
EBITDA-Capex of 82% of EBITDA
in line with recent years
Operating Cash Flow of €47.7m
in H1 2014 vs €61.8m in H1 2013
due to:
€18m higher current
receivables which are
converting to cash in
July and August
€1.3m higher payables
linked to the
development of the
Credit Management
business
VAT payments in January are
higher by €6.5m due to the
carryover of Dec 2013 late
invoicing attributable to the
roll-out of the new ERP system
Key highlights Operating Cash Flow (€m)
Operating Cash Flow
15
(1) FY 2011 EBITDA is adjusted for Database Acquisition Costs and Shareholder Fees; FY 2012 EBITDA only for Shareholder Fees
(2) Cash change in Net Working Capital exludes non recurring items, eg Trade Payables related to IPO transaction fees
€m 2011 2012 2013 H1'13 H1'14
EBITDA (1) 138,0 144,7 151,5 74,8 79,3
Net Capex (24,8) (25,7) (26,6) (13,1) (14,2)
EBITDA-Capex 113,2 119,0 125,0 61,7 65,2
as % of EBITDA 82% 82% 83% 82% 82%
Cash change in Net
Working Capital(2)7,8 (6,1) (24,7) (2,9) (13,9)
Change in other
assets / liabilities(7,1) (1,9) 7,3 2,9 (3,5)
Operating Cash Flow 113,9 111,1 107,5 61,8 47,7
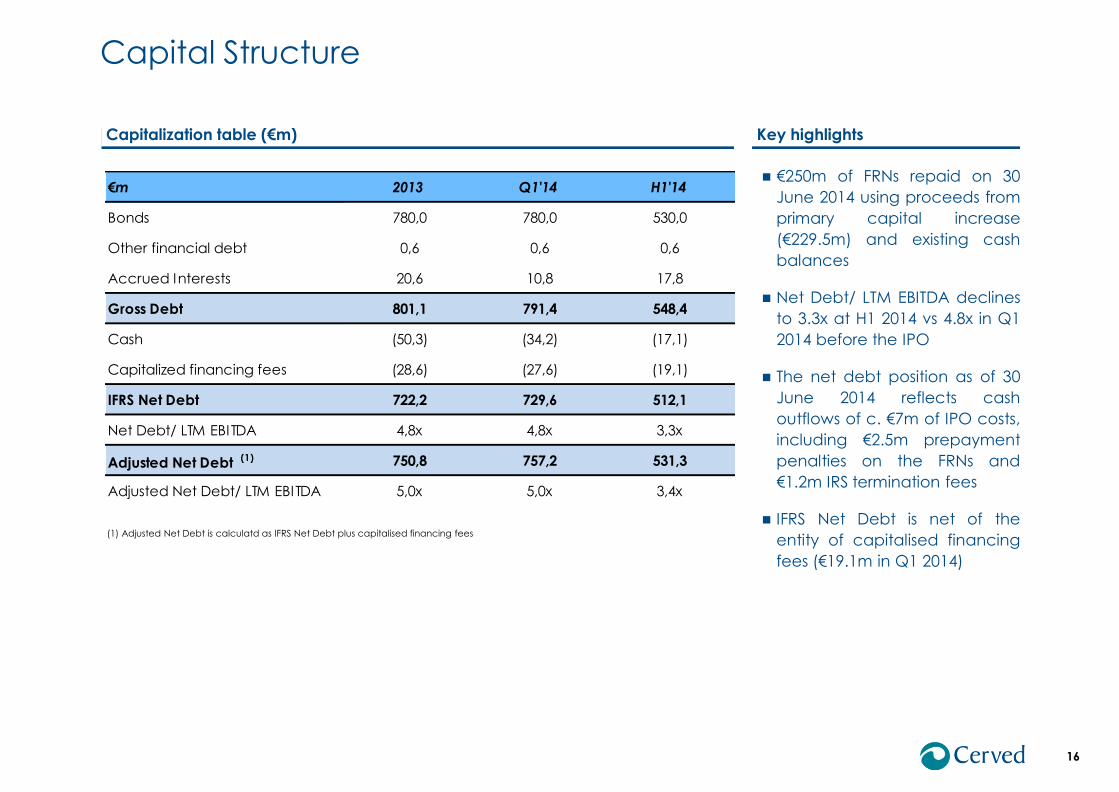
€250m of FRNs repaid on 30
June 2014 using proceeds from
primary capital increase
(€229.5m) and existing cash
balances
Net Debt/ LTM EBITDA declines
to 3.3x at H1 2014 vs 4.8x in Q1
2014 before the IPO
The net debt position as of 30
June 2014 reflects cash
outflows of c. €7m of IPO costs,
including €2.5m prepayment
penalties on the FRNs and
€1.2m IRS termination fees
IFRS Net Debt is net of the
entity of capitalised financing
fees (€19.1m in Q1 2014)
Capital Structure
16
(1) Adjusted Net Debt is calculatd as IFRS Net Debt plus capitalised financing fees
Key highlights Capitalization table (€m)
€m 2013 Q1'14 H1'14
Bonds 780,0 780,0 530,0
Other financial debt 0,6 0,6 0,6
Accrued Interests 20,6 10,8 17,8
Gross Debt 801,1 791,4 548,4
Cash (50,3) (34,2) (17,1)
Capitalized financing fees (28,6) (27,6) (19,1)
IFRS Net Debt 722,2 729,6 512,1
Net Debt/ LTM EBITDA 4,8x 4,8x 3,3x
Adjusted Net Debt (1) 750,8 757,2 531,3
Adjusted Net Debt/ LTM EBITDA 5,0x 5,0x 3,4x
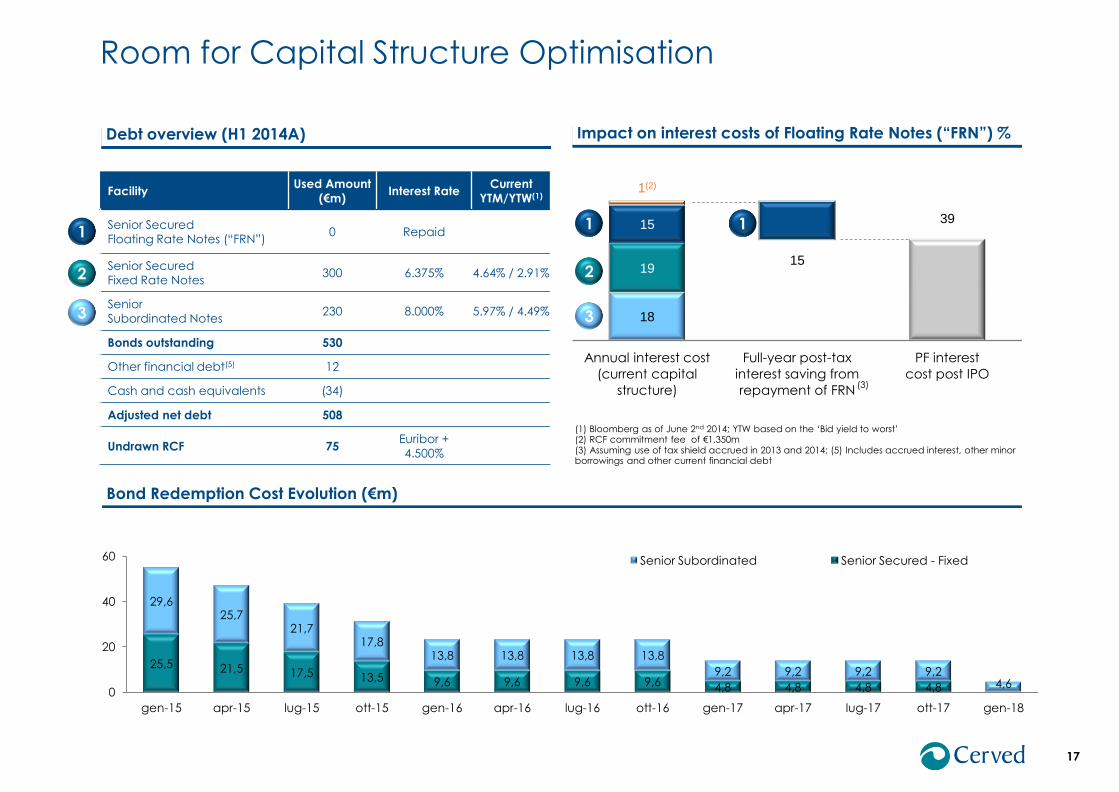
39
18
15 19
15
1(2)
Annual interest cost
(current capital
structure)
Full-year post-tax
interest saving from
repayment of FRN
PF interest
cost post IPO
17
Debt overview (H1 2014A)
Bond Redemption Cost Evolution (€m)
Impact on interest costs of Floating Rate Notes (“FRN”) %
25,5 21,5 17,5 13,5 9,6 9,6 9,6 9,6 4,8 4,8 4,8 4,8
29,6 25,7
21,7 17,8
13,8 13,8 13,8 13,8
9,2 9,2 9,2 9,2 4,6
0
20
40
60
gen-15 apr-15 lug-15 ott-15 gen-16 apr-16 lug-16 ott-16 gen-17 apr-17 lug-17 ott-17 gen-18
Senior Subordinated Senior Secured - Fixed
Facility Used Amount
(€m) Interest Rate
Current
YTM/YTW(1)
Senior Secured
Floating Rate Notes (“FRN”) 0 Repaid
Senior Secured
Fixed Rate Notes 300 6.375% 4.64% / 2.91%
Senior
Subordinated Notes 230 8.000% 5.97% / 4.49%
Bonds outstanding 530
Other financial debt(5) 12
Cash and cash equivalents (34)
Adjusted net debt 508
Undrawn RCF 75 Euribor + 4.500%
(1) Bloomberg as of June 2nd 2014; YTW based on the ‘Bid yield to worst’ (2) RCF commitment fee of €1.350m (3) Assuming use of tax shield accrued in 2013 and 2014; (5) Includes accrued interest, other minor borrowings and other current financial debt
1
2
3
1
2
3
1
(3)
Room for Capital Structure Optimisation
9,1% 9,1% 9,3%
10,8%
9,2%
7,9% 7,5%
8,6% 7,6%
Q1 Q2 Q3 Q4 Q1 Q2 Q3 Q4 Q1
9,5% 10,0% 10,2%
10,6% 11,1% 11,7%
11,9%
11,7% 11,7% 11,3%
Q1 Q2 Q3 Q4 Q1 Q2 Q3 Q4 Q1 Q2
-1,1%
-0,5%
-0,4%
-0,9% -0,6%
-0,3% -0,1%
0,1%
-0,1% -0,2%
Q1 Q2 Q3 Q4 Q1 Q2 Q3 Q4 Q1 Q2
39,9
41,7
38,5
36,9
33,7
34,2
30,6
34,2
31,5
32,4
Q1 Q2 Q3 Q4 Q1 Q2 Q3 Q4 Q1 Q2
5.6% -2.6% 5.2% 5.1%
14.1%
12.3% 11.6% 12.9% 4.6%
Q1 Q2 Q3 Q4 Q1 Q2 Q3 Q4 Q1
2,7% 2,7% 2,9% 3,0% 3,1% 3,3%
3,4% 3,5% 3,6%
Q1 Q2 Q3 Q4 Q1 Q2 Q3 Q4 Q1
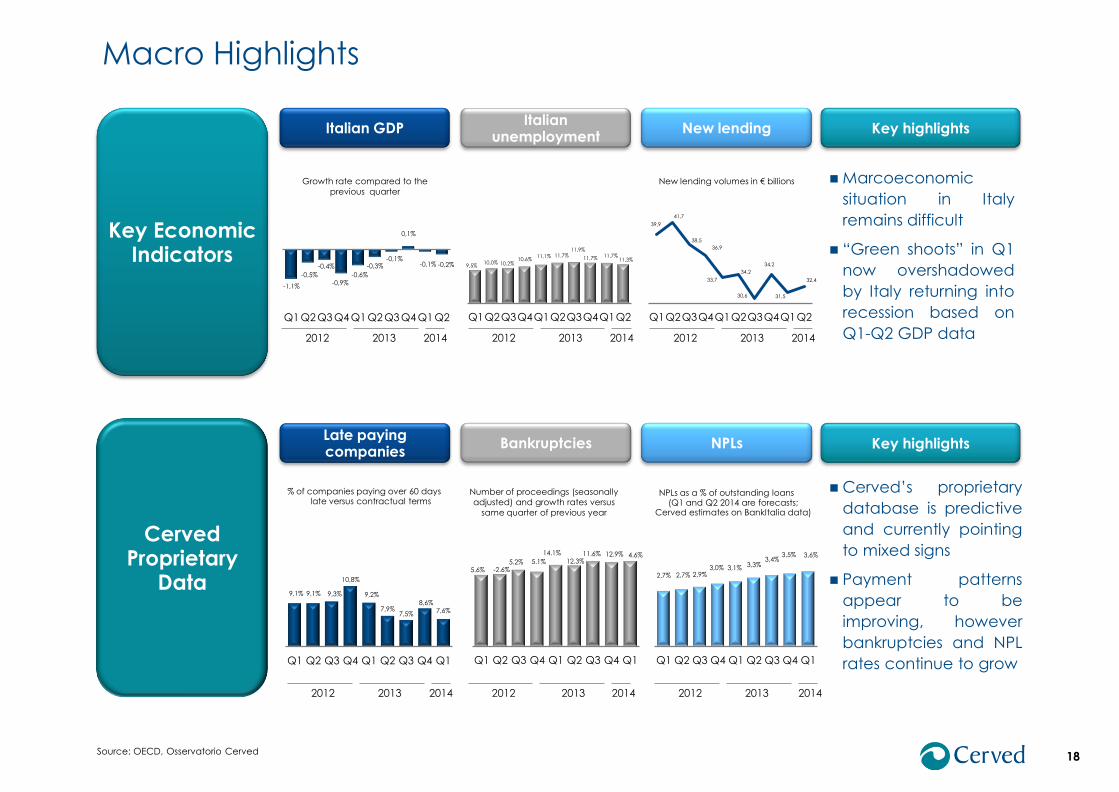
Macro Highlights
18
Key Economic Indicators
Cerved Proprietary
Data
Italian unemployment
Italian GDP New lending
Bankruptcies Late paying companies
NPLs
% of companies paying over 60 days late versus contractual terms
Number of proceedings (seasonally
adjusted) and growth rates versus
same quarter of previous year
NPLs as a % of outstanding loans (Q1 and Q2 2014 are forecasts;
Cerved estimates on BankItalia data)
Marcoeconomic
situation in Italy
remains difficult
“Green shoots” in Q1
now overshadowed
by Italy returning into
recession based on
Q1-Q2 GDP data
Key highlights
Cerved’s proprietary
database is predictive
and currently pointing
to mixed signs
Payment patterns
appear to be
improving, however
bankruptcies and NPL
rates continue to grow
Key highlights
Growth rate compared to the
previous quarter
New lending volumes in € billions
2014 2013 2012 2014 2013 2012 2014 2013 2012
2014 2013 2012 2014 2013 2012 2014 2013 2012
Source: OECD, Osservatorio Cerved
Table of Contents
19
Investment Case 3
Overview 1
Appendices 4
Current Trading 2
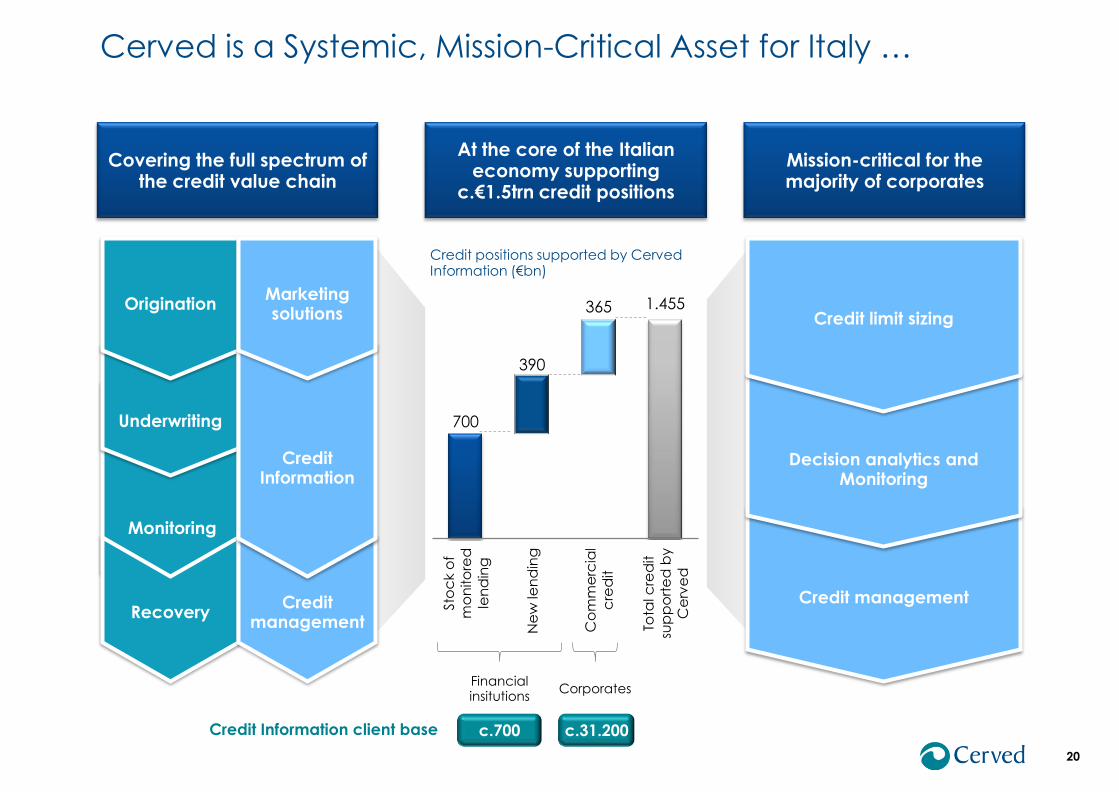
Cerved is a Systemic, Mission-Critical Asset for Italy …
20
Mission-critical for the majority of corporates
At the core of the Italian economy supporting
c.€1.5trn credit positions
700
1.455
390
365
Sto
ck o
f
mo
nito
red
len
din
g
Ne
w le
nd
ing
Co
mm
erc
ial
cre
dit
Tota
l cre
dit
sup
po
rte
d b
y
Ce
rve
d
Credit positions supported by Cerved Information (€bn)
Monitoring
Covering the full spectrum of the credit value chain
Recovery
Underwriting
Origination
c.700 c.31.200 Credit Information client base
Financial insitutions
Corporates
Credit management
Credit Information
Marketing solutions
Credit management
Decision analytics and Monitoring
Credit limit sizing
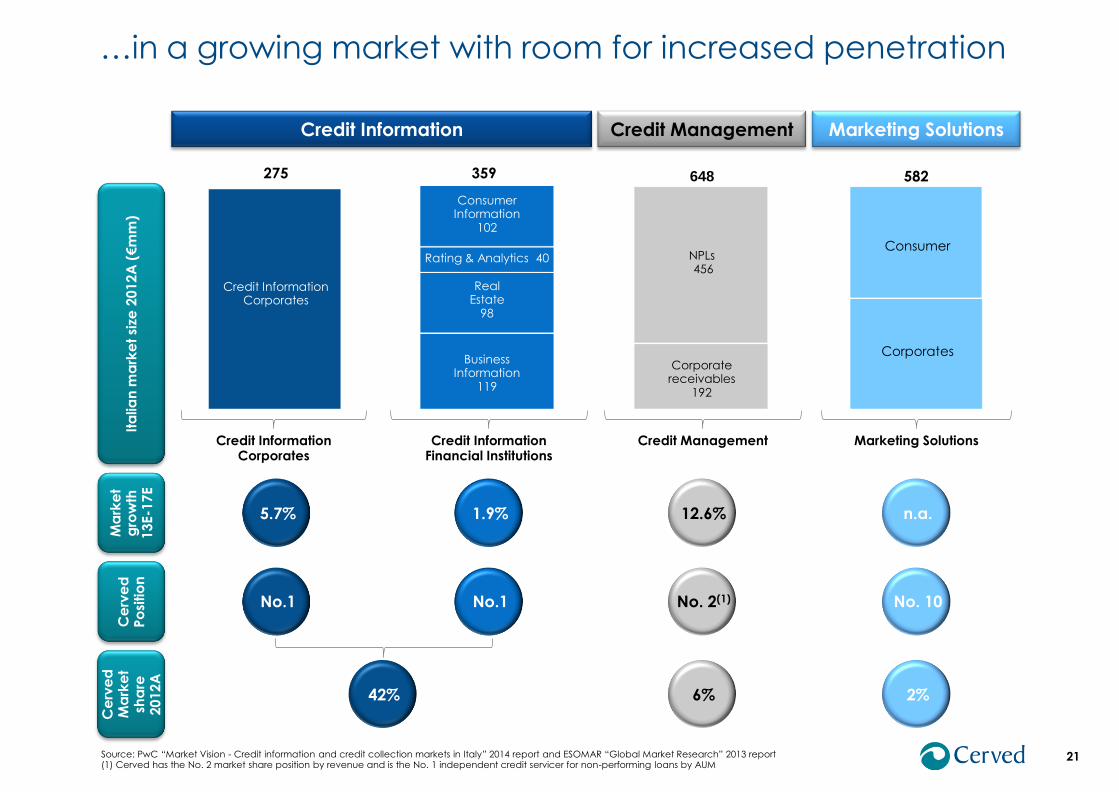
…in a growing market with room for increased penetration
21 Source: PwC “Market Vision - Credit information and credit collection markets in Italy” 2014 report and ESOMAR “Global Market Research” 2013 report (1) Cerved has the No. 2 market share position by revenue and is the No. 1 independent credit servicer for non-performing loans by AUM
2% 42%
Credit Information Marketing Solutions Credit Management
Credit Information Corporates
275
Credit Information Corporates
582 648
Ce
rve
d
Ma
rke
t sh
are
2012A
Ce
rve
d
Po
sitio
n
359
2% 42% 6%
Credit Information Financial Institutions
Credit Management Marketing Solutions
Consumer
Corporates
n.a. 5.7% 12.6% 1.9%
No. 10 No.1 No. 2(1) No.1
Business Information Financial Institutions
119
Real Estate Financial Institutions
98
Consumer Information
Financial Institutions 102
Rating & Analytics Financial Institutions 40
Business Information
119
Real Estate
98
Consumer Information
102
Rating & Analytics 40 Consumer
Corporates
Ita
lian
ma
rke
t si
ze 2
012A
(€m
m)
Ma
rke
t g
row
th
13E-1
7E
NPLs 456
Corporate receivables
192
22
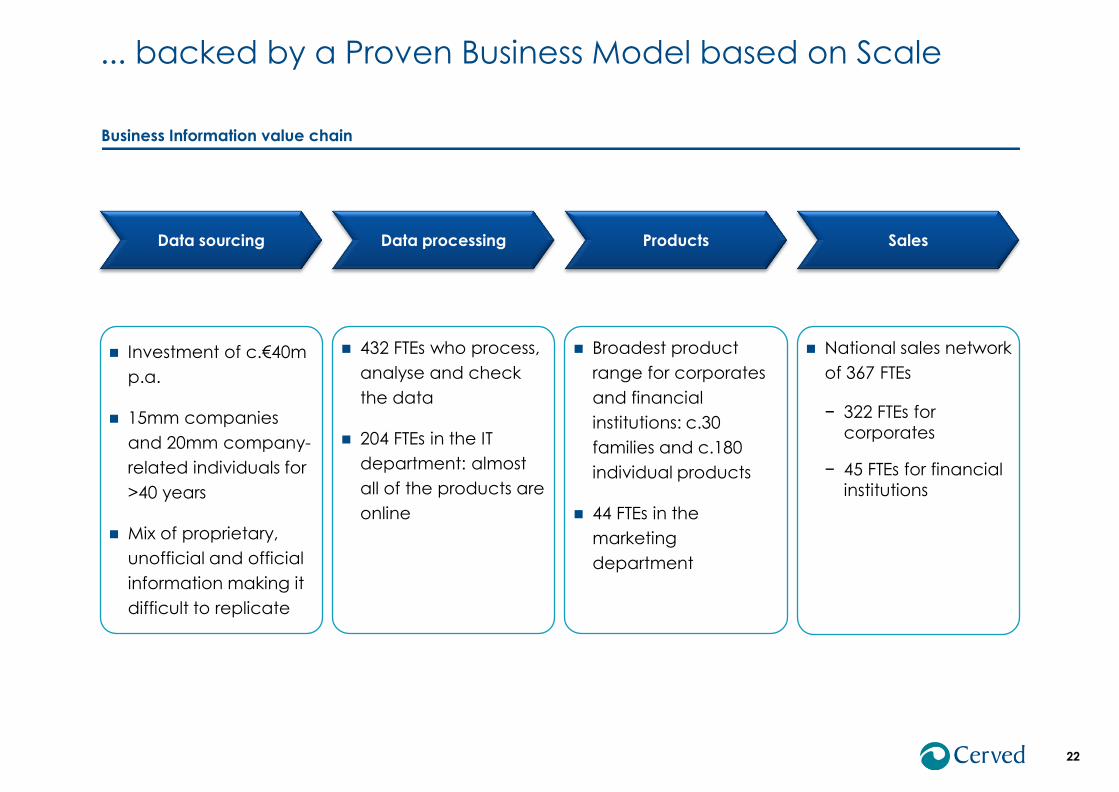
Data sourcing Data processing Products Sales
Business Information value chain
Investment of c.€40m
p.a.
15mm companies
and 20mm company-
related individuals for
>40 years
Mix of proprietary,
unofficial and official
information making it
difficult to replicate
432 FTEs who process,
analyse and check
the data
204 FTEs in the IT
department: almost
all of the products are
online
Broadest product
range for corporates
and financial
institutions: c.30
families and c.180
individual products
44 FTEs in the
marketing
department
National sales network
of 367 FTEs
− 322 FTEs for
corporates
− 45 FTEs for financial
institutions
... backed by a Proven Business Model based on Scale

Proven Model, Bound for Growth
23
Mission-critical products and services through the cycle
Undisputed market leadership
Significant competitive advantages
High revenue visibility
Fundamental sector growth
Untapped potential within the Italian market
Cerved specific organic growth initiatives
M&A
Best-in-class EBITDA margins
Cash conversion
2 Growth
3 Cash flow
1 Resiliency
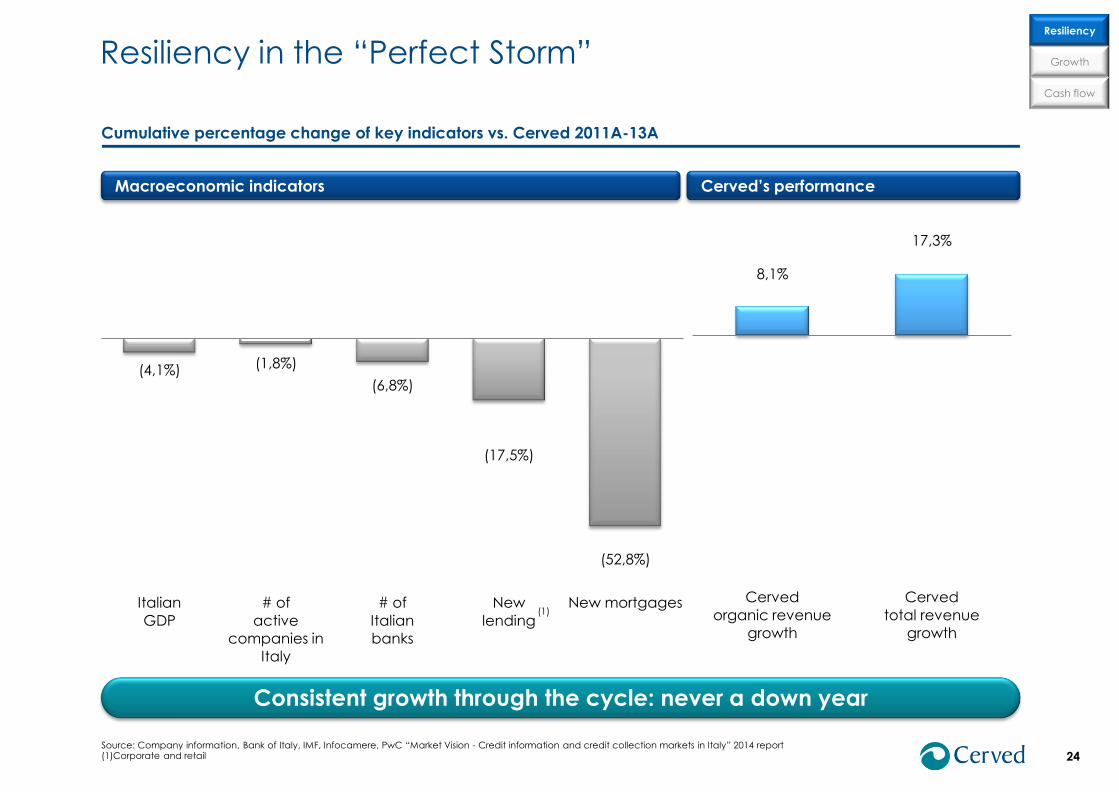
(4,1%) (1,8%)
(6,8%)
(17,5%)
(52,8%)
Italian
GDP
# of
active
companies in
Italy
# of
Italian
banks
New
lending
New mortgages
24
8,1%
17,3%
Cerved
organic revenue
growth
Cerved
total revenue
growth
Macroeconomic indicators
Cumulative percentage change of key indicators vs. Cerved 2011A-13A
Cerved’s performance
Consistent growth through the cycle: never a down year
(1)
Source: Company information, Bank of Italy, IMF, Infocamere, PwC “Market Vision - Credit information and credit collection markets in Italy” 2014 report (1)Corporate and retail
Resiliency
Cash flow
Growth Resiliency in the “Perfect Storm”
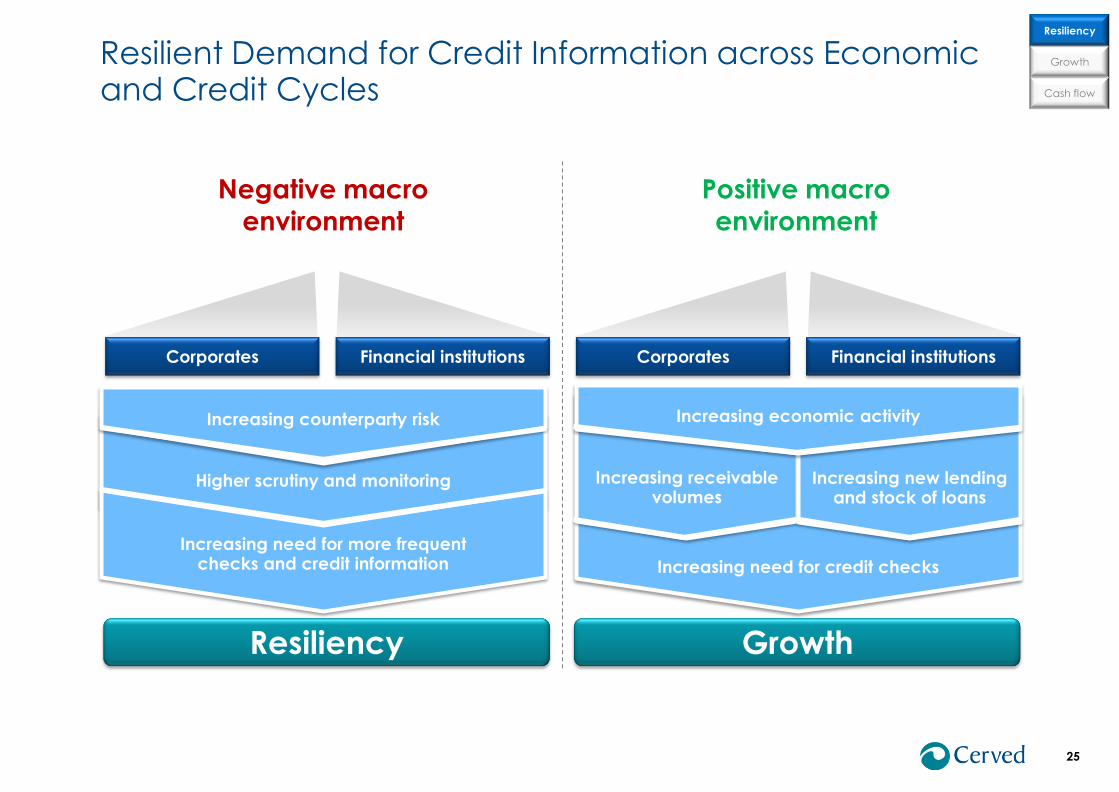
Resilient Demand for Credit Information across Economic and Credit Cycles
25
Increasing need for credit checks
Increasing receivable volumes
Increasing new lending and stock of loans
Increasing economic activity
Higher scrutiny and monitoring
Increasing need for more frequent checks and credit information
Resiliency Growth
Negative macro
environment
Positive macro
environment
Increasing counterparty risk
Corporates Financial institutions Corporates Financial institutions
Resiliency
Cash flow
Growth
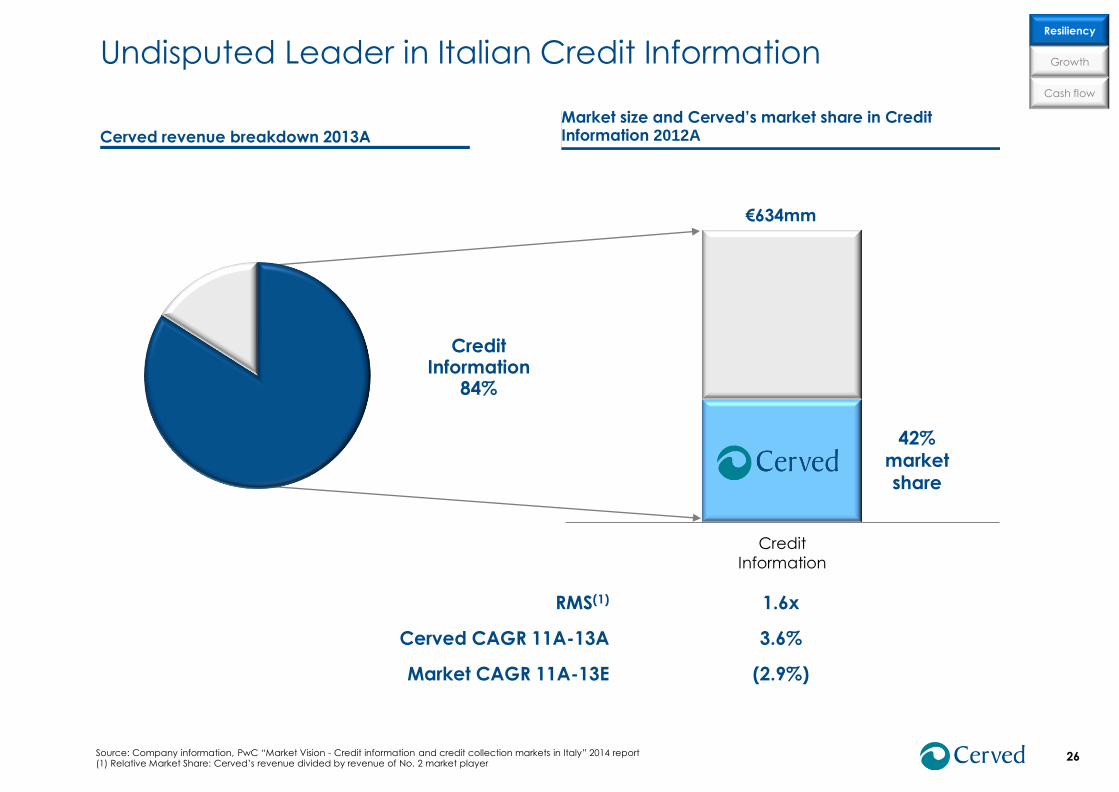
26
RMS(1)
Cerved CAGR 11A-13A
Market CAGR 11A-13E
Source: Company information, PwC “Market Vision - Credit information and credit collection markets in Italy” 2014 report (1) Relative Market Share: Cerved’s revenue divided by revenue of No. 2 market player
Credit
Information
1.6x
3.6%
(2.9%)
€634mm
Credit Information
84%
Market size and Cerved’s market share in Credit Information 2012A Cerved revenue breakdown 2013A
42% market share
Resiliency
Cash flow
Growth Undisputed Leader in Italian Credit Information
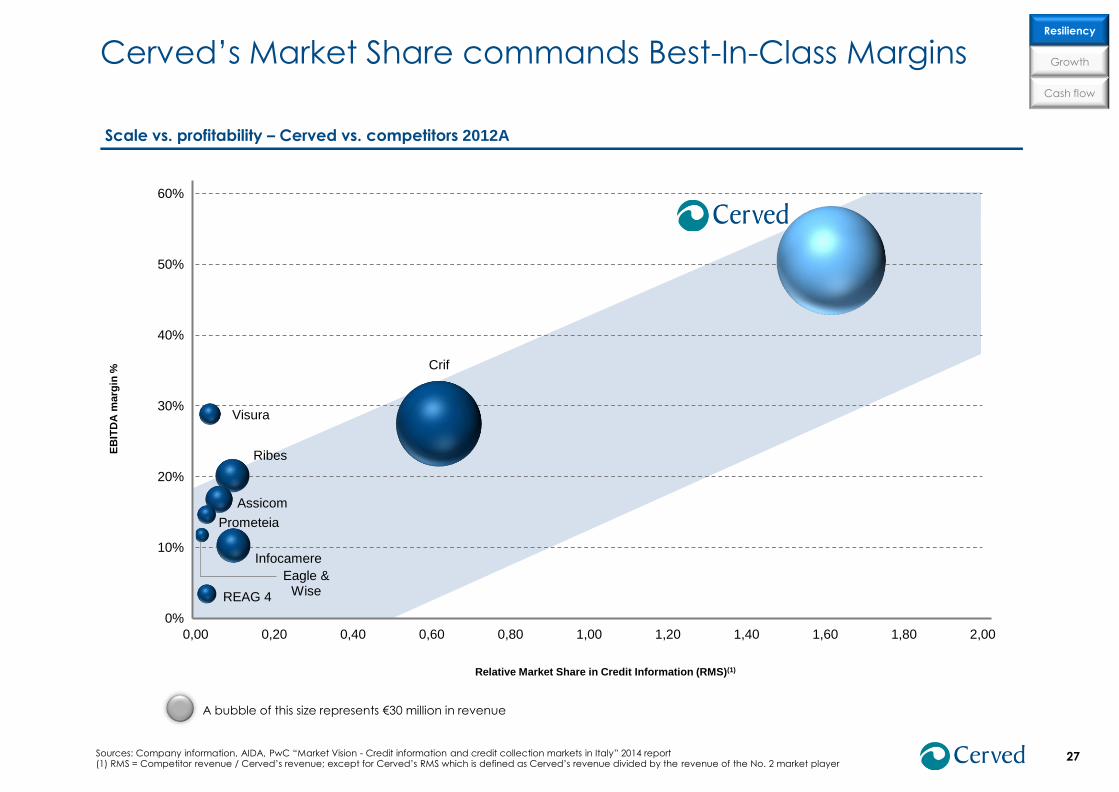
Crif
Infocamere
Ribes
Assicom
Visura
REAG 4
Prometeia
Eagle & Wise
0%
10%
20%
30%
40%
50%
60%
0,00 0,20 0,40 0,60 0,80 1,00 1,20 1,40 1,60 1,80 2,00
EB
ITD
A m
arg
in %
Relative Market Share in Credit Information (RMS)(1)
27 Sources: Company information, AIDA, PwC “Market Vision - Credit information and credit collection markets in Italy” 2014 report (1) RMS = Competitor revenue / Cerved’s revenue; except for Cerved’s RMS which is defined as Cerved’s revenue divided by the revenue of the No. 2 market player
Scale vs. profitability – Cerved vs. competitors 2012A
A bubble of this size represents €30 million in revenue
Resiliency
Cash flow
Growth Cerved’s Market Share commands Best-In-Class Margins
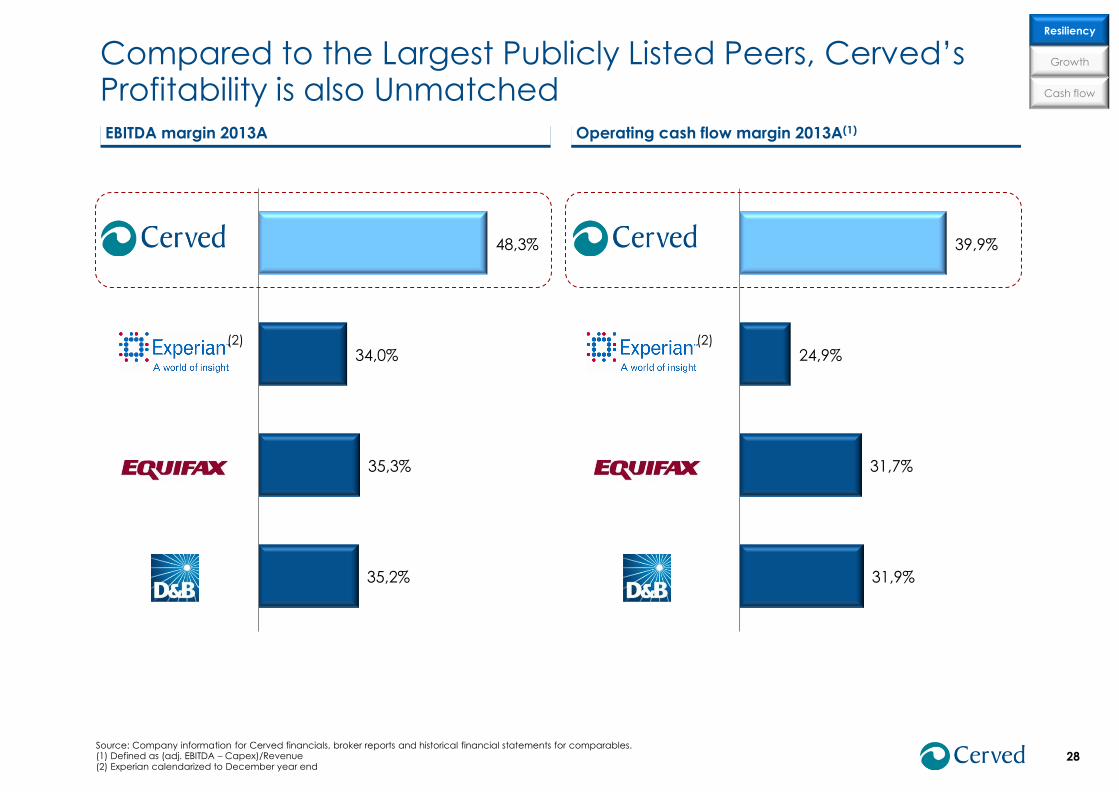
35,2%
35,3%
34,0%
48,3%
28
EBITDA margin 2013A Operating cash flow margin 2013A(1)
Source: Company information for Cerved financials, broker reports and historical financial statements for comparables. (1) Defined as (adj. EBITDA – Capex)/Revenue (2) Experian calendarized to December year end
31,9%
31,7%
24,9%
39,9%
(2) (2)
Resiliency
Cash flow
Growth Compared to the Largest Publicly Listed Peers, Cerved’s Profitability is also Unmatched
29
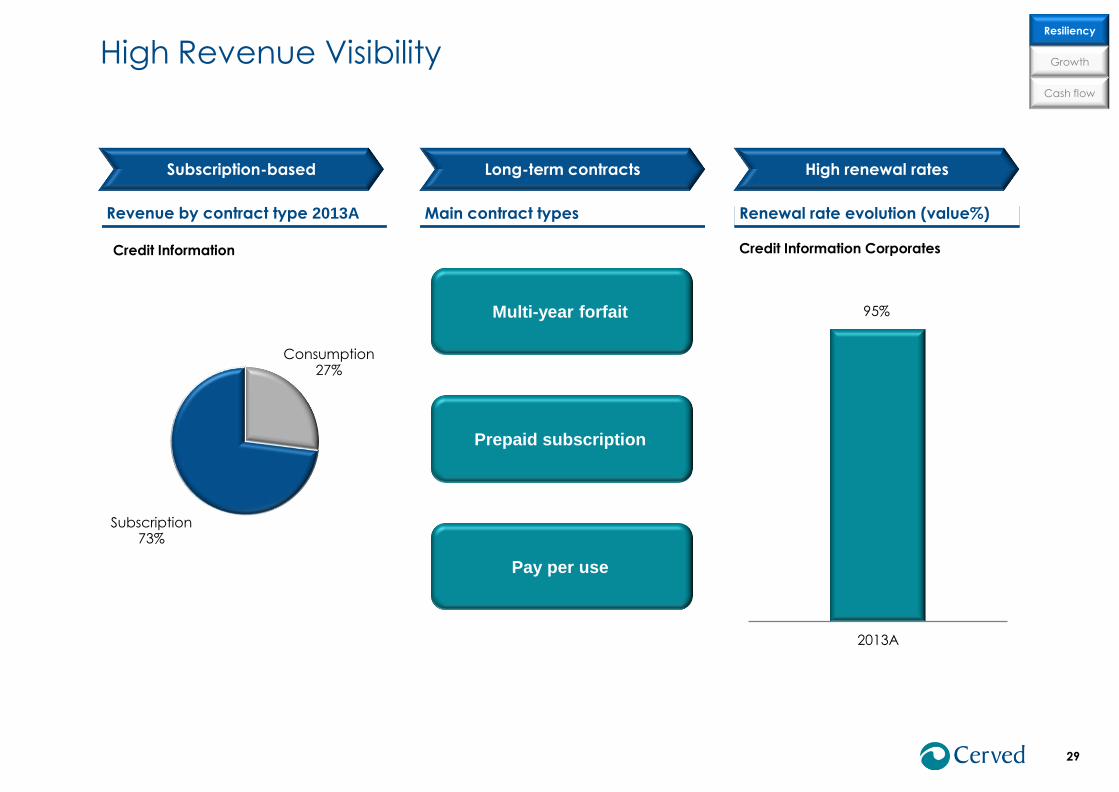
Subscription-based
Revenue by contract type 2013A
Consumption 27%
Subscription 73%
Credit Information
Long-term contracts
Main contract types
High renewal rates
95%
2013A
Credit Information Corporates
Renewal rate evolution (value%)
Multi-year forfait
Prepaid subscription
Pay per use
Resiliency
Cash flow
Growth High Revenue Visibility
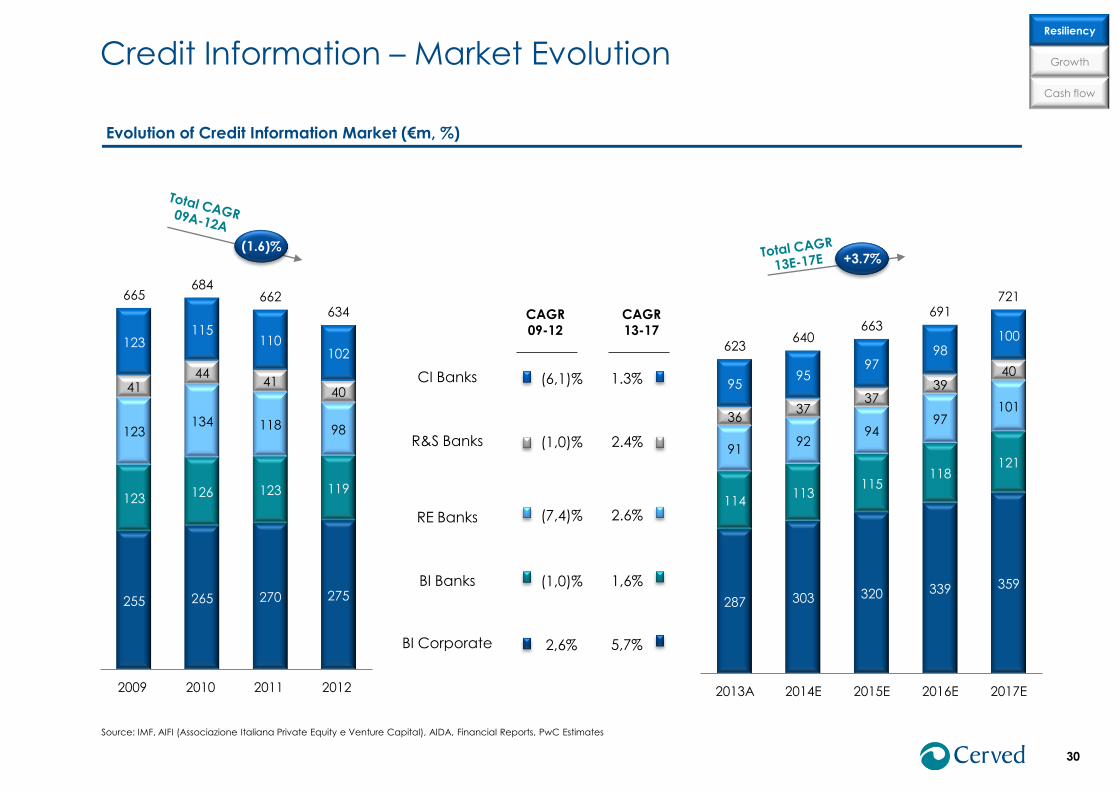
255 265 270 275
123 126 123 119
123 134 118 98
41 44
41 40
123 115
110 102
665 684
662 634
2009 2010 2011 2012
287 303 320 339 359
114 113
115 118
121 91
92 94
97 101
36 37
37 39
40 95
95 97
98 100
623 640
663 691
721
2013A 2014E 2015E 2016E 2017E
Credit Information – Market Evolution
30
Resiliency
Cash flow
Growth
Evolution of Credit Information Market (€m, %)
(6,1)%
(1,0)%
(7,4)%
(1,0)%
2,6%
CAGR
13-17
1.3%
2.4%
2.6%
1,6%
5,7%
+3.7%
CAGR
09-12
Source: IMF, AIFI (Associazione Italiana Private Equity e Venture Capital), AIDA, Financial Reports, PwC Estimates
CI Banks
R&S Banks
RE Banks
BI Banks
BI Corporate
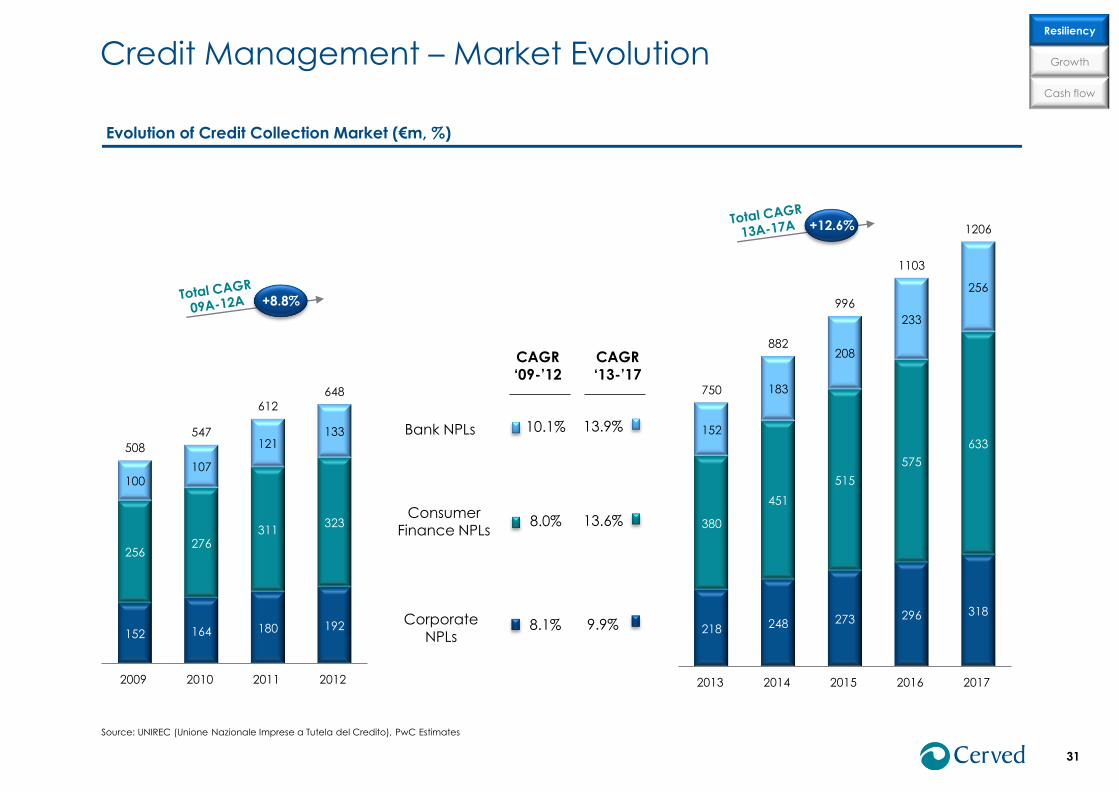
Credit Management – Market Evolution
31
Resiliency
Cash flow
Growth
Evolution of Credit Collection Market (€m, %)
152 164 180 192
256 276
311 323
100 107
121 133
508
547
612
648
2009 2010 2011 2012
Source: UNIREC (Unione Nazionale Imprese a Tutela del Credito), PwC Estimates
218 248 273 296 318
380
451
515
575
633 152
183
208
233
256
750
882
996
1103
1206
2013 2014 2015 2016 2017
+8.8%
+12.6%
10.1%
8.0%
8.1%
CAGR ‘13-’17
13.9%
13.6%
9.9%
CAGR ‘09-’12
Bank NPLs
Consumer Finance NPLs
Corporate NPLs
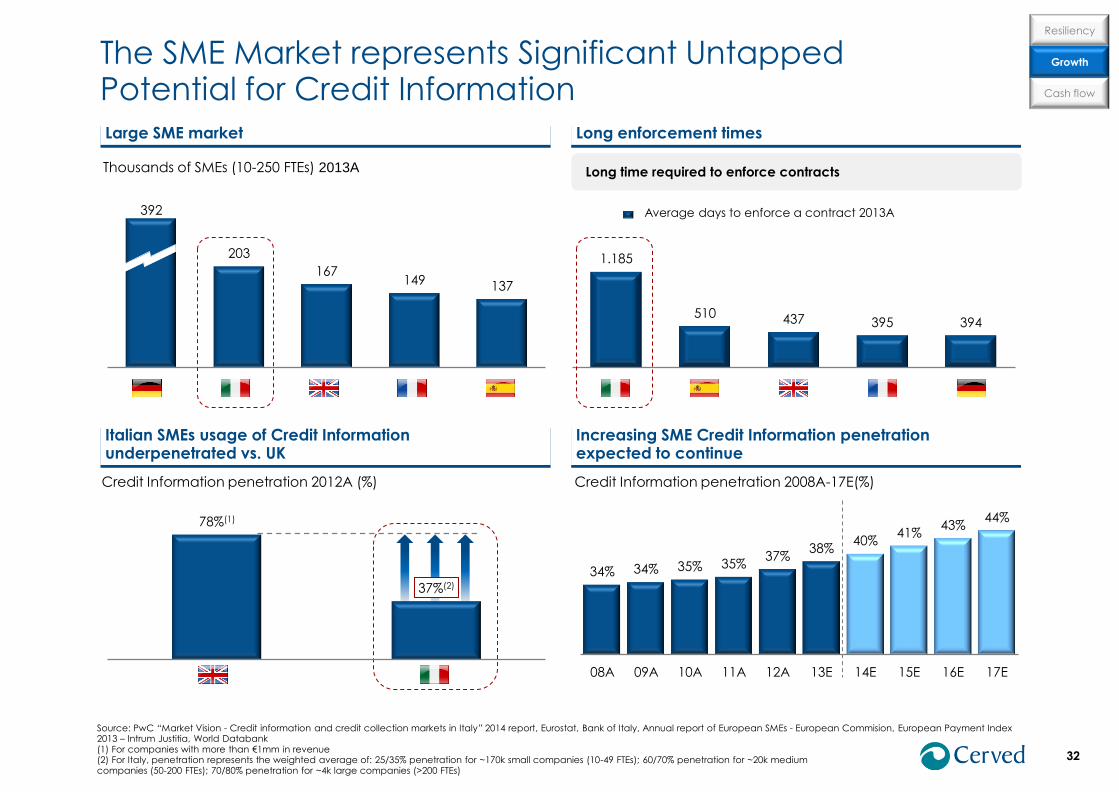
Increasing SME Credit Information penetration expected to continue
1.185
510 437 395 394
The SME Market represents Significant Untapped Potential for Credit Information
Large SME market
Thousands of SMEs (10-250 FTEs) 2013A
Long enforcement times
Long time required to enforce contracts
34% 34% 35% 35% 37%
38% 40%
41% 43%
44%
08A 09A 10A 11A 12A 13E 14E 15E 16E 17E
Source: PwC “Market Vision - Credit information and credit collection markets in Italy” 2014 report, Eurostat, Bank of Italy, Annual report of European SMEs - European Commision, European Payment Index 2013 – Intrum Justitia, World Databank (1) For companies with more than €1mm in revenue (2) For Italy, penetration represents the weighted average of: 25/35% penetration for ~170k small companies (10-49 FTEs); 60/70% penetration for ~20k medium companies (50-200 FTEs); 70/80% penetration for ~4k large companies (>200 FTEs)
392
203
167 149 137
Credit Information penetration 2012A (%) Credit Information penetration 2008A-17E(%)
32
Italian SMEs usage of Credit Information underpenetrated vs. UK
Average days to enforce a contract 2013A
Resiliency
Cash flow
Growth
78%(1)
37%(2)
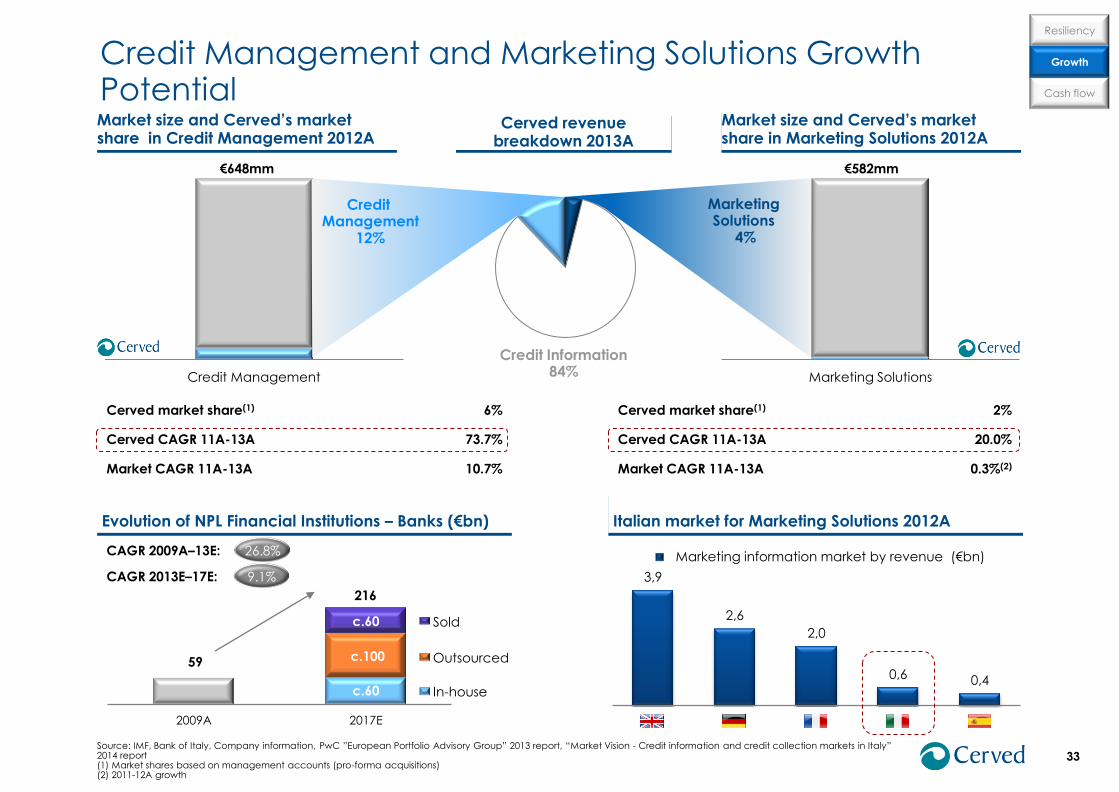
Marketing Solutions Credit Management
3,9
2,6
2,0
0,6 0,4
€648mm
Credit Information 84%
Cerved revenue breakdown 2013A
Marketing Solutions
4%
Credit Management
12%
Credit Management and Marketing Solutions Growth Potential
33
Market size and Cerved’s market share in Credit Management 2012A
Cerved market share(1)
Cerved CAGR 11A-13A
Market CAGR 11A-13A
6%
73.7%
10.7%
€582mm
Italian market for Marketing Solutions 2012A
Source: IMF, Bank of Italy, Company information, PwC ”European Portfolio Advisory Group” 2013 report, “Market Vision - Credit information and credit collection markets in Italy” 2014 report (1) Market shares based on management accounts (pro-forma acquisitions) (2) 2011-12A growth
Market size and Cerved’s market share in Marketing Solutions 2012A
2%
20.0%
0.3%(2)
Cerved market share(1)
Cerved CAGR 11A-13A
Market CAGR 11A-13A
Evolution of NPL Financial Institutions – Banks (€bn)
59
c.60
c.100
c.60
2009A 2017E
216
26.8%
9.1%
CAGR 2009A–13E:
CAGR 2013E–17E:
In-house
Outsourced
Sold
Resiliency
Cash flow
Growth
Marketing information market by revenue (€bn)
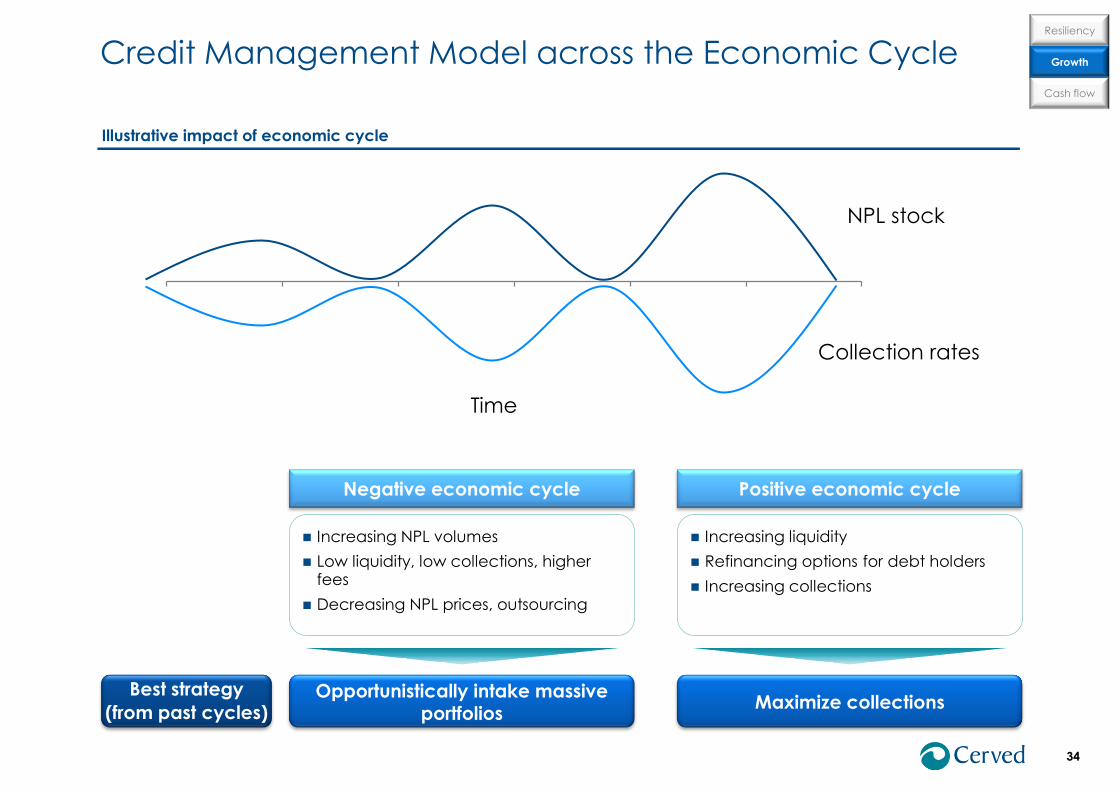
Increasing NPL volumes
Low liquidity, low collections, higher fees
Decreasing NPL prices, outsourcing
Credit Management Model across the Economic Cycle
34
Negative economic cycle
Opportunistically intake massive portfolios
Maximize collections Best strategy
(from past cycles)
Positive economic cycle
Increasing liquidity
Refinancing options for debt holders
Increasing collections
Resiliency
Cash flow
Growth
Illustrative impact of economic cycle
NPL stock
Collection rates
Time
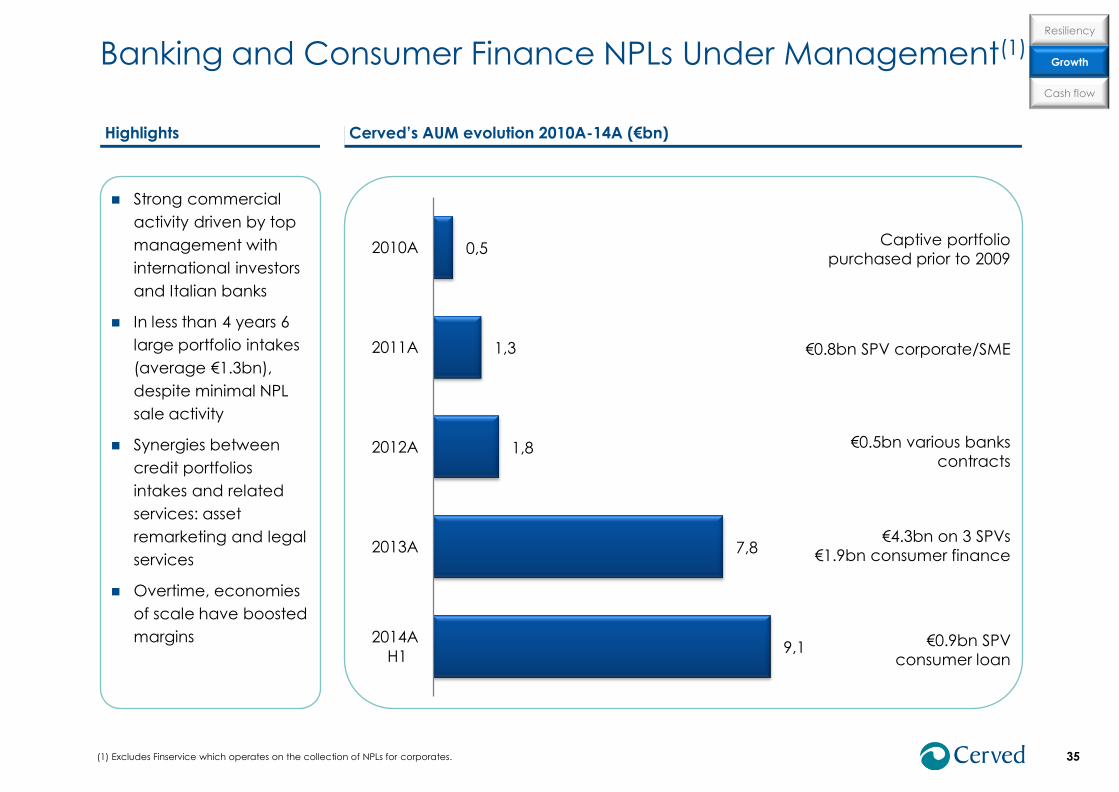
35
Highlights
Strong commercial
activity driven by top
management with
international investors
and Italian banks
In less than 4 years 6
large portfolio intakes
(average €1.3bn),
despite minimal NPL
sale activity
Synergies between
credit portfolios
intakes and related
services: asset
remarketing and legal
services
Overtime, economies
of scale have boosted
margins 9,1
7,8
1,8
1,3
0,5
2014A
H1
2013A
2012A
2011A
2010A Captive portfolio
purchased prior to 2009
€0.8bn SPV corporate/SME
€0.5bn various banks
contracts
€4.3bn on 3 SPVs
€1.9bn consumer finance
€0.9bn SPV
consumer loan
Cerved’s AUM evolution 2010A-14A (€bn)
Banking and Consumer Finance NPLs Under Management(1) Resiliency
Cash flow
Growth
(1) Excludes Finservice which operates on the collection of NPLs for corporates.
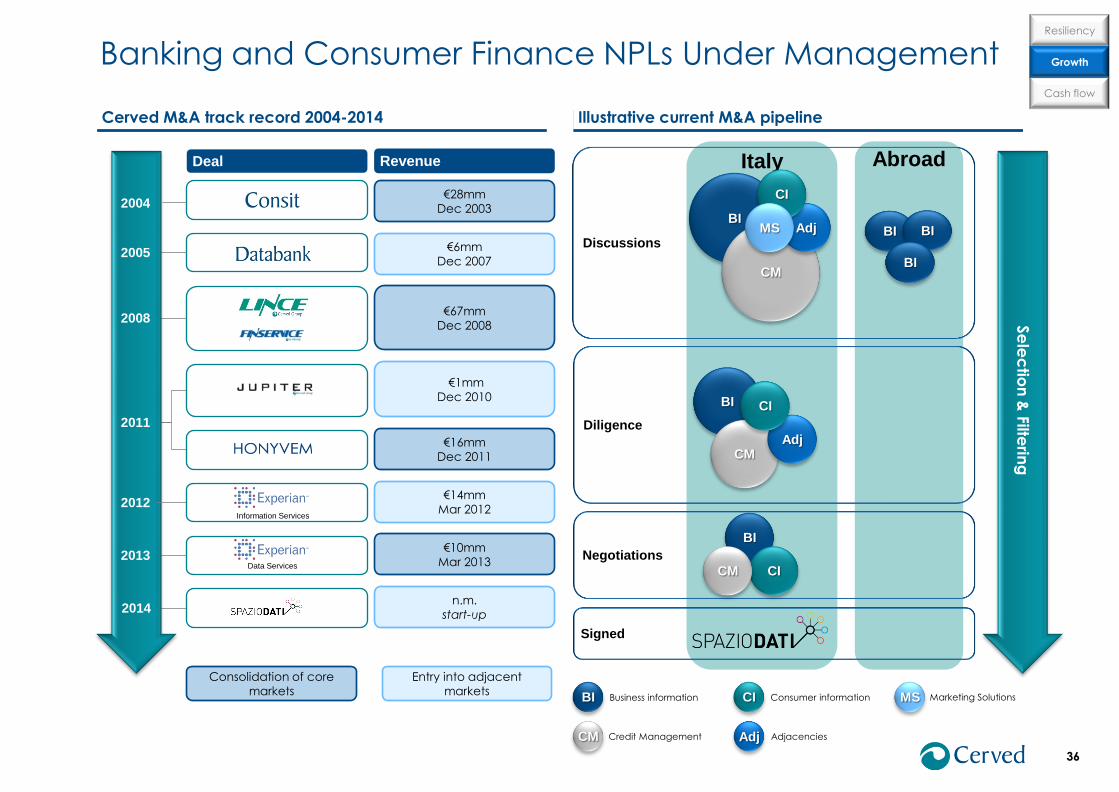
Consolidation of core
markets
36
Deal Revenue
€28mm
Dec 2003
€6mm
Dec 2007
€67mm
Dec 2008
€16mm
Dec 2011
€10mm
Mar 2013
n.m.
start-up
€1mm
Dec 2010
Data Services
Cerved M&A track record 2004-2014
2004
2005
2008
€14mm
Mar 2012 Information Services
2012
2011
2013
2014
Abroad Italy
Illustrative current M&A pipeline
Discussions
Diligence
Signed
Negotiations
BI
CM
BI
CM
BI
Adj
Adj
CI
CI
CI
MS
BI Business information CI Consumer information MS Marketing Solutions
CM Credit Management Adj Adjacencies
CM
Resiliency
Cash flow
Growth
BI BI
BI
Entry into adjacent
markets
Banking and Consumer Finance NPLs Under Management Se
lec
tion
& F
ilterin
g
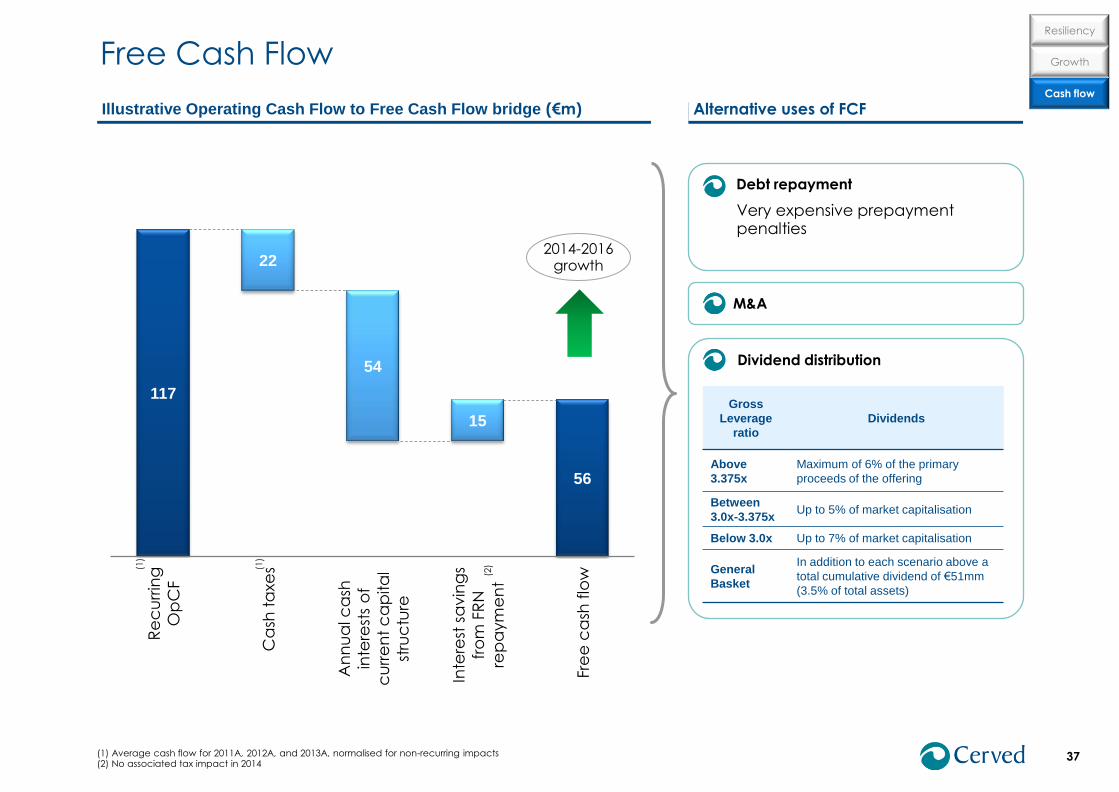
Free Cash Flow
Debt repayment
Very expensive prepayment penalties
Dividend distribution
37
Illustrative Operating Cash Flow to Free Cash Flow bridge (€m)
117
56
22
54
15
Re
cu
rrin
g
Op
CF
Ca
sh t
axe
s
An
nu
al c
ash
inte
rest
s o
f
cu
rre
nt
ca
pita
l
stru
ctu
re
Inte
rest
sa
vin
gs
fro
m F
RN
rep
aym
en
t
Fre
e c
ash
flo
w
Alternative uses of FCF
2014-2016 growth
Gross
Leverage
ratio
Dividends
Above
3.375x
Maximum of 6% of the primary
proceeds of the offering
Between
3.0x-3.375x Up to 5% of market capitalisation
Below 3.0x Up to 7% of market capitalisation
General
Basket
In addition to each scenario above a
total cumulative dividend of €51mm
(3.5% of total assets)
(1) Average cash flow for 2011A, 2012A, and 2013A, normalised for non-recurring impacts (2) No associated tax impact in 2014
(1)
(1)
M&A
(2)
Resiliency
Cash flow
Growth
Table of Contents
38
Investment Case 3
Overview 1
Appendices 4
Current Trading 2
Basis for Financial Information
39
Please note that Cerved Information Solutions SpA (“CIS SpA”) was
incorporated on 14 March 2014 and holds a 100% stake in Cerved Group SpA
(“CG SpA”) since 28 March 2014
In order to provide the market with complete financial information to reflect
the CIS SpA consolidated business operations through the entire first half of
2014, certain financial data contained in this presentation represents the
aggregate of (i.) CG SpA for the period between 1 January 2014 and 30 June
2014, and (ii.) CIS SpA for the period between 14 March 2014 and 30 June 2014
On a consolidated basis, there are minor differences between the accounts of
CIS SpA and CG SpA, mainly related to costs related to CIS SpA’s status as a
listed company, and the costs incurred to carry out the IPO of CIS SpA
Summary of Profit and Loss
40
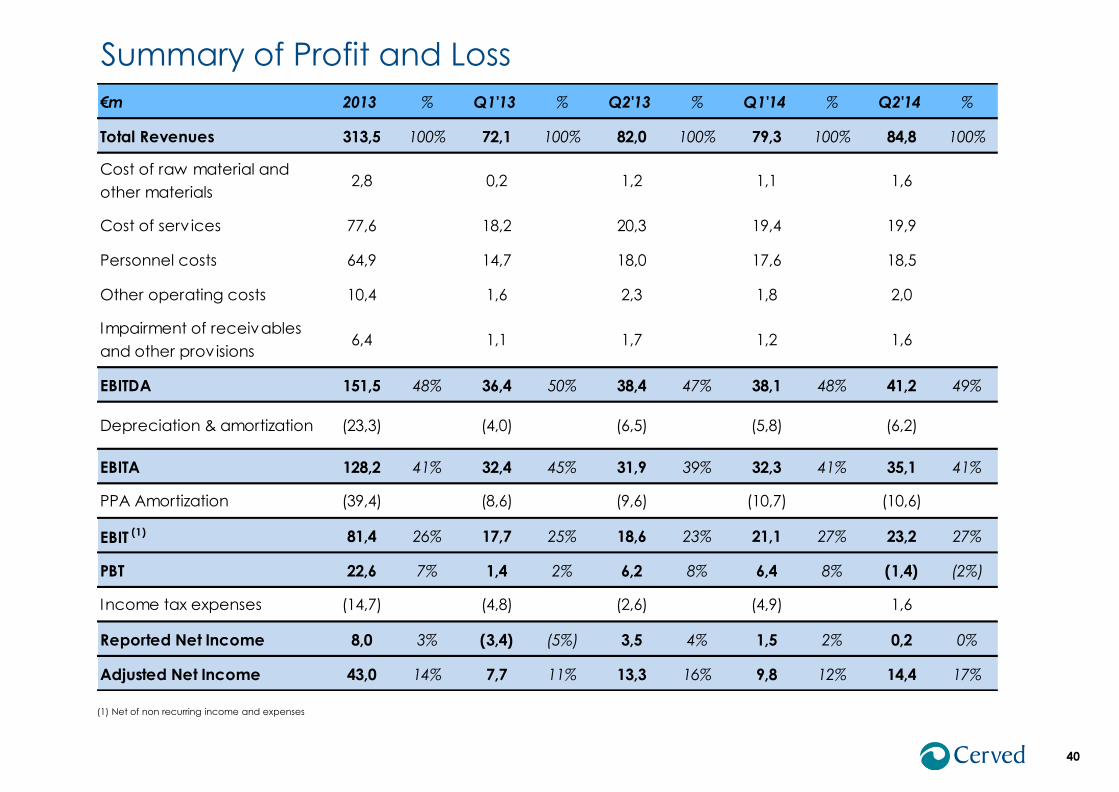
€m 2013 % Q1'13 % Q2'13 % Q1'14 % Q2'14 %
Total Revenues 313,5 100% 72,1 100% 82,0 100% 79,3 100% 84,8 100%
Cost of raw material and
other materials2,8 0,2 1,2 1,1 1,6
Cost of serv ices 77,6 18,2 20,3 19,4 19,9
Personnel costs 64,9 14,7 18,0 17,6 18,5
Other operating costs 10,4 1,6 2,3 1,8 2,0
Impairment of receivables
and other provisions6,4 1,1 1,7 1,2 1,6
EBITDA 151,5 48% 36,4 50% 38,4 47% 38,1 48% 41,2 49%
Depreciation & amortization (23,3) (4,0) (6,5) (5,8) (6,2)
EBITA 128,2 41% 32,4 45% 31,9 39% 32,3 41% 35,1 41%
PPA Amortization (39,4) (8,6) (9,6) (10,7) (10,6)
EBIT (1) 81,4 26% 17,7 25% 18,6 23% 21,1 27% 23,2 27%
PBT 22,6 7% 1,4 2% 6,2 8% 6,4 8% (1,4) (2%)
Income tax expenses (14,7) (4,8) (2,6) (4,9) 1,6
Reported Net Income 8,0 3% (3,4) (5%) 3,5 4% 1,5 2% 0,2 0%
Adjusted Net Income 43,0 14% 7,7 11% 13,3 16% 9,8 12% 14,4 17%
(1) Net of non recurring income and expenses
41
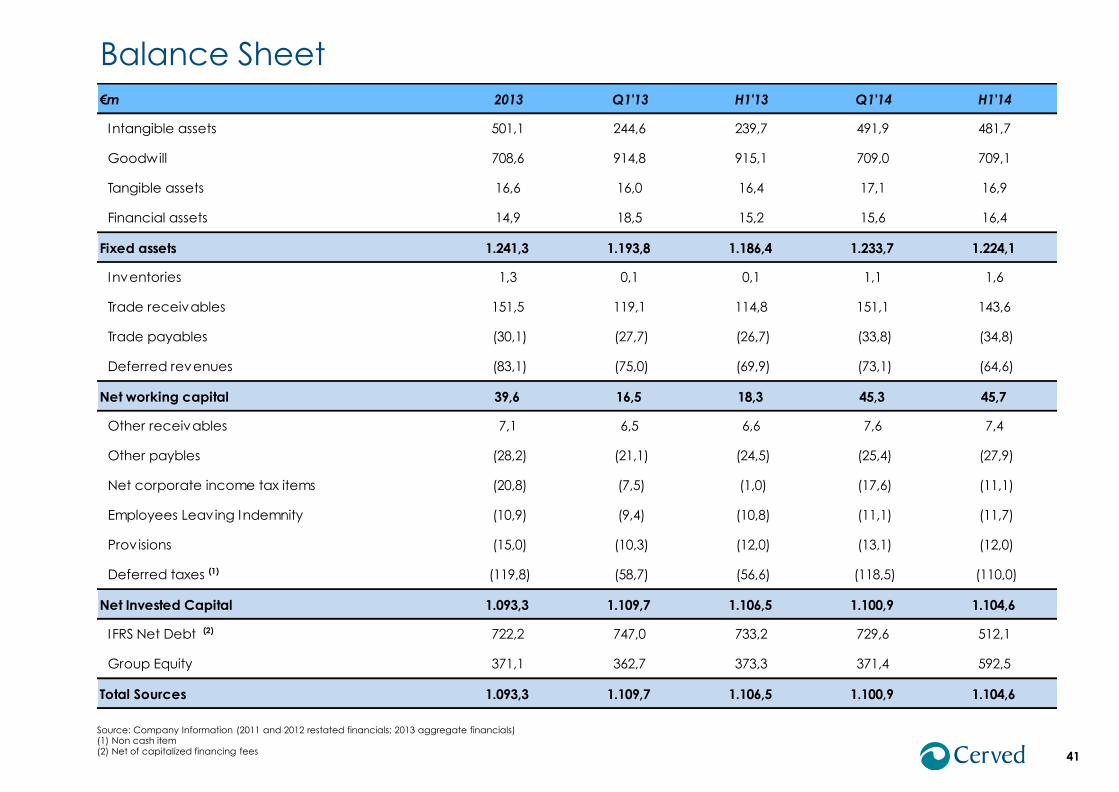
Source: Company Information (2011 and 2012 restated financials; 2013 aggregate financials) (1) Non cash item (2) Net of capitalized financing fees
Balance Sheet
€m 2013 Q1'13 H1'13 Q1'14 H1'14
Intangible assets 501,1 244,6 239,7 491,9 481,7
Goodwill 708,6 914,8 915,1 709,0 709,1
Tangible assets 16,6 16,0 16,4 17,1 16,9
Financial assets 14,9 18,5 15,2 15,6 16,4
Fixed assets 1.241,3 1.193,8 1.186,4 1.233,7 1.224,1
Inventories 1,3 0,1 0,1 1,1 1,6
Trade receivables 151,5 119,1 114,8 151,1 143,6
Trade payables (30,1) (27,7) (26,7) (33,8) (34,8)
Deferred revenues (83,1) (75,0) (69,9) (73,1) (64,6)
Net working capital 39,6 16,5 18,3 45,3 45,7
Other receivables 7,1 6,5 6,6 7,6 7,4
Other paybles (28,2) (21,1) (24,5) (25,4) (27,9)
Net corporate income tax items (20,8) (7,5) (1,0) (17,6) (11,1)
Employees Leaving Indemnity (10,9) (9,4) (10,8) (11,1) (11,7)
Provisions (15,0) (10,3) (12,0) (13,1) (12,0)
Deferred taxes (1) (119,8) (58,7) (56,6) (118,5) (110,0)
Net Invested Capital 1.093,3 1.109,7 1.106,5 1.100,9 1.104,6
IFRS Net Debt (2) 722,2 747,0 733,2 729,6 512,1
Group Equity 371,1 362,7 373,3 371,4 592,5
Total Sources 1.093,3 1.109,7 1.106,5 1.100,9 1.104,6
42
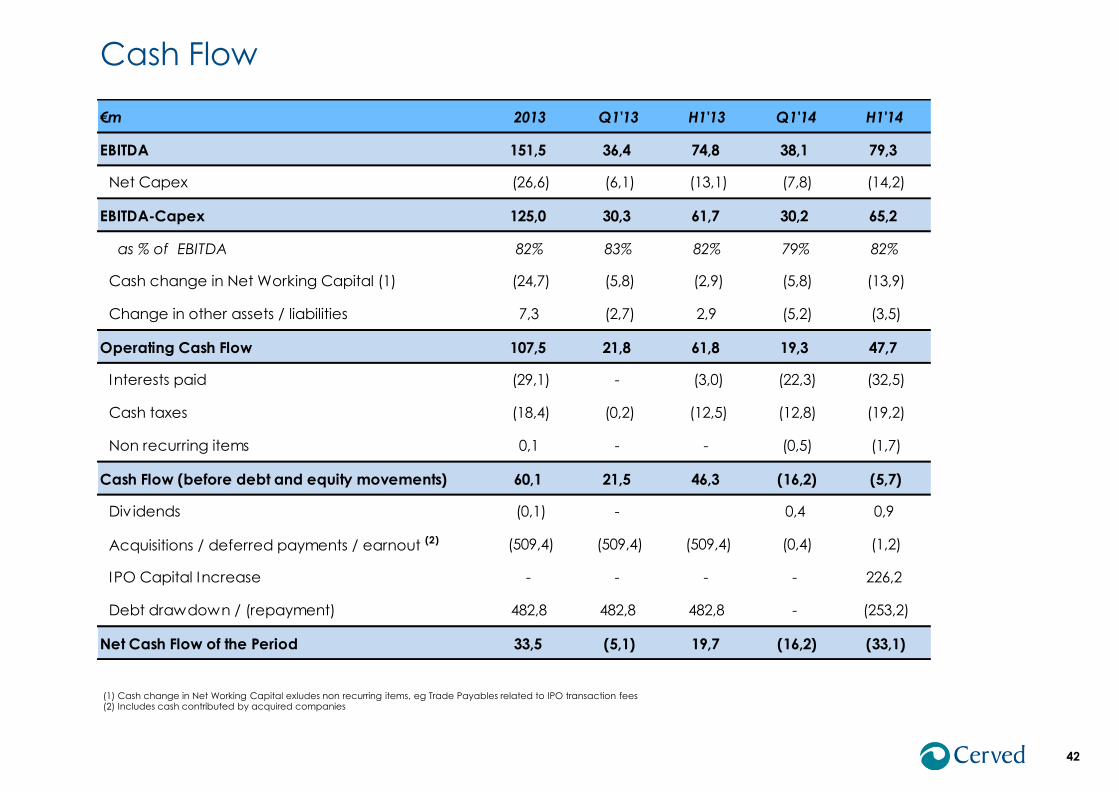
(1) (1) Cash change in Net Working Capital exludes non recurring items, eg Trade Payables related to IPO transaction fees (2) (2) Includes cash contributed by acquired companies
Cash Flow
€m 2013 Q1'13 H1'13 Q1'14 H1'14
EBITDA 151,5 36,4 74,8 38,1 79,3
Net Capex (26,6) (6,1) (13,1) (7,8) (14,2)
EBITDA-Capex 125,0 30,3 61,7 30,2 65,2
as % of EBITDA 82% 83% 82% 79% 82%
Cash change in Net Working Capital (1) (24,7) (5,8) (2,9) (5,8) (13,9)
Change in other assets / liabilities 7,3 (2,7) 2,9 (5,2) (3,5)
Operating Cash Flow 107,5 21,8 61,8 19,3 47,7
Interests paid (29,1) - (3,0) (22,3) (32,5)
Cash taxes (18,4) (0,2) (12,5) (12,8) (19,2)
Non recurring items 0,1 - - (0,5) (1,7)
Cash Flow (before debt and equity movements) 60,1 21,5 46,3 (16,2) (5,7)
Div idends (0,1) - 0,4 0,9
Acquisitions / deferred payments / earnout (2) (509,4) (509,4) (509,4) (0,4) (1,2)
IPO Capital Increase - - - - 226,2
Debt drawdown / (repayment) 482,8 482,8 482,8 - (253,2)
Net Cash Flow of the Period 33,5 (5,1) 19,7 (16,2) (33,1)