investor presentation meet/100209_20130712.pdf · ltm q1 fy 14 revenues / 5-year cagr $7.64 billion...
TRANSCRIPT

Investor Presentation
This presentation includes statements which may constitute forward-looking
statements made pursuant to the safe harbor provisions of the Private Securities
Litigation Reform Act of 1995. Although Infosys believes that the expectations
contained in such forward-looking statements are reasonable, it can give no
assurance that such expectations will prove correct. These statements may involve
risks and uncertainties that could cause actual results to differ materially from the
expected results. Such risks include, but are not limited to, the risk factors described
in Infosys' Registration Statement on Form F-3, a prospectus supplement to such
Registration Statement and in other reports and periodic filings made from time to
time with the Securities and Exchange Commission.
Safe Harbor
2

• An overview
• Next Generation Business model
• Market opportunities
• Competitive situation
• Strategy and approach to market
• Investments
• Financials
• Challenges
Highlights
3

LTM Q1 FY 14 Revenues / 5-year CAGR $7.64 billion / 12%
LTM Q1 FY 14 Net Income / 5-year CAGR $1.73 billion / 8%
Employees (Jun-13) 157,263 from 101 nationalities
Market cap (Jun-13)* $23.7 billion
Global Presence 73 Sales Offices 90 Global Development Centers Operating in 35 countries
Business Model Next Generation business model combining best of Consulting and Global Delivery
An overview
* As of last day of the quarter based on closing NYSE price
4

Next Generation Business Model
1996
2001
2008
1981
2012 • New Engagement Models
People | Organization | Infrastructure | Process | Quality
Infosys Global Delivery Model
5
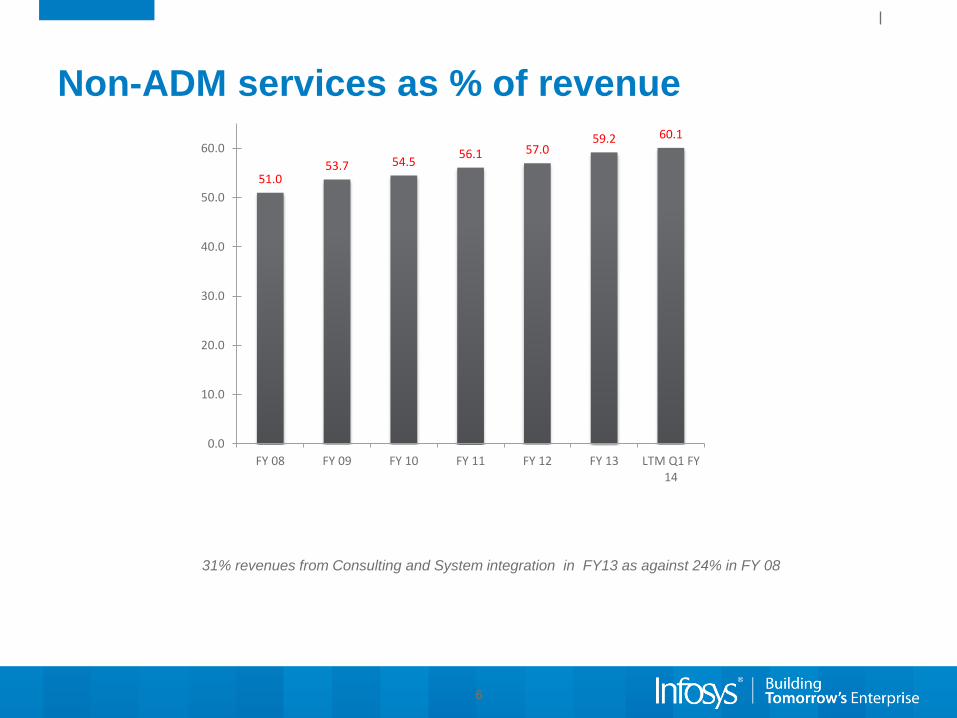
Non-ADM services as % of revenue
31% revenues from Consulting and System integration in FY13 as against 24% in FY 08
6
51.0 53.7 54.5
56.1 57.0 59.2 60.1
0.0
10.0
20.0
30.0
40.0
50.0
60.0
FY 08 FY 09 FY 10 FY 11 FY 12 FY 13 LTM Q1 FY14

Resulting in New Clients and Increasing Revenue Per Client
325
466
Execution excellence resulted in high share of repeat business (98% in FY 13)
* revenue per client has decreased due to client additions resulting from Lodestone acquisition
7
272
384
35
41
12
26
6
15
0
50
100
150
200
250
300
350
400
450
500
LTM Q1 FY 09 LTM Q1 FY 14
Nu
mb
er
of
clie
nts
co
ntr
ibu
tin
g >$
1m
m in
LTM
re
ven
ue
s
Large, Growing Client Relationships
1-20 mn 20-50 mn 50-100 mn 100 mn+
7.8 8.1 8.4 9.7 10.1
9.3 9.1
0
2
4
6
8
10
12
FY 08 FY 09 FY 10 FY 11 FY 12 FY 13* LTM Q1FY 14*
Increasing revenue per client ($ mn)

Market Opportunities
• Asia – New “center of gravity” for the world
• “Geography becomes History” with reduced telecommunication costs
• Technology – the supreme enabler
Global Mega Trends
• Differentiated access to highly educated, cost-competitive
human capital
• Leading the Next-Generation Business Model and
investing in innovations and business solutions
• Redefining scalability with modular global infrastructure
Infosys – Transformation Partner
8
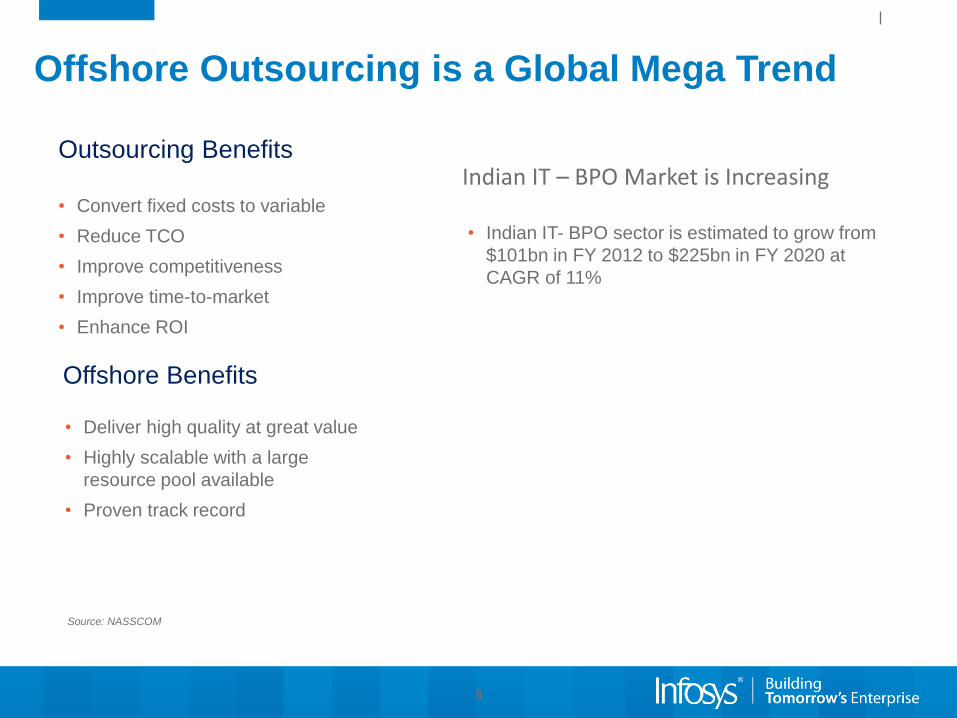
Offshore Outsourcing is a Global Mega Trend
• Convert fixed costs to variable
• Reduce TCO
• Improve competitiveness
• Improve time-to-market
• Enhance ROI
Outsourcing Benefits
• Deliver high quality at great value
• Highly scalable with a large
resource pool available
• Proven track record
Offshore Benefits
~$31bn
~$60bn
Source: NASSCOM
Indian IT – BPO Market is Increasing
• Indian IT- BPO sector is estimated to grow from
$101bn in FY 2012 to $225bn in FY 2020 at
CAGR of 11%
9

High Quality Delivery and Offerings
• Established track record of exceptional quality
• Expanded offerings that encompass the entire value chain
Abundant Skilled Resources
• 2.5 million English speaking graduate pool 2
• 1,478 engineering colleges with a capacity to produce over 500,000
engineering graduates annually 3
Established Industry
• Services market (including BPO) estimated at $50 billion in 2008,
exports to grow to $60 billion by 2010 1
• Offshore „home‟ for virtually all the leading technology companies
Strong Government Support
• “Tax Holiday” schemes
• Supportive Government policy environment
Significant Benefits
• Substantial cost savings associated with moving offshore
• Large intangible benefits such as reduced time to market
Competitive Situation
India – Uniquely positioned
Source:
1. NASSCOM Strategic Review 2007
(includes engineering services and software products)
2. NASSCOM Strategic Review 2004
3. Annual report 2005-06, HRD Ministry, Government of India
10
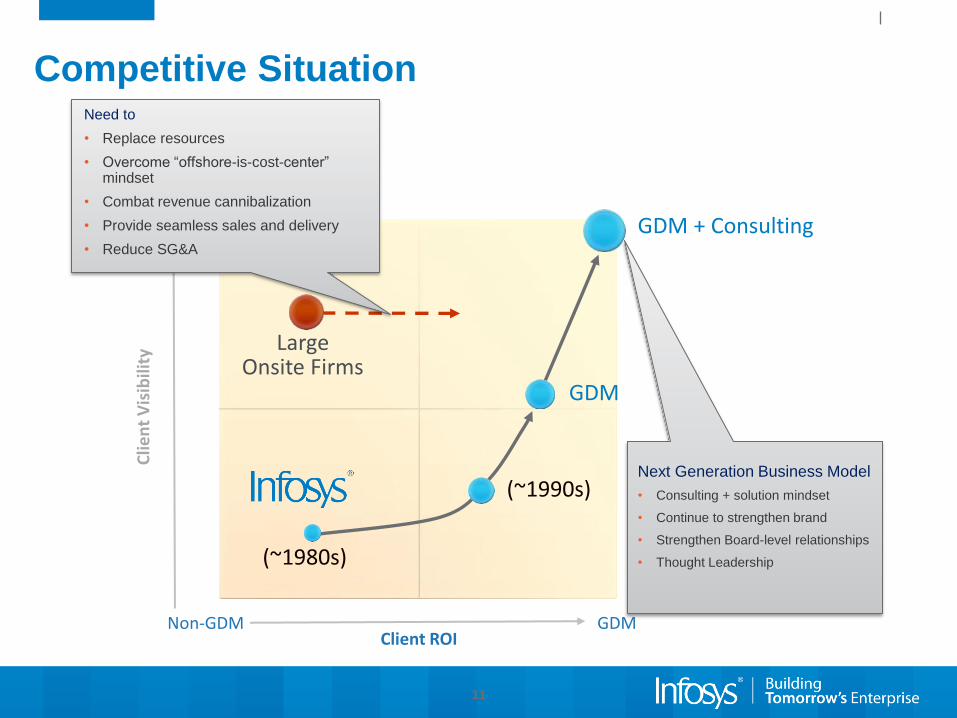
Competitive Situation
Client ROI
Clie
nt
Vis
ibili
ty
Non-GDM GDM
GDM + Consulting
Large Onsite Firms
GDM
(~1980s)
(~1990s) Next Generation Business Model
• Consulting + solution mindset
• Continue to strengthen brand
• Strengthen Board-level relationships
• Thought Leadership
Need to
• Replace resources
• Overcome “offshore-is-cost-center” mindset
• Combat revenue cannibalization
• Provide seamless sales and delivery
• Reduce SG&A
11

Strategy
• To have superior revenue growth and margins relative to the industry
• Have end-to-end service capability, deep vertical penetration, broad geographical
footprint
• Increase revenue productivity and build long-term scalability by creating industry
specific solutions, platforms, IP etc.
Approach to market
• „One Infy‟
• Cross-selling of services
• Vertical focus to create industry specific competencies
• Investing in the business
Strategy and approach to market
12

• Industry wide preferred employer
– Recognized as one of the „Achievers 50 Most Engaged Workplaces™‟ In The United
States
– The most preferred company to work for in India by Business Today magazine in 2010
• Able to simultaneously evaluate 10,000+ candidates across 7 cities in India
• Global hiring
– US, UK, China and Eastern Europe
– Supplementing with experienced local hires
• Tapping non-traditional labor pool
– Employing non-engineers for infrastructure management, testing
and BPO
– Proactive assistance provided to India‟s educational system to produce engineers with
high quality software skills
Talent Management : Hiring the Best
13

• Learning support to employees
towards development and
career progression, which
improves long-term retention
and solidifies culture
• Currently able to train 13,500
entry-level recruits at the
Mysore campus
simultaneously
Developing and Retaining the Best
Leadership Development
Leadership Training
Advanced Training
Managerial Training
Client-facing Training
Domain Training
Role-Based Development
Soft Skills Training Quality Training
On-the-job Training
Foundation Training
Role-Based Development Induction
14

2011 2012 2013 LTM Q1 FY 14
Sales & Marketing expenses ($ mn) 332 366 373 390
Sales & Marketing employees 1,001 1,132 1,263 1,295
Losses in Subsidiaries ($ mn)
Infosys Brazil (1.9) (3.6) (3.1) (5.3)
Infosys Technologies(Shanghai) Co. Ltd. (1.1) (2.9) (2.8)
Investing in front-end, services and subsidiaries
15

• 90 Global Development Centers (“GDC”)*
– 32 in India
– 58 in North America, Europe and Asia-Pacific
– 31.9 million sq. feet* of total area to house 155,045 employees
– 13 million sq. feet* under construction to house 52,126 employees
• Ability to rapidly scale new engagements
• Flexibility to distribute engagements and capacity across centers worldwide
• Disaster recovery / business continuity capabilities
Robust, Flexible, Modular Global Infrastructure
*As of June 30, 2013
16

Building World Class Systems and Processes
Note: EFQM – European Foundation for Quality Management
CMMI – Capability Maturity Model PRIDE – Process Repository at Infosys for Driving Excellence
Technology-driven Scalable
Business Processes
Award-winning Knowledge
Management Processes
• PRIDE: Infosys process repository
• 2008 Asian Most Admired Knowledge Enterprise (MAKE) award
Quality Par Excellence
• Benchmarked to Global Standards
• Deployment of improvement techniques
17

Superior Revenue Growth
928
1991
18
$0
$500,000,000
$1,000,000,000
$1,500,000,000
$2,000,000,000
$2,500,000,000
Q1 Q2 Q3 Q4 Q1 Q2 Q3 Q4 Q1 Q2 Q3 Q4 Q1 Q2 Q3 Q4 Q1 Q2 Q3 Q4 Q1 Q2 Q3 Q4 Q1
FY08 FY09 FY10 FY11 FY12 FY13 FY14
Qu
arte
rly
Re
ven
ue
(U
S$)
Revenue Progression

Sustained, Industry-leading Profitability
418
263
19
24.7%
23.5%
0.0%
5.0%
10.0%
15.0%
20.0%
25.0%
30.0%
35.0%
$0
$50,000,000
$100,000,000
$150,000,000
$200,000,000
$250,000,000
$300,000,000
$350,000,000
$400,000,000
$450,000,000
$500,000,000
Q1 Q2 Q3 Q4 Q1 Q2 Q3 Q4 Q1 Q2 Q3 Q4 Q1 Q2 Q3 Q4 Q1 Q2 Q3 Q4 Q1 Q2 Q3 Q4 Q1
FY08 FY09 FY10 FY11 FY12 FY13 FY14
Op
era
tin
g In
com
e in
%
Qu
arte
rly
Ne
t In
com
e (
US$
)
Flexible cost structure helps Infosys deliver industry-leading margins

• Highly liquid (cash & cash equivalents stand at $4.1bn)*
• Zero debt
• High quality receivables (94% aging less than 60 days)*
• ROCE of 34.6%, ROIC of 54.2% for Q1 FY 14
• Dividends up to 30% of annual post-tax profits
Strong and Liquid Balance Sheet
*As of June 30 2013
20

• Economic uncertainty
• Regulatory changes
• Currency Volatility
• Resource availability
• Ability to expand addressable market
• Wage inflation
Challenges
21

© 2013 Infosys Limited, Bangalore, India. All Rights Reserved. Infosys believes the information in this document is accurate as of its publication date; such information is subject to change without notice. Infosys acknowledges the proprietary rights of other companies to the trademarks, product names and such other intellectual property rights mentioned in this document. Except as expressly permitted, neither this documentation nor any part of it may be reproduced, stored in a retrieval system, or transmitted in any form or by any means, electronic, mechanical, printing, photocopying, recording or otherwise, without the prior permission of Infosys Limited and/ or any named intellectual property rights holders under this document.
Thank You