investor day - link reit
TRANSCRIPT

Investor Day29 March 2019
We Link People
to a Brighter
Future

TODAY’S AGENDAToday’s Agenda
Link’s Investor Day
Lunch with JLL Presentation1:00pm
Link Today and Tomorrow2:00pm – 3:30pm
Open Discussion3:30pm – 4:00pm
Coffee Break4:00pm – 4:30pm
Guided tour at CENTRALWALK4:30pm – 5:30pm
1
2
3
4
5
George HONGCHOYED & CEO
Andy CHEUNGED & COO
Kok Siong NGCFO
Eric YAUCSO
Gary FOKAsset Management
China
Emmanuel FARCISAsset Management
Hong Kong
Calvin KWANSustainability
P.2
TODAY’S AGENDA
Link Today
P.3
Eric Yau
Chief Strategy Officer

TODAY’S AGENDAAbout Link REIT
P.4
100%
#1 • REIT listed in Hong Kong
• REIT in Asia by market capitalisation
• Only internally-managed REIT in Asia
Note: (1) As at 31 December 2018, assuming all asset disposals to date and the acquisitions of Beijing Jingtong Roosevelt Plaza and CENTRALWALK are completed
Hong Kong Mainland China
Portfolio (1) • Includes retail facilities, car parks and offices
• Free float held by institutions and private investors
126 ~ 56,000
Properties Car park spaces
~ 8M sq ft ~ 0.9M sq ft
Retail space Under development
5 ~ 5M sq ft
Properties Retail and office space

TODAY’S AGENDAHealthy Financial Track Record
P.5
Revenue (HK$’M) NPI (HK$’M)
DPU (HK cents)Valuation (HK$’M)
10
,02
3
8,7
40
7,7
23
7,1
55
9,2
55
4,9
30
7,6
63
6,5
13
5,6
69
5,2
02
3,7
59
6,9
94
17/1
8
15/1
6
14/1
5
16/1
7
1H
18/1
9
13/1
4
249.7
8
20
6.1
8
182.8
4
165.8
1
130.6
2
228.4
1
Notes: (1) All figures as at 30 September 2018 (unless stated otherwise)(2) CAGR from FY2012/13 to FY2017/18
17/1
8
15/1
6
14/1
5
16/1
7
1H
18/1
9
13/1
4
17/1
8
15/1
6
14/1
5
16/1
7
1H
18/1
9
13/1
4
20
3,0
91
16
0,6
72
138,3
83
109,8
99
209,7
90
174,0
06
Mar 18
Mar 16
Mar 15
Mar 17
Sep 1
8
Mar 14

TODAY’S AGENDAValue Creation Model
P.6
→Tenant sales growth
→Open space
→Distribution per unit
→Total return for the year
→Credit rating
→Staff attrition rate
→Staff / Board diversity
→Succession planning
→Perception audit result
→Impact of Link Together
Initiatives
→Energy consumption
reduction
→Waste diverted from landfill
→Community Sentiment Index
→Number of asset
enhancement projects

TODAY’S AGENDALargest REIT in Asia
P.7
56.0
24.523.0 22.3
15.5
10.2 9.88.3 7.8 7.0 6.4 6.1 6.1 5.4
3.2 2.1 1.9
0.0
10.0
20.0
30.0
40.0
50.0
60.0
Note: Comparison of selected major REITs in the world based on market capitalisation
Source: Bloomberg as of 28 March 2019
US$B
SECOND LARGEST RETAIL REIT IN THE WORLD

21.81
67.43 74.40 83.9997.37
110.45129.52
146.46165.81
182.84206.18
228.41249.78
130.62
0
50
100
150
200
250
300
350
400
450
Mar-06 Mar-07 Mar-08 Mar-09 Mar-10 Mar-11 Mar-12 Mar-13 Mar-14 Mar-15 Mar-16 Mar-17 Mar-18 Sep-18
TODAY’S AGENDAContinuously Growing Total Return
P.8
Distribution per unit
(HK cents)
Year/period
ended
Price per unit
(HK$)
Compound annual total return since listing +18.6% (1)
Note:
(1) A combination of unit price appreciation and distribution paid since listing in 25 November 2005 to 31 March 2018
Price Per UnitDistribution Per Unit
-20
-10
0
10
20
30
40
50
60
70
80

TODAY’S AGENDAOur Strategic Journey So Far
Since
IPO / 2011Asset
Enhancement
Asset
Acquisition
Asset
Disposal
Property
Development
Property
Re-development
Asset
Management
Multiple growth drivers
to deliver sustainable
return for unitholders
P.9
Since
2014 / 2015
Future

TODAY’S AGENDAKey Questions from Our Stakeholders
P.10
1. How sustainable is the organic portfolio?
2. How do you see the Mainland China market?
3. How do you plan to grow your portfolio?
4. What are your capital management priorities?
5. Is Link a responsible investor?
6. How do we see Link in 5 years?

TODAY’S AGENDA
1. How sustainable is the organic portfolio?
P.11
Emmanuel Farcis
Head of Asset Planning & Strategy

TODAY’S AGENDAHong Kong Portfolio
P.12
HONG KONG
~8M sq ft
~0.9M sq ft
Retail space
Under development
126 Properties
Hong Kong
~56k Spaces
Car park
86.9%Total portfolio value

TODAY’S AGENDAHong Kong Retail Operations
P.13
$45.4$50.0
$55.3
$62.4$65.7
22.0%25.9%
23.8%
29.1%
22.5%
Mar 15 Mar 16 Mar 17 Mar 18 Sep 18
Average monthly unit rent Reversion
94.8%96.0% 96.1% 97.0%
95.5%
Mar 15 Mar 16 Mar 17 Mar 18 Sep 18
OCCUPANCY (1) MONTHLY UNIT RENT (1)
REVERSION RATE (2,3)
Notes:
(1) As at period/year end
(2) Reversion rate refers to the percentage change in per square foot average unit rent between old and new leases on the same unit
(3) For the year/period end
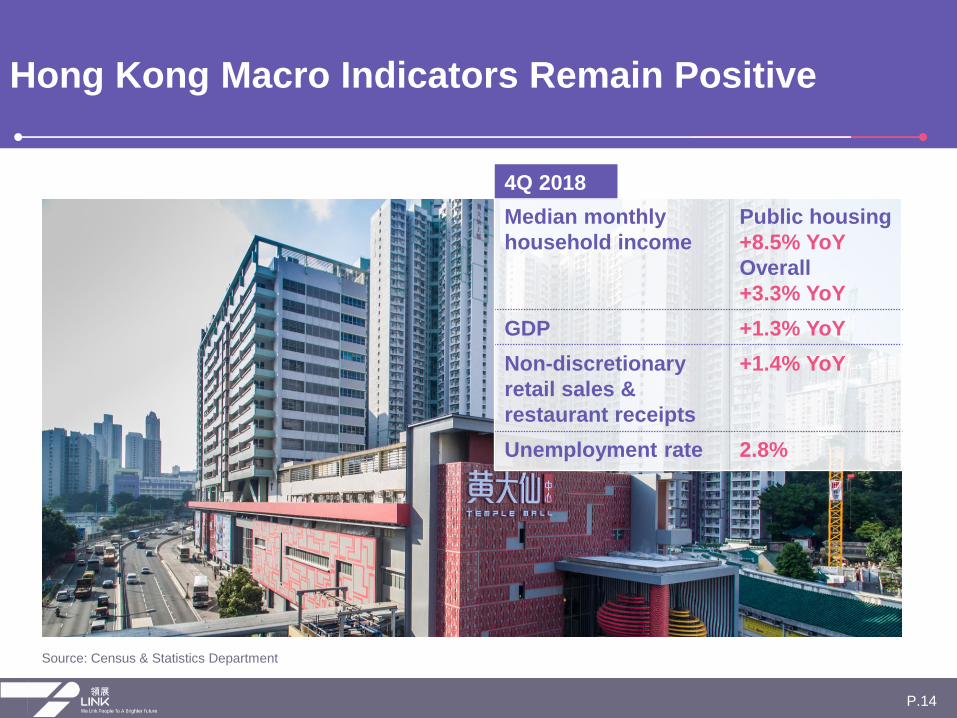
TODAY’S AGENDAHong Kong Macro Indicators Remain Positive
P.14
4Q 2018
Source: Census & Statistics Department
Median monthly
household income
Public housing
+8.5% YoY
Overall
+3.3% YoY
GDP +1.3% YoY
Non-discretionary
retail sales &
restaurant receipts
+1.4% YoY
Unemployment rate 2.8%

Link
Tenant Sales
Growth (2)
HK
Retail Sales
Growth
Link
Rent-to-sales
Ratio (3)
5.8% 4.7% 13.8%
4.4% 2.1% 12.2%
8.2% 8.1% 14.3%
6.1% 6.4% 13.4%
TODAY’S AGENDAHong Kong Portfolio Update for 3Q FY2018/2019
P.15
Notes:
(1) For the period between 1 April to 31 December 2018
(2) Percentage figures represent year-on-year change in tenants’ average monthly sales per square foot of the respective periods
(3) A ratio of base rent plus management fee to tenants’ gross sales
(4) Including clothing, department store, electrical and household products, personal care/medicine, optical, books and stationery, newspaper, valuable goods,
services, leisure and entertainment, and retail others
F&B
Supermarkets &
foodstuff
General retail (4)
Overall

TODAY’S AGENDAHong Kong Car Park Operations
P.16
$330K
$384K
$446K
$567K$595K
Mar 15 Mar 16 Mar 17 Mar 18 Sep 18
$1,767
$2,022 $2,239
$2,492 $2,706
Mar 15 Mar 16 Mar 17 Mar 18 Sep 18
MONTHLY INCOME PER SPACE (1) VALUATION PER SPACE
Note:(1) Include monthly and hourly parking

TODAY’S AGENDAHong Kong Car Park Market Imbalance Continued
P.17
V
V
Source: Transport Department, Legislative Council - Panel on Transport
Private car parking space
+1.2% YoY
< Private car license
+2.3% YoY
4Q 2018

TODAY’S AGENDAOur Asset Management Strategy
P.18
Portfolio
Segmentation
District
Study
Placemaking
Active
Tenant Remixing
InnovationCustomer
Engagement

TODAY’S AGENDADistrict Study of Tseung Kwan O
P.19
Tseung Kwan O
(Population: ~400k)
HK overall
(Population: ~7.5M)
42.9 Median age 43.4
52.8% Working population 51.0%
$32,000 Median household income $25,000
23.3% Live in public rental housing 30.4%
76.6%Live in home ownership scheme /
private housing68.3%
3.0 Average household size 2.8
56.4% Families with kids 52.1%
Profile of a typical household in Tseung Kwan O vs Hong Kong average
Source: Census and Statistics Department

TKO South
LOHAS Park
TKO Area 65 / 66 / 68
New Development
LOHAS Park
New Residential
Development
TKO Central
TKO NorthPo Lam
Hang Hau
Tseung Kwan O
Tiu Keng Leng
LOHAS Park
Po Lam
Choi Ming
Sheung Tak
TKO Gateway
Nan FungMaritime Bay
Tong Ming
Wo Ming
Yan Ming
Kin Ming
Ying Ming
With Fresh
market
Link Assets
TODAY’S AGENDAPortfolio Segmentation
Tseung Kwan O District
P.20
TKO CENTRAL
Hang Hau
TKO Gateway Nan Fung Plaza Maritime Bay
Flagship Mall Daily necessities & service
TKO SOUTH TKO NORTH
Tseung Kwan O Tiu Keng Leng Po Lam
Sheung Tak Plaza Choi Ming Po Lam
Second largest
mall in TKO
Stabilised
Community Mall
Sizeable
Neighbourhood Mall 11 Link Assets
400m

TODAY’S AGENDAPortfolio Segmentation
TKO Gateway as a Destination Shopping Centre
P.21
Introduced “Food Lane” with
extended operating hours to
serve late night diners
Fresh market asset enhancement to
fulfil the extended catchment
(including Sai Kung) needs

TODAY’S AGENDAActive Tenant Remixing
Strategic Tenant at Sheung Tak
P.22
HK Velodrome Park
TKO Waterfront Park
Sai Kung water activities

TODAY’S AGENDAPlacemaking Adding Kids’ Playground at Tsz Wan Shan Shopping Centre
P.23
▪ Extension of living
room
▪ Utilise open space
for the
neighbourhood
▪ Place for gathering
and family time
Jan Feb
CNY – 5th Feb
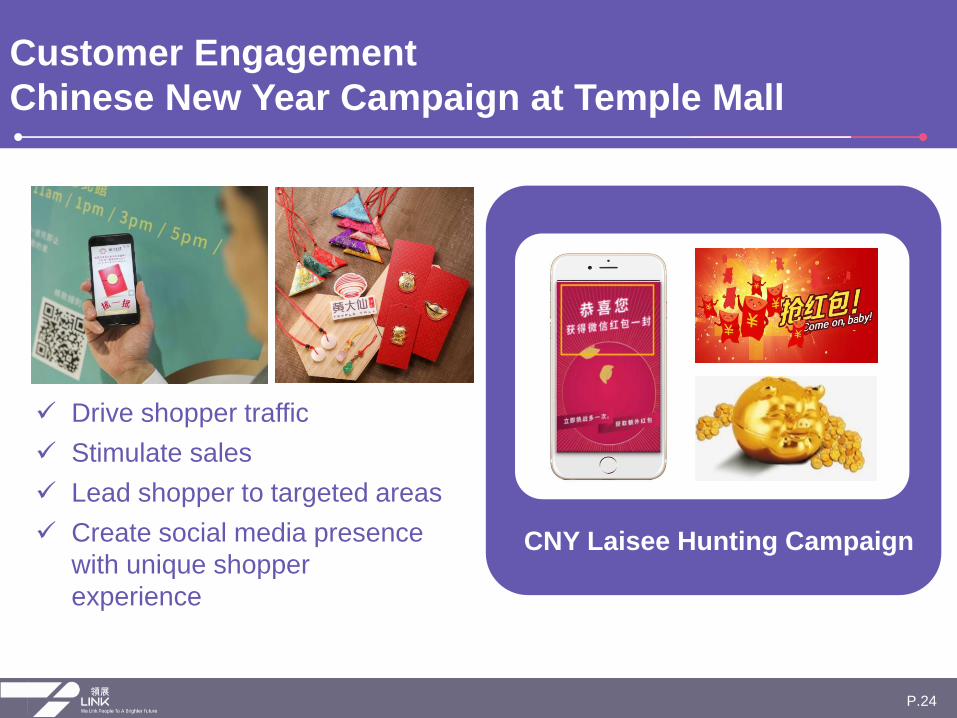
CNY Laisee Hunting Campaign
TODAY’S AGENDACustomer Engagement
Chinese New Year Campaign at Temple Mall
P.24
✓ Drive shopper traffic
✓ Stimulate sales
✓ Lead shopper to targeted areas
✓ Create social media presence
with unique shopper
experience

TODAY’S AGENDAInnovation through Technology
P.25
344,000+ download
since launchAs of 28 Feb 2019
Park & Dine app
Launched the tenant staff appreciation campaign to
engage both shoppers and tenants through offline &
online marketing
T.O.P app
Won HSBC x HKET Innovative Business Award –
Innovative Enterprise (Silver Award)

TODAY’S AGENDAExploring Solutions with Technology
P.26
Planning &
Coordination
Preventive
Maintenance
MaintenanceOperations
Building
Management
Security
FACILITIES MANAGEMENT INFORMATION TECHNOLOGY

TODAY’S AGENDAContinuous Asset Enhancement Pipeline
P.27
Projects FY18/19 FY19/20 FY20/21 FY21/22+
Underway
To commence
Under planning
Note:
(1) As at 30 September 2018.
ROI Target
>15%
Annual CAPEX
~HK$600-800M
10
(HK$1,029M)
5
(HK$681M)
19
(HK$839M)

TODAY’S AGENDA
2. How do you see the Mainland China market?
P.28
Gary Fok
Director (Asset Management – China)

TODAY’S AGENDAOur Mainland China Portfolio
P.29
5 ASSETS ACROSS
4 TIER-1 CITIES
EC Mall
Roosevelt Plaza
Link Square
Metropolitan PlazaCENTRALWALK
SHENZHEN

TODAY’S AGENDARobust Retail Portfolio Performance
P.30
Notes: (1) For six months ended 30 September 2018, all retail properties combined.(2) As at 31 December 2018, all retail properties combined.
Retail Reversion 43.2% (1)
Retail Occupancy 99.1% (2)
Managed by our inhouse management team

TODAY’S AGENDASteady and Resilient Office Portfolio
P.31
Note: (1) As at 31 December 2018
Office Occupancy 94.8% (1)
FY2018/2019 expects to achieve
double-digit reversion

TODAY’S AGENDAAsset Management Capabilities
P.32
Market knowledge Leasing expiry profile
Tenant mix Operational efficiency

Fashion Sportswear F&B Others
H&M Uniqlo Nike Adidas Starbucks Innisfree Xiaomi Huawei
EC Mall √ √ √ √ √ √
Metropolitan
Plaza√ √ √ √ √ √ √ √
Roosevelt Plaza √ √ √ √ √
CENTRALWALK √ √ √ √ √ √
TODAY’S AGENDAStrengthening Tenant Base
P.33
1.
2.
3.
4.
Growing tenant relationships across a wide range of mass-mid tier brands
across our portfolio

TODAY’S AGENDAHow We Improve Efficiency
P.34
Utility
Staff
Marketing
Energy saving measures
Nurturing talents to raise efficiency
Finetuning shoppers targeting
TechnologyProcess automation and data analytics to
improve business operations

TODAY’S AGENDAExpansion of NIKE Store at EC Mall
P.35
NIKE
EC MALL
Branding in addition to sales
Iconic attraction that expands
catchment
FROM ~3,500 sq ft TO ~6,000 sq ft
NEWS HERE
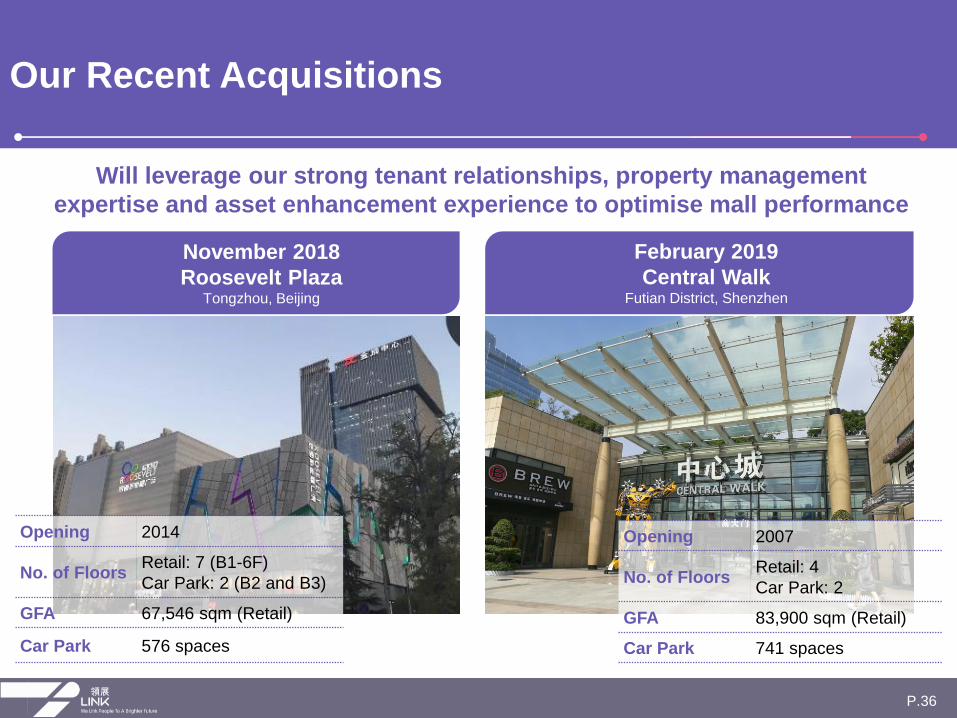
TODAY’S AGENDAOur Recent Acquisitions
P.36
February 2019
Central Walk Futian District, Shenzhen
November 2018
Roosevelt Plaza Tongzhou, Beijing
Opening 2014
No. of FloorsRetail: 7 (B1-6F)
Car Park: 2 (B2 and B3)
GFA 67,546 sqm (Retail)
Car Park 576 spaces
Opening 2007
No. of FloorsRetail: 4
Car Park: 2
GFA 83,900 sqm (Retail)
Car Park 741 spaces
Will leverage our strong tenant relationships, property management
expertise and asset enhancement experience to optimise mall performance
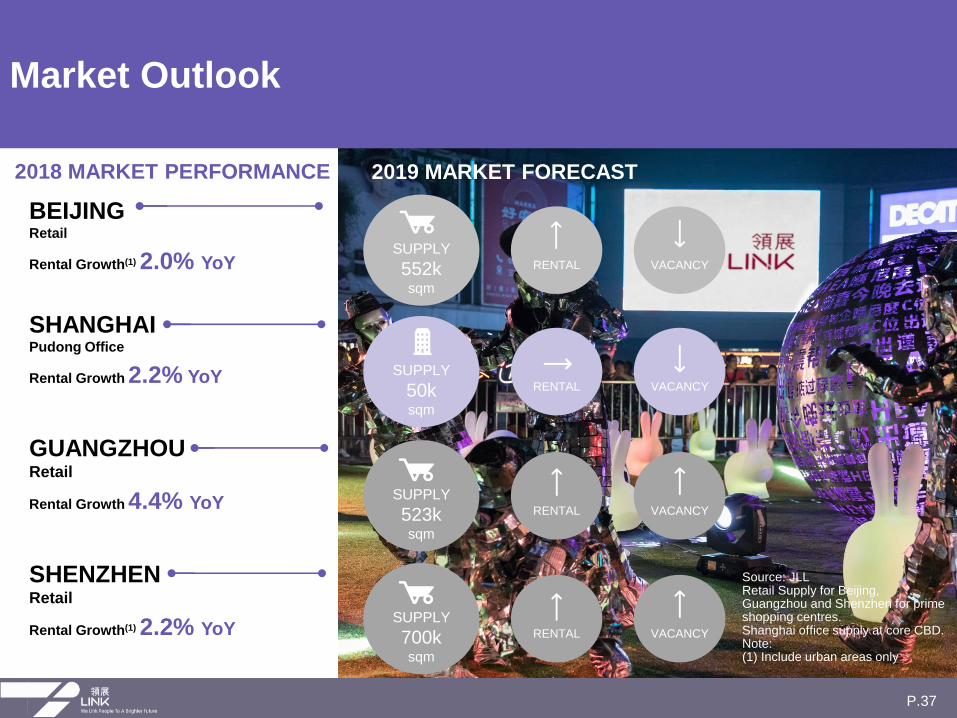
BEIJINGRetail
Rental Growth(1) 2.0% YoY
SHANGHAIPudong Office
Rental Growth 2.2% YoY
GUANGZHOURetail
Rental Growth 4.4% YoY
SHENZHENRetail
Rental Growth(1) 2.2% YoY
TODAY’S AGENDAMarket Outlook
P.37
2018 MARKET PERFORMANCE 2019 MARKET FORECAST
SUPPLY
50k sqm
RENTAL VACANCY
SUPPLY
523ksqm
RENTAL VACANCY
SUPPLY
700ksqm
RENTAL VACANCY
Source: JLLRetail Supply for Beijing, Guangzhou and Shenzhen for prime shopping centres.Shanghai office supply at core CBD.Note: (1) Include urban areas only
SUPPLY
552k sqm
RENTAL VACANCY
TODAY’S AGENDA
3. How do you plan to grow your portfolio?
P.38
Andy Cheung
Chief Operating Officer

TODAY’S AGENDAThree Degrees of Freedom
Expansion and Acquisition
✓ Hong Kong
✓ Tier 1 Mainland China cities and
surrounding river delta areas
✓ Other geographies remain opportunistic
P.39
✓ Changed mandate to allow
development in 2015
✓ HK focus
✓ Preference for build-to-suit
GEOGRAPHY
NEW DEVELOPMENTASSET TYPE
✓ Retail
(HK any positioning,
PRC mid-market
positioning)
✓ Grade A offices

TODAY’S AGENDAGeography
Expansion Focus in Tier-1 Cities
P.40
Bohai Economic Rim
Yangtze River Delta
Greater Bay Area
Beijing
● Shanghai
●● Shenzhen
Guangzhou
✓ Strategic potential
• Continuous government stimulus
• Inter-city transportation development
✓ Growth potential
• Higher GDP growth
• Disposable income and retail sales growth
• Continuous urbanisation and growing middle
class catchment
✓ Others
• Sizeable tertiary industries & positive economic
outlook
? Risk of oversupply in certain districts
? Fluctuations in passing rent and occupancy
TIER-1 CITIES AND THEIR SURROUNDING RIVER DELTA AREAS
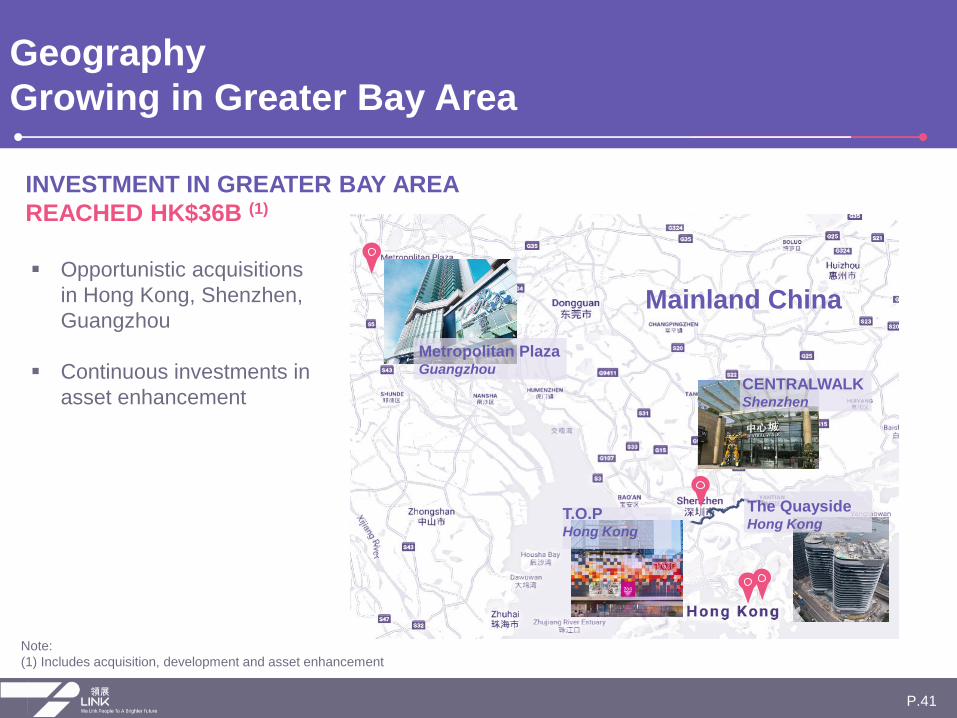
TODAY’S AGENDAGeography
Growing in Greater Bay Area
Note:
(1) Includes acquisition, development and asset enhancement
P.41
Mainland China
CENTRALWALK Shenzhen
Metropolitan PlazaGuangzhou
The QuaysideHong Kong
T.O.PHong Kong
INVESTMENT IN GREATER BAY AREA
REACHED HK$36B (1)
▪ Opportunistic acquisitions
in Hong Kong, Shenzhen,
Guangzhou
▪ Continuous investments in
asset enhancement

✓ Located in Zhongguancun of Beijing
✓ Affluent area surrounded by high-tech
companies and universities
✓ Adjacent to Haidian Huangzhuang Metro
Station
✓ No more new retail development in the
vicinity
✓ Established management team
✓ Good shopper traffic on both weekdays
and weekends
TODAY’S AGENDACase Study of EC Mall
P.42
Peking University
People’s University
EC Mall
Tsinghua UniversityACQUISITION CRITERIA

TODAY’S AGENDASame Criteria Applied to All Our Acquisitions So Far
P.43
✓Tier-1 Cities (1) plus Hong Kong
✓Mass-mid market retail
✓Premium grade-A office
✓Good connectivity
✓Limited competition
✓Sizeable catchment
✓Long-term growth potential
Note: (1) Beijing, Shanghai, Guangzhou and Shenzhen
T.O.PThe
Quayside
EC
Mall
Link
Square
Metropolitan
Plaza
Roosevelt
Plaza
CENTRAL-
WALK
√ √ √ √ √ √ √
√ √ √ √ √
√ √
√ √ √ √ √ √ √
√ √ √ √ √
√ √ √ √ √ √ √
√ √ √ √ √ √ √

99 00 01 02 03 04 05 06 07 08 09 10 11 12 13 14 15 16 17 18
Foods & alcoholic drinks Supermarkets
Restaurant receipts Jewellery
Department stores Clothing
Asian financial crisis
Tech bubble burst
Global financial crisis
SARS outbreak
TODAY’S AGENDAAsset Type
Diversification from Retail to Office
P.44
YoY Change of Retail Sales Value &
Restaurant Receipts
Source: JLL
Office Rental in Hong Kong
Source: Census & Statistics Department
0
20
40
60
80
100
120
140
4Q
10
4Q
11
4Q
12
4Q
13
4Q
14
4Q
15
4Q
16
4Q
17
4Q
18
HKD per sq ft per month, NFA

TODAY’S AGENDADevelopment
Pros and Cons
P.45
Customisation• More sustainable product
• Lower asset enhancement need
Developer’s profit• Better returns
Delayed cash inflow• Large CAPEX at initial stage
Leasing risk• Ramp up time
• Longer exposure to market
conditions

33%30%
24%
52%
32%
2015 2016 2017 2018 2019
PREMIUM TO VALUATION
TODAY’S AGENDADisposal
Selling Non-Core Assets at Premium
P.46
MARKET VALUE > BOOK
VALUE
WITH UNLEVERED
HOLDING PERIOD IRR(1)
RANGE IN ~20%
Historical premiums attained were
above 20%
Note:
(1) Median of property level unleveraged IRRs from IPO/acquisition to divestment for the properties divested during the year

2011/12 2014/15 2015/16 2016/17 2017/18 2018/19
• Nan Fung
Plaza
• Maritime Bay
• Lions Rise
• The Quayside• EC Mall
• Link Square
• 700 Nathan
Road
• Metropolitan
Plaza
• Roosevelt Plaza
• CENTRALWALK
TODAY’S AGENDAPortfolio Management Strategy
Active Management to Maintain Upward Projectile
P.47
$2B
$7B
$11B
$6B $5B$11B
$3B
9 assets
$2B
5 assets $7B
14 assets
$23B
17 assets
$12B
12 assets
ACQUISITION – AGGREGATE HK$42B
DISPOSAL – AGGREGATE HK$47B
FY11/12 FY14/15 FY15/16 FY16/17 FY17/18 FY18/19

TODAY’S AGENDAPortfolio Management Strategy
Recap
P.48
Geography
Asset type
Development
▪ Core portfolio remains in Hong Kong
▪ Focus on tier-1 cities and the surrounding river delta areas in
Mainland China
▪ Maintain guidance on Mainland China exposure at 20%
▪ Other geographies will be opportunistic
▪ Prefer quality retail assets with good growth potential in non-
discretionary sector
▪ Selective on grade A offices not exceeding 12.5% of portfolio
▪ Focus on Hong Kong
▪ Limited to 10% of portfolio
Disposal
▪ Non-core assets
▪ Less growth potential
▪ Lacking synergy

TODAY’S AGENDA
4. What are your capital management priorities?
P.49
Kok Siong Ng
Chief Financial Officer

TODAY’S AGENDAHong Kong Macro Overview
Expect Slower Economic Growth
P.50
Inflation and staff cost will likely
continue to rise steadily
0%
2%
4%
6%
2016 2017 2018* 2019F 2020F 2021F
Inflation rate Avg. Nominal Payroll
HK economy faces external
headwinds amid trade war
0%
2%
4%
6%
2016 2017 2018 2019F 2020F 2021F
GDP (YoY)
Sources: C&SD, EIU (forecast) 2018 Payroll is forecast figure
Sources: C&SD, EIU (forecast)
2018

China Macro Overview
Economy Growth Should Sustain
P.51
Sources: NBS, BMBS, SMSB, SBGM, SSB, EIU (forecast)
4%
6%
8%
10%
12%
2016 2017 2018 2019F 2020F 2021F
Shenzhen Guangzhou
Shanghai Beijing
Mainland China
Economy is likely to grow slightly
GDP (YoY)
Depreciation pressure on RMB
eased recently
1.0
1.1
1.2
1.3
1.4
Jan-15 Jan-16 Jan-17 Jan-18 Jan-19
CNY/HKD
Source: Bloomberg
Jan-19

TODAY’S AGENDAInterest Rate Environment
Expect to Stabilise
P.52
But HIBOR could catch up with LIBOR
0.1%
0.6%
1.1%
1.6%
2.1%
2.6%
3.1% HIBOR LIBOR
Source: Bloomberg
Forward HIBOR/LIBOR as at Feb-19
2016 2017 2018 2019F 2020F 2021F
US$ rate hike starting to slow
Source: Bloomberg
Forward Fed Fund Rates as at Feb-19
0.25%
0.75%
1.25%
1.75%
2.25%
2.75%
2016 2017 2018 2019F 2020F 2021F
Fed Fund Upper Bound

TODAY’S AGENDACredit Ratings
A Strategic Differentiator
P.53
A / Stable
A / Stable
A2 / Stable
3 “A” RATINGS FROM KEY CREDIT RATING AGENCIES
INITIATED IN JAN 19

0.0%
1.0%
2.0%
3.0%
TODAY’S AGENDACapital Management Strategy
Maximum Optionality
P.54
NEW SOURCES OF FUNDING TIGHT YIELD SPREAD
SEP 2018
BANK LOANS $7.5B
MTN $15.2B
MAR 2019
GREEN
CONVERTIBLE BOND
$4.0B
✓ Largest Green CB globally
✓ 1st Green CB of real estate
sector globally
Notes:
(1) As at 30 September 2018.
(2) Source: Bloomberg
Link DPU Yield Spread
(vs 10Y UST)
COMPETITIVE FUNDING COST
0
0.01
0.02
0.03
0.04
0.05
0.0%
1.0%
2.0%
3.0%
4.0%
5.0% 3-month HIBORLink's Cost of Debt10-yr UST
Jan 15 Jan 19
Mar 08 Jan 19

TODAY’S AGENDACapital Management Strategy
Opportunistic Fund Raising with Green CB
P.55
✓ Largest green CB globally
✓ 1st green CB of real estate sector
globally
✓ Largest CB offering by HK issuer since 2011
✓ Lowest coupon rate achieved by
Asian REITs since 2014
✓ 1st CB by HK listed REITs since 2008
✓ Finance green projects including
The Quayside and installation of solar panels
✓ Low-cost funding
half of straight bond yield
✓ High conversion price22.5% conversion premium to lower dilution
✓ New source of fundingIn addition to bank loans and bonds
✓ New investor baseMajority demand came from outright long CB
investors; balanced split of demand between
Asia and Europe
NEW SOURCE OF FUNDING WITH MAJOR BENEFITS AND ACHIEVEMENTS

17.5%22.0% 21.3%
17.3%14.5%
59%63% 61%
76%
70%
Mar 15 Mar 16 Mar 17 Mar 18 Sep 18
Gearing
% of fixed rate debt
TODAY’S AGENDACapital Management Strategy
Strong Capital Structure
P.56
7.2 years 6.9 years
6.3 years
5.3 years5.2 years
Mar 15 Mar 16 Mar 17 Mar 18 Sep 18
Average life of fixed rate debt
AVERAGE LIFE OF FIXED RATE DEBTGEARING
PERCENTAGE OF DEBT FIXED
(1)
Note:
(1) Pro forma gearing based on the consolidated financial position as at 30 September 2018, after adjusting interim distribution and the appraised value of Beijing Jingtong Roosevelt Plaza,
and assuming disposal of the 12 assets announced on 12 December 2018 was completed and a drawdown of HK$5,967M on Link’s debt facilities

TODAY’S AGENDACapital Management Strategy
Our Priorities
MAINTAIN DISCIPLINED CAPITAL STRUCTURE
P.57
Capacity for growth• Acquisitions• CAPEX
Debt repayments• Largely to pay down revolver loans
Relevant investments• Manage short term liquidity
Gearing
Comfortable at
~20%
Fixed vs
floating ratio
Around
60:40
Credit ratings
Maintain “A” Ratings
Distribution
payout ratio
No change at 100%
Management priorities
Capital return & stewardship• Unit buyback• Special distribution

TODAY’S AGENDA
5. Is Link a responsible investor?
Together We Grow P.58
Calvin Kwan
General Manager – Corporate Development & Strategy
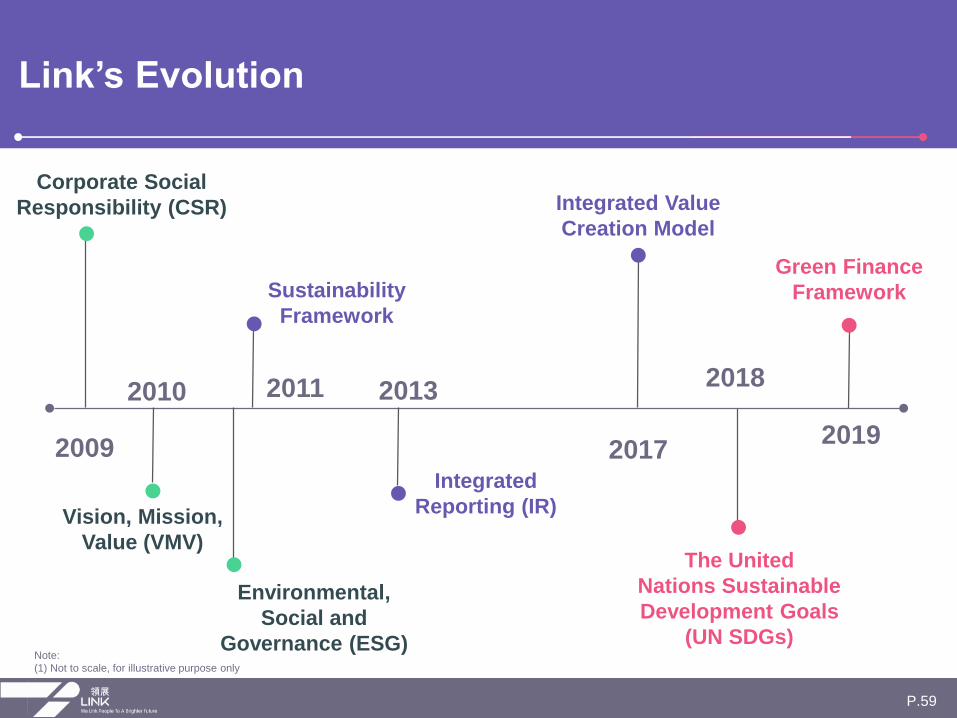
TODAY’S AGENDALink’s Evolution
P.59
2019
The United
Nations Sustainable
Development Goals
(UN SDGs)
Green Finance
Framework
Corporate Social
Responsibility (CSR)
Sustainability
Framework
Integrated Value
Creation Model
Environmental,
Social and
Governance (ESG)
Integrated
Reporting (IR)
2009 2017
20132011 20182010
Vision, Mission,
Value (VMV)
Note:
(1) Not to scale, for illustrative purpose only

GLOBAL RECOGNITIONS
TODAY’S AGENDAAligning with Global Standards
P.60
LOCAL, REGIONAL AND GLOBAL ADVOCACY
Hong Kong Institute of Certified Public Accountants
TODAY’S AGENDAUNEP Property Working Group
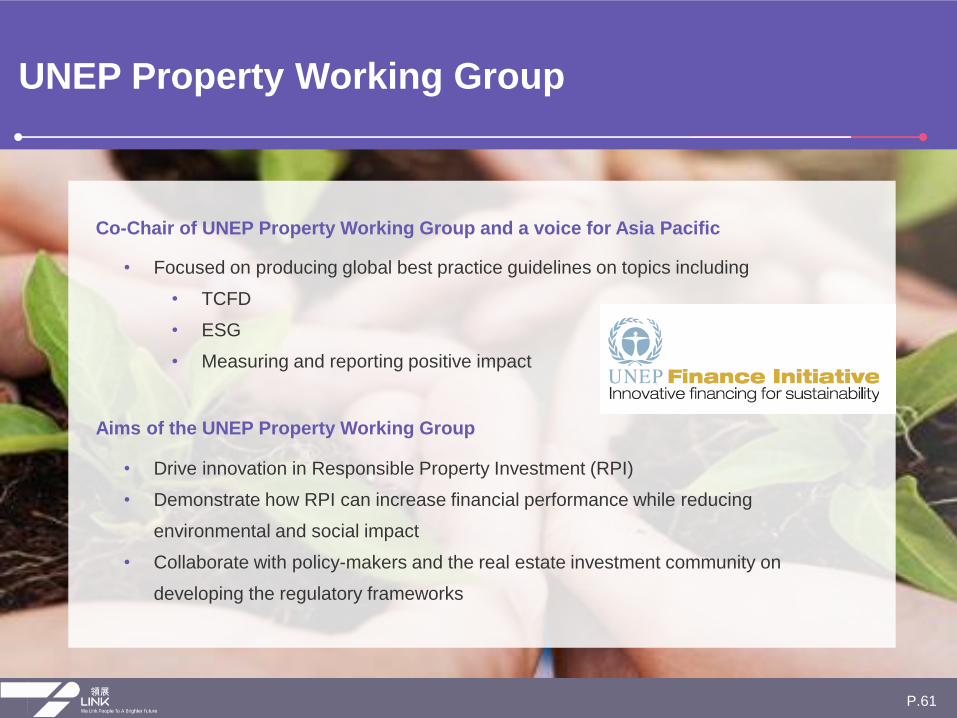
P.61
• Drive innovation in Responsible Property Investment (RPI)
• Demonstrate how RPI can increase financial performance while reducing
environmental and social impact
• Collaborate with policy-makers and the real estate investment community on
developing the regulatory frameworks
• Focused on producing global best practice guidelines on topics including
• TCFD
• ESG
• Measuring and reporting positive impact
Co-Chair of UNEP Property Working Group and a voice for Asia Pacific
Aims of the UNEP Property Working Group

TODAY’S AGENDA
• Direct real estate exposure:
20 participating institutions
globally
• Establish a methodology
and modelling for climate
and transition risk
• Alignment with investors,
next step to bring in
insurance companies
• Q1 2019 – publication of
methodology report and key
TCFD Investor Pilot
P.62
• SUSTAINABILITY
Guiding our Long-Term Strategy
Working on TCFD Recommendations for investors with
a pilot group of 14 investors and 6 real estate companies

• Understand analyst and investor concerns on
ESG issues
• Determine what other policies and procedures
are needed
• Align investor, analyst and responders’
understandings of TCFD including align with
UNEP with GRESB effort to implement climate
change reporting (Apr 19)
• Materiality and scenario planning
• Determine what international and future
standards are needed
TODAY’S AGENDAEngage with ESG Analysts & Investors
P.63
1
2
3
4
5

TODAY’S AGENDA
6. How do we see Link in 5 years?
P.64
George Hongchoy
Chief Executive Officer

Today’s AgendaLink’s Value Creation Model
P.65
→Tenant sales growth
→Open space
→Distribution per unit
→Total return for the year
→Credit rating
→Staff attrition rate
→Staff / Board diversity
→Succession planning
→Perception audit result
→Impact of Link Together
Initiatives
→Energy consumption
reduction
→Waste diverted from landfill
→Community Sentiment Index
→Number of asset
enhancement projects

TODAY’S AGENDAChallenges We Are Facing
P.66
Downward
property
cycle?
New
source of
income?
Talent
retention and
development
Sustaining
long-term
growth
Dissolving
online &
offline
Responsible
Investment

TODAY’S AGENDAVision 2025
P.67
Leader in Retail Industry
Strengths
Clear Vision & Strong Execution
Effective Stewardship
Strong Balance Sheet
Focus on Growth
Portfolio Growth
Culture of Excellence
Visionary Creativity
Vision 2025
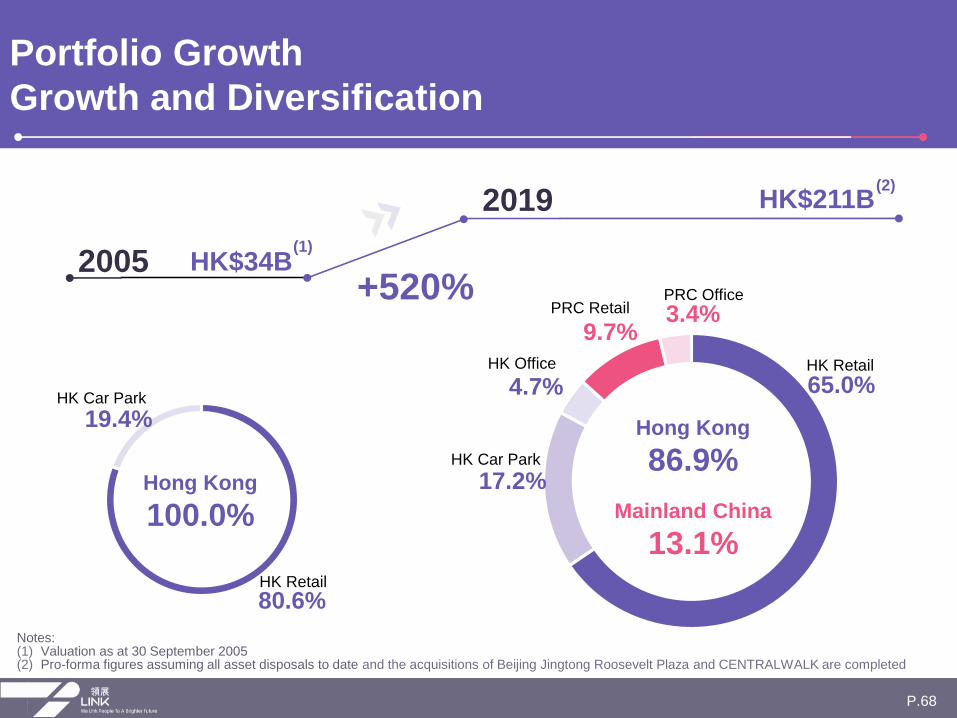
TODAY’S AGENDAPortfolio Growth
Growth and Diversification
Notes: (1) Valuation as at 30 September 2005(2) Pro-forma figures assuming all asset disposals to date and the acquisitions of Beijing Jingtong Roosevelt Plaza and CENTRALWALK are completed
P.68
65.0%
17.2%
4.7%
9.7%
Hong Kong
86.9%
Mainland China
13.1%
HK$211B2019
3.4%
(2)
80.6%
19.4%
Hong Kong
100.0%
HK$34B2005(1)
HK Retail
HK Car Park
HK Office
PRC RetailPRC Office
HK Retail
HK Car Park
+520%

TODAY’S AGENDAPortfolio Growth
Portfolio Shift Since IPO
P.69
2005
Hong Kong Hong Kong China
180 126 5
1 1 4
HK$34 B HK$183 B HK$28 B
5.69%-9.00% 4.02% 4.25%-4.75%
~91% ~96% ~99%
Leasing and
Property
Management
Asset
Management
Asset
Management
No. of
properties
No. of cities
Valuation
Capitalisation
rate (1)
Occupancy
Operating
model
Note: (1) Overall weighted average of Hong Kong portfolio
2019

TODAY’S AGENDAPortfolio Growth
Portfolio Value Today and Tomorrow
Note: (1) Pro-forma figures assuming all asset disposals to date and the acquisitions of Beijing Jingtong Roosevelt Plaza and CENTRALWALK are completed.
P.70
HK$?B2025
HK$211B2019(1)
?%
65.0%
17.2%
4.7%
9.7%
Hong Kong
86.9%
Mainland China
13.1%
3.4%
HK Retail
HK Car Park
HK Office
PRC RetailPRC Office
?

TODAY’S AGENDAPortfolio Growth
Target AUM in Medium-term
P.71
0
50
100
150
200
250
300
350
400
450
500
2006
2007
2008
2009
2010
2011
2012
2013
2014
2015
2016
2017
2018
2019
2020
2021
2022
2023
2024
2025
Target
CAGR
15.6%
2006
$36B
2018
$203B
High single-digit CAGR Blue sky
Status quo
(HK
$’B
)
Mid single-digit
CAGR
Portfolio Management
Innovation
Acquisition
Disposal
Development
Other Investments
Technology

Professional
Productive
Progressive
Proud of
what we do
TODAY’S AGENDA
P.72
1
2
3
4
Culture of Excellence
What is Link’s DNA?

TODAY’S AGENDA
P.73
Diversified and
Independent
Board
Professional
Management
Alignment of
interest with
investors
Culture of Excellence
Our Team

Best in class in transparency
TODAY’S AGENDACulture of Excellence
Two-way and Continuous Engagement
P.74
Investment stewardship
InternalExternal
Succession
planning
Satisfaction &
motivation
Talent development
Strong corporate governance
Employer of Choice Create Shared Values
TODAY’S AGENDA
Together We Grow P.75
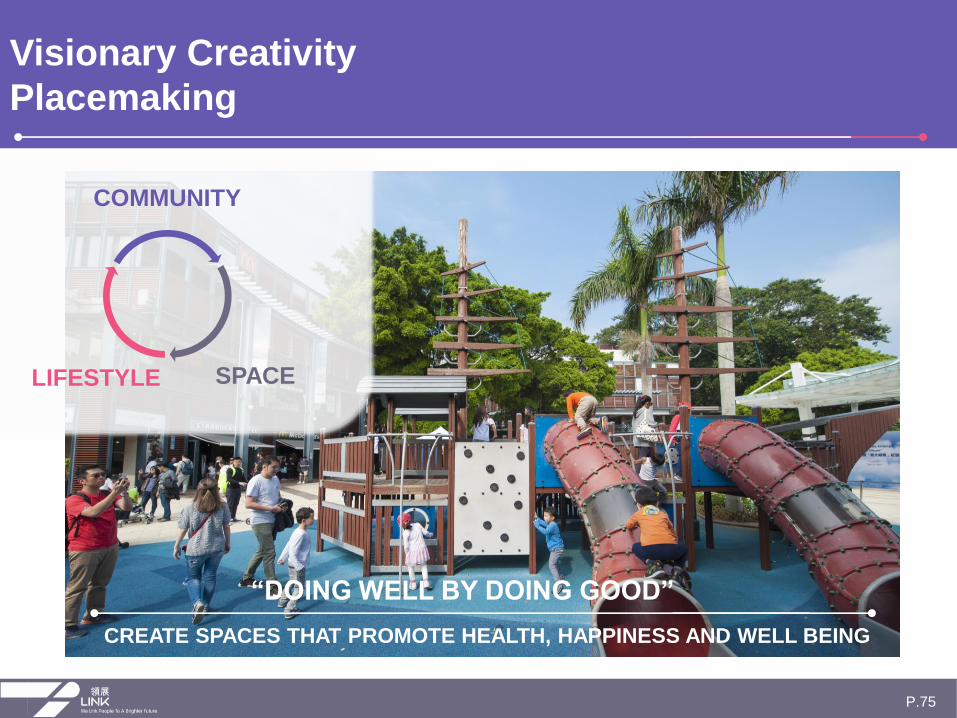
Visionary Creativity
Placemaking
CREATE SPACES THAT PROMOTE HEALTH, HAPPINESS AND WELL BEING
P.75
“DOING WELL BY DOING GOOD”
COMMUNITY
SPACELIFESTYLE

TODAY’S AGENDA
Visionary Creativity
Solar Panel Installation
P.76
4 pilot projects to complete in FY19/20
Funded by proceeds from green convertible bond
Potential rollout to ~29 properties within 3 years

TODAY’S AGENDA
Visionary Creativity
Areas to Work Together
P.77
MOBILE APPSFACILITIES
MANAGEMENT
GREEN LEASESINTELLIGENCE &
ANALYTICS
o Integrate online and offline platforms
o Explore technological solutions to improve operational efficiency
o Extend our belief in sustainability to our tenants
o Capitalise on data insights and analytics

TODAY’S AGENDADeliver Sustainable Returns
P.78
Leader in Retail REIT Industry
Strengths
Clear Vision
Effective Stewardship
Strong Balance Sheet
Focus on Growth
Portfolio Growth
Culture of Excellence
Visionary Creativity
Vision 2025 Targets
Maintain Growth
Momentum
Become Employer
of Choice
Placemaking
through Innovation
Disclaimer
◼ This document has been prepared by Link Asset Management Limited in its capacity as the Manager (the “Manager”) of Link RealEstate Investment Trust (“Link REIT”) solely for use at the presentations/meetings held and may not be reproduced or redistributedwithout permission. Neither this document nor any copy may be taken or transmitted into or distributed, directly or indirectly, in theUnited States or to any U.S. person (within the meaning of Regulation S under the United States Securities Act of 1933, asamended). Neither this document nor any copy may be taken or transmitted into or distributed or redistributed in Canada or to theresident thereof. The distribution of this document in other jurisdictions may be restricted by law and persons into whosepossession this document comes should inform themselves about, and observe any such restrictions. By attending thispresentation/meeting, you are deemed to agree to be bound by the foregoing restrictions and represent that you have understoodand accepted the terms of this disclaimer. Any failure to comply with these restrictions may constitute a violation of applicablesecurities laws.
◼ All information and data are provided for reference only. All opinions expressed herein are based on information available as of thedate hereof and are subject to change without notice. The slides forming part of this document have been prepared solely as asupport for oral discussion about Link REIT. No representation or warranty, express or implied, is made as to, and no relianceshould be placed on, the fairness, accuracy, completeness or suitability of any information or opinion contained herein. None ofLink REIT, the Manager, or any of its directors, officers, employees, agents or advisors shall be in any way responsible for thecontents hereof, nor shall they be liable for any loss arising from use of the information contained in this presentation or otherwisearising in connection therewith.
◼ This document may contain forward-looking statements. The past performance of Link REIT is not necessary indicative of thefuture performance of Link REIT and that the actual results may differ materially from those set forth in any forward-lookingstatements herein. Nothing contained in this document is, or shall be relied on, as a promise or forecast as to the future.
◼ This document does not constitute an offer or invitation to purchase or subscribe for any securities of Link REIT and neither anypart of it shall form basis of or be relied upon in connection with any contract, commitment or investment decision whatsoever. Noaction has been taken or will be taken by Link REIT, the Manager or any of its directors, officers, employees, agents or advisers, toregister this document as an offering document or otherwise to permit public distribution of this document.