investor day february 26, 2010 - …€¢ we believe that growing demand should drive a ... 2009,...
TRANSCRIPT

INVESTOR DAY
FEBRUARY 26, 2010

Page 2 Investor Day | February 26, 2010
AGENDA
ELI HARARIChairman & Chief Executive Officer
SANJAY MEHROTRAPresident & Chief Operating Officer
SHORT BREAK
LUNCH BREAK
SHUKI NIRSenior Vice President & General Manager, Retail Business
JUDY BRUNERExecutive Vice President, Administration &Chief Financial Officer
Q & AELLIOT BROADWINVice President, MNO Solutions
YORAM CEDARExecutive Vice President, OEM & Corporate Engineering
DAN INBARSenior Vice President & General Manager,OEM Mobile & Imaging

Page 3 Investor Day | February 26, 2010
FORWARD-LOOKING STATEMENT
During our meeting today we will be making forward-looking statements.
Any statement that refers to expectations, projections or other characterizations of future events or circumstances is a forward-looking statement, including those relating to revenue, pricing, market share, market growth, product sales, industry trends, expenses, gross margin, future memory technology, production capacity and technology transitions and future products.
Actual results may differ materially from those expressed in these forward-looking statements including due to the factors detailed under the caption ―Risk Factors‖ and elsewhere in the documents we file from time-to-time with the SEC, including our annual and quarterly reports.
Reconciliations between Non-GAAP and GAAP results presented are included in the appendix of the financial presentation.
We undertake no obligation to update these forward-looking statements, which speak only as of the date hereof.
Page 4 Investor Day | February 26, 2010
ELIHARARIChairman and Chief Executive Officer
INVESTOR DAY MEETINGFebruary 26, 2010

Page 5 Investor Day | February 26, 2010
TODAY‘S THEME:
IN THE COMING DECADE, FLASH WILL BE BIGGER THAN YOU THINK!

Page 6 Investor Day | February 26, 2010
AGENDA
• 2009 Scorecard
• Past decade
• Technology, Competition, Capacity
• Intellectual Property
• Coming decade
• Summary

Page 7 Investor Day | February 26, 2010
SANDISK 2009 SCORECARD
Remarkable turnaround for SanDisk
Our decisive actions brought decisive results
Strong execution in technology (X3, 32nm) and operations
Renewed Samsung license agreement
Exiting 2009 with strong balance sheet
2010 Flash fundamentals as good as ever

Page 8 Investor Day | February 26, 2010
DEMAND / SUPPLY GARTNER 4Q09
90%
95%
100%
105%
0
1,000
2,000
3,000
4,000
5,000
6,000
1Q
08
2Q
08
3Q
08
4Q
08
1Q
09
2Q
09
3Q
09
4Q
09
1Q
10
2Q
10
3Q
10
4Q
10
NAND Flash Supply NAND Flash Demand Sufficiency
BIL
LIO
NS
OF
ME
GA
BY
TE
SS
UP
PLY
/DE
MA
ND
SU
FF
ICIE
NC
Y
Short-Term Supply/Demand Sufficiency
2008: 105.0% = Oversupply
2009: 96.0% = Shortage
2010: 98.9% = Shortage
Source: Gartner NAND Flash Memory Supply and Demand, Worldwide, 1Q08-4Q10 (4Q09 Update)

Page 9 Investor Day | February 26, 2010
EXPANDING SCALE
IT TOOK US…
15 years (1991–2006) to ship the first 0.5 billion units
3 years (2007–2009) to ship the next 1 billion units
WE EXPECT TO SHIP MORE THAN 1 BILLION UNITS IN THE NEXT TWO YEARS

Page 10 Investor Day | February 26, 2010
OUR 1999 PREDICTIONS FOR 2010 CAME TRUE
MarketSize
1999
CONSUMER
PC/SERVER
CONSUMERINDUSTRIAL
PC/SERVER
CD/MD
TAPE
HDD
FLASH
DRAM
SRAM
Capacity Cost
Mechanical Solid State
MarketSize
2010
CONSUMER
PC/SERVER
A/V CONSUMER,WIRELESS,
INTERNET E-COMMERCE PC/SERVER
CD/MD
TAPE
HDDFLASH DRAM
SRAM
Capacity Cost
Source: EH 8-25-99

Page 11 Investor Day | February 26, 2010
EVOLUTION OF FLASH MEMORY STORAGE
1990–1999: EARLY DAYS
Industrial, military
Early development of digital film, early PDA‘s
Early web days, DiskonKey (Sneaker-net)
2000–2009: DIGITAL CONSUMER REVOLUTION
Flash: ubiquitous, strategic enabler for portable personal content
Early days of Mobile Internet:
– 3G networks—taking off– iPhone, mobile apps—taking off– Social networking—taking off

Page 12 Investor Day | February 26, 2010
SANDISK‘S PAST DECADE: 2 FLASH INDUSTRY CYCLES
10-Yr CAGR (2000-2009): ~22%
Total Revenue 2010 Revenue
+144%-39%
+48%
+99%
+65%
+30%
+41%
+20%
-14%+6%
12% to 23%
$0.0
$0.5
$1.0
$1.5
$2.0
$2.5
$3.0
$3.5
$4.0
$4.5
$5.0
2000 2001 2002 2003 2004 2005 2006 2007 2008 2009 2010E
(BIL
LIO
NS
)

Page 13 Investor Day | February 26, 2010
MANAGING THRU DOWN CYCLES: RAPID RECOVERIES
See note on page 203.
2000 excludes gain on investment in foundry.
$0.66
($2.19)
$0.25
$1.02
$1.44
$2.00
$2.51
$1.73
($2.07)
$1.84
($3.00)
($2.00)
($1.00)
$0.00
$1.00
$2.00
$3.00
2000 2001 2002 2003 2004 2005 2006 2007 2008 2009
Non-GAAP EPS

Page 14 Investor Day | February 26, 2010
20% 233% 238% 167% 166%221%
190%
125%
116%
2000 2001 2002 2003 2004 2005 2006 2007 2008 2009
GIG
AB
YT
ES
SO
LD
SANDISK DEMAND CONTINUED TO GROW STRONGLY THROUGH 2 DOWN CYCLES
Gigabytes Sold (Y/Y Growth Rate)

Page 15 Investor Day | February 26, 2010
TECHNOLOGY, COMPETITION

Page 16 Investor Day | February 26, 2010
NAND COST REDUCTION TRENDS
2005–2009: 45%-55% annual cost reductions;
SLC MLC (~90% of bits)
200mm 300mm, mega-fabs, automation, immersion lithography
Unprecedented productivity thru rapid technology transitions
2010–2013: 25%-35% annual cost reductions;
MLCX3 (~50% of bits)
NAND technology more challenging at 1x nm, 1y nm
EUV lithography will likely be required below 1x nm

Page 17 Investor Day | February 26, 2010
Source: SanDisk estimate 2010; ITRS 2008
MEMORY TECHNOLOGIES‘ COST CURVES
0%
1%
10%
100%
1,000%
2001 2002 2003 2004 2005 2006 2007 2008 2009 2010 2011 2012 2013 2014 2015 2016
Co
st/
GB
($)
co
mp
are
d t
o N
AN
D c
ost
in y
ear
2005
NAND
FeRAM
MRAM
PCM Conservative
3D Optimistic
BICS Optimistic
PCM Optimistic
3D Conservative
BICS Conservative

Page 18 Investor Day | February 26, 2010
3D R/W (READ/WRITE) MEMORY—SCALABLE CROSS-POINT DIODE ARRAY
Joint development with Toshiba, now proceeding at Yokkaichi
Making good progress with R/W layer, but not yet ready for production
At x8 equivalent, and given our knowhow in 3D diode arrays, we believe 3D R/W is the most likely successor for NAND in the coming decade: could usher second SSD wave
Source: IEDM 2009 Short Course, ―Low Power Approaches for Memories‖, by A. Nitayama
Page 19 Investor Day | February 26, 2010
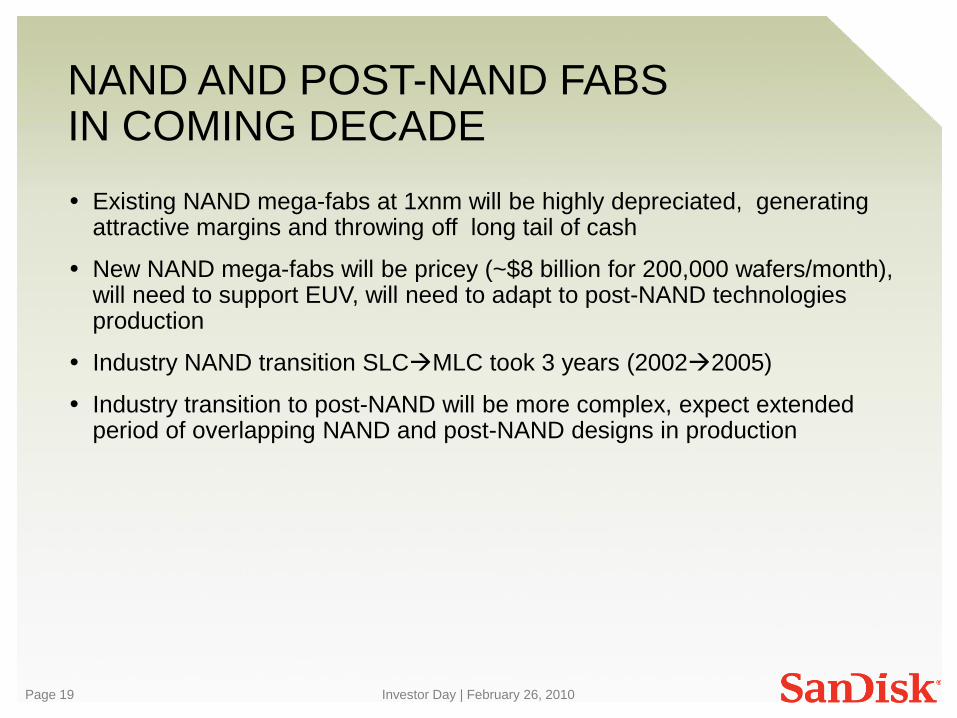
NAND AND POST-NAND FABS IN COMING DECADE
Existing NAND mega-fabs at 1xnm will be highly depreciated, generating attractive margins and throwing off long tail of cash
New NAND mega-fabs will be pricey (~$8 billion for 200,000 wafers/month), will need to support EUV, will need to adapt to post-NAND technologies production
Industry NAND transition SLCMLC took 3 years (20022005)
Industry transition to post-NAND will be more complex, expect extended period of overlapping NAND and post-NAND designs in production

Page 20 Investor Day | February 26, 2010
HOW WE STACK UP AGAINST NAND COMPETITION
• SanDisk Flash Technology/Intellectual Property: – 32nm: leader in X3, industry‘s most cost effective, 2010 work-horse – 24nm: expect to lead with X3: production work-horse in 2011 – X4: shipping products, but limited applications – Systems, Advanced controllers, AFM (Adaptive Flash Management):
uniquely advantaged relative to competition– Security, Content: leadership position– Die stacking: leading 8 die stacking in high volume (microSD™, iNAND™)
• Scale: Great partnership with Toshiba: – Our Fab 3 + Fab 4 deliver ~ 35% of world‘s NAND output
• Flash Storage is really tough to do well. Leadership requires:– Most advanced semi production technology applied on massive scale– Rapid product innovations and strong IP.
• SanDisk: We do Flash right !

Page 21 Investor Day | February 26, 2010
INTELLECTUAL PROPERTY: STATUSSAMSUNG CROSS-LICENSE: Seven-year patent cross license renewal with estimated effective
rate of the fixed payments and royalties at approximately 50% of recent effective royalty rate
FLASH MEMORY PORTFOLIO: Wall Street Journal‘s Patent Board Scorecard ranked SanDisk # 2
in 2009 among the semiconductor companies it tracks, up from # 4 in 2008 Licensed to ~85% of NAND industry output
CARDS: SD, microSD now account for~85% (and growing) of all cards
sold—royalties shared with SD 3C (Toshiba, Panasonic, SanDisk)
AS YET UNTAPPED LICENSING POTENTIAL: Extensive Systems/controllers, SSD, Mobile Security (content) Fundamental patents in 3D diode arrays (apply to most 3D
approaches)

Page 22 Investor Day | February 26, 2010
OUR FLASH CAPACITY PLANS
• We believe that growing demand should drive a healthy industry-wide supply/demand balance in 2010, likely to continue into 2011
• We are focused on technology upgrades and X3 in Fab 3 and Fab 4
• In 2010/2011 we are planning to acquire our 50% of remaining unused capacity in Fab 4, bringing our captive output to ~2 million 300mm wafers/year. – We will leverage non captive sources when demand exceeds this captive
supply
• We project demand for NAND and 3D R/W to outstrip our captive and non-captive supply sometime in the next few years
• Investment in new captive fab believed premature, will require healthy demand/supply balance and ROIC:– We will evaluate continuously and proceed with caution

Page 23 Investor Day | February 26, 2010
GROWTH IN THE COMING DECADE

Page 24 Investor Day | February 26, 2010
0
10,000
20,000
30,000
40,000
50,000
60,000
70,000
80,000
2000 2001 2002 2003 2004 2005 2006 2007 2008 2009 2010 2011 2012 2013
MIL
LIO
NS
OF
GIG
AB
YT
ES
FLASH MARKETS ARE YOUNG: GROWTH MOSTLY STILL AHEAD
Source: Chart created by SanDisk based on data from Gartner: NAND Flash Memory Supply and Demand, Worldwide,
1Q08–4Q10 (4Q09 Update)
Legacy
Consumer
Mobile
Computing

Page 25 Investor Day | February 26, 2010
FLASH IS EVERYWHERE
LEGACY CONSUMER:• Digital cameras• Digital camcorders• GPS• MP3• Gaming• USB Flash drives• e-Books
MOBILE
COMPUTING:• Netbooks, Notebooks, Tablets, MID• Servers, Enterprise
OTHER:• Automotive• Industrial• Medical• Military

Page 26 Investor Day | February 26, 2010
iPhone/SmartPhone/Tablet
= New PC

Page 27
0
200
400
600
800
1,000
1,200
2005 2006 2007 2008 2009E 2010E 2011E 2012E 2013E
An
nu
al
Un
it S
hip
men
ts (
MM
)
Notebook PCs Smartphones Desktop PCs
Notebook PC + Smartphone Shipments Dwarf DesktopConsumers Increasingly Prefer Portability
Unit Shipments of Desktop PCs vs. Notebook PCs + Smartphones, 2005 – 2013E
2006: Inflection Point
Notebook PC + Smartphone
Shipments Broke
Away from Desktop PC
Note: Notebook PCs include Netbooks. Source: IDC, Gartner, Morgan Stanley Research estimates.
Source: December 15, 2009, The Mobile Internet Report, Mary Meeker © 2009 Morgan Stanley

Page 28 Investor Day | February 26, 2010
Source: December 15, 2009, The Mobile Internet Report, Mary Meeker © 2009 Morgan Stanley;
DRAMExchange; SanDisk estimates
iPHONE SEMICONDUCTOR CONTENT
$-
$20
$40
$60
$80
$100
$120
$140
$160
$180
2007 iPhone 2.5G4, 8, 16 GB
2008 iPhone 3G8, 16 GB
2009 iPhone 3GS16, 32 GB
NAND LCD Baseband AP Camera Module DRAM Wifi RF

Page 29 Investor Day | February 26, 2010
FLASH SSD: MASSIVE MARKET IN COMING DECADE
• SSD adoption still in early stages: expect market acceleration in 2011 with 2x nm NAND, tipping point reached with1x nm NAND
• SSD will come in all kinds of form-factors (e.g. thin), optimized for specific usage models, fostering new architectures/innovation
• SSD price elasticity will serve to correct industry excess supply
• We see SSD as playing to our strengths in Systems, IP and captive supply, and expect to be a long term SSD participant

Page 30
Note: Apple iTunes yet to offer full length media streaming. Source: Company websites.
Connectivity = Cloud ComputingConsumers Expect to Get Their Stuff 24x7 from Palms of Their Hands
Music
in the Cloud
Video
in the CloudApps / Documents
in the Cloud
Photos
in the Cloud
Professional Content
Leading repository TBD
Apple iTunes? Amazon.com?
Netflix? Hulu? Spotify?
User Generated Content
Facebook is the leading
repository for user-generated
photos / videos / comments /
links to music / social games
Unified Digital
Locker
Shopping / Stuff
in the Cloud
Source: December 15, 2009, The Mobile Internet Report, Mary Meeker © 2009 Morgan Stanley

Page 31 Investor Day | February 26, 2010

Page 32 Investor Day | February 26, 2010
SUMMARY: FLASH IS EVERYWHERE, WILL BE BIGGER THAN YOU THINK!
• FLASH UBIQUITOUS, AND GROWING
• SMARTPHONE = ―NEW PC‖ FLASH SSD
• ―MOBILE INTERNET IN EARLY INNINGS, WILL BE BIGGER THAN YOU THINK‖ (Morgan Stanley*)
• CLOUD COMPUTING: LAST NODE ON NETWORK, IN YOUR POCKET
• HIGHLY SCALED FLASH GETTING HARD TO DO WELL, SYSTEM SOLUTIONS BECOMING KEY PLAYING TO OUR STRENGTHS
Source: December 15, 2009, The Mobile Internet Report Mary Meeker © 2009 Morgan Stanley

Page 33 Investor Day | February 26, 2010
SANJAY MEHROTRAPresident & Chief Operating Officer
WELL POSITIONED FOR PROFITABLE GROWTH

Page 34 Investor Day | February 26, 2010
AGENDA
• Market Opportunities and Innovation
• Leadership in Technology and Cost
• Scalable Operations, Solid Execution
SanDisk well positioned in all these areas due to its Vertically Integrated Structure and Diversified OEM/Retail Businesses

Page 35 Investor Day | February 26, 2010
• Expanded OEM channels and customers
• Diversified memory products
• Expanded global reach in OEM and Retail
SANDISK PRODUCT REVENUE MIX
2009 STRATEGIC SHIFT:Created New Growth Opportunities in Both OEM and Retail
2009 2008
OEM
36%
Retail
64%
OEM
50%
Retail
50%

Page 36 Investor Day | February 26, 2010
GLOBAL REACH STRONGER THAN EVER
Bell World
Best Buy
Costco
CVS
Future Shop
GameStop
K-Mart
Meijer/Food
Office Depot
OfficeMax
Sears
Sprint
Staples
Verizon
Walgreen’s
Walmart
Carrefour
Casa Bahia
Extra
FNAC
Musimundo
Sanborns
Ripley
Walmart
Carphone Warehouse
Carrefour
Comet
Dixons
FNAC
Jessops
Orange
MediaMarkt
Ringfoto
Saturn
Tesco
Walmart
Amazon
BIC
Edion
K’s
Kitamura
Kojima
Matsukiyo
Yamada
Yodobashi
Japan
N. America
Bing Lee
Broadway
Citicall
Focus
Fortress
Jumbo
Lotte
MIcroMax
Noel Leeming
OfficeWorks
Reliance
Tesco Lotus
• 242,000 storefronts world wide (Retail)
• 5 of top 10 customers in 2009 were Global Handset Manufacturers (OEMs)
• Increasing revenue contribution from emerging markets
Latin
America
Asia/
Pac Rim
Europe

Page 37 Investor Day | February 26, 2010
0
10,000
20,000
30,000
40,000
50,000
60,000
70,000
80,000
90,000
2003 2004 2005 2006 2007 2008 2009 2010 2011 2012 2013
WE ARE IN THE EARLY STAGES OF FLASH IN MOBILE AND COMPUTING MEGA-MARKETS
MIL
LIO
NS
OF
GIG
AB
YT
ES
76 Billion GB
Source: Gartner: ―4Q09 NAND & SSD Update: Enabling Products or Enabling Profits?‖ (November 2009)
2008-2013, 5-Yr CAGR: 74%
Mobile
Computing
20 Million GB
Other Automotive Computing Gaming Mobile Phone
Camcorder USB Drive Media Player Digital Camera

Page 38 Investor Day | February 26, 2010
MOBILE: SANDISK‘S PRIMARY GROWTH DRIVER
END MARKET 2006 2007 2008 2009
Mobile 25% 35% 34% 41%
Imaging 37% 26% 25% 24%
USB 14% 14% 13% 13%
Other Markets 14% 13% 14% 10%
License & Royalty 10% 12% 15% 12%
TOTAL REVENUE 100% 100% 100% 100%
Page 39 Investor Day | February 26, 2010
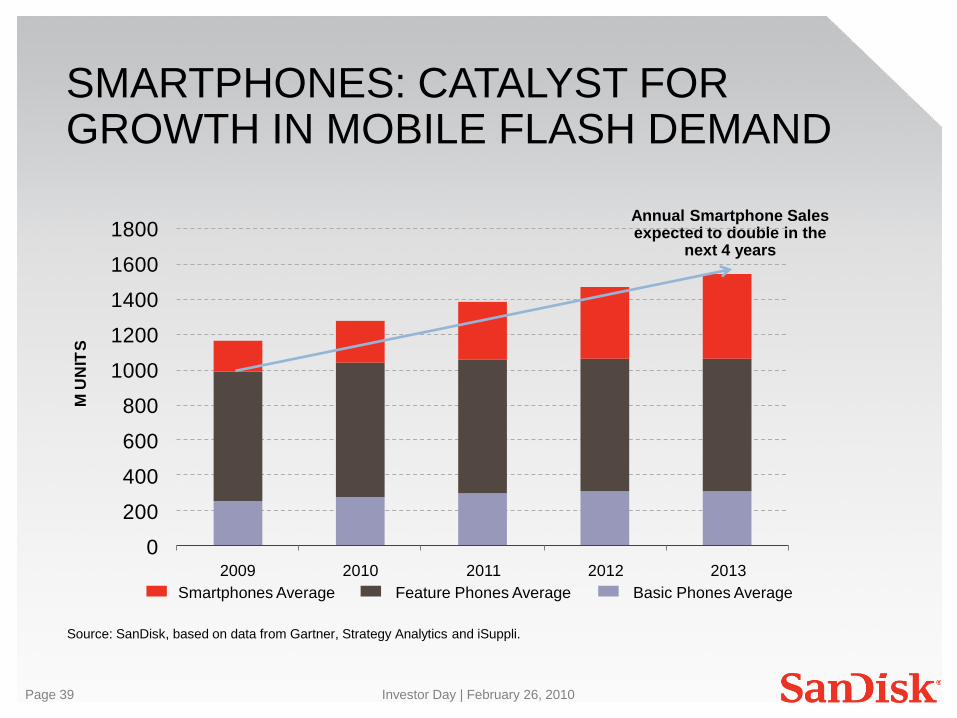
SMARTPHONES: CATALYST FOR GROWTH IN MOBILE FLASH DEMAND
Source: SanDisk, based on data from Gartner, Strategy Analytics and iSuppli.
Annual Smartphone Sales expected to double in the
next 4 years
0
200
400
600
800
1000
1200
1400
1600
1800
2009 2010 2011 2012 2013
M U
NIT
S
Smartphones Average Feature Phones Average Basic Phones Average

Page 40 Investor Day | February 26, 2010
SANDISK MOBILE POINTS OF ENGAGEMENT: BEST IN THE INDUSTRY
Handset
Vendor
Network
Operator
Global
Retail
Embedded Bundled Bundled AftermarketAftermarket

Page 41 Investor Day | February 26, 2010
SOLID STATE DRIVE: A LARGE EMERGING DEMAND DRIVER
SSD adoption expected to pick up in 2010, accelerate in 2011
Gartner projects SSD to approach 20% of NAND bits shipped in 2012
Notebooks: Price/Performance key trigger point
Flash uniquely enables exciting new devices– Netbooks, Tablets, others– Smartphone as a PC– Thin Form Factor, Low Power, High Performance

Page 42 Investor Day | February 26, 2010
INNOVATION

Page 43 Investor Day | February 26, 2010
SANDISK INNOVATION FOCUS AREAS
• Mobile Embedded Applications
• Mobile Network Operator Service Discovery Cards
• Solid State Drives
• Leveraging Technology and System Expertise Across the Entire SanDisk Product Portfolio

Page 44 Investor Day | February 26, 2010
PIONEERING NEW MOBILE EMBEDDED SOLUTIONS
TimeMLC X3
Application
Requirements
Raw Flash
Capability

Page 45 Investor Day | February 26, 2010
PIONEERING NEW MOBILE EMBEDDED SOLUTIONS
TimeMLC X3
Application
Requirements
Raw Flash
Capability
Adaptive Flash Management (AFM) — bridging the gapSanDisk pioneers

Page 46 Investor Day | February 26, 2010
PARTNERING WITH MOBILE NETWORK OPERATORS: SERVICE DISCOVERY CARDS
Historically, carriers have viewed the microSD™ cards as an extension of the phone—like a Bluetooth earpiece.
The Mobile Internet explosion is forcing carriers to find economical solutions to grow their service offerings
SanDisk’s Service Discovery Cards (SDC) leverage unique capabilities (streaming, caching, encrypting) enabled by our system, to act as anextension of the network.

Page 47 Investor Day | February 26, 2010
SANDISK SSD INNOVATION FOCUS
SanDisk expects to be a significant participant in the SSD market
Evolving Product lineup – 2009 SanDisk® pSSD (MLC) for Netbooks
– 2010 SanDisk® G3 SSD (MLC) product launch
– 2011 Targeting innovative, next generation products for Notebook, Netbook, Tablet and Smartphone markets

Page 48 Investor Day | February 26, 2010
LEVERAGING TECHNOLOGYAND SYSTEM EXPERTISE
SANDISK EXTREME®
SANDISK EXTREME® PRO™
Up to 90MB/sec
SANDISK ULTRA®
Up to 15MB/sec
BLUEX3, X4
X2, X3
X2
High Performance, High Capacity, Low Cost
EMBEDDEDX2, X3
Page 49 Investor Day | February 26, 2010
AGENDA
• Market Opportunities and Innovation
• Leadership in Technology and Cost
• Scalable Operations, Solid Execution

Page 50 Investor Day | February 26, 2010
SANDISK-TOSHIBA PARTNERSHIP BUILDING ON 10 YEARS OF NAND COLLABORATION
8 Generations of MLC & 3 Generations of X3 Developed Jointly Over 10 Years
R&D Collaboration and Cost Sharing– NAND and 3D Read/Write
2 Existing Flash Manufacturing Joint Ventures in Fab 3 and Fab 4
SanDisk and Toshiba Combined 300mm NAND Capacity > 4 Mil Wafers/year– Our cost benefits capture the full scale of production in Fab 3 and Fab 4

Page 51 Investor Day | February 26, 2010
X3 IS EXTREMELY VALUABLE…
Significantly increases Gigabytes/wafer
– SNDK 32nm, 32Gb X2 140 mm2
– SNDK 32nm, 32Gb X3 113 mm2
Substantially Lowers Cost without any additional Capital
Investment or Process Complexity
Pricing competitive to X2: Expands Gross Margin and Improves
Return on Invested Capital
X3 ~20% more Gigabytes/wafer

Page 52 Investor Day | February 26, 2010
…IF YOU CAN DEPLOY IT
0%
10%
20%
30%
40%
50%
60%
4Q09
Source: Gartner: 4Q09 NAND & SSD Update: ―Enabling Products or Enabling Profits?" November 2009
ESTIMATED X3 MIX OF FAB BIT OUTPUT (GARTNER DATA)
System Expertise
is key to enabling
high X3 production mix
SanDisk Toshiba Samsung Micron Hynix

Page 53 Investor Day | February 26, 2010
SANDISK UTILIZING X3 IN ALL MAJOR END MARKETS
Products utilizing X3
Mobile: microSD, M2, iNAND
Imaging: SD, MS Pro Duo
Q409 END MARKET SALES UTILIZING X3
0%
10%
20%
30%
40%
50%
60%
70%
80%
90%
100%
Mobile Imaging USB
% of GB sold

Page 54 Investor Day | February 26, 2010
2008 2009 2010 2011 2012 2013
256G
128G
64G
32G
16G
8G
4G
SANDISK NAND ROADMAP
43nmX2, X3
43nm
X2, X3
43nm
X4
32nm
X2, X3
32nm
X3
24nm
X2, X3
24nm
X3
1xnm
X2, X3

Page 55 Investor Day | February 26, 2010
CONTINUED RAPID TECHNOLOGY TRANSITIONS
Source: SanDisk.
TECHNOLOGY TRANSITION FOR TOTAL CAPTIVE WAFER OUTPUT—% OF GB
0%
10%
20%
30%
40%
50%
60%
70%
80%
90%
100%
2006 2007 2008 2009 2010
90 nm 70 nm 56 nm 43 nm 32 nm 24 nm90 nm 70 nm 56 nm 43 nm 32 nm 24 nm

Page 56 Investor Day | February 26, 2010
5TH CONSECUTIVE YEAR OF > 50% COST REDUCTION(1)
COST/GB REDUCTION
MEMORY
(Includes 1H09 Fab underutilization)
NON-MEMORY
0%
10%
20%
30%
40%
50%
60%
2005 2006 2007 2008 2009
Technology Transitions
Increased Mix of X3/X4
Economies of Scale and
Productivity Improvements
1 See note on Page 198
Total Cost Reduction Memory Non-Memory

Page 57 Investor Day | February 26, 2010
2008 2009
Co
st p
er
Un
it
NON-MEMORY COSTS DECLINED EVEN FASTER THAN MEMORY COSTS(1)
ex: 4GB MICROSD™ CARD
-52%
77%
80%
Memory Controller Assy/Test Other
1 See note on Page 198

Page 58 Investor Day | February 26, 2010
2010 COST REDUCTION OUTLOOK
Cost/GB reduction expected to be in the range of 30-40%
X3 expected to be > 50% of fab bit output
Key Cost Reduction Drivers: – 32nm expected to be > 70% of fab bit output– Continued non-memory cost reduction

Page 59 Investor Day | February 26, 2010
AGENDA
• Market Opportunities and Innovation
• Leadership in Technology and Cost
• Scalable Operations, Solid Execution

Page 60 Investor Day | February 26, 2010
0.0
0.2
0.4
0.6
0.8
1.0
1.2
1.4
1.6
2004 2005 2006 2007 2008 2009 2010
MIL
LIO
NS
OF
UN
ITS
SO
LD
PE
R D
AY
SANDISK SCALE APPROACHING 1.5 MILLION UNITS PER DAY
Source: SanDisk.
~ 500M units/ year

Page 61 Investor Day | February 26, 2010
JOINT VENTURE FABS: INDUSTRY LEADING SCALE AND EFFICIENCY
SanDisk 2009
• ~1.5 Million 300 mm wafers output (SanDisk)– returned to 100% Utilization in 2nd Half
Bit output growth ~38%
– includes JV restructuring
– 43nm >90% Bit production
– X3/X4 ~50% of Bit production
Source: SanDisk.
.
Yokkaichi, Japan

Page 62 Investor Day | February 26, 2010
2010: SUPPLY GROWTH ALIGNED WITH DEMAND
MEMORY SUPPLY PLANS
Captive bit output growth expected to be at or below 70%– Growth mostly expected from 32nm transition– In 2H 2010, expect to add ~10% wafer capacity to JVs by expanding
in unused Fab 4 clean room space
DEMAND EXPECTATIONS
Bit demand growth expected to be greater than 70%
END MARKET SHARE
Expect to maintain or grow market share through improved inventory management and potentially non-captive purchases

Page 63 Investor Day | February 26, 2010
SANDISK SHANGHAI ASSEMBLY/TEST FACILITY: ANOTHER COMPETITIVE ADVANTAGE
Key advantages: cost, cycle time, multi-die capability
Source: SanDisk.
.
2007 UNIT PRODUCTION
Sub-Contract
Partners
2009 UNIT PRODUCTION
SanDisk
Sub-Contract
Partners
Page 64 Investor Day | February 26, 2010
TO
TA
L M
EM
OR
Y U
NIT
S S
OL
D
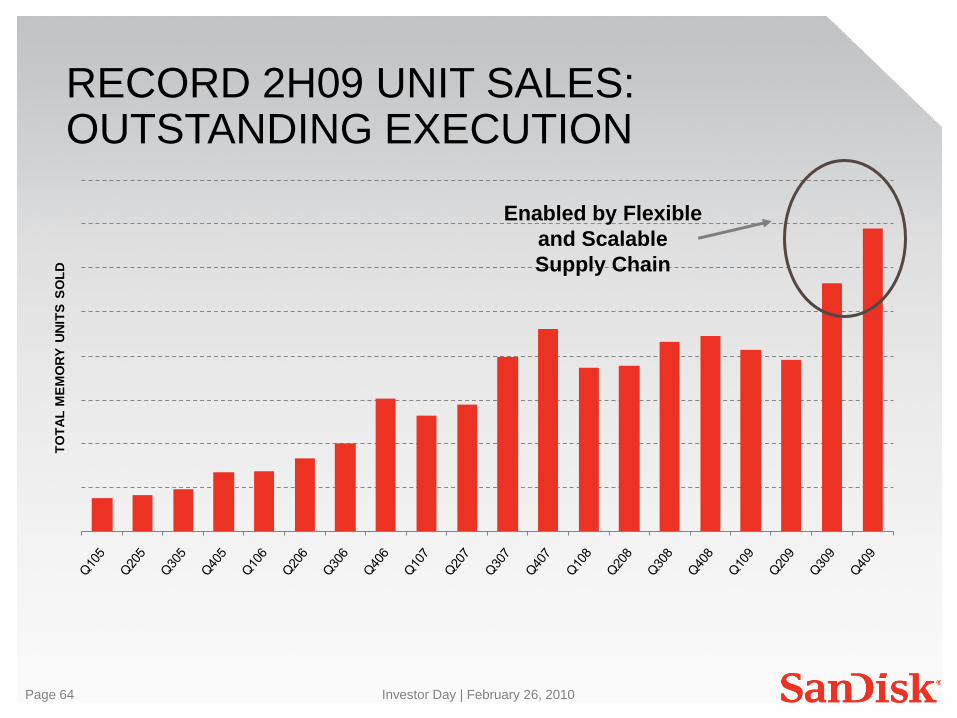
RECORD 2H09 UNIT SALES: OUTSTANDING EXECUTION
Enabled by Flexible
and Scalable
Supply Chain

Page 65 Investor Day | February 26, 2010
Retail OEM Technology OperationsFab
FOCUSED ORGANIZATION, VERTICAL INTEGRATION STRATEGY
EXECUTION
Market Opportunities Cost Effectiveness Scale

Page 66 Investor Day | February 26, 2010
SUMMARY
Strong Demand Ahead
Spurring Growth through both OEM and Retail Businesses
Building on core competencies
– Product Innovation
– Technology Leadership
– High Volume Operations
Solid track record of execution
SanDisk Best Positioned to
Drive Future Growth

Page 67 Investor Day | February 26, 2010
SANDISK 2010 INVESTOR DAY MEETING
We are taking a short break.
The Investor Day Meeting will resume shortly.

Page 68 Investor Day | February 26, 2010
YORAMCEDARExecutive Vice President, OEM & Corporate Engineering
Page 69 Investor Day | February 26, 2010
OEM offers tremendous growth
opportunities which SanDisk is
uniquely positioned to exploit.

Page 70 Investor Day | February 26, 2010
SANDISK‘S OEM PORTFOLIO
MOBILEIMAGING & GAMING COMPUTING
PRIVATE LABEL & COMPONENT BUSINESS

Page 71 Investor Day | February 26, 2010
SANDISK‘S 2009 OEM REVENUE MIX
Grew from ~$1.0B in 2008
to ~$1.5B in 2009 with strong
growth in units and PBs
Mobile Handset Vendors
52%
Computing5%
Imaging & Gaming12%
Private Label Cards & Components
13%
Mobile Network Operators
18%

Page 72 Investor Day | February 26, 2010
SANDISK‘S 2009 OEM REVENUE MIX
Mobile Handset Vendors
52%
Computing5%
Imaging & Gaming12%
Private Label Cards & Components
13%
Mobile Network Operators
18%

Page 73 Investor Day | February 26, 2010
IMAGING & GAMING
SLR HD VIDEO ON SD

Page 74 Investor Day | February 26, 2010
IMAGING & GAMING
SLR HD VIDEO ON SD MOBILE GAMING PMP
16 – 32 – 64GB+

Page 75 Investor Day | February 26, 2010
SANDISK‘S 2009 OEM REVENUE MIX
Mobile Handset Vendors
52%
Computing5%
Imaging & Gaming12%
Private Label Cards & Components
13%
Mobile Network Operators
18%

Page 76 Investor Day | February 26, 2010
PRIVATE LABEL AND COMPONENT BUSINESS
In 2009, SanDisk introduced a new business...
…it represented 13% of our OEM business in 2009.

Page 77 Investor Day | February 26, 2010
SANDISK‘S 2009 OEM REVENUE MIX
Mobile Handset Vendors
52%
Computing5%
Imaging & Gaming12%
Private Label Cards & Components
13%
Mobile Network Operators
18%

Page 78 Investor Day | February 26, 2010
0
200
400
600
800
1,000
1,200
1,400
1,600
2007 2008 2009 2010 2011 2012 2013
total handsets handsets w. card slot
MOBILE STORAGE GROWTH
Source: Wireless Device Strategies Service, Strategy Analytics, February 2010
SHIPMENTS OF ALL HANDSETS, SLOTTED HANDSETS, EMBEDDED NAND, CARD SLOTS – M UNITS

Page 79 Investor Day | February 26, 2010
0
200
400
600
800
1,000
1,200
1,400
1,600
2007 2008 2009 2010 2011 2012 2013
mobile cards total handsets handsets w. card slot
SHIPMENTS OF ALL HANDSETS, SLOTTED HANDSETS, EMBEDDED NAND, CARD SLOTS - M UNITS
MOBILE STORAGE GROWTH
Source: Wireless Device Strategies Service, Strategy Analytics, February 2010

Page 80 Investor Day | February 26, 2010
0
200
400
600
800
1,000
1,200
1,400
1,600
2007 2008 2009 2010 2011 2012 2013
mobile cards embedded flash 1GB+ total handsets handsets w. card slot
SHIPMENTS OF ALL HANDSETS, SLOTTED HANDSETS, EMBEDDED NAND, CARD SLOTS - M UNITS
MOBILE STORAGE GROWTH
Source: Wireless Device Strategies Service, Strategy Analytics, February 2010

Page 81 Investor Day | February 26, 2010
SANDISK‘S 2009 OEM REVENUE MIX
Mobile Handset Vendors
52%
Computing5%
Imaging & Gaming12%
Private Label Cards & Components
13%
Mobile Network Operators
18%

Page 82 Investor Day | February 26, 2010
YOU CAN NEVER BE TOO THIN...
0.41” thick
4.9 oz
$1.50/GB
IPOD CLASSIC - HDD
0.24” thick
1.3 oz
$11.00/GB
IPOD NANO - NAND
Source: Apple, Feb 2010

Page 83 Investor Day | February 26, 2010
1.1” thick 2.5 lbs
$1.85/GB
DELL MINI 10 - HDD
0.55” thick1.3 lbs
$21.00/GB
SONY VAIO X - SSD
YOU CAN NEVER BE TOO THIN...
Half as thickHalf as heavy10x the value
Thin is In
Source: Dell, Sony, Feb 2010

Page 84 Investor Day | February 26, 2010
PERFORMANCE & MODULAR SSD
Modular SSD - pSSD Performance SSD - G3
Smaller and lower cost than an HDD Faster and more reliable than an HDD
Netbooks Smartbooks
Tablets
Notebooks Desktops
Servers

Page 85 Investor Day | February 26, 2010
-
2,000
4,000
6,000
8,000
10,000
12,000
14,000
16,000
2007 2008 2009 2010 2011 2012 2013
DE
MA
ND
(P
B)
SSD: GROWTH IS JUST STARTING
Source: Gartner: Semiconductor Forecast Database, 4Q09
Performance
SSD
Modular
SSD
Enterprise

Page 86 Investor Day | February 26, 2010
8 of the 10Top Netbook MakersUse SanDisk Modular SSD
Revenue basis, Source: SanDisk Market Research

Page 87 Investor Day | February 26, 2010
OEM offers tremendous growth
opportunities which SanDisk is
uniquely positioned to exploit.

Page 88 Investor Day | February 26, 2010
SYSTEM DESIGN AT SANDISK‘S CORE
WORLD CLASS
Cutting-edge, capital-intensive
wafer fabs
WORLD CLASS
Responsive distribution: lean supply
chains and global footprints
Memory
Fabrication
Memory
Design
System
Design
System
Assembly &
Logistics
Retail
& OEM
SANDISK‘S CORE
More bits, more performance and
ultimately more revenue ($$) per wafer

Page 89 Investor Day | February 26, 2010
SANDISK DRIVES EVOLUTION OF LEADING FLASH FORMATS
• Standardization → Market Expansion
• Market Expansion → Volume
UFD
mDOC
miniSD™
microSD™
SD™
MMC™
CF®
Memory
Stick
PRO™
iNAND
SDC
PC Card
iNAND → focus is on enabling embedded X3
SDC → ―More than memory‖— service discovery card

Page 90 Investor Day | February 26, 2010
SANDISK DRIVES EVOLUTION OF LEADING FLASH FORMATS
• Standardization → Market Expansion
• Market Expansion → Volume
UFD
mDOC
miniSD™
microSD™
SD™
MMC™
CF®
Memory
Stick
PRO™
iNAND
SDC
PC Card
iNAND → Focus is on enabling embedded X3
SDC → ―More than memory‖— service discovery card
0
200
400
600
800
2004 2005 2006 2007 2008 2009 2010
Slo
tted
Han
dsets
(M
)
Source: Wireless Device Strategies Service, Strategy Analytics, February 2010
Page 91 Investor Day | February 26, 2010SanDisk Confidential
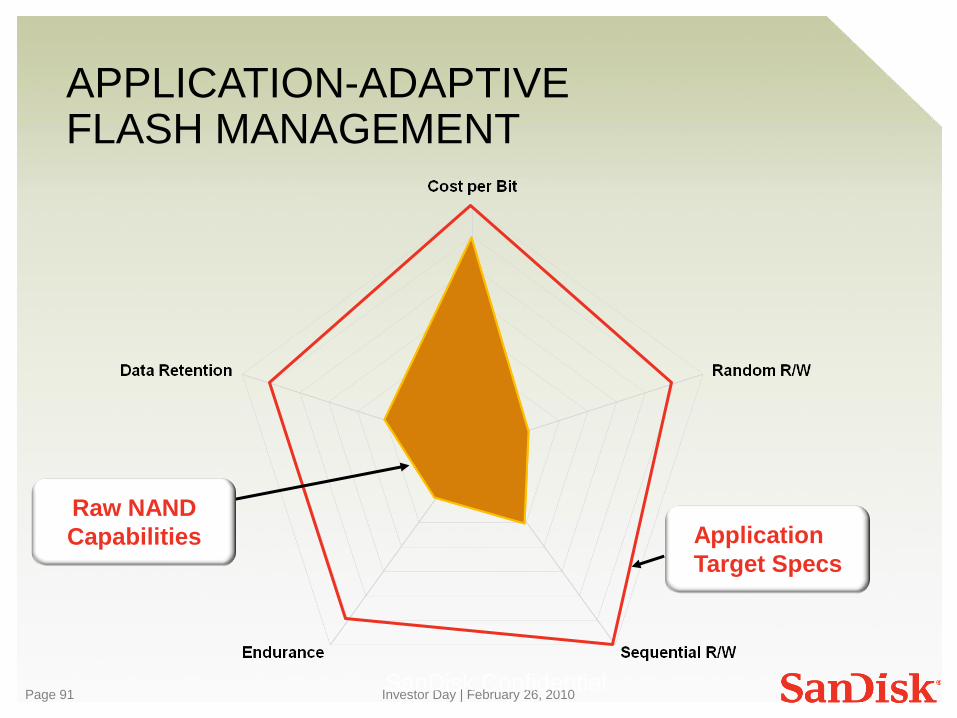
Application
Target Specs
APPLICATION-ADAPTIVE FLASH MANAGEMENT
Raw NAND
Capabilities

Page 92 Investor Day | February 26, 2010SanDisk Confidential
Application
Target Specs
APPLICATION-ADAPTIVE FLASH MANAGEMENT
Raw NAND
Capabilities
Adaptive Flash
Management

Page 93 Investor Day | February 26, 2010
THE KEY TO X3 IS ADOPTION
2003 2004 2005 2006 2007 2008 2009 2010 2011 2012
Time from Introduction to 50% bit share
X2 MLC
X2
SanDisk Rest of Industry 50% Adoption
Source: Internal Estimates, Gartner: NAND Flash Memory Supply and
Demand, Worldwide, 1Q08–4Q10 (4Q09 Update)

Page 94 Investor Day | February 26, 2010
THE KEY TO X3 IS ADOPTIONTime from Introduction to 50% bit share
?X3
X3
2003 2004 2005 2006 2007 2008 2009 2010 2011 2012
X2 MLC
X2
SanDisk Rest of Industry 50% Adoption
Source: Internal Estimates, Gartner: NAND Flash Memory Supply and
Demand, Worldwide, 1Q08–4Q10 (4Q09 Update)

Page 95 Investor Day | February 26, 2010
THE KEY TO X3 IS ADOPTIONTime from Introduction to 50% bit share
SanDisk Rest of Industry 50% Adoption
Source: Internal Estimates, Gartner: NAND Flash Memory Supply and
Demand, Worldwide, 1Q08–4Q10 (4Q09 Update)
0%
10%
20%
30%
40%
50%
2008 2009 2010
x3
PB
%
2003 2004 2005 2006 2007 2008 2009 2010 2011 2012
X2 MLC
X2
?X3
X3

Page 96 Investor Day | February 26, 2010
SANDISK‘S 2009 OEM REVENUE MIX
Mobile Handset Vendors
52%
Computing5%
Imaging & Gaming12%
Private Label Cards & Components
13%
Mobile Network Operators
18%
Grew from ~$1.0B in 2008
to ~$1.5B in 2009 with strong
growth in units and PBs

Page 97 Investor Day | February 26, 2010
DAN INBARSenior Vice President & General Manager,OEM Mobile & Imaging

Page 98 Investor Day | February 26, 2010
Removable Card
Embedded Storage– User storage– Mobile system/boot
code
STORAGE FOR MOBILERemovable and Embedded MLC NAND Based Devices

Page 99 Investor Day | February 26, 2010
Advanced process (X3)
Advanced technology/innovation
Cost Leadership
User Experience
STORAGE FOR MOBILESanDisk broad mobile understanding creates synergy between our product line

Page 100 Investor Day | February 26, 2010
NOREM
BE
DD
ED
TE
CH
NO
LO
GY
AD
VA
NC
ES
Embedded Market2009
EMBEDDED MANAGED NAND• SanDisk has been constantly driving the industry to
managed NAND architecture

Page 101 Investor Day | February 26, 2010
NOR
SLC
EM
BE
DD
ED
TE
CH
NO
LO
GY
AD
VA
NC
ES
Embedded Market2009
EMBEDDED MANAGED NAND• SanDisk has been constantly driving the industry to
managed NAND architecture

Page 102 Investor Day | February 26, 2010
NOR
SLC
MLC
EM
BE
DD
ED
TE
CH
NO
LO
GY
AD
VA
NC
ES
Embedded Market2009
EMBEDDED MANAGED NAND• SanDisk has been constantly driving the industry to
managed NAND architecture
MLC
Boot

Page 103 Investor Day | February 26, 2010
NOR
SLC
MLC
EM
BE
DD
ED
TE
CH
NO
LO
GY
AD
VA
NC
ES
Embedded Market2009
EMBEDDED MANAGED NAND• SanDisk has been constantly driving the industry to
managed NAND architecture
MLC
Boot
Page 104 Investor Day | February 26, 2010
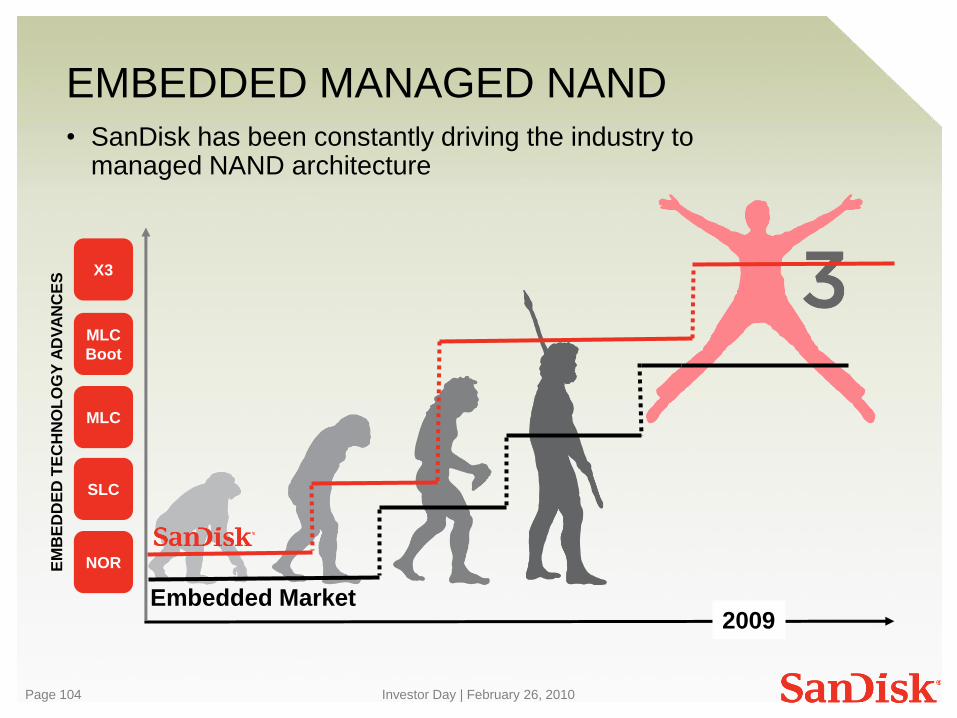
NOR
SLC
MLC
MLC
Boot
X3
EM
BE
DD
ED
TE
CH
NO
LO
GY
AD
VA
NC
ES
Embedded Market2009
EMBEDDED MANAGED NAND• SanDisk has been constantly driving the industry to
managed NAND architecture

Page 105 Investor Day | February 26, 2010
SANDISK ADVANCED TECHNOLOGYUnleash the Full Potential of Embedded Managed NAND

Page 106 Investor Day | February 26, 2010
SANDISK ADVANCED TECHNOLOGYUnleash the Full Potential of Embedded Managed NAND
Market Requirement

Page 107 Investor Day | February 26, 2010
SANDISK ADVANCED TECHNOLOGYUnleash the Full Potential of Embedded Managed NAND
Market Requirement
43nm X2

Page 108 Investor Day | February 26, 2010
SANDISK ADVANCED TECHNOLOGYUnleash the Full Potential of Embedded Managed NAND
Market Requirement
43nm X2
32nm X2

Page 109 Investor Day | February 26, 2010
SANDISK ADVANCED TECHNOLOGYUnleash the Full Potential of Embedded Managed NAND
Market Requirement
43nm X2
32nm X2
32nm X3

Page 110 Investor Day | February 26, 2010
SANDISK ADVANCED TECHNOLOGYUnleash the Full Potential of Embedded Managed NAND
Smart
Caching
Smart
Caching
Market Requirement
43nm X2
32nm X2
32nm X3

Page 111 Investor Day | February 26, 2010
SANDISK ADVANCED TECHNOLOGYUnleash the Full Potential of Embedded Managed NAND
SLC
Emulation
Smart
Caching
Smart
Caching
Market Requirement
43nm X2
32nm X2
32nm X3

Page 112 Investor Day | February 26, 2010
SANDISK ADVANCED TECHNOLOGYUnleash the Full Potential of Embedded Managed NAND
SLC
Emulation
Smart
Caching
High Performance Mode
Smart
Caching
Market Requirement
43nm X2
32nm X2
32nm X3

Page 113 Investor Day | February 26, 2010
SANDISK ADVANCED TECHNOLOGYUnleash the Full Potential of Embedded Managed NAND
SLC
Emulation
Smart
Caching
Smart
Caching
Market Requirement
43nm X2
32nm X2
32nm X3
Adaptive Flash
Management (AFM) –Bridging the Gap
High Performance Mode

Page 114 Investor Day | February 26, 2010
SANDISK ADVANCED TECHNOLOGYUnleash the Full Potential of Embedded Managed NAND
SLC
Emulation
Smart
Caching
Smart
Caching
Market Requirement
43nm X2
32nm X2
32nm X3
32nm X3 + AFM
Adaptive Flash
Management (AFM) –Bridging the Gap
High Performance Mode

Page 115 Investor Day | February 26, 2010
SANDISK ADVANCED TECHNOLOGYUnleash the Full Potential of Embedded Managed NAND
SLC
Emulation
Smart
Caching
Smart
Caching
Market Requirement
43nm X2
32nm X2
32nm X3
32nm X3 + AFM
Adaptive Flash
Management (AFM) –Bridging the Gap
Leveraging X3 in
Embedded requires
advanced system
technology
High Performance Mode

Page 116 Investor Day | February 26, 2010
SANDISK ADVANCED TECHNOLOGYUnleash the Full Potential of Embedded Managed NAND
SLC
Emulation
Smart
Caching
Smart
Caching
Market Requirement
43nm X2
32nm X2
32nm X3
32nm X3 + AFM
Adaptive Flash
Management (AFM) –Bridging the Gap
Leveraging X3 in
Embedded requires
advanced system
technology
High Performance Mode

Page 117 Investor Day | February 26, 2010117
CACHE• High random
performance• High endurance
OPTIMIZED FOR MOBILE SYSTEM• Boot code and user storage in a single device• Design based on actual handset usage modeling• Enhanced system responsiveness – e.MMC 4.41
USER AREA• High capacity mass storage• 3-bits per cell (X3)
CODE AREA• Boot and code storage• High performance• Highly reliable
SMART MEMORY FOR SMART PHONES

Page 118 Investor Day | February 26, 2010 118
* Source: Strategy Analytics (Feb 4, 2010), embedded handsets data relates to 1GB and above
SANDISK IS GROWING EVEN FASTER THAN THE MARKET
MOBILE EMBEDDED MARKET GROWTH• Expected consistent growth in embedded MLC TAM—fueled by the high-
end segment growth
Handsets with Embedded MLC
% of total handsets
0
100
200
300
400
500
600
700
800
2009 2010 2011 2012
Mu

Page 119 Investor Day | February 26, 2010
PORTABLE NAVIGATION DEVICES
PORTABLE MEDIA PLAYERS
DVC
eREADERS
SMARTBOOKS/TABLETS
NETBOOKS
OTHER EMBEDDED OPPORTUNITIES
GAMING

Page 120 Investor Day | February 26, 2010
• Embedded high capacity is a significant
opportunity
• It requires special smart, adaptive Flash
• SanDisk is well positioned for success
SUMMARY

Page 121 Investor Day | February 26, 2010
THANK YOU

Page 122 Investor Day | February 26, 2010
Vice President, MNO Solutions
MOBILE NETWORK OPERATORS
ELLIOTBROADWIN

Page 123 Investor Day | February 26, 2010
WHY OPERATORS?
• $1,000,000,000,000
• 4,600,000,000 subscriptions
• Highly concentrated
Source: Strategy Analytics, May 2009
Page 123 Investor Day | February 26, 2010

Page 124 Investor Day | February 26, 2010
9 of the top 10Mobile Network Operators
Buy SanDiskSource: Operator ranking according to Strategy Analytics, January 10, 2010
Page 124 Investor Day | February 26, 2010

Page 125 Investor Day | February 26, 2010
‗iPHONE‘ CHANGES EVERYTHING
Two dramatic threats to carriers…
…which Flash can
significantly address…
…and SanDisk is uniquely
equipped to deliver
Page 125 Investor Day | February 26, 2010

Page 126 Investor Day | February 26, 2010
STRATEGIC PAIN-POINTS
THE CLOGGED PIPE DILEMMA
―Watching a YouTube video on a
smartphone can be equivalent to
sending 500,000 text messages
simultaneously.‖ (O2‘s CTO Derek McManus)
Thanks a billion
THE DUMB PIPE DILEMMA
Page 126 Investor Day | February 26, 2010

Page 127 Investor Day | February 26, 2010
STRATEGIC PAIN-POINTS
Page 127 Investor Day | February 26, 2010

Page 128 Investor Day | February 26, 2010
WHAT CAN FLASH DO TO HELP?
Page 128 Investor Day | February 26, 2010

Page 129 Investor Day | February 26, 2010
TIME & PLACE SHIFTING
Page 129 Investor Day | February 26, 2010

Page 130 Investor Day | February 26, 2010
Mobile
Data(Off peak)
WiFi(home)
Mobile Data(Peak)
Local
Flash
Memory
Cache
SHIFTING TIME AND PLACE IN A FLASH
Illustrative Data
Pre-
Loading
Ban
dw
idth
Fri
en
dly
Availability(everywhere, all the time)
Page 130 Investor Day | February 26, 2010

Page 131 Investor Day | February 26, 2010
CASE STUDY: SDC & MUSIC
Page 131 Investor Day | February 26, 2010

Page 132 Investor Day | February 26, 2010
CASE STUDY: SDC & MUSIC
Page 132 Investor Day | February 26, 2010

Page 133 Investor Day | February 26, 2010
STORAGE MAKES THE PIPE SMARTER
Early broadband networks relied on ―big iron‖ in
large Network Operations Centers

Page 134 Investor Day | February 26, 2010
STORAGE MAKES THE PIPE SMARTER
CDNs moved content closer to ‖the edge‖ to
speed delivery and improve the user
experience

Page 135 Investor Day | February 26, 2010
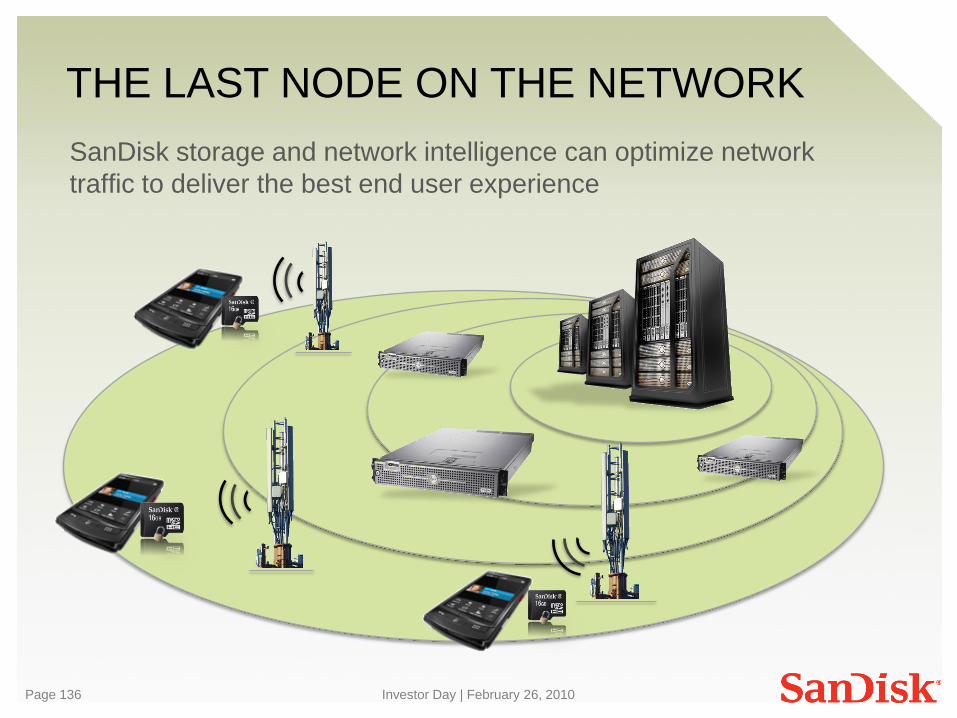
STORAGE MAKES THE PIPE SMARTER
Today‘s wireless networks are facing similar
―last mile‖ issues
Page 136 Investor Day | February 26, 2010
THE LAST NODE ON THE NETWORK
SanDisk storage and network intelligence can optimize network
traffic to deliver the best end user experience

Page 137 Investor Day | February 26, 2010
UNIQUELY SANDISK
Hardware:Trusted Flash
Firmware:Hidden
Partitions & Caplets
Software:Mobile Apps.
Servers:RT, M2M with
content owners
Content Licensing
Page 137 Investor Day | February 26, 2010

Page 138 Investor Day | February 26, 2010
THANK YOU
Page 138 Investor Day | February 26, 2010

Page 139 Investor Day | February 26, 2010
SANDISK 2010 INVESTOR DAY MEETING
We are taking a short lunch break.
The Investor Day Meeting will resume shortly.

Page 140 Investor Day | February 26, 2010
SHUKINIRSenior Vice President & General Manager, Retail Business
SANDISK RETAIL: LEADERSHIP WITH A PREMIUM

Page 141 Investor Day | February 26, 2010
AGENDA
• The strength of our retail position
• The superiority of our brand and how we are going to continue building it
• How our retail business will grow over the next several years

Page 142 Investor Day | February 26, 2010
THE STRENGTH OF SANDISK RETAIL
Page 143 Investor Day | February 26, 2010
0%
5%
10%
15%
20%
25%
30%
35%
40%
45%
50%
2008
-10
2008
-11
2008
-12
2009
-01
2009
-02
2009
-03
2009
-04
2009
-05
2009
-06
2009
-07
2009
-08
2009
-09
2009
-10
2009
-11
2009
-12
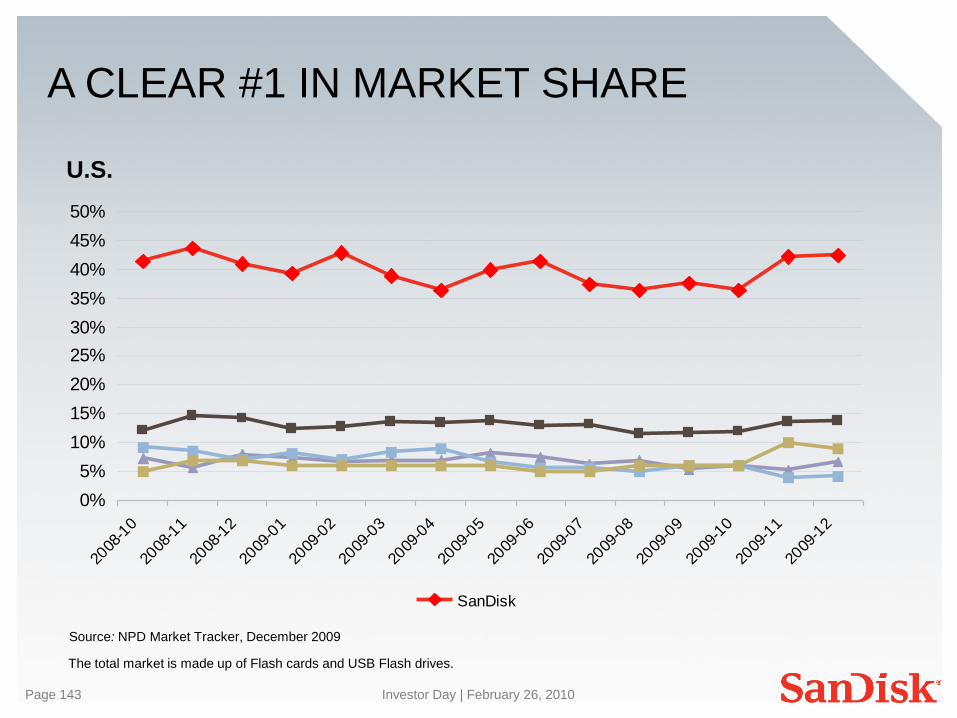
SanDisk
Source: NPD Market Tracker, December 2009
U.S.
A CLEAR #1 IN MARKET SHARE
The total market is made up of Flash cards and USB Flash drives.

Page 144 Investor Day | February 26, 2010
0%
5%
10%
15%
20%
25%
30%
35%
2008
-10
2008
-11
2008
-12
2009
-01
2009
-02
2009
-03
2009
-04
2009
-05
2009
-06
2009
-07
2009
-08
2009
-09
2009
-10
2009
-11
2009
-12
SANDISKSource: Gfk Europe, December 2009
EMEA
A CLEAR #1 IN MARKET SHARE
The total market is made up of Flash cards and USB Flash drives.

Page 145 Investor Day | February 26, 2010
A CLEAR #1 IN MARKET SHARE
The total market is made up of Flash cards and USB Flash drives.
Source: Gfk Japan, December 2009
JAPAN
0%
5%
10%
15%
20%
25%
2008
-10
2008
-11
2008
-12
2009
-01
2009
-02
2009
-03
2009
-04
2009
-05
2009
-06
2009
-07
2009
-08
2009
-09
2009
-10
2009
-11
2009
-12
SanDisk

Page 146 Investor Day | February 26, 2010
A CLEAR #1 IN MARKET SHARE
The total market is made up of Flash cards and USB Flash drives.
APAC
Source: Gfk Asia, December 2009

Page 147 Investor Day | February 26, 2010
0%
2%
4%
6%
8%
10%
12%
14%
16%
18%
20%
Average 2008-2009
PR
ICE
PR
EM
IUM
A CLEAR PREMIUM OVER COMPETITION
APAC EMEA JAPAN U.S.
Source: NPD and GFK, 2009. SD 2GB selling prices
Page 148 Investor Day | February 26, 2010
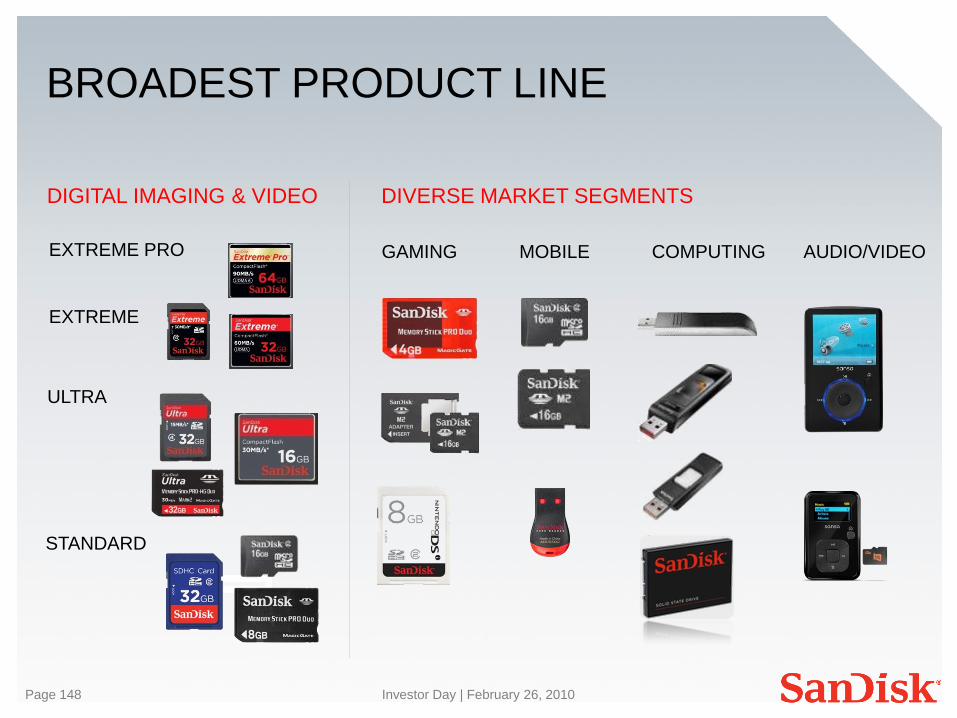
DIGITAL IMAGING & VIDEO DIVERSE MARKET SEGMENTS
BROADEST PRODUCT LINE
MOBILE
ULTRA
EXTREME PRO
EXTREME
AUDIO/VIDEOGAMING
STANDARD
COMPUTING

Page 149 Investor Day | February 26, 2010
ADDRESSING CONSUMER SEGMENTS—IMAGING
Page 150 Investor Day | February 26, 2010
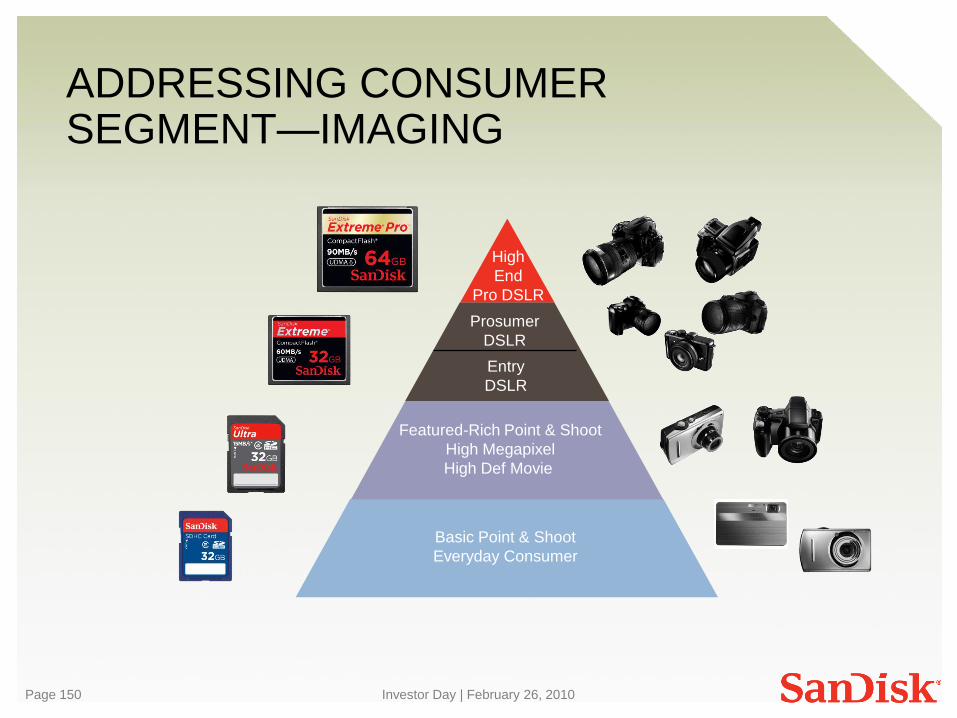
ADDRESSING CONSUMER SEGMENT—IMAGING
Basic Point & Shoot
Everyday Consumer
Featured-Rich Point & Shoot
High Megapixel
High Def Movie
High
End
Pro DSLR
Prosumer
DSLR
Entry
DSLR

Page 151 Investor Day | February 26, 2010
SEGMENTATION PAYS OFF
30%
70%
Retail Imaging Revenue Units 2009
55%
45%
Margin $ From Retail Imaging 2009
High Performance Standard

Page 152 Investor Day | February 26, 2010
ADDRESSING CONSUMER NEEDS—COMPUTING
Here‘s how:
SanDisk Ultra® Backup USB Flash Drive
• The first to add a simple customer backup* button to the USB Flash Drive
• Adding Mac OS support to transfer data between computers
• Always have your valuable files with you in a portable, rugged solution
Note: Backup function currently works only with Windows operating system

Page 153 Investor Day | February 26, 2010
ADDRESSING CONSUMER NEEDS—COMPUTING
Here‘s how:
SanDisk® G3 SSD
• A true HDD replacement that provides better computing performance
• Highly reliable with long-term data endurance

Page 154 Investor Day | February 26, 2010
ADDRESSING CONSUMER USE CASES—MOBILE

Page 155 Investor Day | February 26, 2010
ADDRESSING CONSUMER USE CASES—MOBILE
Here‘s how:
SanDisk® Media Manager Application
• Take the guess work out of transferring files to your phone
• Easily find and browse all your music and photos on your PC
Page 156 Investor Day | February 26, 2010
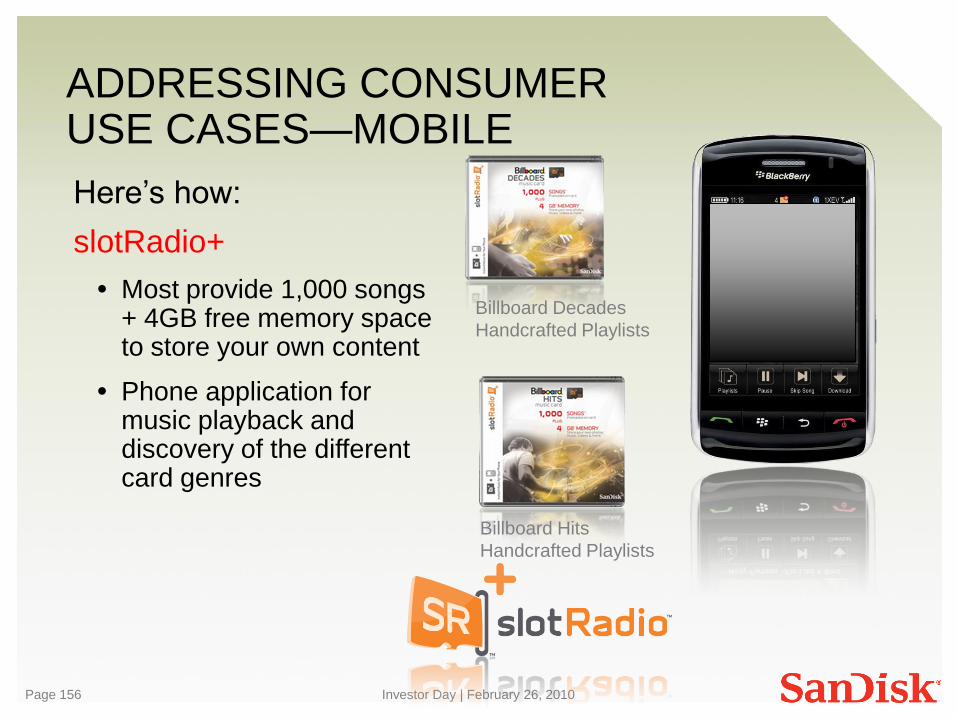
ADDRESSING CONSUMER USE CASES—MOBILE
Here‘s how:
slotRadio+
• Most provide 1,000 songs + 4GB free memory space to store your own content
• Phone application for music playback and discovery of the different card genres
Billboard Decades
Handcrafted Playlists
Billboard Hits
Handcrafted Playlists

Page 157 Investor Day | February 26, 2010
SanDisk is the premium brand in memory cards in retail

Page 158 Investor Day | February 26, 2010
SANDISK RECOGNIZED AS LEADER BY CONSUMERS
Source: Imaging Cards in US Retail, an In-Store Market Research
by BrandTruth Marketplace Intelligence Services, 2009
79% of Shoppers answered SanDisk first
2% of Shoppers mentioned some other memory card brand first
19% of Shoppers related that they were not sure/didn‘t know

Page 159 Investor Day | February 26, 2010
SANDISK RECOGNIZED AS LEADER BY STORE ASSOCIATES AS WELL
87% of associates
recommended SanDisk first
6% of associates recommended some
other memory card brand first
7% of associates related that they
were not sure/didn‘t know
Source: Imaging Cards in US Retail, an In-Store Market Research
by BrandTruth Marketplace Intelligence Services, 2009

Page 160 Investor Day | February 26, 2010
SANDISK BRAND ―OWNS‖ THE LAST 10 FEET

Page 161 Investor Day | February 26, 2010
WALMART—USA

Page 162 Investor Day | February 26, 2010
ELDORADO—MOSCOW, RUSSIA

Page 163 Investor Day | February 26, 2010
BIC YURAKUCHO—JAPAN

Page 164 Investor Day | February 26, 2010
EZONE, STAPLES & JUMBO—INDIA

Page 165 Investor Day | February 26, 2010 165
UNIEURO—ITALY

Page 166 Investor Day | February 26, 2010
VARIOUS RETAILERS—ARGENTINA

Page 167 Investor Day | February 26, 2010 167
February 25, 2010
SHARAF DG—DUBAI, UAE

Page 168 Investor Day | February 26, 2010
BESTBUY—XUJIAHUI, CHINA

Page 169 Investor Day | February 26, 2010
STATION OUTSIDE BIC YURAKUCHO—JAPAN

Page 170 Investor Day | February 26, 2010
OFFICE DEPOT—USA

Page 171 Investor Day | February 26, 2010
DIXONS—HEATHROW AIRPORT, UK

Page 172 Investor Day | February 26, 2010
IT MALL ROADSHOW—CHINA

Page 173 Investor Day | February 26, 2010 173
SATURN—PARIS, FRANCE

Page 174 Investor Day | February 26, 2010 174
February 25, 2010
EMAX—DUBAI, UAE

Page 175 Investor Day | February 26, 2010
25 February 2010
MEDIAMARKT—GERMANY

Page 176 Investor Day | February 26, 2010
TAOYUAN AIRPORT DFS—TAIWAN

Page 177 Investor Day | February 26, 2010
PHOTO SPECIALTY CHANNEL—NY
Page 178 Investor Day | February 26, 2010
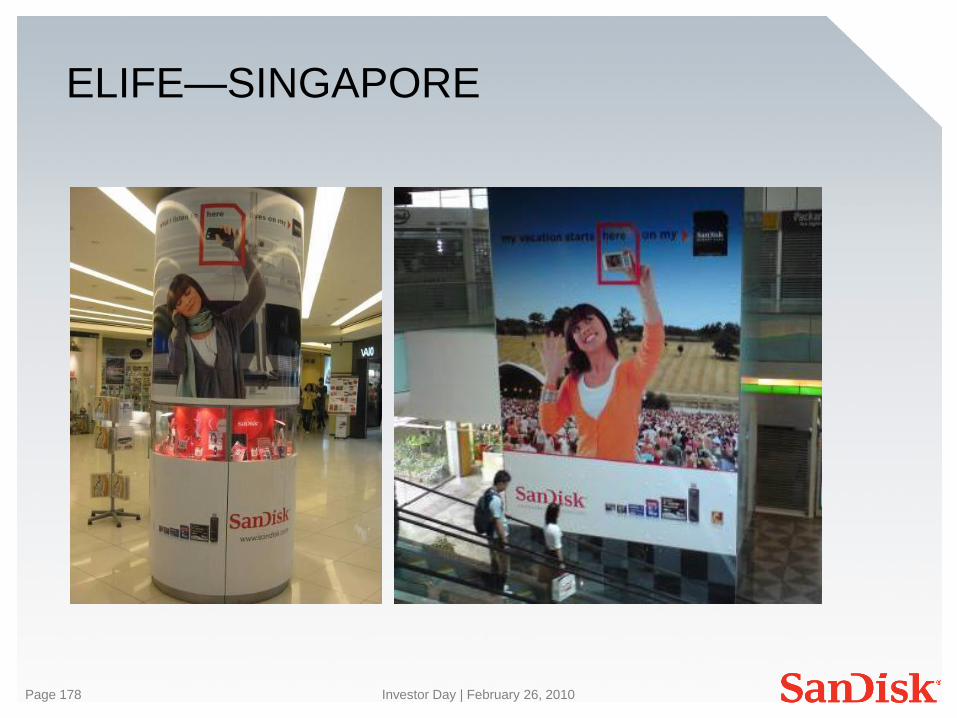
ELIFE—SINGAPORE

Page 179 Investor Day | February 26, 2010
MTR STATION—HONG KONG

Page 180 Investor Day | February 26, 2010
HUB STATIONS—TOKYO, JAPAN

Page 181 Investor Day | February 26, 2010
In More than 242,000 Stores
SANDISK BRAND ―OWNS‖ THE LAST 10 FEET

Page 182 Investor Day | February 26, 2010
SanDisk retail business will continue to grow in the coming years

Page 183 Investor Day | February 26, 2010
IMAGING MARKET PROJECTED TO GROW FURTHER
Source: Chart created by SanDisk based on data from iSuppli, data flash Q4 Market Tracker, 1209, and Gartner Flash Card Forecast 11/09
• Most new camcorders using flash
• Most new digital cameras have an HD-Video function

Page 184 Investor Day | February 26, 2010
USB MARKET PROJECTED TO GROW FURTHER
Source: Chart created by SanDisk based on data from iSuppli, data flash Q4 Market Tracker, 1209, and Gartner Flash Card Forecast 11/09
• Ubiquity of USB Ports
• Additional use cases

Page 185 Investor Day | February 26, 2010
STRONG MOBILE END MARKET GROWTH PROJECTED
Source: Chart created by SanDisk based on data from iSuppli, data flash Q4 Market Tracker, 1209, and Gartner Flash Card Forecast 11/09
• More smart phones
• Greater need for storage on mobile phones

Page 186 Investor Day | February 26, 2010
KEYS TO SUCCESS IN BRIC
Local teams have the responsibility, budgets and accountability
Business model adjusted to the local competitive landscape

Page 187 Investor Day | February 26, 2010
KEYS TO SUCCESS IN BRIC
Products designed for the specific market needs

Page 188 Investor Day | February 26, 2010
KEYS TO SUCCESS IN BRIC
Marketing campaigns to enhance brand awareness and premium
CHINA INDIA

Page 189 Investor Day | February 26, 2010
SUMMARY
SanDisk Retail is uniquely positioned with – Clear market share leadership– Clear price premium– Broadest product line targeted at specific consumer segments
The superiority of our brand– Has been built in the last 10 feet– Has leveraged the innovative and differentiated products coming
from SanDisk– Will continue to leverage on in-store presence
Our retail business will grow over the next several years through– Continuous growth of imaging and computing– Substantial growth in mobile– Increasing our share in BRIC

Page 190 Investor Day | February 26, 2010
JUDYBRUNERExecutive Vice President, Administration and Chief Financial Officer
FINANCIAL REVIEW

Page 191 Investor Day | February 26, 2010
FINANCIAL REVIEW: A PATH TO A PROMISING FUTURE
• Growth and Earnings Power Return
• Balancing Growth, Profits and Cash Flow

Page 192 Investor Day | February 26, 2010
DECISIVE ACTIONS AND STRONG EXECUTION
• Sold ~20% captive capacity to Toshiba
Balanced supply/demand & strengthened financial position
• Reduced 1H09 fab utilization by >20% and stopped wafer capacity expansion
Contributed to pricing recovery
• Streamlined into OEM/Retail units
Significantly reduced opex
• Channel diversification
2H09 OEM 56% of product revenue
• Strong execution in technology and operations
Continued product cost leadership
• Renewed Samsung license agreement
• Negotiated non-captive supply agreements
• Filed & received tax refund

Page 193 Investor Day | February 26, 2010
200920082007200620052004
Q1
Q2
Q3
Q4
Q1
Q2
Q3
Q4
Q1
Q2
Q3
Q4
Q1
Q2
Q3
Q4
Q1
Q2
Q3
Q4
Q1
Q2
Q3
Q4
REVENUE RECOVERS RAPIDLY IN 2009• GBs sold up 116% Y/Y
• ASP/GB down 48% Y/Y
$1.8B65% Growth
$2.3B30% Growth
$3.3B41% Growth
$3.9B20% Growth
$3.3B14% Decline
$3.6B6% Growth
Q409
Revenue
$1.24B
+44% Y/Y
+33% Q/Q
License/Royalty Product
Memory Unit
Growth by year 51% 24% 108% 75% 15% 26%

Page 194 Investor Day | February 26, 2010
BY END MARKET, MOBILE & IMAGING WERE THE PRIMARY DRIVERS OF PRODUCT REVENUE GROWTH IN 2009
$0
$100
$200
$300
$400
$500
$600
$700
Q108 Q208 Q308 Q408 Q109 Q209 Q309 Q409
RE
VE
NU
E IN
MIL
LIO
NS
Mobile Imaging USB AV & Gaming Other Markets
Page 195 Investor Day | February 26, 2010
$0
$100
$200
$300
$400
$500
$600
$700
Q108 Q208 Q308 Q408 Q109 Q209 Q309 Q409
RE
VE
NU
E IN
MIL
LIO
NS
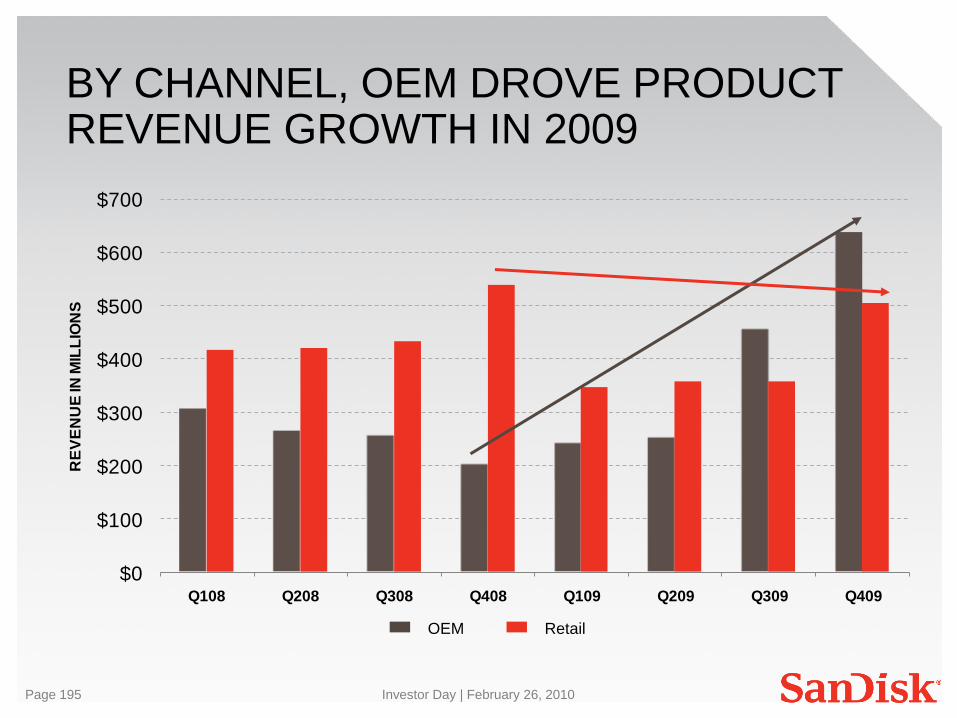
BY CHANNEL, OEM DROVE PRODUCT REVENUE GROWTH IN 2009
OEM Retail

Page 196 Investor Day | February 26, 2010
2006 2007 2008 2009
UN
IT S
AL
ES
IN M
ILL
ION
S
Americas EMEA APAC
RETAIL DEMAND STRONG IN APAC; OPPORTUNITY REMAINS FOR RETAIL RECOVERY IN AMERICAS/EMEA
Page 197 Investor Day | February 26, 2010
-35%
-30%
-25%
-20%
-15%
-10%
-5%
0%
5%
10%
15%
2005 2006 2007 2008 2009
SN
DK
Q/Q
AS
P/G
B C
HA
NG
E
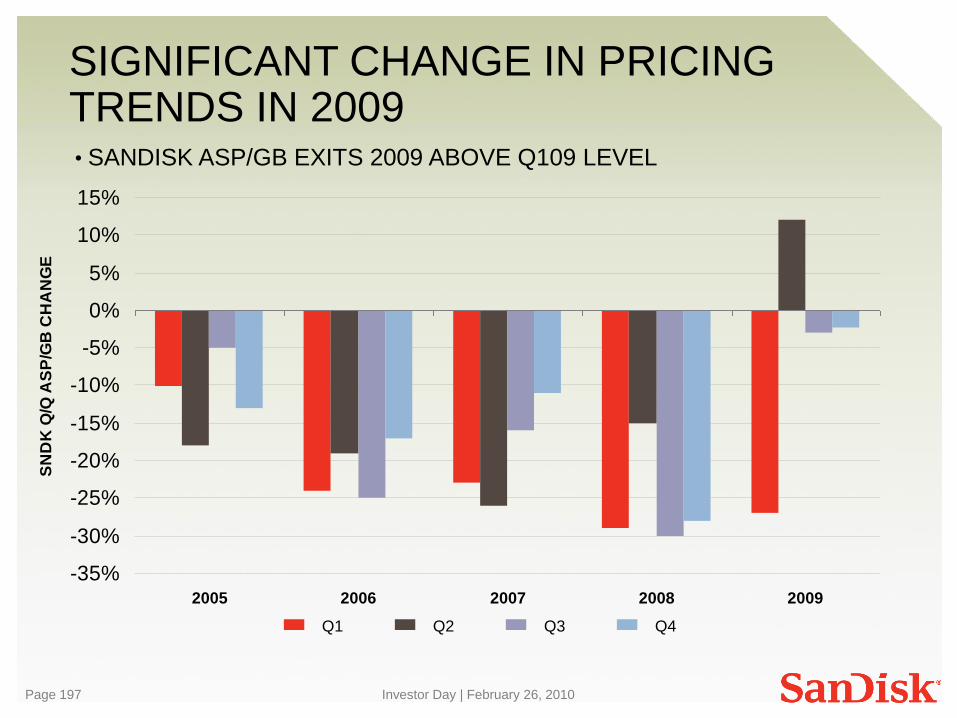
SIGNIFICANT CHANGE IN PRICING TRENDS IN 2009
Q1 Q2 Q3 Q4
• SANDISK ASP/GB EXITS 2009 ABOVE Q109 LEVEL

Page 198 Investor Day | February 26, 2010
-52%
-58%
-60%
-62%
-48%
-54%
-55% -55% -55%
-52%
-65%
-60%
-55%
-50%
-45%
2005 2006 2007 2008 2009
COST REDUCTION EXCEEDS PRICE DECLINE IN 2009, LEADING TO IMPROVED GROSS MARGINS
Change in Underlying Cost/GB (1)Change in ASB/GB
(1) Underlying Cost/GB is calculated using Non-GAAP Cost of Sales, adjusted as follows:2008: excludes inventory reserves, fab impairment charges, and accruals for 2009 fab underutilization2009: excludes inventory reserve benefits, and includes all costs for 2009 fab underutilization

Page 199 Investor Day | February 26, 2010
45%
36%
-80%
-60%
-40%
-20%
0%
20%
40%
60%
Q1 Q2 Q3 Q4 Q1 Q2 Q3 Q4 Q1 Q2 Q3 Q4 Q1 Q2 Q3 Q4 Q1 Q2 Q3 Q4
PRODUCT GROSS MARGINRETURNS TO HISTORIC HIGHS BY Q409
(1) 2006 - 2009 Product GM% is Non-GAAP excluding stock comp expense, amortization of acquisition-related intangible assets, and purchase accounting adjustments.
(2) Underlying Product GM% is calculated using Non-GAAP Cost of Sales, adjusted as follows:
2008: excludes inventory reserves, fab impairment charges, and accruals for 2009 fab underutilization
2009: excludes inventory reserve benefits, and includes all costs for 2009 fab underutilization
2005 2006 2007 2008 2009
Product GM % (1) Underlying Product GM % (2)

Page 200 Investor Day | February 26, 2010
OPERATING EXPENSES REDUCED 25% FROM 2008 TO 2009
(1) 2006–2009 is Non-GAAP Operating Expense excluding stock comp expense, amortization of acquisition-related intangible assets,
purchase accounting adjustments, and impairments of goodwill and acquisition-related intangible assets.
$396
$577
$783
$911
$681
0%
5%
10%
15%
20%
25%
30%
$0
$100
$200
$300
$400
$500
$600
$700
$800
$900
$1,000
2005 2006 2007 2008 2009
OP
ER
AT
ING
EX
PE
NS
ES
, % O
F T
OT
AL
RE
VE
NU
EO
PE
RA
TIN
G E
XP
EN
SE
S I
N M
ILL
ION
S
Operating Expenses (1) Operating Expense as a % of Revenues
Page 201 Investor Day | February 26, 2010
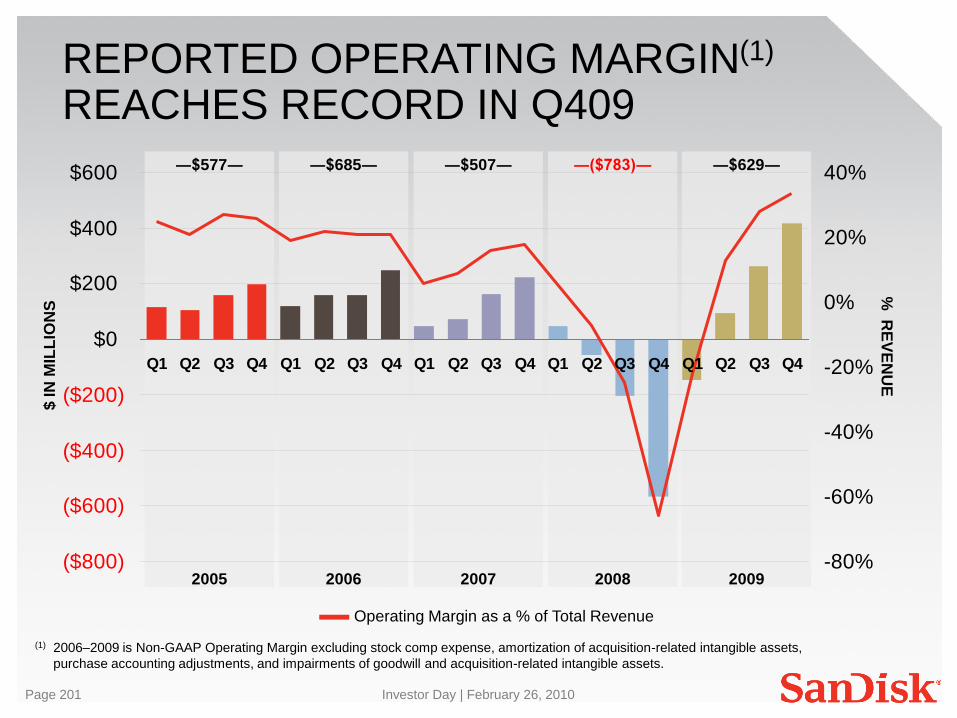
2005
―$577―
2007
―$507―
2006
―$685―
2008
―($783)―
2009
―$629―
REPORTED OPERATING MARGIN(1)
REACHES RECORD IN Q409
(1) 2006–2009 is Non-GAAP Operating Margin excluding stock comp expense, amortization of acquisition-related intangible assets,
purchase accounting adjustments, and impairments of goodwill and acquisition-related intangible assets.
$ IN
MIL
LIO
NS
% R
EV
EN
UE
Operating Margin as a % of Total Revenue
($800)
($600)
($400)
($200)
$0
$200
$400
$600
Q1 Q2 Q3 Q4 Q1 Q2 Q3 Q4 Q1 Q2 Q3 Q4 Q1 Q2 Q3 Q4 Q1 Q2 Q3 Q4
-80%
-60%
-40%
-20%
0%
20%
40%

Page 202 Investor Day | February 26, 2010
UNDERLYING OPERATING MARGIN(1)
RETURNS TO NEAR HISTORIC HIGH IN Q409
23.6%
25.0%
21.0%
13.0%
-5.4%
4.4%
23.0%
26.4%
21.3%17.9%
-20.7%
25.9%
-30%
-20%
-10%
0%
10%
20%
30%
2004 2005 2006 2007 2008 2009
UN
DE
RL
YIN
G O
PE
RA
TIN
G M
AR
GIN
Fourth Quarter OnlyFiscal Year
(1) 2006–2007 Product GM% is Non-GAAP excluding stock comp expense, amortization of acquisition-related intangible assets, and purchase accounting adjustments.
2008–2009 Product GM% is underlying Product GM% calculated using Non-GAAP Cost of Sales, adjusted as follows:
2008: excludes inventory reserves, fab impairment charges, and accruals for 2009 fab underutilization
2009: excludes inventory reserve benefits, and includes all costs for 2009 fab underutilization

Page 203 Investor Day | February 26, 2010
$2.00 $1.73$2.51 $(2.07) $1.84
0.37
0.58
0.30
0.55 0.61 0.54
0.750.68
0.87
0.69
1.18
(0.48)
0.19
0.440.21
0.39 0.36
(0.10)
(0.59)
(1.59)
($2.00)
($1.50)
($1.00)
($0.50)
$0.00
$0.50
$1.00
$1.50
2005 2006 2007 2008 2009
ACHIEVED RECORD EPS(1) IN Q409
(1) 2006–2009 is Non-GAAP EPS excluding stock comp expense, amortization of acquisition-related intangible assets, purchase accounting adjustments, impairment of goodwill and acquisition-related intangible assets, non-cash economic interest expense, and related tax adjustments and valuation allowance. Note: EPS in Q1 2000 was higher than in Q4 2009 due to a gain on an investment in foundry.
Q1 Q2 Q3 Q4
$0.92 without inventory reserve benefits

Page 204 Investor Day | February 26, 2010
0.0
1.0
2.0
3.0
4.0
5.0
6.0
Q408 Q109 Q209 Q309 Q409
INV
EN
TO
RY
TU
RN
S M
EA
SU
RE
D IN
PB
sINVENTORY TURNS IMPROVE SIGNIFICANTLY Y/Y• Factors included: JV Restructuring; Fab Slowdown and
No Capacity Additions; Process Improvements; Sales Growth
Includes SanDisk Owned Inventory: Raw Material, WIP, Finished Goods and Retail & OEM Consignment

Page 205 Investor Day | February 26, 2010
$481
$598$653
$88
($219)
($339)
($900)
($426)
$263 $259
$488
($49)
$438
($247)($338)
2005 2006 2007 2008 2009
RETURNED TO POSITIVE FREE CASH FLOW• Q4 Cash Flow from Operations and 2009 FCF were Highest Ever
Cash Flow from Operations Cash Used in Investing Free Cash Flow
Cash Used in Investing excludes purchases, sales and maturities of short-term and long-term marketable securities.
$ in
Mill
ion
s

Page 206 Investor Day | February 26, 2010
$0
$500
$1,000
$1,500
$2,000
$2,500
$3,000
$3,500
2006 2007 2008 2009
$ IN
MIL
LIO
NS
2009: NET CASH INCREASED AND OFF-B.S. LEASE GUARANTEES REDUCED
Off-Balance Sheet Equipment Lease Guarantees (Mil)
$654 $1139 $2095 $1070
(1) Debt includes the final maturity value for $1.15B Convertible and $75M Convertible(2) Net Cash is Cash & Marketable Securities less Debt
• A Net Improvement of $1.5B
• SanDisk is Calling its $75M Convertible as of March 15, 2010
Cash & Marketable Securities Debt (1) Net Cash (2)

Page 207 Investor Day | February 26, 2010
GROWTH AND EARNINGS POWER RETURN
• Decisive actions & strong execution drove rapid recovery in 2009:
– Revenue up 6%
– Began year in a loss position, exited year at record profit levels
– Generated highest ever positive free cash flow
– Balance sheet and financial position strengthened

Page 208 Investor Day | February 26, 2010
FINANCIAL REVIEW: A PATH TO A PROMISING FUTURE
• Growth and Earnings Power Return
• Balancing Growth, Profits and Cash Flow

Page 209 Investor Day | February 26, 2010
2010 CAPITAL INVESTMENTS: MODERATE AND AFFORDABLEOver 7 years:• JV operating cash flow & return of capital funds ~28% of fab capex• Operating lease financing funds ~42% of fab capex—very attractive
cost of capital$ in Millions ACTUAL FORECAST 7-YEAR TOTAL
CAPITAL INVESTMENTS FY ′04 FY ′05 FY ′06 FY ′07 FY ′08 FY ′09 FY ′10 w/′10 midpt
Fab 1 & 2 33 91 15 139
Fab 3 23 519 905 899 260 69 200 2,875
Fab 4 4 700 1,174 241 400–600 2,618
TOTAL JOINT VENTURE FABS $ 56 $610 $ 924 $1,599 $1,433 $310 $600–$800 $5,632
SanDisk Owned Fab Equipment 63 39 102
Other SanDisk CapEx 63 95 176 259 184 60 100 937
TOTAL CAPITAL INVESTMENTS $182 $744 $1,100 $1,858 $1,617 $370 $700–$900 $6,672
FUNDING FY ′04 FY ′05 FY ′06 FY ′07 FY ′08 FY ′09 FY ′10 w/′10 midpt
Sale of Tools/Restructuring 39 277 316
JV Oper Cash Flow/Return of Capital 328 237 374 207 55 300–400 1,551
JV Operating Lease Financing 225 482 612 945 0 100 2,365
Net Cash Outlay 182 191 381 872 426 38 300–400 2,440
TOTAL FUNDING $182 $744 $1,100 $1,858 $1,617 $370 $700–$900 $6,672

Page 210 Investor Day | February 26, 2010
$182
$744
$1,100
$1,858
$1,617
$370
10%
32% 34%
48% 48%
10%
~20%
0%
10%
20%
30%
40%
50%
60%
$0
$200
$400
$600
$800
$1,000
$1,200
$1,400
$1,600
$1,800
$2,000
2004 2005 2006 2007 2008 2009 2010
Capital Investments % of Revenue
CAPITAL INVESTMENT—A MODERATE % OF REVENUE FOR 2010
Over the Long-Term, we Target an Average of 20%-30% of Revenue to Balance Growth and Positive Free Cash Flow
$700-$900
Capital Investments are funded by: JV Operating Cash Flow/Return of Capital, JV Operating Lease
Financing and Net Cash Outlay
$ in
Mill
ion
s % o
f Revenue

Page 211 Investor Day | February 26, 2010
DEFINING SANDISK‘S LONG-TERM TARGET FINANCIAL MODEL (LTFM)
The LTFM is the P&L model we believe best balances:
– Growth, profitability & cash flow
The LTFM is the P&L model we aim to achieve
We will not be in the LTFM every year
– Industry & SanDisk subject to cyclicality
– In some years we will be below the LTFM, and in some years we will exceed the LTFM
Page 212 Investor Day | February 26, 2010
KEY VARIABLES IMPACTING OUR BUSINESS MODEL
• Variability in Pricing–Industry supply/demand environment a key factor
• Timing of Technology Transitions and Mix of X2/X3–Strong track record of execution–Leader in X3
• Mix of Product Revenue and L&R Revenue–Product revenue currently growing faster than L&R revenue
• Mix of Captive/Non-Captive Memory –Higher non-captive mix results in:•Lower gross margins•Less capital investment required to meet demand
• Investment in Post-NAND technology–Requires parallel R&D spending

Page 213 Investor Day | February 26, 2010
DEFINING SANDISK‘S LTFM
$ in Millions 2005 2006 2007 2008 2009 LTFM
Revenue $2,306 $3,258 $3,896 $3, 351 $3,567
Revenue Growth Y/Y 30% 41% 20% -14% 6%
Product Revenue 90% 90% 88% 85% 88% 92%–93%
L&R Revenue 10% 10% 12% 15% 12% 7%–8%
TOTAL REVENUE 100% 100% 100% 100% 100% 100%
Product Gross Margin (1) 35.5% 31.8% 24.3% -13.4% 28.4% 30%–36%
Total Gross Margin (1) 42.2% 38.8% 33.1% 3.8% 36.7% 35%–41%
R&D (1) 8.4% 8.2% 9.5% 11.7% 9.8% 7%–9%
S&M (1) 5.3% 5.6% 6.7% 9.2% 5.3% ~5%
G&A (1) 3.4% 4.0% 3.7% 5.3% 4.0% ~3%
Restructuring 0.2% 1.1%
Operating Expenses (1) 17.2% 17.7% 20.1% 27.2% 19.1% 15%–17%
OPERATING INCOME (1) 25.0% 21.0% 13.0% -23.4% 17.6% 20%–24%
(1) 2006–2009 and LTFM is Non-GAAP excluding stock comp expense, amortization of acquisition-related intangible assets, purchase accounting adjustments, and impairment of goodwill and acquisition-related intangible assets.

Page 214 Investor Day | February 26, 2010
PLANNING ASSUMPTIONS FOR 2010
• Healthy supply/demand balance in industry
• Mobile end market remains key growth driver
• Consumer demand in U.S. and Europe remains somewhat muted
• Completing 32nm transition; beginning 24nm ramp in Q410
• Price decline less than estimated cost decline
• Close reins on spending; modest increases weighted toward R&D
• Limited use of non-captive memory, but could increase if demand is stronger

Page 215 Investor Day | February 26, 2010
FORECAST FOR 2010
(1) Non-GAAP excluding stock comp expense, amortization of acquisition-related intangible assets, purchase accounting adjustments, and impairment of goodwill and acquisition-related intangible assets.
$in Millions LTFM FCST 2010
Revenue $4,000–$4,400
Revenue Growth Y/Y 12%–23%
Product Revenue 92%–93% ~92%
L&R Revenue 7%–8% ~8%
Total Revenue 100% 100%
Product Gross Margin (1) 30%–36% 28%–34%
Total Gross Margin (1) 35%–41% 34%–40%
R&D (1) 7%–9%
S&M (1) ~5%
G&A (1) ~3%
Restructuring
Operating Expenses (1) 15%–17%$725–$75016% –19%
OPERATING INCOME (1) 20%–24%15%–24%
Objective 20%+
• Objective is to be within LTFM

Page 216 Investor Day | February 26, 2010
POSITIVE FREE CASH FLOW EXPECTED IN 2010
2009 2010
CASH FLOW FROM OPERATIONS $488 At least as much as 2009
CASH USED FOR INVESTING ($49) ($300)–($400)
FREE CASH FLOW $438 Positive Free Cash Flow
KEY FACTORS IN 2010 FORECASTED CASH FLOW FROM OPERATIONS:
COMPARED
TO 2009
Underlying Gross Margin forecasted to be much higher Higher
Tax will be a net payment (vs. net refund in 2009) Lower
Inventory Turns forecasted to improve further Higher

Page 217 Investor Day | February 26, 2010
UPDATE ON Q1 2010
(1) Non-GAAP GM, Opex, Other Income and Tax rate exclude: stock comp expense, amortization of acquisition-related intangible assets, non-cash economic interest expense and related tax adjustments and valuation allowance.
• Total Revenue $875M–$950M– L&R revenue $80M–$90M– Product revenue $785M–$870M
• Prod GM%(1): 31% +/- 3 points
• Total GM%(1): 37% +/- 3 points
• Opex(1): $175–$185M
• Other Income(1): ~$10M
• Tax rate(1): 37%
• Total Revenue of $925M–$1.0B– Upside in product revenue
• Prod GM%(1): 34% +/- 2 points
• Total GM%(1): 40% +/- 2 points
• Opex(1): no change
• Other Income(1): no change
• Tax rate(1): no change
JAN 28, 2010 GUIDANCE FEB 26, 2010 UPDATE
• Pricing environment remains more favorable than in past Q1s
• OEM demand stronger than previously expected

Page 218 Investor Day | February 26, 2010
SUMMARY: A PATH TO A PROMISING FUTURE
• Growth and earnings power have returned
• Focused on balancing growth, profits and cash flow
– Capital investments sized to enable growth and free cash flow
– LTFM helps guide our strategic decisions
– Objective is to be in our LTFM in 2010

Page 219 Investor Day | February 26, 2010
THANK YOU

Page 220 Investor Day | February 26, 2010
ELIHARARIChairman and Chief Executive Officer

Page 221 Investor Day | February 26, 2010
SUMMARY: FLASH IS EVERYWHERE, WILL BE BIGGER THAN YOU THINK!
• FLASH UBIQUITOUS, AND GROWING
• SMARTPHONE = ―NEW PC‖ FLASH SSD
• ―MOBILE INTERNET IN EARLY INNINGS, WILL BE BIGGER THAN YOU THINK‖ (Morgan Stanley*)
• CLOUD COMPUTING: LAST NODE ON NETWORK, IN YOUR POCKET
• HIGHLY SCALED FLASH GETTING HARD TO DO WELL, SYSTEM SOLUTIONS BECOMING KEY PLAYING TO OUR STRENGTHS
Source: December 15, 2009, The Mobile Internet Report Mary Meeker © 2009 Morgan Stanley

Page 222 Investor Day | February 26, 2010
Q&A
Page 223 Investor Day | February 26, 2010
APPENDICES
• Basis of Presentation for Non-GAAP to GAAP Reconciliations
• Non-GAAP to GAAP Reconciliations for Historical Results
• Non-GAAP to GAAP Reconciliations for Forecasts

Page 224 Investor Day | February 26, 2010
To supplement our condensed consolidated financial statements presented in accordance with generally accepted
accounting principles (GAAP), we use non-GAAP measures of operating results, net income (loss) and net income
(loss) per share, which are adjusted from results based on GAAP to exclude certain expenses, gains and losses.
These non-GAAP financial measures are provided to enhance the user's overall understanding of our current
financial performance and our prospects for the future. Specifically, we believe the non-GAAP results provide useful
information to both management and investors as these non-GAAP results exclude certain expenses, gains and
losses that we believe are not indicative of our core operating results and because it is consistent with the financial
models and estimates published by many analysts who follow the Company. For example, because the non-GAAP
results exclude the expenses we recorded for share-based compensation, the amortization of acquisition-related
intangible assets related to acquisitions of Matrix Semiconductor, Inc. in January 2006, msystems Ltd. in November
2006 and MusicGremlin, Inc. in June 2008, the impairment of goodwill and acquisition-related intangible assets, and
non-cash economic interest expense associated with our cash-settled convertible debt, we believe the inclusion of
non-GAAP financial measures provide consistency in our financial reporting. These non-GAAP results are some of
the primary indicators management uses for assessing our performance, allocating resources and planning and
forecasting future periods. Further, management uses non-GAAP information that excludes certain non-cash
charges, such as impairment of goodwill and acquisition-related intangible assets, amortization of purchased
intangible assets, share-based compensation and non-cash economic interest expense associated with our cash-
settled convertible debt, as these non-GAAP charges do not reflect the cash operating results of the business or the
ongoing results. These measures should be considered in addition to results prepared in accordance with GAAP,
but should not be considered a substitute for, or superior to, GAAP results. These non-GAAP measures may be
different than the non-GAAP measures used by other companies.
BASIS OF PRESENTATION FOR GAAP TO
NON-GAAP OPERATING RESULTS

Page 225 Investor Day | February 26, 2010
RECONCILIATION OF NON-GAAP TO GAAP STATEMENT OF OPERATIONSThree months ended April 2, 2006(in thousands, except percentages and per share amounts, unaudited)
SanDisk Purchase SanDisk
Consolidated % of Share-based Accounting Consolidated % of
Non-GAAP Revenue Compensation Adjustments GAAP Revenue
Product revenue 537,728$ 86.3% -$ -$ 537,728$ 86.3%
License and royalty revenue 85,532 13.7% - - 85,532 13.7%
Total revenues 623,260 100.0% - - 623,260 100.0%
Cost of product revenues 384,867 61.8% - - 384,867 61.8%
Total cost of product revenues 384,867 61.8% - - 384,867 61.8%
Product gross profit 152,861 28.4% - - 152,861 28.4%
Gross profit 238,393 38.2% - - 238,393 38.2%
Research and development 54,976 8.8% 8,786 - 63,762 10.2%
Sales and marketing 39,336 6.3% 4,039 - 43,375 7.0%
General and administrative 24,055 3.9% 5,961 - 30,016 4.8%
Write-off of acquired in-process technology - 0.0% - 39,600 (a) 39,600 6.4%
Amortization of acquisition-related intangible assets - 0.0% - 3,715 (b) 3,715 0.6%
Total operating expenses 118,367 19.0% 18,786 43,315 180,468 29.0%
Operating income 120,026 19.3% (18,786) (43,315) 57,925 9.3%
Total other income 18,464 3.0% - - 18,464 3.0%
Income before taxes 138,490 22.2% (18,786) (43,315) 76,389 12.3%
Provision for income taxes 48,472 7.8% (5,845) (c) (1,353) (c) 41,274 6.6%
Net income 90,018$ 14.4% (12,941)$ (41,962)$ 35,115$ 5.6%
Net income per share, diluted 0.44$ 0.17$
Diluted shares used in computing net income per share 203,302 201,892
Effective tax rate 35.0% 54.0%
(a) Write-off of acquired in-process technology associated with the Matrix acquisition (January 2006).
(b) Amortization of acquisition-related intangible assets, primarily core and developed technology related to acquisitions of Matrix Semiconductor, Inc. (January 2006).
(c) Income taxes associated with certain non-GAAP adjustments.

Page 226 Investor Day | February 26, 2010
RECONCILIATION OF NON-GAAP TO GAAP STATEMENT OF OPERATIONSThree months ended July 2, 2006(in thousands, except percentages and per share amounts, unaudited)
SanDisk Purchase Convertible SanDisk
Consolidated % of Share-based Accounting Debt Consolidated % of
Non-GAAP Revenue Compensation Adjustments Interest GAAP (d) Revenue
Product revenue 636,675$ 88.5% -$ -$ -$ 636,675$ 88.5%
License and royalty revenue 82,510 11.5% - - - 82,510 11.5%
Total revenues 719,185 100.0% - - - 719,185 100.0%
Cost of product revenues 427,699 59.5% 2,478 - - 430,177 59.8%
Total cost of product revenues 427,699 59.5% 2,478 - - 430,177 59.8%
Product gross profit 208,976 32.8% (2,478) - - 206,498 32.4%
Gross profit 291,486 40.5% (2,478) - - 289,008 40.2%
Research and development 63,364 8.8% 10,421 - - 73,785 10.3%
Sales and marketing 39,942 5.6% 5,125 - - 45,067 6.3%
General and administrative 29,336 4.1% 7,846 - - 37,182 5.2%
Amortization of acquisition-related intangible assets - 0.0% - 4,432 (a) - 4,432 0.6%
Total operating expenses 132,642 18.4% 23,392 4,432 - 160,466 22.3%
Operating income 158,844 22.1% (25,870) (4,432) - 128,542 17.9%
Total other income 22,013 3.1% - - (5,734) (c) 16,279 2.3%
Income before taxes 180,857 25.1% (25,870) (4,432) (5,734) 144,821 20.1%
Provision for income taxes 63,299 8.8% (6,667) (b) (1,718) (b) (1,855) (b) 53,059 7.6%
Net income 117,558$ 16.3% (19,203)$ (2,714)$ (3,879)$ 91,762$ 12.5%
Net income per share, diluted 0.58$ 0.45$
Diluted shares used in computing net income per share 204,126 202,980
Effective tax rate 35.0% 36.6%
(a) Amortization of acquisition-related intangible assets, primarily core and developed technology related to acquisition of Matrix Semiconductor, Inc. (January 2006).
(b) Income taxes associated with certain non-GAAP adjustments.
(c) Incremental interest expense relating to the non-cash economic interest expense associated with the Company's cash-settled convertible debt.
(d) As adjusted for the retroactive adoption of new accounting requirements, effective December 29, 2008, relating to non-cash economic interest expense associated with the Company's cash-settled convertible debt.

Page 227 Investor Day | February 26, 2010
RECONCILIATION OF NON-GAAP TO GAAP STATEMENT OF OPERATIONSThree months ended October 1, 2006(in thousands, except percentages and per share amounts, unaudited)
SanDisk Purchase Convertible SanDisk
Consolidated % of Share-based Accounting Debt Consolidated % of
Non-GAAP Revenue Compensation Adjustments Interest GAAP (d) Revenue
Product revenue 673,189$ 89.6% -$ -$ -$ 673,189$ 89.6%
License and royalty revenue 78,196 10.4% - - - 78,196 10.4%
Total revenues 751,385 100.0% - - - 751,385 100.0%
Cost of product revenues 452,724 60.3% 2,621 - - 455,345 60.6%
Total cost of product revenues 452,724 60.3% 2,621 - - 455,345 60.6%
Product gross profit 220,465 32.7% (2,621) - - 217,844 32.4%
Gross profit 298,661 39.7% (2,621) - - 296,040 39.4%
Research and development 67,803 9.0% 10,270 - - 78,073 10.4%
Sales and marketing 40,339 5.4% 4,622 - - 44,961 6.0%
General and administrative 32,567 4.3% 7,680 - - 40,247 5.4%
Amortization of acquisition-related intangible assets - 0.0% - 4,432 (a) - 4,432 0.6%
Total operating expenses 140,709 18.7% 22,572 4,432 - 167,713 22.3%
Operating income 157,952 21.0% (25,193) (4,432) - 128,327 17.1%
Total other income 32,223 4.3% - - (10,706) (c) 21,517 2.9%
Income before taxes 190,175 25.3% (25,193) (4,432) (10,706) 149,844 19.9%
Provision for income taxes 66,561 8.9% (7,621) (b) (1,671) (b) (3,464) (b) 53,805 7.6%
Net income 123,614$ 16.5% (17,572)$ (2,761)$ (7,242)$ 96,039$ 12.3%
Net income per share, diluted 0.61$ 0.47$
Diluted shares used in computing net income per share 203,757 202,747
Effective tax rate 35.0% 35.9%
(a) Amortization of acquisition-related intangible assets, primarily core and developed technology related to acquisition of Matrix Semiconductor, Inc. (January 2006).
(b) Income taxes associated with certain non-GAAP adjustments.
(c) Incremental interest expense relating to the non-cash economic interest expense associated with the Company's cash-settled convertible debt.
(d) As adjusted for the retroactive adoption of new accounting requirements, effective December 29, 2008, relating to non-cash economic interest expense associated with the Company's cash-settled convertible debt.

Page 228 Investor Day | February 26, 2010
RECONCILIATION OF NON-GAAP TO GAAP STATEMENT OF OPERATIONSThree months ended December 31, 2006(in thousands, except percentages and per share amounts, unaudited)
SanDisk Purchase Convertible SanDisk
Consolidated % of Share-based Accounting Debt Consolidated % of
Non-GAAP Revenue Compensation Adjustments Interest GAAP (e) Revenue
Product revenue 1,078,880$ 92.7% -$ -$ -$ 1,078,880$ 92.7%
License and royalty revenue 84,815 7.3% - - - 84,815 7.3%
Total revenues 1,163,695 100.0% - - - 1,163,695 100.0%
Cost of product revenues 729,932 62.7% 2,892 4,471 - 737,295 63.4%
Amortization of acquisition-related intangible assets - - - 10,368 (a) - 10,368 0.9%
Total cost of product revenues 729,932 62.7% 2,892 14,839 - 747,663 64.2%
Product gross profit 348,948 32.3% (2,892) (14,839) - 331,217 30.7%
Gross profit 433,763 37.3% (2,892) (14,839) - 416,032 35.8%
Research and development 79,724 6.9% 11,522 - - 91,246 7.8%
Sales and marketing 62,172 5.3% 7,831 - - 70,003 6.0%
General and administrative 43,843 3.8% 8,547 - - 52,390 4.5%
Write-off of acquired in-process technology - 0.0% - 186,000 (b) - 186,000 16.0%
Amortization of acquisition-related intangible assets - 0.0% - 4,853 (a) - 4,853 0.4%
Total operating expenses 185,739 16.0% 27,900 190,853 - 404,492 34.8%
Operating income 248,024 21.3% (30,792) (205,692) - 11,540 1.0%
Total other income 31,674 2.7% - - (10,913) (d) 20,761 1.8%
Income before taxes 279,698 24.0% (30,792) (205,692) (10,913) 32,301 2.8%
Provision for income taxes 86,409 7.4% (7,689) (c) (1,984) (c) (3,531) (c) 73,205 5.8%
Income (loss) after tax 193,289 16.6% (23,103) (203,708) (7,382) (40,904) -3.1%
Non-controlling interests 1,619 0.1% - - - 1,619 0.1%
Net income (loss) 191,670$ 16.5% (23,103)$ (203,708)$ (7,382)$ (42,523)$ -3.2%
Net income (loss) per share, diluted 0.87$ (0.20)$
Diluted shares used in computing net income (loss) per share 220,090 210,849
Effective tax rate 30.9% 226.6%
(a) Amortization of acquisition-related intangible assets, primarily core and developed technology related to acquisitions of Matrix Semiconductor, Inc. (January 2006) and msystems Ltd. (November 2006).
(b) Write-off of acquired in-process technology associated with the msystems Ltd. acquisition.
(c) Income taxes associated with certain non-GAAP adjustments.
(d) Incremental interest expense relating to the non-cash economic interest expense associated with the Company's cash-settled convertible debt.
(e) As adjusted for the retroactive adoption of new accounting requirements, effective December 29, 2008, relating to non-cash economic interest expense associated with the Company's cash-settled convertible debt.

Page 229 Investor Day | February 26, 2010
RECONCILIATION OF NON-GAAP TO GAAP STATEMENT OF OPERATIONSTwelve months ended December 31, 2006(in thousands, except percentages and per share amounts, unaudited)
SanDisk Purchase Convertible SanDisk
Consolidated % of Share-based Accounting Debt Consolidated % of
Non-GAAP Revenue Compensation Adjustments Interest GAAP (e) Revenue
Product revenue 2,926,472$ 89.8% -$ -$ -$ 2,926,472$ 89.8%
License and royalty revenue 331,053 10.2% - - - 331,053 10.2%
Total revenues 3,257,525 100.0% - - - 3,257,525 100.0%
Cost of product revenues 1,995,222 61.2% 7,991 4,471 - 2,007,684 61.6%
Amortization of acquisition-related intangible assets - - - 10,368 (a) - 10,368 0.3%
Total cost of product revenues 1,995,222 61.2% 7,991 14,839 - 2,018,052 62.0%
Product gross profit 931,250 31.8% (7,991) (14,839) - 908,420 31.0%
Gross profit 1,262,303 38.8% (7,991) (14,839) - 1,239,473 38.0%
Research and development 265,867 8.2% 40,999 - - 306,866 9.4%
Sales and marketing 181,789 5.6% 21,617 - - 203,406 6.2%
General and administrative 129,801 4.0% 30,034 - - 159,835 4.9%
Write-off of acquired in-process technology - 0.0% - 225,600 (b) - 225,600 6.9%
Amortization of acquisition-related intangible assets - 0.0% - 17,432 (a) - 17,432 0.5%
Total operating expenses 577,457 17.7% 92,650 243,032 - 913,139 28.0%
Operating income 684,846 21.0% (100,641) (257,871) - 326,334 10.0%
Total other income 104,374 3.2% - - (27,353) (d) 77,021 2.4%
Income before taxes 789,220 24.2% (100,641) (257,871) (27,353) 403,355 12.4%
Provision for income taxes 264,741 8.1% (27,822) (c) (6,726) (c) (8,850) (c) 221,343 6.8%
Income after tax 524,479 16.1% (72,819) (251,145) (18,503) 182,012 5.6%
Non-controlling interests 1,619 0.0% - - - 1,619 0.0%
Net income 522,860$ 16.1% (72,819)$ (251,145)$ (18,503)$ 180,393$ 5.5%
Net income per share, diluted 2.51$ 0.87$
Diluted shares used in computing net income per share 208,661 207,451
Effective tax rate 33.5% 54.9%
(a) Amortization of acquisition-related intangible assets, primarily core and developed technology related to acquisitions of Matrix Semiconductor, Inc. (January 2006) and msystems Ltd. (November 2006).
(b) Write-off of acquired in-process technology associated with the Matrix and msystems Ltd. acquisitions.
(c) Income taxes associated with certain non-GAAP adjustments.
(d) Incremental interest expense relating to the non-cash economic interest expense associated with the Company's cash-settled convertible debt.
(e) As adjusted for the retroactive adoption of new accounting requirements, effective December 29, 2008, relating to non-cash economic interest expense associated with the Company's cash-settled convertible debt.
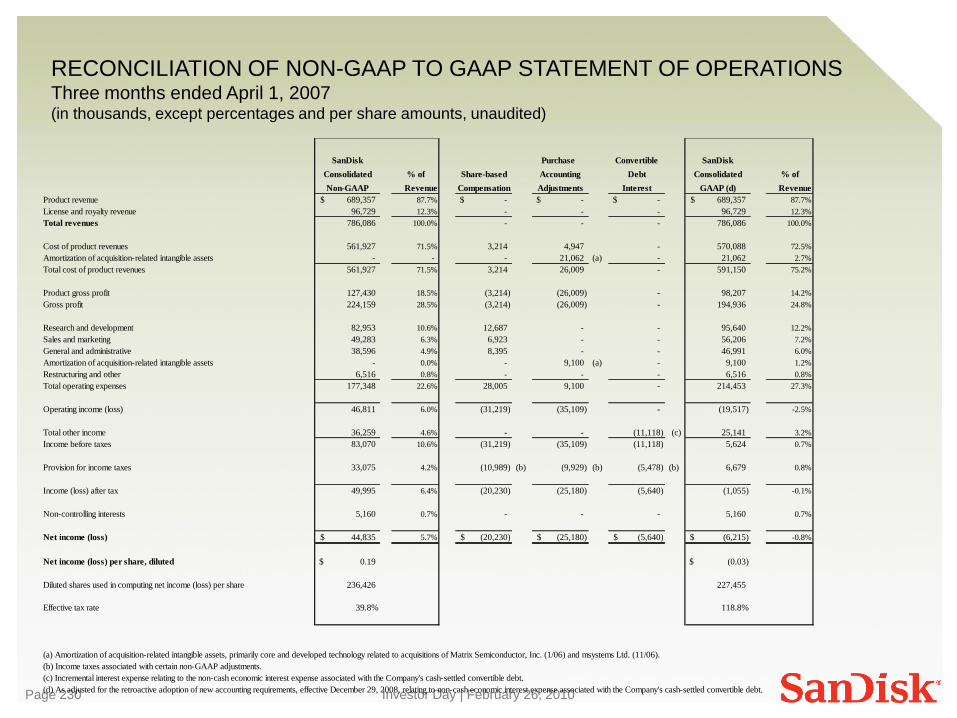
Page 230 Investor Day | February 26, 2010
RECONCILIATION OF NON-GAAP TO GAAP STATEMENT OF OPERATIONSThree months ended April 1, 2007(in thousands, except percentages and per share amounts, unaudited)
SanDisk Purchase Convertible SanDisk
Consolidated % of Share-based Accounting Debt Consolidated % of
Non-GAAP Revenue Compensation Adjustments Interest GAAP (d) Revenue
Product revenue 689,357$ 87.7% -$ -$ -$ 689,357$ 87.7%
License and royalty revenue 96,729 12.3% - - - 96,729 12.3%
Total revenues 786,086 100.0% - - - 786,086 100.0%
Cost of product revenues 561,927 71.5% 3,214 4,947 - 570,088 72.5%
Amortization of acquisition-related intangible assets - - - 21,062 (a) - 21,062 2.7%
Total cost of product revenues 561,927 71.5% 3,214 26,009 - 591,150 75.2%
Product gross profit 127,430 18.5% (3,214) (26,009) - 98,207 14.2%
Gross profit 224,159 28.5% (3,214) (26,009) - 194,936 24.8%
Research and development 82,953 10.6% 12,687 - - 95,640 12.2%
Sales and marketing 49,283 6.3% 6,923 - - 56,206 7.2%
General and administrative 38,596 4.9% 8,395 - - 46,991 6.0%
Amortization of acquisition-related intangible assets - 0.0% - 9,100 (a) - 9,100 1.2%
Restructuring and other 6,516 0.8% - - - 6,516 0.8%
Total operating expenses 177,348 22.6% 28,005 9,100 - 214,453 27.3%
Operating income (loss) 46,811 6.0% (31,219) (35,109) - (19,517) -2.5%
Total other income 36,259 4.6% - - (11,118) (c) 25,141 3.2%
Income before taxes 83,070 10.6% (31,219) (35,109) (11,118) 5,624 0.7%
Provision for income taxes 33,075 4.2% (10,989) (b) (9,929) (b) (5,478) (b) 6,679 0.8%
Income (loss) after tax 49,995 6.4% (20,230) (25,180) (5,640) (1,055) -0.1%
Non-controlling interests 5,160 0.7% - - - 5,160 0.7%
Net income (loss) 44,835$ 5.7% (20,230)$ (25,180)$ (5,640)$ (6,215)$ -0.8%
Net income (loss) per share, diluted 0.19$ (0.03)$
Diluted shares used in computing net income (loss) per share 236,426 227,455
Effective tax rate 39.8% 118.8%
(a) Amortization of acquisition-related intangible assets, primarily core and developed technology related to acquisitions of Matrix Semiconductor, Inc. (1/06) and msystems Ltd. (11/06).
(b) Income taxes associated with certain non-GAAP adjustments.
(c) Incremental interest expense relating to the non-cash economic interest expense associated with the Company's cash-settled convertible debt.
(d) As adjusted for the retroactive adoption of new accounting requirements, effective December 29, 2008, relating to non-cash economic interest expense associated with the Company's cash-settled convertible debt.
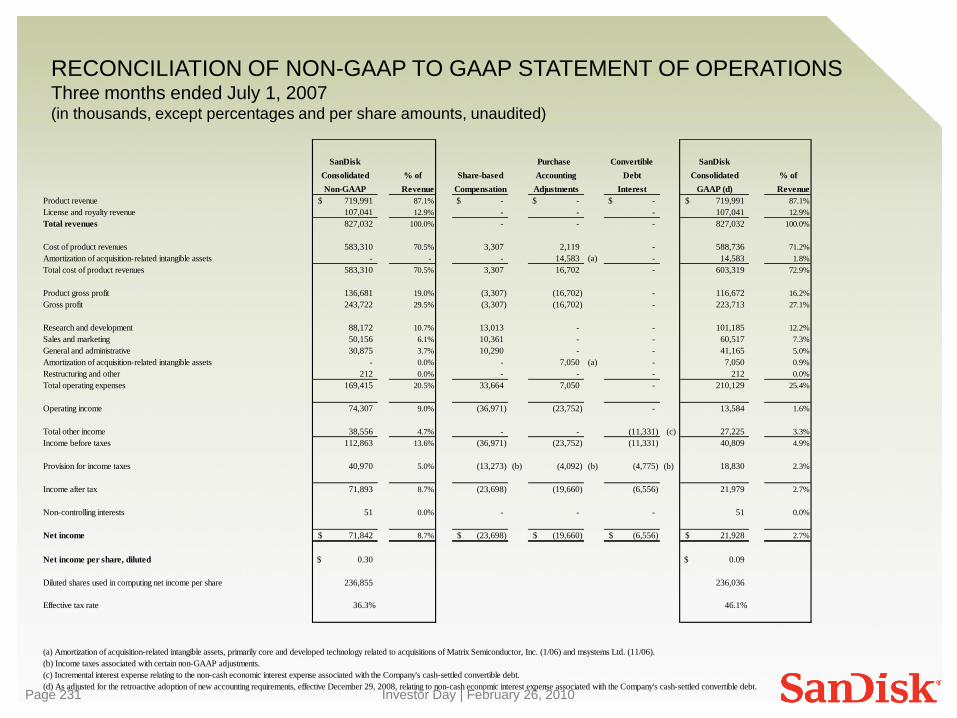
Page 231 Investor Day | February 26, 2010
RECONCILIATION OF NON-GAAP TO GAAP STATEMENT OF OPERATIONSThree months ended July 1, 2007(in thousands, except percentages and per share amounts, unaudited)
SanDisk Purchase Convertible SanDisk
Consolidated % of Share-based Accounting Debt Consolidated % of
Non-GAAP Revenue Compensation Adjustments Interest GAAP (d) Revenue
Product revenue 719,991$ 87.1% -$ -$ -$ 719,991$ 87.1%
License and royalty revenue 107,041 12.9% - - - 107,041 12.9%
Total revenues 827,032 100.0% - - - 827,032 100.0%
Cost of product revenues 583,310 70.5% 3,307 2,119 - 588,736 71.2%
Amortization of acquisition-related intangible assets - - - 14,583 (a) - 14,583 1.8%
Total cost of product revenues 583,310 70.5% 3,307 16,702 - 603,319 72.9%
Product gross profit 136,681 19.0% (3,307) (16,702) - 116,672 16.2%
Gross profit 243,722 29.5% (3,307) (16,702) - 223,713 27.1%
Research and development 88,172 10.7% 13,013 - - 101,185 12.2%
Sales and marketing 50,156 6.1% 10,361 - - 60,517 7.3%
General and administrative 30,875 3.7% 10,290 - - 41,165 5.0%
Amortization of acquisition-related intangible assets - 0.0% - 7,050 (a) - 7,050 0.9%
Restructuring and other 212 0.0% - - - 212 0.0%
Total operating expenses 169,415 20.5% 33,664 7,050 - 210,129 25.4%
Operating income 74,307 9.0% (36,971) (23,752) - 13,584 1.6%
Total other income 38,556 4.7% - - (11,331) (c) 27,225 3.3%
Income before taxes 112,863 13.6% (36,971) (23,752) (11,331) 40,809 4.9%
Provision for income taxes 40,970 5.0% (13,273) (b) (4,092) (b) (4,775) (b) 18,830 2.3%
Income after tax 71,893 8.7% (23,698) (19,660) (6,556) 21,979 2.7%
Non-controlling interests 51 0.0% - - - 51 0.0%
Net income 71,842$ 8.7% (23,698)$ (19,660)$ (6,556)$ 21,928$ 2.7%
Net income per share, diluted 0.30$ 0.09$
Diluted shares used in computing net income per share 236,855 236,036
Effective tax rate 36.3% 46.1%
(a) Amortization of acquisition-related intangible assets, primarily core and developed technology related to acquisitions of Matrix Semiconductor, Inc. (1/06) and msystems Ltd. (11/06).
(b) Income taxes associated with certain non-GAAP adjustments.
(c) Incremental interest expense relating to the non-cash economic interest expense associated with the Company's cash-settled convertible debt.
(d) As adjusted for the retroactive adoption of new accounting requirements, effective December 29, 2008, relating to non-cash economic interest expense associated with the Company's cash-settled convertible debt.

Page 232 Investor Day | February 26, 2010
RECONCILIATION OF NON-GAAP TO GAAP STATEMENT OF OPERATIONSThree months ended September 30, 2007(in thousands, except percentages and per share amounts, unaudited)
SanDisk Purchase Convertible SanDisk
Consolidated % of Share-based Accounting Debt Consolidated % of
Non-GAAP Revenue Compensation Adjustments Interest GAAP (d) Revenue
Product revenue 918,810$ 88.6% -$ -$ -$ 918,810$ 88.6%
License and royalty revenue 118,613 11.4% - - - 118,613 11.4%
Total revenues 1,037,423 100.0% - - - 1,037,423 100.0%
Cost of product revenues 676,359 65.2% 4,162 - - 680,521 65.6%
Amortization of acquisition-related intangible assets - - - 14,582 (a) - 14,582 1.4%
Total cost of product revenues 676,359 65.2% 4,162 14,582 - 695,103 67.0%
Product gross profit 242,451 26.4% (4,162) (14,582) - 223,707 24.3%
Gross profit 361,064 34.8% (4,162) (14,582) - 342,320 33.0%
Research and development 98,005 9.4% 12,528 - - 110,533 10.7%
Sales and marketing 64,499 6.2% 7,956 - - 72,455 7.0%
General and administrative 36,100 3.5% 9,481 - - 45,581 4.4%
Amortization of acquisition-related intangible assets - 0.0% - 4,600 (a) - 4,600 0.4%
Total operating expenses 198,604 19.1% 29,965 4,600 - 233,169 22.5%
Operating income 162,460 15.7% (34,127) (19,182) - 109,151 10.5%
Total other income 29,200 2.8% - - (11,537) (c) 17,663 1.7%
Income before taxes 191,660 18.5% (34,127) (19,182) (11,537) 126,814 12.2%
Provision for income taxes 61,857 6.0% (11,613) (b) 3,469 (b) (3,548) (b) 50,165 4.8%
Income after tax 129,803 12.5% (22,514) (22,651) (7,989) 76,649 7.4%
Non-controlling interests - 0.0% - - - - 0.0%
Net income 129,803$ 12.5% (22,514)$ (22,651)$ (7,989)$ 76,649$ 7.4%
Net income per share, diluted 0.54$ 0.32$
Diluted shares used in computing net income per share 238,643 236,930
Effective tax rate 32.3% 39.6%
(a) Amortization of acquisition-related intangible assets, primarily core and developed technology related to acquisitions of Matrix Semiconductor, Inc. (1/06) and msystems Ltd. (11/06).
(b) Income taxes associated with certain non-GAAP adjustments.
(c) Incremental interest expense relating to the non-cash economic interest expense associated with the Company's cash-settled convertible debt.
(d) As adjusted for the retroactive adoption of new accounting requirements, effective December 29, 2008, relating to non-cash economic interest expense associated with the Company's cash-settled convertible debt.

Page 233 Investor Day | February 26, 2010
RECONCILIATION OF NON-GAAP TO GAAP STATEMENT OF OPERATIONSThree months ended December 30, 2007(in thousands, except percentages and per share amounts, unaudited)
SanDisk Purchase Convertible SanDisk
Consolidated % of Share-based Accounting Debt Consolidated % of
Non-GAAP Revenue Compensation Adjustments Interest GAAP (d) Revenue
Product revenue 1,117,967$ 89.7% -$ -$ -$ 1,117,967$ 89.7%
License and royalty revenue 127,858 10.3% - - - 127,858 10.3%
Total revenues 1,245,825 100.0% - - - 1,245,825 100.0%
Cost of product revenues 785,433 63.0% 4,060 - - 789,493 63.4%
Amortization of acquisition-related intangible assets - - - 14,582 (a) - 14,582 1.2%
Total cost of product revenues 785,433 63.0% 4,060 14,582 - 804,075 64.5%
Product gross profit 332,534 29.7% (4,060) (14,582) - 313,892 28.1%
Gross profit 460,392 37.0% (4,060) (14,582) - 441,750 35.5%
Research and development 99,743 8.0% 10,965 - - 110,708 8.9%
Sales and marketing 98,934 7.9% 6,482 - - 105,416 8.5%
General and administrative 38,586 3.1% 9,186 - - 47,772 3.8%
Amortization of acquisition-related intangible assets - 0.0% - 4,558 (a) - 4,558 0.4%
Total operating expenses 237,263 19.0% 26,633 4,558 - 268,454 21.5%
Operating income 223,129 17.9% (30,693) (19,140) - 173,296 13.9%
Total other income 17,887 1.4% - - (11,772) (c) 6,115 0.5%
Income before taxes 241,016 19.3% (30,693) (19,140) (11,772) 179,411 14.4%
Provision for income taxes 79,387 6.4% 6,504 (b) (518) (b) (4,216) (b) 81,157 6.5%
Income after tax 161,629 13.0% (37,197) (18,622) (7,556) 98,254 7.9%
Non-controlling interests - 0.0% - - - - 0.0%
Net income 161,629$ 13.0% (37,197)$ (18,622)$ (7,556)$ 98,254$ 7.9%
Net income per share, diluted 0.69$ 0.42$
Diluted shares used in computing net income per share 234,154 234,033
Effective tax rate 32.9% 45.2%
(a) Amortization of acquisition-related intangible assets, primarily core and developed technology related to acquisitions of Matrix Semiconductor, Inc. (1/06) and msystems Ltd. (11/06).
(b) Income taxes associated with certain non-GAAP adjustments.
(c) Incremental interest expense relating to the non-cash economic interest expense associated with the Company's cash-settled convertible debt.
(d) As adjusted for the retroactive adoption of new accounting requirements, effective December 29, 2008, relating to non-cash economic interest expense associated with the Company's cash-settled convertible debt.

Page 234 Investor Day | February 26, 2010
RECONCILIATION OF NON-GAAP TO GAAP STATEMENT OF OPERATIONSTwelve months ended December 30, 2007(in thousands, except percentages and per share amounts, unaudited)
SanDisk Purchase Convertible SanDisk
Consolidated % of Share-based Accounting Debt Consolidated % of
Non-GAAP Revenue Compensation Adjustments Interest GAAP (d) Revenue
Product revenue 3,446,125$ 88.4% -$ -$ -$ 3,446,125$ 88.4%
License and royalty revenue 450,241 11.6% - - - 450,241 11.6%
Total revenues 3,896,366 100.0% - - - 3,896,366 100.0%
Cost of product revenues 2,607,029 66.9% 14,743 7,066 - 2,628,838 67.5%
Amortization of acquisition-related intangible assets - - - 64,809 (a) - 64,809 1.7%
Total cost of product revenues 2,607,029 66.9% 14,743 71,875 - 2,693,647 69.1%
Product gross profit 839,096 24.3% (14,743) (71,875) - 752,478 21.8%
Gross profit 1,289,337 33.1% (14,743) (71,875) - 1,202,719 30.9%
Research and development 368,873 9.5% 49,193 - - 418,066 10.7%
Sales and marketing 262,872 6.7% 31,722 - - 294,594 7.6%
General and administrative 144,157 3.7% 37,352 - - 181,509 4.7%
Amortization of acquisition-related intangible assets - 0.0% - 25,308 (a) - 25,308 0.6%
Restructuring and other 6,728 0.2% - - - 6,728 0.2%
Total operating expenses 782,630 20.1% 118,267 25,308 - 926,205 23.8%
Operating income 506,707 13.0% (133,010) (97,183) - 276,514 7.1%
Total other income 121,902 3.1% - - (45,758) (c) 76,144 2.0%
Income before taxes 628,609 16.1% (133,010) (97,183) (45,758) 352,658 9.1%
Provision for income taxes 215,289 5.5% (29,371) (b) (11,070) (b) (18,017) (b) 156,831 4.0%
Income after tax 413,320 10.6% (103,639) (86,113) (27,741) 195,827 5.0%
Non-controlling interests 5,211 0.1% - - - 5,211 0.1%
Net income 408,109$ 10.5% (103,639)$ (86,113)$ (27,741)$ 190,616$ 4.9%
Net income per share calculation:
Net income used in computing basic net income per share 408,109$ 190,616$
Tax-effected interest costs related to convertible long term debt 469 469
Net income used in computing diluted net income per share 408,578$ 191,085$
Net income per share, diluted 1.73$ 0.81$
Diluted shares used in computing net income per share 236,614 235,857
Effective tax rate 34.2% 44.5%
(a) Amortization of acquisition-related intangible assets, primarily core and developed technology related to acquisitions of Matrix Semiconductor, Inc. (1/06) and msystems Ltd. (11/06).
(b) Income taxes associated with certain non-GAAP adjustments.
(c) Incremental interest expense relating to the non-cash economic interest expense associated with the Company's cash-settled convertible debt.
(d) As adjusted for the retroactive adoption of new accounting requirements, effective December 29, 2008, relating to non-cash economic interest expense associated with the Company's cash-settled convertible debt.
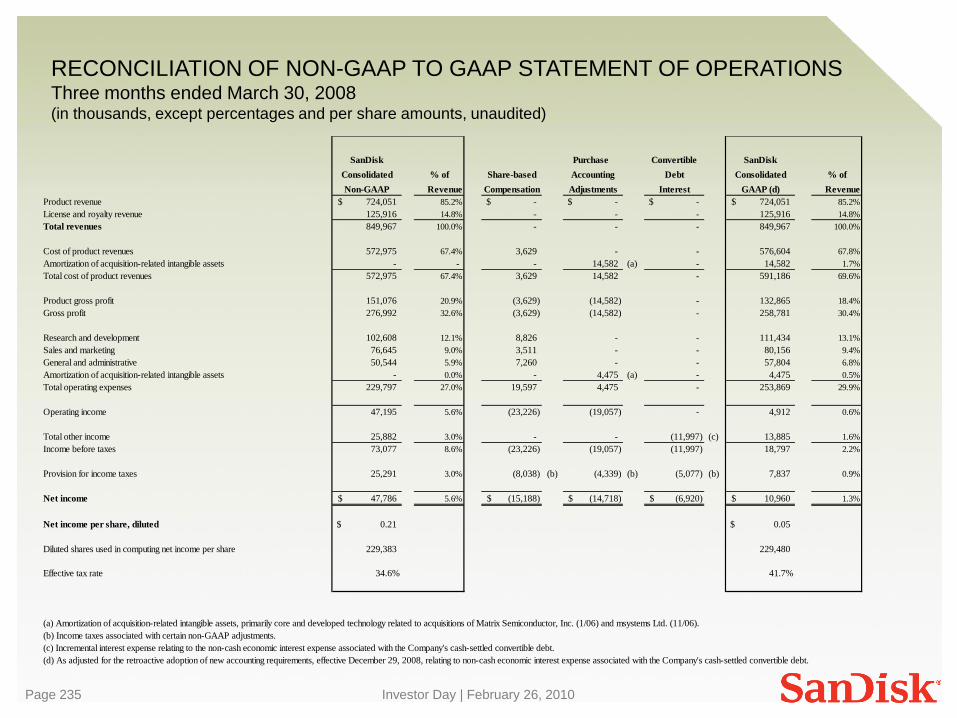
Page 235 Investor Day | February 26, 2010
RECONCILIATION OF NON-GAAP TO GAAP STATEMENT OF OPERATIONSThree months ended March 30, 2008(in thousands, except percentages and per share amounts, unaudited)
SanDisk Purchase Convertible SanDisk
Consolidated % of Share-based Accounting Debt Consolidated % of
Non-GAAP Revenue Compensation Adjustments Interest GAAP (d) Revenue
Product revenue 724,051$ 85.2% -$ -$ -$ 724,051$ 85.2%
License and royalty revenue 125,916 14.8% - - - 125,916 14.8%
Total revenues 849,967 100.0% - - - 849,967 100.0%
Cost of product revenues 572,975 67.4% 3,629 - - 576,604 67.8%
Amortization of acquisition-related intangible assets - - - 14,582 (a) - 14,582 1.7%
Total cost of product revenues 572,975 67.4% 3,629 14,582 - 591,186 69.6%
Product gross profit 151,076 20.9% (3,629) (14,582) - 132,865 18.4%
Gross profit 276,992 32.6% (3,629) (14,582) - 258,781 30.4%
Research and development 102,608 12.1% 8,826 - - 111,434 13.1%
Sales and marketing 76,645 9.0% 3,511 - - 80,156 9.4%
General and administrative 50,544 5.9% 7,260 - - 57,804 6.8%
Amortization of acquisition-related intangible assets - 0.0% - 4,475 (a) - 4,475 0.5%
Total operating expenses 229,797 27.0% 19,597 4,475 - 253,869 29.9%
Operating income 47,195 5.6% (23,226) (19,057) - 4,912 0.6%
Total other income 25,882 3.0% - - (11,997) (c) 13,885 1.6%
Income before taxes 73,077 8.6% (23,226) (19,057) (11,997) 18,797 2.2%
Provision for income taxes 25,291 3.0% (8,038) (b) (4,339) (b) (5,077) (b) 7,837 0.9%
Net income 47,786$ 5.6% (15,188)$ (14,718)$ (6,920)$ 10,960$ 1.3%
Net income per share, diluted 0.21$ 0.05$
Diluted shares used in computing net income per share 229,383 229,480
Effective tax rate 34.6% 41.7%
(a) Amortization of acquisition-related intangible assets, primarily core and developed technology related to acquisitions of Matrix Semiconductor, Inc. (1/06) and msystems Ltd. (11/06).
(b) Income taxes associated with certain non-GAAP adjustments.
(c) Incremental interest expense relating to the non-cash economic interest expense associated with the Company's cash-settled convertible debt.
(d) As adjusted for the retroactive adoption of new accounting requirements, effective December 29, 2008, relating to non-cash economic interest expense associated with the Company's cash-settled convertible debt.

Page 236 Investor Day | February 26, 2010
RECONCILIATION OF NON-GAAP TO GAAP STATEMENT OF OPERATIONSThree months ended June 29, 2008 (in thousands, except percentages and per share amounts, unaudited)
SanDisk Purchase Convertible SanDisk
Consolidated % of Share-based Accounting Debt Consolidated % of
Non-GAAP Revenue Compensation Adjustments Interest GAAP (d) Revenue
Product revenue 687,508$ 84.3% -$ -$ -$ 687,508$ 84.3%
License and royalty revenue 128,503 15.7% - - - 128,503 15.7%
Total revenues 816,011 100.0% - - - 816,011 100.0%
Cost of product revenues 648,549 79.5% 2,009 - - 650,558 79.7%
Amortization of acquisition-related intangible assets - - - 14,582 (a) - 14,582 1.8%
Total cost of product revenues 648,549 79.5% 2,009 14,582 - 665,140 81.5%
Product gross profit 38,959 5.7% (2,009) (14,582) - 22,368 3.3%
Gross profit 167,462 20.5% (2,009) (14,582) - 150,871 18.5%
Research and development 102,819 12.6% 9,324 - - 112,143 13.7%
Sales and marketing 71,215 8.7% 6,423 - - 77,638 9.5%
General and administrative 46,332 5.7% 7,352 - - 53,684 6.6%
Amortization of acquisition-related intangible assets - 0.0% - 4,553 (a) - 4,553 0.6%
Restructuring and other 4,085 0.5% - - - 4,085 0.5%
Total operating expenses 224,451 27.5% 23,099 4,553 - 252,103 30.9%
Operating loss (56,989) -7.0% (25,108) (19,135) - (101,232) -12.4%
Total other income 20,542 2.5% - - (12,219) (c) 8,323 1.0%
Loss before taxes (36,447) -4.5% (25,108) (19,135) (12,219) (92,909) -11.4%
Benefit from income taxes (14,106) -1.7% 652 (b) 641 (b) (6,342) (b) (19,155) -2.3%
Net loss (22,341)$ -2.7% (25,760)$ (19,776)$ (5,877)$ (73,754)$ -9.0%
Net loss per share, diluted (0.10)$ (0.33)$
Diluted shares used in computing net loss per share 224,888 224,888
Effective tax rate 38.7% 20.6%
(a) Amortization of acquisition-related intangible assets, primarily core and developed technology related to acquisitions of Matrix Semiconductor, Inc. (January 2006), msystems Ltd. (November 2006),
and MusicGremlin, Inc. (June 2008).
(b) Income taxes associated with certain non-GAAP adjustments.
(c) Incremental interest expense relating to the non-cash economic interest expense associated with the Company's cash-settled convertible debt.
(d) As adjusted for the retroactive adoption of new accounting requirements, effective December 29, 2008, relating to non-cash economic interest expense associated with the Company's cash-settled convertible debt.

Page 237 Investor Day | February 26, 2010
RECONCILIATION OF NON-GAAP TO GAAP STATEMENT OF OPERATIONSThree months ended September 28, 2008(in thousands, except percentages and per share amounts, unaudited)
SanDisk Purchase Convertible SanDisk
Consolidated % of Share-based Accounting Debt Consolidated % of
Non-GAAP Revenue Compensation Adjustments Interest GAAP (d) Revenue
Product revenue 689,556$ 83.9% -$ -$ -$ 689,556$ 83.9%
License and royalty revenue 131,941 16.1% - - - 131,941 16.1%
Total revenues 821,497 100.0% - - - 821,497 100.0%
Cost of product revenues 810,184 98.6% 2,648 - - 812,832 98.9%
Amortization of acquisition-related intangible assets - - - 14,582 (a) - 14,582 1.8%
Total cost of product revenues 810,184 98.6% 2,648 14,582 - 827,414 100.7%
Product gross loss (120,628) -17.5% (2,648) (14,582) - (137,858) -20.0%
Gross profit (loss) 11,313 1.4% (2,648) (14,582) - (5,917) -0.7%
Research and development 94,017 11.4% 10,543 - - 104,560 12.7%
Sales and marketing 82,313 10.0% 5,546 - - 87,859 10.7%
General and administrative 40,277 4.9% 6,814 - - 47,091 5.7%
Amortization of acquisition-related intangible assets - 0.0% - 4,766 (a) - 4,766 0.6%
Total operating expenses 216,607 26.4% 22,903 4,766 - 244,276 29.7%
Operating loss (205,294) -25.0% (25,551) (19,348) - (250,193) -30.5%
Total other loss (450) -0.1% - - (12,451) (c) (12,901) -1.6%
Loss before taxes (205,744) -25.0% (25,551) (19,348) (12,451) (263,094) -32.0%
Benefit from income taxes (73,656) -9.0% (10,853) (b) (10,940) (b) (1,746) (b) (97,195) -11.8%
Net loss (132,088)$ -16.1% (14,698)$ (8,408)$ (10,705)$ (165,899)$ -20.2%
Net loss per share, diluted (0.59)$ (0.74)$
Diluted shares used in computing net loss per share 225,682 225,682
Effective tax rate 35.8% 36.9%
(a) Amortization of acquisition-related intangible assets, primarily core and developed technology related to acquisitions of Matrix Semiconductor, Inc. (January 2006), msystems Ltd. (November 2006),
and MusicGremlin, Inc. (June 2008).
(b) Income taxes associated with certain non-GAAP adjustments.
(c) Incremental interest expense relating to the non-cash economic interest expense associated with the Company's cash-settled convertible debt.
(d) As adjusted for the retroactive adoption of new accounting requirements, effective December 29, 2008, relating to non-cash economic interest expense associated with the Company's cash-settled convertible debt.

Page 238 Investor Day | February 26, 2010
RECONCILIATION OF NON-GAAP TO GAAP STATEMENT OF OPERATIONSThree months ended December 28, 2008 (in thousands, except percentages and per share amounts, unaudited)
SanDisk Purchase Convertible SanDisk
Consolidated % of Share-based Accounting Debt Consolidated % of
Non-GAAP Revenue Compensation Adjustments Interest Impairments GAAP (e) Revenue
Product revenue 742,128$ 85.9% -$ -$ -$ -$ 742,128$ 85.9%
License and royalty revenue 121,749 14.1% - - - - 121,749 14.1%
Total revenues 863,877 100.0% - - - - 863,877 100.0%
Cost of product revenues 1,191,270 137.9% 2,489 - - - 1,193,759 138.2%
Amortization of acquisition-related intangible assets - - - 10,766 (a) - - 10,766 1.2%
Total cost of product revenues 1,191,270 137.9% 2,489 10,766 - - 1,204,525 139.4%
Product gross loss (449,142) -60.5% (2,489) (10,766) - - (462,397) -62.3%
Gross loss (327,393) -37.9% (2,489) (10,766) - - (340,648) -39.4%
Research and development 91,651 10.6% 10,161 - - - 101,812 11.8%
Sales and marketing 77,839 9.0% 4,587 - - - 82,426 9.5%
General and administrative 39,509 4.6% 6,677 - - - 46,186 5.3%
Impairment of goodwill - 0.0% - - - 845,453 (d) 845,453 97.9%
Impairment of acquisition-related intangible assets - 0.0% - - - 175,785 (d) 175,785 20.3%
Amortization of acquisition-related intangible assets - 0.0% - 3,275 (a) - - 3,275 0.4%
Restructuring and other 31,382 3.6% - - - - 31,382 3.6%
Total operating expenses 240,381 27.8% 21,425 3,275 - 1,021,238 1,286,319 148.9%
Operating loss (567,774) -65.7% (23,914) (14,041) - (1,021,238) (1,626,967) -188.3%
Total other income 24,472 2.8% - - (12,673) (c) - 11,799 1.4%
Loss before taxes (543,302) -62.9% (23,914) (14,041) (12,673) (1,021,238) (1,615,168) -187.0%
Provision for (benefit from) income taxes (183,971) -21.3% (12,065) (b) (7,084) (b) (106,327) (b) 452,210 (b) 142,763 16.5%
Net loss (359,331)$ -41.6% (11,849)$ (6,957)$ 93,654$ (1,473,448)$ (1,757,931)$ -203.5%
Net loss per share, diluted (1.59)$ (7.78)$
Diluted shares used in computing net loss per share 226,079 226,079
Effective tax rate 33.9% -8.8%
(a) Amortization of acquisition-related intangible assets, primarily core and developed technology related to acquisitions of Matrix Semiconductor, Inc. (January 2006), msystems Ltd. (November 2006),
and MusicGremlin, Inc. (June 2008).
(b) Income taxes associated with certain non-GAAP adjustments and an allowance on deferred taxes.
(c) Incremental interest expense relating to the non-cash economic interest expense associated with the Company's cash-settled convertible debt.
(d) Impairment of goodwill and acquisition-related intangible assets primarily related to acquisitions of Matrix Semiconductor, Inc. (January 2006), msystems Ltd. (November 2006), MusicGremlin, Inc. (June 2008).
(e) As adjusted for the retrospective adoption of new accounting requirements, effective December 29, 2008, relating to non-cash economic interest expense associated with the Company's cash-settled convertible debt.

Page 239 Investor Day | February 26, 2010
RECONCILIATION OF NON-GAAP TO GAAP STATEMENT OF OPERATIONSTwelve months ended December 28, 2008(in thousands, except percentages and per share amounts, unaudited)
SanDisk Purchase Convertible SanDisk
Consolidated % of Share-based Accounting Debt Consolidated % of
Non-GAAP Revenue Compensation Adjustments Interest Impairments GAAP (e) Revenue
Product revenue 2,843,243$ 84.8% -$ -$ -$ -$ 2,843,243$ 84.8%
License and royalty revenue 508,109 15.2% - - - - 508,109 15.2%
Total revenues 3,351,352 100.0% - - - - 3,351,352 100.0%
Cost of product revenues 3,222,978 96.2% 10,775 - - - 3,233,753 96.5%
Amortization of acquisition-related intangible assets - - - 54,512 (a) - - 54,512 1.6%
Total cost of product revenues 3,222,978 96.2% 10,775 54,512 - - 3,288,265 98.1%
Product gross loss (379,735) -13.4% (10,775) (54,512) - - (445,022) -15.7%
Gross profit 128,374 3.8% (10,775) (54,512) - - 63,087 1.9%
Research and development 391,095 11.7% 38,854 - - - 429,949 12.8%
Sales and marketing 308,012 9.2% 20,067 - - - 328,079 9.8%
General and administrative 176,662 5.3% 28,103 - - - 204,765 6.1%
Impairment of goodwill - 0.0% - - - 845,453 (d) 845,453 25.2%
Impairment of acquisition-related intangible assets - 0.0% - - - 175,785 (d) 175,785 5.2%
Amortization of acquisition-related intangible assets - 0.0% - 17,069 (a) - - 17,069 0.5%
Restructuring and other 35,467 1.1% - - - - 35,467 1.1%
Total operating expenses 911,236 27.2% 87,024 17,069 - 1,021,238 2,036,567 60.8%
Operating loss (782,862) -23.4% (97,799) (71,581) - (1,021,238) (1,973,480) -58.9%
Total other income 70,446 2.1% - - (49,340) (c) - 21,106 0.6%
Loss before taxes (712,416) -21.3% (97,799) (71,581) (49,340) (1,021,238) (1,952,374) -58.3%
Provision for (benefit from) income taxes (246,442) -7.4% (30,304) (b) (21,722) (b) (119,492) (b) 452,210 (b) 34,250 1.0%
Net loss (465,974)$ -13.9% (67,495)$ (49,859)$ 70,152$ (1,473,448)$ (1,986,624)$ -59.3%
Net loss per share, diluted (2.07)$ (8.82)$
Diluted shares used in computing net loss per share 225,292 225,292
Effective tax rate 34.6% -1.8%
(a) Amortization of acquisition-related intangible assets, primarily core and developed technology related to acquisitions of Matrix Semiconductor, Inc. (January 2006), msystems Ltd. (November 2006),
and MusicGremlin, Inc. (June 2008).
(b) Income taxes associated with certain non-GAAP adjustments and an allowance on deferred taxes.
(c) Incremental interest expense relating to the non-cash economic interest expense associated with the Company's cash-settled convertible debt.
(d) Impairment of goodwill and acquisition-related intangible assets primarily related to acquisitions of Matrix Semiconductor, Inc. (January 2006), msystems Ltd. (November 2006), MusicGremlin, Inc. (June 2008).
(e) As adjusted for the retrospective adoption of new accounting requirements, effective December 29, 2008, relating to non-cash economic interest expense associated with the Company's cash-settled convertible debt.

Page 240 Investor Day | February 26, 2010
RECONCILIATION OF NON-GAAP TO GAAP STATEMENT OF OPERATIONSThree months ended March 29, 2009(in thousands, except percentages and per share amounts, unaudited)
Purchase Convertible
% of Share-based Accounting Debt % of
Non-GAAP Revenue Compensation Adjustments Interest Other GAAP Revenue
Product revenues 588,099$ 89.2% -$ -$ -$ -$ 588,099$ 89.2%
License and royalty revenues 71,372 10.8% - - - - 71,372 10.8%
Total revenues 659,471 100.0% - - - - 659,471 100.0%
Cost of product revenues 655,104 99.3% 2,374 - - - 657,478 99.7%
Amortization of acquisition-related intangible assets - - - 3,132 (a) - - 3,132 0.5%
Total cost of product revenues 655,104 99.3% 2,374 3,132 - - 660,610 100.2%
Product gross loss (67,005) -11.4% (2,374) (3,132) - - (72,511) -12.3%
Gross profit (loss) 4,367 0.7% (2,374) (3,132) - - (1,139) -0.2%
Research and development 80,784 12.2% 6,152 - - - 86,936 13.2%
Sales and marketing 35,529 5.4% 2,349 - - - 37,878 5.7%
General and administrative 32,870 5.1% 5,455 - - - 38,325 5.9%
Amortization of acquisition-related intangible assets - - - 292 (a) - - 292 0.0%
Restructuring and other 765 0.1% - - - - 765 0.1%
Total operating expenses 149,948 22.8% 13,956 292 - - 164,196 24.9%
Operating loss (145,581) -22.1% (16,330) (3,424) - - (165,335) -25.1%
Other income/(expense) (5,767) -0.8% - - (12,926) (b) - (18,693) -2.8%
Loss before income taxes (151,348) -22.9% (16,330) (3,424) (12,926) - (184,028) -27.9%
Provision for (benefit from) income taxes (42,885) -6.5% (4,511) (1,268) (4,791) 77,422 (c) 23,967 3.6%
Net loss (108,463)$ -16.4% (11,819)$ (2,156)$ (8,135)$ (77,422)$ (207,995)$ -31.5%
Net loss per share, diluted (0.48)$ (0.92)$
Diluted shares used in computing net loss per share 226,529 226,529
Effective tax rate 28.3% -13.0%
(a) Amortization of acquisition-related intangible assets, primarily core and developed technology related to acquisitions of Matrix Semiconductor, Inc. (1/06) and MusicGremlin, Inc. (6/08).
(b) Incremental interest expense relating to the non-cash economic interest expense associated with the Company's cash-settled convertible debt.
(c) Income taxes associated with certain non-GAAP to GAAP adjustments.

Page 241 Investor Day | February 26, 2010
RECONCILIATION OF NON-GAAP TO GAAP STATEMENT OF OPERATIONSThree months ended June 28, 2009 (in thousands, except percentages and per share amounts, unaudited)
Purchase Convertible
% of Share-based Accounting Debt % of
Non-GAAP Revenue Compensation Adjustments Interest Other GAAP Revenue
Product revenues 610,432$ 83.6% -$ -$ -$ -$ 610,432$ 83.6%
License and royalty revenues 120,141 16.4% - - - - 120,141 16.4%
Total revenues 730,573 100.0% - - - - 730,573 100.0%
Cost of product revenues 475,998 65.2% 2,446 - - - 478,444 65.5%
Amortization of acquisition-related intangible assets - 0.0% - 3,132 (a) - - 3,132 0.4%
Total cost of product revenues 475,998 65.2% 2,446 3,132 - - 481,576 65.9%
Product gross profit 134,434 22.0% (2,446) (3,132) - - 128,856 21.1%
Gross profit 254,575 34.8% (2,446) (3,132) - - 248,997 34.1%
Research and development 82,167 11.2% 9,052 - - - 91,219 12.5%
Sales and marketing 45,523 6.2% 4,886 - - - 50,409 6.9%
General and administrative 32,666 4.5% 5,970 - - - 38,636 5.3%
Amortization of acquisition-related intangible assets - 0.0% - 291 (a) - - 291 0.0%
Total operating expenses 160,356 21.9% 19,908 291 - - 180,555 24.7%
Operating income 94,219 12.9% (22,354) (3,423) - - 68,442 9.4%
Other income (expense) 17,875 2.4% - - (13,159) (b) - 4,716 0.6%
Income before income taxes 112,094 15.3% (22,354) (3,423) (13,159) - 73,158 10.0%
Provision for income taxes 29,146 3.9% (6,175) (1,270) (4,877) 3,827 (c) 20,651 2.8%
Net income 82,948$ 11.4% (16,179)$ (2,153)$ (8,282)$ (3,827)$ 52,507$ 7.2%
Net income per share, diluted 0.36$ 0.23$
Diluted shares used in computing net income per share 231,818 231,066
Effective tax rate 26.0% 28.2%
(a) Amortization of acquisition-related intangible assets, primarily core and developed technology related to acquisitions of Matrix Semiconductor, Inc. (1/06) and MusicGremlin, Inc. (6/08).
(b) Incremental interest expense relating to the non-cash economic interest expense associated with the Company's cash-settled convertible debt.
(c) Income taxes associated with certain non-GAAP to GAAP adjustments.

Page 242 Investor Day | February 26, 2010
RECONCILIATION OF NON-GAAP TO GAAP STATEMENT OF OPERATIONSThree months ended September 27, 2009(in thousands, except percentages and per share amounts, unaudited)
Purchase Convertible
% of Share-based Accounting Debt % of
Non-GAAP Revenue Compensation Adjustments Interest Other GAAP Revenue
Product revenues 813,811$ 87.0% -$ -$ -$ -$ 813,811$ 87.0%
License and royalty revenues 121,360 13.0% - - - - 121,360 13.0%
Total revenues 935,171 100.0% - - - - 935,171 100.0%
Cost of product revenues 493,422 60.6% (a) 2,347 - - - 495,769 60.9%
Amortization of acquisition-related intangible assets - 0.0% (a) - 3,132 (b) - - 3,132 0.4%
Total cost of product revenues 493,422 60.6% (a) 2,347 3,132 - - 498,901 61.3%
Product gross profit 320,389 39.4% (a) (2,347) (3,132) - - 314,910 38.7%
Total gross profit 441,749 47.2% (2,347) (3,132) - - 436,270 46.7% (a)
(a)
Research and development 87,788 9.4% 7,137 - - - 94,925 10.2% (a)
Sales and marketing 51,832 5.5% 3,918 - - - 55,750 6.0%
General and administrative 39,378 4.2% 5,972 - - - 45,350 4.8% (a)
Amortization of acquisition-related intangible assets - 0.0% - 292 (b) - - 292 0.0%
Total operating expenses 178,998 19.1% 17,027 292 - - 196,317 21.0%
Operating income 262,751 28.1% (19,374) (3,424) - - 239,953 25.7%
Other income (expense) 10,872 1.2% - - (13,410) (c) - (2,538) -0.3%
Income before income taxes 273,623 29.3% (19,374) (3,424) (13,410) - 237,415 25.4%
Provision for income taxes 98,112 10.5% (5,352) (1,270) (4,970) (80,398) (d) 6,122 0.7%
Net income 175,511$ 18.8% (14,022)$ (2,154)$ (8,440)$ 80,398$ 231,293$ 24.7%
Net income per share, diluted 0.75$ 0.99$
Diluted shares used in computing net income per share 232,961 232,724
Effective tax rate 35.9% 2.6%
(a) Percent of revenue calculations for cost of product revenues and product gross profit are based on product revenues only (license and royalty revenues are excluded).
(b) Amortization of acquisition-related intangible assets, primarily core and developed technology related to acquisitions of Matrix Semiconductor, Inc. (1/06) and MusicGremlin, Inc. (6/08).
(c) Incremental interest expense relating to the non-cash economic interest expense associated with the Company's cash-settled convertible debt.
(d) Income taxes associated with certain non-GAAP to GAAP adjustments.

Page 243 Investor Day | February 26, 2010
RECONCILIATION OF NON-GAAP TO GAAP STATEMENT OF OPERATIONSThree months ended January 3, 2010 (in thousands, except percentages and per share amounts, unaudited)
Purchase Convertible
% of Share-based Accounting Debt % of
Non-GAAP Revenue Compensation Adjustments Interest Other GAAP Revenue
Product revenues 1,141,972$ 92.0% -$ -$ -$ -$ 1,141,972$ 92.0%
License and royalty revenues 99,619 8.0% - - - - 99,619 8.0%
Total revenues 1,241,591 100.0% - - - - 1,241,591 100.0%
Cost of product revenues 632,700 55.4% (a) 5,260 (b) - - - 637,960 55.9%
Amortization of acquisition-related intangible assets - 0.0% (a) - 3,133 (c) - - 3,133 0.2%
Total cost of product revenues 632,700 55.4% (a) 5,260 3,133 - - 641,093 56.1%
Product gross profit 509,272 44.6% (a) (5,260) (3,133) - - 500,879 43.9%
Total gross profit 608,891 49.0% (5,260) (3,133) - - 600,498 48.4% (a)
(a)
Research and development 97,020 7.8% 14,058 (b) - - - 111,078 8.9% (a)
Sales and marketing 56,383 4.5% 8,094 (b) - - - 64,477 5.2%
General and administrative 38,958 3.2% 10,090 (b) - - - 49,048 4.1% (a)
Amortization of acquisition-related intangible assets - 0.0% - 292 (c) - - 292 0.0%
Restructuring and other (727) -0.1% - - - - (727) -0.1%
Total operating expenses 191,634 15.4% 32,242 292 - - 224,168 18.1%
Operating income 417,257 33.6% (37,502) (3,425) - - 376,330 30.3%
Other income (expense) 15,885 1.3% - - (14,959) (d) - 926 0.1%
Income before income taxes 433,142 34.9% (37,502) (3,425) (14,959) - 377,256 30.4%
Provision for income taxes 155,931 12.6% (10,213) (1,342) (5,837) (100,788) (e) 37,751 3.1%
Net income 277,211$ 22.3% (27,289)$ (2,083)$ (9,122)$ 100,788$ 339,505$ 27.3%
Net income per share, diluted 1.18$ 1.45$
Diluted shares used in computing net income per share 234,381 234,462
Effective tax rate 36.0% 10.0%
(a)
(b)
(c)
(d)
(e) Income taxes associated with certain non-GAAP to GAAP adjustments.
Percent of revenue calculations for cost of product revenues and product gross profit are based on product revenues only (license and royalty revenues are excluded).
Share-based compensation expense. The fourth quarter and full fiscal year 2009 include a one-time cumulative adjustment of $16.2 million to increase share-based compensation due to the way in which the Company's third-party software
Amortization of acquisition-related intangible assets, primarily core and developed technology related to acquisitions of Matrix Semiconductor, Inc. (1/06) and MusicGremlin, Inc. (6/08).
Incremental interest expense relating to the non-cash economic interest expense associated with the Company's cash-settled convertible debt.
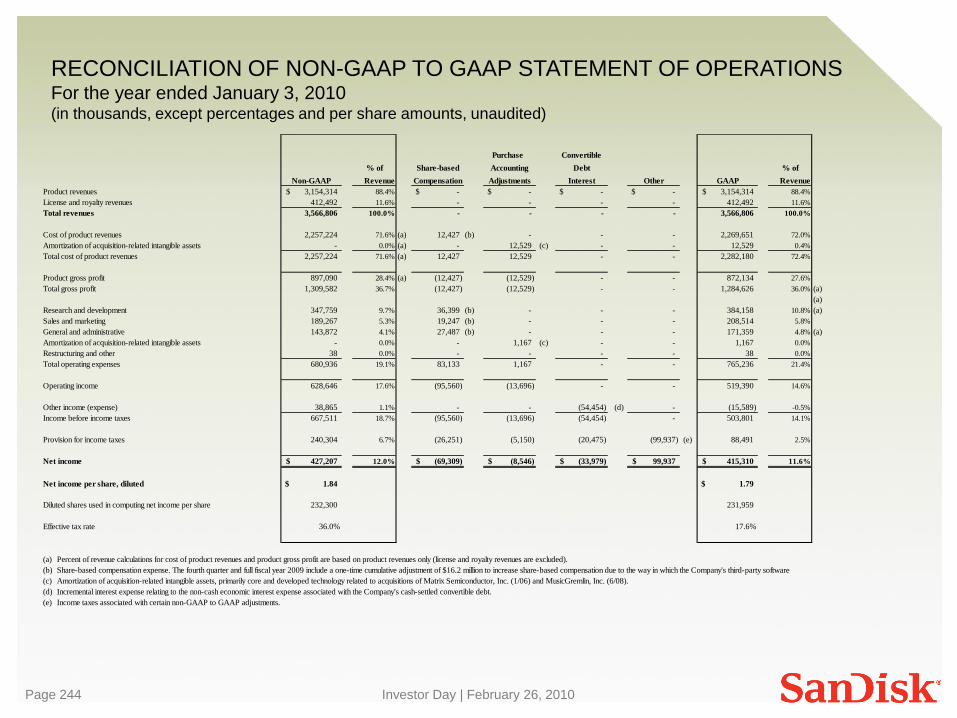
Page 244 Investor Day | February 26, 2010
RECONCILIATION OF NON-GAAP TO GAAP STATEMENT OF OPERATIONSFor the year ended January 3, 2010(in thousands, except percentages and per share amounts, unaudited)
Purchase Convertible
% of Share-based Accounting Debt % of
Non-GAAP Revenue Compensation Adjustments Interest Other GAAP Revenue
Product revenues 3,154,314$ 88.4% -$ -$ -$ -$ 3,154,314$ 88.4%
License and royalty revenues 412,492 11.6% - - - - 412,492 11.6%
Total revenues 3,566,806 100.0% - - - - 3,566,806 100.0%
Cost of product revenues 2,257,224 71.6% (a) 12,427 (b) - - - 2,269,651 72.0%
Amortization of acquisition-related intangible assets - 0.0% (a) - 12,529 (c) - - 12,529 0.4%
Total cost of product revenues 2,257,224 71.6% (a) 12,427 12,529 - - 2,282,180 72.4%
Product gross profit 897,090 28.4% (a) (12,427) (12,529) - - 872,134 27.6%
Total gross profit 1,309,582 36.7% (12,427) (12,529) - - 1,284,626 36.0% (a)
(a)
Research and development 347,759 9.7% 36,399 (b) - - - 384,158 10.8% (a)
Sales and marketing 189,267 5.3% 19,247 (b) - - - 208,514 5.8%
General and administrative 143,872 4.1% 27,487 (b) - - - 171,359 4.8% (a)
Amortization of acquisition-related intangible assets - 0.0% - 1,167 (c) - - 1,167 0.0%
Restructuring and other 38 0.0% - - - - 38 0.0%
Total operating expenses 680,936 19.1% 83,133 1,167 - - 765,236 21.4%
Operating income 628,646 17.6% (95,560) (13,696) - - 519,390 14.6%
Other income (expense) 38,865 1.1% - - (54,454) (d) - (15,589) -0.5%
Income before income taxes 667,511 18.7% (95,560) (13,696) (54,454) - 503,801 14.1%
Provision for income taxes 240,304 6.7% (26,251) (5,150) (20,475) (99,937) (e) 88,491 2.5%
Net income 427,207$ 12.0% (69,309)$ (8,546)$ (33,979)$ 99,937$ 415,310$ 11.6%
Net income per share, diluted 1.84$ 1.79$
Diluted shares used in computing net income per share 232,300 231,959
Effective tax rate 36.0% 17.6%
(a)
(b)
(c)
(d)
(e) Income taxes associated with certain non-GAAP to GAAP adjustments.
Percent of revenue calculations for cost of product revenues and product gross profit are based on product revenues only (license and royalty revenues are excluded).
Share-based compensation expense. The fourth quarter and full fiscal year 2009 include a one-time cumulative adjustment of $16.2 million to increase share-based compensation due to the way in which the Company's third-party software
Amortization of acquisition-related intangible assets, primarily core and developed technology related to acquisitions of Matrix Semiconductor, Inc. (1/06) and MusicGremlin, Inc. (6/08).
Incremental interest expense relating to the non-cash economic interest expense associated with the Company's cash-settled convertible debt.

Page 245 Investor Day | February 26, 2010
SUMMARY OF Q1 2010 AND FISCAL YEAR 2010
FORWARD NON-GAAP AND GAAP GUIDANCEProvided on February 26, 2010 Investor Day Meeting (1)
(in millions, except for percentages)
Non-GAAP GAAP Non-GAAP GAAP
Product Revenue $845 - $910 $785 - $870 $3,640 - $4,080 $3,640 - $4,080
License & Royalty Revenue $80 - $ 90 $80 - $90 $320 - $360 $320 - $360
Total Revenue $925 - $1,000 $875 - $950 $4,000 - $4,400 $4,000 - $4,400
Product Gross Margin (2) (3) 34% +/- 2 points 33% +/- 2 points 31% +/- 3 points 30% +/- 3 points
Total Gross Margin 40% +/- 2 points 39% +/- 2 points 37% +/- 3 points 36% +/- 3 points
Operating Expenses (4) $175 - $185 $190 - $205 $725 - $750 $785 - $830
Other Income (Expense) (5) $10 ($4) $40 ($18)
Tax Rate 37% (6) 37% (6)
(1)
(2)
Explanation of Difference Between Non-GAAP and GAAP:(3)
(4)
(5)
(6)
Non-GAAP excludes incremental interest expense relating to the non-cash economic interest expense associated with
the Company's cash-settled convertible debt.
Non-GAAP total cost of product revenues excludes estimated share-based compensation expenses and amortization
of acquisition-related intangible assets.
Product gross margin reflects product revenues less total cost of product revenues.
Due to a partial valuation allowance on net deferred tax assets, no estimate of GAAP tax provision rate is possible at
this time.
The information herein is qualified by and subject to the disclaimer, regarding forward-looking language statements,
that is included on our SanDisk Investor Relations web page at www.sandisk.com/ir.
Q1 2010 Fiscal Year 2010
Non-GAAP operating expenses excludes estimated share-based compensation expenses and amortization of
acquisition-related intangible assets.

Page 246 Investor Day | February 26, 2010
RECONCILATION OF NON-GAAP TO GAAP FOR LONG-TERM
FINANCIAL MODELProvided on February 26, 2010 Investor Day Meeting
LTFM
Long-Term
Target
Financial Adjustments
Model To Reconcile
Non-GAAP To GAAP (1) GAAP
Revenue
Revenue Growth Y/Y
Product Revenue 92% - 93% - 92% - 93%
L&R Revenue 7% - 8% - 7% - 8%
Total Revenue 100% - 100%
Product Gross Margin 30% - 36% (1%) 29% - 35%
Total Gross Margin 35% - 41% (1%) 34% - 40%
R&D 7% - 9% 1% 8% - 9%
S&M ~5% 1% ~6%
G&A ~3% 1% ~4%
Oper Expenses 15% - 17% 2% 17% - 19%
Oper Income 20% - 24% 3% 17% - 21%
(1) Estimated stock compensation expense and amortization of
acquisition-related intangible assets.

Page 247 Investor Day | February 26, 2010
SanDisk, the SanDisk logo, CompactFlash, SanDisk Extreme, SanDisk Ultra and Sansa are trademarks of SanDisk Corporation, registered in the United States and other countries. iNAND, SanDisk Extreme Pro, SanDisk pSSD, and slotRadio mark and logo are trademarks of SanDisk Corporation. The SD, SDHC, SDXC, microSD, microSDHC and miniSD marks and logos are trademarks of SD-3C, LLC. Memory Stick, Memory Stick Micro M2 and Memory Stick PRO marks and logos are trademarks and registered trademarks of Sony Corporation. Other brand names mentioned herein are for identification purposes only and may be trademarks of their respective holder(s).
* Read/Write performance based on internal testing; performance may vary depending upon host device. 1 megabyte (MB) = 1 million bytes; 1 gigabyte (GB) = 1 billion bytes. slotRadio cards contain songs pre-programmed in music playlists for unlimited playback with slotRadio-compatible devices only. Visit slotRadio.org for slotRadio compatible devices. Much like radio, these songs are played in sequence and cannot be rewound or rearranged, yet individual songs can be skipped as often as you want. Song and playlist files cannot be copied or viewed (for example on a PC). slotRadio content is subject to change. Titles feature songs from Billboard and other music charts.
© 2010 SanDisk Corporation. All rights reserved.