investor briefing q3 2001 final reissued - bce inc
TRANSCRIPT

October 24, 2001
Revised November 6, 2001
Third Quarter 2001 (Unaudited)
This supplement to the press release announcing BCE’s Quarterly results is intended toprovide, on a timely basis, information of interest to the investment community.
Results are reported in Canadian dollars and prepared according to Canadian GAAP.
This supplement is a re-issue of the October 24, 2001 version of BCE’s third quarterresults to provide detailed results for BCE Ventures.
For further information, please contact Isabelle Morin at (514) 786-3845 or GeorgeWalker at (514) 870-2488.
The Investor Briefing is also available on BCE’s web site at www.bce.ca under theInvestor Relations section.
Investor Briefing
Certain sections of this document contain forward-looking statements with respect to BCE and itssubsidiaries. These forward-looking statements, by their nature, necessarily involve risks anduncertainties that could cause actual results to differ materially from those contemplated by theforward-looking statements. Factors which could cause actual results or events to differ materiallyfrom current expectations are discussed on page 22 under “CAUTIONARY STATEMENTCONCERNING FORWARD-LOOKING STATEMENTS”.
This material is presented for information only, and should not be construed as a solicitation to investin any securities of BCE Inc.

BCE Inc. | Investor Briefing – Third Quarter 2001
October 24, 2001
n BCE’s Core Operations Drive 6% Revenue GrowthData, Wireless, High Speed Internet and Satellite Television show continued growth
• BCE reported its third quarterresults, reflecting solid growthin the face of a morechallenging environment.
• Revenues from coreoperations grew 6.1% to reach$5.1B as compared to the thirdquarter of 2000, showingstrong performance by BCE’sgrowth drivers.
• Bell Canada contributedrevenue increases of 21% inwireless and 17% in data. BellExpressVu revenue grew by44% and BCE Emergisrevenue reflected a 29%increase.
• Consolidated revenues for thethird quarter of 2001 were$5.4B, up 5.7% from the sameperiod last year.
• EBITDA from core activitieswas $1.9B reflecting 4.7%growth compared to the sameperiod last year. ConsolidatedEBITDA growth was 6.6%.
• Consolidated cash baselineearnings per share of $0.40 forthe third quarter increased11% compared to proformacash baseline earnings pershare of $0.36 last year.
Summary of Third Quarter Results
(Millions of dollars, except where otherwise indicated)2001 2000* % change
Proforma Consolidated results
Revenues – Core 5,087 4,795 6.1%Revenues – Total (3) 5,379 5,089 5.7%
EBITDA - Core 1,854 1,771 4.7%EBITDA – Total (3) 1,942 1,821 6.6%
Cash baseline earnings per common share ($) - Core 0.40 0.34 17.6%Cash baseline earnings per common share ($) – Total (3) 0.40 0.36 11.1%
Bell CanadaWirelineData revenues 881 756 16.5%High Speed Internet net activations (k) 96 81 18.5%
WirelessRevenues 490 406 20.7%PCS and cellular net activations (k) 151 141 7.1%
Bell ExpressVuRevenues 117 81 44.4%DTH net activations (k) 83 68 22.1%
Bell GlobemediaRevenues 246 251 (2.0%)
TeleglobeGross data and hosting revenues 139 145 (4.1%)Gross voice revenues 352 373 (5.6%)Net voice revenues 87 73 19.2%
BCE EmergisRevenues 173 134 29.1%
Investor Briefing
* Proforma for 2000 reflects the acquisition and consolidation of CTV (including NetStar), the Globe and Mail, Globe Interactive and Teleglobe for improved comparability. Figures have been restated to reflect Excel as a discontinued operation – see note 3.

BCE Inc. Investor Briefing – Third Quarter 2001 Page 2
Solid data growth despite continued economic weakness
Growth
• Data revenues came in at$881 million for the thirdquarter, up 17% from last year,reflecting continued growth inlegacy, IP broadband, Internetand e-commerce services.
• The number of digitalequivalent access lines grewto 3.7 million, reflecting a 4%increase over the secondquarter and 32% growthcompared to Q3 2000.
• Data revenues made up 21%of Bell Canada’s totalrevenues this quarter.
Customer Wins
• In September, Bell Canada,with partners BCE Emergis,CGI and KPMG Consultingannounced that they hadentered into a partnership withthe Ontario government toprovide anywhere access togovernment services. Theconsortium will design, buildand operate electronicconnections, providingconvenient 24-7 access togovernment services, includingvehicle registration andrenewal and address changes.Individuals will be able toaccess the services online, bytelephone and over self-serveterminals.
High Speed Internet subscriber base grows by 96,000
Growth
• Overall, the DSL customerbase grew to 625,000customers, up 18% from lastquarter and over 181% fromQ3 2000. These growth ratesare largely attributable toincreased marketing activityand promotional offers,customer retention initiativesand seasonality.
• DSL net additions totaled96,000 this quarter, of which85,000 related to consumerDSL services, 8,000 businessand 3,000 wholesale.
• Growth rates for Bell Canada’sSympatico High Speed Edition(SHSE) in Ontario and Quebecwere strong, leading to acustomer base of 484,000 atthe end of this quarter. Thisrepresents a quarterly increaseof 79,000 customers, 93%higher than that achieved inQ2.
Self-installation rateimprovement
• Self-installation rates for SHSEaveraged 74% in the quarter,an improvement over the 60-65% range seen at the end ofthe second quarter.
Cost and service improvements
• During the quarter, the USB(universal serial bus) modemwas introduced, simplifyinginstallation and reducing costs.Customers no longer need toinstall an Ethernet card. Theyneed only to plug the modeminto the USB port on their PCand install the software.
• The quarter also saw theintroduction of high densityDSLAM’s (digital subscriberline access multiplexor), whichare smaller and easier toinstall. The new equipmentreduces costs and floor spacerequirements and can beplaced in locations that werepreviously not suitable.
• A new business Internet highspeed service, with downloadspeeds of up to 3Mbps andupload speeds of up to 640kbps, was also introduced.
Data / DSL Growth
756
854810
878 881
650
700
750
800
850
900
($M)
Q300 Q400 Q101 Q201 Q301
Data Revenues
222336
466529
625
0
200
400
600
800
(000's)
Q300 Q400 Q101 Q201 Q301
DSL High Speed Internet Subscribers

BCE Inc. Investor Briefing – Third Quarter 2001 Page 3
Canada’s largest wireless carrier continues to post impressive growth with 151,000 netadditions and maintains its industry leading churn
Growth
• Wireless service revenueswere $490 million, up 21%from the third quarter of 2000,fuelled by strong growth incellular and PCS subscribersand a continued focus onpostpaid activations.
• Of the 151,000 net additionsthis quarter, 68% were onpostpaid rate plans. Totalcellular and PCS subscribersreached 3,186,000 at the endof the third quarter, withpostpaid accounting for 73% ofthe total subscriber base.Including its pagingsubscribers, BCE now servesmore than 3.9 million wirelesscustomers.
• Growth of this magnitude is allthe more impressiveconsidering Bell Mobilitymoved away from offering $0handsets during the quarter.
ARPU
• While ARPU of $49 per monthwas flat compared to thirdquarter 2000, it was $3 higherthan the second quarter,increasing for the secondconsecutive quarter.
• Postpaid ARPU of $62 permonth increased by $1compared to Q3 2000, whileprepaid ARPU remained flatcompared to the same periodlast year, at $14 per month.
Industry Leading Churn
• Postpaid churn for the quarterwas 1.5%, once again leadingthe industry. This marked thesixth consecutive quarter thatchurn has remained below 2%,demonstrating BCE’scontinued commitment tocustomers and networkservice, as well as productinnovation.
• Prepaid churn for the quarterwas 1.4% compared to 2.0% inthe third quarter of 2000.
National Expansion
• In August, Bell Mobilityannounced it had contractedwith Nortel Networks toexpand Bell Mobility’s CDMAdigital PCS network intoAlberta and B.C. This contractrepresents a $180 millioninvestment and will deliver a1xRTT ready network in early2002 to urban centers in theseprovinces.
• In September, Bell Mobilitylaunched services for theconsumer market in Albertaand B.C. At the end of thethird quarter there were 120retail points of presence inAlberta and B.C., including atotal of 13 Bell World locationsand numerous outlets at 5major retailers.
• On October 17th, Bell Mobilityentered into a reciprocalagreement with Telus Mobilitywhich will extend currentroaming and resaleagreements and will enhancethe reach of Bell Mobility’sdigital PCS service acrossrural Alberta and B.C. Thisagreement will enable BellMobility to avoid capitalexpenditures in excess of $500million over the 10 year termof the agreement and to fast-track the delivery of wirelessPCS and 3G applications tonon-urban areas in Alberta andB.C.
Wireless Data
• Bell Mobility mobile browserhits totaled 41 million, up 14%from the second quarter. Datausers grew some 24% over Q22001 to 650,000. Bell Mobilitycontinues to be recognized asan industry leader for serviceinnovation and leads theindustry with the number ofwireless data applications andservices available to itscustomers.
Wireless Growth
22
119
76
144
5856 53
98
48
103
0
50
100
150(000's)
Q300 Q400 Q101 Q202 Q301
Wireless Net Subscriber Additions
Prepaid adds Postpaid adds
4948
44
46
49
40
42
44
46
48
50
$
Q300 Q400 Q101 Q201 Q301
Wireless ARPU

BCE Inc. Investor Briefing – Third Quarter 2001 Page 4
Bell ExpressVu has best third quarter ever, with 83,000 net additions
Growth
• Bell ExpressVu’s stronggrowth continued withrevenues of $117 million forthe quarter, 44% higher thanthe same period last year.
• Bell ExpressVu grew itssubscriber base to 930,000customers, 57% higher thanthe same period last year, andwell on its way to meet its yearend target of 1 millionsubscribers.
• With 83,000 net subscriberactivations, Bell ExpressVuhad its strongest third quarterto date. Net activations were63% higher than the previousquarter and 22% higher thanthe third quarter of 2000.
• Bell ExpressVu continues tobe Canada’s leading satelliteTV provider with an estimatedmarket share of 59%.
Urban customer growth
• Seventy percent of thisquarter’s net additions were inurban areas, primarily servicedby cable companies. Thiscompares to 65% in thesecond quarter of 2001 and57% in the same quarter lastyear. At quarter-end, 55% ofBell ExpressVu’s subscriberbase was located in urbanareas.
New product/serviceintroductions• In August, Bell ExpressVu
launched its Personal VideoRecorder (PVR), and becamethe first in Canada to offer anintegrated digital satellitereceiver capable of recordingup to 30 hours of content on a40-gigabyte PVR hard drive.The enhanced features of themodel now offer customersmore choice and control overprogram viewing.
• In early September, BellExpressVu added over 40 newspecialty channels to itsnational digital programminglineup, for a total of over 275video channels. The specialtychannels cover NHL hockey,NBA basketball, travel, lifestyleand leisure and new kids’programs.
.
• Bell Canada’s plan for 2001included an 8% improvementin productivity that translatedinto $450 million in savings.To date, Bell Canada is ontrack to achieve these savings.These initiatives havepermitted Bell to continueinvesting in new service areassuch as consumer DSLservices and Bell ExpressVuwhile maintaining a healthyEBITDA performance.
• The $335M of savings year todate were achieved through acombination of processefficiencies, supply chainmanagement improvements,management streamlining andvarious other initiatives.
• Process efficiency initiativesincluded improvements in workforce management, callcenters, network provisioningand integrated ordermanagement. Supply chainmanagement improvementsincluded outsourcing and therenegotiation of varioussupplier contracts andimproved inventorymanagement practices.Streamlining of managementoperations occurred in Q1.
DTH Growth
Rural43%
Rural30%
Urban57%
Urban70%Q3 00
Mix of Net Additions
Q3 01
Bell Canada Cost Management
594722
796 847930
0
200
400
600
800
1000
(000's)
Q300 Q400 Q101 Q201 Q301
Bell ExpressVu Subscribers

BCE Inc. Investor Briefing – Third Quarter 2001 Page 5
Maintaining market leadership
• Despite continued softness inthe advertising market,revenues remained relativelystable compared with Q32000, coming in at $246M, 2%lower than last year. A year-over-year decrease in printrevenues, resulting fromcontinuing competition andstrong results in Q3 2000contributed to the third quarterdecline. The acquisition ofCFCF and CKY, along with a50% increase in interactiveadvertising revenues as wellas subscriber revenues helpedpartially offset the negativevariance.
• EBITDA was negative $6million during the quarter,compared to negative $4million in Q3 2000 as a resultof weaker advertising marketscombined with ongoing printcompetition, continuing start-up losses of the interactivebusinesses and higherprogramming costs at CTV.
• Recently, CTV announced arestructuring program,resulting in the elimination ofapproximately 150 positions.Efficiencies will come fromcentralization andreorganization ofadministrative areas such asmarketing, promotion,technical and managementservices.
Television
• In September, the CRTCcleared the way for CTVaffiliates CFCF in Montreal andCKY-TV in Manitoba to joinCTV’s family of TV stationsacross Canada. This willpermit better amortization ofprogramming costs over alarger airtime revenue base.The acquisition of ROBTv wasrecently granted CRTCapproval.
• In September, BellGlobemedia and COGECOannounced the conclusion ofan agreement, subject toregulatory approval, to acquireQuebecor’s 86% interest in TVnetwork TQS. Under theterms of the agreement,COGECO has a 60% stake inthe new business while BellGlobemedia has the remaining40%. COGECO will contributesix of its TV stations, as wellas its 13% interest in TQS fora total consideration valued at$104 million. Bell Globemediawill provide approximately $74million in cash to complete thetransaction. The agreementextends Bell Globemedia’sreach into francophoneQuebec.
• Recently, CTV launched sixnew digital channels which arelargely sports and sciencebased, namely WTSN, ESPNClassic Canada, NHL Network,Animal Planet, DiscoveryCivilization and CTV Travel.
• According to a recentindependent study byNADbank, The Globe and Mailnot only led in readership butalso in quality of reader profilefor advertisers.
Interactive
• During the quarter, BellGlobemedia Interactivecontinued to expand itsleadership position in Canada.Bell Globemedia Interactiveweb sites are the first choicefor Canadian advertisers.
Bell Globemedia
Interactive4%
Interactive6%
Print23%
Print19%
TV73%
TV75%
Q3 00 Q3 01
Revenue Mix

BCE Inc. Investor Briefing – Third Quarter 2001 Page 6
Improved EBITDA despite challenging marketplace
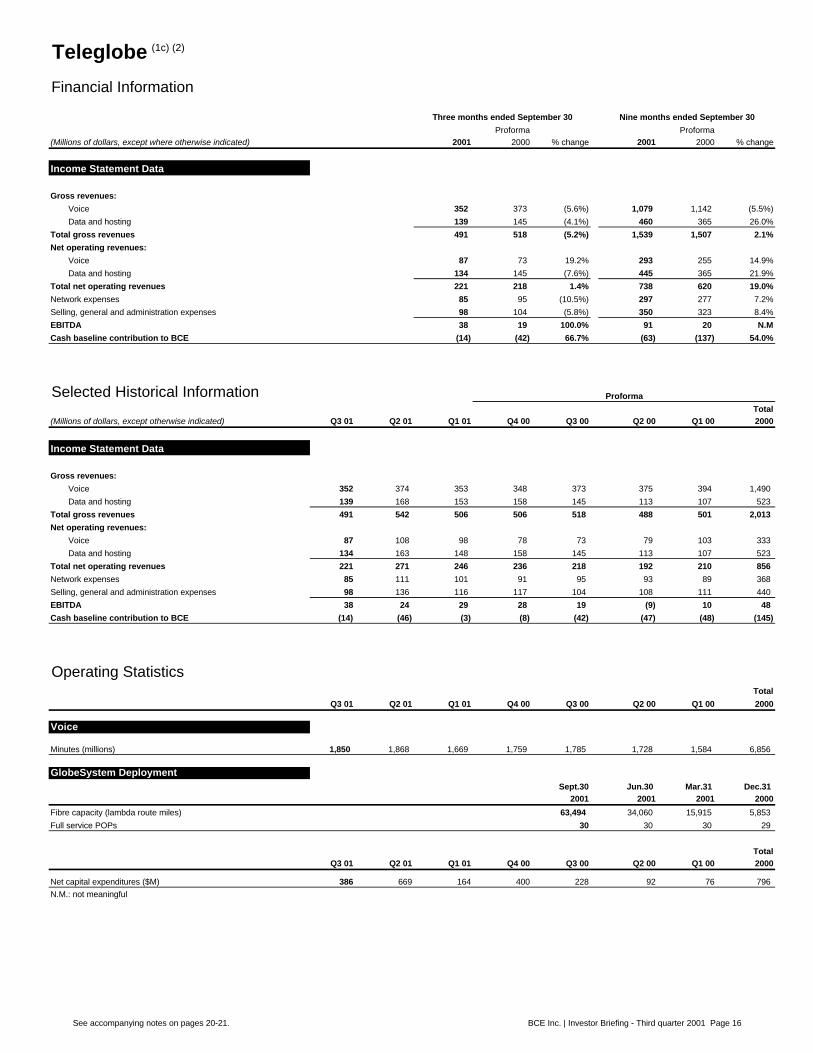
• Total gross revenues were$491 million for the quarter,down 5% from the sameperiod last year and 9% lowerthan Q2 2001. Both voice anddata revenues came in loweras a result of adverse marketconditions.
• Net voice revenues came in at$87 million, 19% better thanthe same quarter last year. Ona quarter over quarter basis,they were down 19%.
• Notwithstanding the softeningin revenues, EBITDA doubledover Q3 2000 to $38 millionand came in 58% higher thanQ2 of this year. Voice marginscontinue to stabilize andsavings were realized duringthe quarter as customersmigrated off of leased facilitiesonto Teleglobe’s own network.
• Given the worldwide slowdownin international connectivity,Teleglobe rationalized selectedbusiness units in order to lowercosts, more effectively utilizefinite resources and betterrespond to customer needs.The restructuring, announcedin August, resulted in theelimination of approximately450 positions, or 20% of theworkforce, and an associatedthird quarter pre-tax charge ofUS$85 million. Annualizedsavings of $US 50 million areanticipated. The restructuringannouncement also included aUS$500 million reduction incapital expenditures for theGlobesystem buildout.
Customer wins
• In August, Teleglobeannounced that it would supplya high-speed Internetconnection to China Unicom, aprivate-sector company thatprovides telecom servicesthroughout China. With thesale, Teleglobe becomes thefirst global network serviceprovider to serve all of China’scommercial internationalInternet Service Providers.
New service introductions
• During the quarter, Teleglobeannounced that it hadincreased the capability toprovide global wirelessroaming services. The newplatform, developed inconjunction with PerformanceTechnologies, translates andconverts signals seamlessly,permitting customers to placeor receive calls wherever theytravel internationally.
GlobeSystem
• The wavelength purchasesannounced last quarter withWilliams, Broadwing andKPNQwest have enabled asignificant expansion inTeleglobe’s network to over 63thousand lambda route milesof fiber capacity this quarter,an 86% increase over theprevious quarter. Thisincrease in network capacityenabled the start of themigration of Teleglobe’scustomers from leasedfacilities to Teleglobe’s ownnetwork which, as notedearlier, contributed to EBITDAimprovements.
Teleglobe
BCE Inc. Investor Briefing – Third Quarter 2001 Page 7
Continued growth in all units drives revenues up 29% and EBITDA up 35% compared to same periodlast year
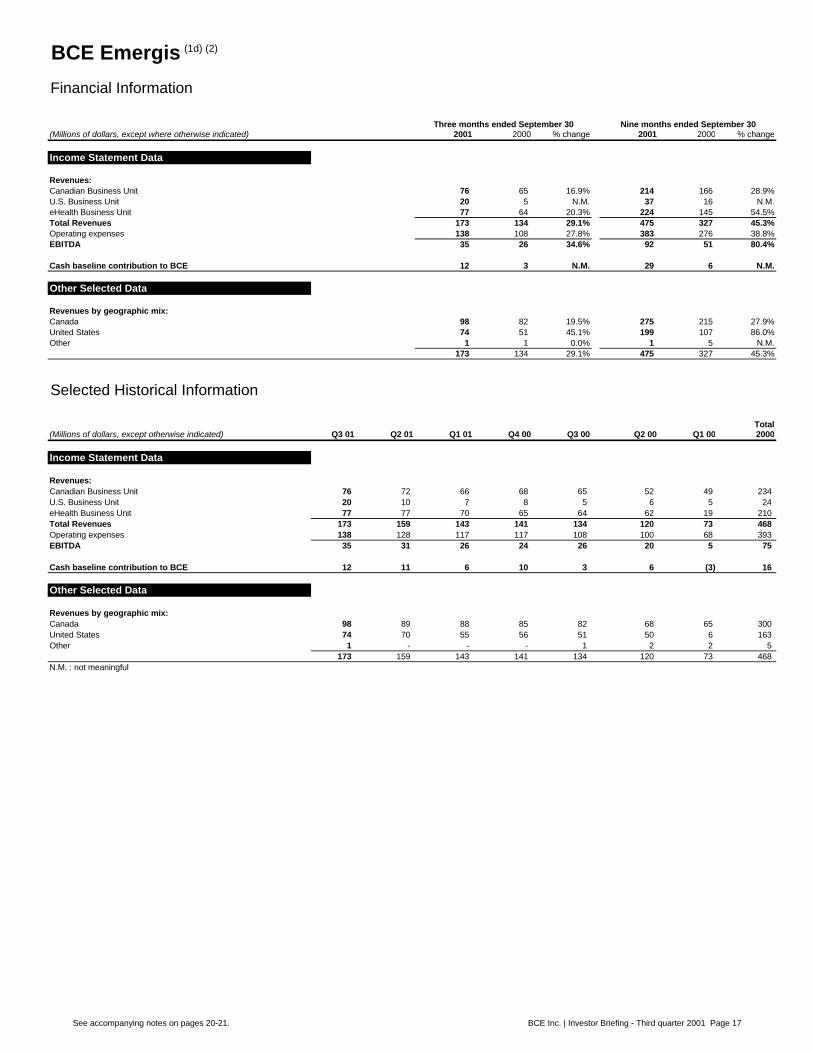
• Revenues for the third quarterof 2001 were $173 million,29% higher than the sameperiod last year, reflectingstrong performance in allbusiness segments. Recurringrevenues continued toincrease this quarter,representing the 40th
consecutive quarter-over-quarter increase.
• EBITDA of $35 million thisquarter was 35% higher thanthe same period last year. AnEBITDA margin of 20% wasachieved in the quarter,continuing the trend ofincreasing quarterly margins.
Canada Life Agreement
• On October 17th, BCE Emergisannounced that Canada LifeAssurance Company hasbecome the second majorinsurance company to join theEmergis e-Claims exchange.
• Canada Life will also be usingthe BCE Emergis e-Premiumssolution which will beintegrated into the exchange.
The Principal
• On October 3rd, BCE Emergisannounced that it hadlaunched a new electronicpremium presentment andmanagement solution for thehealth and life insuranceindustry and has signed thePrincipal Financial Group as itsfirst customer.
BCE Emergis signs three-yeareCommerce Agreements withBell Canada
• On October 11th, BCE Emergisannounced that it hadextended and enhancedprevious agreements with BellCanada for the provision ofadvanced eCommerceservices.
• The agreements with BellCanada relate to the deliveryof eCommerce network-centricservices through the Bellchannel as part of BCE'sconvergence strategy.
• Included in these services aresolutions that will provide thefollowing capabilities: commoninfrastructure application;online web-based customercare; web-based managementof marketing processes; small,medium and large enterpriseweb-based automation ofordering, invoicing andpayment functions; andenablement services tosupport suppliers and buyersfor electronic procurement.
Launch of TSNMAX.ca
• On October 1st, the first in aseries of convergenceproducts was announced -TSNMax.ca. This Internet-based service combinesenriched sports coverage andexclusive reports from TSNand The Globe and Mail withdynamic video, personalizedfeatures, and wireless alerts ofnews and scores.
Convergence Showcase
• On October 16th, BCE held amedia and analyst briefing inToronto showcasing the firstwave of convergence productsto be launched by year-end.
• In addition to TSNMAX.caother consumer focusedconvergence productsshowcased included:• GlobeinvestorGOLD – a
premium subscription-based financial website.
• Gamesmania –subscription-based accessto cutting-edge games
• VoiceNet – voice activatedaccess to web-basedinformation for wirelesscustomers.
• Also displayed were a numberof products developed by Belland BCE Emergis for businesscustomers including:• SmartWeb – allows small
businesses to build theirown website.
• e-CRM – an e-customerrelationship managementtool for medium sizedbusinesses.
• e-Invoicer – B2B electronicinvoice presentment andprocessing for mediumand large businesses.
BCE Emergis
Convergence
9
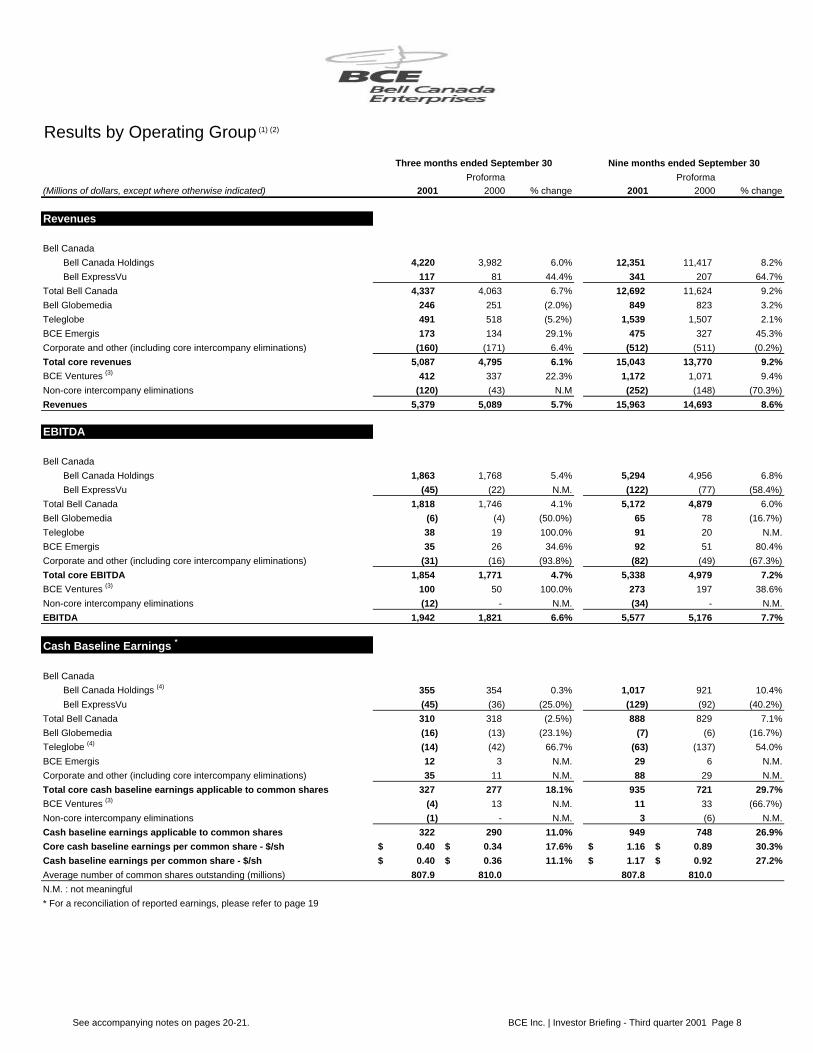
Results by Operating Group (1) (2)
Proforma Proforma(Millions of dollars, except where otherwise indicated) 2001 2000 % change 2001 2000 % change
Revenues
Bell CanadaBell Canada Holdings 4,220 3,982 6.0% 12,351 11,417 8.2%Bell ExpressVu 117 81 44.4% 341 207 64.7%
Total Bell Canada 4,337 4,063 6.7% 12,692 11,624 9.2%Bell Globemedia 246 251 (2.0%) 849 823 3.2%Teleglobe 491 518 (5.2%) 1,539 1,507 2.1%BCE Emergis 173 134 29.1% 475 327 45.3%Corporate and other (including core intercompany eliminations) (160) (171) 6.4% (512) (511) (0.2%)Total core revenues 5,087 4,795 6.1% 15,043 13,770 9.2%BCE Ventures (3) 412 337 22.3% 1,172 1,071 9.4%Non-core intercompany eliminations (120) (43) N.M (252) (148) (70.3%)Revenues 5,379 5,089 5.7% 15,963 14,693 8.6%
EBITDA
Bell CanadaBell Canada Holdings 1,863 1,768 5.4% 5,294 4,956 6.8%Bell ExpressVu (45) (22) N.M. (122) (77) (58.4%)
Total Bell Canada 1,818 1,746 4.1% 5,172 4,879 6.0%Bell Globemedia (6) (4) (50.0%) 65 78 (16.7%)Teleglobe 38 19 100.0% 91 20 N.M.BCE Emergis 35 26 34.6% 92 51 80.4%Corporate and other (including core intercompany eliminations) (31) (16) (93.8%) (82) (49) (67.3%)Total core EBITDA 1,854 1,771 4.7% 5,338 4,979 7.2%BCE Ventures (3) 100 50 100.0% 273 197 38.6%Non-core intercompany eliminations (12) - N.M. (34) - N.M.EBITDA 1,942 1,821 6.6% 5,577 5,176 7.7%
Cash Baseline Earnings *
Bell CanadaBell Canada Holdings (4) 355 354 0.3% 1,017 921 10.4%Bell ExpressVu (45) (36) (25.0%) (129) (92) (40.2%)
Total Bell Canada 310 318 (2.5%) 888 829 7.1%Bell Globemedia (16) (13) (23.1%) (7) (6) (16.7%)Teleglobe (4) (14) (42) 66.7% (63) (137) 54.0%BCE Emergis 12 3 N.M. 29 6 N.M.Corporate and other (including core intercompany eliminations) 35 11 N.M. 88 29 N.M.Total core cash baseline earnings applicable to common shares 327 277 18.1% 935 721 29.7%BCE Ventures (3) (4) 13 N.M. 11 33 (66.7%)Non-core intercompany eliminations (1) - N.M. 3 (6) N.M.Cash baseline earnings applicable to common shares 322 290 11.0% 949 748 26.9%Core cash baseline earnings per common share - $/sh 0.40$ 0.34$ 17.6% 1.16$ 0.89$ 30.3%Cash baseline earnings per common share - $/sh 0.40$ 0.36$ 11.1% 1.17$ 0.92$ 27.2%Average number of common shares outstanding (millions) 807.9 810.0 807.8 810.0N.M. : not meaningful* For a reconciliation of reported earnings, please refer to page 19
Three months ended September 30 Nine months ended September 30
See accompanying notes on pages 20-21. BCE Inc. | Investor Briefing - Third quarter 2001 Page 8
9 3.1 11 40.28 8 8 8
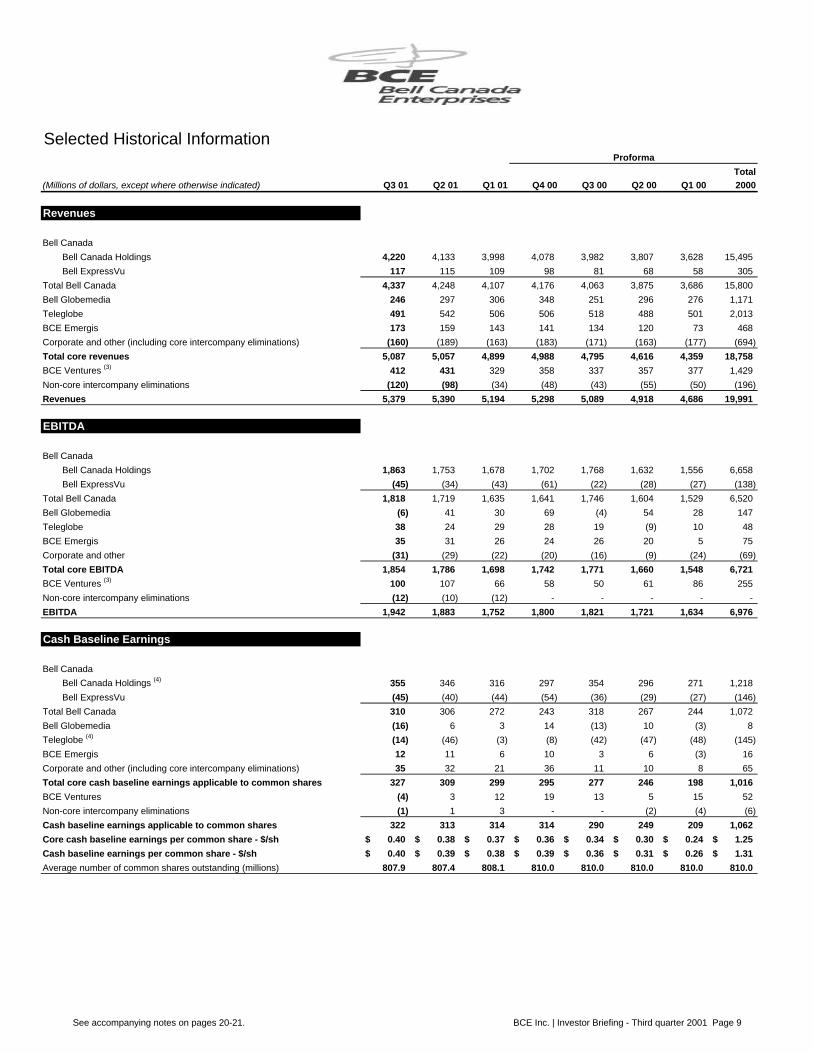
Selected Historical Information
Total(Millions of dollars, except where otherwise indicated) Q3 01 Q2 01 Q1 01 Q4 00 Q3 00 Q2 00 Q1 00 2000
Revenues
Bell Canada
Bell Canada Holdings 4,220 4,133 3,998 4,078 3,982 3,807 3,628 15,495
Bell ExpressVu 117 115 109 98 81 68 58 305
Total Bell Canada 4,337 4,248 4,107 4,176 4,063 3,875 3,686 15,800
Bell Globemedia 246 297 306 348 251 296 276 1,171
Teleglobe 491 542 506 506 518 488 501 2,013
BCE Emergis 173 159 143 141 134 120 73 468
Corporate and other (including core intercompany eliminations) (160) (189) (163) (183) (171) (163) (177) (694)
Total core revenues 5,087 5,057 4,899 4,988 4,795 4,616 4,359 18,758
BCE Ventures (3) 412 431 329 358 337 357 377 1,429
Non-core intercompany eliminations (120) (98) (34) (48) (43) (55) (50) (196)
Revenues 5,379 5,390 5,194 5,298 5,089 4,918 4,686 19,991
EBITDA
Bell Canada
Bell Canada Holdings 1,863 1,753 1,678 1,702 1,768 1,632 1,556 6,658
Bell ExpressVu (45) (34) (43) (61) (22) (28) (27) (138)
Total Bell Canada 1,818 1,719 1,635 1,641 1,746 1,604 1,529 6,520
Bell Globemedia (6) 41 30 69 (4) 54 28 147
Teleglobe 38 24 29 28 19 (9) 10 48
BCE Emergis 35 31 26 24 26 20 5 75
Corporate and other (31) (29) (22) (20) (16) (9) (24) (69)
Total core EBITDA 1,854 1,786 1,698 1,742 1,771 1,660 1,548 6,721
BCE Ventures (3) 100 107 66 58 50 61 86 255
Non-core intercompany eliminations (12) (10) (12) - - - - -
EBITDA 1,942 1,883 1,752 1,800 1,821 1,721 1,634 6,976
Cash Baseline Earnings
Bell Canada
Bell Canada Holdings (4) 355 346 316 297 354 296 271 1,218
Bell ExpressVu (45) (40) (44) (54) (36) (29) (27) (146)
Total Bell Canada 310 306 272 243 318 267 244 1,072
Bell Globemedia (16) 6 3 14 (13) 10 (3) 8
Teleglobe (4) (14) (46) (3) (8) (42) (47) (48) (145)
BCE Emergis 12 11 6 10 3 6 (3) 16
Corporate and other (including core intercompany eliminations) 35 32 21 36 11 10 8 65
Total core cash baseline earnings applicable to common shares 327 309 299 295 277 246 198 1,016
BCE Ventures (4) 3 12 19 13 5 15 52
Non-core intercompany eliminations (1) 1 3 - - (2) (4) (6)
Cash baseline earnings applicable to common shares 322 313 314 314 290 249 209 1,062
Core cash baseline earnings per common share - $/sh 0.40$ 0.38$ 0.37$ 0.36$ 0.34$ 0.30$ 0.24$ 1.25$
Cash baseline earnings per common share - $/sh 0.40$ 0.39$ 0.38$ 0.39$ 0.36$ 0.31$ 0.26$ 1.31$
Average number of common shares outstanding (millions) 807.9 807.4 808.1 810.0 810.0 810.0 810.0 810.0
Proforma
See accompanying notes on pages 20-21. BCE Inc. | Investor Briefing - Third quarter 2001 Page 9

Selected Financial Information
(Millions of dollars, except where otherwise indicated)
Proportionate EBITDA (6)
Number of common * BCE*
shares owned by BCE Ownership % Q3 01 Q2 01 Q1 01 Q4 00 12-Mth Trailing(M) ($M) ($M) ($M) ($M) ($M)
Bell Canada
Bell Canada Holdings 80% 1,285 1,202 1,173 1,191 4,851
Aliant 71.3 45% (5) 116 113 96 95 420
Bell ExpressVu 100% (45) (34) (43) (61) (183)
Total Bell Canada 1,356 1,281 1,226 1,225 5,088
Bell Globemedia 70% (9) 25 18 43 77
Teleglobe 95% 36 23 28 27 114
BCE Emergis 62.0 65% 23 20 17 16 76
BCE Ventures (3)
BCI 58.1 74% 20 21 2 (4) 39
CGI 120.0 33% 21 24 22 15 82
Telesat 100% 48 41 37 43 169
Other 100% 4 13 4 5 26
Total BCE Ventures 93 99 65 59 316
Corporate and other 100% (43) (39) (34) (20) (136)
Total 1,456 1,409 1,320 1,350 5,535
Proportionate Net Debt and Preferreds (6)
Number of common * BCE*
shares owned by BCE Ownership % September 30(M) 2001
Bell Canada
Bell Canada Holdings 80% 12,453
Aliant (5) 71.3 45% (5) 819
ExpressVu 100% 232
Total Bell Canada 13,504
Bell Globemedia 70% 465
Teleglobe 95% 2,497
BCE Emergis 62.0 65% (4)
BCE Ventures
BCI 58.1 74% 1,685
CGI 120.0 33% (1)
Telesat 100% 442
Other 100% 1,353
Total BCE Ventures 3,479
Corporate 100% (3,108)
Total 16,833
Corporate Liquidity and Debt Investments Net of Debt and Preferred Shares Outstanding
September 302001
Cash and cash equivalents 540
Nortel common shares at market 114
Bell Canada Holdings debt due to BCE 4,154
Preferred shares outstanding (7) (1,700)
Total 3,108
Other Information
Nine months ended September 30 2001 2000
Shares outstanding (M) 808.1 644.7
Shares issued (M) 2.7 0.9
Shares purchased for cancellation (M) 4.5 -
Book value ($/sh) 19.80 15.11
*At September 30, 2001
See accompanying notes on pages 20-21. BCE Inc. | Investor Briefing - Third quarter 2001 Page 10

Bell Canada (1a) (4)
9 3 11 42.14 2.14 10 10 10
Financial Information
Proforma Proforma(Millions of dollars, except where otherwise indicated) 2001 2000 % change 2001 2000 % change
Cash Baseline Income Statement
Revenues
Local and access 1,635 1,521 7.5% 4,706 4,476 5.1%
Long distance 663 738 (10.2%) 2,004 2,147 (6.7%)
Wireless 490 406 20.7% 1,346 1,095 22.9%
Data 881 756 16.5% 2,569 2,065 24.4%
Other 551 561 (1.8%) 1,726 1,634 5.6%
Total Bell Canada Holdings (including Aliant) 4,220 3,982 6.0% 12,351 11,417 8.2%
Bell ExpressVu 117 81 44.4% 341 207 64.7%
Total operating revenues 4,337 4,063 6.7% 12,692 11,624 9.2%
Cash operating expenses
Bell Canada Holdings (including Aliant) 2,357 2,214 6.5% 7,057 6,461 9.2%
Bell ExpressVu 162 103 57.3% 463 284 63.0%
Total cash operating expenses 2,519 2,317 8.7% 7,520 6,745 11.5%
EBITDA
Bell Canada Holdings (including Aliant) 1,863 1,768 5.4% 5,294 4,956 6.8%
Bell ExpressVu (45) (22) N.M. (122) (77) (58.4%)
Total EBITDA 1,818 1,746 4.1% 5,172 4,879 6.0%
Depreciation and amortization (715) (699) (2.3%) (2,142) (2,057) (4.1%)
Pension credit 28 29 (3.4%) 97 93 4.3%
Interest payments to third parties (236) (194) (21.6%) (711) (592) (20.1%)
Interest payments to BCE (42) (59) 28.8% (129) (168) 23.2%
Equity income and other (including non-controlling interest) (58) (56) (3.6%) (120) (126) 4.8%
Cash baseline earnings before income taxes 795 767 3.7% 2,167 2,029 6.8%
Income taxes (368) (334) (10.2%) (945) (905) (4.4%)
Cash baseline earnings 427 433 (1.4%) 1,222 1,124 8.7%
Interest on equity settled notes (15) (15) 0.0% (44) (44) 0.0%
Preferred dividends (15) (11) (36.4%) (40) (30) (33.3%)
Cash baseline earnings applicable to common shares 397 407 (2.5%) 1,138 1,050 8.4%
Cash baseline contribution to BCE 310 318 (2.5%) 888 829 7.1%
Net Debt and PreferredsSeptember 30
2001
Cash and cash equivalents (25)
Bell Canada operating level debt (8) 13,891
Debt and equity notes due from Bell (9) (2,768)
Debt and equity notes due to BCE 4,154
Equity notes due to SBC 314
Total Bell Canada Holdings net debt 15,566
Net Debt - Aliant 1,819
Net Debt - Bell ExpressVu 232
Total 17,617
Other Balance Sheet Information September 30
2001
Consolidated common shareholders' equity 6,698
Other Information
For the periods ended September 30 2001 2000 2001 2000
Free cash flow (10) 64 (304) (988) (1,042)
Net capital expenditures 896 871 3,533 2,259
N.M. : not meaningful
Three months Nine months
Three months ended September 30 Nine months ended September 30
See accompanying notes on pages 20-21. BCE Inc. | Investor Briefing - Third quarter 2001 Page 11

Bell Canada (1a) (4)
Selected Historical InformationTotal
(Millions of dollars, except where otherwise indicated) Q3 01 Q2 01 Q1 01 Q4 00 Q3 00 Q2 00 Q1 00 2000
Cash Baseline Income Statement
RevenuesLocal and access 1,635 1,590 1,481 1,543 1,521 1,492 1,463 6,019 Long distance 663 645 696 698 738 694 715 2,845 Wireless 490 447 409 420 406 355 334 1,515 Data 881 878 810 854 756 692 617 2,919 Other 551 573 602 563 561 574 499 2,197 Total Bell Canada Holdings (including Aliant) 4,220 4,133 3,998 4,078 3,982 3,807 3,628 15,495 Bell ExpressVu 117 115 109 98 81 68 58 305 Total operating revenues 4,337 4,248 4,107 4,176 4,063 3,875 3,686 15,800 Cash operating expensesBell Canada Holdings (including Aliant) 2,357 2,380 2,320 2,376 2,214 2,175 2,072 8,837 Bell ExpressVu 162 149 152 159 103 96 85 443 Total cash operating expenses 2,519 2,529 2,472 2,535 2,317 2,271 2,157 9,280 EBITDABell Canada Holdings (including Aliant) 1,863 1,753 1,678 1,702 1,768 1,632 1,556 6,658 Bell ExpressVu (45) (34) (43) (61) (22) (28) (27) (138) Total EBITDA 1,818 1,719 1,635 1,641 1,746 1,604 1,529 6,520 Depreciation and amortization (715) (732) (695) (715) (699) (689) (669) (2,772) Pension credit 28 34 35 19 29 35 29 112 Interest payments to third parties (236) (242) (233) (217) (194) (197) (201) (809) Interest payments to BCE (42) (43) (44) (51) (59) (59) (50) (219) Equity income and other (including non-controlling interest) (58) (27) (35) (37) (56) (54) (16) (163) Cash baseline earnings before income taxes 795 709 663 640 767 640 622 2,669 Income taxes (368) (291) (286) (302) (334) (280) (291) (1,207) Cash baseline earnings 427 418 377 338 433 360 331 1,462 Interest on equity settled notes (15) (15) (14) (15) (15) (14) (15) (59) Preferred dividends (15) (13) (12) (10) (11) (10) (9) (40) Cash baseline earnings applicable to common shares 397 390 351 313 407 336 307 1,363 Cash baseline contribution to BCE 310 306 272 243 318 267 244 1,072
Proforma
See accompanying notes on pages 20-21. BCE Inc. | Investor Briefing - Thrid quarter 2001 Page 12

Bell Canada (1a)
9 3 11 42.14 10 2 10 10 10
Operating Statistics*
2001 2000 % change 2001 2000 % change
Wireline
Network access service (k)
Residential 8,648 8,602 0.5%
Business 4,736 4,726 0.2%
13,384 13,328 0.4%
Estimated Local market share (%) - Bell Canada only
Residential 99.4% 99.6% (0.2%)
Business 90.6% 93.6% (3.2%)
96.1% 97.4% (1.3%)
Long Distance conversation minutes (M) 4,400 4,372 0.6% 13,396 13,264 1.0%
Estimated Long Distance market share (% based on revenues) - Bell Canada only 64.1% 63.5% 0.9%
SmartTouch feature revenues ($M) 226 199 13.6% 658 579 13.6%
Data
Data revenues ($M)
Legacy (11) 546 505 8.1% 1,620 1,444 12.2%
Non-Legacy (12) 335 251 33.5% 949 621 52.8%
881 756 16.5% 2,569 2,065 24.4%
Digital equivalent access lines (13) (k) - Bell Canada only 3,734 2,840 31.5%
Internet subscribers (14) (k)
DSL High Speed Internet subscribers (k) 625 222 N.M.
Dial-up Internet subscribers (k) 1,002 761 31.7%
1,627 983 65.5%
Wireless
Cellular & PCS Net activations (k)
Pre-paid 48 22 N.M. 159 123 29.3%
Post-paid 103 119 (13.4%) 257 252 2.0%
151 141 7.1% 416 375 10.9%
Cellular & PCS subscribers (k)
Pre-paid 876 641 36.7%
Post-paid 2,310 1,909 21.0%
3,186 2,550 24.9%
Wireless ARPU ($/month) 49 49 0.0% 46 46 0.0%
Pre-paid 14 14 0.0% 13 13 0.0%
Post-paid 62 61 1.6% 58 58 0.0%
Post-paid churn (%) (average per month) 1.5% 1.3% 15.4% 1.4% 1.6% (12.5%)
Usage per subscriber (min/month) 184 168 9.5% 179 155 15.5%
Estimated cost of acquisition (15) ($/sub) - Bell Mobility only 395 363 8.8% 387 393 (1.5%)
Browser hits (M) - Bell Mobility only 41 12 N.M. 105 23 N.M.
Paging
Subscribers (k) 733 731 0.3%
ARPU ($/month) 10 11 (9.1%) 10 12 (16.7%)
DTH
Total DTH subscribers (k) 930 594 56.6%
Net subscriber activations (k) 83 68 22.1% 208 177 17.5%
ARPS ($/month) 44 46 (4.3%) 45 46 (2.2%)
Churn (%) (per quarter, year-to-date) 3.3% 3.1% 6.5% 8.9% 10.2% (12.7%)
*Operating statistics are reported on a consolidated basis, except where otherwise noted.
N.M. : not meaningful
Three months ended September 30 Nine months ended September 30
See accompanying notes on pages 20-21. BCE Inc. | Investor Briefing - Third quarter 2001 Page 13

Bell Canada (1a)
Selected Historical Information
Operating Statistics*Total
Q3 01 Q2 01 Q1 01 Q4 00 Q3 00 Q2 00 Q1 00 2000
Wireline
Network access service (k)Residential 8,648 8,576 8,652 8,642 8,602 8,530 8,581Business 4,736 4,721 4,723 4,719 4,726 4,656 4,609
13,384 13,297 13,375 13,361 13,328 13,186 13,190
Estimated Local market share (%) - Bell Canada onlyResidential 99.4% 99.5% 99.6% 99.6% 99.6% 99.6% 99.6%Business 90.6% 90.8% 91.9% 92.8% 93.6% 94.4% 95.5%
96.1% 96.3% 96.8% 97.1% 97.4% 97.7% 98.2%
Long Distance conversation minutes (M) 4,400 4,498 4,498 4,634 4,372 4,464 4,428 17,898 Estimated Long Distance market share (% based on revenues) - Bell Canada only 64.1% 63.2% 61.5% 62.0% 63.5% 62.3% 61.2%
SmartTouch feature revenues ($M) 226 224 208 205 199 192 188 784
Data
Data revenues ($M)Legacy (11) 546 540 534 563 505 481 458 2,007 Non-Legacy (12) 335 338 276 291 251 211 159 912
881 878 810 854 756 692 617 2,919
Digital equivalent access lines (13) (k) - Bell Canada only 3,734 3,599 3,445 3,158 2,840 2,571 2,408
Internet subscribers (14) (k)DSL High Speed Internet subscribers (k) 625 529 466 336 222 141 92 Dial-up Internet subscribers (k) 1,002 968 946 847 761 711 679
1,627 1,497 1,412 1,183 983 852 771
Wireless
Cellular & PCS Net activations (k) Pre-paid 48 53 58 76 22 51 50 199 Post-paid 103 98 56 144 119 134 (1) 396
151 151 114 220 141 185 49 595
Cellular & PCS subscribers (k) Pre-paid 876 828 775 717 641 619 568 Post-paid 2,310 2,207 2,109 2,053 1,909 1,790 1,656
3,186 3,035 2,884 2,770 2,550 2,409 2,224
Wireless ARPU ($/Month) 49 46 44 48 49 45 45 47Pre-paid 14 12 13 14 14 13 13 13Post-paid 62 59 55 60 61 57 55 58
Post-paid churn (%) (average per month) 1.5% 1.4% 1.3% 1.4% 1.3% 1.5% 2.0% 1.5%Usage per subscriber (min/month) 184 190 161 173 168 156 145 Estimated cost of acquisition (15) ($/sub) - Bell Mobility only 395 385 380 375 363 386 451 385
Browser hits (M) - Bell Mobility only 41 36 28 18 12 8 3 41
PagingSubscribers (k) 733 755 759 756 731 723 709 ARPU ($/month) 10 10 11 11 11 12 12 12
DTH
Total DTH subscribers (k) 930 847 796 722 594 526 469 Net subscriber activations (k) 83 51 74 128 68 57 53 306 ARPS ($/month) 44 46 47 48 46 47 46 47 Churn (%) (per quarter, year-to-date) 3.3% 2.9% 2.7% 2.6% 3.1% 3.0% 4.1% 12.9%* Operating statistics are reported on a consolidated basis, except where otherwise noted.
Proforma
See accompanying notes on pages 20-21. BCE Inc. | Investor Briefing - Third quarter 2001 Page 14
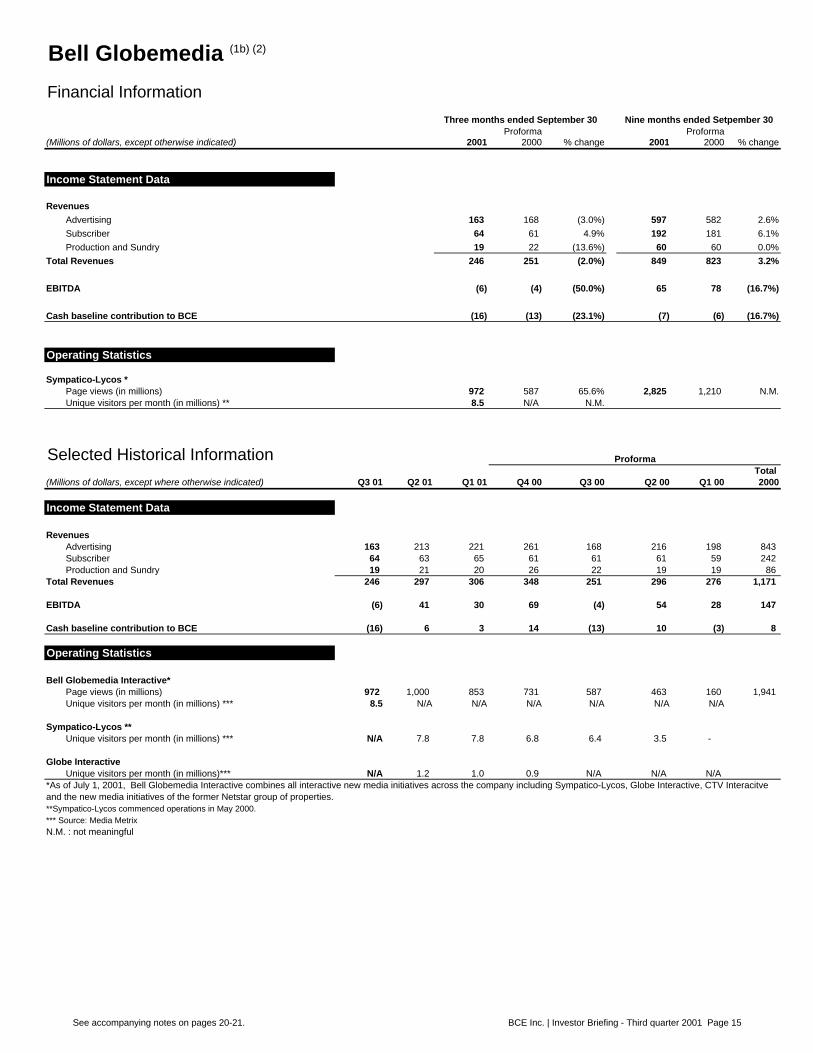
Bell Globemedia (1b) (2)
Financial Information
Proforma Proforma(Millions of dollars, except otherwise indicated) 2001 2000 % change 2001 2000 % change
Income Statement Data
Revenues Advertising 163 168 (3.0%) 597 582 2.6%Subscriber 64 61 4.9% 192 181 6.1%Production and Sundry 19 22 (13.6%) 60 60 0.0%
Total Revenues 246 251 (2.0%) 849 823 3.2%
EBITDA (6) (4) (50.0%) 65 78 (16.7%)
Cash baseline contribution to BCE (16) (13) (23.1%) (7) (6) (16.7%)
Operating Statistics
Sympatico-Lycos *Page views (in millions) 972 587 65.6% 2,825 1,210 N.M.Unique visitors per month (in millions) ** 8.5 N/A N.M.
Selected Historical InformationTotal
(Millions of dollars, except where otherwise indicated) Q3 01 Q2 01 Q1 01 Q4 00 Q3 00 Q2 00 Q1 00 2000
Income Statement Data
RevenuesAdvertising 163 213 221 261 168 216 198 843 Subscriber 64 63 65 61 61 61 59 242 Production and Sundry 19 21 20 26 22 19 19 86
Total Revenues 246 297 306 348 251 296 276 1,171
EBITDA (6) 41 30 69 (4) 54 28 147
Cash baseline contribution to BCE (16) 6 3 14 (13) 10 (3) 8
Operating Statistics
Bell Globemedia Interactive* Page views (in millions) 972 1,000 853 731 587 463 160 1,941 Unique visitors per month (in millions) *** 8.5 N/A N/A N/A N/A N/A N/A
Sympatico-Lycos **Unique visitors per month (in millions) *** N/A 7.8 7.8 6.8 6.4 3.5 -
Globe InteractiveUnique visitors per month (in millions)*** N/A 1.2 1.0 0.9 N/A N/A N/A
*As of July 1, 2001, Bell Globemedia Interactive combines all interactive new media initiatives across the company including Sympatico-Lycos, Globe Interactive, CTV Interacitve and the new media initiatives of the former Netstar group of properties.**Sympatico-Lycos commenced operations in May 2000.*** Source: Media MetrixN.M. : not meaningful
Proforma
Three months ended September 30 Nine months ended Setpember 30
See accompanying notes on pages 20-21. BCE Inc. | Investor Briefing - Third quarter 2001 Page 15
Teleglobe (1c) (2)
9 3 11 42.14 10 10 10 10 10 10
Financial Information
Proforma Proforma(Millions of dollars, except where otherwise indicated) 2001 2000 % change 2001 2000 % change
Income Statement Data
Gross revenues:
Voice 352 373 (5.6%) 1,079 1,142 (5.5%)
Data and hosting 139 145 (4.1%) 460 365 26.0%
Total gross revenues 491 518 (5.2%) 1,539 1,507 2.1%
Net operating revenues:
Voice 87 73 19.2% 293 255 14.9%
Data and hosting 134 145 (7.6%) 445 365 21.9%
Total net operating revenues 221 218 1.4% 738 620 19.0%
Network expenses 85 95 (10.5%) 297 277 7.2%
Selling, general and administration expenses 98 104 (5.8%) 350 323 8.4%
EBITDA 38 19 100.0% 91 20 N.M
Cash baseline contribution to BCE (14) (42) 66.7% (63) (137) 54.0%
Selected Historical InformationTotal
(Millions of dollars, except otherwise indicated) Q3 01 Q2 01 Q1 01 Q4 00 Q3 00 Q2 00 Q1 00 2000
Income Statement Data
Gross revenues:
Voice 352 374 353 348 373 375 394 1,490
Data and hosting 139 168 153 158 145 113 107 523
Total gross revenues 491 542 506 506 518 488 501 2,013
Net operating revenues:
Voice 87 108 98 78 73 79 103 333
Data and hosting 134 163 148 158 145 113 107 523
Total net operating revenues 221 271 246 236 218 192 210 856
Network expenses 85 111 101 91 95 93 89 368
Selling, general and administration expenses 98 136 116 117 104 108 111 440
EBITDA 38 24 29 28 19 (9) 10 48
Cash baseline contribution to BCE (14) (46) (3) (8) (42) (47) (48) (145)
Operating StatisticsTotal
Q3 01 Q2 01 Q1 01 Q4 00 Q3 00 Q2 00 Q1 00 2000
Voice
Minutes (millions) 1,850 1,868 1,669 1,759 1,785 1,728 1,584 6,856
GlobeSystem DeploymentSept.30 Jun.30 Mar.31 Dec.31
2001 2001 2001 2000
Fibre capacity (lambda route miles) 63,494 34,060 15,915 5,853
Full service POPs 30 30 30 29
TotalQ3 01 Q2 01 Q1 01 Q4 00 Q3 00 Q2 00 Q1 00 2000
Net capital expenditures ($M) 386 669 164 400 228 92 76 796 N.M.: not meaningful
Proforma
Three months ended September 30 Nine months ended September 30
See accompanying notes on pages 20-21. BCE Inc. | Investor Briefing - Third quarter 2001 Page 16
BCE Emergis (1d) (2)
Financial Information
(Millions of dollars, except where otherwise indicated) 2001 2000 % change 2001 2000 % change
Income Statement Data
Revenues:Canadian Business Unit 76 65 16.9% 214 166 28.9%U.S. Business Unit 20 5 N.M. 37 16 N.M.eHealth Business Unit 77 64 20.3% 224 145 54.5%Total Revenues 173 134 29.1% 475 327 45.3%Operating expenses 138 108 27.8% 383 276 38.8%EBITDA 35 26 34.6% 92 51 80.4%
Cash baseline contribution to BCE 12 3 N.M. 29 6 N.M.
Other Selected Data
Revenues by geographic mix:Canada 98 82 19.5% 275 215 27.9%United States 74 51 45.1% 199 107 86.0%Other 1 1 0.0% 1 5 N.M.
173 134 29.1% 475 327 45.3%
Selected Historical Information
Total(Millions of dollars, except otherwise indicated) Q3 01 Q2 01 Q1 01 Q4 00 Q3 00 Q2 00 Q1 00 2000
Income Statement Data
Revenues:Canadian Business Unit 76 72 66 68 65 52 49 234 U.S. Business Unit 20 10 7 8 5 6 5 24 eHealth Business Unit 77 77 70 65 64 62 19 210 Total Revenues 173 159 143 141 134 120 73 468 Operating expenses 138 128 117 117 108 100 68 393 EBITDA 35 31 26 24 26 20 5 75
Cash baseline contribution to BCE 12 11 6 10 3 6 (3) 16
Other Selected Data
Revenues by geographic mix:Canada 98 89 88 85 82 68 65 300 United States 74 70 55 56 51 50 6 163 Other 1 - - - 1 2 2 5
173 159 143 141 134 120 73 468 N.M. : not meaningful
Three months ended September 30 Nine months ended September 30
See accompanying notes on pages 20-21. BCE Inc. | Investor Briefing - Third quarter 2001 Page 17

BCE Ventures (1e) (2) (3)
Financial Information
Proforma Proforma(Millions of dollars, except otherwise indicated) 2001 2000 % change 2001 2000 % change
Revenues
BCI 149 104 43.3% 400 340 17.6%CGI 166 138 20.3% 488 454 7.5%Telesat 80 74 8.1% 225 219 2.7%Other 17 21 (19.0%) 59 58 1.7%Total Revenues 412 337 22.3% 1,172 1,071 9.4%
EBITDA
BCI 27 (5) N.M. 59 35 68.6%
CGI 21 13 61.5% 67 50 34.0%
Telesat 48 39 23.1% 126 113 11.5%
Other 4 3 33.3% 21 (1) N.M.
EBITDA 100 50 100.0% 273 197 38.6%
Cash Baseline Contribution to BCE
CGI 8 4 100.0% 27 21 28.6%
Telesat 11 15 (26.7%) 34 32 6.3%
Other (23) (6) N.M. (50) (20) N.M.
Cash Baseline Contribution to BCE (4) 13 N.M. 11 33 (66.7%)
Selected Historical InformationTotal
(Millions of dollars, except where otherwise indicated) Q3 01 Q2 01 Q1 01 Q4 00 Q3 00 Q2 00 Q1 00 2000
Revenues
BCI 149 163 88 112 104 118 118 452 CGI 166 168 154 147 138 147 169 601 Telesat 80 74 71 79 74 73 72 298 Other 17 26 16 20 21 19 18 78 Total Revenues 412 431 329 358 337 357 377 1,429
EBITDA
BCI 27 29 3 (5) (5) 14 26 30 CGI 21 24 22 15 13 13 24 65 Telesat 48 41 37 43 39 37 37 156 Other 4 13 4 5 3 (3) (1) 4 EBITDA 100 107 66 58 50 61 86 255
Cash Baseline Contribution to BCE
CGI 8 8 11 6 4 6 11 27 Telesat 11 7 16 19 15 8 9 51 Other (23) (12) (15) (6) (6) (9) (5) (26) Cash Baseline Contribution to BCE (4) 3 12 19 13 5 15 52
Three months ended September 30 Nine months ended September 30
Proforma
See accompanying notes on pages 20-21 BCE Inc. | Investor Briefing - Third quarter 2001 Page 18

Reconciliation of reported earnings
YTD(Millions of dollars, except where otherwise indicated) Q3 01 Q2 01 Q1 01 2001
Cash baseline earnings to common shares 322 313 314 949 Bell Canada:
Restructuring charge - - (114) (114) Gain on sale of Sympatico-Lycos - - 34 34 Gain on sale of TDL Hong Kong - - 19 19 Goodwill expense (18) (18) (17) (53) Aliant dilution gains and other 6 6 2 14 Impact of Income tax rate adjustments and Other - 2 (1) 1
Bell Globemedia:Goodwill expense (36) (36) (36) (108) Impact of Income tax rate adjustments and Other - (10) - (10)
Teleglobe:Goodwill expense (95) (103) (111) (309) Restructuring and other one-time charge (77) - - (77)
BCE Emergis: - Goodwill expense (82) (89) (76) (247) Write-off of assets and IPR&D (15) 3 (21) (33) Dilution gain 15 - - 15
BCE Ventures:Bell Canada International (289) (83) 151 (221) Dilution gain in CGI 132 - 30 162 Other Ventures - Gain on sale of Vistar - - 21 21 Telesat - Investment write-off (PSN) (3) - - (3) Goodwill expense (6) (6) (7) (19) Excel - discontinued operations (3) - (9) (18) (27) Goodwill impairment (16) - - (2,049) (2,049) Impact of Income tax rate adjustments and Other - 12 - 12
Corporate:Gain on sale of Nortel Networks shares & settlement of related fund contracts - - 2,901 2,901 Teleglobe one-time charge - - (20) (20) Teleglobe one-time charge - Excel related (discontinued operations) - - (40) (40) Impact of Income tax rate adjustments and Other - (13) - (13)
Net cash baseline adjustments (468) (344) 648 (164) Reported earnings applicable to common shares (146) (31) 962 785 Reported earnings per common share - $/sh (0.18)$ (0.04)$ 1.19$ 0.97$ Average number of common shares outstanding (millions) 807.9 807.4 808.1 807.8
See accompanying notes on pages 20-21. BCE Inc. | Investor Briefing - Third quarter 2001 Page 19

BCE Inc. | Investor Briefing – Third Quarter 2001 Page 20
BCE Inc.Accompanying Notes
(1) BCE centers its activities around four core operating businesses: Bell Canada (Canadian connectivity); Bell Globemedia(content), Teleglobe (global connectivity); and BCE Emergis (commerce). All other non-core investments are combined in BCEVentures.
(a) Bell Canada• Bell Canada provides an integrated platform of domestic telecommunications services including voice, data, wireline,
wireless, directory communications and satellite entertainment to Canadian customers.
• This segment reflects the consolidation of :• Bell Canada Holdings (BCH) (80%): BCH results reflect the consolidation of Bell Canada (100%) and its wholly-owned
subsidiaries, mainly, Bell Mobility , BCE Nexxia Inc and Bell ActiMedia Inc. In addition, BCH holds interests in BellIntrigna (33.3%) and Manitoba Telecom Services Inc. (21.7% on a fully diluted basis) which are accounted for using theequity method, and Teleglobe (23%) which is accounted for at cost;
• Aliant (approximately 39% held by Bell Canada and approximately 14% held by BCE Inc.); and• Bell ExpressVu Limited Partnership (100%).
(b) Bell Globemedia (BGM)
• BGM is a Canadian multi-media company in the fields of broadcasting, print and the Internet. BGM provides integratedinformation, communications and entertainment services to Canadian customers and access to distinctive Canadian contentthat allows the creation of unique destinations for Internet users through various portal properties.
• BCE holds a 70.1% interest in BGM and therefore consolidates its results. BGM’s main activities are centered around CTVInc. (100%), Globe and Mail (100%), Globe Interactive (100%) and Sympatico-Lycos (71%).
(c) Teleglobe
• This segment represents Teleglobe Communications group. Teleglobe provides, on a worldwide basis, a broad portfolio ofvoice, data and Internet services including connectivity services, hosting services and content distribution to Internet serviceproviders, Internet content providers, application service providers, carriers and global enterprises.
• BCE holds an effective 95.4% ownership in Teleglobe (approximately 23% held by Bell Canada of which BCE indirectlyowns 80% and approximately 77% held directly by BCE Inc.) and therefore consolidates Teleglobe’s results.
(d) BCE Emergis
• Represents BCE Emergis Inc. BCE Emergis focuses its activities in three business units (Canadian, US and eHealth), offeringa full suite of products to companies in transaction-intensive, eHealth and financial services sectors.
• BCE Emergis Inc. is 65% owned by BCE and financial results are consolidated.
(e) BCE Ventures
• Represents investments in a diverse group of companies which provide services to customers worldwide.
• This segment consolidates BCE’s interests in BCI (73.7%), Telesat Canada (100%), TMI Communications and CompanyLimited Partnership (100%), Bimcor Inc. (100%), BCE Capital Inc. (100%) and TeleReal Inc. (100%), as well as, CGI(32.6%) on a proportionate basis and Look Communications Inc. (25.3%) at cost.
(2) For comparative purposes, financial results for 2000 have been reported on a proforma basis to reflect full year consolidation ofCTV (including Netstar), The Globe and Mail and Globe Interactive in the Bell GlobeMedia segment as well as Teleglobe Inc.The acquisition of Teleglobe Inc. consisted of Teleglobe Communications group (reported in the Teleglobe segment), ExcelCommunications group (see note 3) and Look (reported in the BCE Ventures segment). In 2000, Teleglobe Inc.’s corporateexpenses were reported in the Teleglobe segment.
BCE Inc. | Investor Briefing – Third Quarter 2001 Page 21
BCE Inc.Accompanying Notes (continued)
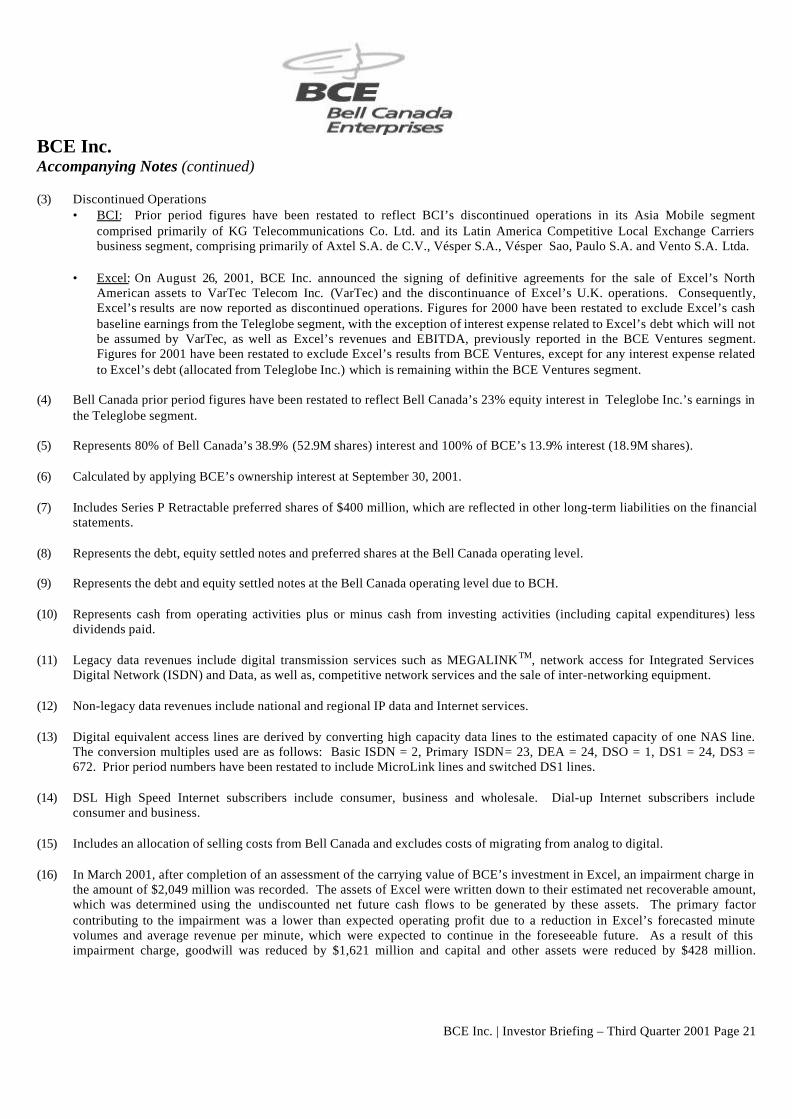
(3) Discontinued Operations• BCI: Prior period figures have been restated to reflect BCI’s discontinued operations in its Asia Mobile segment
comprised primarily of KG Telecommunications Co. Ltd. and its Latin America Competitive Local Exchange Carriersbusiness segment, comprising primarily of Axtel S.A. de C.V., Vésper S.A., Vésper Sao, Paulo S.A. and Vento S.A. Ltda.
• Excel: On August 26, 2001, BCE Inc. announced the signing of definitive agreements for the sale of Excel’s NorthAmerican assets to VarTec Telecom Inc. (VarTec) and the discontinuance of Excel’s U.K. operations. Consequently,Excel’s results are now reported as discontinued operations. Figures for 2000 have been restated to exclude Excel’s cashbaseline earnings from the Teleglobe segment, with the exception of interest expense related to Excel’s debt which will notbe assumed by VarTec, as well as Excel’s revenues and EBITDA, previously reported in the BCE Ventures segment.Figures for 2001 have been restated to exclude Excel’s results from BCE Ventures, except for any interest expense relatedto Excel’s debt (allocated from Teleglobe Inc.) which is remaining within the BCE Ventures segment.
(4) Bell Canada prior period figures have been restated to reflect Bell Canada’s 23% equity interest in Teleglobe Inc.’s earnings inthe Teleglobe segment.
(5) Represents 80% of Bell Canada’s 38.9% (52.9M shares) interest and 100% of BCE’s 13.9% interest (18.9M shares).
(6) Calculated by applying BCE’s ownership interest at September 30, 2001.
(7) Includes Series P Retractable preferred shares of $400 million, which are reflected in other long-term liabilities on the financialstatements.
(8) Represents the debt, equity settled notes and preferred shares at the Bell Canada operating level.
(9) Represents the debt and equity settled notes at the Bell Canada operating level due to BCH.
(10) Represents cash from operating activities plus or minus cash from investing activities (including capital expenditures) lessdividends paid.
(11) Legacy data revenues include digital transmission services such as MEGALINKTM, network access for Integrated ServicesDigital Network (ISDN) and Data, as well as, competitive network services and the sale of inter-networking equipment.
(12) Non-legacy data revenues include national and regional IP data and Internet services.
(13) Digital equivalent access lines are derived by converting high capacity data lines to the estimated capacity of one NAS line.The conversion multiples used are as follows: Basic ISDN = 2, Primary ISDN= 23, DEA = 24, DSO = 1, DS1 = 24, DS3 =672. Prior period numbers have been restated to include MicroLink lines and switched DS1 lines.
(14) DSL High Speed Internet subscribers include consumer, business and wholesale. Dial-up Internet subscribers includeconsumer and business.
(15) Includes an allocation of selling costs from Bell Canada and excludes costs of migrating from analog to digital.
(16) In March 2001, after completion of an assessment of the carrying value of BCE’s investment in Excel, an impairment charge inthe amount of $2,049 million was recorded. The assets of Excel were written down to their estimated net recoverable amount,which was determined using the undiscounted net future cash flows to be generated by these assets. The primary factorcontributing to the impairment was a lower than expected operating profit due to a reduction in Excel’s forecasted minutevolumes and average revenue per minute, which were expected to continue in the foreseeable future. As a result of thisimpairment charge, goodwill was reduced by $1,621 million and capital and other assets were reduced by $428 million.
BCE Inc. | Investor Briefing – Third Quarter 2001 Page 22
BCE Inc.
CAUTIONARY STATEMENT CONCERNING FORWARD-LOOKING STATEMENTS
Certain statements made in this document which describe BCE’s or its subsidiaries' intentions, expectations or predictions, areforward-looking statements and are subject to important risks and uncertainties. The results or events predicted in these statementscould differ materially from actual results or events.
Factors which could cause results or events to differ materially from current expectations include, among otherthings:
− current negative trends in global market and economic conditions which impact the demand for, and costs of, products
and services;
− changes in customer purchasing patterns and, more specifically, the fact that the purchase of certain services provided by
the BCE group of companies is more subject to be adversely affected by economic slowdowns;
− the financial condition and credit risk of customers;
− uncertainties regarding collectibility of receivables;
− uncertainty as to whether BCE’s strategies (including its convergence strategy) will yield the expected benefits, synergies
and growth prospects;
− the intensity of competitive activity and its resulting impact on the ability to retain existing, and attract new, customers
and the consequent impact on pricing strategies, revenues, new product offerings and network capacity;
− the ability to reduce operating costs and achieve productivity improvement goals;
− the level of expenditures necessary to expand operations, increase the number of subscribers, provide new services, build
and update networks and maintain or improve quality of service, and the availability and cost of capital required to fund
such expenditures;
− unanticipated higher capital spending for, or delays in the deployment of, new technologies and initiatives;
− Teleglobe’s GlobeSystem initiative requiring more capital than anticipated to complete, or not being completed on
schedule, or insufficient financing being available to complete GlobeSystem;
− the ability to increase revenues from business segments other than voice services (such as data and Internet services);
− uncertainties related to the transformation of Teleglobe from a voice-driven global carrier to a global data and Internet
provider;
− loss of network capacity or other interruption in service resulting from the failure by key suppliers to continue to provide
to Teleglobe network capacity;
− the uncertainties of the Internet including its impact on network capacity and the Internet economy growing at a slower
pace than is currently anticipated;
− the level of adoption of e-commerce and BCE Emergis’ ability to expand its operations in the United States;
− the impact of rapid technological and market change and the resulting potential technological obsolescence of current
networks and equipment and the ability to deploy new technologies;
− the ability to make acquisitions and/or integrate the operations of acquired businesses in an effective manner;
− the impact of consolidations in the telecommunications and media industries;

BCE Inc. | Investor Briefing – Third Quarter 2001 Page 23
− stock market volatility;
− the availability of, and ability to retain, key personnel;
− the impact of adverse changes in laws or regulations or of adverse regulatory initiatives or proceedings;
− the impact of the CRTC's decision concerning the review of the price caps regime for local services expected early in
2002;
− the final outcome of pending or future litigation; and
− the risk that the transaction for the sale of the North American operations of Excel to VarTec Telecom will not close.
For additional information with respect to certain of these and other factors, please refer to BCE’s reports on Forms 6-K and 40-F filedwith the U.S. Securities and Exchange Commission and BCE’s filings with the Canadian securities commissions. The forward-looking statements contained in this document represent BCE’s expectations as of October 24, 2001 and, accordingly, are subject tochange after such date. However, BCE disclaims any intention or obligation to update or revise any forward-looking statements,whether as a result of new information, future events or otherwise. Furthermore, forward-looking statements contained in thisdocument do not reflect the potential impact of any mergers, acquisitions, other business combinations or divestitures that may beannounced or completed after October 24, 2001.