investor advisory tar sands invasion · before beneath a green sweep of boreal fen and forest in...
TRANSCRIPT
1
Investor AdvisoryAnglo American’s Pebble Mine
Tar Sands Invasion
A report by:
EARTHWORKSTM
EARTHWORKSTM
EARTHWORKSTM
EARTHWORKSTM
How Dirty and Expensive Oil from Canada Threatens America’s New Energy Economy
C O R P O R A T EETHICSI N T E R N AT I O N A L

BeforeBeneath a green sweep of Boreal fen and forest in northern Alberta lies a promise of addiction — tar sands that can be refined into petroleum products like gasoline. This land has already been staked by prospectors.
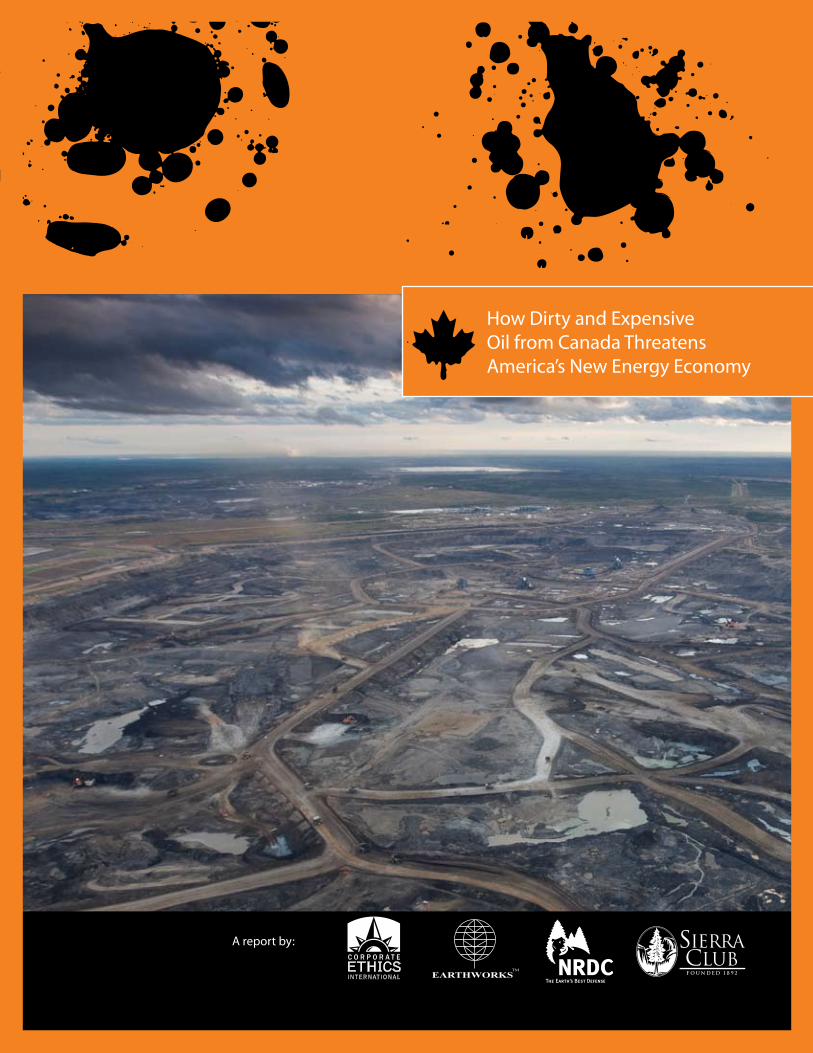
After, on the coverThe Suncor Millennium mine, an open-pit north of Fort McMurray, Alberta. Pristine Boreal Forest can look like this after tar sands extraction.
Photos: Peter Essick/National Geographic
Investor AdvisoryAnglo American’s Pebble Mine
Tar sands InvasionHow Dirty and Expensive Oil from Canada Threatens America’s New Energy Economy
A joint report by:
EARTHWORKSTM
EARTHWORKSTM
EARTHWORKSTM
EARTHWORKSTM
C O R P O R A T EETHICSI N T E R N AT I O N A L
Investor AdvisoryAnglo American’s Pebble Mine
MAy 2010How Dirty and Expensive Oil from Canada Threatens America’s New Energy Economy
Corporate Ethics InternationalEARTHWORKSNatural Resources Defense CouncilSierra Club
AuTHORS:Kenny Bruno, Corporate Ethics InternationalBruce Baizel, EARTHWORKSSusan Casey-Lefkowitz, Natural Resources Defense CouncilElizabeth Shope, Natural Resources Defense CouncilKate Colarulli, Sierra Club
Tar Sands Invasion
A report by:
EARTHWORKSTM
EARTHWORKSTM
EARTHWORKSTM
EARTHWORKSTM
C O R P O R A T EETHICSI N T E R N AT I O N A L
1
2 Tar Sands Invasion
ABOuT CORPORATE ETHICS INTERNATIONAL
CEI is part of the movement for corporate accountability. It works on behalf of foundations to design complex
corporate campaigns. It sponsors the Business Ethics Network, which facilitates collaboration and training for
over 150 organizations engaged in corporate campaigns. CEI also coordinates cross-border, multi-strategy cam-
paigns targeting companies like Wal-Mart and industries like the tar sands. Visit us at www.corpethics.org.
ABOuT EARTHWORKS
EARTHWORKS is a non-profit organization dedicated to protecting communities and the environment from the
destructive impacts of mineral development, in the u.S. and worldwide. EARTHWORKS stands for clean water,
healthy communities and corporate accountability. We’re working for solutions that protect the earth’s resourc-
es and communities. Visit us at www.earthworksaction.org.
ABOuT NATuRAL RESOuRCES DEfENSE COuNCIL
The Natural Resources Defense Council is an international nonprofit environmental organization with more than
1.2 million members and online activists. Since 1970, our lawyers, scientists, and other environmental specialists
have worked to protect the world’s natural resources, public health, and the environment. NRDC has offices in
New york City, Washington, D.C., Los Angeles, San francisco, Chicago, and Beijing. Visit us at www.nrdc.org.
ABOuT SIERRA CLuB
The Sierra Club’s members and supporters are more than 1.3 million of your friends and neighbors. Inspired by
nature, we work together to protect our communities and the planet. The Club is America’s oldest, largest and
most influential grassroots environmental organization. Visit us at www.sierraclub.org.
ACKNOWLEDgEMENTS
The report authors would like to thank the following people for their contributions to and review of the report:
Andrew Logan, CERES, Alan Septoff, EARTHWORKS, Aaron Sanger, forestEthics, Ann Alexander, NRDC, Liz Barratt-
Brown, NRDC, Jon McLaughlin, NRDC, Luke Tonachel, NRDC, Dan Woynillowicz, Pembina Institute, Heather Moyer,
Sierra Club, and Kristina Johnson, Sierra Club.
Report design by Charlene Anderson, www.Creativegeckos.com.
© 2010 EARTHWORKS. This report is available online at www.dirtyoilsands.org. Printed on paper that is 100 per-cent post-consumer recycled fiber, processed chlorine free.
Syncrude tar sands plant at night. Photo: David Dodge/Pembina Institute, www.oilsandswatch.org
2 Tar Sands Invasion

3
CONTENTS
PREfACE: getting Serious About Breaking the Oil Addiction .................................................5
ExECuTIVE SuMMARy ...........................................................................................................................7
CHAPTER 1: The Dirtiest Project on Earth ......................................................................................9
Tar Sands 101 ...................................................................................................................9
CHAPTER 2: Buyer Beware: The Drastic Impacts of Tar Sands on the united States .....15
Pollution from Refining ..............................................................................................17
Threats from Pipelines ................................................................................................17
CHAPTER 3: Expensive Oil and the Myth of Energy Security ................................................21
Seven Reasons Why Tar Sands Cannot Enhance u.S. Energy Security ......21
A Risky Investment ......................................................................................................23
CHAPTER 4: Stopping the Tar Sands Invasion ............................................................................25
Six Solutions to Help Americans Reduce Reliance on Oil ..............................25
CONCLuSION ..........................................................................................................................................29
ENDNOTES ...............................................................................................................................................30
3
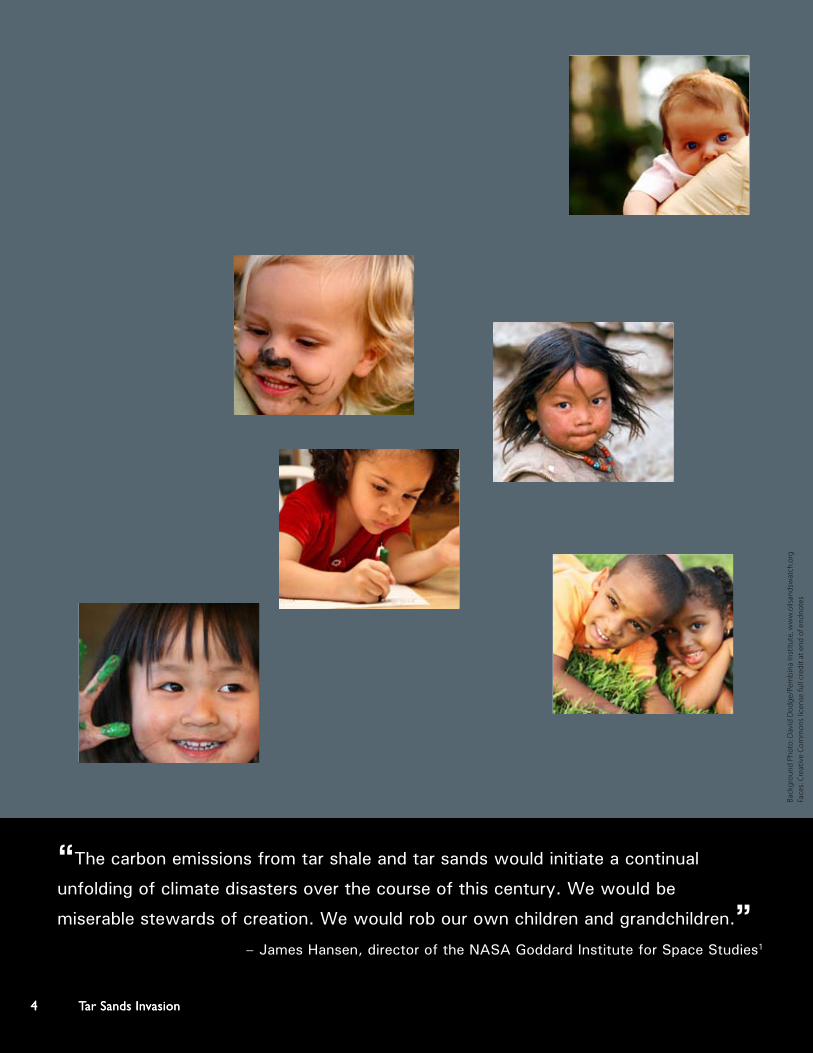
“The carbon emissions from tar shale and tar sands would initiate a continual
unfolding of climate disasters over the course of this century. We would be
miserable stewards of creation. We would rob our own children and grandchildren.”
– James Hansen, director of the NASA Goddard Institute for Space Studies1
Back
grou
nd P
hoto
: Dav
id D
odge
/Pem
bina
Inst
itute
, ww
w.o
ilsan
dsw
atch
.org
Fa
ces:
Crea
tive
Com
mon
s lic
ense
full
cred
it at
end
of e
ndno
tes
4 Tar Sands Invasion4 Tar Sands Invasion
Petroleum is a problem. For the sake of oil profits, human rights are violated, ecosystems de-spoiled, and the planet over-heated. Now, the industry is seeking out ever more remote and high-carbon sources of oil. The largest of those dirty and expensive sources, the bitumen found under the forests of Alberta, Canada, is the subject of this report.
This oil is known traditionally as tar sands – or oil sands (the two terms are synonymous) – and is undergoing a reckless ex-pansion that is arguably the largest and most destructive project on earth.
The good news is that technologies now exist that can transform energy and transportation systems and reduce reliance on oil. It’s already happening. Yet, while North America is on the verge of a cleaner, more energy independent future, the oil industry in Canada is planning to triple exports of dirty and expensive tar sands oil to the United States.
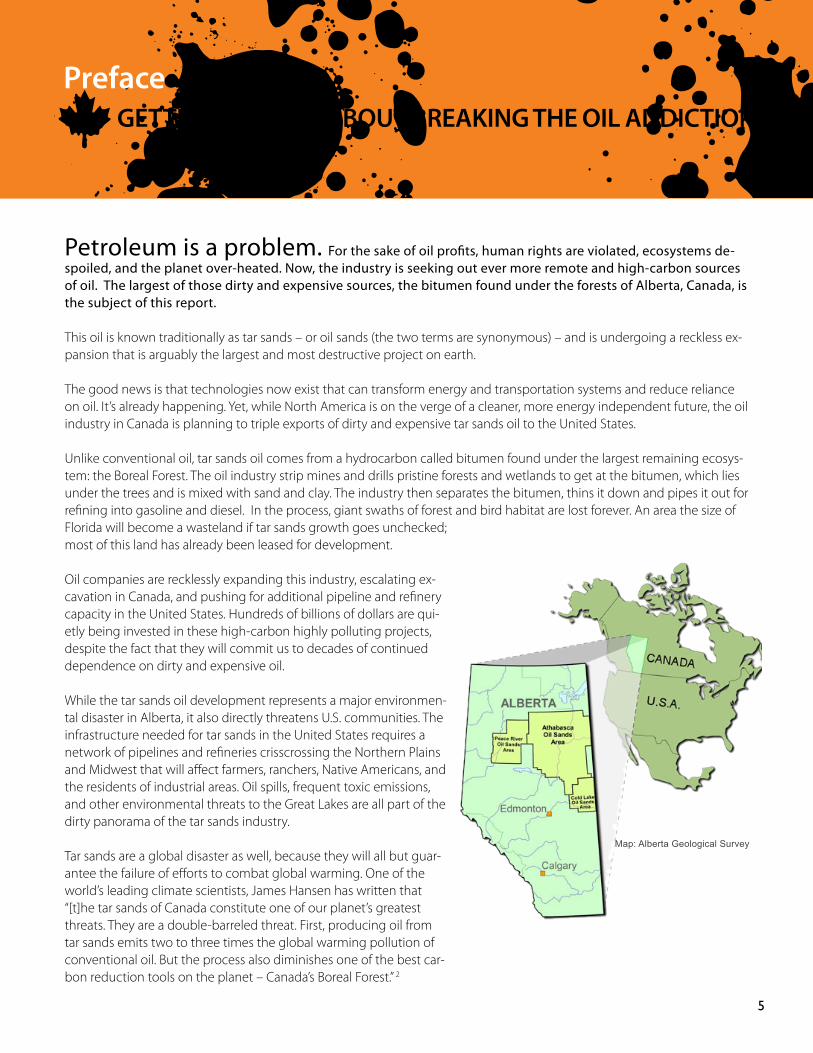
Unlike conventional oil, tar sands oil comes from a hydrocarbon called bitumen found under the largest remaining ecosys-tem: the Boreal Forest. The oil industry strip mines and drills pristine forests and wetlands to get at the bitumen, which lies under the trees and is mixed with sand and clay. The industry then separates the bitumen, thins it down and pipes it out for refining into gasoline and diesel. In the process, giant swaths of forest and bird habitat are lost forever. An area the size of Florida will become a wasteland if tar sands growth goes unchecked; most of this land has already been leased for development.
Oil companies are recklessly expanding this industry, escalating ex-cavation in Canada, and pushing for additional pipeline and refinery capacity in the United States. Hundreds of billions of dollars are qui-etly being invested in these high-carbon highly polluting projects, despite the fact that they will commit us to decades of continued dependence on dirty and expensive oil.
While the tar sands oil development represents a major environmen-tal disaster in Alberta, it also directly threatens U.S. communities. The infrastructure needed for tar sands in the United States requires a network of pipelines and refineries crisscrossing the Northern Plains and Midwest that will affect farmers, ranchers, Native Americans, and the residents of industrial areas. Oil spills, frequent toxic emissions, and other environmental threats to the Great Lakes are all part of the dirty panorama of the tar sands industry.
Tar sands are a global disaster as well, because they will all but guar-antee the failure of efforts to combat global warming. One of the world’s leading climate scientists, James Hansen has written that “[t]he tar sands of Canada constitute one of our planet’s greatest threats. They are a double-barreled threat. First, producing oil from tar sands emits two to three times the global warming pollution of conventional oil. But the process also diminishes one of the best car-bon reduction tools on the planet – Canada’s Boreal Forest.” 2
Preface GettinG SeriouS About breAkinG the oil Addiction
Back
grou
nd P
hoto
: Dav
id D
odge
/Pem
bina
Inst
itute
, ww
w.o
ilsan
dsw
atch
.org
Fa
ces:
Crea
tive
Com
mon
s lic
ense
full
cred
it at
end
of e
ndno
tes
5
Map: Alberta Geological Survey

6 Tar Sands Invasion
Tar sands do not enhance energy security simply because they come from a friendly neighbor. Continued reliance on oil empowers all countries that are major oil exporters, including Saudi Arabia and Iran. The best investments in energy secu-rity are investments in alternatives to oil. Fortunately, the best investments also clean up the local environment, combat global warming, and create home-grown jobs in energy efficiency and renewable energy.
Most major forecasts agree that demand for oil in the United States has peaked and will soon decline. With efficiency mea-sures and cleaner vehicles such as hybrids and fully electric cars, oil use can drop dramatically in the next decade and all of us will be better for it.3 Oil will remain, for some time, a part of the fuel mix, but America does not need an expansion of tar sands oil, especially when the environmental and public health cost is so high. The decline of demand for fossil fuels and the rise of alternative energy has put America on the verge of a tremendously important step toward a new energy economy. Expanding reliance on tar sands oil would represent the proverbial two steps back.
Considering the size and significance of the tar sands project, it is remarkable that most Americans have never heard of it. This report is an introduction to the subject of tar sands and a guide for how to prevent the reckless expansion of a dirty and expensive industry.
Tar sands production consumes and contaminates enormous amounts of fresh water — up to four gallons for every one gallon of crude oil produced. Processing mined tar sands creates toxic waste that is held in ponds so massive they are visible from space. Photo: Garth Lenz, www.garthlenz.com

7
executive Summary tAr SAndS invASion: how dirty And exPenSive oil from cAnAdA threAtenS AmericA’S new enerGy economy
The oil industry is currently planning a massive project to export mil-lions of barrels more per day of dirty tar sands oil from Alberta to the United States. Tar sands mining and drilling in Canada’s Boreal Forest is the largest and most destructive project on earth. The decline of demand for oil and the rise of alternative energy put North America on the verge of a phenomenally important step forward toward a new energy economy. Expanding reliance on tar sands is unnecessary, undermines our progress, and moves us backward instead of forward.
tar Sands are dirty and expensiveCanadian tar sands deposits are found primarily under Alberta’s Boreal Forest and wetlands in an area about the size of Florida.4 In order to access it, millions of acres of pristine forest and wildlife habitat are strip-mined and drilled, destroying sensitive habitat and disrupting critical terrestrial carbon reservoirs in the peatlands of the Boreal Forest. Because it requires large amounts of energy, production of synthetic crude oil from tar sands is estimated to release at least three times the greenhouse gas emissions per barrel as compared to production of conventional crude oil.5
In addition to its high carbon costs, tar sands oil production requires two to five barrels of water for each barrel of bitumen ex-tracted,6 has already created over 50 square miles of toxic waste ponds,7 threatens the health of downstream indigenous com-munities,8 and is likely to cause the loss of millions of migratory birds that nest in the forests and wetlands of the region.9
tar Sands oil has real impacts in AmericaThe United States is the main consumer of tar sands oil. 60% of the 1.34 million barrels of tar sands oil being produced daily in Canada are exported to the United States, and oil companies are aiming to expand production to as much as 3.5 million barrels per day (mbd) by 2025.10
In America, oil and pipeline companies plan to build an exten-sive tar sands pipeline and refinery infrastructure that will lock the United States into reliance on this high-carbon fossil fuel for decades. This investment commitment conflicts with tackling global warming and shifting the U.S. transportation sector to cleaner alternatives. Further, pipelines bring a danger of oil spills to America’s agricultural heartland, while pollution from refiner-ies would threaten local communities and the Great Lakes. All of these environmental consequences are unnecessary because, due to declining demand and improving energy efficiency, the United States does not need tar sands oil.
Security lies in reducing dependence on oilThe best climate security policy is to aggressively implement en-ergy efficiency and other measures that reduce oil dependency. These and other measures stand to reduce U.S. demand for oil by four million barrels per day by 2020 and ten million barrels per day by 2030, which would make expansion of tar sands
Syncrude tar sands mining operation. Photo: David Dodge/Pembina Institute, www.oilsandswatch.org

8 Tar Sands Invasion
unnecessary for U.S. fuel needs.11 Given the climate security risks associated with development of the tar sands and other high-carbon fuels, we should focus on cleaner, low carbon alternatives.
Further, tar sands oil cannot enhance energy security in the United States because it is too expensive and there is not enough of it. Producing tar sands oil will not break the power of OPEC, which controls the world oil market. Tar sands can-not compete in a world of low oil prices; in fact, oil from tar sands is among the most expensive anywhere. Tar sands would not help in the event of an embargo or natural disaster that disrupts supply, because the tar sands industry carries no spare capacity.
Solutions for Stopping the tar Sands invasionThere are serious costs and consequences to the United States in encouraging tar sands oil expansion. Fortunately, there are solutions that policy-makers and business leaders can put in place now.
Stop expansion of tar sands oil production in Canada. �Build no more tar sands pipelines and refineries in the United States. �Continue to reduce demand for oil as a transportation fuel. �Don’t spend taxpayer dollars on buying tar sands oil. �Eliminate tar sands oil subsidies and financing. �Adopt corporate policies that say no to tar sands oil. �
A better way forwardAs the world’s largest oil consumer, the United States has choices about its energy future. America currently consumes a quarter of the world’s oil supply. We can and must do better.
Surely a nation this innovative and motivated can find a way to maintain mobility, while at the same time acting to halt ex-pansion of expensive and dirty fuels such as tar sands oil that cause global warming and so many other environmental and health impacts. The solutions lie in clean, renewable fuel sources, energy efficient technology and smart growth.
Athabasca River near Fort Chipewyan, Alberta Photo: Mark S. Elliot, www.flickr.com/photos/markselliot
The solutions lie in clean, renewable fuel sources, energy efficient technology and smart growth.
99
chapter 1 the dirtieSt Project on eArth
Most Americans think of Canada as clean and wild. So it comes as a shock to learn that what has been called “the most destructive project on earth” originates in the Canadian province of Alberta.12 But why is this project so destructive?
��� It’s huge. The tar sands project is the most costly project on earth. If expansion in the tar sands goes unchecked, it will mean mining and drilling an area the size of Florida.
��� The project is wasteful and inefficient. It consumes and contaminates enormous amounts of fresh water – up to four gallons of water for every gallon of crude oil produced. The extraction process requires moving four tons of earth to produce one barrel of oil.13
��� Tar sands extraction destroys vast swaths of forests and wetlands and the habitat of wildlife such as woodland caribou and millions of migratory birds.
��� Processing mined tar sands creates toxic waste that is held in ponds so massive they are visible from space.��� Tar sands operations harm the health of communities that depend on local waters and wildlife, and violate the legal
rights of Canadian indigenous peoples.��� Producing a barrel of synthetic crude oil from tar sands emits at least three times the global warming pollution as pro-
ducing a barrel of conventional oil, causing the tar sands to be the fastest growing source of global warming pollution in Canada.
��� If we replace just three million barrels per day of conventional oil with tar sands oil, the increase in greenhouse gas emissions would be equivalent to adding more than 20 million new passenger cars to the road.14
��� Expanding the tar sands industry will require building an invasive network of pipelines and refineries that will pollute communities across the United States.
tAr SAndS 101
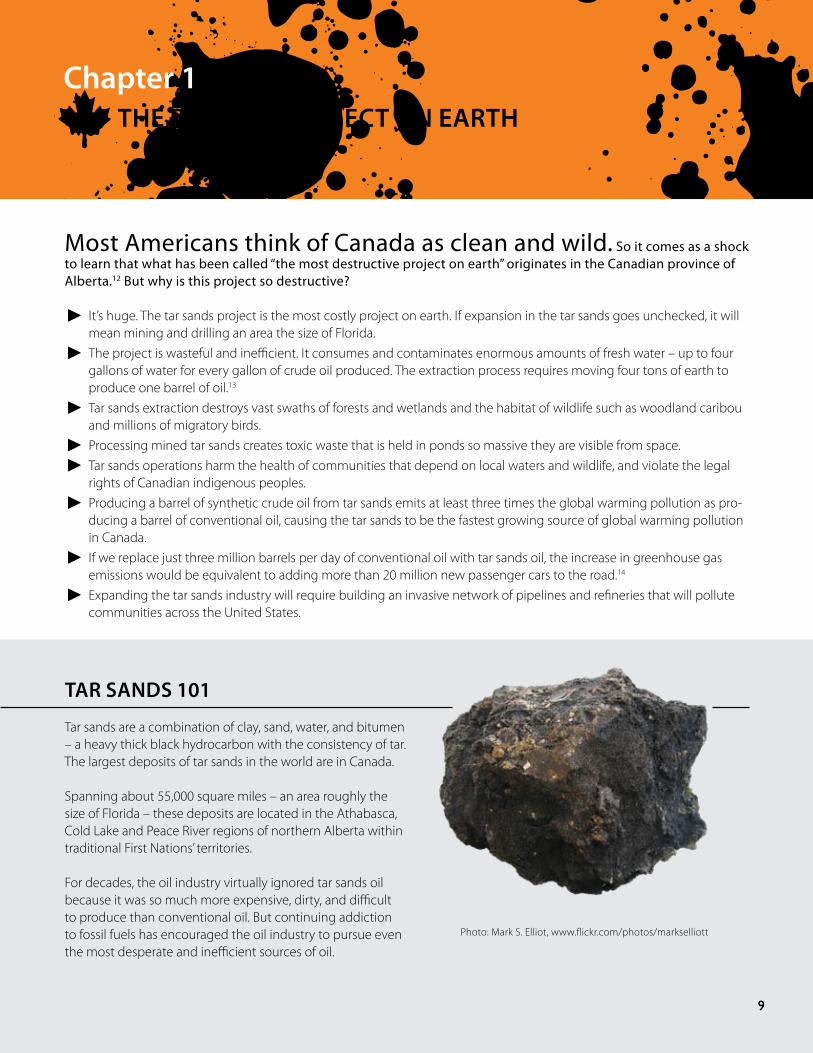
Tar sands are a combination of clay, sand, water, and bitumen – a heavy thick black hydrocarbon with the consistency of tar. The largest deposits of tar sands in the world are in Canada.
Spanning about 55,000 square miles – an area roughly the size of Florida – these deposits are located in the Athabasca, Cold Lake and Peace River regions of northern Alberta within traditional First Nations’ territories.
For decades, the oil industry virtually ignored tar sands oil because it was so much more expensive, dirty, and difficult to produce than conventional oil. But continuing addiction to fossil fuels has encouraged the oil industry to pursue even the most desperate and inefficient sources of oil.
Photo: Mark S. Elliot, www.flickr.com/photos/markselliott

10 Tar Sands Invasion
open Pit miningTar sands oil extraction is a dirty, wasteful, and energy-intensive process. The bitumen in Canadian tar sands can-not be pumped from the ground like conventional oil, but must be mined and melted to be retrieved. Less than 20 percent of the tar sands reserves can be mined this way. At these mines, massive machines literally dig up the earth and load it into trucks the size of houses. Roughly four tons of earth are excavated to produce one barrel of oil at these mines, and even then, only about 75 percent of the bitu-men is recovered. Each massive truck carries up to 320 tons of soil per load to an extraction plant, where a hot water process separates the bitumen from the sand, water, and minerals.15 Then, because bitumen is so thick, it requires either dilution or upgrading before it can be transported by pipeline.
in Situ extractionFor tar sands deposits that are too deep for open pit min-ing – approximately 80 percent of the tar sands reserves in Alberta – the industry uses “in situ” (Latin for “in place”) ex-traction technology. This process involves injecting steam into the ground to melt the bitumen from the sands and pumping the bitumen up to the surface.16 While in situ operations don’t look as destructive as the open pit mines, they actually require even more massive amounts of en-ergy and fragment huge swaths of wildlife and bird habitat.
Bitumen is much heavier than conventional crude oil and contains various contaminants, and therefore cannot be refined into transportation fuels with traditional refining machinery. First, it must undergo a preliminary refining pro-
cess called “upgrading” that transforms the bitumen into “synthetic crude oil” by removing carbon and impurities. This synthetic crude oil, which is more similar to conven-tional crude oil, can then be sent by pipeline to refiner-ies. Increasingly, though, the bitumen is not upgraded in Canada, but is diluted for pipeline transport to refineries in the United States that have been retrofitted with upgrad-ing equipment.
Air and water PollutionTar sands operations release large volumes of pollutants into the air. These emissions include nitrogen oxides, sul-fur dioxide, volatile organic compounds and particulate
tAr SAndS 101
We used to be able to drink water directly from Beaver Lake and it didn’t hurt us. We can no longer do that be-cause of the tar sands developments.”
– Ron Lameman, Beaver Lake Cree Nation
‘‘
In-situ or in-place drilling melts the tar sands too deep for strip-mining by pumping steam underground until the bitu-men softens enough to pump out.Graphic: Pembina Institute
Syncrude tar sands open pit mine. Photo: David Dodge/Pembina Institute, www.oilsandswatch.org

11
matter. These chemicals pollute the air and are known to impact human and wildlife health.17 For example, sulfur di-oxide and nitrogen oxides are major contributors to smog and acid rain.
Tar sands mining requires about four gallons of water for every gallon of crude oil produced. This water comes from the Athabasca River, which flows nearly 930 miles, past tar sands mines, and on to the Peace-Athabasca Delta. This delta is the largest boreal delta in the world, and one of the most important nesting and staging grounds for North American waterfowl.18 As of 2009, the Alberta government had granted permits allowing oil companies to divert 21 billion cubic feet of water each year for their operations, an amount that is about six times what is needed by a city of one million people for one year.19 These water withdrawals threaten the sustainability of fish populations and water-fowl nesting grounds.20
In situ tar sands drilling projects also consume great quan-tities of water, some of which is taken from the Athabasca or other rivers, but most of which is removed from local groundwater aquifers. These projects pump steam under-ground, which condenses to form water that is pumped back to the surface along with the bitumen. While most of this water can be recycled, some remains stranded under-ground, meaning that these projects are continually de-pleting water resources. When shallower freshwater aqui-fers are used, the continuous pumping of water can lower the water table and cause lakes to shrink and wetlands to dry out. When deeper, saltier groundwater is used, the tar
sands operations must remove the salt, resulting in large amounts of waste sludge that has to be taken to landfills or injected underground.
toxic wasteTar sands mining operations produce huge amounts of toxic waste, called “tailings.” This waste consists of water, sand, silt, clay, contaminants and hydrocarbons.21 Contami-nants in the tailings include naphthenic acids, polycyclic aromatic hydrocarbons, phenolic compounds, ammonia, mercury and other trace metals.22
The mix of water and waste in tar sands tailings ponds is acutely toxic to aquatic organisms and mammals.23 Accord-ing to the International Agency for Research on Cancer, the National Toxicology Program and the U.S. Environmental
tAr SAndS 101
Syncrude tar sands tailings pond. Photo: David Dodge/Pembina Institute, www.oilsandswatch.org
indiGenouS PeoPleS cAll for morAtorium
Many leaders of indigenous peoples, known in Canada as First Nations, have denounced the tar sands industry for destroying forests and limiting their abil-ity to hunt and fish in their traditional territories. Residents of Fort Chipewyan, downstream of the largest concentration of tar sands strip mining operations, report that they can no longer drink the water or eat fish from the area, and they suspect pollution from the tar sands is causing elevated rates of a rare form of cancer. The First Nations also report that they were not adequately con-sulted – as required by their constitutional treaty rights – before these mam-moth operations were launched.
First Nations have been fighting back against this injustice. In 2008, the Atha-basca Chipewyan and Mikisew Cree called for a moratorium on tar sands de-velopment. That same year, the Beaver Lake Cree filed suit against Canada and Alberta for violation of their treaty rights relating to severe pollution of their territory. And in March 2010, a coalition of 30 First Nations from British Colum-bia, whose lives and livelihoods would be threatened by a proposed tar sands pipeline to the Pacific coast, declared that “…tankers carrying crude oil from the Alberta Tar Sands will not be allowed to transit our lands and waters.”
Near Fort Chipewyan, Alberta, downstream from the tar sands.Photo: Mark S. Elliot, www.flickr.com/pho-tos/markselliott

12 Tar Sands Invasion
Protection Agency, certain polycyclic aromatic hydrocar-bons have been classified as definite, probable or possible cancer-causing agents in humans. Because of this toxicity, the tailings waste cannot be released directly back into the Athabasca River, and is instead stored behind holding dams.
These toxic tailings ponds cover nearly 50 square miles, and are increasing in volume at the rate of about 80 Olympic-sized swimming pools each day.24 These dumps are an environmental threat because they leak into the ground-water, with estimates suggesting that as much as four bil-lion liters of tailings leak each year.25 The tailings ponds also are a threat to migratory birds. For example, in the spring of 2008, 1,600 migrating ducks were killed when they landed on one of Syncrude’s tailings ponds.26 Independent scien-tists have estimated that the actual number of waterfowl deaths is far higher.27
ecosystem destruction: 32 million AcresThe future ‘footprint’ of the tar sands operations could eventually cover an area nearly the size of Florida – and oil companies have leased more than half of this land already, lands that are held in public trust by the province of Al-berta.
Canada’s Boreal Forest is one of the most important forests in the world. It represents one-quarter of the earth’s remaining intact forests and makes up 11% of the planet’s terrestrial carbon storehouses, not including its tundra and wetlands.28 Because of its key role in carbon storage, Canada’s Boreal region is a life-support system for the planet. But instead of being protected as an irreplaceable resource, it is un-der siege by these tar sands strip-mining and drilling operations in Alberta.
The Boreal Forest is a complex ecosystem of forests, wetlands, and lakes that are home to a wide variety of wildlife such as bears, wolves, lynx, and some of the largest populations of woodland caribou left in the world. Thirty percent of North America’s songbirds and 40% of its waterfowl rely on critical
habitat in the Boreal’s lakes and wetlands.
Nearly 2,000 square miles of this forest, spanning numerous watersheds, could ultimately be strip-mined as a result of tar sands oil development.29 Before strip-mining can begin, the forest must be clear-cut, the wetlands drained, and riv-ers and streams diverted. By 2008, mining operations had already destroyed more than 200 square miles of the Boreal Forest,30 and approved operations would strip-mine an ad-ditional 360 square miles.31
Tar sands sites deemed suitable for in situ drilling span 52,800 square miles – an area nearly 30 times as large as the strip-mineable area. This massive scale of industrial de-velopment could push these forests beyond recovery, lead-ing to irreversible ecological damage and loss. Based on tar sands operations over the past three decades, the United Nations Environment Program has identified Alberta’s tar sands mines as one of the world’s key global “hotspots” of environmental degradation.
While oil companies are obligated by law to reclaim their tar sands operations, the track record to date and the mas-sive extent of environmental degradation make success-ful restoration of the Boreal Forest nearly impossible. Less than one percent of the 200 square miles of land disturbed
by tar sands mining operations thus far has been certified by the government as reclaimed.32 The oil industry has claimed that as much as 33 square miles have been reclaimed, but have not shown that this area has met any reclamation standards or guidelines.33 In addition, the toxic tailings ponds represent an im-mense long-term reclamation challenge for the industry, as no reclamation approach has been proven to successfully manage this toxic waste.
At best, reclamation of the Boreal Forest from tar sands oil produc-
tion will be a large-scale experiment that has little hope of re-creating a self-sustaining ecosystem anytime within the next hundred years.
tAr SAndS 101
‘‘Our ancestors have lived on these lands for thousands of years and the deci-mation of the land, air, water, vegetation in the past 40 years of tar sands mining is the worst any industrialized country has seen ever. Worst case for our people living downstream is the multitude of rare cancers we are living and dying with while the governments continue to give approvals for further development.”
— George J. Poitras, Former Chief of the
Mikisew Cree First Nation
tAr SAndS 101
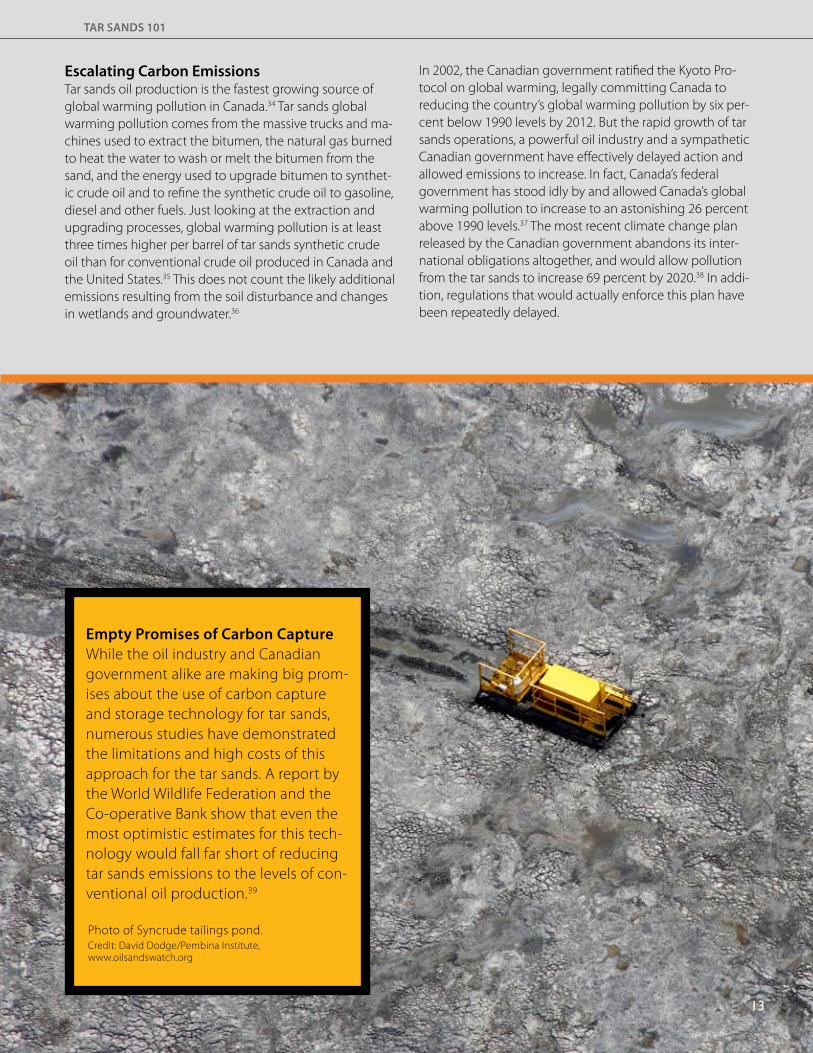
escalating carbon emissions Tar sands oil production is the fastest growing source of global warming pollution in Canada.34 Tar sands global warming pollution comes from the massive trucks and ma-chines used to extract the bitumen, the natural gas burned to heat the water to wash or melt the bitumen from the sand, and the energy used to upgrade bitumen to synthet-ic crude oil and to refine the synthetic crude oil to gasoline, diesel and other fuels. Just looking at the extraction and upgrading processes, global warming pollution is at least three times higher per barrel of tar sands synthetic crude oil than for conventional crude oil produced in Canada and the United States.35 This does not count the likely additional emissions resulting from the soil disturbance and changes in wetlands and groundwater.36
In 2002, the Canadian government ratified the Kyoto Pro-tocol on global warming, legally committing Canada to reducing the country’s global warming pollution by six per-cent below 1990 levels by 2012. But the rapid growth of tar sands operations, a powerful oil industry and a sympathetic Canadian government have effectively delayed action and allowed emissions to increase. In fact, Canada’s federal government has stood idly by and allowed Canada’s global warming pollution to increase to an astonishing 26 percent above 1990 levels.37 The most recent climate change plan released by the Canadian government abandons its inter-national obligations altogether, and would allow pollution from the tar sands to increase 69 percent by 2020.38 In addi-tion, regulations that would actually enforce this plan have been repeatedly delayed.
empty Promises of carbon captureWhile the oil industry and Canadian government alike are making big prom-ises about the use of carbon capture and storage technology for tar sands, numerous studies have demonstrated the limitations and high costs of this approach for the tar sands. A report by the World Wildlife Federation and the Co-operative Bank show that even the most optimistic estimates for this tech-nology would fall far short of reducing tar sands emissions to the levels of con-ventional oil production.39
tAr SAndS 101
Photo of Syncrude tailings pond.Credit: David Dodge/Pembina Institute, www.oilsandswatch.org
13

14 Tar Sands Invasion
In a single incident, 1,600 ducks died after landing in Syncrude tar sands mine tailings waste ponds in 2008. These photos were made public, as was the extent of the deaths (originally report-ed as 500), through the subsequent prosecution of Syncrude. The Boreal Forest and wetlands of this region are critical nesting grounds for millions of songbirds and waterfowl from throughout the Americas.
Duck photos: Todd Powell/Alberta Sustainable Resource Development Tailings pond photo: David Dodge/Pembina Institute, www.oilsandswatch.org
tAr SAndS 101

chapter 2 buyer bewAre
Tar sands oil currently accounts for only about four percent of overall U.S. oil use; however, if industry has its way, that portion is slated to rise to ten or 15 percent. The United States could easily do without tar sands oil, and the proposed rapid expansion of tar sands facilities in the United States threatens com-munities in several ways:
Miles of pipelines would crisscross the Northern Plains, Midwest and South, industrializing rural areas and bringing �noise, traffic and risks of pollution. Dozens of refineries proposed to process dirty tar sands oil will bring toxic emissions and pollute air and water. �Construction of tar sands pipelines and refineries will lock America into a dirty energy infrastructure and encourage the �nation’s addiction to oil. The higher carbon footprint of tar sands oil will lead to an increase in the U.S. transportation sector emissions – a sector �that already accounts for one third of the nation’s global warming pollution.
America desperately needs to break its addiction to oil. Importing tar sands oil from Canada continues dependence on oil and leaves the country vulnerable to skyrocketing fuel costs, national security threats, pollution, and environmental destruction.
15
the drAStic imPActS of tAr SAndS on the united StAteS
The U.S. Increasing Addiction to Tar Sands Oil
Map: Proposed and existing pipelines and refineries that would use tar sands oil. Details: http://ustarsandsmap.nodirtyenergy.org
Alberta Tar SandsThe tar sands represent around half of Canada’s
total oil production.40
Over 99 percent of exported Western Canadian Crude goes to the United States.41
Approximately 10 percent of u.S. crude oil is imported from Canada.42
Tar sands are about four percent of total U.S. oil consumption at 800,000 barrels per day as of 2008.
Alberta’s oil exports – over half of which are from the tar sands – reach the United States through a network of more than 10,000 miles of pipeline.43
The proposed Keystone XL pipeline would bring as much as 900,000 barrels a day to the Gulf Coast.

Producing a barrel of syn-thetic crude oil from tar sands emits at least three times the global warming pollution as producing a barrel of conventional oil, causing the tar sands to be the fastest growing source of global warming pollution in Canada.
Syncrude tar sands processing facility and upgrader. Photo: Bill Reinert
16 Tar Sands Invasion

17
Pollution from refininG
There are approximately 150 oil refineries in the United States, and many of the communities that host them are already subject to high levels of pollution. Tar sands crude, with its higher concentration of pollutants, will simply make this worse.44
Pollutants from refineries include, but are not limited to, air emissions of sulfur dioxide (SO2), nitrogen oxide (NOx), car-bon monoxide (CO), volatile organic compounds (VOCs), particulate matter, and heavy metals, and discharges of ammonia and other chemicals into water systems.
To date, most of the refining of tar sands oil in the United States has been of limited volumes of synthetic crude oil (SCO). Many oil refineries in the Midwest are being ex-panded and retrofitted so they can process both additional SCO and raw bitumen from the tar sands. These retrofits—necessary to deal with this heavy, sour crude—essentially involve adding upgraders to the refinery facilities. Bitumen must be upgraded into SCO, and then SCO is refined into gasoline, diesel, jet fuel, and other petroleum products. Bitumen is very heavy and contains many impurities. ‘Cracking’ the bitumen to make it lighter and removing the contaminants requires large inputs of energy, with carbon dioxide, a key global warming pollutant, being one of the main waste products.
What is so bad about upgrading Canadian tar sands oil? It is “heavy sour” crude that contains more sulfur, nitrogen and metals (including mercury, lead, nickel, and arsenic) than conventional crudes. In fact, bitumen typically con-tains 2.5 percent more sulfur and four times the nitrogen of conventional crude.45 These chemical differences result in increased emissions of such pollutants as SO2, NOx, VOCs, and metals.
All of these pollutants are harmful to human health. Sulfur dioxide, nitrogen oxide, and particulate matter all make
people sick, causing lung and respiratory problems such as bronchitis, asthma, respiratory infections, and decreased lung function. Many metals such as mercury are neuro-toxic; and some volatile organic compounds emitted by refineries are carcinogenic.46 Sulfur dioxide causes acid rain, and volatile organic compounds and nitrogen oxide create smog and haze.
While refineries are supposed to control any significant new pollution generated by their expansions, they often radically underestimate emissions due to faulty and inaccu-rate estimation tools borrowed from completely different industries, or omit emission sources altogether in their per-mit application calculations—especially those that are not directly emitted from smokestacks. Emissions from flaring, coking, venting, and “fugitive” sources such as leaky valves tend to be among the most miscalculated.47
Simply put, refining tar sands oil requires more energy than conventional oil because of the additional upgrading needed. As a result, the refining process emits higher levels of greenhouse gases. Importing tar sands will add to U.S. emissions.
threAtS from PiPelineS: fArmlAnd, communitieS, And wAter At riSk
Pipelines transport approximately 800,000 barrels of tar sands bitumen and synthetic crude to the United States per day, mainly to refineries in the Midwest and Rocky Mountain regions. Operating these pipelines and allowing construction of new and expanded tar sands pipelines will present serious environmental risks to the land and water in these areas. The largest of the proposed new pipelines will run around 2000 miles through the heartland of Amer-ica, in areas populated by farmers, ranchers and Native Americans.48
Along their routes, heated soil and spills caused by the pipelines threaten soil quality and productivity. For
A Sample of U.S. Refineries Taking or Moving to Take Tar Sands
Project Company Location Capacity Status
Wood River Conoco Phillips Wood River, IL 70,000 BPD (expansion) Completed
Whiting Refinery British Petroleum (BP) Whiting, IN 240,000 BPD (expansion) In permitting process
Hyperion Energy Center Hyperion Resources Elk Point, SD 400,000 BPD
(new) In permitting process
Marathon Marathon Detroit, MI 80,000 BPD (expansion) In permitting process
Toledo BP/Husky Toledo, OH 60,000 BPD (expansion) In permitting process

18 Tar Sands Invasion
example, soil temperatures near the TransCanada Keystone pipeline which runs through the Dakotas, Nebraska, Missouri, Kansas and Oklahoma will be elevated by around 2°F from late December through late August, and by as much as 5°F in early March, when the pipeline is running at its full capacity of 591,000 barrels per day. This may cause a decrease in soil moisture content, which would hurt farmers who use their land for pro-duction agriculture.49
Underground pipelines, including the crude oil pipelines currently being proposed and built, are not immune to leaks and spills, and in fact, their leaks would go directly into the soil without having to pen-etrate vegetation and surface lay-ers. Because of the imperfect leak detection mechanism, small leaks can be present for as much as three months and penetrate multiple lay-ers of soil before being detected. Catastrophic leaks or ruptures are detected far more quickly, but even in just a few minutes, can involve thousands of barrels of oil.50 Since 1973, Enbridge, a pipeline company currently building tar sands oil pipe-lines in the United States, has been responsible for over four million gallons of hazardous liquids (primar-ily crude oil) spilled from pipelines; between 2003 and 2008, Enbridge pipeline accidents were responsible for 13 fatalities, 29 injuries and $633
million in property damage.51
These pipelines often run through shal-low aquifers; it is of little help that a pipeline company can detect the leak and shut the pipeline down within the first several hours – the leak will already have infiltrated and contaminated the aquifer. A proposed tar sands oil pipeline called Keystone XL will run through the Ogalalla Aquifer – also known as the High Plains aquifer – in the Great Plains. Ap-proximately 27 percent of the irrigated land in the United States lies above this aquifer system, and 30 percent of the ground water used for irrigation comes from this source. Furthermore, the High Plains aquifer provides drinking water to 82 percent of the people who live within its border.52
Pipeline companies want us to imagine that pipelines sit quietly underground, and that oil flows easily through them from Canada to refineries in the Midwest and other parts of the United States, re-quiring only the help of gravity, and per-haps a small amount of assistance from pumps. The reality is, however, that tar sands pipelines need fossil fuel-consum-ing pumping stations along their length to keep the heavy oil moving through. If tar sands exports to the United States were to increase to three million barrels per day, as some industry experts have predicted, the carbon dioxide emissions from the pipeline transportation alone would be equivalent to the emissions from over one million passenger cars.53
Pipeline Proposals
Pipeline Company Impacted States Capacity BPD Endpoint Status
Keystone TransCanada IL, OK, ND, SD, NE, KS, MO 590,000
Wood River and Pakota, IL; Cushing OK
Nearing Completion
Alberta Clipper Enbridge ND, MN, WI 800,000 Superior, WI Nearing Completion
Keystone XL TransCanada MT, SD, NE, KS, OK, TX 900,000 Nederland, TX In Permitting
Process
Northern Gateway Enbridge BC, Alberta 525,000 Kitimat, BC In Permitting Process
BPD = barrels per day
In April 2010, an Enbridge tar sands pipeline spilled crude oil into wetlands of north-central Minnesota. The white material is oil-absorbing padding.Photo: Marty Cobenais/Indigenous Environmental Network
The Keystone tar sands pipeline being laid across a landowners property. The earthen berm, intended to limit water along the pipeline path, is drowning the property owner’s crops. Photo: Tim Hofer/Dakota Rural Action

19
The big oil companies stand to make millions of dollars with the sludge that they’re going to put through the pipe, and yet they won’t even set up a fund for clean-ing up spills. South Dakotans historically are reasonable, me-thodical people, not easily swayed and misled by the smoke and mirrors of snake oil salesmen and the like. Yet we have this project [a tar sands pipeline] which is be-ing pushed through our beautiful state with little or no questions by those who are charged with the responsibility to protect this state and the people who live here.”
– Kent Moeckly, a South Dakotan landowner along
the Keystone pipeline route.
‘‘
A proposed tar sands oil pipeline called Keystone XL will run through the Ogalalla Aquifer – also known as the High Plains aquifer – in the Great Plains. Approximately 27 percent of the irrigated land in the United States lies above this aquifer system, and 30 percent of the ground water used for irrigation comes from this source.
Montana and South Dakota land-owners along the proposed Key-stone XL tar sands pipeline visiting North Dakota landowners affected by the Keystone I pipeline. “My land, liability, water, and my liveli-hood are at stake,” said Sandy Bar-nick, at left.Photo: Western Organization of Resource Councils

Climate Security and Energy Security Must Go Hand in Hand
…we cannot pursue energy independence by taking steps that would con-tradict our emerging climate policy. Energy security and a sound response to climate change cannot be achieved by pursuing more fossil fuels. Our nation requires diversification of energy sources and a serious commitment to renewable energy. Not simply for environmental reasons – for national security reasons.”
– Vice Admiral Dennis McGinn, Testimony to Senate Foreign Relations Committee, Hearing on “Climate Change and Global Security: Challenges,
Threats, and Global Opportunities.” Washington, DC. July 21, 2009
‘‘
20 Tar Sands Invasion
Hurricane Katrina was a sign of the terrible insecurity climate change can cause. Tar sands oil exacerbates climate change and the severe storms associated with it. Yet tar sands cannot provide oil supply in case of disruption such as that caused by Katrina, be-cause the industry carries no spare production capacity.Photo: Robert M. Reed/U.S. Coast Guard, Petty Officer 3rd Class
21
chapter 3 exPenSive oil And the myth of enerGy Security
Canadian officials and oil executives claim that tar sands oil is a boon to U.S. energy security because it comes from a neighboring country friendly to the United States.
Scratching the surface of this claim reveals that, in reality, tar sands oil cannot substantially enhance energy security be-cause it is too expensive and there isn’t enough of it. In fact, tar sands oil presents a risk to American energy security be-cause it perpetuates oil addiction and requires resources that could be devoted to new, clean energy projects that would create jobs.
Seven reASonS why tAr SAndS cAn-not enhAnce u.S. enerGy Security
tar sands cannot break the power of oPec. 1. The oil cartel, the Organization of the Petroleum Ex-porting Countries (OPEC), controls the world market for oil, and this will remain true with or without tar sands. The International Energy Agency forecasts show that OPEC’s share of the market is set to increase with or without tar sands growth.54 Even if the United States were to greatly increase its consumption of tar sands oil, it would not change the dynamic of the market or challenge OPEC control.
tar sands are expensive. 2. Oil from tar sands is among the most expensive on earth because it re-quires enormous amounts of energy to extract and extra processes to refine. Tar sands oil is only profitable when gas prices are high. In fact, the industry cannot be profitable in a world of low or volatile prices. If you are putting tar sands in your tank, it’s because gas prices are high. We cannot drill or mine our way to low gas prices because oil prices are set on the world market. If the United States produces more, OPEC, which controls more than 75% of world’s proved oil reserves and 44% of global production, will simply decrease its output commensurately.55 The total oil supply will remain es-sentially the same and the price of fuel will continue to increase unless we get off oil. Tar sands oil represents a tiny drop in the bucket on the world oil market, and is not worth the costs to for-ests, water, and human health.
tar sands cannot help if there is an embargo, 3. climate event or armed conflict that disrupts oil shipments. Because of huge infrastructure and capital investments, it takes years for tar sands projects to come on-line and the industry carries no spare ca-pacity. During the so-called tar sands boom between 2003 and 2008, tar sands producers spent five years and $50 billion raising tar sands production a mere 350,000 barrels a day.56 By comparison, Hurricane Ka-trina knocked out 367,000 barrels a day of production in a single day.57
tar sands are not needed for rising u.S. oil 4. consumption, because (good news!) u.S. oil consumption is not rising. There is a myth that U.S. oil demand will rise for decades, but the good news is that oil consumption is expected to decline. All major forecasts now agree that U.S. oil demand has peaked and will level off under existing regulations aimed at tackling oil consumption.58 Moreover, many forecasts have yet to take into account the full transfor-mational potential of hybrids, electric cars, and other efficiency measures such as smart growth planning that could vastly reduce U.S. oil consumption.59 With policies that encourage this reduction, there will be no need for tar sands oil, and much of the predicted rise in tar sands production will not materialize.
tar Sands impede the transition to cleaner 5. technologies. Occasionally, one hears the argu-ment that while tar sands are dirty, our clean energy future is still years away, and we need this oil in the meantime. This argument has several flaws. First, ex-acerbating oil addiction cannot logically be the way toward breaking that addiction. Second, tar sands infrastructure projects last 30 years or more. That’s a long bridge. Third, investing billions in tar sands infra-structure puts cleaner technologies at a disadvantage for decades to come as investors must recoup the enormous sunk costs of that infrastructure. Efficiency can save more oil than tar sands can provide. Efficiency is the solution to our oil addiction.
tar Sands projects in the united States will 6. not hinder chinese access. Some Canadian com-mentators have threatened that if the United States does not buy tar sands oil, then Canada will sell to Chi-na. This is an empty threat as there is no current way to get tar sands oil to China. The proposed Gateway pipeline which would take tar sands from Alberta to the west coast of Canada is not certain. Such a pipeline would have to cross dozens of First Nation territories, defy a de facto tanker ban, and overcome the deter-mined resistance of activists in British Columbia and across Canada.
Further, the industry wants “both/and,” not “either/or” and intends to meet both markets with its growth plans. In addition, it is possible that the Keystone XL pipeline may be used to deliver tar sands oil to the international shipping ports on the Gulf Coast as op-posed to serving the U.S. market. However, with global demand for oil flattening, it is far from clear that the market will support tar sands growth at this level.60 U.S. abstinence from tar sands oil will retard the industry’s growth. A reduction in U.S. oil demand allows other countries to meet demand without resorting to tar sands oil.
tar Sands do not prevent the dynamic of 7. “peak oil.” Tar sands growth – even reckless and rapid growth – cannot keep pace with future declines in conventional oil production. The good news is that through transformational technologies such as the electric car, we can make “peak demand” drive lower prices, instead of “peak supply” driving higher ones.
‘‘‘‘
Fear is the Oil Industry’s FriendTar sands proponents who market the myth of energy security are hoping that U.S. policy makers will be frightened into accepting tar sands growth. However, expanding reliance on tar sands oil, as with any oil, perpetuates American strategic and economic vulnerability. The best investments in energy security are those that reduce oil demand and dependence.
Reliance on fossil fuels harms national security: “ U.S. dependence on fossil
fuels undermines economic stability, which is critical to national security.”
—Center for Naval Analysis Military Advisory Board (Powering America’s Defense, 2009)
We must free ourselves from oil: “ Our dependence on oil – not just foreign oil – reduces our leverage internationally and sometimes limits our options. I say all oil, because we simply do not have enough resources in this country to free us from the stranglehold of those who do. We find ourselves entangled with unfriendly rulers and undemocratic nations simply because we need their oil. And we cannot produce enough oil to change this dynam-ic – we have to wean ourselves from it.”
—Vice Admiral Dennis McGinn, Testimony to Senate Foreign Relations Committee
22 Tar Sands Invasion

23
A riSky inveStment
The financial attractiveness of tar sands projects depend on several increasingly tenuous assumptions: that high oil prices will be sus-tained over the very long life of the projects; that social and envi-ronmental costs will be minimal and not lead to costly delays; that breakthrough, transformational technologies will be achieved at an affordable price (e.g., carbon capture and sequestration); and that the projects will maintain their continued social license to operate.
As the most expensive source of oil in the world, the tar sands are uniquely vulnerable to low oil prices. Before the price of oil plunged in 2008, the tar sands were the world’s largest industrial project. Companies had planned to spend as much as $125 billion to expand operations toward the goal of tripling oil production over the next 10 to 15 years. Between oil’s price drop in July 2008 and June 2009, 85% of deferred or cancelled non-OPEC production capacity was located in the tar sands. Overall spending was cut in half during this period, which Canada’s federal Environment Minister Jim Prentice dubbed a “de facto moratorium.”
There is only a small price window at which tar sands projects are recognized to be economically viable. Financial analysts and indus-try players including Goldman Sachs and Total have said that tar sands projects require long-term prices in excess of $80/barrel to break even. Given the long capital horizons involved in the tar sands, oil prices need to remain consistently high for decades in order for projects to earn a return. Deutsche Bank and BP, among others, have raised doubts recently about the long-term oil demand and have pre-dicted that global demand will peak in the next 10-20 years.
Some in the oil and gas industry are already beginning to acknowl-edge the risks associated with the tar sands and shift capital toward shorter term, less carbon-intensive opportunities. Relative to tar sands, these new opportunities have low costs and fast payback ho-rizons. Shell Oil has significantly scaled back its tar sands plans, and Nexen has said that it is waiting for carbon-price certainty before ex-panding its tar sands exposure. _____________
Ceres 2010. Sources include: Goldman Sachs, Canadian Oil Sands Fieldtrip, 2009; International Energy Agency, Medium-Term Oil Market Report, 2009; Innovest, The Viability of Non-Conventional Oil Development, 2009; NRDC, Driving It Home: Choosing the Right Path for Fueling North America’s Transportation Future, 2007; and Deutsche Bank, The Peak Oil Market: Price Dynamics at the End of the Oil Age, 2009.
The most expensive source of oil in the world...
Goldman Sachs and Total
have said that tar sands
projects require long-
term prices in excess of
$80/barrel to break even.
Syncrude Oil Sands Plant
Photo: David Dodge, Pembina Institute, www.oilsandswatch.org
01 02 03 04 05 06 07 08 09 10 11 12 13 14 15 16 17 18 19 20 21 22 23 24 25 26 27 28 29 30 31 32 33 34 35
Syncrude tar sands plant and mining operations Photos: David Dodge/Pembina Institute, www.oilsandswatch.org

24 Tar Sands Invasion
Wind turbines in southern California.Photo: Charlene Anderson, www.creativegeckos.com

25
At a time when the country is embracing a new, clean energy economy, it doesn’t make sense to suggest that America now needs a dirtier, more expensive source of oil – a source that we have made do without for years. It is in the U.S. national interest to stop the expansion of Canada’s tar sands oil de-velopment as part of efforts to fight global warming through reducing the emissions of the transportation sector. Working together, the government, citizens and private sector can stop the progression of this massive dirty oil project and help keep America on its clean energy path.
There are a number of policy solutions that can help Canada to clean up existing tar sands operations and stop the indus-try’s reckless expansion. Policies and incentives for clean fuels and healthy transportation solutions will reduce U.S. demand for tar sands oil. Although the consequences of destroying the Boreal Forest, one of the world’s largest carbon storehouses, are felt by everyone, currently the oil industry is not being held accountable for its actions. They are passing the costs of their mining operations on to our children and our children’s children. Policies and decisions that make tar sands oil compa-nies bear the full weight of their environmental impacts will provide incentives to clean up the tar sands oil operations.
Furthermore, a federal government decision that the United States does not need yet another tar sands pipeline slicing through America’s agricultural heartland would show that tar sands oil is not the path that Americans choose. Companies that pur-chase fuel for their transportation needs are already starting to say no to tar sands oil. The following solutions can help America reach its goal of reducing its reliance on oil, including the much dirtier and more expensive oil from the Canadian tar sands.
Six SolutionS to helP AmericAnS reduce reliAnce on oil, includinG cAnAdiAn tAr SAndS
chapter 4 StoPPinG the tAr SAndS invASion
Solution 1: Stop expansion of tar sands oil production in canada. The United States should send a clear message to the oil industry and the Canadian government that the environ-mental and public health cost of tar sands oil production is too high. Existing tar sands oil operations need to be cleaned up, and the oil companies need to bear the full costs of this work. Expansion of tar sands oil production is not environmentally healthy and not economically neces-sary at a time when we are building a clean energy econo-my in the United States and Canada.
Solution 2: build no more tar sands pipelines and refineries in the united States.The United States should not lock itself into an expensive and polluting pipeline and refinery infrastructure. Such an infrastructure will make it even harder to reduce depen-dence on oil in the long-term.
The United States should not permit tar sands pipe- �lines that would bring even more tar sands oil from Alberta to the United States.The United States should conduct a comprehensive re- �view of whether this expansion of tar sands oil imports into the United States is consistent with the nation’s commitments to curb climate change and to build a clean energy economy. State and federal government permits for these refin- �eries should be held to the highest standard for water, air and greenhouse gas pollution.
John
Kno
x
State and federal governments should not provide fi- �nancial subsidies for tar sands oil refinery construction.Companies and governments as purchasers of fuel �should not support expansion of existing upgrading/refining operations in the United States and should oppose construction of new refineries for tar sands oil, such as the proposed new Hyperion refinery in South Dakota. The United States should not allow the proposed �Alaska natural gas pipeline, meant to bring natural gas to the United States, to be diverted to fuel tar sands extraction in Alberta. Using this natural gas to fuel tar sands oil production would result in increasing rather than decreasing global warming emissions.
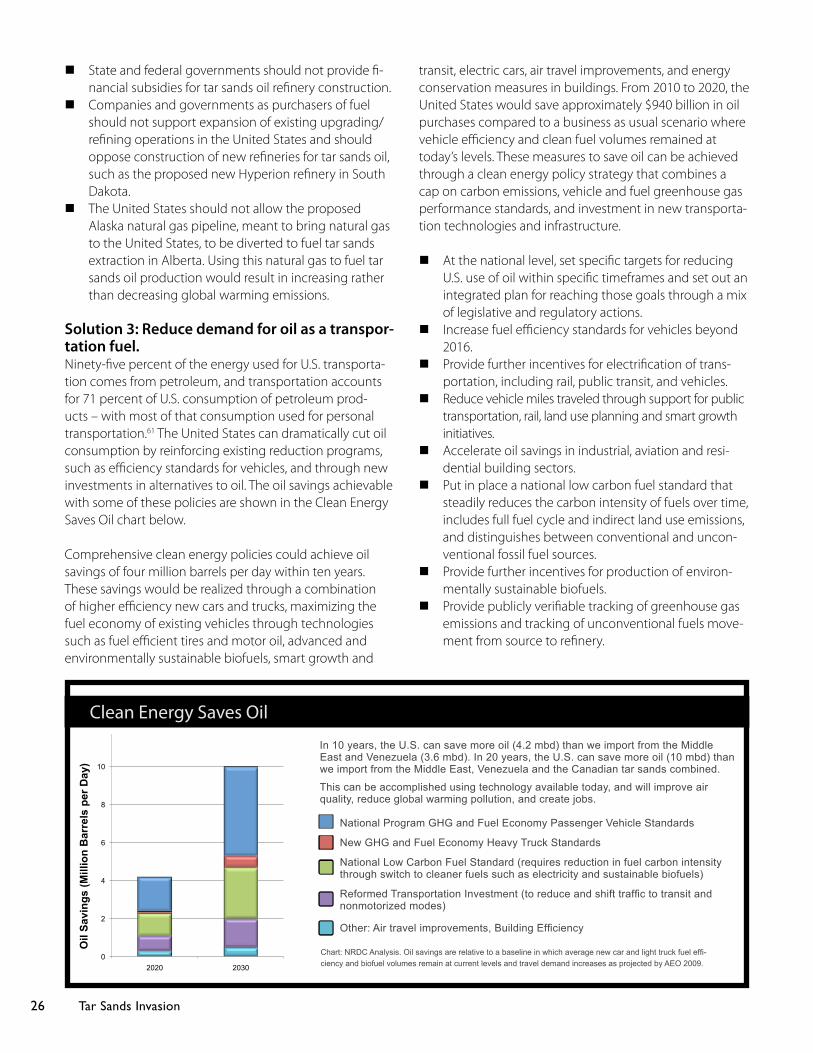
Solution 3: reduce demand for oil as a transpor-tation fuel.Ninety-five percent of the energy used for U.S. transporta-tion comes from petroleum, and transportation accounts for 71 percent of U.S. consumption of petroleum prod-ucts – with most of that consumption used for personal transportation.61 The United States can dramatically cut oil consumption by reinforcing existing reduction programs, such as efficiency standards for vehicles, and through new investments in alternatives to oil. The oil savings achievable with some of these policies are shown in the Clean Energy Saves Oil chart below.
Comprehensive clean energy policies could achieve oil savings of four million barrels per day within ten years. These savings would be realized through a combination of higher efficiency new cars and trucks, maximizing the fuel economy of existing vehicles through technologies such as fuel efficient tires and motor oil, advanced and environmentally sustainable biofuels, smart growth and
transit, electric cars, air travel improvements, and energy conservation measures in buildings. From 2010 to 2020, the United States would save approximately $940 billion in oil purchases compared to a business as usual scenario where vehicle efficiency and clean fuel volumes remained at today’s levels. These measures to save oil can be achieved through a clean energy policy strategy that combines a cap on carbon emissions, vehicle and fuel greenhouse gas performance standards, and investment in new transporta-tion technologies and infrastructure.
At the national level, set specific targets for reducing �U.S. use of oil within specific timeframes and set out an integrated plan for reaching those goals through a mix of legislative and regulatory actions.Increase fuel efficiency standards for vehicles beyond �2016. Provide further incentives for electrification of trans- �portation, including rail, public transit, and vehicles.Reduce vehicle miles traveled through support for public �transportation, rail, land use planning and smart growth initiatives.Accelerate oil savings in industrial, aviation and resi- �dential building sectors.Put in place a national low carbon fuel standard that �steadily reduces the carbon intensity of fuels over time, includes full fuel cycle and indirect land use emissions, and distinguishes between conventional and uncon-ventional fossil fuel sources. Provide further incentives for production of environ- �mentally sustainable biofuels.Provide publicly verifiable tracking of greenhouse gas �emissions and tracking of unconventional fuels move-ment from source to refinery.
Clean Energy Saves Oil
0
2
4
6
8
10
12
2020 2030
Oil
Savi
ngs
(Mill
ion
Bar
rels
per
Day
)
National Program GHG and Fuel Economy Passenger Vehicle Standards
New GHG and Fuel Economy Heavy Truck Standards
National Low Carbon Fuel Standard (requires reduction in fuel carbon intensity through switch to cleaner fuels such as electricity and sustainable biofuels)
Reformed Transportation Investment (to reduce and shift traffic to transit and nonmotorized modes)
Other: Air travel improvements, Building Efficiency
In 10 years, the U.S. can save more oil (4.2 mbd) than we import from the Middle East and Venezuela (3.6 mbd). In 20 years, the U.S. can save more oil (10 mbd) than we import from the Middle East, Venezuela and the Canadian tar sands combined.
This can be accomplished using technology available today, and will improve air quality, reduce global warming pollution, and create jobs.
� National Program GHG and Fuel Economy Passenger Vehicle Standards
� New GHG and Fuel Economy Heavy Truck Standards
� National Low Carbon Fuel Standard (requires reduction in fuel carbon intensity through switch to cleaner fuels such as electricity and sustainable biofuels)
� Reformed Transportation Investment (to reduce and shift traffic to transit and nonmotorized modes)
� Other: Air travel improvements, Building Efficiency
Chart: NRDC Analysis. Oil savings are relative to a baseline in which average new car and light truck fuel effi-ciency and biofuel volumes remain at current levels and travel demand increases as projected by AEO 2009.
26 Tar Sands Invasion
27
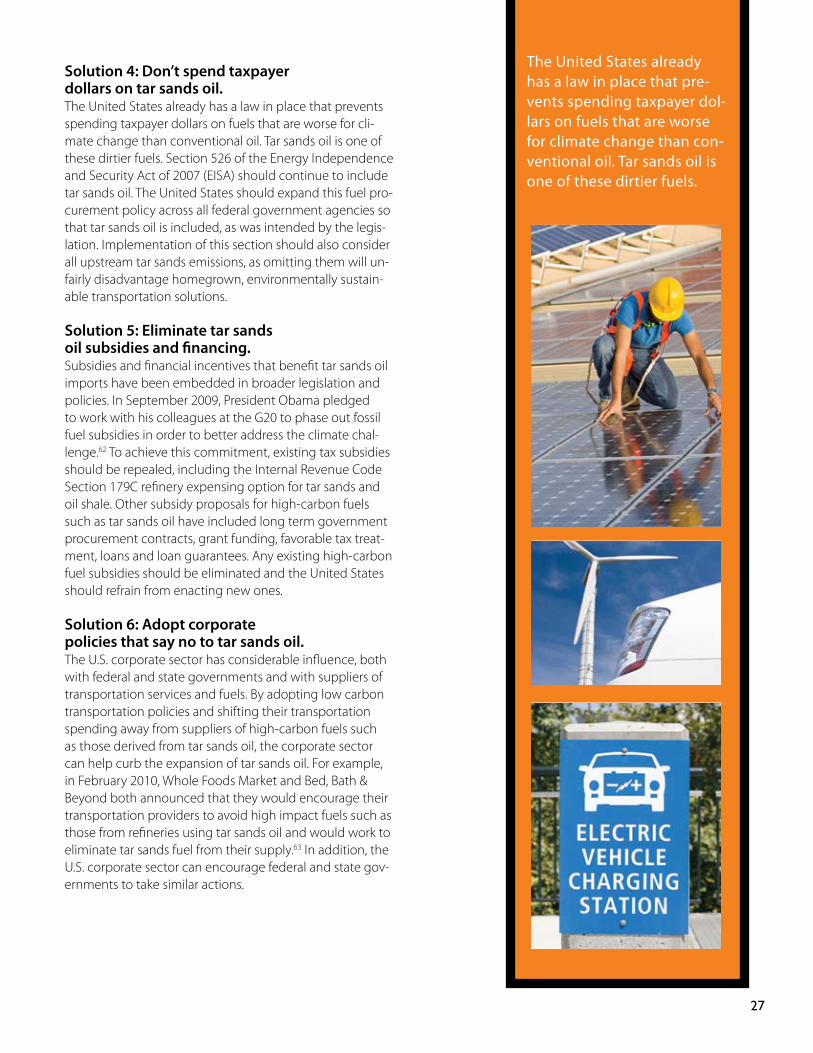
Solution 4: don’t spend taxpayer dollars on tar sands oil.The United States already has a law in place that prevents spending taxpayer dollars on fuels that are worse for cli-mate change than conventional oil. Tar sands oil is one of these dirtier fuels. Section 526 of the Energy Independence and Security Act of 2007 (EISA) should continue to include tar sands oil. The United States should expand this fuel pro-curement policy across all federal government agencies so that tar sands oil is included, as was intended by the legis-lation. Implementation of this section should also consider all upstream tar sands emissions, as omitting them will un-fairly disadvantage homegrown, environmentally sustain-able transportation solutions.
Solution 5: eliminate tar sands oil subsidies and financing.Subsidies and financial incentives that benefit tar sands oil imports have been embedded in broader legislation and policies. In September 2009, President Obama pledged to work with his colleagues at the G20 to phase out fossil fuel subsidies in order to better address the climate chal-lenge.62 To achieve this commitment, existing tax subsidies should be repealed, including the Internal Revenue Code Section 179C refinery expensing option for tar sands and oil shale. Other subsidy proposals for high-carbon fuels such as tar sands oil have included long term government procurement contracts, grant funding, favorable tax treat-ment, loans and loan guarantees. Any existing high-carbon fuel subsidies should be eliminated and the United States should refrain from enacting new ones.
Solution 6: Adopt corporate policies that say no to tar sands oil.The U.S. corporate sector has considerable influence, both with federal and state governments and with suppliers of transportation services and fuels. By adopting low carbon transportation policies and shifting their transportation spending away from suppliers of high-carbon fuels such as those derived from tar sands oil, the corporate sector can help curb the expansion of tar sands oil. For example, in February 2010, Whole Foods Market and Bed, Bath & Beyond both announced that they would encourage their transportation providers to avoid high impact fuels such as those from refineries using tar sands oil and would work to eliminate tar sands fuel from their supply.63 In addition, the U.S. corporate sector can encourage federal and state gov-ernments to take similar actions.
The United States already has a law in place that pre-vents spending taxpayer dol-lars on fuels that are worse for climate change than con-ventional oil. Tar sands oil is one of these dirtier fuels.

28 Tar Sands Invasion
Syncrude tar sands mining operations Photo: David Dodge/Pembina Institute, www.oilsandswatch.org

29
conclusion
America is a land of innovators. And today the factories of Detroit, the laboratories of Silicon Valley and the next generation of American consumers are ready to invest in and profit from clean technol-ogy. Almost every major car maker in the world is coming out with an electric vehicle, and cost benefit analyses show that these vehicles will reduce the cost of fuel. More importantly, these vehicles are the transformational technology that will finally reduce strategic dependence on oil, thus making the nation more secure.
As simple as this way forward appears, it is being threatened by the powerful interests of the oil lobby and certain arms of the Canadian government. The oil industry does not want to give up the record profits they have enjoyed. In 2009, the oil industry spent $154 million just on lobbying the U.S. Congress – not including all of the millions they spent on advertis-ing.64 Recognizing that conventional oil supplies are decreasing, the giants of the oil industry – including Shell, BP, Exxon Mobil, Chevron and Conoco-Philips – have partnered with influential arms of the Canadian government to lobby for in-creased U.S. use of tar sands oil. They are willing to sacrifice the largest remaining carbon storehouse in the world – our planet’s very ability to cope with CO2 emissions – for the chance to make themselves rich. The tar sands battle is about profit at the expense of climate security.
Over the past several years, tens of thousands of people have come together from all over the world to protest the tar sands. Yet without the support of the Obama Administration and the U.S. Congress, the oil industry will win. While the tar sands oil industry benefits from increasingly expensive gasoline, Canadian and American citizens will be left to deal with a network of pollution and a planet that is increasingly unable to deal with global warming.
This report has outlined the dangers of the tar sands. We call on you, our reader, to consider the costs:
Tar sands are a global disaster, because they will all but guarantee the failure of efforts to combat global warming. �Tar sands weaken U.S. energy security by continuing our dependence on oil, in this case the dirtiest and most expen- �sive form of oil.Tar sands operations violate the legal rights of indigenous people, and harm the health of people living in communi- �ties downstream from those operations.Tar sands directly compete with homegrown jobs in clean energy and may take away opportunities for America to �transition to an independent energy sector.
All forecasts agree that U.S. demand for oil has peaked and will soon decline. With a little help from efficiency measures, hybrids and fully electric cars, oil use can decrease dramatically in the next few years. Oil will remain, for some time, a sig-nificant part of the fuel mix, but America does not need an expansion of tar sands oil, especially when the environmental and public health costs are so high.
The United States can maintain mobility, while at the same time acting to halt expansion of expensive and dirty fuels that cause global warming and so many other environmental and health impacts. The solutions lie in clean, renewable fuel sources, energy efficient technology and smart growth.
30 Tar Sands Invasion
endnotes
1 Hansen, James. “President’s trip to Canada defines critical carbon moment.” Seattle Post-Intelligencer. February 16, 2009.
2 Ibid.
3 Environmental Protection Agency. EPA Analysis of the Transportation Sector: Greenhouse Gas and Oil Reduction Scenarios. 2010. http://www.epa.gov/otaq/climate/kerry-analysis-02-18-2010.pdf.
4 Energy Resources Conservation Board. “Frequently Asked Questions on the Development of Alberta’s Energy Resources – Oil Sands.” 2009. http://www.ercb.ca/docs/public/EnerFAQs/PDF/EnerFAQs12-OilSands.pdf.
5 National Energy Technology Laboratory. Development of Baseline Data and Analysis of Life Cycle Greenhouse Gas Emissions of Petroleum-Based Fuels. DOE/NETL-2009/1346, 2008. See tables 2-4 and 2-5 on p. 12.
6 Woynillowicz, Dan, Chris Severson-Baker, and Marlo Raynolds. Oil Sands Fever: The Environmental Implications of Canada’s Oil Sands Rush. Alberta, Canada: The Pembina Institute, 2005.
7 Peachey, Bruce. Strategic Needs for Energy Related Water Use Technologies: Water and the EnergyINet. Alberta, Canada: Energy Innovation Net, 2005. http://www.aeri.ab.ca/sec/new_res/docs/energyinet_and_water_feb2005.pdf.
8 Timoney, Kevin. A study of water and sediment quality as related to public health issues, Fort Chipeywan, Alberta. Alberta, Canada: Nunee Health Board Society, 2007.
9 Wells, Jeff, Susan Casey-Lefkowitz, Gabriela Chavarria, Simon Dyer. Danger in the Nursery: Impact on Birds of Tar Sands Oil Development in Canada’s Boreal Forest. Washington, DC: Natural Resources Defense Council, 2008. http://www.nrdc.org/wildlife/borealbirds.asp.
10 Canadian Association of Petroleum Producers. Crude Oil Forecast, Markets & Pipeline Expansions. Alberta, Canada: CAPP, 2009. http://www.capp.ca/GetDoc.aspx?DocId=152951.
11 NRDC Analysis. Oil savings are relative to a baseline in which average new car and light truck fuel efficiency and biofuel volumes remain at current levels and travel demand increases as projected by AEO 2009.
12 Hatch, Christopher and Matt Price. Canada’s Toxic Tar Sands: The Most Destructive Project on Earth. Toronto, Canada: Environmental Defence Canada, 2008. http://www.environmentaldefence.ca/reports/pdf/TarSands_TheReport.pdf.
13 On water use: The Pembina Institute Oil Sands Watch. “Oil Sands 101: Water Use.” http://www.oilsandswatch.org/os101/water. On earth moving: Oil Shale & Tar Sands Programmatic EIS Information Center. “About Tar Sands.” http://ostseis.anl.gov/guide/tarsands/index.cfm. Note that two of the four tons of earth excavated per barrel are “overburden”—really, Boreal Forest and peatlands—and the other two tons are the soil in which the bitumen is found.
14 NRDC. This is a conservative estimate based on the assumptions that: over its entire lifecycle, tar sands oil causes on average 20g CO2e/MJ more than conventional oil; there are around 5840 MJ of energy in every barrel of gasoline; and the average passenger car causes a little bit less than 6 metric tons of CO2e annually.
15 Oil Shale & Tar Sands Programmatic EIS Information Center. “About Tar Sands.” http://ostseis.anl.gov/guide/tarsands/index.cfm.
31
16 The most common technology is called Steam Assisted Gravity Drainage (SAGD). More information about this technology and its environmental footprint can be found at: Schneider, Rick and Simon Dyer. Death by a Thousand Cuts: Impacts of In Situ Oil Sands Development on Alberta’s Boreal Forest. Alberta, Canada: The Pembina Institute and CPAWS Edmonton, 2006. http://pubs.pembina.org/reports/1000-cuts.pdf.
17 Environment Canada. “National Pollutant Release Inventory 2007 Summary.” Section 3.1.1.1: Criteria Air Contaminants. http://www.ec.gc.ca/inrp-npri/default.asp?lang=En&n=0D743E97-1.
18 Natural Resources Defense Council: Save BioGems. “Peace-Athabasca Delta.” http://www.savebiogems.org/peace/.
19 Tar sands mining water allocations are from: Alberta Environment. “Water Diversion by Oilsands Mining Projects in 2007” (data received September 2008). EPCOR Water Services reported treating 92.9 million cubic metres of water for the greater Edmonton area in 2008: EPCOR Water Services Inc. “2008 Performance Based Regulation Progress Report.” 2009. p. 8. http://webdocs.edmonton.ca/OcctopusDocs/Public/Complete/Reports/CC/CSAM/2009-07-22/2009FTF036%20Attachment%201.pdf ).
20 Griffiths, Mary, Amy Taylor and Dan Woynillowicz. Troubled Waters, Troubling Trends: Technology and Policy Options to Reduce Water Use in Oil and Oil Sands Development in Alberta. Drayton Valley, AB: The Pembina Institute, 2006. p. 69. http://pubs.pembina.org/reports/TroubledW_Full.pdf.
21 MacKinnon, Michael et al. “Water Quality Issues Associated with Composite Tailings (CT) Technology for Managing Oil Sands Tailings.” International Journal of Surface Mining, Reclamation and Environment. 15.4 (2001): 235-56.
22 Nix, Peter and Robert Martin. “Detoxification and Reclamation of Suncor’s Oil Sand Tailings Ponds.” Environmental Toxicology and Water Quality 7.2 (1992): 171-88.
23 U.S. Environmental Protection Agency Office of Toxic Substances. “Fate and Effects of Sediment-bound Chemicals in Aquatic Systems.” Proceedings of the Sixth Pellston Workshop. Florissant, CO. August 12–17, 1984.
24 Alberta Environment. “Tailings.” http://www.environment.alberta.ca/2595.html.
25 Price, Matt. 11 Million Litres a Day: The Tar Sands’ Leaking Legacy. Toronto, ON: Environmental Defence, 2008. http://www.environmentaldefence.ca/reports/tarsands_dec_2008.html.
26 Jones, Jeffrey. “Syncrude duck deaths now triple initial tally.” Reuters. March 31, 2009. http://www.reuters.com/article/environmentNews/idUSTRE52U6Q920090331.
27 Wells, Jeff, Susan Casey-Lefkowitz, Gabriela Chavarria, and Simon Dyer. Danger in the Nursery: Impact on Birds of Tar Sands Oil Development in Canada’s Boreal Forest. New York, NY: NRDC, Boreal Songbird Initiative, and The Pembina Institute, 2008. http://www.nrdc.org/wildlife/borealbirds.pdf.
28 Leaton, James. Unconventional Oil: Scraping the bottom of the barrel? United Kingdom: WWF-UK, 2008. http://assets.panda.org/downloads/unconventional_oil_final_lowres.pdf.
29 Alberta Energy, Alberta’s Leased Oil Sands Area (Edmonton, AB: June 24, 2009), http://www.energy.alberta.ca/OilSands/pdfs/OSAagreesStats_June2009vkb.pdf. This delineation of the surface mineable area is an increase of 1,350 square kilometres from the previous delineation, which put the surface mineable area at 3,400 square kilometres. See figure 2-4 in: Burrowes, Andy et al. ST98-2009: Alberta’s Energy Reserves 2008 and Supply/Demand Outlook 2009–2018. Calgary, AB: Energy Resources Conservation Board, 2009. http://www.ercb.ca/docs/products/STs/st98-2009.pdf.
30 Government of Alberta Environment Ministry. “Tailings.” http://www.environment.alberta.ca/2595.html.
31 Cited as 93,220 ha in 2006 from: Government of Alberta. State of the Environment – Land. “Oil Sands Mining Development, Activity, and Reclamation – 2006.” http://www3.gov.ab.ca/env/soe/land_indicators/41_status.html.
32 Government of Alberta. “Alberta’s Oil Sands: Facts and Stats.” http://www.oilsands.alberta.ca/519.cfm.
33 For example, Suncor reported a reclamation area of 1,019 hectares as of 2008 in their 2009 Report on Sustainability. http://www.suncor.com/en/responsible/1574.aspx. And Syncrude reported a reclamation area of 4,500 hectares in their 2007 Sustainability Report. http://sustainability.syncrude.ca/sustainability2007/enviro/reclamation/.
32 Tar Sands Invasion
34 The ecoENERGY Carbon Capture and Storage Task Force. Canada’s Fossil Energy Future: The Way Forward on Carbon Capture and Storage. Natural Resources Canada, 2008. http://www.nrcan-rncan.gc.ca/com/resoress/publications/fosfos/fosfos-eng.pdf.
35 Mui, Simon, Doug Hannah and Roland Hwang. Life Cycle Analysis of Greenhouse Gas Emissions from Tar Sands. Natural Resources Defense Council, 2008.
36 Lee, Peter and Ryan Cheng. Bitumen and Biocarbon: Land Use Conversions and Loss of Biological Carbon Due to Bitumen Operations in the Boreal Forests of Alberta, Canada. Alberta, Canada: Global Forest Watch Canada, 2009. http://www.globalforestwatch.ca/climateandforests/bitumenbiocarbon/BioCarbon_WEB_LR.pdf.
37 Ecofys Germany. G8 Climate Scorecards 2009. WWF and Allianz SE, 2009. p. 15. http://www.worldwildlife.org/climate/Publications/WWFBinaryitem12911.pdf.
38 Demerse, Clare and Matthew Bramley. Backgrounder: The March 2008 Federal Regulatory Framework for Industrial Greenhouse Gas Emissions. Pembina Institute, 2008. http://climate.pembina.org/pub/1614.
39 WWF-UK and The Co-operative Bank Insurance Investments. Carbon Capture and Storage in the Alberta Oil Sands – A Dangerous Myth. WWF-UK and the Co-operative Bank, 2009.
40 Canadian Association of Petroleum Producers. Crude Oil Forecast, Markets & Pipeline Expansions. CAPP, 2009. http://www.capp.ca/GetDoc.aspx?DocId=152951. Appendix B.2, p. 34. In 2008, tar sands oil production accounted for 1.306 mbd, or 48%, of Canada’s total oil production of 2.718 mbd.
41 Canadian Association of Petroleum Producers. Crude Oil Forecast, Markets & Pipeline Expansions. CAPP, 2009. http://www.capp.ca/GetDoc.aspx?DocId=152951. p. 9. In 2008, Western Canadian Crude exports totaled 1.724 million bpd. Only 8,000 bpd (less than 1%) went to non-US locations.
42 In 2008, the United States imported 1.941 million bpd of crude oil from Canada: U.S. Energy Information Administration. “Crude Oil and Total Petroleum Imports Top 15 Countries.” http://www.eia.doe.gov/pub/oil_gas/petroleum/data_publications/company_level_imports/current/import.html. The United States used a total of 19.498 million bpd of oil the same year: U.S. Energy Information Administration. “United States Energy Profile.” http://tonto.eia.doe.gov/country/country_energy_data.cfm?fips=US.
43 Statistics Canada. “CYB Overview 2008: Energy.” http://www41.statcan.ca/2008/1741/ceb1741_000-eng.htm.
44 Environmental Protection Agency. “Nonattainment Areas Map – Criteria Air Pollutants.” http://www.epa.gov/air/data/nonat.html?us~USA~United%20States. For example, Harris County, TX (Houston), Wayne County, MI (Detroit), Cook County, IL (Chicago) and all its neighboring counties, and many of the counties in the Bay Area are nonattainment areas for Ozone (8-hour). These areas are each home to several refineries. For a list of oil refineries in the United States, see: Energy Information Administration. “Refinery Capacity 2009.”
45 Higher sulfur content in tar sands: Gareth R. Crandall. Prospects for Increased Production – Non-Conventional Oil Market Outlook. Presentation to: International Energy Agency Conference on Non-Conventional Oil. 2002. http://iea.org/textbase/work/2002/calgary/Crandall.pdf. Higher nitrogen content in tar sands: ADVENT-ENVIRON. Addendum to “Case-by-Case Antidegradation Analysis.” Prepared for BP Whiting, Indiana, submitted to IDEM November 30, 2006. p. 2. http://www.in.gov/idem/files/clarification_3.pdf.
46 Dan Woynillowicz. The Pembina Institute. Oil Sands Fever. November 2005. http://pubs.pembina.org/reports/OilSands72.pdf. Accessed November 11, 2009. p. 45.
47 Minority Staff Special Investigations Division, Committee on Government Reform. Oil Refineries Fail to Report Millions of Pounds of Harmful Emissions. Prepared for Henry Waxman. U.S. House of Representatives, 1999.
48 The Keystone XL pipeline would consist of 1,702 miles of new, 36-inch-diameter pipeline – about 327 miles in Canada and 1375 miles within the United States. U.S. Department of State. “Keystone KL Pipeline Project.” http://www.keystonepipeline-xl.state.gov. It would also incorporate the Cushing Extension portion of the Keystone Pipeline – 291 miles of 30-inch diameter pipe. U.S. Department of State. “Keystone Pipeline Project.” http://www.keystonepipeline.state.gov.

33
49 United States Department of State. Final Environmental Impact Statement for the Keystone Oil Pipeline Project. 2008. Section 3.2: Soils and Sediments. http://www.entrix.com/keystone/project/eis/06_Section%203.02%20Soils.pdf.
50 DNV Consulting. Frequency-Volume Study of Keystone Pipeline: Report for TransCanada PipeLines Limited. Report no.: 70015849-2. Rev 1, May 1, 2006. p. 19.
51 Thomas, Richard. “Alberta-Superior pipeline takes center stage in world climate debate.” BusinessNorth Exclusives. October 27, 2009. http://www.businessnorth.com/viewarticle.asp?articleid=3219.
52 Dennehy, Kevin “High Plains Regional Ground-Water Study: U.S. Geological Survey Fact Sheet FS-091-00.” USGS, 2000. http://co.water.usgs.gov/nawqa/hpgw/factsheets/DENNEHYFS1.html.
53 These CO2 emissions were calculated with a modified GREET spreadsheet (file GREET1_8c_0.xls)—changing the distance traveled via pipeline. We assumed a pipeline length of 3000 km (1864 miles) from Edmonton to Chicago, which gave us an emissions factor of 0.403 g CO2 e/mmBtu-km. This is equivalent to 0.00219 kg CO2e/barrel-km. Thus the transportation emissions to Chicago are 6.58 kg CO2e/barrel.
Wang, M. et al. GREET 1.8c.0. Argonne National Laboratory, February 2009. Assuming a future scenario of 3 million bpd (mbd) tar sands exports: (3,000,000 barrels/day)*(6.58 kg CO2e/barrel)*(365 days/yr)*(1 metric ton/1000 kg) = 7,205,100 metric tons CO2e/year The average passenger car emits 5.8 metric tons of CO2 annually. (7,205,100 metric tons CO2e/year) / (5.8 metric tons
CO2/car/year) = 1,242,259 cars.
54 International Energy Agency. World Energy Outlook 2009. Paris, France: OECD/IEA, 2009.
55 BP. Statistical Review of World Energy. BP, 2009. http://www.bp.com/liveassets/bp_internet/globalbp/globalbp_uk_english/reports_and_publications/statistical_energy_review_2008/STAGING/local_assets/2009_downloads/statistical_review_of_world_energy_full_report_2009.pdf.
56 Stockman, Lorne and Kenny Bruno. “Comments to the White House regarding the EISA Section 933 Energy Security Report to Congress.” December 2009. http://dirtyoilsands.org/files/CommentsToWH_EISA933_CEI_SC_GP.pdf.
57 U.S. Energy Information Administration. EIA Report on Hurricane Impacts on U.S. Energy. EIA, 2005. http://tonto.eia.doe.gov/oog/special/eia1_katrina.html.
58 IHS CERA. Research Highlights. “Peak Oil Demand in the Developed World: It’s Here.” September 29, 2009. http://www.cera.com/aspx/cda/public1/news/researchHighlights/researchHighlights.aspx and International Energy Agency. World Energy Outlook 2009. Paris, France: OECD/IEA, 2009.
59 Ewing, Reid et al. Growing Cooler: The Evidence on Urban Development and Climate Change. Urban Land Institute, 2008.
60 PLATFORM, Greenpeace, and Oil Change International. Shifting Sands: How a changing economy could bury the tar sands industry. London, UK: Greenpeace, PLATFORM, and Oil Change International, 2009. http://www.greenpeace.org.uk/files/pdfs/climate/shifting-sands-bp-shell-rising-risks-update-2.pdf.
61 Energy Information Administration. “Primary Energy Consumption by Source and Sector, 2008.” http://www.eia.doe.gov/emeu/aer/pdf/pecss_diagram.pdf.
62 President Obama. “Remarks by the President at United Nations Secretary General Ban Ki-Moon’s Climate Change Summit.” United Nations Headquarters, New York, NY. September 22, 2009. http://www.whitehouse.gov/the_press_office/Remarks-by-the-President-at-UN-Secretary-General-Ban-Ki-moons-Climate-Change-Summit.
63 ForestEthics. “Press Release: Whole Foods, Bed Bath & Beyond Reject Canada’s Tar Sands.” February 10, 2010. http://www.forestethics.org/whole-foods-bed-bath-beyond-reject-canadas-tar-sands------.
64 Mulkern, Anne. “LOBBYING: Oil and gas interests set spending record in 2009.” E&E. February 2, 2010. http://www.eenews.net/Greenwire/2010/02/02/1/.
Faces photos on page 4: Dey Alexander, http://www.flickr.com/photos/dey; Hamed Masoumi, http://www.flickr.com/photos/hamedmasoumi; Andrea Leganza, http://www.flickr.com/photos/neogene.

34 Tar Sands Invasion
EARTHWORKS1612 K St, NW, Suite 808Washington, D.C. 20006202-887-1872www.earthworksaction.org
EARTHWORKSTM
EARTHWORKSTM
EARTHWORKSTM
EARTHWORKSTM
Corporate Ethics InternationalP.O. Box 2401Suisun City, CA 94585415-238-9975 www.corpethics.org
C O R P O R A T EETHICSI N T E R N AT I O N A L
Natural Resources Defense Council40 West 20th StNew york, Ny 10011212 727-2700fax 212 727-1773www.nrdc.org
Sierra Club85 Second Street, 2nd floor San francisco, CA 94105 415 977-5500 fax 415 977-5799www.sierraclub.org