investoer guide for turkey
DESCRIPTION
Investor Guide FOR TURKEYTRANSCRIPT
INVESTOR’S GUIDE
FOR TURKEY
2
Establishing a Business in Turkey ..................................................3
Cost of Doing Business in Turkey ...................................................4 Incentives......................................................................................7 1. The Investment Incentive System in Turkey....................................................... 7
1.a. General Investment Incentive Regime ...................................................................... 7 1.b Incentives for Priority Development Regions .............................................................. 7 1.c Incentives Granted to Small and Medium Sized Enterprises (SME Incentives) ................. 9 1.d Research and Development Supports ........................................................................ 9 1.e Technology Development Zones’ Supports ............................................................... 10 1.f State Incentives for Export ..................................................................................... 10
Taxes ...........................................................................................11 1. Taxes .......................................................................................................... 11
1.b Taxes on Expenditure............................................................................................ 12 1.c Taxes on Wealth ................................................................................................... 12
2. Tax Incentives.............................................................................................. 14 3. Tax Exemptions and Allowances ..................................................................... 14
Special Investment Zones............................................................15 Demography and Labor Force ......................................................18 1. DEMOGRAPHY .............................................................................................. 18 2. LABOR FORCE .............................................................................................. 19
Business Environment..................................................................24 AUTONOMOUS BODIES ..................................................................................... 24
1. Competition Authority ............................................................................................. 24 2. Energy Market Regulation Authority .......................................................................... 24 3. Banking Regulation and Supervision Agency .............................................................. 24 4. Telecommunication Authority ................................................................................... 25 5. Tobacco, Tobacco Products and Alcoholic Beverages Market Regulation Board................ 25 6. Privatization Authority............................................................................................. 25
ENVIRONMENTAL STANDARDS........................................................................... 26 TURKISH LABOR MARKET .................................................................................. 26 EMPLOYMENT OF EXPATRIATES.......................................................................... 26
1. How to get a work permit in Turkey .......................................................................... 26 2. Main categories of work permits ............................................................................... 27
RESEARCH AND DEVELOPMENT ACTIVITIES ........................................................ 27 1. TUBITAK ............................................................................................................... 27 2. TTGV .................................................................................................................... 27 3. KOSGEB ................................................................................................................ 28
Infrastructure ..............................................................................29
Economic Outlook ........................................................................34 1. MACROECONOMIC INDICATORS ..................................................................... 34
1.a Changes in price levels .......................................................................................... 35 1.b Balance of Payments ............................................................................................. 36
2.FDI IN TURKEY.............................................................................................. 41 3. INTERNATIONAL TRADE ................................................................................ 46
Business Legislation.....................................................................52

3
Establishing a Business in Turkey
Turkey's regulatory environment is extremely business-friendly. You can establish a business in Turkey irrespective of nationality or place of residence. The registration and establishment of a company in Turkey can be completed in one day. The process is handled by one ministry which acts as the coordinator between all authorities. The first step in establishing a business in Turkey is to fill out the "Business Registration Form" at the local Trade Registry Office located at the local Chamber of Commerce. Here are the steps to follow: • Submit the notarized 'Articles of Association'. • Deposit 0.04% of the capital into either a State Bank or the Turkish Central Bank. • Complete the “Company Establishment Form” and register with the Trade Registry Office. International companies may start their activities in Turkey in various forms depending on the investors' development strategies. The most common types of legal entities in Turkey are : • Limited Liability Company (Ltd.Sti.) • Joint-Stock Company (A.S) • Branch Office • Liaison Office

4
Cost of Doing Business in Turkey
Minimum Monthly Wage (Gross and Net)
USD
Net Minimum Wage 297.29
- Social Security Premium Payment (14%) 58.08
- Payment for Unemployment Insurance Fund (1%) 4.14
- Income Tax (15%) 52.90
- Stamp Tax (6%) 2.48
Gross Minimum Wage 414.89
Total Deduction 117.60
Cost for Employer
Gross Minimum Wage 414.89
Employer Share of Social Security Premium (19.5%) 80.90
Employer's Payment for Unemployment Insurance Fund
(2%) 8.29
Total Cost for Employer 504.08
Source: Ministry of Labor and Social Security, Valid for the year
2007.
35,6% of the labor force work on the minimum wage which is the highest rate in the EU.
For more than four years, the electricity cost remain at the same tariff. The cost policy was adopted by
Turkish Government in order to maintain the stability of the competiveness of national productivity.

5
Cost of Electricity
Cost of Electricity USD/kwh
Active Energy
Daytime Night
Cent/kWh Cent/kWh
Double Term Tariff
Industry Mid
Voltage 0.070 0.035
Single Term Tariff
Mid Voltage 0.081 0.046
Source: Tedaş, Valid for the year 2007
Cost of Water for Industrial Use
Type of
Customer USD/m3
Water Waste
Water Total VAT (%)
Industry 2.41 0 2.41 8
Org.Ind.Zone 1.57 0 1.57 8
Source: ĐSKĐ, valid for the year 2007.
Cost of natural gas for industrial purposes
Price per kwh (USD)
Disengaged Consumer Engaged Consumer
0.030743 USD/kwh 0.034992 USD/kwh
Engaged Consumer: The group of consumers who must purchase
gas from the local supplier company.
Disengaged Consumer: The group of consumers who consumes
more than 1 million m3 annually and qualified to purchase gas
from other suppliers.
Source: IGDAŞ, Valid for the year 2007.

6
Cost of Telephone Use
USD
Fixed Cost (per Month) 25.17
CALL CHARGES- YTL/min
Local Peak 0.039
Local Off-Peak(2) 0.019
Long Distance 0.056
Source: Turk Telecom, valid for the year 2007.
7
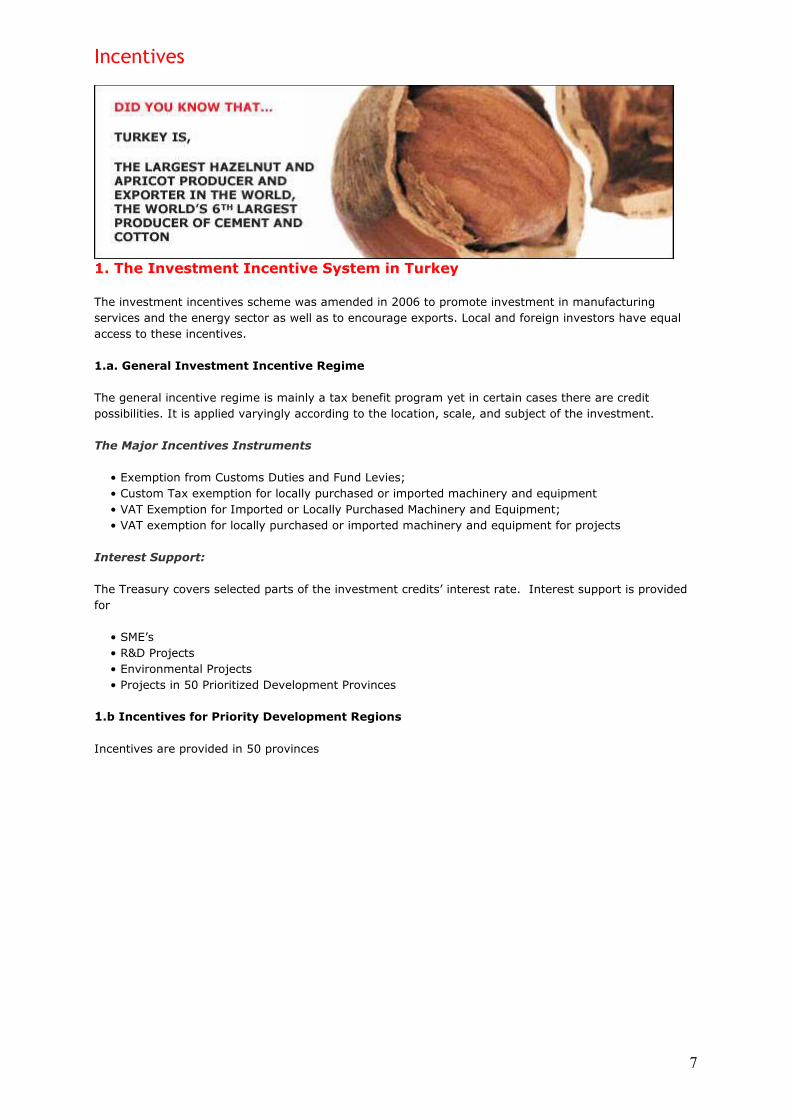
Incentives
1. The Investment Incentive System in Turkey
The investment incentives scheme was amended in 2006 to promote investment in manufacturing
services and the energy sector as well as to encourage exports. Local and foreign investors have equal
access to these incentives.
1.a. General Investment Incentive Regime
The general incentive regime is mainly a tax benefit program yet in certain cases there are credit
possibilities. It is applied varyingly according to the location, scale, and subject of the investment.
The Major Incentives Instruments
• Exemption from Customs Duties and Fund Levies;
• Custom Tax exemption for locally purchased or imported machinery and equipment
• VAT Exemption for Imported or Locally Purchased Machinery and Equipment;
• VAT exemption for locally purchased or imported machinery and equipment for projects
Interest Support:
The Treasury covers selected parts of the investment credits’ interest rate. Interest support is provided
for
• SME’s
• R&D Projects
• Environmental Projects
• Projects in 50 Prioritized Development Provinces
1.b Incentives for Priority Development Regions
Incentives are provided in 50 provinces

8
Province List
Incentives provided are as below;
• Free Land
• Income Tax Relief
• Employer’s Share for Social Security Relief
• Energy Support
Free land allocation provided in 4 provinces

9
INCENTIVE TYPE FOR COMPANIES OIZ’s AND
INDUSTRIAL ZONES OTHERS
INCOME TAX RELIEF 100 % 80 %
COMPANSATION FOR THE EMPLOYERS SOCIAL
SECURITY CONTRIBIUTION 100 % 80 %
ENERGY SUPPORT VARIES MIN. 20% - 50% VARIES MIN. 20%
- 50%
FREE LAND ALLOCATION AVAILABLE AVAILABLE
1.c Incentives Granted to Small and Medium Sized Enterprises (SME Incentives)
• Custom Duties Exemption
• VAT Exemption
• Interest Support
KOSGEB support of SME’s; The Small and Medium Industry Development Organization (KOSGEB) makes
significant contributions to strengthen SME’s by various support instruments in financing, R&D, common
facilities, market research, investment site, marketing, export and training.
1.d Research and Development Supports
TÜBĐTAK (Scientific and Technological Research Council of Turkey) and TTGV (Turkish Technology
Development Foundation) both reimburse and/or grant R&D related expenses and capital loans for R&D
projects.
Projects eligible for TÜBĐTAK Incentives cover:
• Concept Development
• Technological Research and Technical Feasibility Research
• Laboratory Studies in the transformation of a concept to a design
• Design and Sketching Studies
• Prototype Production
• Construction of pilot facilities
• Test production
• Patent and License studies
• Activities related to post-sale problems stemming from product design

10
1.e Technology Development Zones’ Supports
• Infrastructure facilities are provided.
• Profits derived out software and R&D activities are exempt from income and corporate taxes until
31.12.2013.
• The wages of researchers, software and R&D personnel employed in the zone are exempt from all
taxes until 31.12.2013.
• VAT exemption during the exemption period of income and corporate taxes is provided for IT specific
sectors.
• Exemption from customs and duties as well as fund levies.
1.f State Incentives for Export The principle aims of this scheme are to encourage export and to increase the competitiveness of firms in international markets. This specific package covers mainly R&D activities, market research, participation in exhibitions and international fairs, expenditures for patents, trademarks and industrial design.

11
Taxes
1. Taxes
Turkey has one of the most competitive corporate tax rates in the OECD region. The new Corporate Tax
law that was enacted on June 21, 2006 has made some important amendments to the current
applications and also included new concepts in the tax legislation. With the new Corporate Tax Law in
place, the Turkish corporate tax legislation has noticeably clearer, more objective and greater
harmonized provisions which are in-line with international standards.
The Turkish tax regime can be classified under three main headings:
1.a Income Taxes
Income taxes in Turkey are levied on all income, including domestic as well as foreign individuals and
corporations residing in Turkey. Non-residents earning income in Turkey through employment, ownership
of property, business transactions, or any other activity which generates income are also subject to
taxation, but only on the income earned in Turkey.
1.a.1 Corporate Income Taxes
In Turkey, the basic corporate income tax rate levied on business profits is 20%.
Withholding Taxes On Selected Payments of Resident Corporations
- Dividends are subject to 15%.
- Interest on treasury-bill and treasury bonds derived by resident corporations is subject to 10%.
- Interest on other bonds and bills derived by resident corporations is subject to 10%.
- Bank deposits are subject to 15%.
- Profit shares paid by participation banks in consideration of participation account are subject to 15%.
- REPO agreements are subject to 15%.
Withholding Taxes On Selected Payments of Non-Resident Corporations
- Dividends are subject to 15%.
- Interest on treasury-bill and treasury bonds derived by non-resident corporations is subject to 0%.
- Interest on other bonds and bills derived by non-resident corporations is subject to 0%.
- Bank deposits are subject to 15%.
- Profit shares paid by participation banks in consideration of participation account are subject to 15%.
- REPO agreements are subject to 15%.
1.a.2 Individual Income Tax
The personal income tax rate varies from 15% to 35%.
Income tax rates applicable to yearly gross earnings from 2007 are as follows:
12
1.b Taxes on Expenditure
1.b.1 Value Added Tax (VAT)
The generally applied VAT rate varies between 1%, 8%, and 18%. Commercial, industrial, agricultural,
and independent professional goods and services; goods and services imported into the country and
deliveries on goods and services caused by other activities are all subject to VAT.
1.b.2 Special Consumption Tax
There are 4 main product groups that are subject to special consumption tax at different tax rates:
• Petroleum products, natural gas, lubricating oil, solvents, and derivatives of solvents
• Automobiles and other vehicles, motorcycles, planes, helicopters, yachts
• Tobacco and tobacco products, alcoholic beverages
• Luxury products
Unlike VAT, which is applied on each delivery, special consumption tax is charged only once.
1.b.3 Banking and Insurance Transaction Tax
Banking and Insurance company transactions remain exempt from VAT but are subject to a Banking and
Insurance Transaction Tax. This tax applies to income earned by the banks, for example on loan interest.
The general rate is 5%, while interest on deposit transactions between banks is 1% and sales amount
from foreign exchange transactions is 0.1%.
1.b.4 Stamp Duty
The Stamp duty applies to a wide range of documents, including contracts, agreements, notes payable,
capital contributions, letters of credit, letters of guarantee, financial statements and payrolls. The Stamp
duty is levied as a percentage of the value of the document at rates ranging from 0.15% to 0.75%.
1.c Taxes on Wealth
There are three kinds of taxes on wealth:
Inheritance and Gift Taxes, property taxes and motor vehicle tax
Buildings and land owned in Turkey are subject to real estate tax at the following rates:
• Residences 0.1%
• Other buildings 0.2%
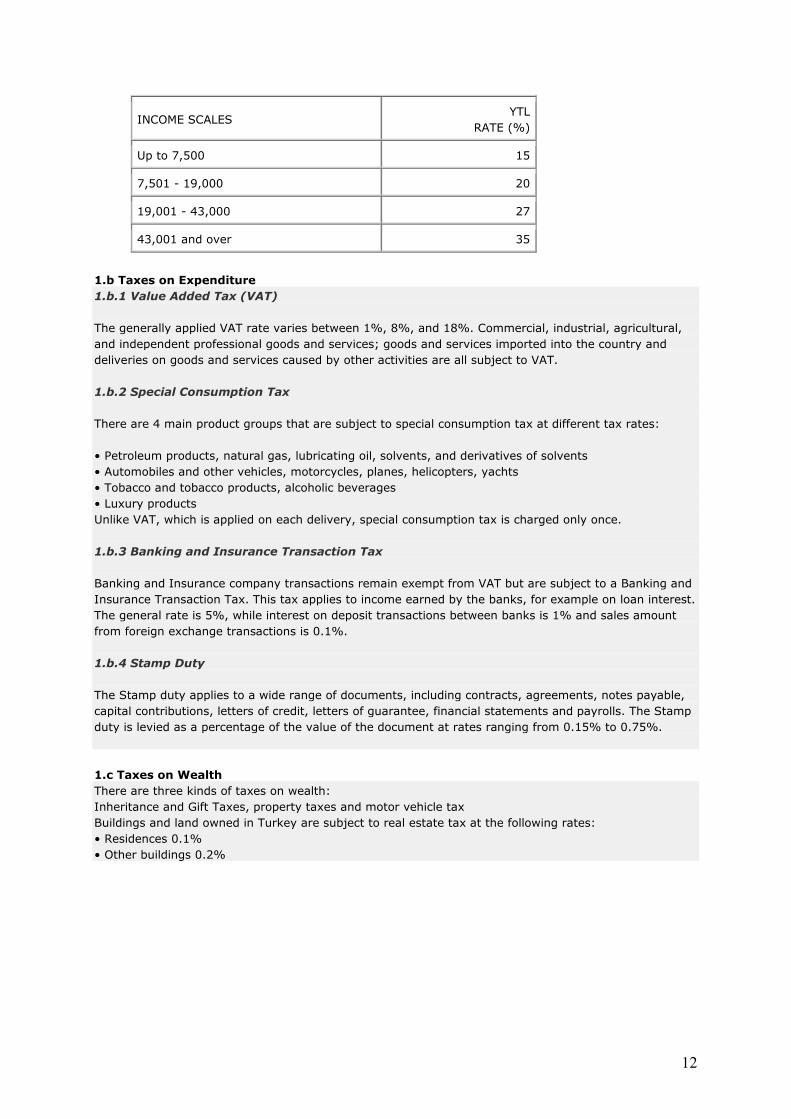
INCOME SCALES YTL
RATE (%)
Up to 7,500 15
7,501 - 19,000 20
19,001 - 43,000 27
43,001 and over 35
13
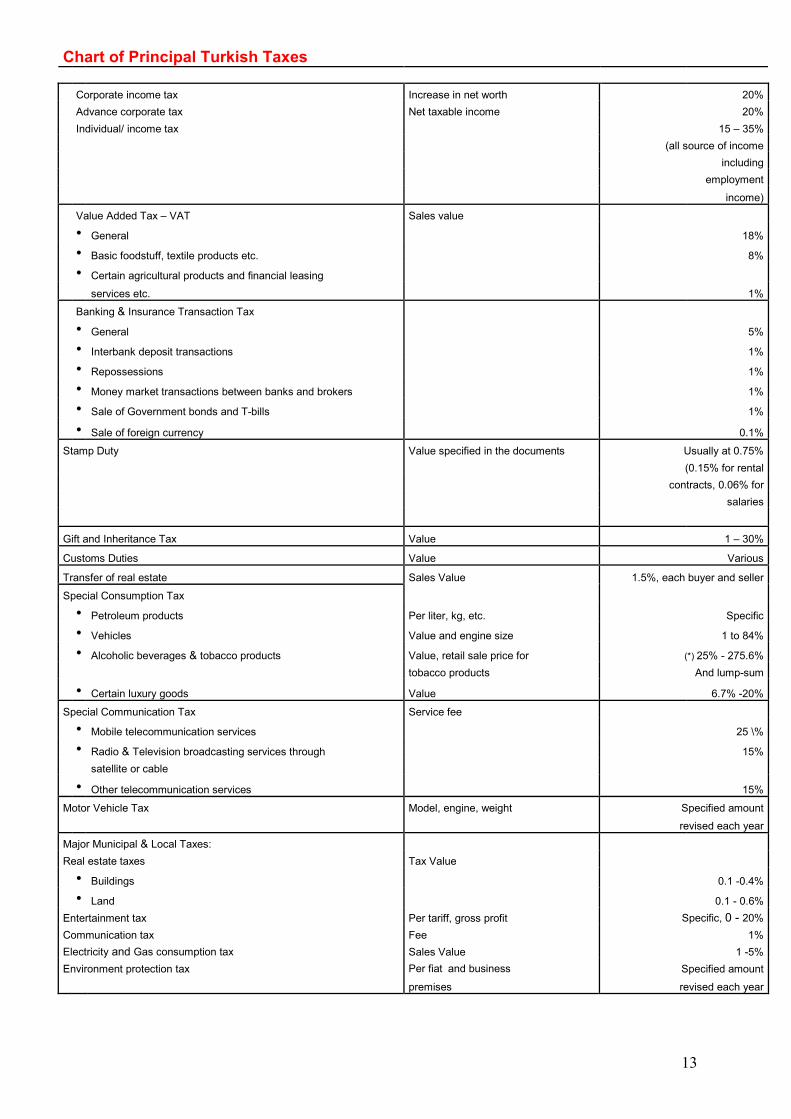
Chart of Principal Turkish Taxes
Corporate income tax Increase in net worth 20%
Advance corporate tax Net taxable income 20%
Individual/ income tax 15 – 35%
(all source of income
including
employment
income)
Value Added Tax – VAT Sales value
• General 18%
• Basic foodstuff, textile products etc. 8%
• Certain agricultural products and financial leasing
services etc. 1%
Banking & Insurance Transaction Tax
• General 5%
• Interbank deposit transactions 1%
• Repossessions 1%
• Money market transactions between banks and brokers 1%
• Sale of Government bonds and T-bills 1%
• Sale of foreign currency 0.1%
Stamp Duty Value specified in the documents Usually at 0.75%
(0.15% for rental
contracts, 0.06% for
salaries
Gift and Inheritance Tax Value 1 – 30%
Customs Duties Value Various
Transfer of real estate Sales Value 1.5%, each buyer and seller
Special Consumption Tax
• Petroleum products Per liter, kg, etc. Specific
• Vehicles Value and engine size 1 to 84%
• Alcoholic beverages & tobacco products Value, retail sale price for (*) 25% - 275.6%
tobacco products And lump-sum
• Certain luxury goods Value 6.7% -20%
Special Communication Tax Service fee
• Mobile telecommunication services 25 \%
• Radio & Television broadcasting services through 15%
satellite or cable
• Other telecommunication services 15%
Motor Vehicle Tax Model, engine, weight Specified amount
revised each year
Major Municipal & Local Taxes:
Real estate taxes Tax Value
• Buildings 0.1 -0.4%
• Land 0.1 - 0.6%
Entertainment tax Per tariff, gross profit Specific, 0 - 20%
Communication tax Fee 1%
Electricity and Gas consumption tax Sales Value 1 -5%
Environment protection tax Per fiat and business Specified amount
premises revised each year

14
(*) Only the percentage tax rate is applied provided that it is not less than the tax calculated by using the minimum lump-sum tax amounts.
Source : KPMG
2. Tax Incentives
• Prioritized Development Zones
• Technology Development Zones
• Organized Industrial Zones
• Free Zones
• Research and Development
• Educational Corporations
• Cultural Investments and Enterprises
3. Tax Exemptions and Allowances VAT exemptions include but are not limited to the following transactions: • Export of goods and services • Roaming services rendered in Turkey for customers outside Turkey (i.e. non-resident customers) in-line with international roaming agreements and which have a reciprocity condition in place • Petroleum exploration activities • International transportation • Deliveries made to diplomatic representatives, consulates and international organizations with tax exemption status and to their employees • The supply of machinery and equipment, including importation to persons or corporations that are VAT taxpayers and that have an investment certificate issued by the relevant authority • Services rendered at harbors and airports for vessels and aircrafts • Social and other exemptions apply to deliveries made to the government and other related organizations for cultural, educational, health and similar purposes • Banking and insurance transactions are exempted from VAT as they are subject to a separate Banking and Insurance Transactions Tax at the rate of 5 % • Tax exemption are provided for earnings derived by corporations from their overseas branches and both their domestic and overseas ventures if they meet certain conditions • Research and Development Allowances • Deductions from the tax base of corporations related to certain donations, aid or sponsorship expenditures for sport activities

15
Special Investment Zones
There are 4 types of special investment zones in Turkey:
1. TECHNOLOGY DEVELOPMENT ZONES - TECHNOPARKS • Technology Development Zones are areas designed to support R&D activities and attract investments in high technology fields. • There are 14 operational TDZ’s and 8 new TDZ’s which have been approved for construction.
ADVANTAGES OF TDZ’s • Offices ready to rent and infrastructure facilities provided. • Profits derived from software and R&D activities are exempt from income and corporate taxes until December 31, 2013. • Deliveries of application software produced exclusively in TDZ’s are exempt from VAT until December 31, 2013. Examples include software for systems management, data management, business applications, different business sectors, Internet, mobile phones and military command control. • Wages of researchers, software and R&D personnel employed in the zone are exempt from all taxes until December 31, 2013. • A VAT exemption during the exemption period of income and corporate taxes is provided for IT specific sectors. • Exemption from customs and duties as well as fund levies. • Academic staff is encouraged to establish companies, participate in a recognized company or join its executive boards as well as conduct research in the zones.

16
2. ORGANIZED INDUSTRIAL ZONES Organized Industrial Zones are designed in a way that allow companies which provide goods and services to operate within approved boundaries with the necessary infrastructure, techno parks and social facilities. • The infrastructure provided in the zones includes roads, water, natural gas, electricity, communications, waste treatment and other services. • There are 93 OIZ’s in 81 provinces with a completed infrastructure. Another 151 OIZ’s are currently under construction throughout Turkey. Number of Organized Industrial Zones in Turkey: Marmara Region (57) Aegean Region (44) Mediterranean Region (17) Central Anatolia Region (42) Black Sea Region (33) Eastern Anatolia Region (20) South Eastern Anatolia Region (13) ADVANTAGES OF OIZ’s have in 54 PRIORITIZED PROVINCES Investors operating in the zones located in 54 selected provinces benefit from the following advantages: • 100% exemption from income tax for employed workers. • 100% exemption from the employer’s share of social security costs. • Free land allocation. • Up to 50% support for electricity costs. • Exemption from real estate tax, waste water charges, building construction duties and the use-of-building. Province List: Provinces with active OIZ’s Adana, Adiyaman, Afyon, Amasya, Ankara, Antalya, Aydın, Balikesir, Bartin, Bayburt, Bilecik, Bolu, Burdur, Bursa, Canakkale, Cankiri, Corum, Denizli, Duzce, Elazıg, Erzincan, Erzurum, Eskisehir, Gaziantep, Hatay, Isparta, Istanbul, Izmir, Karaman, Karabuk, Kars, Kayseri, Kirikkale, Kirklareli, Kirşehir, Kilis, Kocaeli, Konya, Kütahya, Malatya, Manisa, Mardin, Mersin, Niğde, Ordu, Osmaniye, Samsun, Sinop, Sivas, Sanliurfa, Tekirdag, Tokat, Trabzon, Tunceli, Usak, Yozgat, Zonguldak, Van
3. INDUSTRIAL ZONES • Industrial Zones are designed to provide sites suitable for large scale and technology intensive investments. • The Council of Ministers approves the Industrial Zones after the evaluation of the investment sites by the Ministry of Industry and Trade. • The investments carried out in an Industrial Zone should be in a high technology sector and have an investment site of a minimum of 1,500 m2. • Industrial Zones benefit from all of the same advantages provided to OIZ’s.
17
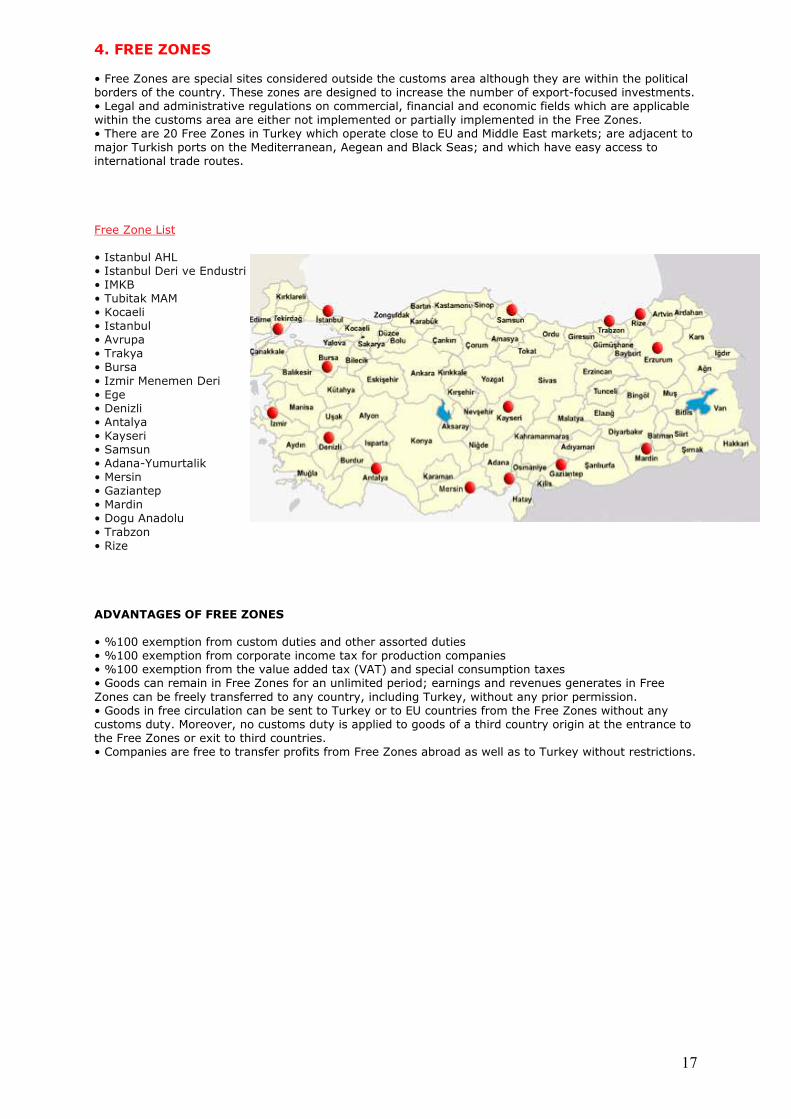
4. FREE ZONES • Free Zones are special sites considered outside the customs area although they are within the political borders of the country. These zones are designed to increase the number of export-focused investments. • Legal and administrative regulations on commercial, financial and economic fields which are applicable within the customs area are either not implemented or partially implemented in the Free Zones. • There are 20 Free Zones in Turkey which operate close to EU and Middle East markets; are adjacent to major Turkish ports on the Mediterranean, Aegean and Black Seas; and which have easy access to international trade routes. Free Zone List • Istanbul AHL • Istanbul Deri ve Endustri • IMKB • Tubitak MAM • Kocaeli • Istanbul • Avrupa • Trakya • Bursa • Izmir Menemen Deri • Ege • Denizli • Antalya • Kayseri • Samsun • Adana-Yumurtalik • Mersin • Gaziantep • Mardin • Dogu Anadolu • Trabzon • Rize ADVANTAGES OF FREE ZONES • %100 exemption from custom duties and other assorted duties • %100 exemption from corporate income tax for production companies • %100 exemption from the value added tax (VAT) and special consumption taxes • Goods can remain in Free Zones for an unlimited period; earnings and revenues generates in Free Zones can be freely transferred to any country, including Turkey, without any prior permission. • Goods in free circulation can be sent to Turkey or to EU countries from the Free Zones without any customs duty. Moreover, no customs duty is applied to goods of a third country origin at the entrance to the Free Zones or exit to third countries. • Companies are free to transfer profits from Free Zones abroad as well as to Turkey without restrictions.

18
Demography and Labor Force
1. DEMOGRAPHY
Turkey is located in the GMT+2 time zone, which allows it to communicate with countries from both west
and east in the same working day.
783,562.38 km2
Turkey’s 783,562.38 km2 of land is divided in 7 geographic regions, namely the Marmara, Aegean,
Mediterranean, South East Anatolian, East Anatolian, Central Anatolian and Black Sea. The country is
surrounded by 4 seas: Mediterranean, Aegean, Marmara and Black Sea.
70 MILLION
Turkey has a total population of 70 million, of which 24.6 million people are active in the labor force.
Demographic Structure
Average Age 29
0-14 years 24.9%
15-64 years 68.1%
65 years and over 6.9% (2007 est.)
Population growth rate
1.04% (2007 est.)
Life expectancy at birth
total population 72.88 years
male 70.43 years
female 75.46 years (2007 est.)
Source : TURKSTAT

19
Gender Ratios
At Birth 1.05 m/f
0 – 14 1.038 m/f
15 - 64 1.032 m/f
65 + 0.84 m/f
Total Population 1.019 m/f
Source : www.indexmundi.com
Population Age
0 – 14 24.9% (m 9.03 million / f 8.7 million)
15 - 64 68.1% (m 24.6 million / f 23.8 million)
65 + 6.9% (m 2.2 million / f 2.6 million)
Source : www.indexmundi.com
2. LABOR FORCE
Turkey offers investors a young, talented, motivated and skilled workforce composed of 24.6 million
people, approximately 35% of the total population. This skilled labor force is capable of meeting the
needs of the globally integrated and highly diversified Turkish economy.
Turkey’s young population is an important source for labor force growth and has helped Turkey to rank
highest among its competitors .

20
The distribution of the workforce among many diverse sectors reflects the wealth of the opportunities
offered to investors.
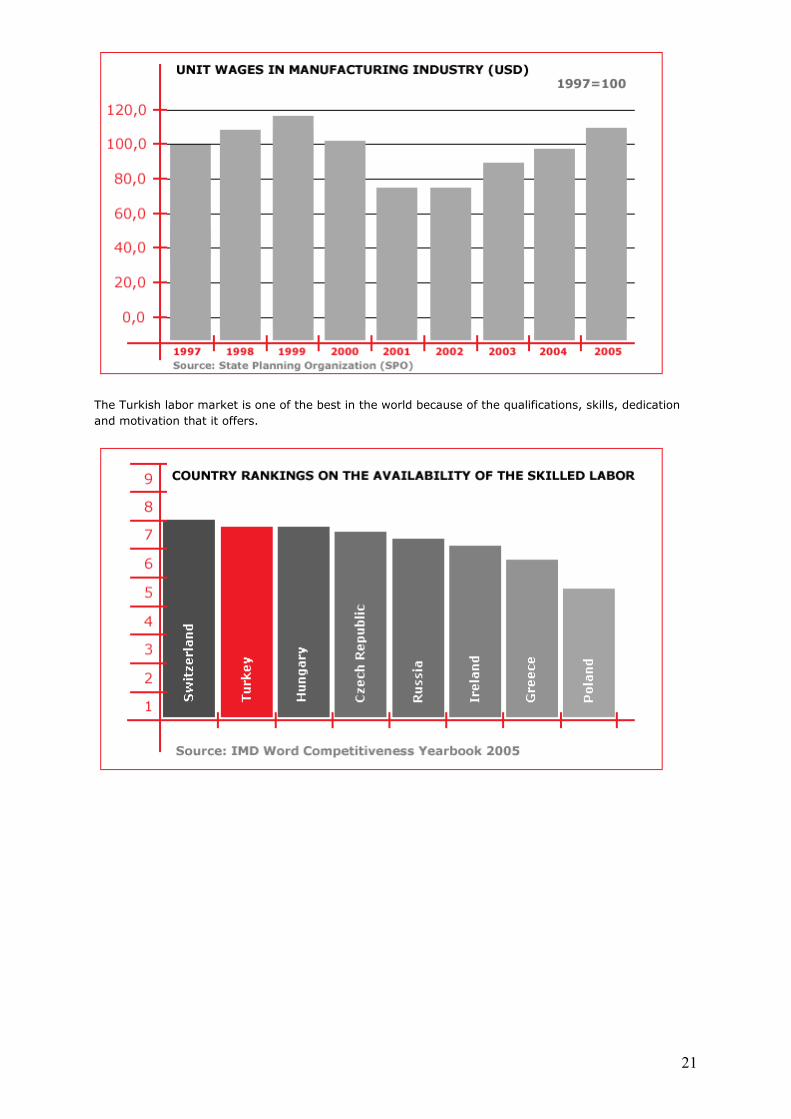
Labor costs in Turkey are very competitive and wages have remained quite stable. As it can be seen from
the table below, the unit wage manufacturing index is still below the 1997 level.
21
The Turkish labor market is one of the best in the world because of the qualifications, skills, dedication
and motivation that it offers.
22
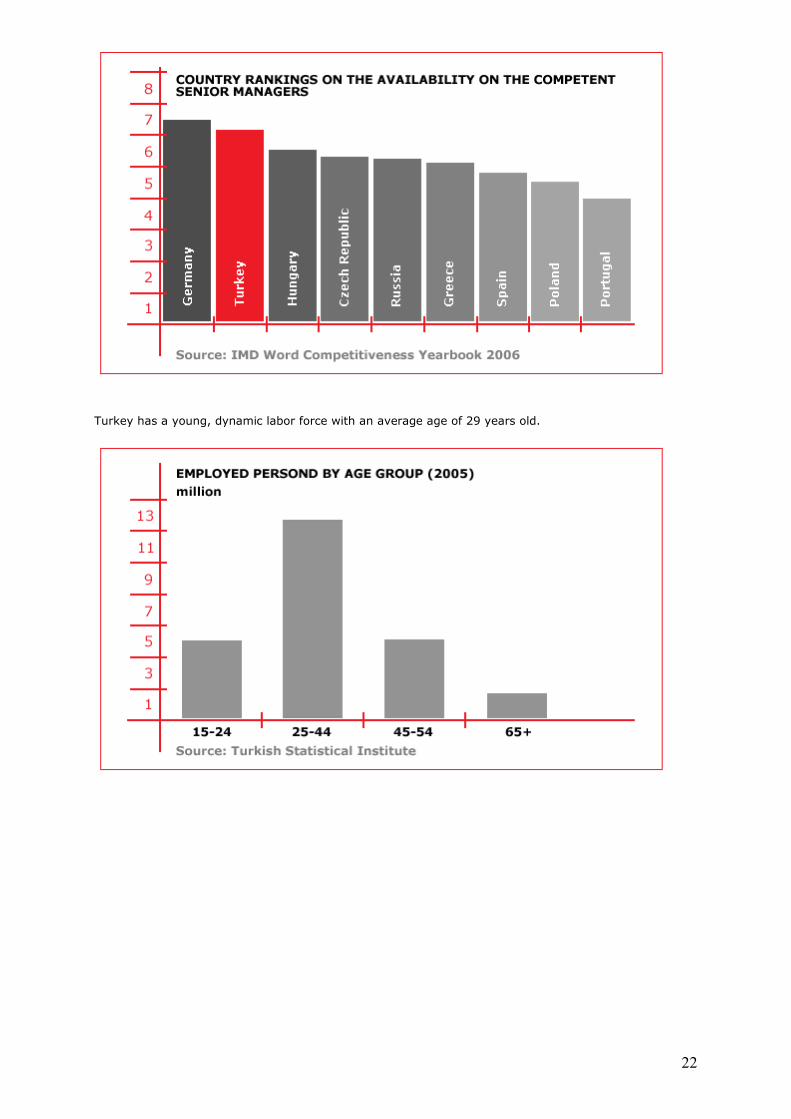
Turkey has a young, dynamic labor force with an average age of 29 years old.

23
A strong work ethic is an important component of the Turkish work culture. The workplace as an
institution is cherished in Turkey because it allows individuals to utilize their skills and to work towards
self advancement. The labor force’s dedication to work is shown via Turkey’s high productivity, low
absenteeism and its top ranked position among working hour rates per year.
EDUCATION At the end of every academic year, nearly 400,000 graduates from 115 universities in Turkey join the labor market. Moreover, about 250,000 students graduate every year from 4,244 vocational and professional high schools; an additional 400,000 students graduate from 3,690 high schools in Turkey. All things considered, Turkey has a labor market which continues to improve dramatically every year, both in quantity and quality.
24
Business Environment
AUTONOMOUS BODIES
Autonomous Bodies are established in order to regulate and monitor different types of markets in
accordance with the requirements of a functioning market economy. The Bodies have both administrative
and fiscal independency. Some of the important entities in Turkey are the Competition Authority, the
Energy Market Regulation Authority, the Banking Regulation and Supervision Authority;
Telecommunication Authority and the Tobacco, Tobacco Products and Alcoholic Beverages Market
Regulation Board.
1. Competition Authority
Competition Authority (CA) is responsible for the full achievement of competition in the markets. Main
responsibilities and powers of the Competition Authority are:
a. To carry out, the examination, inquiry and investigation into activities and official transactions defined
in Competition Code upon application or upon its own initiative; to take the necessary measures to
expunge infringements of the Code; and to impose administrative regulations
b. To evaluate the requests for exemption and to grant an exemption certificate to the appropriate
agreements which may distort competition,
c. To constantly follow the markets to which exemption decisions and negative clearance certificates are
related, and to re-evaluate the applications of those in case changes are established in these markets or
in the positions of the parties
d. To evaluate mergers and acquisition activities and approve them according to determined criteria
www.rekabet.gov.tr
2. Energy Market Regulation Authority
Energy Market Regulation Authority (EMRA) regulates and controls the energy market. The Authority
ensures its independent duties in order to provide sufficient energy sources to consumers at high quality
and at low cost, in a reliable and environmentally friendly manner. The main responsibilities of Energy
Market Regulation Authority are:
a) To regulate and monitor the Electricity, Natural Gas, Petroleum and Liquid Petroleum Gas markets,
b) To establish a financially viable, stable and transparent energy market within a competitive
environment.
www.epdk.gov.tr
3. Banking Regulation and Supervision Agency
Banking Regulation and Supervision Agency (BRSA) safeguards the rights and benefits of depositors;
prevents all kinds of operations and transactions that may risk the orderly and safe operation of banks or
that may harm the economy; facilitates the efficient working of the credit system. The main goals of the
Agency are as follows:

25
a) To enhance the efficiency of the banking sector and its competitiveness
b) To maintain confidence in the banking sector
c) To minimize potential negative effects of banking sector on economy
d) To improve the stability of the banking sector
e) To protect the rights of depositors.
www.bddk.org.tr
4. Telecommunication Authority
Telecommunication Authority undertakes the regulation, the authorization, the reconciliation and the
supervision of activities within the telecommunication market. The main responsibilities of the Authority
are:
a) To prepare the required plans in the telecommunications area and present them to the Ministry of
Transportation,
b) To observe the developments in technology of the telecommunications area in cooperation with the
universities and private establishments,
c) To observe, control, examine and evaluate the telecommunication implementations,
d) To give opinions on the concession contracts to be signed for telecommunication services and/or
infrastructure,
e) To define the general criteria on price tariffs, contract provisions and technical issues to be
implemented for the users of the telecommunication services and infrastructure, and other operators for
their use of interconnections between the telecommunication networks,
f) To define and implement the performance standards considered as a basis for telecommunication
items,
g) To take the required measures to protect the consumer rights.
www.tk.gov.tr
5. Tobacco, Tobacco Products and Alcoholic Beverages Market Regulation Board
Tobacco, Tobacco Products and Alcoholic Beverages Market Regulation Board(TAMRB) establishes
regulatory and supervisory systems in areas dealing with tobacco, tobacco products, alcohol and
alcoholic drinks. The main responsibilities of the Board are as follows:
a) Regulation and supervision of tobacco production; granting of permission for the import of tobacco
seeds; issuing of authorization to trade in tobacco; regulating, monitoring, and supervising tobacco
producers on the basis of a written contract; and buying and selling of tobacco products by public
auctions
b) Granting permissions for setting up tobacco processing plants, controlling their production,
movements, handovers, and closures; monitoring of tobacco stocks and warehouses; and the granting of
compatibility permissions to tobacco warehouses
c) Supervision of companies operating within the sector
d) The granting of production permits, sales permits as well as granting permission to establish factories
aimed at producing tobacco products
e) Regulating the market in Ethyl Alcohol, Methanol, Distilled Alcoholic Drinks, and Fermented Alcoholic
Drinks; preparing national regulation policies; and harmonizing with the EU regulations
www.tapdk.gov.tr
6. Privatization Authority
Privatization Authority does not show the main characteristics of the above mentioned market regulating
autonomous agencies. However, as an independent administrative body fully responsible for privatization
in Turkey, it has a very high importance for the direct investors. The Privatization High Council and
Privatization Administration are responsible for carrying out privatization transactions in Turkey. The
main responsibilities of the Authority are:
a) To decide which enterprises meet the criteria for inclusion in the privatization process,
b) To prepare enterprises for privatization in both fiscal and legal matters,
c) To determine a timeline for the completion of privatization procedures,
d) To prepare the privatization process of enterprises which have been deemed suitable,
e) To decide on the privatization methods required for selected enterprises,
f) To decide on scaling down methods for enterprises that are already in the process of privatization,

26
g) To conclude the activities of enterprises either temporarily or permanently, which are already in the
process of privatization,
h) To make a decision about the possible liquidation of companies in the privatization process.
www.oib.gov.tr
ENVIRONMENTAL STANDARDS
Turkey's policies regarding environmental protection and development are based on the harmonization of
policies and solutions with both EU and international standards, reinforcement of existing legislation,
improvement of environmental management, prevention of pollution and increasing awareness of
environmental issues.
Turkey participates in 76 international agreements concerning environmental protection and
management as well as 25 bilateral agreements.
On January 28, 2003, the Republic of Turkey ratified an act between Turkey and European Union
countries regarding Turkey's participation in the European Environment Agency and the European
Information and Observation Network. Furthermore, most of the legislation on the environment has
already been harmonized with the exception of certain legislation that is at the last stage of full
harmonization with the EU law.
TURKISH LABOR MARKET
Turkey has been a member of the International Labor Organization (ILO) since 1932. Since it became a
member, Turkey has approved 56 ILO Agreements. Moreover, Turkey has signed Bilateral Social Security
Agreements with 22 countries.
According to the Turkish Constitution, the State is responsible for creating a suitable environment to
prevent unemployment and to provide a peaceful labor environment.
The minimum wage is to be determined annually by the Ministry of Labor and Social Security. According
to the Social Insurance Code, the social security services for employees are handled by the Social
Insurance Agency. Recently, the Social Security Agency has been reorganized with the ultimate goals of
consolidating all Social Security and Social Support Organizations into one single body; standardizing
the regulations and principles of all social security institutions; and keeping track of the fiscal position
and financial records of the institutions.
Is-Kur, a governmental body, is responsible for the domestic and international matching of jobs with
employees; carrying out workforce planning; as well as safeguarding and developing employment. There
is a large amount of private employment agencies in the market working effectively with employees and
employers. It is also possible to find employment and employees via private employment agencies.
EMPLOYMENT OF EXPATRIATES
1. How to get a work permit in Turkey
Expatriates are required to obtain a work permit before they start to work dependently or independently
in Turkey.
The Ministry of Labor and Social Security is responsible for:
• Processing the applications of companies that wish to employ expatriates
• Issuing work permits for expatriates
• Extending and/or restricting the term of work permits in accordance with the relevant legislation

27
Applications for work permits can be made both inside and outside of Turkey:
• Expatriates residing outside of Turkey need to apply to the relevant Turkish Consulate in either their
residential country or their country of citizenship
• Expatriates with valid residence permits (a minimum 6 month period, with the exception of residence
permits for educational purposes) can apply directly to the Ministry of Labor and Social Security
Other legal procedures regarding work permits are as follows:
• A work permit is valid only when a work visa and/or residence permit is also granted
• Applications are processed and answered within a fixed 90 day period by the Ministry. For key
personnel of large foreign direct investors, this period is at most 15 days
2. Main categories of work permits
Work permits are divided into 4 categories:
• Dependent work permits for a definite period of time
• Dependent work permits for an indefinite period of time
• Independent work permits
• Exceptional work permits
Exceptional work permits can be granted under certain conditions stipulated in Law. This type of work
permit can be issued to an expatriate living in Turkey who is married to a Turkish citizen, to one who will
temporarily come to Turkey with the aim of scientific and/or cultural activities, or to one employed by
ministries, public authorities or other similar organizations.
RESEARCH AND DEVELOPMENT ACTIVITIES
1. TUBITAK
In Turkey, public institutions and universities play an important role in R&D activities. The Scientific and
Technological Research Council of Turkey is the public agency in charge of promoting, developing,
organizing, conducting and coordinating research and development in different fields of natural sciences.
This research is in line with the national targets for economical development and technical progress. The
Council also makes important contributions to the relations between universities and industries.
The institution provides certain incentives in order to increase the scientific and technological
competitiveness of Turkey; develop methods to rapidly transform scientific research into technological
innovations; and provide an active contribution from the private sector into research and development.
www.tubitak.gov.tr
2. TTGV
The Turkish Technology Development Foundation was set up to raise the industrial sector's awareness of
R&D and to support technological development projects in the Turkish Industry through the funds
provided by the Under Secretariat of Treasury from the resources of the World Bank. This Foundation
continues its activities as a successful example of Private and Public Sector cooperation. In this respect,
the Foundation promotes the R&D activities of the industrial sector; contributes to the creation of the
necessary infrastructure for technology to produce a commercial and marketable product, system or
service; provides financial support; and undertakes studies aimed at improving the legislative and
institutional framework for R&D.
www.ttgv.org.tr/

28
3. KOSGEB Another institution, which conducts R&D research in Turkey, is the Small and Medium-sized Industry Development Organization (SMSIDO - KOSGEB). KOSGEB is focused on helping small and medium-sized industrial companies to adapt quickly to technological innovations; increasing their competitiveness and contributions to the economy; as well as improving their efficiency. www.kosgeb.gov.tr
29
Infrastructure
ENERGY INFRASTRUCTURE
1. ENERGY STRATEGY:
• Turkey’s strategy in the energy sector is to supply security and higher service quality to the consumer.
• In addition to unused energy resources such as hydrologic and lignite, Turkey’s renewable energy
potential is a great opportunity for investors. The new law which supports renewable energy encourages
these types of investment and makes them even more attractive.
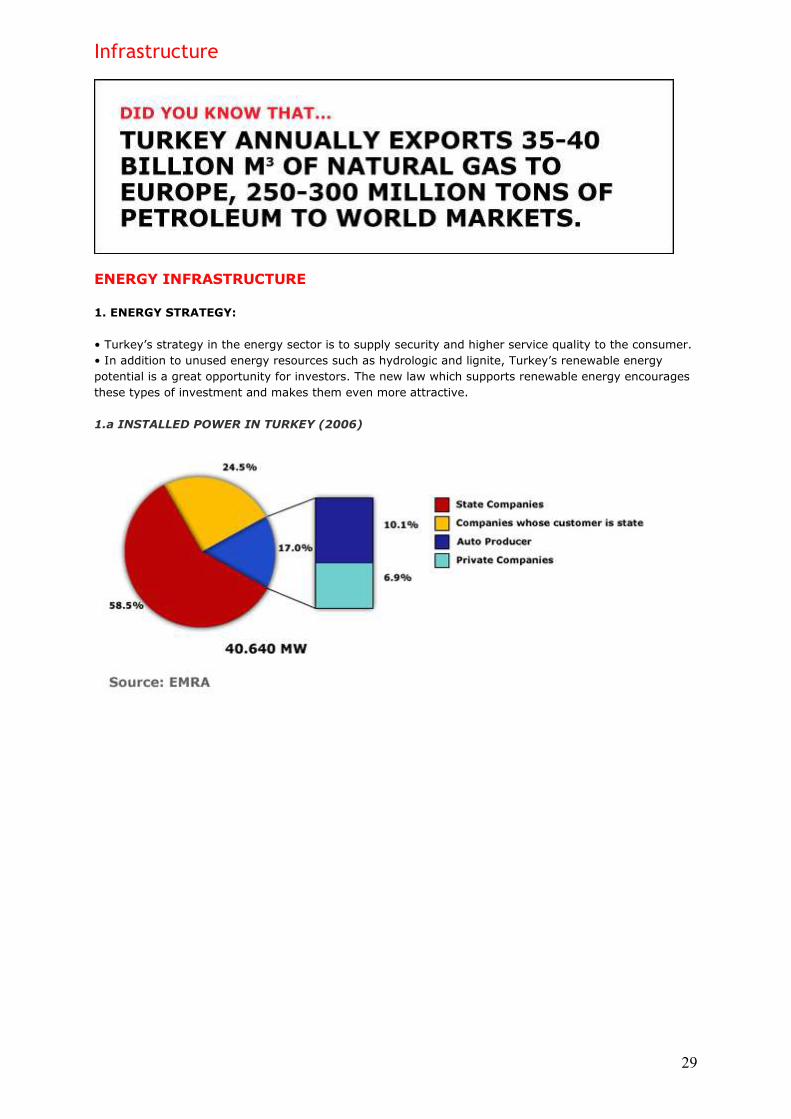
1.a INSTALLED POWER IN TURKEY (2006)

30
1.b RESOURCES USED TO PRODUCING ENERGY (2006)
1.c COMPARISON OF ELECTRICITY PRICES FOR INDUSTRIAL USERS (2006)
Energy prices in Turkey, presently at 8.32 €¢/kWh, are very competitive with respect to the global
market.
(Source: EMRA)
31
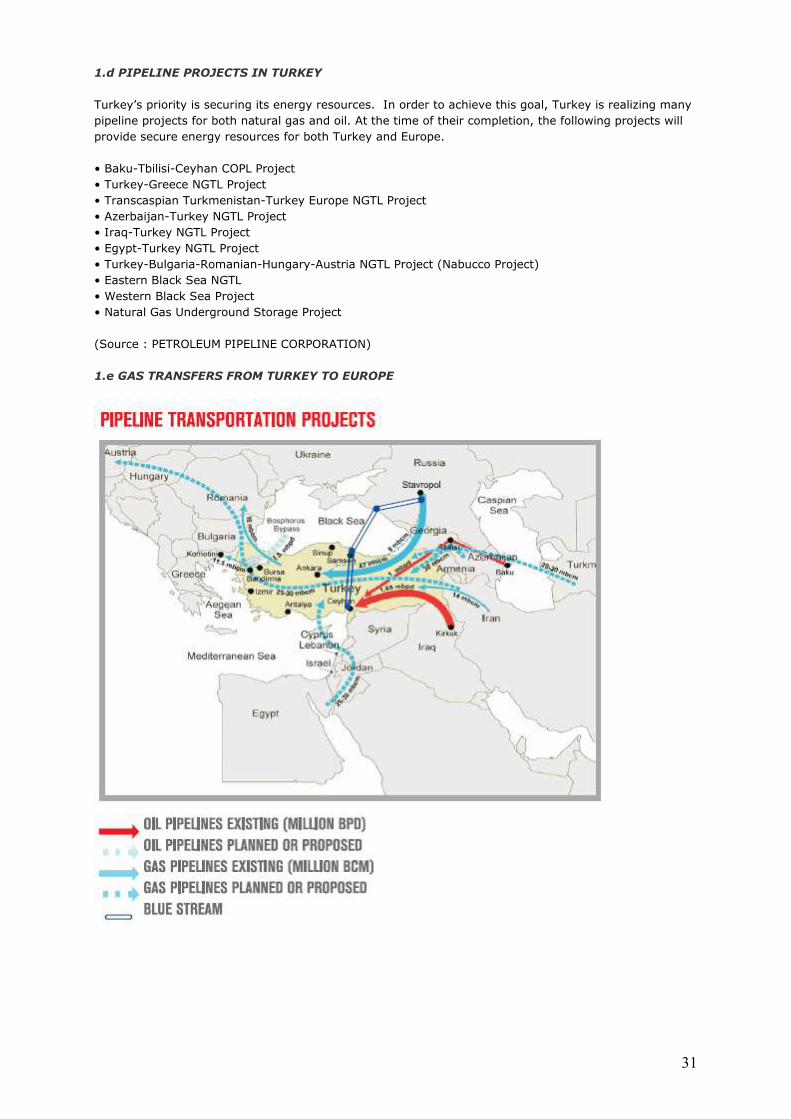
1.d PIPELINE PROJECTS IN TURKEY
Turkey’s priority is securing its energy resources. In order to achieve this goal, Turkey is realizing many
pipeline projects for both natural gas and oil. At the time of their completion, the following projects will
provide secure energy resources for both Turkey and Europe.
• Baku-Tbilisi-Ceyhan COPL Project
• Turkey-Greece NGTL Project
• Transcaspian Turkmenistan-Turkey Europe NGTL Project
• Azerbaijan-Turkey NGTL Project
• Iraq-Turkey NGTL Project
• Egypt-Turkey NGTL Project
• Turkey-Bulgaria-Romanian-Hungary-Austria NGTL Project (Nabucco Project)
• Eastern Black Sea NGTL
• Western Black Sea Project
• Natural Gas Underground Storage Project
(Source : PETROLEUM PIPELINE CORPORATION)
1.e GAS TRANSFERS FROM TURKEY TO EUROPE

32
2. Telecommunications Infrastructure
Telecommunications Infrastructure - 2006
Mobile Telephone Subscribers 54.7 mil
Public Telephone Switched Users 18.8 mil
Internet Users 18.0 mil
Broadband Subscribers 3.5 mil
Source: Telecommunications Authority - Turk Telekom A.Ş
The Telecommunication sector in Turkey has evolved considerably in recent years and began with the
privatization of 55% of Turk Telekom stock. The diversification of services within the telecommunication
sector via mobile phones and the internet has created new economies which are attractive as areas for
further investment.
3. Transportation Infrastructure
The proximity Turkey has to major markets such as CIS, the Middle East and North Africa means that 1.2
billion consumers can be easily reached.
Turkey’s advantages also include its logistics industry which has developed significantly since its entry
into the EU Customs Union. Its geographic, physical and corporate infrastructure is one of the key
attractions for potential investors.
Transportation Infrastructure
Number of Passengers
Internal Flights 28.8 mil
External Flights 32.8 mil
Number of Airports
Rail Way 10.948 km
Sea Way 243.5 million tons/year
Source: Ministry of Transportation - 2006
Turkey meets all the requirements for the efficient and cost effective shipment of goods with its high performance structure, reliable and on-time transportation services and its strategic location in the region.

33
Quantities by Transportation Type
DETAILED QUANTITIES BY TRANSPORTATION TYPE
2004 2005 2006
QUANTITY (tons) VALUE $
QUANTITY (tons) VALUE $
QUANTITY (tons) VALUE $
000. TON % 000. $ % 000. TON % 000. $ % 000. TON % 000. $ %
SEA TRANSPORT 150.453,0 86,4 80.876.384,0 50,4 159.221,0 86,1 102.167.289,0 53,8 178.079,0 87,6 122.747.456,0 55,3
RAILWAY TRANSPORT 2,1 1,2 1.845.728,0 1,1 2.168,0 1,2 2.573.457,0 1,4 2.162,0 1,1 3.086.501,0 1,4
ROAD TRANSPORT 19.790,0 11,4 58.234.461,0 36,3 21.845,0 11,8 60.271.018,0 31,8 21.165,0 10,4 67.415.308,0 30,4
AIRWAY TRANSPORT 237,0 0,1 16.201.418,0 10,1 275,0 0,1 17.050.735,0 9,0 275,0 0,1 18.332.136,0 8,3
OTHERS 1.648,0 0,9 3.466.590,0 2,2 1.431,0 0,8 7.719.220,0 4,1 1.705,0 0,8 10.362.749,0 4,7
TOTAL 172.130,1 100,0 160.624.581,0 100,0 184.940,0 100,0 189.781.719,0 100,0 203.386,0 100,0 221.944.150,0 100,0
Source. TURKSTAT
The national road and railway network are completely integrated into the Eurasian infrastructure. The Silk Road connection project will ensure a uniform railway connection between Europe, the Middle East, the Turkic Republics and the Far East throughout Turkey. Regular truck transportation and Ro-Ro ferry routes are continuing to increase logistic services capacity.

34
Economic Outlook
Fiscal discipline and a tight fiscal policy continue to be the main pillars of Turkey’s economic program and have contributed a great deal to disinflation as well as to a strong growth performance. In addition to the sound macroeconomic policies, Turkey has implemented a comprehensive and far-reaching structural reform agenda. Compared with the experiences of other countries, Turkey’s success has been remarkable primarily because of the speed with which it has conducted structural and institutional changes. Indeed, Turkey has made large strides in restructuring its financial sector as well as improving public sector governance and its business environment.
1. MACROECONOMIC INDICATORS
The Turkish economy has had a steady growth rate for the last 20 quarters. GNP and GNP per capita
figures highlight the strength and the stability of the national economy as well as its integration to
macroeconomic global trends.
GNP (Current
price in billions
of USD)
GNP Per Capita
(Current Price in
USD)
Growth
(Real)
(%)
2007 ( I. Period) 91.8 6.7
2006 399.7 5,477 6.0
2005 360.9 5,008 7.6
2004 299.5 4,172 9.9
2003 239.2 3,383 5.9
2002 180.9 2,598 7.9
2001 145.7 2,123 -9.5
2000 200.0 2,965 6.3
1999 185.3 2,879 -6.1
1998 206.5 3,255 3.9
1997 192.4 3,079 8.3
Source: Turkish Statistical Institution (TURKSTAT)
35
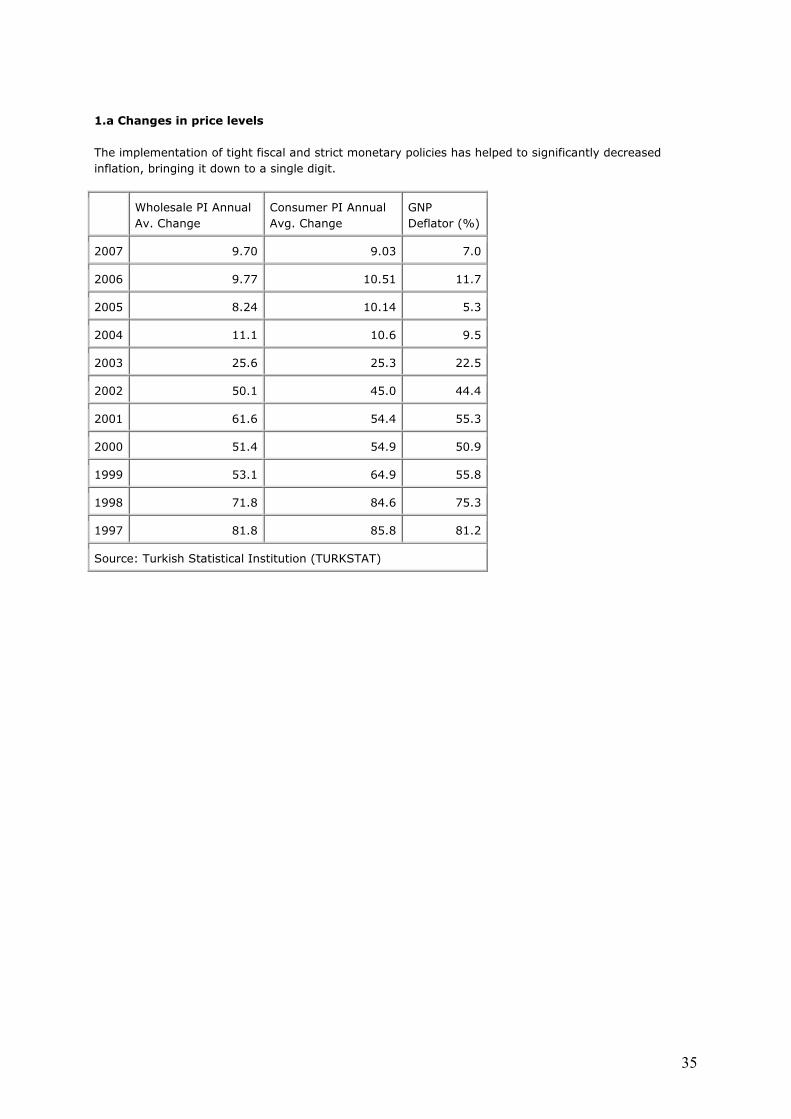
1.a Changes in price levels
The implementation of tight fiscal and strict monetary policies has helped to significantly decreased
inflation, bringing it down to a single digit.
Wholesale PI Annual
Av. Change
Consumer PI Annual
Avg. Change
GNP
Deflator (%)
2007 9.70 9.03 7.0
2006 9.77 10.51 11.7
2005 8.24 10.14 5.3
2004 11.1 10.6 9.5
2003 25.6 25.3 22.5
2002 50.1 45.0 44.4
2001 61.6 54.4 55.3
2000 51.4 54.9 50.9
1999 53.1 64.9 55.8
1998 71.8 84.6 75.3
1997 81.8 85.8 81.2
Source: Turkish Statistical Institution (TURKSTAT)
36
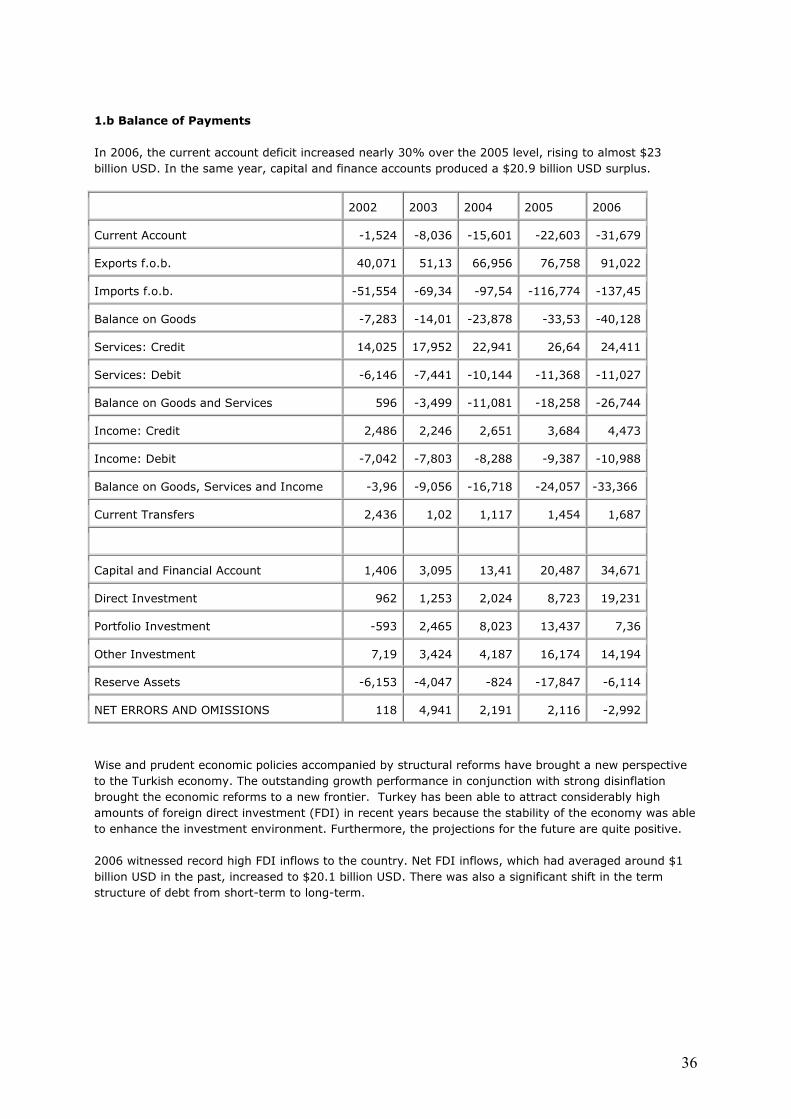
1.b Balance of Payments
In 2006, the current account deficit increased nearly 30% over the 2005 level, rising to almost $23
billion USD. In the same year, capital and finance accounts produced a $20.9 billion USD surplus.
2002 2003 2004 2005 2006
Current Account -1,524 -8,036 -15,601 -22,603 -31,679
Exports f.o.b. 40,071 51,13 66,956 76,758 91,022
Imports f.o.b. -51,554 -69,34 -97,54 -116,774 -137,45
Balance on Goods -7,283 -14,01 -23,878 -33,53 -40,128
Services: Credit 14,025 17,952 22,941 26,64 24,411
Services: Debit -6,146 -7,441 -10,144 -11,368 -11,027
Balance on Goods and Services 596 -3,499 -11,081 -18,258 -26,744
Income: Credit 2,486 2,246 2,651 3,684 4,473
Income: Debit -7,042 -7,803 -8,288 -9,387 -10,988
Balance on Goods, Services and Income -3,96 -9,056 -16,718 -24,057 -33,366
Current Transfers 2,436 1,02 1,117 1,454 1,687
Capital and Financial Account 1,406 3,095 13,41 20,487 34,671
Direct Investment 962 1,253 2,024 8,723 19,231
Portfolio Investment -593 2,465 8,023 13,437 7,36
Other Investment 7,19 3,424 4,187 16,174 14,194
Reserve Assets -6,153 -4,047 -824 -17,847 -6,114
NET ERRORS AND OMISSIONS 118 4,941 2,191 2,116 -2,992
Wise and prudent economic policies accompanied by structural reforms have brought a new perspective
to the Turkish economy. The outstanding growth performance in conjunction with strong disinflation
brought the economic reforms to a new frontier. Turkey has been able to attract considerably high
amounts of foreign direct investment (FDI) in recent years because the stability of the economy was able
to enhance the investment environment. Furthermore, the projections for the future are quite positive.
2006 witnessed record high FDI inflows to the country. Net FDI inflows, which had averaged around $1
billion USD in the past, increased to $20.1 billion USD. There was also a significant shift in the term
structure of debt from short-term to long-term.
37
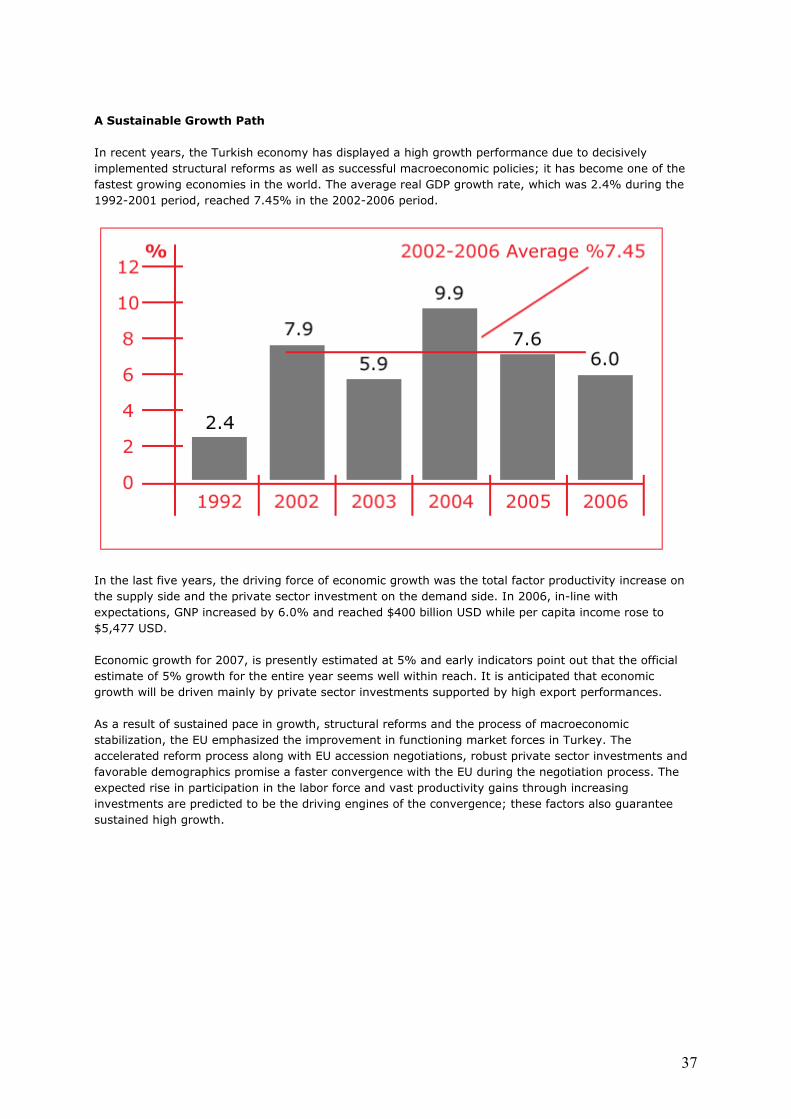
A Sustainable Growth Path
In recent years, the Turkish economy has displayed a high growth performance due to decisively
implemented structural reforms as well as successful macroeconomic policies; it has become one of the
fastest growing economies in the world. The average real GDP growth rate, which was 2.4% during the
1992-2001 period, reached 7.45% in the 2002-2006 period.
In the last five years, the driving force of economic growth was the total factor productivity increase on
the supply side and the private sector investment on the demand side. In 2006, in-line with
expectations, GNP increased by 6.0% and reached $400 billion USD while per capita income rose to
$5,477 USD.
Economic growth for 2007, is presently estimated at 5% and early indicators point out that the official
estimate of 5% growth for the entire year seems well within reach. It is anticipated that economic
growth will be driven mainly by private sector investments supported by high export performances.
As a result of sustained pace in growth, structural reforms and the process of macroeconomic
stabilization, the EU emphasized the improvement in functioning market forces in Turkey. The
accelerated reform process along with EU accession negotiations, robust private sector investments and
favorable demographics promise a faster convergence with the EU during the negotiation process. The
expected rise in participation in the labor force and vast productivity gains through increasing
investments are predicted to be the driving engines of the convergence; these factors also guarantee
sustained high growth.

38
Declining Inflation...
One of the most striking aspects of the recent performance of the Turkish economy has been the
substantial decline in inflation in a strong growth environment with soaring energy prices. Annual
inflation rate declined from a level near 70% at the beginning of 2002 to 7.5% in October 2005, the
lowest level in 35 years. To further support disinflation, the Central Bank of Turkey shifted to formal
inflation targeting in 2006. The 2007 end-year CPI target was determined at 5% with a 2 percentage
point uncertainty range around this target.
Prudent Fiscal Policy
Fiscal discipline continues to be the cornerstone of the macroeconomic performance of the Turkish
economy. By sustaining historically high levels of total public sector primary surpluses over GNP,
averaging more than 6.5% annually for the past four years, Turkey reduced its debt stock and positively
affected the expectations of the market towards a stable economic growth environment and low inflation
rate.

39
Looking at External Accounts...
The 2006 current account deficit was realized at 7.9% of GNP. The current account deficit was easily
financed in 2006 and the share of long term and non-debt creating capital inflows demonstrated an
increasing trend. The FDI inflows reached $20.1 billion USD in 2006, the highest ever in Turkish
economic history. The receipts from FDI are expected to continue in future years with the acceleration of
the EU accession process and efforts to improve the investment environment.
The current account deficit in 2007 is projected to decline to about 7% of GNP mainly due to high export
performance, privatization receipts, and rising FDI.
40
In Conclusion
Thanks to prudent fiscal and monetary policies as well as comprehensive structural reforms, economic
fundamentals and balance sheets have strengthened considerably in recent years, making the economy
much more resilient to adverse shocks. In order to move forward, Turkey still faces important
challenges. In this respect, Turkey is determined to continue and to accelerate the structural reforms on
all fronts and transform into a well developed country in every aspect.
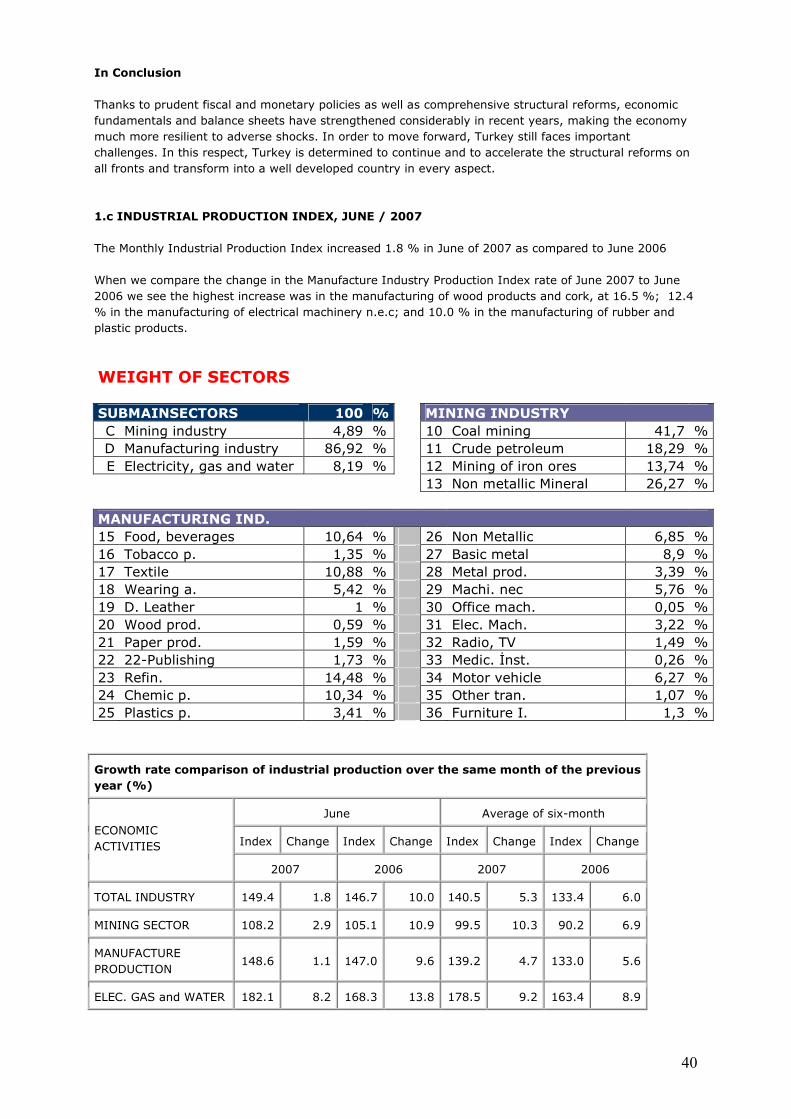
1.c INDUSTRIAL PRODUCTION INDEX, JUNE / 2007
The Monthly Industrial Production Index increased 1.8 % in June of 2007 as compared to June 2006
When we compare the change in the Manufacture Industry Production Index rate of June 2007 to June
2006 we see the highest increase was in the manufacturing of wood products and cork, at 16.5 %; 12.4
% in the manufacturing of electrical machinery n.e.c; and 10.0 % in the manufacturing of rubber and
plastic products.
WEIGHT OF SECTORS SUBMAINSECTORS 100 % MINING INDUSTRY
C Mining industry 4,89 % 10 Coal mining 41,7 % D Manufacturing industry 86,92 % 11 Crude petroleum 18,29 % E Electricity, gas and water 8,19 % 12 Mining of iron ores 13,74 %
13 Non metallic Mineral 26,27 % MANUFACTURING IND.
15 Food, beverages 10,64 % 26 Non Metallic 6,85 % 16 Tobacco p. 1,35 % 27 Basic metal 8,9 % 17 Textile 10,88 % 28 Metal prod. 3,39 % 18 Wearing a. 5,42 % 29 Machi. nec 5,76 % 19 D. Leather 1 % 30 Office mach. 0,05 % 20 Wood prod. 0,59 % 31 Elec. Mach. 3,22 % 21 Paper prod. 1,59 % 32 Radio, TV 1,49 % 22 22-Publishing 1,73 % 33 Medic. Đnst. 0,26 % 23 Refin. 14,48 % 34 Motor vehicle 6,27 % 24 Chemic p. 10,34 % 35 Other tran. 1,07 % 25 Plastics p. 3,41 % 36 Furniture I. 1,3 %
Growth rate comparison of industrial production over the same month of the previous
year (%)
June Average of six-month
Index Change Index Change Index Change Index Change ECONOMIC
ACTIVITIES
2007 2006 2007 2006
TOTAL INDUSTRY 149.4 1.8 146.7 10.0 140.5 5.3 133.4 6.0
MINING SECTOR 108.2 2.9 105.1 10.9 99.5 10.3 90.2 6.9
MANUFACTURE
PRODUCTION 148.6 1.1 147.0 9.6 139.2 4.7 133.0 5.6
ELEC. GAS and WATER 182.1 8.2 168.3 13.8 178.5 9.2 163.4 8.9

41
2.FDI IN TURKEY
2.a. Turkey is the 13th most attractive country in the world for FDI
2.b. International Direct Investment (Inflows)
(Million $of USD)
Jan.-Sept.
2000 2001 2002 2003 2004 2005 2006
2006 2007
International Direct
Investment Total
(Net)
982 3,352 1,133 1,752 2,883 10,029 29,968 13,127 15,334
International Direct
Investment 982 3,352 1,133 754 1,542 8,188 17,046 10,798 13,156
Equity Investment
(Net) 982 3,352 617 737 1,191 8,137 17,038 10,783 12,862
Inflows 1,707 3,374 622 745 1,291 8,538 17,695 11,345 12,921
Liquidation
Outflows -725 -22 -5 -8 -100 -401 -657 -562 -59
Intra Company
Loans* -- -- 516 17 351 51 8 15 294
Real Estate (Net) -- -- -- 998 1,343 1,841 2,922 2,329 2,178
*Loans which companies with foreign capital take from foreign partners
Provisional Data
Source: Central Bank of the Republic of Turkey
42
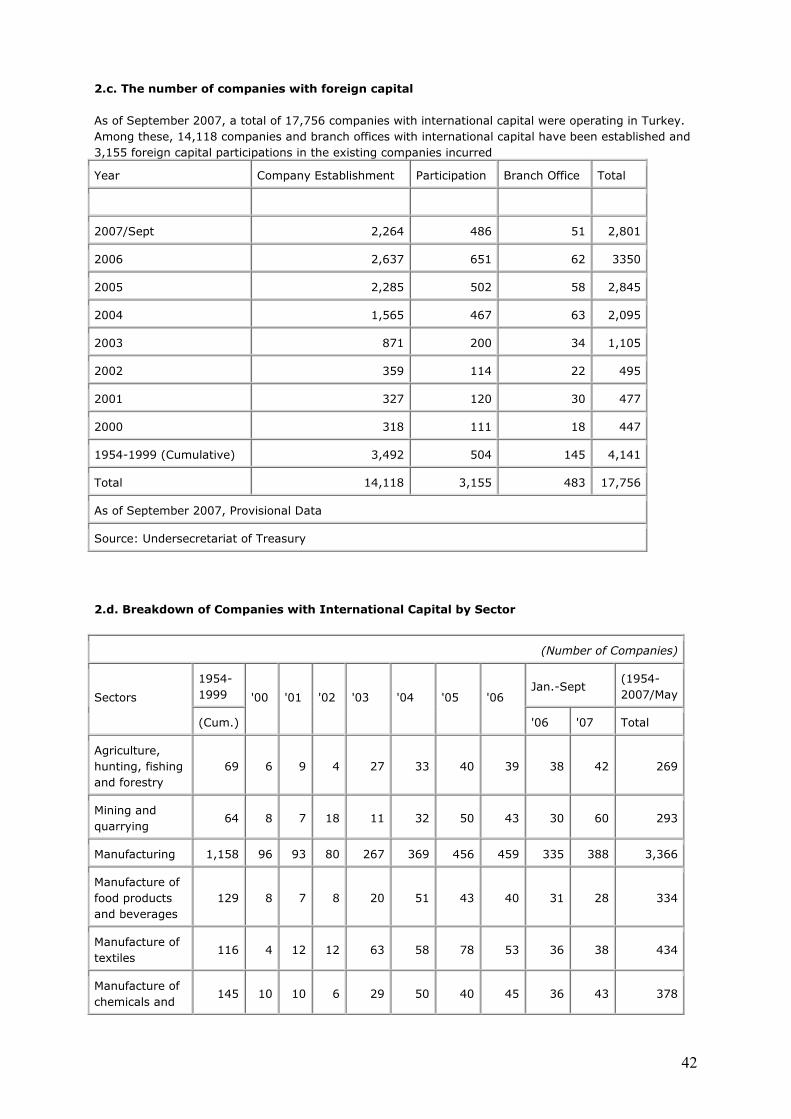
2.c. The number of companies with foreign capital
As of September 2007, a total of 17,756 companies with international capital were operating in Turkey.
Among these, 14,118 companies and branch offices with international capital have been established and
3,155 foreign capital participations in the existing companies incurred
Year Company Establishment Participation Branch Office Total
2007/Sept 2,264 486 51 2,801
2006 2,637 651 62 3350
2005 2,285 502 58 2,845
2004 1,565 467 63 2,095
2003 871 200 34 1,105
2002 359 114 22 495
2001 327 120 30 477
2000 318 111 18 447
1954-1999 (Cumulative) 3,492 504 145 4,141
Total 14,118 3,155 483 17,756
As of September 2007, Provisional Data
Source: Undersecretariat of Treasury
2.d. Breakdown of Companies with International Capital by Sector
(Number of Companies)
1954-
1999 Jan.-Sept
(1954-
2007/May Sectors
(Cum.)
'00 '01 '02 '03 '04 '05 '06
'06 '07 Total
Agriculture,
hunting, fishing
and forestry
69 6 9 4 27 33 40 39 38 42 269
Mining and
quarrying 64 8 7 18 11 32 50 43 30 60 293
Manufacturing 1,158 96 93 80 267 369 456 459 335 388 3,366
Manufacture of
food products
and beverages
129 8 7 8 20 51 43 40 31 28 334
Manufacture of
textiles 116 4 12 12 63 58 78 53 36 38 434
Manufacture of
chemicals and 145 10 10 6 29 50 40 45 36 43 378
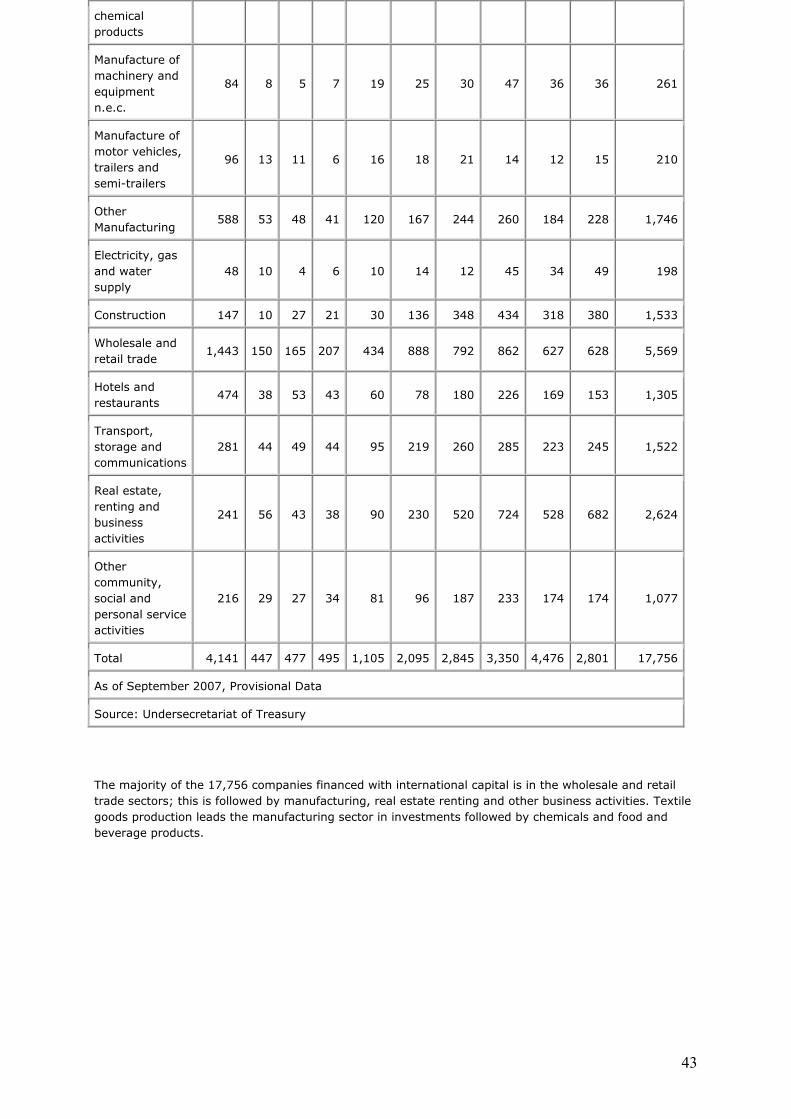
43
chemical
products
Manufacture of
machinery and
equipment
n.e.c.
84 8 5 7 19 25 30 47 36 36 261
Manufacture of
motor vehicles,
trailers and
semi-trailers
96 13 11 6 16 18 21 14 12 15 210
Other
Manufacturing 588 53 48 41 120 167 244 260 184 228 1,746
Electricity, gas
and water
supply
48 10 4 6 10 14 12 45 34 49 198
Construction 147 10 27 21 30 136 348 434 318 380 1,533
Wholesale and
retail trade 1,443 150 165 207 434 888 792 862 627 628 5,569
Hotels and
restaurants 474 38 53 43 60 78 180 226 169 153 1,305
Transport,
storage and
communications
281 44 49 44 95 219 260 285 223 245 1,522
Real estate,
renting and
business
activities
241 56 43 38 90 230 520 724 528 682 2,624
Other
community,
social and
personal service
activities
216 29 27 34 81 96 187 233 174 174 1,077
Total 4,141 447 477 495 1,105 2,095 2,845 3,350 4,476 2,801 17,756
As of September 2007, Provisional Data
Source: Undersecretariat of Treasury
The majority of the 17,756 companies financed with international capital is in the wholesale and retail
trade sectors; this is followed by manufacturing, real estate renting and other business activities. Textile
goods production leads the manufacturing sector in investments followed by chemicals and food and
beverage products.

44
2.e. International Direct Investment Inflow by Sector
During last 5 years, the highest FDI attracting sectors are manufacturing, financial services and energy
fields
(Million $)
Jan.-May Sectors 2002 2003 2004 2005 2006
2006 2007
Agriculture, hunting and forestry -- 1 4 5 5 -- --
Fishing -- -- 2 2 1 -- 3
Mining and quarrying 2 14 75 40 122 76 318
Manufacturing 110 448 214 788 1,868 1,214 2,810
Manufacture of food products and
beverages 14 249 78 68 609 580 255
Manufacture of textiles 10 8 14 183 26 14 187
Manufacture of chemicals and
chemical products 9 9 39 174 602 305 896
Manufacture of machinery and
equipment n.e.c. 13 17 8 13 54 52 24
Office machinery and computers 2 4 2 13 53 41 76
Manufacture of motor vehicles,
trailers and semi-trailers 33 145 35 106 63 46 66
Other Manufacturing 19 14 38 227 461 176 1,306
Electricity, gas and water supply 68 86 69 4 112 111 537
Construction 3 8 23 80 278 161 246
Wholesale and retail trade 89 92 103 68 1,167 1,139 111
Hotels and restaurants 0 4 1 42 23 22 12
Transport, storage and
communications 1 2 639 3,285 6,700 4,887 504
Financial intermediation 260 51 69 4,016 6,957 3,423 7,870
Real estate, renting and business
activities 0 6 3 29 93 58 481
Health and social work 5 23 53 74 265 180 17
Other community, social and personal
service activities 84 10 36 86 104 84 12
Total 622 745 1,291 8,536 17,695 11,345 12,921
Provisional Data Source: Central Bank of the Republic of Turkey
45
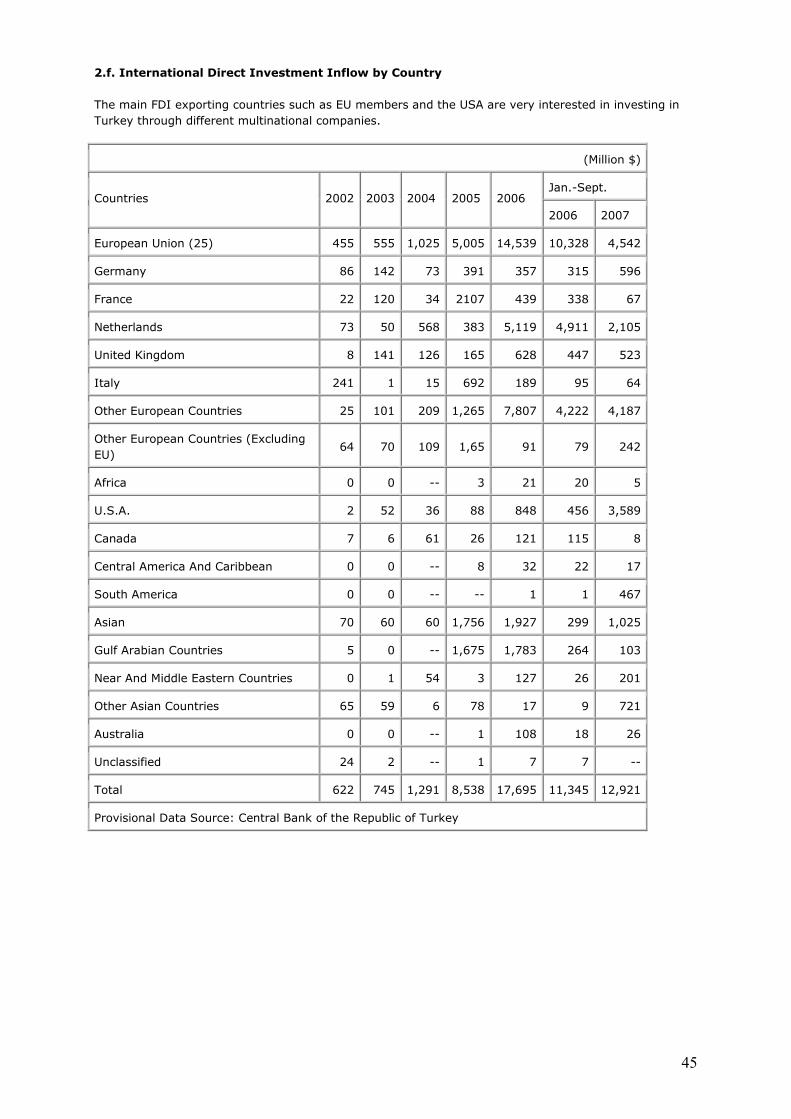
2.f. International Direct Investment Inflow by Country
The main FDI exporting countries such as EU members and the USA are very interested in investing in
Turkey through different multinational companies.
(Million $)
Jan.-Sept. Countries 2002 2003 2004 2005 2006
2006 2007
European Union (25) 455 555 1,025 5,005 14,539 10,328 4,542
Germany 86 142 73 391 357 315 596
France 22 120 34 2107 439 338 67
Netherlands 73 50 568 383 5,119 4,911 2,105
United Kingdom 8 141 126 165 628 447 523
Italy 241 1 15 692 189 95 64
Other European Countries 25 101 209 1,265 7,807 4,222 4,187
Other European Countries (Excluding
EU) 64 70 109 1,65 91 79 242
Africa 0 0 -- 3 21 20 5
U.S.A. 2 52 36 88 848 456 3,589
Canada 7 6 61 26 121 115 8
Central America And Caribbean 0 0 -- 8 32 22 17
South America 0 0 -- -- 1 1 467
Asian 70 60 60 1,756 1,927 299 1,025
Gulf Arabian Countries 5 0 -- 1,675 1,783 264 103
Near And Middle Eastern Countries 0 1 54 3 127 26 201
Other Asian Countries 65 59 6 78 17 9 721
Australia 0 0 -- 1 108 18 26
Unclassified 24 2 -- 1 7 7 --
Total 622 745 1,291 8,538 17,695 11,345 12,921
Provisional Data Source: Central Bank of the Republic of Turkey
46
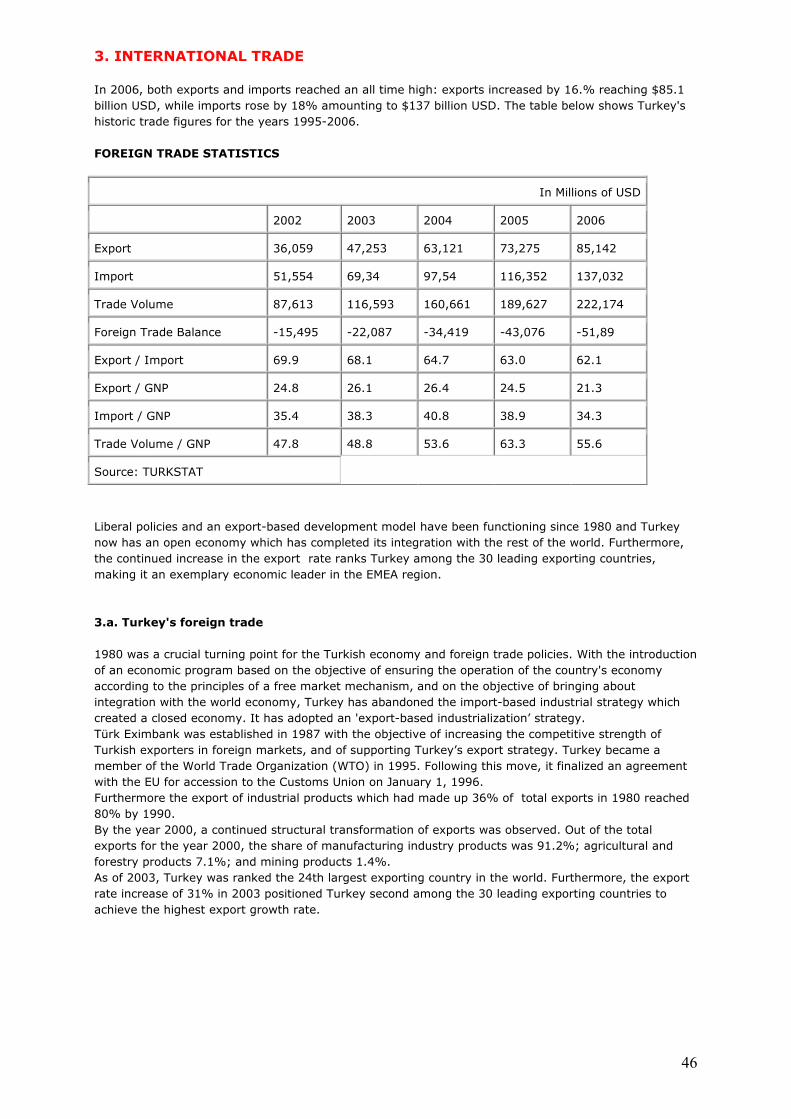
3. INTERNATIONAL TRADE
In 2006, both exports and imports reached an all time high: exports increased by 16.% reaching $85.1
billion USD, while imports rose by 18% amounting to $137 billion USD. The table below shows Turkey's
historic trade figures for the years 1995-2006.
FOREIGN TRADE STATISTICS
In Millions of USD
2002 2003 2004 2005 2006
Export 36,059 47,253 63,121 73,275 85,142
Import 51,554 69,34 97,54 116,352 137,032
Trade Volume 87,613 116,593 160,661 189,627 222,174
Foreign Trade Balance -15,495 -22,087 -34,419 -43,076 -51,89
Export / Import 69.9 68.1 64.7 63.0 62.1
Export / GNP 24.8 26.1 26.4 24.5 21.3
Import / GNP 35.4 38.3 40.8 38.9 34.3
Trade Volume / GNP 47.8 48.8 53.6 63.3 55.6
Source: TURKSTAT
Liberal policies and an export-based development model have been functioning since 1980 and Turkey
now has an open economy which has completed its integration with the rest of the world. Furthermore,
the continued increase in the export rate ranks Turkey among the 30 leading exporting countries,
making it an exemplary economic leader in the EMEA region.
3.a. Turkey's foreign trade
1980 was a crucial turning point for the Turkish economy and foreign trade policies. With the introduction
of an economic program based on the objective of ensuring the operation of the country's economy
according to the principles of a free market mechanism, and on the objective of bringing about
integration with the world economy, Turkey has abandoned the import-based industrial strategy which
created a closed economy. It has adopted an 'export-based industrialization’ strategy.
Türk Eximbank was established in 1987 with the objective of increasing the competitive strength of
Turkish exporters in foreign markets, and of supporting Turkey’s export strategy. Turkey became a
member of the World Trade Organization (WTO) in 1995. Following this move, it finalized an agreement
with the EU for accession to the Customs Union on January 1, 1996.
Furthermore the export of industrial products which had made up 36% of total exports in 1980 reached
80% by 1990.
By the year 2000, a continued structural transformation of exports was observed. Out of the total
exports for the year 2000, the share of manufacturing industry products was 91.2%; agricultural and
forestry products 7.1%; and mining products 1.4%.
As of 2003, Turkey was ranked the 24th largest exporting country in the world. Furthermore, the export
rate increase of 31% in 2003 positioned Turkey second among the 30 leading exporting countries to
achieve the highest export growth rate.

47
These developments contributed greatly to Turkey being considered an attractive investment region; this
is particularly because trade and investments exhibit complementary features. Also, the open economy
indicator calculated as the GNP/foreign trade ratio is accepted as a significant determining factor for
foreign direct investors in identifying their investment areas. With its economic structure integrated with
the world economy, Turkey has not only increased its trade volume and exports but also has created an
export product range with an emphasis on industrial products of high added value which require
advanced technology. This was all made possible by ensuring a structural transformation in its exports.
Furthermore it has continued to diversify its target markets.
Turkey currently exports over 7,000 products to 170 countries and for 2007, will reach nearly $100
billion USD in exports.
3.b. Foreign Trade by Economic Activities
In line with the policies implemented within the framework of the export-led development model that has
been followed since 1980, exportation has become important to Turkey both qualitatively and
quantitatively.
Starting particularly in 1980 and continuing up to the mid-1990s, very important developments have
been observed in the market share of labor-intensive industrial products such as the manufacture of
textiles and of clothing; iron and steel; and foodstuffs.
In 1996, with the establishment of a Customs Union with the European Union, Turkey's exportation
entered a new structural transformation process. Developments in recent years show that production and
export have increased significantly in high technology sectors such as electrical and electronic machinery
and equipment as well as automobile manufacture. In this respect, it is also seen that the export market
share of the manufacture of industrial products has increased in the period from 1999 to 2006.
Between 1980 and 2006 there have been important changes made in the distribution of imports within
different sectors.
Since 1990, the manufacturing industry has became the leading importer. Including the sub-sectors of
the manufacturing industry, it is apparent that the import share of iron and steel, as well as chemicals in
total imports has not changed significantly. However, the import of machinery and transportation
vehicles, as well as that of textile products sectors has increased.
3.c. Foreign Trade in terms of Countries
In terms of both imports and exports, members of the European Union are Turkey's most important
trade partners.
Imports by Country
With respect to Turkey's imports by country groups, EU members have maintained the highest position
since 1980. Between 1999 and 2005, while it was observed that imports from EU members rose from
around 44% to 52%, there was also a marked increase in imports from Asia, the Black Sea Economic
Cooperation Member Countries, and the Common Wealth of Independent States which has attracted
significant attention.
In 2005, the share of imports to OECD countries was 56.6%. The highest position among the OECD
countries was held by the EU members with a total market share of 42.2%. In 2005 the top 5 countries
in terms of imports were Germany, Russia, Italy, China and France. The overall share of these 5
countries in imports was 40.1%.

48
2002 2003 2004 2005
Million
USD
% of
Total
Million
USD
% of
Total
Million
USD
% of
Total
Million
USD
% of
Total
OECD Countries 32984,5 64 43898,6 43898,6 59492,4 61 65896,5 56,6
EU Countries 23321 45,2 33494,7 33494,7 45373,1 46,5 49047,6 42,2
EFTA Countries 2512 4,9 3395,7 3395,7 3888,7 4 4437,3 3,8
Other OECD
Countries 7151,4 13,9 7008,2 7008,2 10230,6 10,5 12845,1 11
Turkish Free
Zones 574,5 1,1 588,9 588,9 809 0,8 756,8 0,7
Non OECD
Countries 17994,8 34,9 24852,2 24852,2 37238,4 38,2 49698,4 42,7
European
Countries 6342,8 12,3 8910 8910 14411,3 14,8 19274 16,6
African Countries 2696,2 5,2 3338 3338 4779,3 4,9 6032,9 5,2
American
Countries 592,3 1,1 1082 1082 1359 1,4 1798,1 1,5
Middle East
Countries 3681,5 7,1 4059 4059 5121,8 5,3 7372,9 6,3
Other Asian
Countries 4366,5 8,5 6801 6801 10636,2 10,9 14457,8 12,4
Other Countries 315,5 0,6 651 651 930,9 1 762,6 0,7
Selected Country Groups
Black Sea Econ.
Cooperation 6576,6 12,8 9297,7 9297,7 15263,1 15,6 20401,3 17,5
Economic
Cooperation Org. 1548,2 3 2735,7 2735,7 3208,1 3,3 5101,5 4,4
Commonwealth
of
Indep.States 5554,5 10,8 7777,1 7777,1 12848,2 13,2 17178,4 14,8
Turkish
Republics 467,8 0,9 623,3 623,3 940,9 1 1262,3 1,1
Islamic
Conference Org. 6770,1 13,1 8481,5 8481,5 10565,9 10,8 14426,8 12,4
Selected Countries*
Germany 7041,5 13,7 9453 13,6 12515,7 12,8 13594,8 11,7

49
Russia 3891,7 7,5 5451,3 7,9 9033,1 9,3 12856,8 11
Italy 4097 7,9 5471,5 7,9 6865,8 7 7539,8 6,5
China 1368,3 2,7 2610,3 3,8 4476,1 4,6 6848,2 5,9
France 3052,7 5,9 4164,1 6 6201,3 6,4 5874,8 5
USA 3099,1 6 3495,8 5 4745,2 4,9 5360,6 4,6
Switzerland 2142,7 4,2 2968,2 4,3 3404,5 3,5 4053 3,5
United Kingdom 2438,3 4,7 3500 5 4317,1 4,4 4681,4 4
Spain 1419,2 2,8 2003,7 2,9 3253,7 3,3 3540,1 3
Southern Korea 900,4 1,7 1312,4 1,9 2572,5 2,6 3475,7 3
Iran 921 1,8 1860,7 2,7 1962,1 2 3469 3
Japan 1465,5 2,8 1927,1 2,8 2684,3 2,8 3102,3 2,7
Ukraine 991,1 1,9 1331,5 1,9 2509,4 2,6 2632,4 2,3
Belgium-
Luxemburg 1150 2,2 1523,6 2,2 1991,7 2 2224,3 1,9
Netherlands 1311,3 2,5 1656,7 2,4 1908,1 2 2138,6 1,8
Saudi Arabia 793,8 1,5 969,1 1,4 1231,5 1,3 1886,5 1,6
Sweden 535,1 1 822,2 1,2 1118,4 1,1 1423,6 1,2
T o t a l 51553,8 100 69339,7 100 97539,8 100 116351,7 100
Source: SPO
* The countries are chosen according to the total import values in the previous years.
Exports by Country
Between 1980 and 2005, the share of Turkish exports to European Union members was around 50%;
these countries maintained their place as the group to which Turkey exports most. Between 1999 and
2005, it was observed that while the share of exports made to the EU countries changed from around
51% to 54%, there was also an increase in exports made to Black Sea Economic Cooperation Countries,
to countries of the Islamic Conference Organization, and to the Commonwealth of Independent States.
In 2005, the share of exports to OECD countries was 60.4 %. The highest position among the OECD
countries was held by the EU members with an overall share of 52.3%. In 2004, the top 5 countries for
exports were Germany, the UK, Italy, the USA and France. The overall share of exports by these 5
countries was 40.6%.

50
2002 2003 2004 2005
Million
USD
% of
Total
Million
USD
% of
Total
Million
USD
% of
Total
Million
USD
% of
Total
OECD Countries 23,553.1 65.3 30.422.4 64.4 40.332.2 63.9 44.280.0 60.4
EU Countries 18,458.5 51.2 25,898.7 54.8 34,309.9 54.4 38,349.6 52.3
EFTA Countries 409.0 1.1 538.0 1.1 655.5 1.0 819.9 1.1
Other OECD
Countries 4,685.5 13.0 3,985.6 8.4 5,366.8 8.5 6,009.7 8.2
Turkish Free
Zones 1,438.5 4.0 1,928.3 4.1 2,529.1 4.0 2,963.8 4.0
Non OECD
Countries 11,067.5 30.7 14,902.2 31.5 20,259,6 32.1 26,031.5 35.5
Europe + CIS
Countries 3,447.4 9.6 4,720.0 10.0 5,922.2 9.4 7,920.2 10.8
African Countries 1,696.7 4.7 2,131.2 4.5 2,951.5 4.7 3,625.8 4.9
American
Countries 241.2 0.7 256.0 0.5 373.0 0.6 520.7 0.7
Middle East
Countries 3,575.7 9.9 5,131.5 10.9 7,237.6 11.5 9,268.8 12.6
Other Asian
Countries 1,939.8 5.4 2,604.0 5.5 2,864.0 4.5 3,486.7 4.8
Other Countries 166.7 0.5 59.5 0.1 911.3 1.4 1,209.3 1.7
Selected Country Groups
Black Sea
Economic
Cooperation
3,476.9 9.6 5,044.4 10.7 6,736.3 10.7 8,604.0 11.7
Economic
Cooperation
Organization
1,041.9 2.9 1,569.2 3.3 2,186.5 3.5 2,658.9 3.6
Commonwealth
of Independent
States
2,278.9 6.3 2,962.6 6.3 3,932.7 6.2 5,046.6 6.9
Turkish Republics 619.3 1.7 899.1 1.9 1,186.1 1.9 1,406.0 1.9
Islamic
Conference
Organization
5,195.9 14.4 7,341.8 15.5 10,141.2 16.1 12,988.8 17.7

51
Selected Countries*
Germany 5,868.8 16.3 7,484.9 15.8 8,745.3 13.8 9,448.8 12.9
United Kingdom 3,024.9 8.4 3,670.1 7.8 5,543.9 8.8 5,916.1 8.1
Italy 2,375.7 6.6 3,193.2 6.8 4,640.3 7.3 5,606.2 7.7
USA 3,356.1 9.3 3,751.6 7.9 4,848.6 7.7 4,887.3 6.7
France 2,134.6 5.9 2,826.1 6.0 3,668.4 5.8 3,791.0 5.2
Spain 1,125.1 3.1 1,789.5 3.8 2,618.4 4.1 3,009.1 4.1
Iraq 0.0 0.0 0.0 0.0 1,820.8 2.9 2,724.7 3.7
Netherlands 1,055.6 2.9 1,525.9 3.2 2,138.0 3.4 2,467.3 3.4
Russia 1,172.0 3.3 1,367.6 2.9 1,859.2 2.9 2,374.4 3.2
Romania 566.5 1.6 873.3 1.8 1,235.5 2.0 1,783.6 2.4
U. A. E 457.3 1.3 702.9 1.5 1,143.7 1.8 1,669.4 2.3
Israel 861.4 2.4 1,083.0 2.3 1,313.9 2.1 1,462.5 2.0
Belgium
Luxembourg 693.3 1.9 885.6 1.9 1,183.2 1.9 1,291.1 1.8
Bulgaria 380.3 1.1 621.7 1.3 894.3 1.4 1,178.5 1.6
Greece 590.4 1.6 920.4 1.9 1,170.8 1.9 1,124.1 1.5
Saudi Arabia 554.6 1.5 741.5 1.6 768.5 1.2 961.2 1.3
Iran 334.0 0.9 533.8 1.1 813.0 1.3 905.4 1.2
Poland 342.6 1.0 480.0 1.0 697.7 1.1 829.3 1.1
T o t a l 36.059.1 100.0 47,252.8 100.0 63,120.9 100.0 73,275.3 100.0
Source: SPO
* The countries are chosen according to the total export values in the last year.
TURKEY MEMBERSHIPS IN INTERNATIONAL TRADE ORGANIZATIONS
Turkey has been a member of World Trade Organization, since 1995. Its commitment to intergrating with
regional and international trade norms is seen in its participation in and membership of various
organizations such as: Economic Cooperation Organization (ECO), UNCTAD, Black Sea Economic
Cooperation Organization, World Customs Organization, International Chamber of Commerce, Islamic
Cooperation Organization, D-8 , Stability Pact, and various other organization.

52
Business Legislation
Turkey offers a simple business legislation system with international standards through which all
investors enjoy equal treatment. Recent amendments to the existing law will assist Turkey even further
with its present improvements in the investment environment.
Turkey offers:
1. Legal Framework for Foreign Direct Investment
2. Bilateral Agreements, Double Taxation Prevention Treaties and Social Security Agreements
3. Bilateral Free Trade Agreements
Legal Framework of Foreign Direct Investment
The aim of Foreign Direct Investment Law is:
• To encourage FDI’s in the country
• To protect foreign investors’ rights
• To bring the investors and investments in line with international standards
• To establish a notification-based rather than approval-based system for FDI’s
• To increase the volume of FDI’s through established policies
The Foreign Direct Investment Law provides a definition of foreign investors and foreign direct
investments. Additionally, it explains the important principles of FDI’s such as freedom to invest, national
treatment, expropriation and nationalization, transfers, access to real estate, dispute settlement,
valuation of non-cash capital, employment of expatriates, and liaison offices.
The Regulation for the implementation of the Foreign Direct Investment law consists of:
• Specifying the procedures and principles of the issues that are laid down in Foreign Direct Investment
(FDI) Law.
The target for the new FDI law on work permits for foreigners is:
• To regulate the work carried out by foreigners
• To stipulate the rules about working permits given to foreigners
BILATERAL AGREEMENTS
Bilateral Agreements for the Promotion and Protection of Investments
Since 1962, Turkey has developed an impressive Bilateral Agreements network including 79 countries.
The main purpose of these agreements is to promote the investment flows between the parties, to
ensure a more stable investment environment, to provide economic and legal assurance to foreign
investors and to establish a favorable atmosphere for economic cooperation.

53
Double Taxation Prevention Treaties
Turkey signed Double Taxation Prevention Treaties with 68 countries which enables offsetting tax paid in
one of two countries against the tax payable in the other, in this way preventing double taxation.
The following list includes the countries with which Turkey has DTT agreements.
Europe (34): (Albania, Austria, Belarus, Belgium, Bosnia/Herzegovina, Bulgaria, Croatia, Czech Republic,
Denmark, England, Estonia, Finland, France, Germany, Greece, Holland, Hungary, Italy, Latvia,
Lithuania, Luxemburg, Macedonia, Moldova, Norway, Poland, Portugal, Romania, Serbia/Montenegro,
Slovakia, Slovenia, Spain, Sweden, Turkish Republic of Northern Cyprus, Ukraine)
Africa (7): (Algeria, Egypt, Ethiopia, Morocco, Republic of South Africa, Sudan, Tunisia)
Asia (18): (Azerbaijan, Bangladesh, India, Indonesia, Japan, Kazakhstan, Kyrgyzstan, Malaysia,
Mongolia, Pakistan, Russia, Singapore, South Korea, Tajikistan, Thailand, The Republic of China,
Turkmenistan, Uzbekistan)
Middle East (8): (Jordan, Saudi Arabia, Israel, Iran, Lebanon, Syria, United Arab Emirates, Kuwait)
Americas (1):(U.S.A).
Turkey continues to expand the coverage area of the Double Taxation Prevention Treaty by adding more
countries on continuous basis.
Social Security Agreements
Turkey signed Social Security Agreements with 22 countries(Albania, Austria, Azerbaijan, Belgium,
Bosnia and Herzegovina, Canada, Czech Republic, Denmark, France, Georgia, Germany, Great Britain,
Libya, Luxembourg, Macedonia, Netherlands, Norway, Quebec, Romania, Switzerland, Sweden, Turkish
Republic of Northern Cyprus) which ease the movement of the expatriates between countries. The
number of these countries will increase parallel to the enlarging spectrum of the FDI origin.
Bilateral Free Trade Agreements
Turkey has 11 Free Trade Agreements (with EFTA, Israel, Macedonia, Croatia, Bosnia and Herzegovina,
Palestine, Tunisia, Morocco, Syria, Egypt and Albania) which forms a levy-free environment in intra-trade
on an agreed list of goods. This framework explains why many global companies are now using Turkey as
the second supply source, not only for EU and rapidly growing Turkish market, but also for Middle East,
Black Sea and North Africa, with the added advantage of relatively cheaper but well-educated labor
force, coupled with cost-effective transportation.
Turkey is carrying out negotiations to include Gulf Co-operation Council, Jordan, Lebanon, Georgia and
Faroe Islands to the existing network in order to attract investors.