investment strategy webinar - aon · investment strategy webinar may 15, 2013. 2 presenters russ...
TRANSCRIPT
Investment Strategy Webinar
May 15, 2013

2
Presenters
Russ Ivinjack, Senior PartnerHead of Specialty Services &Resource IntegrationPhone: 312.715.3330Email: [email protected]
John Geissinger, CFA, PartnerInvestment SolutionsPhone: 203-523-8898Email: [email protected]
Adrian Kurniadjaja, CFA, Senior ConsultantGlobal EquityPhone: 312-715-3305Email: [email protected]
Duncan Lamont, CFA, PrincipalGlobal Asset AllocationPhone: 011 +44 207 086 9168Email: [email protected]
Chris Riley, Associate PartnerGlobal Head of Equity ResearchPhone: 312-715-3339Email: [email protected]
3
Discussion Topics
Opening Remarks & Recently Released Research Market Update with a Focus on Bond Yields Rethinking Fixed Income Hiring Underperforming Equity Managers Closing RemarksQ&A Session

4
Entries in the HEK Blog (www.hekblog.com) – In Case You Missed It
Five New Viewpoints Defined Contribution Plan Re-Enrollment: Responsible Redirection or Wrong
Direction? Do Hedge Fund of Funds have a future? PBS Frontline “The Retirement Gamble” Segment Recent Case Law Development Regarding ERISA Fees and 401(k) Plan
Investments Alternative Investments in DC Plans
Several Pieces of Intellectual Capital on Weekly Update Postings Corporate pension liability hedging views (4/22/2013) Quarterly investment outlook (4/29/2013) Three new white papers (5/8/2013) Liability discount rate update (5/13/2013) Stable value quarterly (5/13/2013) Week in markets summary (every week)

5
Subscribing to the HEK Blog
Go to www.hekblog.com Enter your email address where it says “subscribe” Get ~2 emails per week
Market Update with a Focus on Bond Yields
Duncan Lamont, CFA
7
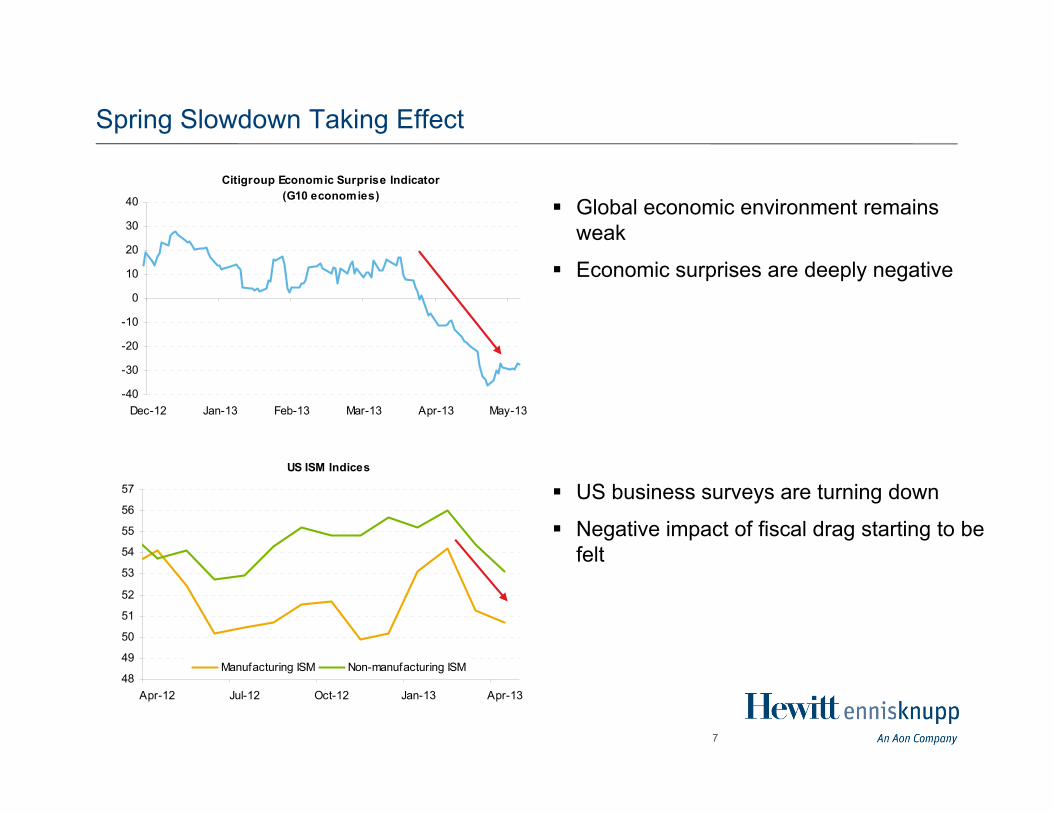
Spring Slowdown Taking Effect
Global economic environment remains weak
Economic surprises are deeply negative
US business surveys are turning down
Negative impact of fiscal drag starting to be felt
Citigroup Economic Surprise Indicator (G10 economies)
-40
-30
-20
-10
0
10
20
30
40
Dec-12 Jan-13 Feb-13 Mar-13 Apr-13 May-13
US ISM Indices
48
49
50
51
52
53
54
55
56
57
Apr-12 Jul-12 Oct-12 Jan-13 Apr-13
Manufacturing ISM Non-manufacturing ISM
8
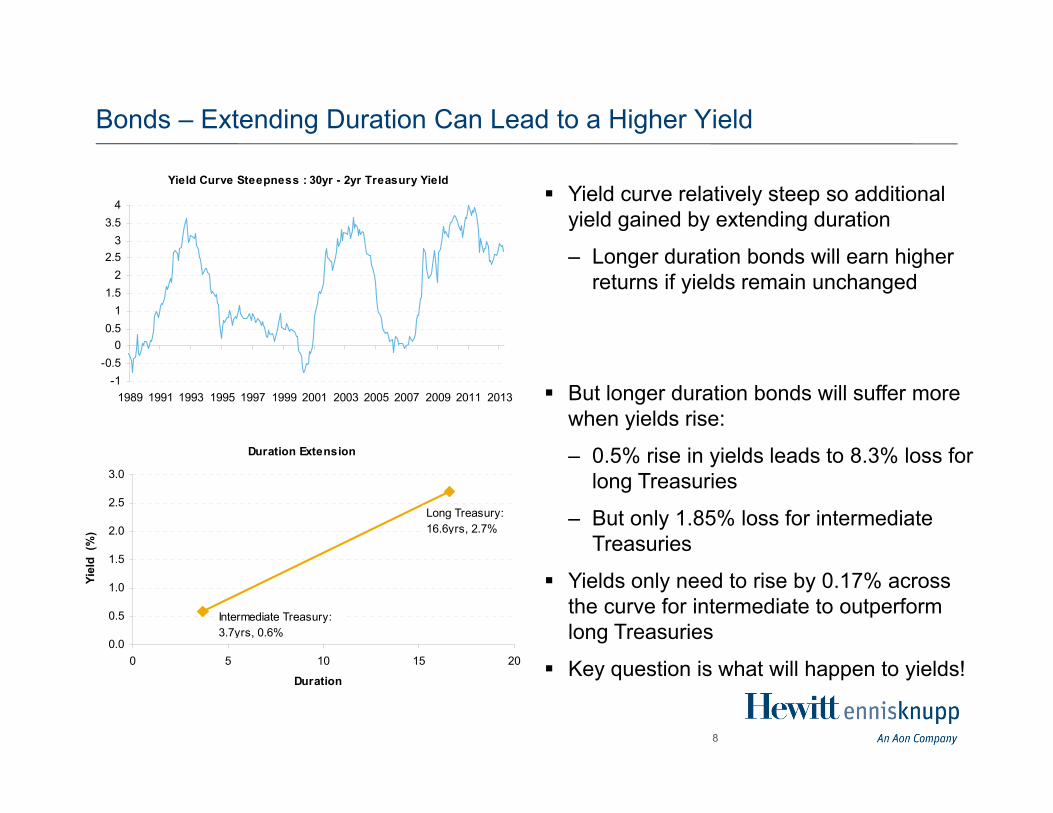
Bonds – Extending Duration Can Lead to a Higher Yield
Yield Curve Steepness : 30yr - 2yr Treasury Yield
-1-0.5
00.5
11.5
22.5
33.5
4
1989 1991 1993 1995 1997 1999 2001 2003 2005 2007 2009 2011 2013
Duration Extension
0.0
0.5
1.0
1.5
2.0
2.5
3.0
0 5 10 15 20
Duration
Yiel
d (%
)
Intermediate Treasury:3.7yrs, 0.6%
Long Treasury:16.6yrs, 2.7%
Yield curve relatively steep so additional yield gained by extending duration
– Longer duration bonds will earn higher returns if yields remain unchanged
But longer duration bonds will suffer more when yields rise:
– 0.5% rise in yields leads to 8.3% loss for long Treasuries
– But only 1.85% loss for intermediate Treasuries
Yields only need to rise by 0.17% across the curve for intermediate to outperform long Treasuries
Key question is what will happen to yields!
9
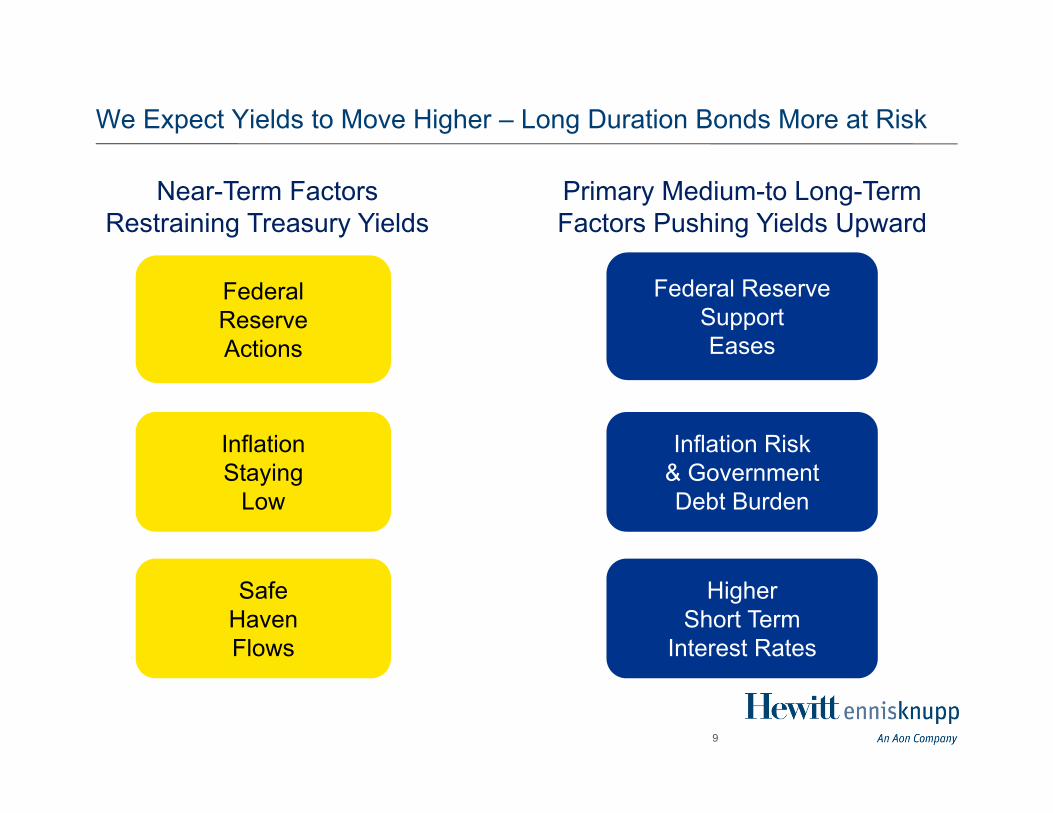
We Expect Yields to Move Higher – Long Duration Bonds More at Risk
FederalReserveActions
InflationStaying
Low
SafeHavenFlows
Federal ReserveSupportEases
Inflation Risk& GovernmentDebt Burden
HigherShort Term
Interest Rates
Near-Term Factors Restraining Treasury Yields
Primary Medium-to Long-Term Factors Pushing Yields Upward

10
Medium Term Outlook on Interest Rates
Market Expectation Increase from today MTV Expectation Increase from todayNow 2.8% 2.8%In 3yrs 3.4% 0.5% 3.9% 1.1%In 5yrs 3.6% 0.8% 4.4% 1.6%
Market Expectations for Yield Curves
0%
1%
2%
3%
4%
1 3 5 7 9 11 13 15 17 19 21 23 25
Duration
Yield curve at April 30, 2013
Projected yield curve at April 30, 2016
Projected yield curve at April 30, 2018
We expect yields to rise by more than priced into the marketRecommend tilting portfolios to short of target duration

11
Summary of Medium-Term Market Views
Equities Gains to slow significantly, but prefer to bonds Non-US markets should outperform on currency hedged
basis Now prefer emerging markets to developed Neutral growth/value Retain preference for large cap
Bonds Continue with negative view Negative view on US treasuries Take profits on credit - move back to target Cautious on high yield, still prefer loans Local emerging market currency debt preferred to dollar
denominatedAlternative Asset Classes Favor real estate, hedge funds, infrastucture and
selected private equity investments

Rethinking Fixed Income
John Geissinger, CFA

13
Focus on Risk Reducing Portfolio
We have discussed many ways to enhance the return seeking portfolio; for example, “Go Big or Go Home”, and “Conviction in Equity Investing.”
In an era of low expected returns, we also must invest in the most efficient risk-reducing portfolio.
Corporate Defined Benefit plans are encouraged to de-risk through the use of a hedge portfolio.
Other investors-Public Defined Benefit, Endowment, Foundation and Sovereign Wealth-should move away from the broad based bond benchmarks to fine tune the risk-reducing properties of fixed income.
14
Risk Reducing Properties
There are several desired characteristics for a risk reducing portfolio:– Low correlation– Low volatility– High volatility, IF correlation is negative– Downside protection: perform when the return-seeking, predominantly equity,
portfolio experiences negative returns Achieving these properties at minimum cost is preferable.
15
Intermediate versus Long Treasury Market
We disaggregated the Treasury Index into the intermediate sector (1-10 years) and long sector (10+ years) to compare the risk-reducing qualities of both maturity sectors of the fixed income market.
The Treasury Index was utilized to focus exclusively on the duration positioning of the risk-reducing portfolio.

16
Volatility and Correlation Comparison
Even though short-term interest rates are more volatile than long-term interest rates, the intermediate sector has less volatility than the long sector.
The volatility of the long sector can be similar to the equity volatility. The intermediate sector has less correlation to the equity market than the long sector.
-0.6
-0.4
-0.2
0
0.2
0.4
0.6
0.8
12/1
/197
712
/1/1
980
12/1
/198
312
/1/1
986
12/1
/198
912
/1/1
992
12/1
/199
512
/1/1
998
12/1
/200
112
/1/2
004
12/1
/200
712
/1/2
010
Correlation
Rolling 5 Yr Correlation with Equity
Intermediate
Long
17
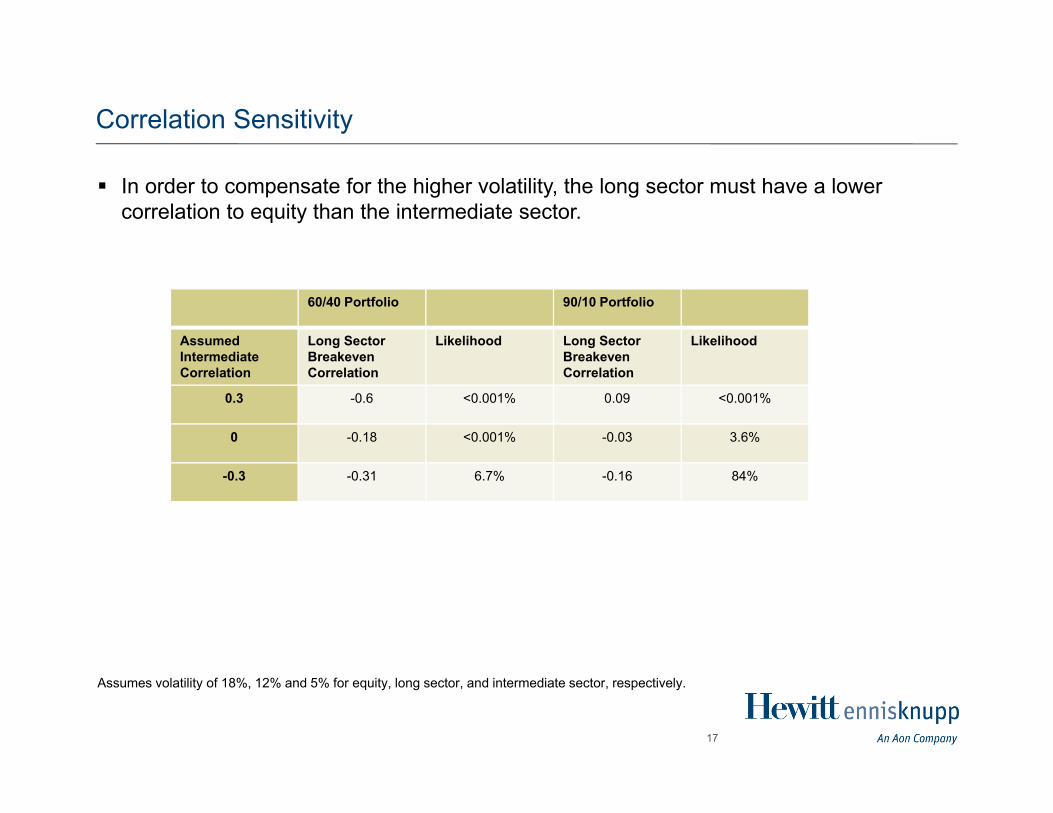
Correlation Sensitivity
In order to compensate for the higher volatility, the long sector must have a lower correlation to equity than the intermediate sector.
Assumes volatility of 18%, 12% and 5% for equity, long sector, and intermediate sector, respectively.
60/40 Portfolio 90/10 Portfolio
AssumedIntermediate Correlation
Long Sector Breakeven Correlation
Likelihood Long Sector Breakeven Correlation
Likelihood
0.3 -0.6 <0.001% 0.09 <0.001%
0 -0.18 <0.001% -0.03 3.6%
-0.3 -0.31 6.7% -0.16 84%
18
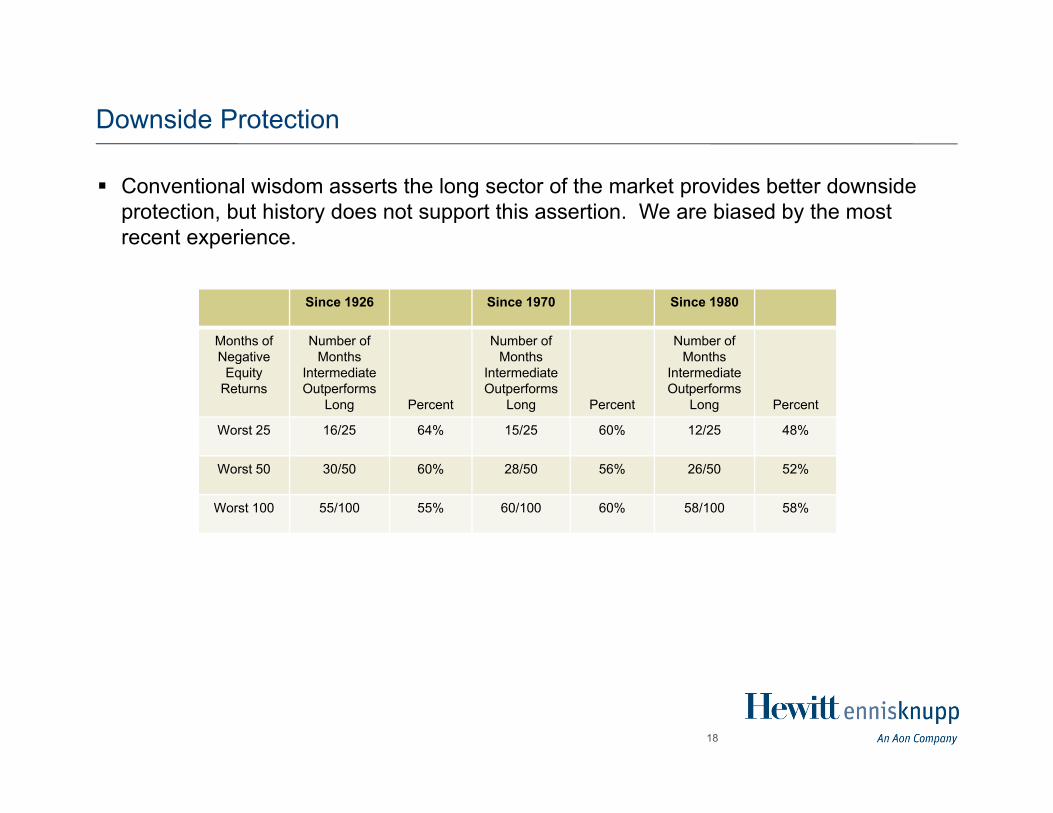
Downside Protection
Conventional wisdom asserts the long sector of the market provides better downside protection, but history does not support this assertion. We are biased by the most recent experience.
Since 1926 Since 1970 Since 1980
Months of Negative
Equity Returns
Number of Months
IntermediateOutperforms
Long Percent
Number of Months
IntermediateOutperforms
Long Percent
Number of Months
IntermediateOutperforms
Long Percent
Worst 25 16/25 64% 15/25 60% 12/25 48%
Worst 50 30/50 60% 28/50 56% 26/50 52%
Worst 100 55/100 55% 60/100 60% 58/100 58%

19
Does the Long Sector Compensate for Additional Volatility
In a word, NO!
-4
-2
0
2
4
6
8
10
12/1
/199
38/
1/19
944/
1/19
9512
/1/1
995
8/1/
1996
4/1/
1997
12/1
/199
78/
1/19
984/
1/19
9912
/1/1
999
8/1/
2000
4/1/
2001
12/1
/200
18/
1/20
024/
1/20
0312
/1/2
003
8/1/
2004
4/1/
2005
12/1
/200
58/
1/20
064/
1/20
0712
/1/2
007
8/1/
2008
4/1/
2009
12/1
/200
98/
1/20
104/
1/20
1112
/1/2
011
8/1/
2012
Rolling 5 Year Return Difference
Risk Adj Inter Less Long
Inter Less Risk Adj Long

20
One Explanation for Lack of Risk Premium in Long Sector
0
0.5
1
1.5
2
2.5
3
0 1 2 3 4 5 6 7 8 9 10 11 12 13 14 15 16 17 18 19 20 21Duration
Yield
Long end pulled downby long liabilityhedging

21
Portfolio Implications
Investors looking to manage the volatility of the return-seeking portfolio should invest the risk-reducing portfolio in intermediate fixed income.
For those that are concerned about cash flow yield, recognize the yield reduction relative to the volatility reduction is minimal:– Reposition from Aggregate Index to Intermediate Aggregate Index,– Shorten duration by 1.35 years,– Yield reduction of 30 basis points,– One year breakeven yield change is only 22 basis points.
Hiring Underperforming Equity Managers
Chris RileyAdrian Kurniadjaja, CFA

23
Manager Decisions
Hiring managers to succeed in the long term is not just about hiring the best performing manager in the search process– Be cognizant of the manager’s style and tendencies before making a decision
• Style biases• Size biases• Macro economic conditions that may have impacted performance• If these conditions reverse, how will the manager perform?
A similar decision needs to be made when evaluating current managers within an investment program that have underperformed their respective benchmark
The market environment over the last few years has been volatile where a variety of active management strategies have not worked– Low quality rally– Value out of favor– Europe/Japan– Correlation of U.S. securities

24
Terminating an Investment Manager – Is Now the Right Time?
Benchmark-relative performance is just one of several factors to consider when contemplating the replacement of an investment manager
Other considerations include:– Stability of key investment staff
• Did they become dumb overnight
– Stability of investment firm• Are they unfocused?
– Has the process changed?• Including execution of the process
– Is the manager’s style in favor or out of favor?
25
Examination of Buy-Rated Managers
We analyzed buy-rated equity managers to determine if there was any patterns of performance that are meaningful to assist with these critical decisions– Time periods analyzed were three years through 3/31/2010 and the subsequent
three-year period
A few patterns emerged:– Strong outperformance of a subset of buy-rated managers was followed with
weakness– Conversely, underperforming periods for managers was followed by outperformance
Implications for client investments– Given the strong mean reversion, consider recently underperforming managers
when hiring a new manager• Don’t hire the manager with the best short-term performance
– Have a little more patience with the managers that underperform

26
Analysis
Alphas are cyclical. – For the three years to 3/31/10, the medians performed strongly– For the three years to 3/31/13, alpha was much harder to achieve– Only emerging markets, EAFE and Global managers saw improved alphas; EM
and Global outperformed during both examined time periods.
-3
-2
-1
0
1
2
3
4
SM
IDV
SM
IDG
SM
IDC
MC
V
MC
G
MC
C
LCV
LCG
LCC
EM
Glo
bal
EA
FE
Median excess return for three years to 3/31/10Median excess return for three years to 3/31/13

27
Findings
Managers that underperform their medians exhibit stronger returns over the next three years; Further, managers that were out-performing their medians exhibit weaker returns over the next
three years Directionally, 75% of underperforming managers experienced an improvement relative to median,
while close to 80% of outperforming managers saw their excess returns falling relative to median
-1.8
2.6
-0.1
0.5
-2.0
-1.5
-1.0
-0.5
0.0
0.5
1.0
1.5
2.0
2.5
3.0
Bel
owm
edia
n
abov
em
edia
n3 years to 3/31/10 3 years to 3/31/13

28
Client Implications
We have all heard the phrase “buy low, sell high.” This needs to be considered more when hiring and firing investment managers within the institutional framework.
Implications for client manager decisions– Given the strong mean reversion noted within our universe of Buy-rated equity
managers, clients should strongly consider managers underperforming their benchmark when hiring a new manager• Don’t hire the manager with the best short-term performance
– During reviews of existing managers, consider the reasons for underperformance• If the reasons for the manager’s hiring remain (strong team, unique process,
investment culture, etc.), examine the reasons for the underperformance In most cases where the qualities of an investment manager remain
consistent, the performance issues are likely environmental or not conducive to the manager’s process
Data has shown mean reversion which should lead to outperformance in the future if patient
Closing Remarks
Russ Ivinjack

30
Question & Answer
Questions may be submitted at any time during the web seminar by typing the question in the "Ask a Question" text field and clicking "Submit." Questions will be answered live as time permits during the question and answer session.
31
Our next investment strategy update call is scheduled for Wednesday, June 19th, at 10 a.m. CDT.