investment recovery performance benchmarking...2017/07/07 · of companies that said non-hazardous...
TRANSCRIPT

CAPS Research2017 Investment Recovery Performance Benchmarking Report
Release Date: July 7, 2017
© 2017, Arizona Board of Regents on behalf of Arizona State University.1
A.
For the entire company:Less than $500 million 3% $500 million - $1 billion 3%$1 billiion - $5 billion 20% $5 billion - $10 billion 25%$10 billion - $25 billion 30% $25 billion - $50 billion 3%$50 billion - $100 billion 12% Greater than $100 billion 3%
For the business units to which IR services were provided:Less than $500 million 15% $500 million - $1 billion 5%$1 billiion - $5 billion 22% $5 billion - $10 billion 20%$10 billion - $25 billion 23% $25 billion - $50 billion 7%$50 billion - $100 billion 5% Greater than $100 billion 3%
B.
Entire company: 84%
Multiple locations or business units: 13%
A single location or business unit: 3%
Percent of participants that reported the following revenue ranges
Percent of companies reporting at the following level:
Entire company: Multiple locations or business units:
A single location or business unit:

CAPS Research2017 Investment Recovery Performance Benchmarking Report
Release Date: July 7, 2017
© 2017, Arizona Board of Regents on behalf of Arizona State University.2
C. Percent of companies that use the following organizational structure to perform the Investment Recovery function:
IR Program ManagementCentralized 83%Decentralized 17%
IR Operations/ServicesCentralized 61%Decentralized 39%
D. Geographic areas to which Investment Recovery services are provided:
North America (NAFTA) 74%Global 30%
0%10%20%30%40%50%60%70%80%90%
IR Program Management IR Operations Services
Global
North America (NAFTA)
0% 10% 20% 30% 40% 50% 60% 70% 80%

CAPS Research2017 Investment Recovery Performance Benchmarking Report
Release Date: July 7, 2017
© 2017, Arizona Board of Regents on behalf of Arizona State University.3
E. Investment Recovery directly reports to:
CEO/President 0%Executive V.P. 3%Vice President 21%Director 23%Manager 44%Supervisor 5%Other 3%
Deputy Commissioner; Managing Director
F. Functional area Investment Recovery directly reports to:
Supply/Purchasing/Sourcing/ Materials Management 80%Finance/Controller 3%Maintenance 2%Operations 13%Environmental 0%Other 2%
Inventory Control Management
0% 10% 20% 30% 40% 50%
OtherSupervisor
ManagerDirector
Vice PresidentExecutive V.P.CEO/President
0% 10% 20% 30% 40% 50% 60% 70% 80%
Other
Environmental
Operations
Maintenance
Finance/Controller
Supply/Purchasing/Sourcing/Materials…

CAPS Research2017 Investment Recovery Performance Benchmarking Report
Release Date: July 7, 2017
© 2017, Arizona Board of Regents on behalf of Arizona State University.4
G.
Aerospace & Defense 7%Automotive & Transport 2%Chemical 7%Consumer Products 2%Electronics 3%Food 2%Government 8%Industrial Manufacturing 2%Metals & Mining 3%Oil & Gas 15%Pharmaceuticals 2%Telecommunications 3%Utilities 39%Other 7%
Financial Services; Healthcare
H.
Type of Industry that best describes each company:
On average, the IR function serviced 675 company locations or facilities with a median of 60. When the largest data point is removed, the average is 118.
0.0% 5.0% 10.0% 15.0% 20.0% 25.0% 30.0% 35.0% 40.0%
OtherUtilities
TelecommunicationsPharmaceuticals
Oil & GasMetals & Mining
Industrial ManufacturingGovernment
FoodElectronics
Consumer ProductsChemical
Automotive & TransportAerospace & Defense

CAPS Research2017 Investment Recovery Performance Benchmarking Report
Release Date: July 7, 2017
© 2017, Arizona Board of Regents on behalf of Arizona State University.5
I. The most effective tools used for the disposition of assets: (A rating of 1 = least effective and a rating of 5 = most effective)
Tool Average RatingIncrease Decrease No Change
Auctions 4.1 29.5% 4.5% 65.9%eAuctions 4.0 38.6% 2.3% 59.1%3rd-Party Sellers or Brokers 4.0 38.3% 0.0% 61.7%Email 3.7 20.5% 6.8% 72.7%Intranet 3.6 26.1% 6.5% 67.4%Internet posting 3.5 31.8% 4.5% 63.6%Social media 2.7 25.6% 2.3% 72.1%Special Apps 2.3 14.3% 2.4% 83.3%Catalogs 2.2 9.3% 9.3% 81.4%Commercial Ads 2.2 7.1% 4.8% 88.1%Telemarketing 1.8 9.8% 0.0% 90.2%Flyers/Mailers 1.5 2.4% 7.1% 90.5%Fax 1.1 0.0% 9.8% 90.2%Other 3.0 0.0% 0.0% 100.0%
Expected Change in Use

CAPS Research2017 Investment Recovery Performance Benchmarking Report
Release Date: July 7, 2017
© 2017, Arizona Board of Regents on behalf of Arizona State University.6
J. Investment Recovery services provided:
Primary Service Provided
Service Occasionally Provided
Service Not Provided
Sales (material & equipment) 79.7% 13.6% 6.8%Recycling 68.3% 20.0% 11.7%Redeployment 51.7% 34.5% 13.8%Inventory reclamation 43.3% 38.3% 18.3%Non-hazardous waste stream management 33.9% 28.8% 37.3%
Used equipment searches 28.1% 33.3% 38.6%Donations 25.9% 43.1% 31.0%Dismantling/Demolition 24.6% 35.1% 40.4%Appraisals 22.4% 48.3% 29.3%Hazardous waste stream management 20.7% 31.0% 48.3%Other 21.2% 3.0% 75.8%
Of companies that said Hazardous waste stream management is a Primary Service Provided, 50% have employees dedicated exclusively to this activity.Of companies that said Non-hazardous waste stream management is a Primary Service Provided, 65% have employees dedicated exclusively to this activity.

CAPS Research2017 Investment Recovery Performance Benchmarking Report
Release Date: July 7, 2017
© 2017, Arizona Board of Regents on behalf of Arizona State University.7
# Benchmarks Mean Median Minimum MaximumNumber of
ParticipantsPrevious
Report Mean
Financial Information
1 Total cost benefit: $7,413,572 $4,395,966 $23,500 $32,982,000 48 $11,865,559
2 Total cost benefit dollars to operating expense dollars:This ratio should reflect XX:1 21 11 0 90 38 49
3 Total cost benefit dollars per transaction: $18,399 $8,289 $0 $160,000 36 $22,756
4 Total cost benefit provided by each investment recovery employee: $1,987,847 $1,125,000 $7,833 $11,383,982 47 $3,870,713
5 Total cost benefit provided by each exempt investment recovery employee: $3,471,934 $2,060,483 $7,833 $15,980,000 42 $5,856,106
6 Investment recovery third-party sales as a percent of total cost benefit: 25.7% 19.7% 0.0% 77.8% 34 23.9%
7 Net third-party sales as a percent of total cost benefit: 17.8% 8.8% 0.0% 66.7% 36 22.7%
8 Gross sales dollars as a percent of total cost benefit: 83.8% 98.2% 0.0% 100.0% 48 74.3%
Internal transfers/redeployments as a percent of total cost benefit: 11.9% 0.8% 0.0% 92.3% 48 20.4%
Other cost avoidance as a percent of total cost benefit: 4.4% 0.0% 0.0% 57.4% 48 5.3%
9 Operating expense per investment recovery employee including outsourcing expenses: $121,363 $102,500 $19,077 $302,500 37 $117,448
Operating expense per investment recovery employee excluding outsourcing expenses: $118,003 $106,250 $19,077 $250,000 36 $104,110

CAPS Research2017 Investment Recovery Performance Benchmarking Report
Release Date: July 7, 2017
© 2017, Arizona Board of Regents on behalf of Arizona State University.8
# Benchmarks Mean Median Minimum MaximumNumber of
ParticipantsPrevious
Report Mean
10Company IR employees operating expense for salaries and payroll-related expenses as a percent of total operating expense:
80.9% 94.2% 0.0% 100.0% 38 83.9%
Non-allocated expenses as a percent of total operating expense: 2.3% 0.0% 0.0% 36.7% 38 1.9%
IT (Infrastructure and desktop support) expenses as a percent of total operating expense: 0.7% 0.0% 0.0% 8.7% 38 2.8%
Business systems expenses as a percent of total operating expense: 2.1% 0.0% 0.0% 55.6% 38 0.3%
Allocated expenses as a percent of total operating expense: 2.0% 0.0% 0.0% 54.5% 38 1.6%
In-house IR contractors/consultants operating expense as a percent of total operating expense: 2.5% 0.0% 0.0% 39.2% 38 1.8%
Direct cost of outsourced IR services as a percent of total operating expense: 7.1% 0.0% 0.0% 100.0% 38 3.6%
Other costs as a percent of total operating expense: 2.4% 1.2% 0.0% 14.6% 38 4.1%
11 Operating expense per transaction: $1,811 $804 $4 $8,857 30 $1,415

CAPS Research2017 Investment Recovery Performance Benchmarking Report
Release Date: July 7, 2017
© 2017, Arizona Board of Regents on behalf of Arizona State University.9
# Benchmarks Mean Median Minimum MaximumNumber of
ParticipantsPrevious
Report Mean
Investment Recovery Processes and Best Practices
12 Percent of organizations that outsource some IR activities or services: 76.7% 60 75.0%
Percent of organizations that chose the following as one of the top five activities/services outsourced in 2016: 46
Auctions 65.2% 72.4%
Recycling/Scrap 63.0% 75.9%
Dismantling/Demolition 54.3% 44.8%
eAuction sales 34.8% 41.4%
Appraisals 34.8% 27.6%
Bid or negotiated sales 34.8% 27.6%
Environmental services 26.1% 24.1%
Equipment refurbishment 15.2% 17.2%
Surplus identification/characterization 13.0% 24.1%
Offsite surplus storage/management 10.9% 13.8%
Internal surplus redeployment 10.9% 6.9%
Used equipment searches 8.7% 10.3%
Internal staff augmentation 4.3% 13.8%
Other 8.7% 3.4%
13 Average number of transactions per IR employee: 1,108 141 6 30,004 35 321
Broker sales; Economic development; IT hardware equipment and IT salvage sales; Website creation

CAPS Research2017 Investment Recovery Performance Benchmarking Report
Release Date: July 7, 2017
© 2017, Arizona Board of Regents on behalf of Arizona State University.10
# Benchmarks Mean Median Minimum MaximumNumber of
ParticipantsPrevious
Report Mean
14 Internal transfers/redeployments as a percent of total transactions: 17.1% 3.3% 0.0% 100.0% 40 23.9%
Third-party sales transactions as a percent of total transactions: 82.9% 96.7% 0.0% 100.0% 40 76.1%
15 Percent of organizations that require the use of Investment Recovery for disposal of surplus assets: 61.0% 59 67.6%
Percent of organizations that encourage the use of Investment Recovery for disposal of surplus assets: 28.8% 59 24.3%
Percent of organizations that have no policy regarding the use of Investment Recovery: 10.2% 59 8.1%
16 Percent of IR groups active in efforts to support sustainability requirements (e.g., landfill avoidance) 77.2% 57 87.8%
Of those IR groups, percent that are active in the following areas: 44
Landfill avoidance/Recycling 93.2% 100.0%
Employee education 65.9% 52.9%
Seek new diversions of waste streams 61.4% 61.8%
Hazmat handling/processing 61.4% 44.1%
Cradle-to-grave waste stream management 47.7% 52.9%
Sustainable metrics as top company goals 47.7% 41.2%
Water conservation 29.5% 29.4%
Composting/biofuel 25.0% 23.5%
Other 2.3% 0.0%

CAPS Research2017 Investment Recovery Performance Benchmarking Report
Release Date: July 7, 2017
© 2017, Arizona Board of Regents on behalf of Arizona State University.11
# Benchmarks Mean Median Minimum MaximumNumber of
ParticipantsPrevious
Report Mean
17 On a scale of 1 - 5, average rating of the following statements (1 = Strongly Disagree, 5 = Strongly Agree):
Senior executives understand the value of Investment Recovery 3.7 60 3.7
Operations managers understand the value of Investment Recovery 3.8 60 3.9
18 Percent of organization's identified surplus assets managed: 73.0% 92.5% 0.0% 100.0% 58 76.8%
19Average number of days surplus assets are typically held or considered for redeployment before being marketed for external sale:
163 60 0 3600 52 160
When supported by policy, average number of days assets are held prior to being marketed for external sale: 76 60 0 365 21 136

CAPS Research2017 Investment Recovery Performance Benchmarking Report
Release Date: July 7, 2017
© 2017, Arizona Board of Regents on behalf of Arizona State University.12
# Benchmarks Mean Median Minimum MaximumNumber of
ParticipantsPrevious
Report Mean
In Place Planning Still an Opportunity Not Planned Number of
Participants
20 Percent of organizations that reported implementation of the following Investment Recovery Association best practices:
72.9% 18.6% 5.1% 3.4% 59
Strong Visible Management Support 67.8% 6.8% 20.3% 5.1% 59
59.3% 10.2% 27.1% 3.4% 59
External Networking 57.6% 13.6% 23.7% 5.1% 59
56.9% 15.5% 22.4% 5.2% 58
Supplier/Contractor Diversity Program 50.9% 7.0% 24.6% 17.5% 57
40.7% 25.4% 28.8% 5.1% 59
39.0% 16.9% 23.7% 20.3% 59
39.0% 6.8% 42.4% 11.9% 59
37.9% 17.2% 32.8% 12.1% 58
30.5% 20.3% 40.7% 8.5% 59
Utilization of the Triple Bottom Line (people, planet, profit) 26.8% 8.9% 37.5% 26.8% 56
Capture of Carbon Credits 20.0% 10.9% 21.8% 47.3% 55
21 Other IR processes considered by organizations as good/best practices: See Addendum A
Internet/intranet Utilization for Sales/Redeployment
Surplus Prevention and Return-to-Supplier processes
Value Chain (Decision Hierarchy) Approach to Surplus Asset Disposition
Surplus Asset Management Processes (identification, valuation, data base visibility, surplus matched with demand, etc.)
Regular Reporting of Metrics and Successes
Surplus and Refurbished Assets Considered before Buying New
Early Involvement with Other Corporate Activities (capital projects, real estate sales, upgrades, demolition, divestitures, plant shut-downs, etc.)
Supplier Integration and Support (IR service provider contracts in place, equipment refurbishment programs, integrated processes, etc.)

CAPS Research2017 Investment Recovery Performance Benchmarking Report
Release Date: July 7, 2017
© 2017, Arizona Board of Regents on behalf of Arizona State University.13
# Benchmarks Mean Median Minimum MaximumNumber of
ParticipantsPrevious
Report Mean
Electronic Commerce
22 Percent of total sales that resulted from the use of the Internet/intranet:
External sales via Internet Posting (excluding eAuctions): 18.3% 5.0% 0.0% 100.0% 45 15.6%
External sales via eAuctions: 20.9% 1.0% 0.0% 100.0% 46 9.3%
External sales via 3rd-party sellers or brokers (excluding eAuctions): 45.5% 40.0% 0.0% 100.0% 48 31.4%
23 Redeployment via intranet - percent of total transfers: 24.8% 0.0% 0.0% 100.0% 55 21.6%
24Percent of organizations in which the IR function is responsible for locating and purchasing used machinery and equipment:
11.7% 60 20.5%
25 Percent of organizations that use the following types of information systems for internal redeployment and surplus sales: 56
Combined company-wide redeployment and surplus sales system, web-based 28.6% 10.3%
Separate company-wide redeployment and surplus sales systems, both web-based 7.1% 10.3%
Separate company-wide redeployment and surplus sales systems, only surplus sales system web-based 5.4% 7.7%
One internal deployment system, plus multiple surplus sales systems, some web-based 8.9% 10.3%
No web-based information systems - use posted spreadsheets, lists, faxes, and/or email only 37.5% 46.2%
Other 12.5% 15.4%

CAPS Research2017 Investment Recovery Performance Benchmarking Report
Release Date: July 7, 2017
© 2017, Arizona Board of Regents on behalf of Arizona State University.14
# Benchmarks Mean Median Minimum MaximumNumber of
ParticipantsPrevious
Report Mean
26 Percent of organizations that use the following web-based technologies to promote surplus sales: 55
Maintain own company surplus sales website 34.5% 26.3%Actively submit company surplus sales website(s) to search engines for indexing 7.3% 13.2%
Maintain and use database or email list of prospective buyers 43.6% 55.3%
Rely solely on outside contract sales and auction firms 38.2% 39.5%
Rely on third-party websites for marketing of surplus 40.0% 34.2%
Investment Recovery Staffing
27 Investment recovery employees as a percent of total organization employees: 0.2% 0.0% 0.0% 2.7% 55 0.1%
Exempt investment recovery employees as a percent of total IR employees: 63.3% 60.0% 0.0% 100.0% 51 66.3%
Non-exempt investment recovery employees as a percent of total IR employees: 25.0% 0.0% 0.0% 100.0% 51 25.6%
In-house contractors as a percent of total IR employees: 11.7% 0.0% 0.0% 100.0% 51 8.1%
28 Percent of FTE IR employees that have:
Bachelor's degree 54.7% 50.0% 0.0% 100.0% 51 43.3%
Master's degree 24.6% 10.0% 0.0% 100.0% 39 15.5%
CMIR Certification 22.7% 10.0% 0.0% 100.0% 36 23.9%
Professional certification 20.2% 11.0% 0.0% 100.0% 35 15.5%
Less than 5 years of IR experience 38.9% 31.5% 0.0% 100.0% 58 31.9%
Between 5 and 15 years of IR experience 39.8% 33.0% 0.0% 100.0% 58 45.4%
More than 15 years of IR experience 21.2% 0.0% 0.0% 100.0% 58 20.1%
CAPS Research2017 Investment Recovery Performance Benchmarking Report
Release Date: July 7, 2017
© 2017, Arizona Board of Regents on behalf of Arizona State University.15
# Benchmarks Mean Median Minimum MaximumNumber of
ParticipantsPrevious
Report Mean
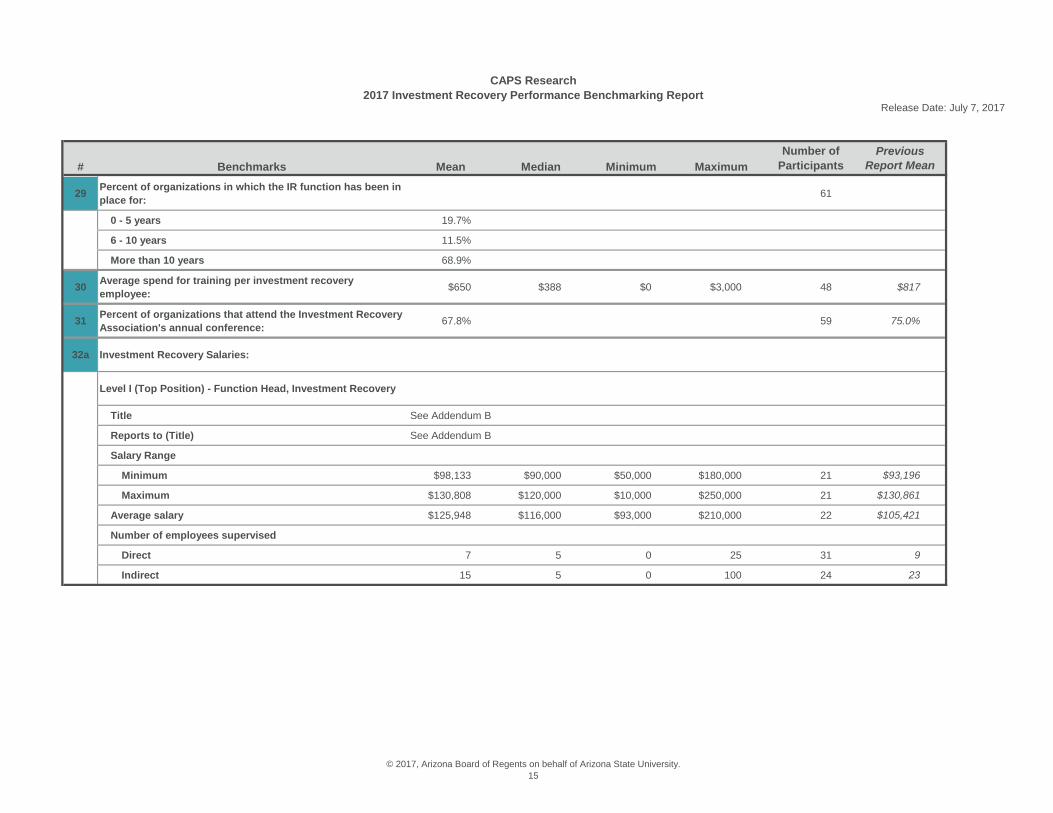
29 Percent of organizations in which the IR function has been in place for: 61
0 - 5 years 19.7%
6 - 10 years 11.5%
More than 10 years 68.9%
30 Average spend for training per investment recovery employee: $650 $388 $0 $3,000 48 $817
31 Percent of organizations that attend the Investment Recovery Association's annual conference: 67.8% 59 75.0%
32a Investment Recovery Salaries:
Level I (Top Position) - Function Head, Investment Recovery
Title See Addendum B
Reports to (Title) See Addendum B
Salary Range
Minimum $98,133 $90,000 $50,000 $180,000 21 $93,196
Maximum $130,808 $120,000 $10,000 $250,000 21 $130,861
Average salary $125,948 $116,000 $93,000 $210,000 22 $105,421
Number of employees supervised
Direct 7 5 0 25 31 9
Indirect 15 5 0 100 24 23

CAPS Research2017 Investment Recovery Performance Benchmarking Report
Release Date: July 7, 2017
© 2017, Arizona Board of Regents on behalf of Arizona State University.16
# Benchmarks Mean Median Minimum MaximumNumber of
ParticipantsPrevious
Report Mean
32b Level II - Sr. Investment Recovery Representative
Title See Addendum C
Salary Range
Minimum $70,098 $72,750 $33,000 $90,000 23 $70,930
Maximum $100,317 $98,000 $50,000 $140,000 23 $99,885
Number of employees in position 2 1 0 6 29 2
Average salary $86,806 $86,000 $42,000 $125,000 24 $81,708
32c Level III - Investment Recovery Representative
Title See Addendum D
Salary Range
Minimum $55,900 $60,850 $30,000 $68,000 10 $52,392
Maximum $85,480 $85,000 $72,000 $100,000 10 $78,019
Number of employees in position 1 1 0 4 13 3
Average salary $72,652 $74,000 $60,000 $80,000 11 $59,635
32d Level IV - Associate Investment Recovery Representative (Clerical, Support Staff)
Title See Addendum E
Salary Range
Minimum $43,225 $41,000 $35,000 $55,500 8 $40,598
Maximum $63,300 $60,000 $55,000 $80,100 8 $59,298
Number of employees in position 2 2 1 4 10 5
Average salary $61,364 $57,455 $50,000 $85,000 8 $56,121
Average number of union workers 1 1 0 3 9 3
Average number of contract/temporary workers 0 0 0 0 6

CAPS Research2017 Investment Recovery Performance Benchmarking Report
Release Date: July 7, 2017
© 2017, Arizona Board of Regents on behalf of Arizona State University.17
# Benchmarks Mean Median Minimum MaximumNumber of
ParticipantsPrevious
Report Mean
Paid by Employer Paid by Employee
Joint Contribution
33 Company Benefits:
Professional Support:
Professional License Fees 78.3% 17.4% 4.3% 46
Professional Society Dues 84.8% 15.2% 0.0% 46
Professional Publications 85.4% 12.5% 2.1% 48
Continuing Education 79.6% 12.2% 8.2% 49Attendance at Investment Recovery Association Conference 83.3% 16.7% 0.0% 48

CAPS Research2017 Investment Recovery Performance Benchmarking Report
Release Date: July 7, 2017
© 2017, Arizona Board of Regents on behalf of Arizona State University.18
Addendum A
Benchmark 21: Other Investment Recovery Best Practices
A fully integrated, dedicated Investment Recovery Program with supportive policies and procedures, metrics, annual goals and membership and involvement in the Investment Recovery Association.Automated transmittal of surplus assets from property management system directly to redeployment system.Buyer database sharing with other utilities.Catalyst life-cycle management.Clear policy how to price IR assets for sale.Collection and accountability of scrap sales.[Company] has an extensive recycling program that is primarily managed and reported for the entire Corporation by Investment Recovery. Not aware of another recycling program that is this extensive in the industry. Continuing to reduce our footprint to the environment.Contracts from competitive bidding work best.Defined progression plan for Investment Recovery Specialist.Donation of wood poles and reels to individuals for personal projects. Donations.Having vendors pay via ACH.Identification and elimination of single point vulnerability as it pertains to Investment Recovery Specialists skill sets. In the field, some Operations groups are taking a very active role in identifying surplus items, relocating and storing these items where appropriate, and promoting them across the company. Manage web based auction store front.Primary supply chain processes are tracking surplus materials and equipment and utilizing these for new purchasing requirements where possible, or using third party brokers where redeployment is unlikely.Recycling ink and toner cartridges.Reverse Supply Chain.Scrap paid monthly for all pickups vs per load.Selling to employees through intranet sales.Sustainable reuse with local community.Using workshop to brainstorm opportunities and assign stream leaders for various stream of waste.We adhere to guidelines set by our Capital Accounting Department and FERC to process the proceeds recovered for surplus and salvage assets.Working with a 3rd party to market our surplus machinery.

CAPS Research2017 Investment Recovery Performance Benchmarking Report
Release Date: July 7, 2017
© 2017, Arizona Board of Regents on behalf of Arizona State University.19
Benchmark 31: Level I Title Level I Reports to:
Asset Recovery Manager Asset ManagerDirector Category DirectorDirector, Surplus Division Chief Operation Officer (2 responses)Exess Programs Manager Deputy Commissioner OperationsFacilities Director Director (3 responses)Facilities Engineering Sr Mgr Director - Supply ChainFossil Materials management manager Director of OperationsGlobal Facilities Director Director Supply Chain ManagementGlobal MRO Service Lead Director, Trans & Materials Mgmt., Supply Chain ManagementInventory Manager EVP of Supply ChainInvestment Recovery Coordinator Executive VPInvestment Recovery Director Global MRO category managerIR Supervisor (2 responses) Global Operations and Inventory Management ManagerManager (2 responses) Indirect DirectorManager Non-Operation Material Manager (2 responses)Manager of Asset Control and Recovery Manager Material ServicesManager, Asset Accountability Manager of Supply Chain ManagementManager, Inventory Optimization, Asset Recovery & Recycling Manager Procurement OperationsManager, Investment Recovery (3 responses) Manager, Asset ManagementManager, Materials Management Managing DirectorProcurement Manager Managing Director, Supply Chain Strategy and SupportProgram Manager Procurement DirectorProperty Disposal Officer Program Management Director, Finance & Business OperationsSenior Manager Property Programs ManagerSenior Manager Program Decision Support Senior DirectorSenior Manager Senior ManagerSourcing Manager Supervisor, General Supply Chain SpecialistSupervisor, Investment Recovery & Material Master Data Supply Chain ManagerSupervisor, Materials Management SVP OperationsSupply Chain Supervisor Investment Recovery Vice President Business Operations and Technical SupportVice President, Corporate ProcurementVP of Engineering
Addendum B

CAPS Research2017 Investment Recovery Performance Benchmarking Report
Release Date: July 7, 2017
© 2016, Arizona Board of Regents on behalf of Arizona State University.20
Addendum C
Benchmark 31: Level II Titles (Sr. Investment Recovery Representative)
Asset Recovery AdministratorAsset Recovery Principle SpecialistBusiness AnalystDirector, Corporate ProcurementInv Recovery CoordinatorInventory Control SpecialistInvestment Recovery Analyst (3 responses)Investment Recovery CoordinatorInvestment Recovery ManagerInvestment Recovery Specialist (2 responses)Investment Recovery Specialist lInvestment Recovery Specialist, SrIR ConsultantMaterials AnalystProgram ManagerProject ManagerProperty Disposal SpecialistProperty ManagerSenior Asset Recovery CoordinatorSenior Investment Recovery SpecialistSenior IR PlannerSenior Supply Business AnalystSourcing Specialist IIISpecialistSr Materials ManagementSr Sourcing AnalystSr. Analyst, Inventory SystemsSupply Person Leader

CAPS Research2017 Investment Recovery Performance Benchmarking Report
Release Date: July 7, 2017
© 2017, Arizona Board of Regents on behalf of Arizona State University.21
Addendum D
Asset Disposition Analyst Investment Recovery Specialist llAsset Recovery Associate Specialist IR PlannerAsset Recovery Coordinator MDC SupervisorBusiness Information Technician Property and Receipt Control SpecialistDivision Surplus Equipment Administrator Purchasing Coordinator IInventory Control Specialist Site Procurement OperationsInvestment Recovery Specialist (2 responses) Supply Person
Addendum E
Administrator (2 responses) Material SpecialistBusiness Support Rep Reclamation ProcessorInventory Control Specialist Senior Support SpecialistInvestment Recovery Technician and Admin Supply Chain ClerkMaterial Processor Supply Tech
Benchmark 31: Level III (Investment Recovery Representative) Titles
Benchmark 31: Level IV (Associate Investment Recovery Representative) Titles

CAPS Research2017 Investment Recovery Performance Benchmarking Report
Investment Recovery Association Members Release Date: July 7, 2017
© 2017, Arizona Board of Regents on behalf of Arizona State University.22
# Benchmarks Mean Median Minimum MaximumNumber of
ParticipantsPrevious
Report Mean
Financial Information
1 Total cost benefit: $8,270,154 $5,531,000 $537,283 $32,982,000 32 $11,865,559
2 Total cost benefit dollars to operating expense dollars:This ratio should reflect XX:1 21 13 2 90 26 49
3 Total cost benefit dollars per transaction: $19,782 $8,704 $0 $160,000 25 $22,756
4 Total cost benefit provided by each investment recovery employee: $2,341,480 $1,395,000 $58,750 $11,383,982 32 $3,870,713
5 Total cost benefit provided by each exempt investment recovery employee: $4,290,813 $2,773,833 $268,642 $15,980,000 30 $5,856,106
6 Investment recovery third-party sales as a percent of total cost benefit: 30.5% 23.0% 0.0% 71.4% 23 23.9%
7 Net third-party sales as a percent of total cost benefit: 22.4% 15.9% 0.0% 60.3% 24 22.7%
8 Gross sales dollars as a percent of total cost benefit: 84.8% 98.2% 0.0% 100.0% 32 74.3%
Internal transfers/redeployments as a percent of total cost benefit: 9.9% 0.8% 0.0% 90.5% 32 20.4%
Other cost avoidance as a percent of total cost benefit: 5.2% 0.0% 0.0% 57.4% 32 5.3%
9 Operating expense per investment recovery employee including outsourcing expenses: $135,533 $124,749 $41,250 $302,500 26 $117,448
Operating expense per investment recovery employee excluding outsourcing expenses: $128,136 $124,749 $41,250 $250,000 26 $104,110

CAPS Research2017 Investment Recovery Performance Benchmarking Report
Investment Recovery Association Members Release Date: July 7, 2017
© 2017, Arizona Board of Regents on behalf of Arizona State University.23
# Benchmarks Mean Median Minimum MaximumNumber of
ParticipantsPrevious
Report Mean
10Company IR employees operating expense for salaries and payroll-related expenses as a percent of total operating expense:
85.3% 94.2% 39.7% 100.0% 26 83.9%
Non-allocated expenses as a percent of total operating expense: 2.3% 0.0% 0.0% 36.7% 26 1.9%
IT (Infrastructure and desktop support) expenses as a percent of total operating expense: 0.9% 0.0% 0.0% 8.7% 26 2.8%
Business systems expenses as a percent of total operating expense: 0.6% 0.0% 0.0% 4.7% 26 0.3%
Allocated expenses as a percent of total operating expense: 2.9% 0.0% 0.0% 54.5% 26 1.6%
In-house IR contractors/consultants operating expense as a percent of total operating expense: 2.4% 0.0% 0.0% 39.2% 26 1.8%
Direct cost of outsourced IR services as a percent of total operating expense: 3.1% 0.0% 0.0% 49.6% 26 3.6%
Other costs as a percent of total operating expense: 2.7% 2.0% 0.0% 9.6% 26 4.1%
11 Operating expense per transaction: $1,224 $639 $4 $6,313 20 $1,415

CAPS Research2017 Investment Recovery Performance Benchmarking Report
Investment Recovery Association Members Release Date: July 7, 2017
© 2017, Arizona Board of Regents on behalf of Arizona State University.24
# Benchmarks Mean Median Minimum MaximumNumber of
ParticipantsPrevious
Report Mean
Investment Recovery Processes and Best Practices
12 Percent of organizations that outsource some IR activities or services: 73.7% 38 75.0%
Percent of organizations that chose the following as one of the top five activities/services outsourced in 2016: 28
Auctions 78.6% 72.4%
Recycling/Scrap 46.4% 75.9%
Dismantling/Demolition 46.4% 44.8%
eAuction sales 42.9% 41.4%
Appraisals 28.6% 27.6%
Bid or negotiated sales 39.3% 27.6%
Environmental services 21.4% 24.1%
Equipment refurbishment 7.1% 17.2%
Surplus identification/characterization 10.7% 24.1%
Offsite surplus storage/management 3.6% 13.8%
Internal surplus redeployment 0.0% 6.9%
Used equipment searches 7.1% 10.3%
Internal staff augmentation 0.0% 13.8%
Other 3.6% 3.4%
13 Average number of transactions per IR employee: 1,560 173 6 30,004 24 321
Broker sales; Economic development; IT hardware equipment and IT salvage sales; Website creation

CAPS Research2017 Investment Recovery Performance Benchmarking Report
Investment Recovery Association Members Release Date: July 7, 2017
© 2017, Arizona Board of Regents on behalf of Arizona State University.25
# Benchmarks Mean Median Minimum MaximumNumber of
ParticipantsPrevious
Report Mean
14 Internal transfers/redeployments as a percent of total transactions: 13.2% 2.2% 0.0% 100.0% 25 23.9%
Third-party sales transactions as a percent of total transactions: 86.8% 97.8% 0.0% 100.0% 25 76.1%
15 Percent of organizations that require the use of Investment Recovery for disposal of surplus assets: 64.9% 37 67.6%
Percent of organizations that encourage the use of Investment Recovery for disposal of surplus assets: 29.7% 37 24.3%
Percent of organizations that have no policy regarding the use of Investment Recovery: 5.4% 37 8.1%
16 Percent of IR groups active in efforts to support sustainability requirements (e.g., landfill avoidance) 86.1% 36 87.8%
Of those IR groups, percent that are active in the following areas: 31
Landfill avoidance/Recycling 100.0% 100.0%
Employee education 67.7% 52.9%
Seek new diversions of waste streams 71.0% 61.8%
Hazmat handling/processing 54.8% 44.1%
Cradle-to-grave waste stream management 54.8% 52.9%
Sustainable metrics as top company goals 54.8% 41.2%
Water conservation 32.3% 29.4%
Composting/biofuel 29.0% 23.5%
Other 0.0% 0.0%

CAPS Research2017 Investment Recovery Performance Benchmarking Report
Investment Recovery Association Members Release Date: July 7, 2017
© 2017, Arizona Board of Regents on behalf of Arizona State University.26
# Benchmarks Mean Median Minimum MaximumNumber of
ParticipantsPrevious
Report Mean
17 On a scale of 1 - 5, average rating of the following statements (1 = Strongly Disagree, 5 = Strongly Agree):
Senior executives understand the value of Investment Recovery 3.7 38 3.7
Operations managers understand the value of Investment Recovery 3.9 38 3.9
18 Percent of organization's identified surplus assets managed: 80.4% 100.0% 1.0% 100.0% 38 76.8%
19Average number of days surplus assets are typically held or considered for redeployment before being marketed for external sale:
80 30 0 1000 35 160
When supported by policy, average number of days assets are held prior to being marketed for external sale: 47 30 0 180 13 136

CAPS Research2017 Investment Recovery Performance Benchmarking Report
Investment Recovery Association Members Release Date: July 7, 2017
© 2017, Arizona Board of Regents on behalf of Arizona State University.27
# Benchmarks Mean Median Minimum MaximumNumber of
ParticipantsPrevious
Report Mean
In Place Planning Still an Opportunity Not Planned Number of
Participants
20 Percent of organizations that reported implementation of the following Investment Recovery Association best practices:
83.8% 16.2% 0.0% 0.0% 37
Strong Visible Management Support 73.0% 5.4% 21.6% 0.0% 37
70.3% 16.2% 13.5% 0.0% 37
External Networking 78.4% 5.4% 13.5% 2.7% 37
70.3% 13.5% 16.2% 0.0% 37
Supplier/Contractor Diversity Program 66.7% 2.8% 22.2% 8.3% 36
45.9% 32.4% 21.6% 0.0% 37
54.1% 16.2% 21.6% 8.1% 37
35.1% 8.1% 43.2% 13.5% 37
47.2% 16.7% 27.8% 8.3% 36
37.8% 21.6% 32.4% 8.1% 37
Utilization of the Triple Bottom Line (people, planet, profit) 38.9% 8.3% 30.6% 22.2% 36
Capture of Carbon Credits 27.8% 11.1% 16.7% 44.4% 36
21 Other IR processes considered by organizations as good/best practices: See Addendum A
Internet/intranet Utilization for Sales/Redeployment
Surplus Prevention and Return-to-Supplier processes
Value Chain (Decision Hierarchy) Approach to Surplus Asset Disposition
Surplus Asset Management Processes (identification, valuation, data base visibility, surplus matched with demand, etc.)
Regular Reporting of Metrics and Successes
Surplus and Refurbished Assets Considered before Buying New
Early Involvement with Other Corporate Activities (capital projects, real estate sales, upgrades, demolition, divestitures, plant shut-downs, etc.)
Supplier Integration and Support (IR service provider contracts in place, equipment refurbishment programs, integrated processes, etc.)

CAPS Research2017 Investment Recovery Performance Benchmarking Report
Investment Recovery Association Members Release Date: July 7, 2017
© 2017, Arizona Board of Regents on behalf of Arizona State University.28
# Benchmarks Mean Median Minimum MaximumNumber of
ParticipantsPrevious
Report Mean
Electronic Commerce
22 Percent of total sales that resulted from the use of the Internet/intranet:
External sales via Internet Posting (excluding eAuctions): 18.5% 10.0% 0.0% 100.0% 30 15.6%
External sales via eAuctions: 24.9% 5.5% 0.0% 95.0% 30 9.3%
External sales via 3rd-party sellers or brokers (excluding eAuctions): 41.7% 24.0% 0.0% 100.0% 32 31.4%
23 Redeployment via intranet - percent of total transfers: 28.0% 3.5% 0.0% 100.0% 34 21.6%
24Percent of organizations in which the IR function is responsible for locating and purchasing used machinery and equipment:
5.3% 38 20.5%
25 Percent of organizations that use the following types of information systems for internal redeployment and surplus sales: 36
Combined company-wide redeployment and surplus sales system, web-based 33.3% 10.3%
Separate company-wide redeployment and surplus sales systems, both web-based 8.3% 10.3%
Separate company-wide redeployment and surplus sales systems, only surplus sales system web-based 8.3% 7.7%
One internal deployment system, plus multiple surplus sales systems, some web-based 8.3% 10.3%
No web-based information systems - use posted spreadsheets, lists, faxes, and/or email only 27.8% 46.2%
Other 13.9% 15.4%

CAPS Research2017 Investment Recovery Performance Benchmarking Report
Investment Recovery Association Members Release Date: July 7, 2017
© 2017, Arizona Board of Regents on behalf of Arizona State University.29
# Benchmarks Mean Median Minimum MaximumNumber of
ParticipantsPrevious
Report Mean
26 Percent of organizations that use the following web-based technologies to promote surplus sales: 36
Maintain own company surplus sales website 36.1% 26.3%Actively submit company surplus sales website(s) to search engines for indexing 8.3% 13.2%
Maintain and use database or email list of prospective buyers 52.8% 55.3%
Rely solely on outside contract sales and auction firms 38.9% 39.5%
Rely on third-party websites for marketing of surplus 41.7% 34.2%
Investment Recovery Staffing
27 Investment recovery employees as a percent of total organization employees: 0.1% 0.0% 0.0% 2.7% 35 0.1%
Exempt investment recovery employees as a percent of total IR employees: 61.8% 60.0% 12.5% 100.0% 33 66.3%
Non-exempt investment recovery employees as a percent of total IR employees: 28.5% 29.6% 0.0% 83.3% 33 25.6%
In-house contractors as a percent of total IR employees: 9.6% 0.0% 0.0% 66.7% 33 8.1%
28 Percent of FTE IR employees that have:
Bachelor's degree 61.0% 55.0% 0.0% 100.0% 34 43.3%
Master's degree 27.6% 17.0% 0.0% 100.0% 25 15.5%
CMIR Certification 30.7% 20.0% 0.0% 100.0% 24 23.9%
Professional certification 23.5% 13.0% 0.0% 100.0% 23 15.5%
Less than 5 years of IR experience 33.9% 25.0% 0.0% 100.0% 38 31.9%
Between 5 and 15 years of IR experience 41.4% 33.5% 0.0% 100.0% 38 45.4%
More than 15 years of IR experience 24.6% 0.0% 0.0% 100.0% 38 20.1%

CAPS Research2017 Investment Recovery Performance Benchmarking Report
Investment Recovery Association Members Release Date: July 7, 2017
© 2017, Arizona Board of Regents on behalf of Arizona State University.30
# Benchmarks Mean Median Minimum MaximumNumber of
ParticipantsPrevious
Report Mean
29 Percent of organizations in which the IR function has been in place for: 38
0 - 5 years 13.2%
6 - 10 years 5.3%
More than 10 years 81.6%
30 Average spend for training per investment recovery employee: $957 $833 $0 $3,000 29 $817
31 Percent of organizations that attend the Investment Recovery Association's annual conference: 94.7% 38 75.0%
32a Investment Recovery Salaries:
Level I (Top Position) - Function Head, Investment Recovery
Title See Addendum B
Reports to (Title) See Addendum B
Salary Range
Minimum $96,433 $90,000 $50,000 $180,000 18 $93,196
Maximum $129,276 $120,000 $10,000 $250,000 18 $130,861
Average salary $126,467 $115,000 $93,000 $210,000 19 $105,421
Number of employees supervised
Direct 6 4 0 23 23 9
Indirect 11 5 0 75 17 23

CAPS Research2017 Investment Recovery Performance Benchmarking Report
Investment Recovery Association Members Release Date: July 7, 2017
© 2017, Arizona Board of Regents on behalf of Arizona State University.31
# Benchmarks Mean Median Minimum MaximumNumber of
ParticipantsPrevious
Report Mean
32b Level II - Sr. Investment Recovery Representative
Title See Addendum C
Salary Range
Minimum $70,793 $72,750 $33,000 $90,000 21 $70,930
Maximum $100,824 $98,000 $50,000 $140,000 21 $99,885
Number of employees in position 2 1 0 6 24 2
Average salary $88,291 $87,000 $42,000 $125,000 21 $81,708
32c Level III - Investment Recovery Representative
Title See Addendum D
Salary Range
Minimum $58,778 $62,000 $40,000 $68,000 9 $52,392
Maximum $83,867 $85,000 $72,000 $96,800 9 $78,019
Number of employees in position 1 1 0 2 12 3
Average salary $72,652 $74,000 $60,000 $80,000 11 $59,635
32d Level IV - Associate Investment Recovery Representative (Clerical, Support Staff)
Title See Addendum E
Salary Range
Minimum $43,225 $41,000 $35,000 $55,500 8 $40,598
Maximum $63,300 $60,000 $55,000 $80,100 8 $59,298
Number of employees in position 2 2 1 4 10 5
Average salary $61,364 $57,455 $50,000 $85,000 8 $56,121
Average number of union workers 1 1 0 2 8 3
Average number of contract/temporary workers 0 0 0 0 5

CAPS Research2017 Investment Recovery Performance Benchmarking Report
Investment Recovery Association Members Release Date: July 7, 2017
© 2017, Arizona Board of Regents on behalf of Arizona State University.32
# Benchmarks Mean Median Minimum MaximumNumber of
ParticipantsPrevious
Report Mean
Paid by Employer Paid by Employee
Joint Contribution
33 Company Benefits:
Professional Support:
Professional License Fees 93.3% 3.3% 3.3% 30
Professional Society Dues 100.0% 0.0% 0.0% 32
Professional Publications 100.0% 0.0% 0.0% 33
Continuing Education 87.5% 6.3% 6.3% 32Attendance at Investment Recovery Association Conference 97.3% 2.7% 0.0% 37

CAPS Research2017 Investment Recovery Performance Benchmarking Report
Oil & Gas Release Date: July 7, 2017
© 2017, Arizona Board of Regents on behalf of Arizona State University.33
# Benchmarks Mean Median Minimum MaximumNumber of
ParticipantsPrevious
Report Mean
Financial Information
1 Total cost benefit: $10,129,833 $5,881,000 $35,000 $32,982,000 6 $11,865,559
3 Total cost benefit dollars per transaction: $46,354 $24,000 $5,000 $160,000 5 $22,756
4 Total cost benefit provided by each investment recovery employee: $1,375,993 $1,285,286 $10,769 $3,000,000 6 $3,870,713
5 Total cost benefit provided by each exempt investment recovery employee: $3,406,350 $4,000,000 $28,000 $6,000,000 5 $5,856,106
6 Investment recovery third-party sales as a percent of total cost benefit: 28.7% 4 23.9%
7 Net third-party sales as a percent of total cost benefit: 25.8% 4 22.7%
8 Gross sales dollars as a percent of total cost benefit: 77.1% 86.2% 37.5% 100.0% 6 74.3%
Internal transfers/redeployments as a percent of total cost benefit: 20.1% 5.2% 0.0% 62.5% 6 20.4%
Other cost avoidance as a percent of total cost benefit: 2.9% 0.0% 0.0% 14.3% 6 5.3%
Benchmarks not displayed contained insufficient data to report.

CAPS Research2017 Investment Recovery Performance Benchmarking Report
Oil & Gas Release Date: July 7, 2017
© 2017, Arizona Board of Regents on behalf of Arizona State University.34
# Benchmarks Mean Median Minimum MaximumNumber of
ParticipantsPrevious
Report Mean
Investment Recovery Processes and Best Practices
12 Percent of organizations that outsource some IR activities or services: 66.7% 9 75.0%
Percent of organizations that chose the following as one of the top five activities/services outsourced in 2016: 6
Auctions 33.3% 72.4%
Recycling/Scrap 100.0% 75.9%
Dismantling/Demolition 50.0% 44.8%
eAuction sales 66.7% 41.4%
Appraisals 66.7% 27.6%
Bid or negotiated sales 50.0% 27.6%
Environmental services 16.7% 24.1%
Equipment refurbishment 16.7% 17.2%
Surplus identification/characterization 33.3% 24.1%
Offsite surplus storage/management 16.7% 13.8%
Internal surplus redeployment 0.0% 6.9%
Used equipment searches 0.0% 10.3%
Internal staff augmentation 0.0% 13.8%
Other 16.7% 3.4%
13 Average number of transactions per IR employee: 80 4 321
Broker sales; Economic development; IT hardware equipment and IT salvage sales; Website creation

CAPS Research2017 Investment Recovery Performance Benchmarking Report
Oil & Gas Release Date: July 7, 2017
© 2017, Arizona Board of Regents on behalf of Arizona State University.35
# Benchmarks Mean Median Minimum MaximumNumber of
ParticipantsPrevious
Report Mean
14 Internal transfers/redeployments as a percent of total transactions: 28.4% 11.3% 0.0% 90.6% 6 23.9%
Third-party sales transactions as a percent of total transactions: 71.6% 88.7% 9.4% 100.0% 6 76.1%
15 Percent of organizations that require the use of Investment Recovery for disposal of surplus assets: 44.4% 9 67.6%
Percent of organizations that encourage the use of Investment Recovery for disposal of surplus assets: 33.3% 9 24.3%
Percent of organizations that have no policy regarding the use of Investment Recovery: 22.2% 9 8.1%
16 Percent of IR groups active in efforts to support sustainability requirements (e.g., landfill avoidance) 75.0% 8 87.8%
Of those IR groups, percent that are active in the following areas: 6
Landfill avoidance/Recycling 83.3% 100.0%
Employee education 50.0% 52.9%
Seek new diversions of waste streams 33.3% 61.8%
Hazmat handling/processing 66.7% 44.1%
Cradle-to-grave waste stream management 66.7% 52.9%
Sustainable metrics as top company goals 16.7% 41.2%
Water conservation 16.7% 29.4%
Composting/biofuel 0.0% 23.5%
Other 16.7% 0.0%
CAPS Research2017 Investment Recovery Performance Benchmarking Report
Oil & Gas Release Date: July 7, 2017
© 2017, Arizona Board of Regents on behalf of Arizona State University.36
# Benchmarks Mean Median Minimum MaximumNumber of
ParticipantsPrevious
Report Mean
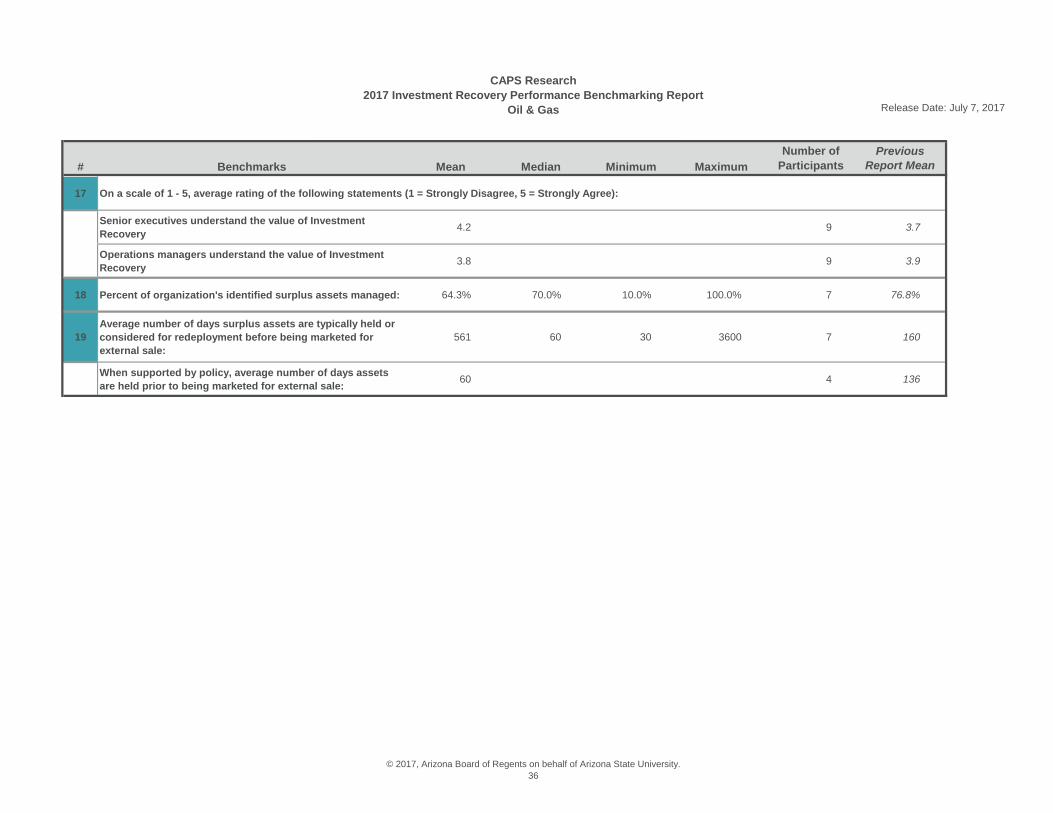
17 On a scale of 1 - 5, average rating of the following statements (1 = Strongly Disagree, 5 = Strongly Agree):
Senior executives understand the value of Investment Recovery 4.2 9 3.7
Operations managers understand the value of Investment Recovery 3.8 9 3.9
18 Percent of organization's identified surplus assets managed: 64.3% 70.0% 10.0% 100.0% 7 76.8%
19Average number of days surplus assets are typically held or considered for redeployment before being marketed for external sale:
561 60 30 3600 7 160
When supported by policy, average number of days assets are held prior to being marketed for external sale: 60 4 136

CAPS Research2017 Investment Recovery Performance Benchmarking Report
Oil & Gas Release Date: July 7, 2017
© 2017, Arizona Board of Regents on behalf of Arizona State University.37
# Benchmarks Mean Median Minimum MaximumNumber of
ParticipantsPrevious
Report Mean
In Place Planning Still an Opportunity Not Planned Number of
Participants
20 Percent of organizations that reported implementation of the following Investment Recovery Association best practices:
33.3% 44.4% 11.1% 11.1% 9
Strong Visible Management Support 66.7% 11.1% 11.1% 11.1% 9
55.6% 11.1% 33.3% 0.0% 9
External Networking 55.6% 22.2% 11.1% 11.1% 9
25.0% 50.0% 25.0% 0.0% 8
Supplier/Contractor Diversity Program 25.0% 0.0% 37.5% 37.5% 8
55.6% 22.2% 0.0% 22.2% 9
33.3% 22.2% 11.1% 33.3% 9
22.2% 11.1% 55.6% 11.1% 9
11.1% 22.2% 44.4% 22.2% 9
33.3% 22.2% 44.4% 0.0% 9
Utilization of the Triple Bottom Line (people, planet, profit) 0.0% 25.0% 25.0% 50.0% 8
Capture of Carbon Credits 0.0% 14.3% 14.3% 71.4% 7
21 Other IR processes considered by organizations as good/best practices: See Addendum A
Internet/intranet Utilization for Sales/Redeployment
Surplus Prevention and Return-to-Supplier processes
Value Chain (Decision Hierarchy) Approach to Surplus Asset Disposition
Surplus Asset Management Processes (identification, valuation, data base visibility, surplus matched with demand, etc.)
Regular Reporting of Metrics and Successes
Surplus and Refurbished Assets Considered before Buying New
Early Involvement with Other Corporate Activities (capital projects, real estate sales, upgrades, demolition, divestitures, plant shut-downs, etc.)
Supplier Integration and Support (IR service provider contracts in place, equipment refurbishment programs, integrated processes, etc.)

CAPS Research2017 Investment Recovery Performance Benchmarking Report
Oil & Gas Release Date: July 7, 2017
© 2017, Arizona Board of Regents on behalf of Arizona State University.38
# Benchmarks Mean Median Minimum MaximumNumber of
ParticipantsPrevious
Report Mean
Electronic Commerce
22 Percent of total sales that resulted from the use of the Internet/intranet:
External sales via Internet Posting (excluding eAuctions): 9.7% 10.0% 0.0% 28.0% 7 15.6%
External sales via eAuctions: 46.4% 47.5% 0.0% 95.0% 8 9.3%
External sales via 3rd-party sellers or brokers (excluding eAuctions): 37.3% 5.0% 0.0% 100.0% 7 31.4%
23 Redeployment via intranet - percent of total transfers: 17.5% 0.0% 0.0% 100.0% 8 21.6%
24Percent of organizations in which the IR function is responsible for locating and purchasing used machinery and equipment:
11.1% 9 20.5%
25 Percent of organizations that use the following types of information systems for internal redeployment and surplus sales: 9
Combined company-wide redeployment and surplus sales system, web-based 22.2% 10.3%
Separate company-wide redeployment and surplus sales systems, both web-based 11.1% 10.3%
Separate company-wide redeployment and surplus sales systems, only surplus sales system web-based 11.1% 7.7%
One internal deployment system, plus multiple surplus sales systems, some web-based 11.1% 10.3%
No web-based information systems - use posted spreadsheets, lists, faxes, and/or email only 44.4% 46.2%
Other 0.0% 15.4%

CAPS Research2017 Investment Recovery Performance Benchmarking Report
Oil & Gas Release Date: July 7, 2017
© 2017, Arizona Board of Regents on behalf of Arizona State University.39
# Benchmarks Mean Median Minimum MaximumNumber of
ParticipantsPrevious
Report Mean
26 Percent of organizations that use the following web-based technologies to promote surplus sales: 8
Maintain own company surplus sales website 37.5% 26.3%Actively submit company surplus sales website(s) to search engines for indexing 25.0% 13.2%
Maintain and use database or email list of prospective buyers 37.5% 55.3%
Rely solely on outside contract sales and auction firms 50.0% 39.5%
Rely on third-party websites for marketing of surplus 37.5% 34.2%
Investment Recovery Staffing
27 Investment recovery employees as a percent of total organization employees: 0.5% 0.2% 0.0% 2.7% 7 0.1%
Exempt investment recovery employees as a percent of total IR employees: 27.8% 33.3% 0.0% 50.0% 7 66.3%
Non-exempt investment recovery employees as a percent of total IR employees: 27.1% 0.0% 0.0% 90.0% 7 25.6%
In-house contractors as a percent of total IR employees: 45.0% 61.5% 0.0% 100.0% 7 8.1%
28 Percent of FTE IR employees that have:
Bachelor's degree 64.2% 55.0% 50.0% 100.0% 6 43.3%
Professional certification 24.0% 25.0% 10.0% 50.0% 5 15.5%
Less than 5 years of IR experience 50.4% 50.0% 0.0% 100.0% 7 31.9%
Between 5 and 15 years of IR experience 42.9% 33.0% 0.0% 100.0% 7 45.4%
More than 15 years of IR experience 6.7% 0.0% 0.0% 30.0% 7 20.1%

CAPS Research2017 Investment Recovery Performance Benchmarking Report
Oil & Gas Release Date: July 7, 2017
© 2017, Arizona Board of Regents on behalf of Arizona State University.40
# Benchmarks Mean Median Minimum MaximumNumber of
ParticipantsPrevious
Report Mean
29 Percent of organizations in which the IR function has been in place for: 9
0 - 5 years 44.4%
6 - 10 years 11.1%
More than 10 years 44.4%
30 Average spend for training per investment recovery employee: $716 $500 $0 $1,429 5 $817
31 Percent of organizations that attend the Investment Recovery Association's annual conference: 50.0% 8 75.0%
Paid by Employer Paid by Employee
Joint Contribution
33 Company Benefits:
Professional Support:
Professional License Fees 77.8% 22.2% 0.0% 9
Professional Society Dues 77.8% 22.2% 0.0% 9
Professional Publications 66.7% 22.2% 11.1% 9
Continuing Education 88.9% 11.1% 0.0% 9Attendance at Investment Recovery Association Conference 85.7% 14.3% 0.0% 7

CAPS Research2017 Investment Recovery Performance Benchmarking Report
All Utilities Release Date: July 7, 2017
© 2017, Arizona Board of Regents on behalf of Arizona State University.41
# Benchmarks Mean Median Minimum MaximumNumber of
ParticipantsPrevious
Report Mean
Financial Information
1 Total cost benefit: $8,724,840 $6,352,500 $500,000 $29,000,000 22 $11,865,559
2 Total cost benefit dollars to operating expense dollars:This ratio should reflect XX:1 24 15 2 90 20 49
3 Total cost benefit dollars per transaction: $21,613 $14,471 $552 $94,444 15 $22,756
4 Total cost benefit provided by each investment recovery employee: $3,005,404 $1,506,163 $58,750 $11,383,982 22 $3,870,713
5 Total cost benefit provided by each exempt investment recovery employee: $4,956,400 $2,666,667 $313,333 $15,980,000 19 $5,856,106
6 Investment recovery third-party sales as a percent of total cost benefit: 20.1% 9.8% 0.0% 65.6% 16 23.9%
7 Net third-party sales as a percent of total cost benefit: 14.9% 8.5% 0.0% 60.3% 18 22.7%
8 Gross sales dollars as a percent of total cost benefit: 93.8% 100.0% 42.6% 100.0% 22 74.3%
Internal transfers/redeployments as a percent of total cost benefit: 1.6% 0.0% 0.0% 14.2% 22 20.4%
Other cost avoidance as a percent of total cost benefit: 4.5% 0.0% 0.0% 57.4% 22 5.3%
9 Operating expense per investment recovery employee including outsourcing expenses: $126,444 $107,352 $41,250 $302,500 20 $117,448
Operating expense per investment recovery employee excluding outsourcing expenses: $117,233 $107,352 $41,250 $209,000 20 $104,110

CAPS Research2017 Investment Recovery Performance Benchmarking Report
All Utilities Release Date: July 7, 2017
© 2017, Arizona Board of Regents on behalf of Arizona State University.42
# Benchmarks Mean Median Minimum MaximumNumber of
ParticipantsPrevious
Report Mean
10Company IR employees operating expense for salaries and payroll-related expenses as a percent of total operating expense:
86.9% 95.7% 41.4% 100.0% 18 83.9%
Non-allocated expenses as a percent of total operating expense: 0.8% 0.0% 0.0% 6.1% 18 1.9%
IT (Infrastructure and desktop support) expenses as a percent of total operating expense: 0.7% 0.0% 0.0% 8.7% 18 2.8%
Business systems expenses as a percent of total operating expense: 0.2% 0.0% 0.0% 2.6% 18 0.3%
Allocated expenses as a percent of total operating expense: 3.3% 0.0% 0.0% 54.5% 18 1.6%
In-house IR contractors/consultants operating expense as a percent of total operating expense: 1.2% 0.0% 0.0% 21.2% 18 1.8%
Direct cost of outsourced IR services as a percent of total operating expense: 4.2% 0.0% 0.0% 49.6% 18 3.6%
Other costs as a percent of total operating expense: 2.7% 2.0% 0.0% 9.6% 18 4.1%
11 Operating expense per transaction: $1,454 $725 $77 $6,313 14 $1,415

CAPS Research2017 Investment Recovery Performance Benchmarking Report
All Utilities Release Date: July 7, 2017
© 2017, Arizona Board of Regents on behalf of Arizona State University.43
# Benchmarks Mean Median Minimum MaximumNumber of
ParticipantsPrevious
Report Mean
Investment Recovery Processes and Best Practices
12 Percent of organizations that outsource some IR activities or services: 70.8% 24 75.0%
Percent of organizations that chose the following as one of the top five activities/services outsourced in 2016: 17
Auctions 88.2% 72.4%
Recycling/Scrap 47.1% 75.9%
Dismantling/Demolition 76.5% 44.8%
eAuction sales 29.4% 41.4%
Appraisals 29.4% 27.6%
Bid or negotiated sales 23.5% 27.6%
Environmental services 41.2% 24.1%
Equipment refurbishment 11.8% 17.2%
Surplus identification/characterization 0.0% 24.1%
Offsite surplus storage/management 5.9% 13.8%
Internal surplus redeployment 0.0% 6.9%
Used equipment searches 0.0% 10.3%
Internal staff augmentation 0.0% 13.8%
Other 0.0% 3.4%
13 Average number of transactions per IR employee: 335 141 16 1,640 15 321
Broker sales; Economic development; IT hardware equipment and IT salvage sales; Website creation

CAPS Research2017 Investment Recovery Performance Benchmarking Report
All Utilities Release Date: July 7, 2017
© 2017, Arizona Board of Regents on behalf of Arizona State University.44
# Benchmarks Mean Median Minimum MaximumNumber of
ParticipantsPrevious
Report Mean
14 Internal transfers/redeployments as a percent of total transactions: 14.4% 1.6% 0.0% 100.0% 15 23.9%
Third-party sales transactions as a percent of total transactions: 85.6% 98.4% 0.0% 100.0% 15 76.1%
15 Percent of organizations that require the use of Investment Recovery for disposal of surplus assets: 75.0% 24 67.6%
Percent of organizations that encourage the use of Investment Recovery for disposal of surplus assets: 16.7% 24 24.3%
Percent of organizations that have no policy regarding the use of Investment Recovery: 8.3% 24 8.1%
16 Percent of IR groups active in efforts to support sustainability requirements (e.g., landfill avoidance) 91.7% 24 87.8%
Of those IR groups, percent that are active in the following areas: 22
Landfill avoidance/Recycling 95.5% 100.0%
Employee education 68.2% 52.9%
Seek new diversions of waste streams 77.3% 61.8%
Hazmat handling/processing 45.5% 44.1%
Cradle-to-grave waste stream management 45.5% 52.9%
Sustainable metrics as top company goals 59.1% 41.2%
Water conservation 22.7% 29.4%
Composting/biofuel 31.8% 23.5%
Other 0.0% 0.0%

CAPS Research2017 Investment Recovery Performance Benchmarking Report
All Utilities Release Date: July 7, 2017
© 2017, Arizona Board of Regents on behalf of Arizona State University.45
# Benchmarks Mean Median Minimum MaximumNumber of
ParticipantsPrevious
Report Mean
17 On a scale of 1 - 5, average rating of the following statements (1 = Strongly Disagree, 5 = Strongly Agree):
Senior executives understand the value of Investment Recovery 3.5 24 3.7
Operations managers understand the value of Investment Recovery 3.8 24 3.9
18 Percent of organization's identified surplus assets managed: 90.3% 100.0% 10.0% 100.0% 24 76.8%
19Average number of days surplus assets are typically held or considered for redeployment before being marketed for external sale:
105 50 0 1000 21 160
When supported by policy, average number of days assets are held prior to being marketed for external sale: 58 15 0 180 5 136

CAPS Research2017 Investment Recovery Performance Benchmarking Report
All Utilities Release Date: July 7, 2017
© 2017, Arizona Board of Regents on behalf of Arizona State University.46
# Benchmarks Mean Median Minimum MaximumNumber of
ParticipantsPrevious
Report Mean
In Place Planning Still an Opportunity Not Planned Number of
Participants
20 Percent of organizations that reported implementation of the following Investment Recovery Association best practices:
87.5% 12.5% 0.0% 0.0% 24
Strong Visible Management Support 70.8% 8.3% 20.8% 0.0% 24
66.7% 16.7% 16.7% 0.0% 24
External Networking 75.0% 8.3% 16.7% 0.0% 24
75.0% 12.5% 12.5% 0.0% 24
Supplier/Contractor Diversity Program 78.3% 4.3% 13.0% 4.3% 23
37.5% 33.3% 29.2% 0.0% 24
41.7% 16.7% 25.0% 16.7% 24
25.0% 4.2% 50.0% 20.8% 24
47.8% 17.4% 30.4% 4.3% 23
25.0% 20.8% 50.0% 4.2% 24
Utilization of the Triple Bottom Line (people, planet, profit) 45.5% 9.1% 31.8% 13.6% 22
Capture of Carbon Credits 27.3% 4.5% 22.7% 45.5% 22
21 Other IR processes considered by organizations as good/best practices: See Addendum A
Internet/intranet Utilization for Sales/Redeployment
Surplus Prevention and Return-to-Supplier processes
Value Chain (Decision Hierarchy) Approach to Surplus Asset Disposition
Surplus Asset Management Processes (identification, valuation, data base visibility, surplus matched with demand, etc.)
Regular Reporting of Metrics and Successes
Surplus and Refurbished Assets Considered before Buying New
Early Involvement with Other Corporate Activities (capital projects, real estate sales, upgrades, demolition, divestitures, plant shut-downs, etc.)
Supplier Integration and Support (IR service provider contracts in place, equipment refurbishment programs, integrated processes, etc.)

CAPS Research2017 Investment Recovery Performance Benchmarking Report
All Utilities Release Date: July 7, 2017
© 2017, Arizona Board of Regents on behalf of Arizona State University.47
# Benchmarks Mean Median Minimum MaximumNumber of
ParticipantsPrevious
Report Mean
Electronic Commerce
22 Percent of total sales that resulted from the use of the Internet/intranet:
External sales via Internet Posting (excluding eAuctions): 14.2% 5.0% 0.0% 100.0% 19 15.6%
External sales via eAuctions: 15.1% 0.0% 0.0% 80.0% 19 9.3%
External sales via 3rd-party sellers or brokers (excluding eAuctions): 34.5% 20.0% 0.0% 100.0% 20 31.4%
23 Redeployment via intranet - percent of total transfers: 14.2% 0.0% 0.0% 80.0% 22 21.6%
24Percent of organizations in which the IR function is responsible for locating and purchasing used machinery and equipment:
4.2% 24 20.5%
25 Percent of organizations that use the following types of information systems for internal redeployment and surplus sales: 21
Combined company-wide redeployment and surplus sales system, web-based 19.0% 10.3%
Separate company-wide redeployment and surplus sales systems, both web-based 4.8% 10.3%
Separate company-wide redeployment and surplus sales systems, only surplus sales system web-based 4.8% 7.7%
One internal deployment system, plus multiple surplus sales systems, some web-based 9.5% 10.3%
No web-based information systems - use posted spreadsheets, lists, faxes, and/or email only 42.9% 46.2%
Other 19.0% 15.4%

CAPS Research2017 Investment Recovery Performance Benchmarking Report
All Utilities Release Date: July 7, 2017
© 2017, Arizona Board of Regents on behalf of Arizona State University.48
# Benchmarks Mean Median Minimum MaximumNumber of
ParticipantsPrevious
Report Mean
26 Percent of organizations that use the following web-based technologies to promote surplus sales: 22
Maintain own company surplus sales website 27.3% 26.3%Actively submit company surplus sales website(s) to search engines for indexing 9.1% 13.2%
Maintain and use database or email list of prospective buyers 72.7% 55.3%
Rely solely on outside contract sales and auction firms 36.4% 39.5%
Rely on third-party websites for marketing of surplus 45.5% 34.2%
Investment Recovery Staffing
27 Investment recovery employees as a percent of total organization employees: 0.1% 0.0% 0.0% 0.7% 24 0.1%
Exempt investment recovery employees as a percent of total IR employees: 71.3% 100.0% 13.3% 100.0% 20 66.3%
Non-exempt investment recovery employees as a percent of total IR employees: 24.2% 0.0% 0.0% 83.3% 20 25.6%
In-house contractors as a percent of total IR employees: 4.5% 0.0% 0.0% 46.7% 20 8.1%
28 Percent of FTE IR employees that have:
Bachelor's degree 47.9% 50.0% 0.0% 100.0% 21 43.3%
Master's degree 29.9% 16.5% 0.0% 100.0% 18 15.5%
CMIR Certification 29.3% 20.0% 0.0% 100.0% 15 23.9%
Professional certification 21.0% 13.0% 0.0% 100.0% 15 15.5%
Less than 5 years of IR experience 32.3% 25.5% 0.0% 100.0% 24 31.9%
Between 5 and 15 years of IR experience 46.4% 42.5% 0.0% 100.0% 24 45.4%
More than 15 years of IR experience 21.2% 2.5% 0.0% 100.0% 24 20.1%

CAPS Research2017 Investment Recovery Performance Benchmarking Report
All Utilities Release Date: July 7, 2017
© 2017, Arizona Board of Regents on behalf of Arizona State University.49
# Benchmarks Mean Median Minimum MaximumNumber of
ParticipantsPrevious
Report Mean
29 Percent of organizations in which the IR function has been in place for: 24
0 - 5 years 8.3%
6 - 10 years 4.2%
More than 10 years 87.5%
30 Average spend for training per investment recovery employee: $841 $533 $0 $3,000 19 $817
31 Percent of organizations that attend the Investment Recovery Association's annual conference: 91.7% 24 75.0%
32a Investment Recovery Salaries:
Level I (Top Position) - Function Head, Investment Recovery
Title See Addendum B
Reports to (Title) See Addendum B
Salary Range
Minimum $98,400 $90,000 $60,000 $180,000 12 $93,196
Maximum $133,748 $122,500 $10,000 $250,000 12 $130,861
Average salary $128,989 $115,000 $98,000 $210,000 12 $105,421
Number of employees supervised
Direct 7 5 0 23 15 9
Indirect 16 1 0 75 10 23

CAPS Research2017 Investment Recovery Performance Benchmarking Report
All Utilities Release Date: July 7, 2017
© 2017, Arizona Board of Regents on behalf of Arizona State University.50
# Benchmarks Mean Median Minimum MaximumNumber of
ParticipantsPrevious
Report Mean
32b Level II - Sr. Investment Recovery Representative
Title See Addendum C
Salary Range
Minimum $70,116 $71,375 $50,000 $90,000 16 $70,930
Maximum $102,100 $97,500 $76,000 $140,000 16 $99,885
Number of employees in position 1 1 0 3 18 2
Average salary $88,707 $82,500 $70,000 $125,000 16 $81,708
32c Level III - Investment Recovery Representative
Title See Addendum D
Salary Range
Minimum $57,329 $62,000 $40,000 $65,000 7 $52,392
Maximum $83,000 $85,000 $72,000 $92,000 7 $78,019
Number of employees in position 1 1 0 2 10 3
Average salary $71,830 $72,000 $60,000 $80,000 9 $59,635
32d Level IV - Associate Investment Recovery Representative (Clerical, Support Staff)
Title See Addendum E
Salary Range
Minimum $42,357 $40,000 $35,000 $55,500 7 $40,598
Maximum $60,900 $60,000 $55,000 $69,300 7 $59,298
Number of employees in position 2 1 1 4 9 5
Average salary $60,601 $54,910 $50,000 $85,000 7 $56,121
Average number of union workers 1 1 0 2 7 3
Average number of contract/temporary workers 0 0 0 0 4

CAPS Research2017 Investment Recovery Performance Benchmarking Report
All Utilities Release Date: July 7, 2017
© 2017, Arizona Board of Regents on behalf of Arizona State University.51
# Benchmarks Mean Median Minimum MaximumNumber of
ParticipantsPrevious
Report Mean
Paid by Employer Paid by Employee
Joint Contribution
33 Company Benefits:
Professional Support:
Professional License Fees 94.4% 0.0% 5.6% 18
Professional Society Dues 100.0% 0.0% 0.0% 18
Professional Publications 100.0% 0.0% 0.0% 20
Continuing Education 90.0% 5.0% 5.0% 20Attendance at Investment Recovery Association Conference 95.7% 4.3% 0.0% 23

CAPS Research2017 Investment Recovery Performance Benchmarking Report
Utilities with Revenue >$5B Release Date: July 7, 2017
© 2017, Arizona Board of Regents on behalf of Arizona State University.52
# Benchmarks Mean Median Minimum MaximumNumber of
ParticipantsPrevious
Report Mean
Financial Information
1 Total cost benefit: $12,255,680 $11,875,000 $1,500,000 $29,000,000 14 $11,865,559
2 Total cost benefit dollars to operating expense dollars:This ratio should reflect XX:1 34 29 4 90 13 49
3 Total cost benefit dollars per transaction: $26,361 $20,132 $2,306 $94,444 10 $22,756
4 Total cost benefit provided by each investment recovery employee: $4,408,406 $3,458,333 $286,129 $11,383,982 14 $3,870,713
5 Total cost benefit provided by each exempt investment recovery employee: $6,779,406 $6,726,258 $1,635,504 $15,980,000 13 $5,856,106
6 Investment recovery third-party sales as a percent of total cost benefit: 26.1% 23.0% 0.0% 65.6% 11 23.9%
7 Net third-party sales as a percent of total cost benefit: 19.1% 10.9% 0.0% 60.3% 12 22.7%
8 Gross sales dollars as a percent of total cost benefit: 93.0% 100.0% 42.6% 100.0% 14 74.3%
Internal transfers/redeployments as a percent of total cost benefit: 2.4% 0.0% 0.0% 14.2% 14 20.4%
Other cost avoidance as a percent of total cost benefit: 4.6% 0.0% 0.0% 57.4% 14 5.3%
9 Operating expense per investment recovery employee including outsourcing expenses: $124,559 $101,000 $74,033 $211,898 13 $117,448
Operating expense per investment recovery employee excluding outsourcing expenses: $121,969 $101,000 $69,366 $209,000 13 $104,110

CAPS Research2017 Investment Recovery Performance Benchmarking Report
Utilities with Revenue >$5B Release Date: July 7, 2017
© 2017, Arizona Board of Regents on behalf of Arizona State University.53
# Benchmarks Mean Median Minimum MaximumNumber of
ParticipantsPrevious
Report Mean
10Company IR employees operating expense for salaries and payroll-related expenses as a percent of total operating expense:
85.7% 95.0% 41.4% 99.0% 12 83.9%
Non-allocated expenses as a percent of total operating expense: 0.9% 0.0% 0.0% 6.1% 12 1.9%
IT (Infrastructure and desktop support) expenses as a percent of total operating expense: 0.9% 0.0% 0.0% 8.7% 12 2.8%
Business systems expenses as a percent of total operating expense: 0.2% 0.0% 0.0% 2.6% 12 0.3%
Allocated expenses as a percent of total operating expense: 4.9% 0.0% 0.0% 54.5% 12 1.6%
In-house IR contractors/consultants operating expense as a percent of total operating expense: 1.8% 0.0% 0.0% 21.2% 12 1.8%
Direct cost of outsourced IR services as a percent of total operating expense: 2.0% 0.0% 0.0% 16.2% 12 3.6%
Other costs as a percent of total operating expense: 3.4% 2.7% 1.0% 9.6% 12 4.1%
11 Operating expense per transaction: $1,260 $604 $77 $6,313 9 $1,415

CAPS Research2017 Investment Recovery Performance Benchmarking Report
Utilities with Revenue >$5B Release Date: July 7, 2017
© 2017, Arizona Board of Regents on behalf of Arizona State University.54
# Benchmarks Mean Median Minimum MaximumNumber of
ParticipantsPrevious
Report Mean
Investment Recovery Processes and Best Practices
12 Percent of organizations that outsource some IR activities or services: 66.7% 15 75.0%
Percent of organizations that chose the following as one of the top five activities/services outsourced in 2016: 10
Auctions 100.0% 72.4%
Recycling/Scrap 40.0% 75.9%
Dismantling/Demolition 80.0% 44.8%
eAuction sales 20.0% 41.4%
Appraisals 30.0% 27.6%
Bid or negotiated sales 20.0% 27.6%
Environmental services 30.0% 24.1%
Equipment refurbishment 10.0% 17.2%
Surplus identification/characterization 0.0% 24.1%
Offsite surplus storage/management 0.0% 13.8%
Internal surplus redeployment 0.0% 6.9%
Used equipment searches 0.0% 10.3%
Internal staff augmentation 0.0% 13.8%
Other 0.0% 3.4%
13 Average number of transactions per IR employee: 407 217 16 1,640 10 321
Broker sales; Economic development; IT hardware equipment and IT salvage sales; Website creation

CAPS Research2017 Investment Recovery Performance Benchmarking Report
Utilities with Revenue >$5B Release Date: July 7, 2017
© 2017, Arizona Board of Regents on behalf of Arizona State University.55
# Benchmarks Mean Median Minimum MaximumNumber of
ParticipantsPrevious
Report Mean
14 Internal transfers/redeployments as a percent of total transactions: 10.3% 1.0% 0.0% 82.4% 10 23.9%
Third-party sales transactions as a percent of total transactions: 89.7% 99.0% 17.6% 100.0% 10 76.1%
15 Percent of organizations that require the use of Investment Recovery for disposal of surplus assets: 73.3% 15 67.6%
Percent of organizations that encourage the use of Investment Recovery for disposal of surplus assets: 20.0% 15 24.3%
Percent of organizations that have no policy regarding the use of Investment Recovery: 6.7% 15 8.1%
16 Percent of IR groups active in efforts to support sustainability requirements (e.g., landfill avoidance) 93.3% 15 87.8%
Of those IR groups, percent that are active in the following areas: 14
Landfill avoidance/Recycling 100.0% 100.0%
Employee education 64.3% 52.9%
Seek new diversions of waste streams 71.4% 61.8%
Hazmat handling/processing 21.4% 44.1%
Cradle-to-grave waste stream management 35.7% 52.9%
Sustainable metrics as top company goals 57.1% 41.2%
Water conservation 21.4% 29.4%
Composting/biofuel 28.6% 23.5%
Other 0.0% 0.0%

CAPS Research2017 Investment Recovery Performance Benchmarking Report
Utilities with Revenue >$5B Release Date: July 7, 2017
© 2017, Arizona Board of Regents on behalf of Arizona State University.56
# Benchmarks Mean Median Minimum MaximumNumber of
ParticipantsPrevious
Report Mean
17 On a scale of 1 - 5, average rating of the following statements (1 = Strongly Disagree, 5 = Strongly Agree):
Senior executives understand the value of Investment Recovery 3.4 15 3.7
Operations managers understand the value of Investment Recovery 3.7 15 3.9
18 Percent of organization's identified surplus assets managed: 89.2% 100.0% 10.0% 100.0% 15 76.8%
19Average number of days surplus assets are typically held or considered for redeployment before being marketed for external sale:
143 90 0 1000 13 160
When supported by policy, average number of days assets are held prior to being marketed for external sale: i.d. 136

CAPS Research2017 Investment Recovery Performance Benchmarking Report
Utilities with Revenue >$5B Release Date: July 7, 2017
© 2017, Arizona Board of Regents on behalf of Arizona State University.57
# Benchmarks Mean Median Minimum MaximumNumber of
ParticipantsPrevious
Report Mean
In Place Planning Still an Opportunity Not Planned Number of
Participants
20 Percent of organizations that reported implementation of the following Investment Recovery Association best practices:
86.7% 13.3% 0.0% 0.0% 15
Strong Visible Management Support 66.7% 13.3% 20.0% 0.0% 15
66.7% 20.0% 13.3% 0.0% 15
External Networking 86.7% 0.0% 13.3% 0.0% 15
80.0% 6.7% 13.3% 0.0% 15
Supplier/Contractor Diversity Program 86.7% 0.0% 13.3% 0.0% 15
26.7% 33.3% 40.0% 0.0% 15
33.3% 26.7% 26.7% 13.3% 15
20.0% 0.0% 60.0% 20.0% 15
53.3% 20.0% 20.0% 6.7% 15
20.0% 33.3% 40.0% 6.7% 15
Utilization of the Triple Bottom Line (people, planet, profit) 50.0% 14.3% 21.4% 14.3% 14
Capture of Carbon Credits 35.7% 7.1% 21.4% 35.7% 14
21 Other IR processes considered by organizations as good/best practices: See Addendum A
Internet/intranet Utilization for Sales/Redeployment
Surplus Prevention and Return-to-Supplier processes
Value Chain (Decision Hierarchy) Approach to Surplus Asset Disposition
Surplus Asset Management Processes (identification, valuation, data base visibility, surplus matched with demand, etc.)
Regular Reporting of Metrics and Successes
Surplus and Refurbished Assets Considered before Buying New
Early Involvement with Other Corporate Activities (capital projects, real estate sales, upgrades, demolition, divestitures, plant shut-downs, etc.)
Supplier Integration and Support (IR service provider contracts in place, equipment refurbishment programs, integrated processes, etc.)

CAPS Research2017 Investment Recovery Performance Benchmarking Report
Utilities with Revenue >$5B Release Date: July 7, 2017
© 2017, Arizona Board of Regents on behalf of Arizona State University.58
# Benchmarks Mean Median Minimum MaximumNumber of
ParticipantsPrevious
Report Mean
Electronic Commerce
22 Percent of total sales that resulted from the use of the Internet/intranet:
External sales via Internet Posting (excluding eAuctions): 14.6% 5.0% 0.0% 100.0% 12 15.6%
External sales via eAuctions: 11.8% 0.0% 0.0% 55.0% 12 9.3%
External sales via 3rd-party sellers or brokers (excluding eAuctions): 31.1% 20.0% 0.0% 100.0% 13 31.4%
23 Redeployment via intranet - percent of total transfers: 9.4% 0.0% 0.0% 80.0% 13 21.6%
24Percent of organizations in which the IR function is responsible for locating and purchasing used machinery and equipment:
6.7% 15 20.5%
25 Percent of organizations that use the following types of information systems for internal redeployment and surplus sales: 13
Combined company-wide redeployment and surplus sales system, web-based 7.7% 10.3%
Separate company-wide redeployment and surplus sales systems, both web-based 7.7% 10.3%
Separate company-wide redeployment and surplus sales systems, only surplus sales system web-based 0.0% 7.7%
One internal deployment system, plus multiple surplus sales systems, some web-based 7.7% 10.3%
No web-based information systems - use posted spreadsheets, lists, faxes, and/or email only 46.2% 46.2%
Other 30.8% 15.4%

CAPS Research2017 Investment Recovery Performance Benchmarking Report
Utilities with Revenue >$5B Release Date: July 7, 2017
© 2017, Arizona Board of Regents on behalf of Arizona State University.59
# Benchmarks Mean Median Minimum MaximumNumber of
ParticipantsPrevious
Report Mean
26 Percent of organizations that use the following web-based technologies to promote surplus sales: 14
Maintain own company surplus sales website 28.6% 26.3%Actively submit company surplus sales website(s) to search engines for indexing 7.1% 13.2%
Maintain and use database or email list of prospective buyers 85.7% 55.3%
Rely solely on outside contract sales and auction firms 28.6% 39.5%
Rely on third-party websites for marketing of surplus 28.6% 34.2%
Investment Recovery Staffing
27 Investment recovery employees as a percent of total organization employees: 0.0% 0.0% 0.0% 0.2% 15 0.1%
Exempt investment recovery employees as a percent of total IR employees: 74.4% 100.0% 13.3% 100.0% 14 66.3%
Non-exempt investment recovery employees as a percent of total IR employees: 22.3% 0.0% 0.0% 83.3% 14 25.6%
In-house contractors as a percent of total IR employees: 3.3% 0.0% 0.0% 46.7% 14 8.1%
28 Percent of FTE IR employees that have:
Bachelor's degree 55.1% 55.0% 0.0% 100.0% 14 43.3%
Master's degree 26.2% 16.5% 0.0% 100.0% 10 15.5%
CMIR Certification 27.0% 8.5% 0.0% 100.0% 10 23.9%
Professional certification 14.6% 11.0% 0.0% 50.0% 9 15.5%
Less than 5 years of IR experience 35.9% 30.0% 0.0% 100.0% 15 31.9%
Between 5 and 15 years of IR experience 45.8% 34.0% 0.0% 100.0% 15 45.4%
More than 15 years of IR experience 18.2% 0.0% 0.0% 60.0% 15 20.1%

CAPS Research2017 Investment Recovery Performance Benchmarking Report
Utilities with Revenue >$5B Release Date: July 7, 2017
© 2017, Arizona Board of Regents on behalf of Arizona State University.60
# Benchmarks Mean Median Minimum MaximumNumber of
ParticipantsPrevious
Report Mean
29 Percent of organizations in which the IR function has been in place for: 15
0 - 5 years 6.7%
6 - 10 years 0.0%
More than 10 years 93.3%
30 Average spend for training per investment recovery employee: $920 $833 $0 $3,000 12 $817
31 Percent of organizations that attend the Investment Recovery Association's annual conference: 93.3% 15 75.0%
32a Investment Recovery Salaries:
Level I (Top Position) - Function Head, Investment Recovery
Title See Addendum B
Reports to (Title) See Addendum B
Salary Range
Minimum $95,200 $90,000 $60,000 $180,000 9 $93,196
Maximum $128,330 $120,000 $10,000 $250,000 9 $130,861
Average salary $133,318 $115,000 $100,000 $210,000 9 $105,421
Number of employees supervised
Direct 7 5 2 15 11 9
Indirect 19 4 0 75 6 23

CAPS Research2017 Investment Recovery Performance Benchmarking Report
Utilities with Revenue >$5B Release Date: July 7, 2017
© 2017, Arizona Board of Regents on behalf of Arizona State University.61
# Benchmarks Mean Median Minimum MaximumNumber of
ParticipantsPrevious
Report Mean
32b Level II - Sr. Investment Recovery Representative
Title See Addendum C
Salary Range
Minimum $71,373 $70,000 $50,000 $90,000 11 $70,930
Maximum $101,200 $98,000 $76,000 $140,000 11 $99,885
Number of employees in position 2 1 1 3 13 2
Average salary $87,780 $80,000 $75,000 $120,000 10 $81,708
32c Level III - Investment Recovery Representative
Title See Addendum D
Salary Range
Minimum $60,217 $62,000 $53,300 $65,000 6 $52,392
Maximum $84,333 $85,000 $72,000 $92,000 6 $78,019
Number of employees in position 1 1 1 2 8 3
Average salary $73,424 $75,971 $60,000 $80,000 7 $59,635
32d Level IV - Associate Investment Recovery Representative (Clerical, Support Staff)
Title See Addendum E
Salary Range
Minimum $41,750 $40,000 $35,000 $55,500 6 $40,598
Maximum $61,050 $60,000 $55,000 $69,300 6 $59,298
Number of employees in position 2 1 1 4 7 5
Average salary $55,842 $53,000 $50,000 $69,300 5 $56,121
Average number of union workers 1 1 0 2 5 3
Average number of contract/temporary workers i.d.

CAPS Research2017 Investment Recovery Performance Benchmarking Report
Utilities with Revenue >$5B Release Date: July 7, 2017
© 2017, Arizona Board of Regents on behalf of Arizona State University.62
# Benchmarks Mean Median Minimum MaximumNumber of
ParticipantsPrevious
Report Mean
Paid by Employer Paid by Employee
Joint Contribution
33 Company Benefits:
Professional Support:
Professional License Fees 100.0% 0.0% 0.0% 10
Professional Society Dues 100.0% 0.0% 0.0% 10
Professional Publications 100.0% 0.0% 0.0% 12
Continuing Education 90.9% 0.0% 9.1% 11Attendance at Investment Recovery Association Conference 100.0% 0.0% 0.0% 14
i.d. indicates insufficient data

CAPS Research2017 Investment Recovery Performance Benchmarking Report
Utilities with Revenue <$5B Release Date: July 7, 2017
© 2017, Arizona Board of Regents on behalf of Arizona State University.63
# Benchmarks Mean Median Minimum MaximumNumber of
ParticipantsPrevious
Report Mean
Financial Information
1 Total cost benefit: $2,545,871 $1,393,485 $500,000 $6,705,000 8 $11,865,559
2 Total cost benefit dollars to operating expense dollars:This ratio should reflect XX:1 6 5 2 13 7 49
3 Total cost benefit dollars per transaction: $12,117 $9,434 $552 $30,642 5 $22,756
4 Total cost benefit provided by each investment recovery employee: $550,152 $521,875 $58,750 $1,260,000 8 $3,870,713
5 Total cost benefit provided by each exempt investment recovery employee: $1,006,553 $865,493 $313,333 $2,235,000 6 $5,856,106
6 Investment recovery third-party sales as a percent of total cost benefit: 6.9% 1.0% 0.0% 19.8% 5 23.9%
7 Net third-party sales as a percent of total cost benefit: 6.3% 5.3% 0.0% 15.5% 6 22.7%
8 Gross sales dollars as a percent of total cost benefit: 95.3% 99.6% 79.4% 100.0% 8 74.3%
Internal transfers/redeployments as a percent of total cost benefit: 0.3% 0.0% 0.0% 1.1% 8 20.4%
Other cost avoidance as a percent of total cost benefit: 4.4% 0.0% 0.0% 19.8% 8 5.3%
9 Operating expense per investment recovery employee including outsourcing expenses: $129,946 $123,197 $41,250 $302,500 7 $117,448
Operating expense per investment recovery employee excluding outsourcing expenses: $108,438 $123,197 $41,250 $172,727 7 $104,110

CAPS Research2017 Investment Recovery Performance Benchmarking Report
Utilities with Revenue <$5B Release Date: July 7, 2017
© 2017, Arizona Board of Regents on behalf of Arizona State University.64
# Benchmarks Mean Median Minimum MaximumNumber of
ParticipantsPrevious
Report Mean
10Company IR employees operating expense for salaries and payroll-related expenses as a percent of total operating expense:
89.2% 96.9% 49.6% 100.0% 6 83.9%
Non-allocated expenses as a percent of total operating expense: 0.6% 0.0% 0.0% 3.8% 6 1.9%
IT (Infrastructure and desktop support) expenses as a percent of total operating expense: 0.3% 0.0% 0.0% 1.9% 6 2.8%
Business systems expenses as a percent of total operating expense: 0.0% 0.0% 0.0% 0.0% 6 0.3%
Allocated expenses as a percent of total operating expense: 0.1% 0.0% 0.0% 0.8% 6 1.6%
In-house IR contractors/consultants operating expense as a percent of total operating expense: 0.1% 0.0% 0.0% 0.3% 6 1.8%
Direct cost of outsourced IR services as a percent of total operating expense: 8.4% 0.0% 0.0% 49.6% 6 3.6%
Other costs as a percent of total operating expense: 1.2% 0.6% 0.0% 4.3% 6 4.1%
11 Operating expense per transaction: $1,802 $917 $107 $5,867 5 $1,415

CAPS Research2017 Investment Recovery Performance Benchmarking Report
Utilities with Revenue <$5B Release Date: July 7, 2017
© 2017, Arizona Board of Regents on behalf of Arizona State University.65
# Benchmarks Mean Median Minimum MaximumNumber of
ParticipantsPrevious
Report Mean
Investment Recovery Processes and Best Practices
12 Percent of organizations that outsource some IR activities or services: 77.8% 9 75.0%
Percent of organizations that chose the following as one of the top five activities/services outsourced in 2016: 7
Auctions 71.4% 72.4%
Recycling/Scrap 57.1% 75.9%
Dismantling/Demolition 71.4% 44.8%
eAuction sales 42.9% 41.4%
Appraisals 28.6% 27.6%
Bid or negotiated sales 28.6% 27.6%
Environmental services 57.1% 24.1%
Equipment refurbishment 14.3% 17.2%
Surplus identification/characterization 0.0% 24.1%
Offsite surplus storage/management 14.3% 13.8%
Internal surplus redeployment 0.0% 6.9%
Used equipment searches 0.0% 10.3%
Internal staff augmentation 0.0% 13.8%
Other 0.0% 3.4%
13 Average number of transactions per IR employee: 191 53 21 675 5 321
Broker sales; Economic development; IT hardware equipment and IT salvage sales; Website creation

CAPS Research2017 Investment Recovery Performance Benchmarking Report
Utilities with Revenue <$5B Release Date: July 7, 2017
© 2017, Arizona Board of Regents on behalf of Arizona State University.66
# Benchmarks Mean Median Minimum MaximumNumber of
ParticipantsPrevious
Report Mean
14 Internal transfers/redeployments as a percent of total transactions: 22.6% 5.7% 0.0% 100.0% 5 23.9%
Third-party sales transactions as a percent of total transactions: 77.4% 94.3% 0.0% 100.0% 5 76.1%
15 Percent of organizations that require the use of Investment Recovery for disposal of surplus assets: 77.8% 9 67.6%
Percent of organizations that encourage the use of Investment Recovery for disposal of surplus assets: 11.1% 9 24.3%
Percent of organizations that have no policy regarding the use of Investment Recovery: 11.1% 9 8.1%
16 Percent of IR groups active in efforts to support sustainability requirements (e.g., landfill avoidance) 88.9% 9 87.8%
Of those IR groups, percent that are active in the following areas: 8
Landfill avoidance/Recycling 87.5% 100.0%
Employee education 75.0% 52.9%
Seek new diversions of waste streams 87.5% 61.8%
Hazmat handling/processing 87.5% 44.1%
Cradle-to-grave waste stream management 62.5% 52.9%
Sustainable metrics as top company goals 62.5% 41.2%
Water conservation 25.0% 29.4%
Composting/biofuel 37.5% 23.5%
Other 0.0% 0.0%

CAPS Research2017 Investment Recovery Performance Benchmarking Report
Utilities with Revenue <$5B Release Date: July 7, 2017
© 2017, Arizona Board of Regents on behalf of Arizona State University.67
# Benchmarks Mean Median Minimum MaximumNumber of
ParticipantsPrevious
Report Mean
17 On a scale of 1 - 5, average rating of the following statements (1 = Strongly Disagree, 5 = Strongly Agree):
Senior executives understand the value of Investment Recovery 3.7 9 3.7
Operations managers understand the value of Investment Recovery 3.9 9 3.9
18 Percent of organization's identified surplus assets managed: 92.2% 100.0% 75.0% 100.0% 9 76.8%
19Average number of days surplus assets are typically held or considered for redeployment before being marketed for external sale:
44 25 0 180 8 160
When supported by policy, average number of days assets are held prior to being marketed for external sale: i.d. 136

CAPS Research2017 Investment Recovery Performance Benchmarking Report
Utilities with Revenue <$5B Release Date: July 7, 2017
© 2017, Arizona Board of Regents on behalf of Arizona State University.68
# Benchmarks Mean Median Minimum MaximumNumber of
ParticipantsPrevious
Report Mean
In Place Planning Still an Opportunity Not Planned Number of
Participants
20 Percent of organizations that reported implementation of the following Investment Recovery Association best practices:
88.9% 11.1% 0.0% 0.0% 9
Strong Visible Management Support 77.8% 0.0% 22.2% 0.0% 9
66.7% 11.1% 22.2% 0.0% 9
External Networking 55.6% 22.2% 22.2% 0.0% 9
66.7% 22.2% 11.1% 0.0% 9
Supplier/Contractor Diversity Program 62.5% 12.5% 12.5% 12.5% 8
55.6% 33.3% 11.1% 0.0% 9
55.6% 0.0% 22.2% 22.2% 9
33.3% 11.1% 33.3% 22.2% 9
37.5% 12.5% 50.0% 0.0% 8
33.3% 0.0% 66.7% 0.0% 9
Utilization of the Triple Bottom Line (people, planet, profit) 37.5% 0.0% 50.0% 12.5% 8
Capture of Carbon Credits 12.5% 0.0% 25.0% 62.5% 8
21 Other IR processes considered by organizations as good/best practices: See Addendum A
Internet/intranet Utilization for Sales/Redeployment
Surplus Prevention and Return-to-Supplier processes
Value Chain (Decision Hierarchy) Approach to Surplus Asset Disposition
Surplus Asset Management Processes (identification, valuation, data base visibility, surplus matched with demand, etc.)
Regular Reporting of Metrics and Successes
Surplus and Refurbished Assets Considered before Buying New
Early Involvement with Other Corporate Activities (capital projects, real estate sales, upgrades, demolition, divestitures, plant shut-downs, etc.)
Supplier Integration and Support (IR service provider contracts in place, equipment refurbishment programs, integrated processes, etc.)

CAPS Research2017 Investment Recovery Performance Benchmarking Report
Utilities with Revenue <$5B Release Date: July 7, 2017
© 2017, Arizona Board of Regents on behalf of Arizona State University.69
# Benchmarks Mean Median Minimum MaximumNumber of
ParticipantsPrevious
Report Mean
Electronic Commerce
22 Percent of total sales that resulted from the use of the Internet/intranet:
External sales via Internet Posting (excluding eAuctions): 13.6% 0.0% 0.0% 50.0% 7 15.6%
External sales via eAuctions: 20.7% 5.0% 0.0% 80.0% 7 9.3%
External sales via 3rd-party sellers or brokers (excluding eAuctions): 40.7% 10.0% 0.0% 100.0% 7 31.4%
23 Redeployment via intranet - percent of total transfers: 21.1% 0.0% 0.0% 75.0% 9 21.6%
24Percent of organizations in which the IR function is responsible for locating and purchasing used machinery and equipment:
0.0% 9 20.5%
25 Percent of organizations that use the following types of information systems for internal redeployment and surplus sales: 8
Combined company-wide redeployment and surplus sales system, web-based 37.5% 10.3%
Separate company-wide redeployment and surplus sales systems, both web-based 0.0% 10.3%
Separate company-wide redeployment and surplus sales systems, only surplus sales system web-based 12.5% 7.7%
One internal deployment system, plus multiple surplus sales systems, some web-based 12.5% 10.3%
No web-based information systems - use posted spreadsheets, lists, faxes, and/or email only 37.5% 46.2%
Other 0.0% 15.4%

CAPS Research2017 Investment Recovery Performance Benchmarking Report
Utilities with Revenue <$5B Release Date: July 7, 2017
© 2017, Arizona Board of Regents on behalf of Arizona State University.70
# Benchmarks Mean Median Minimum MaximumNumber of
ParticipantsPrevious
Report Mean
26 Percent of organizations that use the following web-based technologies to promote surplus sales: 8
Maintain own company surplus sales website 25.0% 26.3%Actively submit company surplus sales website(s) to search engines for indexing 12.5% 13.2%
Maintain and use database or email list of prospective buyers 50.0% 55.3%
Rely solely on outside contract sales and auction firms 50.0% 39.5%
Rely on third-party websites for marketing of surplus 75.0% 34.2%
Investment Recovery Staffing
27 Investment recovery employees as a percent of total organization employees: 0.2% 0.1% 0.0% 0.7% 9 0.1%
Exempt investment recovery employees as a percent of total IR employees: 64.2% 75.0% 16.7% 100.0% 6 66.3%
Non-exempt investment recovery employees as a percent of total IR employees: 28.7% 25.0% 0.0% 72.2% 6 25.6%
In-house contractors as a percent of total IR employees: 7.1% 0.0% 0.0% 31.3% 6 8.1%
28 Percent of FTE IR employees that have:
Bachelor's degree 33.4% 25.0% 0.0% 100.0% 7 43.3%
Master's degree 34.5% 13.0% 0.0% 100.0% 8 15.5%
CMIR Certification 34.0% 25.0% 0.0% 100.0% 5 23.9%
Professional certification 30.7% 16.5% 0.0% 100.0% 6 15.5%
Less than 5 years of IR experience 26.4% 13.0% 0.0% 100.0% 9 31.9%
Between 5 and 15 years of IR experience 47.4% 50.0% 0.0% 100.0% 9 45.4%
More than 15 years of IR experience 26.1% 10.0% 0.0% 100.0% 9 20.1%

CAPS Research2017 Investment Recovery Performance Benchmarking Report
Utilities with Revenue <$5B Release Date: July 7, 2017
© 2017, Arizona Board of Regents on behalf of Arizona State University.71
# Benchmarks Mean Median Minimum MaximumNumber of
ParticipantsPrevious
Report Mean
29 Percent of organizations in which the IR function has been in place for: 9
0 - 5 years 11.1%
6 - 10 years 11.1%
More than 10 years 77.8%
30 Average spend for training per investment recovery employee: $707 $0 $0 $2,500 7 $817
31 Percent of organizations that attend the Investment Recovery Association's annual conference: 88.9% 9 75.0%
32a Investment Recovery Salaries:
Level I (Top Position) - Function Head, Investment Recovery
Title See Addendum B
Reports to (Title) See Addendum B
Salary Range
Minimum i.d. $93,196
Maximum i.d. $130,861
Average salary i.d. $105,421
Number of employees supervised
Direct 9 4 9
Indirect 10 4 23

CAPS Research2017 Investment Recovery Performance Benchmarking Report
Utilities with Revenue <$5B Release Date: July 7, 2017
© 2017, Arizona Board of Regents on behalf of Arizona State University.72
# Benchmarks Mean Median Minimum MaximumNumber of
ParticipantsPrevious
Report Mean
32b Level II - Sr. Investment Recovery Representative
Title See Addendum C
Salary Range
Minimum $67,350 $72,750 $50,000 $85,000 5 $70,930
Maximum $104,080 $97,000 $90,000 $135,000 5 $99,885
Number of employees in position 1 1 0 2 5 2
Average salary $90,250 $88,750 $70,000 $125,000 6 $81,708
32c Level III - Investment Recovery Representative
Title See Addendum D
Salary Range
Minimum i.d. $52,392
Maximum i.d. $78,019
Number of employees in position i.d. 3
Average salary i.d. $59,635
32d Level IV - Associate Investment Recovery Representative (Clerical, Support Staff)
Title See Addendum E
Salary Range
Minimum i.d. $40,598
Maximum i.d. $59,298
Number of employees in position i.d. 5
Average salary i.d. $56,121
Average number of union workers i.d. 3
Average number of contract/temporary workers i.d.

CAPS Research2017 Investment Recovery Performance Benchmarking Report
Utilities with Revenue <$5B Release Date: July 7, 2017
© 2017, Arizona Board of Regents on behalf of Arizona State University.73
# Benchmarks Mean Median Minimum MaximumNumber of
ParticipantsPrevious
Report Mean
Paid by Employer Paid by Employee
Joint Contribution
33 Company Benefits:
Professional Support:
Professional License Fees 87.5% 0.0% 12.5% 8
Professional Society Dues 100.0% 0.0% 0.0% 8
Professional Publications 100.0% 0.0% 0.0% 8
Continuing Education 88.9% 11.1% 0.0% 9Attendance at Investment Recovery Association Conference 88.9% 11.1% 0.0% 9
i.d. indicates insufficient data