investment outlook - globenewswire
TRANSCRIPT

Investment Outlook
September 2018

3Investment Outlook: September 2018
03 Contents
04 Introduction
Divided view of the economic cycle
05 Asset class allocation
06 Risk exposure and allocation
07-09 Theme – Economic and market cycles
A more defensive trend so far during 2018
10-11 Market view – macro
Persistent growth is defying political risks
12-13 Global equities
Continued strong corporate reports, but political worries dampen the mood
14-16 Nordic equities
A new reality ahead?
17-18 Fixed income investments
Challenging environment for fixed income
19-20 Alternative investments
Uncertain prospects can both help and hurt
Oil prices near current levels for the rest of 2018
21-22 Currencies
Changes in risk appetite trigger large movements
23 Contact information
Contents
4 Investment Outlook: September 2018
In the last two issues of Investment Outlook, we have emphasised that we are in the latter part of the economic cycle. We expected this to result in greater instability and less risk tolerance among investors, yet we maintained our recommendation to stay overweight in equities and corporate bonds.
Duringthesummer,riskappetiteinitiallyfellandlaterrose.SinceJanuary2018,investors have successively reallocated their portfolios towards a larger element of defensive assets. This trend has unfolded gradually and in orderly fashion, unlikethemoredramaticfallinriskappetiteinlate2015andearly2016.Atthattime, there was great concern that the economy was on the brink of downturn, and we also had extremely low oil prices that were squeezing parts of the corporatesectorandcertainoil-producingcountries.
Today we have a completely different situation. The global economic growth rate is healthy, inflation has slowly reverted to more desirable levels and the latest corporate report season was very strong. In spite of this, the stock and fixed income markets basically remain flat, in local currency terms. There are thus other forces which are dampening risk appetite. These include disruptive variables such as more and more signs that we are in the latter phase of the economic cycle, more uneven performance as regards global growth and different segments of the capital market, trade conflicts and the US Federal Reserve’s moves towards a less stimulative policy including higher key interest rates.
For the first time in years, we have therefore chosen to reduce our risk exposure to a neutral level. We remain structurally optimistic, but are tactically more cautious. The equation is fairly complicated. For this reason, we are providing aspecialin-depthanalysisonthethemeof“Economicandmarketcycles”,especially the impact of these cycles on asset markets and our view of where we stand today.
One important determinant of an optimistic or a cautious view of the future is assessing how much vitality is left in the economic cycle, both in terms of strength and duration. If the strong expansion lasts longer, the defensive trend may be reversed. If the expansion is cut short, we will see a continuation of the current trend towards a more cautious attitude among investors.
Wishing you enjoyable reading,
Fredrik Öberg Chief Investment Officer
Investment Strategy
IntroductionDivided view of the economic cycle
5Investment Outlook: September 2018
Alternative investments Return Risk
Hedge funds 3.5 6.0
Commodities 2.4 10.0Source:SEB
Equities
• Despite the trade war, falling commodity prices, a strong US dollar and emerging market turmoil, the MSCI All Country World Index is largely unchanged in local currencies from June and up about 5 per cent in Swedish kronor.
• The US quarterly report season was impressive: earnings up around 25 per cent, sales up around 10 per cent. Lower but healthy figures in the rest of the world.
• Equityvaluationsarethuslower,whichisnormallateinan economic cycle.
• Very large differences in returns between sectors, regions and countries – this will continue.
• Companies can raise prices to offset inflation pressure on their own costs.
• Chinese equity valuations are historically low due to the trade war, weaker economic data and marginally tighter lending standards.
• Return expectations for equities remain higher than for other asset classes, driven by a good corporate earnings outlook.
• We expect higher volatility than during the relative calm prevailing in 2016 and 2017.
We now have a neutral weight in equities compared to fixed income and alternative investments. During 2018 we have successively decreased the propor-tion of equities in our portfolios, since we are in the late phase of an economic cycle. However, we are still strategically positive towards having risk in our portfolios. The latest adjustment to a neutral stance also includes tactical arguments that are causing us to end up at a neutral risk level in the short term. These strategic and tactical factors are discussed in the“Riskexposureandallocation”sectionandinthe“Economicandmarketcycles”themearticle.
Return expectations, next 12 months
Equities Return Risk
Global equities 6.7 11.8
Emergingmarketequities (local currencies)
9.0 13.8
Swedish equities 8.5 11.7
Fixed income investments Return Risk
Government bonds -2.6 1.5
Corporate bonds, investmentgrade(EuropeIG)
0.2 2.9
Corporate bonds, highyield(EuropeHY)
2.7 5.1
Emergingmarketdebt(local currencies)
5.7 11.5
Fixed income investments
• Central banks have begun cautious monetary policy normalisation.
• US economic performance continues to support planned Federal Reserve (Fed) key interest rate hikes.
• TheEuropeanCentralBank(ECB)isreducingitsbond-buyingbutwillnothikethekeyrateforawhile.
• The trade war and a strong US dollar are causing worries about fixed income investments in emerging markets.
Alternative investments
• Volatility early in 2018 faded a bit during the summer.• The trade war and strong quarterly reports are creating
performance gaps within and between asset classes.• Event-drivenhedgefundstrategiescontinuetobenefit
fromarecord-strongcorporatetransactionmarket.• A continued relatively trendless market that is difficult
for CTAs to navigate.
Asset class allocation
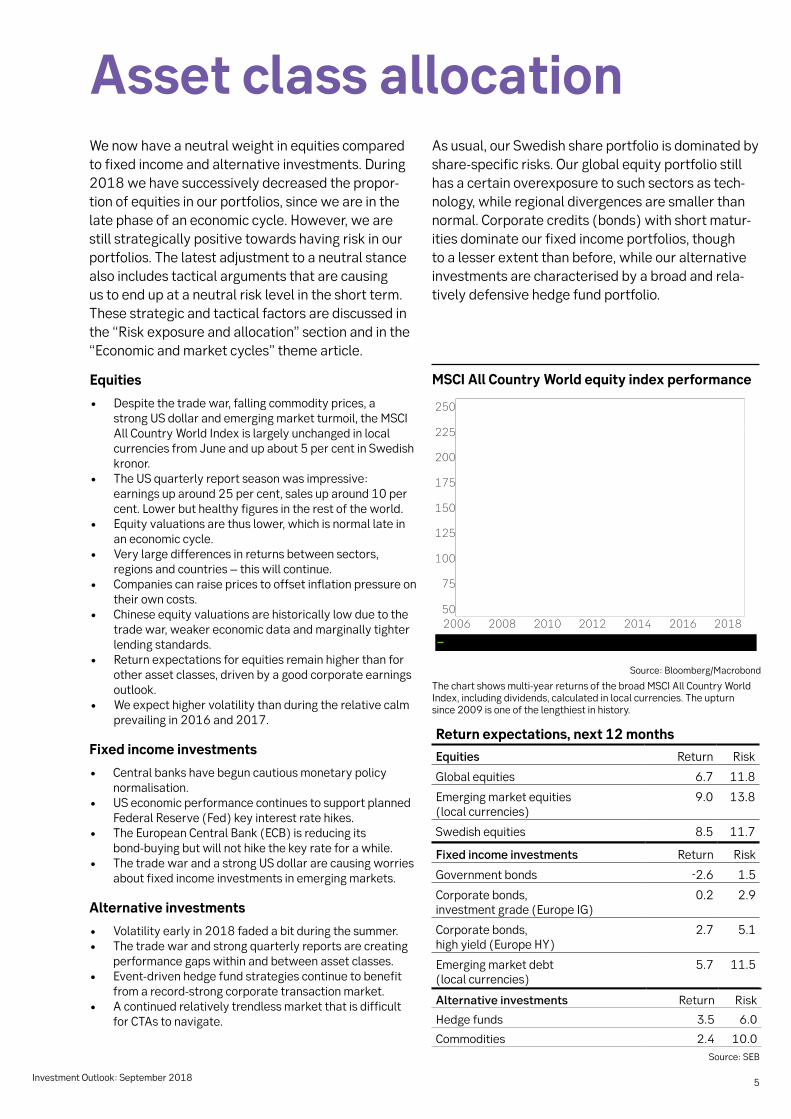
MSCI All Country World equity index performance
Thechartshowsmulti-yearreturnsofthebroadMSCIAllCountryWorldIndex, including dividends, calculated in local currencies. The upturn since2009isoneofthelengthiestinhistory.
Source:Bloomberg/Macrobond
As usual, our Swedish share portfolio is dominated by share-specificrisks.Ourglobalequityportfoliostillhas a certain overexposure to such sectors as tech-nology, while regional divergences are smaller than normal. Corporate credits (bonds) with short matur-ities dominate our fixed income portfolios, though to a lesser extent than before, while our alternative investments are characterised by a broad and rela-tively defensive hedge fund portfolio.
6 Investment Outlook: September 2018
Risk exposure and allocationIn early August we decided to reduce our risk to a neutral level. We based this decision on a combination of being in a late-cyclical phase, no further acceleration in the glob-al economic growth rate, a strong report period with good stock market response and numerous disruptive factors such as a trade war and turbulence in various emerging market (EM) economies. Another factor contributing to our decision was that we had already received good returns earlier in the year by having aggressive risk exposure, including an overweight in equities. To some extent, the decision was also tactically based, since we are now entering a period when companies will be relatively quiet until third quarter reports start to be published. We also believe there is some risk of tempo-rary disappointments connected to economic statistics. We thus have a neutral risk level, even though the global capital spending cycle has speeded up and the rate of economic growth is so high that the probability of recession must still be viewed as very low.
The following is a review of a number of important factors that justify our current moderately optimistic view of risk assets and how these factors may influence future develop-ments.
Growth and corporate earnings
Leading indicators are continuing to lose momentum. This is entirely compatible with a stable economic growth rate of just below 4 per cent in real terms (subtracting inflation) and around 6 per cent in nominal terms. This was expected and does not change our forecast of an annual global growth rate of around 4 per cent this year and next. Inflation has climbed but is expected to level out at around 2 per cent.
Global corporate earnings growth is strong, above 10 per cent yearly. It is being driven by the US, due to solid economic growth and a tax reform that is providing extra fuel. In 2019, earnings are expected to climb by nearly 10 per cent, and their allocation among regions is also expected to become more even.
Central banks
The US Federal Reserve (Fed) will raise its key interest rate a totalof3-4timesthisyearandafewmoretimesin2019.TheFed will also shrink its balance sheet by about USD 40 billion permonth.Towardstheendof2018,weexpecttheECBtostop its stimulative bond purchases, while planning an initial key rate hike no earlier than next summer. In Sweden we are moving closer to a rate hike if a majority of the Riksbank’s ExecutiveBoardgetsitsway,butwebelievethatthishikewillprobably be postponed until early 2019 due to low underlying inflation. Overall, the world economy will continue to operate in an expansionary monetary policy environment, but this stimulus will slowly but surely fade and central banks will normalise their policies.
Valuations
If we measure returns in a currency other than Swedish kro-nor, this year’s stock market performance has been meagre, while earnings are strong. This means that valuations have moderated,whichisnormalinthelate-cyclicalphase.Thesame is true of the fixed income market, where yields are
slowly rising and credit spreads (yield gaps) are widening or remaining intact. Pricing is still high compared to the historical average and is an effect of low interest rates and yields. If the economic expansion proves more persistent than some observers fear, today’s pricing may well endure and share prices may keep pace with corporate earnings.
Risk appetite and positioning
Investors have slowly but surely become more cautious, which has caused risk appetite to fall and the positioning sig-nal to improve. If the expansion proves more prolonged than expected, risk appetite may increase, while the opposite will apply if the economy slows.
Expected returns
We expect continued positive returns for most asset classes over the next 12 months, except for traditional fixed income investments. These expected returns are lower than the historicalaverages,whileriskwillbeunchanged.Equitiesare still at the top and government bonds at the bottom. This forecast is dependent on our optimistic prediction of persis-tent economic expansion proving correct.
Examples of risks
As usual, a slowdown in the economic cycle would have a ma-jor impact on the stock and credit markets, but the recession risk is low. Valuations are high from a historical perspective, although they have improved during the year. We expect the positiveimpactofmajorliquidityinjectionsandrecord-lowkey interest rates by central banks to be gradually replaced by normalisation, which means that a large stimulative force will diminish. A surprise inflation surge would push interest rates higher and increase the cost of the large debts that exist intheworld.Afull-scaletradewarmighthurtgrowth,aswellas the capital spending cycle and other portions of the econ-omyviaindirecteffects.GeopoliticaluncertaintyandBrexitmay create problems, along with the tendency for such weak points as the funding needs of Turkey and Italy to become more visible.
7Investment Outlook: September 2018
Aside from a very strong January, this year has been characterised by a wait-and-see, successively more cautious attitude among investors. This contrasts sharply with February 2016 to the end of 2017, a period of accelerating growth and earnings, as well as highly stimulative central banks. It also began from a depressed market situation. Oil prices were extremely low and investors were deeply concerned about weak economic growth. On the whole, this proved to be a good mix for all types of asset markets, which performed very strongly as risk appetite and valuations reached high levels. Cyclical and growth sectors were the winners
Earlyin2018thistrendslowlybutsurelychanged,althoughthe year’s growth rate has been higher than for a long time and earnings have climbed sharply. The stock, credit and fixed income markets have essentially treaded water this year. This is true of major global indices measured in local currencies or, for example, in euros or US dollars. Measured in Swedish kronor, market performance has been much better due to the weakkrona.Belowthesurface,themarketpictureismoredivided. If we take the stock market as an example, US share prices have continued to climb, while emerging markets led byChinahavelostalotofground.Europeanequitieshaveremained relatively flat. At the sectoral level, technology and defensive shares such as pharmaceuticals have performed the best, while cyclical sectors and financials have had a tougher time.
Why are we seeing this risk aversion and flows towards more defensive investments when both earnings and growth are so strong?
Several classic economic indicators are making investors cautious
Inthelate-cyclicalphase,economicgrowthistypicallyhighand inflation is rising, causing central banks to tighten their policies.Sincethecapitalmarketisforward-looking,volatilitygenerally rises since investors are already preparing for the next phase – the downturn phase.
Most indicators that are used in an attempt to estimate where we are in the economic cycle focus on the US. This is because it is the largest economy and is often ahead of other regions in the economic cycle.
Three examples of indicators that can be used to tell where we are in the economic cycle:
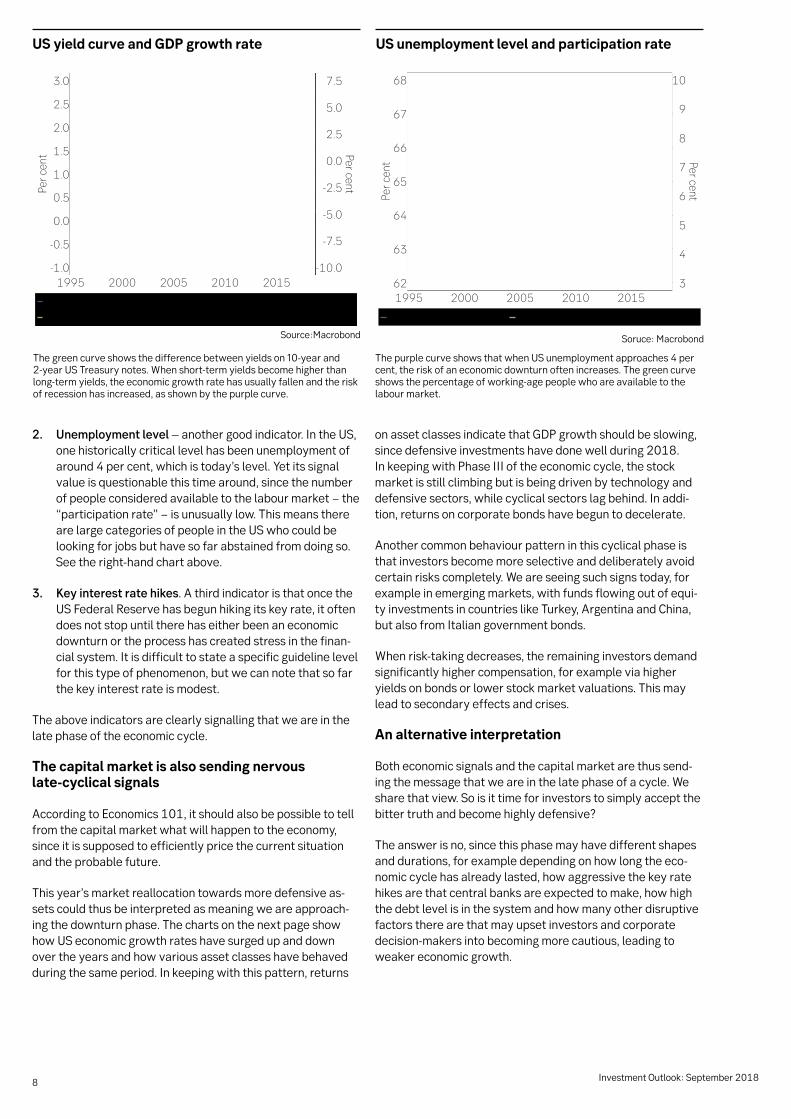
1. When short-term bond yields become higher than long-term yields(an“invertedyieldcurve”).Thestandardmetricistotake10-yearminus2-yeargovernmentbondyields. The idea is that this method will indicate when the central bank has hiked its key interest rate too much, thereby decelerating the economy into a downturn. This has been a good indicator, but it generally takes up to 20 months before the signal is followed by a recession. Today the yield curve has a weakly positive slope, and long-termyieldshavebeenpusheddownbycentralbanks’stimulativebondpurchases.Seetheleft-handchart on the next page.
Theme – Economic and market cyclesA more defensive trend so far during 2018
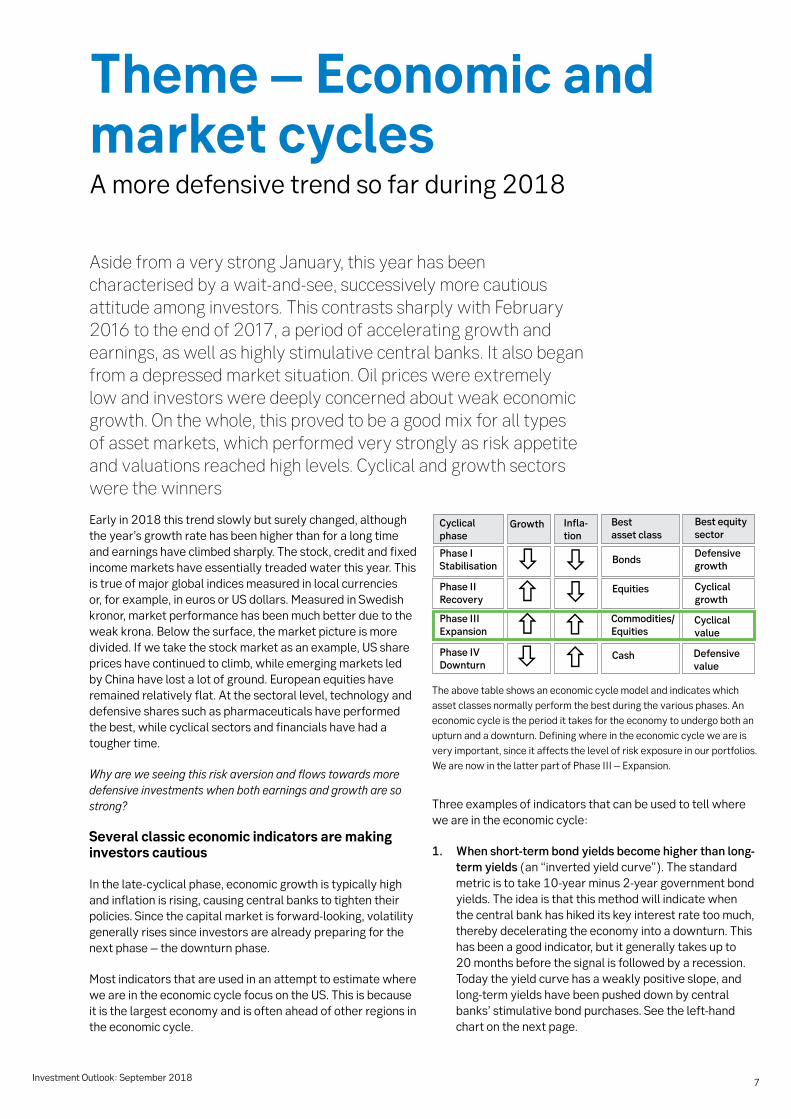
The above table shows an economic cycle model and indicates which asset classes normally perform the best during the various phases. An economic cycle is the period it takes for the economy to undergo both an upturn and a downturn. Defining where in the economic cycle we are is very important, since it affects the level of risk exposure in our portfolios. WearenowinthelatterpartofPhaseIII–Expansion.
Phase IStabilisation
Phase II Recovery
Phase III Expansion
Phase IVDownturn
Cyclical phase
Growth Infla-tion
Best asset class
Best equity sector
Bonds
Equities
Commodities/ Equities
Cash
Defensivegrowth
Cyclicalgrowth
Cyclical value
Defensive value
8 Investment Outlook: September 2018
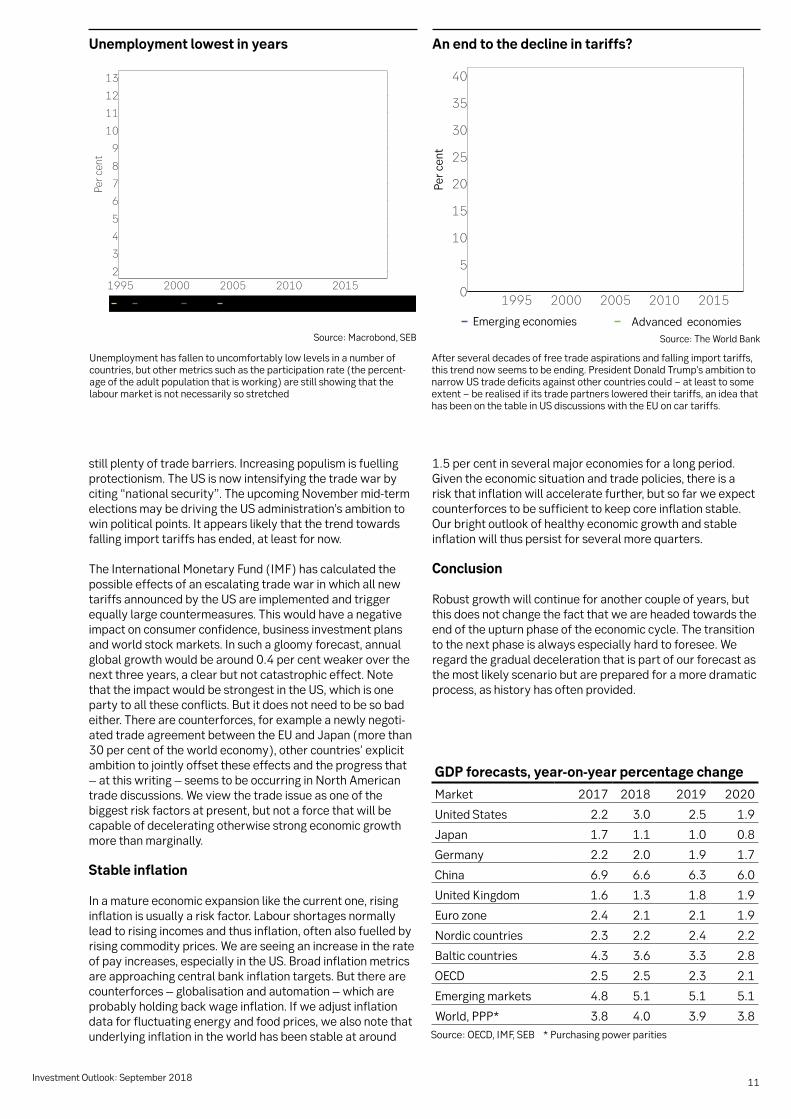
2. Unemployment level – another good indicator. In the US, one historically critical level has been unemployment of around4percent,whichistoday’slevel.Yetitssignalvalue is questionable this time around, since the number ofpeopleconsideredavailabletothelabourmarket−the“participationrate”−isunusuallylow.Thismeansthereare large categories of people in the US who could be looking for jobs but have so far abstained from doing so. Seetheright-handchartabove.
3. Key interest rate hikes. A third indicator is that once the US Federal Reserve has begun hiking its key rate, it often does not stop until there has either been an economic downturn or the process has created stress in the finan-cial system. It is difficult to state a specific guideline level for this type of phenomenon, but we can note that so far the key interest rate is modest.
The above indicators are clearly signalling that we are in the late phase of the economic cycle.
The capital market is also sending nervous late-cyclical signals
AccordingtoEconomics101,itshouldalsobepossibletotellfrom the capital market what will happen to the economy, since it is supposed to efficiently price the current situation and the probable future.
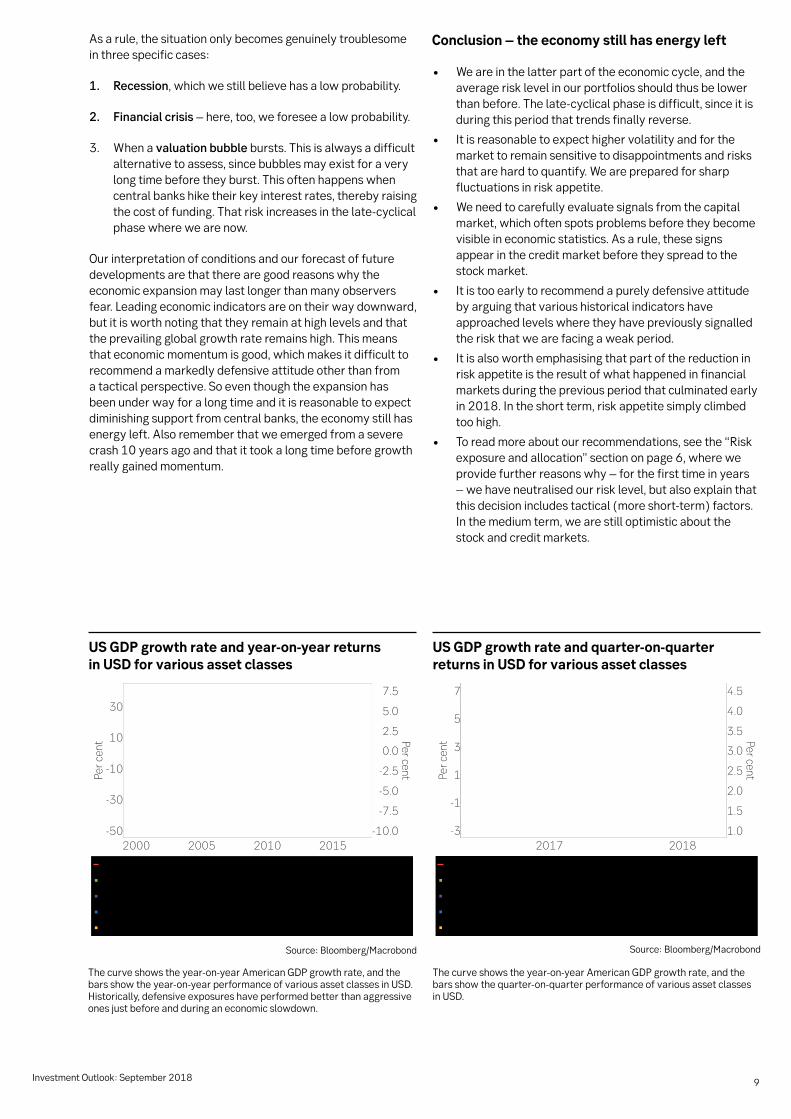
This year’s market reallocation towards more defensive as-sets could thus be interpreted as meaning we are approach-ing the downturn phase. The charts on the next page show how US economic growth rates have surged up and down over the years and how various asset classes have behaved during the same period. In keeping with this pattern, returns
on asset classes indicate that GDP growth should be slowing, since defensive investments have done well during 2018. In keeping with Phase III of the economic cycle, the stock market is still climbing but is being driven by technology and defensive sectors, while cyclical sectors lag behind. In addi-tion, returns on corporate bonds have begun to decelerate.
Another common behaviour pattern in this cyclical phase is that investors become more selective and deliberately avoid certain risks completely. We are seeing such signs today, for example in emerging markets, with funds flowing out of equi-ty investments in countries like Turkey, Argentina and China, but also from Italian government bonds.
Whenrisk-takingdecreases,theremaininginvestorsdemandsignificantly higher compensation, for example via higher yields on bonds or lower stock market valuations. This may lead to secondary effects and crises.
An alternative interpretation
Botheconomicsignalsandthecapitalmarketarethussend-ing the message that we are in the late phase of a cycle. We share that view. So is it time for investors to simply accept the bitter truth and become highly defensive?
The answer is no, since this phase may have different shapes and durations, for example depending on how long the eco-nomic cycle has already lasted, how aggressive the key rate hikes are that central banks are expected to make, how high the debt level is in the system and how many other disruptive factors there are that may upset investors and corporate decision-makersintobecomingmorecautious,leadingtoweaker economic growth.
US yield curve and GDP growth rate
Thegreencurveshowsthedifferencebetweenyieldson10-yearand2-yearUSTreasurynotes.Whenshort-termyieldsbecomehigherthanlong-termyields,theeconomicgrowthratehasusuallyfallenandtheriskof recession has increased, as shown by the purple curve.
Source:Macrobond
US unemployment level and participation rate
ThepurplecurveshowsthatwhenUSunemploymentapproaches4percent, the risk of an economic downturn often increases. The green curve showsthepercentageofworking-agepeoplewhoareavailabletothelabour market.
Soruce: Macrobond
9Investment Outlook: September 2018
As a rule, the situation only becomes genuinely troublesome in three specific cases:
1. Recession, which we still believe has a low probability.
2. Financial crisis – here, too, we foresee a low probability.
3. When a valuation bubble bursts. This is always a difficult alternative to assess, since bubbles may exist for a very long time before they burst. This often happens when central banks hike their key interest rates, thereby raising thecostoffunding.Thatriskincreasesinthelate-cyclicalphase where we are now.
Our interpretation of conditions and our forecast of future developments are that there are good reasons why the economic expansion may last longer than many observers fear. Leading economic indicators are on their way downward, but it is worth noting that they remain at high levels and that the prevailing global growth rate remains high. This means that economic momentum is good, which makes it difficult to recommend a markedly defensive attitude other than from a tactical perspective. So even though the expansion has been under way for a long time and it is reasonable to expect diminishing support from central banks, the economy still has energy left. Also remember that we emerged from a severe crash 10 years ago and that it took a long time before growth really gained momentum.
Conclusion – the economy still has energy left
• We are in the latter part of the economic cycle, and the average risk level in our portfolios should thus be lower thanbefore.Thelate-cyclicalphaseisdifficult,sinceitisduring this period that trends finally reverse.
• It is reasonable to expect higher volatility and for the market to remain sensitive to disappointments and risks that are hard to quantify. We are prepared for sharp fluctuations in risk appetite.
• We need to carefully evaluate signals from the capital market, which often spots problems before they become visible in economic statistics. As a rule, these signs appear in the credit market before they spread to the stock market.
• It is too early to recommend a purely defensive attitude by arguing that various historical indicators have approached levels where they have previously signalled the risk that we are facing a weak period.
• It is also worth emphasising that part of the reduction in risk appetite is the result of what happened in financial markets during the previous period that culminated early in 2018. In the short term, risk appetite simply climbed too high.
• Toreadmoreaboutourrecommendations,seethe“Riskexposureandallocation”sectiononpage6,whereweprovide further reasons why – for the first time in years – we have neutralised our risk level, but also explain that thisdecisionincludestactical(moreshort-term)factors.In the medium term, we are still optimistic about the stock and credit markets.
US GDP growth rate and year-on-year returns in USD for various asset classes
Thecurveshowstheyear-on-yearAmericanGDPgrowthrate,andthebarsshowtheyear-on-yearperformanceofvariousassetclassesinUSD.Historically, defensive exposures have performed better than aggressive ones just before and during an economic slowdown.
Source:Bloomberg/Macrobond
US GDP growth rate and quarter-on-quarter returns in USD for various asset classes
Thecurveshowstheyear-on-yearAmericanGDPgrowthrate,andthebarsshowthequarter-on-quarterperformanceofvariousassetclassesin USD.
Source:Bloomberg/Macrobond
10 Investment Outlook: September 2018
The global expansion will last for another couple of years. Late-cyclical forces like private consumption and capital spending are drivers, but increasing resource shortages will cause a slow deceleration. The US, which is furthest along in the cycle, will decelerate the most clearly, while emerging markets will grow at an undiminished rate. Trade war and other political risks make the picture uncertain, but inflation should not be a problem for growth and interest rates this time around.
September 15 marks ten years since the crash of Lehman Brothers,anAmericanbank.Theworldeconomyisnowinthe midst of what, during next year, will probably become the longest economic expansion in modern times. This naturally raises questions about how long healthy growth can last, and what happens after that. Last spring, such questions surfaced due to slightly weaker economic growth than expected in the euro zone, and to some extent in China. Warning signs are also coming from the political sphere, not least in the form of a trade war that – if it worsens – can definitely help precipitate an economic deceleration.
Butletusputasidepoliticsandstudythegrowthpicturefirst.Economicexpansionsdonotdieofoldage.Onthecontrary,our optimistic view of the economy from the last issue of Investment Outlook (May) remains. Just as in that issue, we expect global growth of around 4 per cent both this year and next. We are now adding our forecast for 2020, when we foresee only a mild deceleration. Although the weak start to 2018 in the euro zone is causing us to revise our forecast for this year a bit lower, we expect growth to remain steady over the next couple of years. In the US, the picture is the opposite. After a strong start to the year, we are adjusting our 2018 forecast upward, but we foresee a more significant deceler-ationin2019-2020towardsamoreaveragegrowthrateofaround 2 per cent.
Private consumption and capital spending drive growth
The US is one of the major economies most clearly in a late-cyclicalphase.Lookingatthecomponentsofgrowth,demandwillprobablyremainhealthywhilesupply-sidelimitswill lead to the mild deceleration that we foresee. The drivers ofdemandincludeclassiclate-cyclicalones:strongprivateconsumption and good risk appetite. Consumption is fuelled by an extremely strong labour market, rising asset values and several years of high household saving. Capital spending, in turn, is driven by an increasing scarcity of production resourc-es,especiallyevermoreobviouslabourshortages.Beyondthese classic economic forces, we can also add powerful (and in this phase unusual) stimulus from the political sphere, both intheshapeofataxreformandpublicsectorspending.Yet
we expect US growth to decelerate, largely due to the diffi-culty of finding production resources. The ongoing normalisa-tion of interest rate policy, including key rate hikes, also limits the growth dynamic.
Looking at other large economies, the situation in the euro zone is similar to that in the US. Here too, growth is driven by strong labour markets and increasing capital spending. Within Europe,growthpatternsarechanging.TheGermaneconomyis more in phase with the US and will decelerate somewhat, while growth will speed up a little in countries like France. There is political uncertainty about the euro project, but it can best be described as part of everyday life. Uncertainty about Brexitislikelytoculminateinthenextcoupleofmonths,sincenegotiationsbetweentheUnitedKingdomandtheEurope-an Union need to be concluded. The outcome is genuinely difficulttoassess.WebelievethattheBritishwillbeabletoachieveafairlyorderlyretreatfromtheEUproject,butthereisdefinitelyariskofa“hardBrexit”andthesubsequentuncertainty.
China’s deceleration offset by other emerging markets
China’s planned slow deceleration continues, but the trade war with the US is fuelling uncertainty and increasing risks. Chinese authorities are responding with more expansionary economic policies. The depreciation of the yuan in recent months is also easing some of the negative effects. We expect a somewhat accelerating but still controlled downturn. If we expand our view to emerging markets at the global level, China’s deceleration will be offset by speedier growth in BrazilandtosomeextentalsoinRussiaandIndonesia.Morestable commodity prices will contribute to this, along with continued relatively healthy global demand.
The trade issue is a manageable risk factor
Yetglobaldemandisoneareawhereuncertaintyhasgreatlyincreased. The trade war will definitely have an impact; how seriousanimpactremainstobeseen.Butitisimportantto understand where we are coming from. In a global per-spective, tariffs have decreased for decades, but there are
Market view – macroPersistent growth is defying political risks
11Investment Outlook: September 2018
GDP forecasts, year-on-year percentage change
Market 2017 2018 2019 2020
United States 2.2 3.0 2.5 1.9
Japan 1.7 1.1 1.0 0.8
Germany 2.2 2.0 1.9 1.7
China 6.9 6.6 6.3 6.0
United Kingdom 1.6 1.3 1.8 1.9
Eurozone 2.4 2.1 2.1 1.9
Nordic countries 2.3 2.2 2.4 2.2
Balticcountries 4.3 3.6 3.3 2.8
OECD 2.5 2.5 2.3 2.1
Emergingmarkets 4.8 5.1 5.1 5.1
World, PPP* 3.8 4.0 3.9 3.8 Source:OECD,IMF,SEB*Purchasingpowerparities
still plenty of trade barriers. Increasing populism is fuelling protectionism. The US is now intensifying the trade war by citing“nationalsecurity”.TheupcomingNovembermid-termelections may be driving the US administration’s ambition to win political points. It appears likely that the trend towards falling import tariffs has ended, at least for now.
The International Monetary Fund (IMF) has calculated the possible effects of an escalating trade war in which all new tariffs announced by the US are implemented and trigger equally large countermeasures. This would have a negative impact on consumer confidence, business investment plans and world stock markets. In such a gloomy forecast, annual global growth would be around 0.4 per cent weaker over the next three years, a clear but not catastrophic effect. Note that the impact would be strongest in the US, which is one partytoalltheseconflicts.Butitdoesnotneedtobesobadeither. There are counterforces, for example a newly negoti-atedtradeagreementbetweentheEUandJapan(morethan30 per cent of the world economy), other countries’ explicit ambition to jointly offset these effects and the progress that – at this writing – seems to be occurring in North American trade discussions. We view the trade issue as one of the biggest risk factors at present, but not a force that will be capable of decelerating otherwise strong economic growth more than marginally.
Stable inflation
In a mature economic expansion like the current one, rising inflation is usually a risk factor. Labour shortages normally lead to rising incomes and thus inflation, often also fuelled by rising commodity prices. We are seeing an increase in the rate ofpayincreases,especiallyintheUS.Broadinflationmetricsareapproachingcentralbankinflationtargets.Buttherearecounterforces – globalisation and automation – which are probably holding back wage inflation. If we adjust inflation data for fluctuating energy and food prices, we also note that underlying inflation in the world has been stable at around
Unemployment lowest in years
Unemployment has fallen to uncomfortably low levels in a number of countries, but other metrics such as the participation rate (the percent-age of the adult population that is working) are still showing that the labour market is not necessarily so stretched
1.5 per cent in several major economies for a long period. Given the economic situation and trade policies, there is a risk that inflation will accelerate further, but so far we expect counterforces to be sufficient to keep core inflation stable. Our bright outlook of healthy economic growth and stable inflation will thus persist for several more quarters.
Conclusion
Robust growth will continue for another couple of years, but this does not change the fact that we are headed towards the end of the upturn phase of the economic cycle. The transition to the next phase is always especially hard to foresee. We regard the gradual deceleration that is part of our forecast as the most likely scenario but are prepared for a more dramatic process, as history has often provided.
Source:Macrobond,SEB
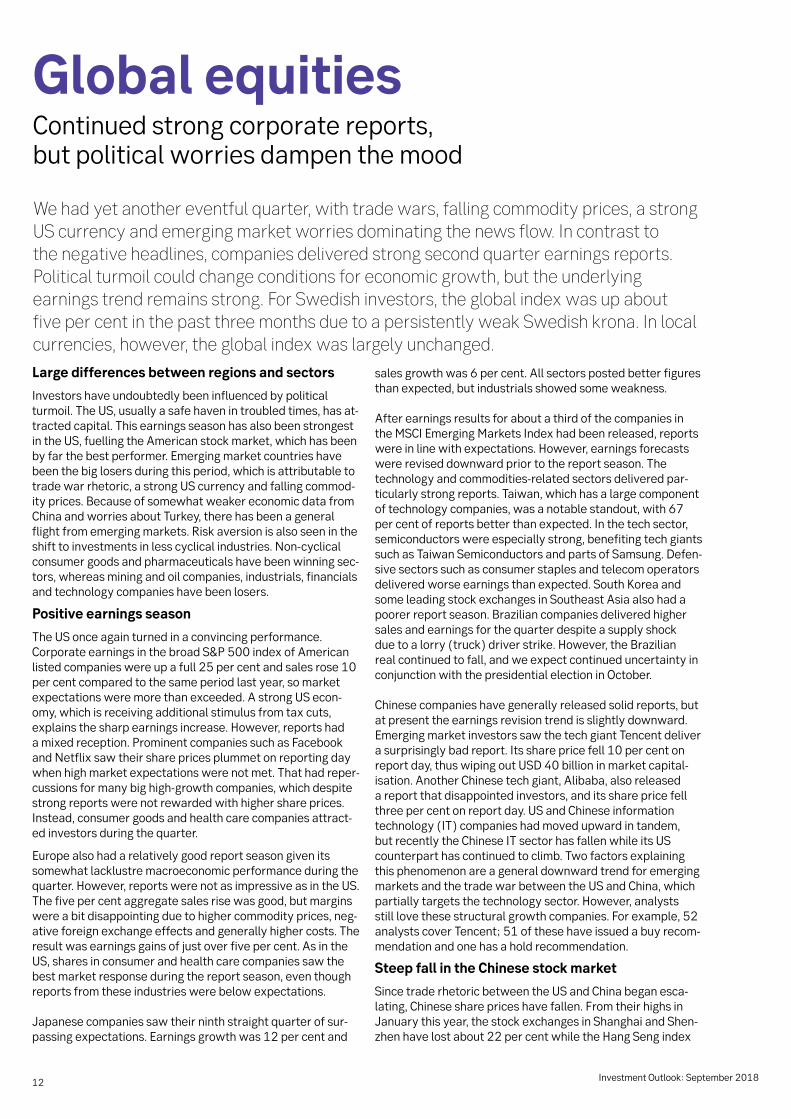
An end to the decline in tariffs?
After several decades of free trade aspirations and falling import tariffs, this trend now seems to be ending. President Donald Trump’s ambition to narrowUStradedeficitsagainstothercountriescould−atleasttosomeextent−berealisedifitstradepartnersloweredtheirtariffs,anideathathasbeenonthetableinUSdiscussionswiththeEUoncartariffs.
Source:TheWorldBank
Per c
ent
Emergingeconomies Advanced economies
12 Investment Outlook: September 2018
We had yet another eventful quarter, with trade wars, falling commodity prices, a strong US currency and emerging market worries dominating the news flow. In contrast to the negative headlines, companies delivered strong second quarter earnings reports. Political turmoil could change conditions for economic growth, but the underlying earnings trend remains strong. For Swedish investors, the global index was up about five per cent in the past three months due to a persistently weak Swedish krona. In local currencies, however, the global index was largely unchanged.
Large differences between regions and sectors
Investors have undoubtedly been influenced by political turmoil. The US, usually a safe haven in troubled times, has at-tracted capital. This earnings season has also been strongest in the US, fuelling the American stock market, which has been byfarthebestperformer.Emergingmarketcountrieshavebeen the big losers during this period, which is attributable to trade war rhetoric, a strong US currency and falling commod-ityprices.BecauseofsomewhatweakereconomicdatafromChina and worries about Turkey, there has been a general flight from emerging markets. Risk aversion is also seen in the shifttoinvestmentsinlesscyclicalindustries.Non-cyclicalconsumer goods and pharmaceuticals have been winning sec-tors, whereas mining and oil companies, industrials, financials and technology companies have been losers.
Positive earnings season
The US once again turned in a convincing performance. Corporate earnings in the broad S&P 500 index of American listed companies were up a full 25 per cent and sales rose 10 per cent compared to the same period last year, so market expectations were more than exceeded. A strong US econ-omy, which is receiving additional stimulus from tax cuts, explains the sharp earnings increase. However, reports had a mixed reception. Prominent companies such as Facebook and Netflix saw their share prices plummet on reporting day when high market expectations were not met. That had reper-cussionsformanybighigh-growthcompanies,whichdespitestrong reports were not rewarded with higher share prices. Instead, consumer goods and health care companies attract-ed investors during the quarter.
Europealsohadarelativelygoodreportseasongivenitssomewhat lacklustre macroeconomic performance during the quarter. However, reports were not as impressive as in the US. The five per cent aggregate sales rise was good, but margins were a bit disappointing due to higher commodity prices, neg-ative foreign exchange effects and generally higher costs. The result was earnings gains of just over five per cent. As in the US, shares in consumer and health care companies saw the best market response during the report season, even though reports from these industries were below expectations.
Japanese companies saw their ninth straight quarter of sur-passingexpectations.Earningsgrowthwas12percentand
sales growth was 6 per cent. All sectors posted better figures than expected, but industrials showed some weakness.
After earnings results for about a third of the companies in theMSCIEmergingMarketsIndexhadbeenreleased,reportswere in line with expectations. However, earnings forecasts were revised downward prior to the report season. The technologyandcommodities-relatedsectorsdeliveredpar-ticularly strong reports. Taiwan, which has a large component of technology companies, was a notable standout, with 67 per cent of reports better than expected. In the tech sector, semiconductors were especially strong, benefiting tech giants such as Taiwan Semiconductors and parts of Samsung. Defen-sive sectors such as consumer staples and telecom operators delivered worse earnings than expected. South Korea and some leading stock exchanges in Southeast Asia also had a poorerreportseason.Braziliancompaniesdeliveredhighersales and earnings for the quarter despite a supply shock duetoalorry(truck)driverstrike.However,theBrazilianreal continued to fall, and we expect continued uncertainty in conjunction with the presidential election in October.
Chinese companies have generally released solid reports, but at present the earnings revision trend is slightly downward. EmergingmarketinvestorssawthetechgiantTencentdelivera surprisingly bad report. Its share price fell 10 per cent on report day, thus wiping out USD 40 billion in market capital-isation. Another Chinese tech giant, Alibaba, also released a report that disappointed investors, and its share price fell three per cent on report day. US and Chinese information technology (IT) companies had moved upward in tandem, but recently the Chinese IT sector has fallen while its US counterpart has continued to climb. Two factors explaining this phenomenon are a general downward trend for emerging markets and the trade war between the US and China, which partially targets the technology sector. However, analysts still love these structural growth companies. For example, 52 analysts cover Tencent; 51 of these have issued a buy recom-mendation and one has a hold recommendation.
Steep fall in the Chinese stock market
Since trade rhetoric between the US and China began esca-lating, Chinese share prices have fallen. From their highs in January this year, the stock exchanges in Shanghai and Shen-zhen have lost about 22 per cent while the Hang Seng index
Global equitiesContinued strong corporate reports, but political worries dampen the mood
13Investment Outlook: September 2018
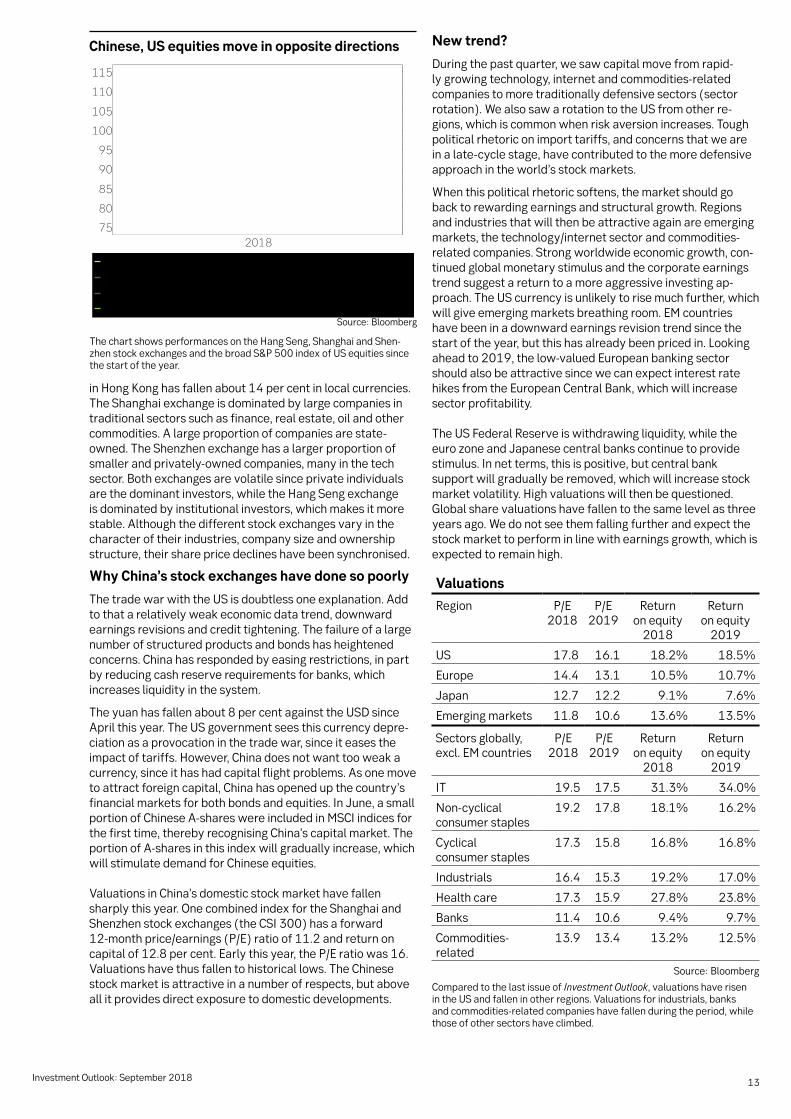
Chinese, US equities move in opposite directions
The chart shows performances on the Hang Seng, Shanghai and Shen-zhenstockexchangesandthebroadS&P500indexofUSequitiessincethe start of the year.
in Hong Kong has fallen about 14 per cent in local currencies. The Shanghai exchange is dominated by large companies in traditional sectors such as finance, real estate, oil and other commodities.Alargeproportionofcompaniesarestate-owned. The Shenzhen exchange has a larger proportion of smallerandprivately-ownedcompanies,manyinthetechsector.Bothexchangesarevolatilesinceprivateindividualsare the dominant investors, while the Hang Seng exchange is dominated by institutional investors, which makes it more stable. Although the different stock exchanges vary in the character of their industries, company size and ownership structure, their share price declines have been synchronised.
Why China’s stock exchanges have done so poorly
The trade war with the US is doubtless one explanation. Add to that a relatively weak economic data trend, downward earnings revisions and credit tightening. The failure of a large number of structured products and bonds has heightened concerns. China has responded by easing restrictions, in part by reducing cash reserve requirements for banks, which increases liquidity in the system.
The yuan has fallen about 8 per cent against the USD since April this year. The US government sees this currency depre-ciation as a provocation in the trade war, since it eases the impact of tariffs. However, China does not want too weak a currency, since it has had capital flight problems. As one move to attract foreign capital, China has opened up the country’s financial markets for both bonds and equities. In June, a small portionofChineseA-shareswereincludedinMSCIindicesforthe first time, thereby recognising China’s capital market. The portionofA-sharesinthisindexwillgraduallyincrease,whichwill stimulate demand for Chinese equities.
Valuations in China’s domestic stock market have fallen sharply this year. One combined index for the Shanghai and Shenzhen stock exchanges (the CSI 300) has a forward 12-monthprice/earnings(P/E)ratioof11.2andreturnoncapitalof12.8percent.Earlythisyear,theP/Eratiowas16.Valuations have thus fallen to historical lows. The Chinese stock market is attractive in a number of respects, but above all it provides direct exposure to domestic developments.
New trend?
During the past quarter, we saw capital move from rapid-lygrowingtechnology,internetandcommodities-relatedcompanies to more traditionally defensive sectors (sector rotation). We also saw a rotation to the US from other re-gions, which is common when risk aversion increases. Tough political rhetoric on import tariffs, and concerns that we are inalate-cyclestage,havecontributedtothemoredefensiveapproach in the world’s stock markets.
When this political rhetoric softens, the market should go back to rewarding earnings and structural growth. Regions and industries that will then be attractive again are emerging markets,thetechnology/internetsectorandcommodities- related companies. Strong worldwide economic growth, con-tinued global monetary stimulus and the corporate earnings trend suggest a return to a more aggressive investing ap-proach. The US currency is unlikely to rise much further, which willgiveemergingmarketsbreathingroom.EMcountrieshave been in a downward earnings revision trend since the start of the year, but this has already been priced in. Looking aheadto2019,thelow-valuedEuropeanbankingsectorshould also be attractive since we can expect interest rate hikesfromtheEuropeanCentralBank,whichwillincreasesector profitability.
The US Federal Reserve is withdrawing liquidity, while the euro zone and Japanese central banks continue to provide stimulus. In net terms, this is positive, but central bank support will gradually be removed, which will increase stock market volatility. High valuations will then be questioned. Global share valuations have fallen to the same level as three years ago. We do not see them falling further and expect the stock market to perform in line with earnings growth, which is expected to remain high.
Source:Bloomberg
Compared to the last issue of Investment Outlook, valuations have risen in the US and fallen in other regions. Valuations for industrials, banks andcommodities-relatedcompanieshavefallenduringtheperiod,whilethose of other sectors have climbed.
Valuations
Region P/E2018
P/E2019
Return on equity
2018
Return on equity
2019
US 17.8 16.1 18.2% 18.5%
Europe 14.4 13.1 10.5% 10.7%
Japan 12.7 12.2 9.1% 7.6%
Emergingmarkets 11.8 10.6 13.6% 13.5%
Sectors globally, excl.EMcountries
P/E2018
P/E2019
Return on equity
2018
Return on equity
2019
IT 19.5 17.5 31.3% 34.0%
Non-cyclicalconsumer staples
19.2 17.8 18.1% 16.2%
Cyclical consumer staples
17.3 15.8 16.8% 16.8%
Industrials 16.4 15.3 19.2% 17.0%
Health care 17.3 15.9 27.8% 23.8%
Banks 11.4 10.6 9.4% 9.7%
Commodities-related
13.9 13.4 13.2% 12.5%
Source:Bloomberg
14 Investment Outlook: September 2018
Since the 2008-2009 financial crisis, political challenges in Europe, digitisation and continued globalisation of trade have led to lower inflation, interest rates and yields. Strongly stimulative monetary policies have benefited share prices across the world. Do we face a new reality ahead? Yes, since monetary policy will lose power and fiscal agendas will take shape in the US and China. Real economic performance should become a more widespread theme. Nordic companies today complain about cost inflation, which should in due time affect consumers − one consequence of the lengthy economic upturn and protectionism. Since our last issue of Investment Outlook in May, Nordic equities have generated a return of 3-4 per cent in euros. We are repeating our advice to be somewhat cautious, but also note that there are exciting investment areas and sectors.
Increased protectionism alongside higher inflation
TheNordicstockmarkethasadvanced3-4percentineurossince our previous issue in late May and so far in 2018, whereas the return for this year calculated in Swedish kronor is around 11 per cent. It is unusual to have an upward busi-ness cycle for nine years, which is why we believe it is (still) a good idea to take positions that include at least some degree of caution. The global business cycle is in a clearly mature phase, although there are of course always parts of the econ-omy that have a completely different environment. Combined with historically strong, sustained equity returns, this means that investors should be alert to risks. The 27 million people living in the Nordic countries are economically open to the rest of the world, and changes in the global macroeconomic arena will doubtless leave their mark on domestic consump-tion and business activity. After many years of decreasing financial costs, low wage growth and the increased attrac-tiveness of equities as an asset class, we see a new reality gradually taking shape – a reality in which fiscal policy and the real economy will play a bigger role, compared to gigantic monetary stimulus measures over the past decade. The scale of central bank support is expected to decline going forward, which means that real economic factors will take over from higher valuations (multiple expansion) in determining total re-turns. Over the past five years, more than half of Nordic stock market returns of about 60 per cent were generated through higher valuations – in other words, as a function of lower interest rates and yields. A new reality lies ahead.
The US often leads the global economy and may also be first out this time around when it comes to fiscal policy. Among the most obvious changes since the previous Democratic
administration are a sharp reduction in monetary stimulus, a shift to large tax cuts for companies and high income earners, and increased import tariffs. Recently we have seen greater fiscalpolicyambitionsinsouthernEuropeandMexicoaswell.There are also positive effects from a more protectionist agenda, since it spurs greater real economic investments, whereasanydeclineincost-effectiveglobaltradecouldlead to unforeseen negative consequences. Increased cost inflation in the production chain will probably lead to more investments in automation, so that companies can meet profit demands. However, it is more uncertain whether we will see anyriseininflationforend-consumersthistimearound.Oth-erwise, that has usually been the case in the later stage of an economic upturn, since the normal historical pattern shows there is ultimately an inflation impulse that central banks try to restrain. This often hurts economic activity to varying de-grees. It also has an impact on investors’ allocation to equities as a percentage of their total assets.
Chinese toolkit bigger than many observers think
For Nordic companies and equities, it is important to follow the debate being led by the US government since it may lead tohigherlong-termtradecostsbetweencountries.Alter-native supply chains will probably benefit, including local production. The US has its largest trade deficits in automotive production (Mexico), retail (China) and electronics (China), which are the main sectors where we see high volatility in the global stock markets, including in the Nordic countries. Although the entire world is focused on what the US govern-ment describes as a nearly 400 billion dollar trade deficit withChina,thedeficitisalmostnon-existentwhenproductsand services that US subsidiaries sell in China, to Chinese
Nordic equitiesA new reality ahead?
15Investment Outlook: September 2018
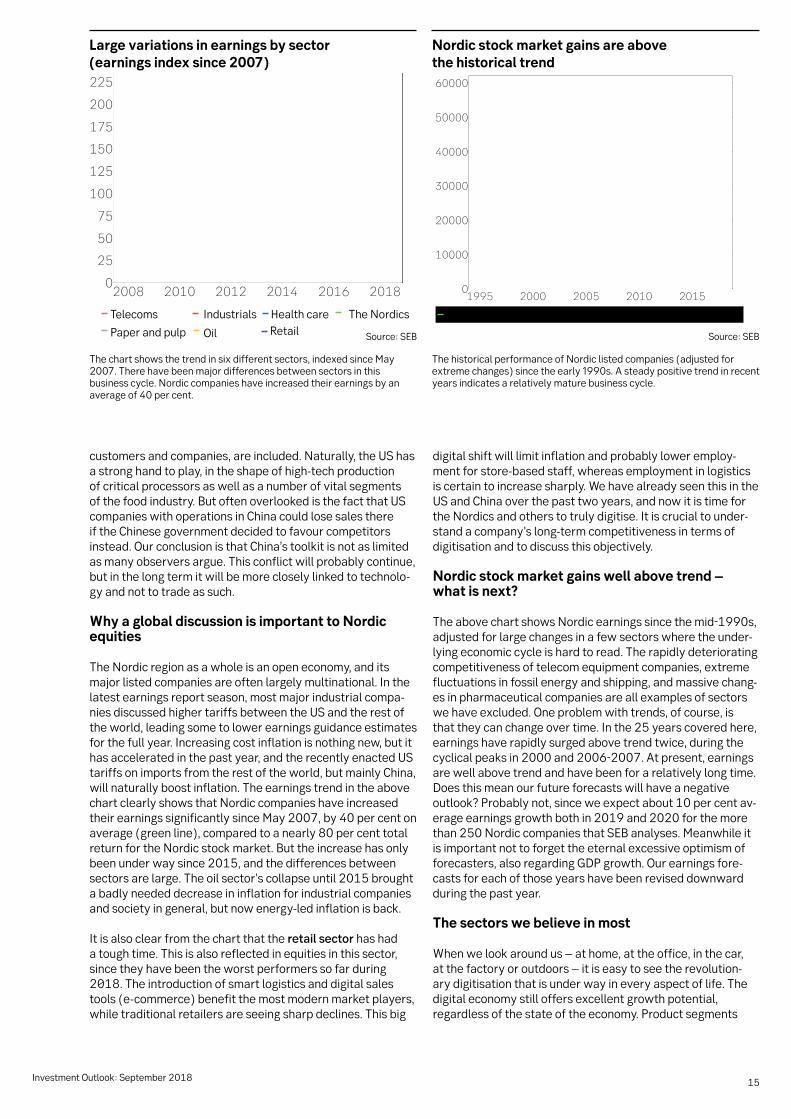
Large variations in earnings by sector (earnings index since 2007)
The chart shows the trend in six different sectors, indexed since May 2007.Therehavebeenmajordifferencesbetweensectorsinthisbusiness cycle. Nordic companies have increased their earnings by an averageof40percent.
customers and companies, are included. Naturally, the US has astronghandtoplay,intheshapeofhigh-techproductionof critical processors as well as a number of vital segments ofthefoodindustry.ButoftenoverlookedisthefactthatUScompanies with operations in China could lose sales there if the Chinese government decided to favour competitors instead. Our conclusion is that China’s toolkit is not as limited as many observers argue. This conflict will probably continue, but in the long term it will be more closely linked to technolo-gy and not to trade as such.
Why a global discussion is important to Nordic equities
The Nordic region as a whole is an open economy, and its major listed companies are often largely multinational. In the latest earnings report season, most major industrial compa-nies discussed higher tariffs between the US and the rest of the world, leading some to lower earnings guidance estimates for the full year. Increasing cost inflation is nothing new, but it has accelerated in the past year, and the recently enacted US tariffs on imports from the rest of the world, but mainly China, will naturally boost inflation. The earnings trend in the above chart clearly shows that Nordic companies have increased their earnings significantly since May 2007, by 40 per cent on average (green line), compared to a nearly 80 per cent total returnfortheNordicstockmarket.Buttheincreasehasonlybeen under way since 2015, and the differences between sectors are large. The oil sector’s collapse until 2015 brought a badly needed decrease in inflation for industrial companies andsocietyingeneral,butnowenergy-ledinflationisback.
It is also clear from the chart that the retail sector has had a tough time. This is also reflected in equities in this sector, since they have been the worst performers so far during 2018.Theintroductionofsmartlogisticsanddigitalsalestools(e-commerce)benefitthemostmodernmarketplayers,while traditional retailers are seeing sharp declines. This big
digital shift will limit inflation and probably lower employ-mentforstore-basedstaff,whereasemploymentinlogisticsis certain to increase sharply. We have already seen this in the US and China over the past two years, and now it is time for the Nordics and others to truly digitise. It is crucial to under-standacompany’slong-termcompetitivenessintermsofdigitisation and to discuss this objectively.
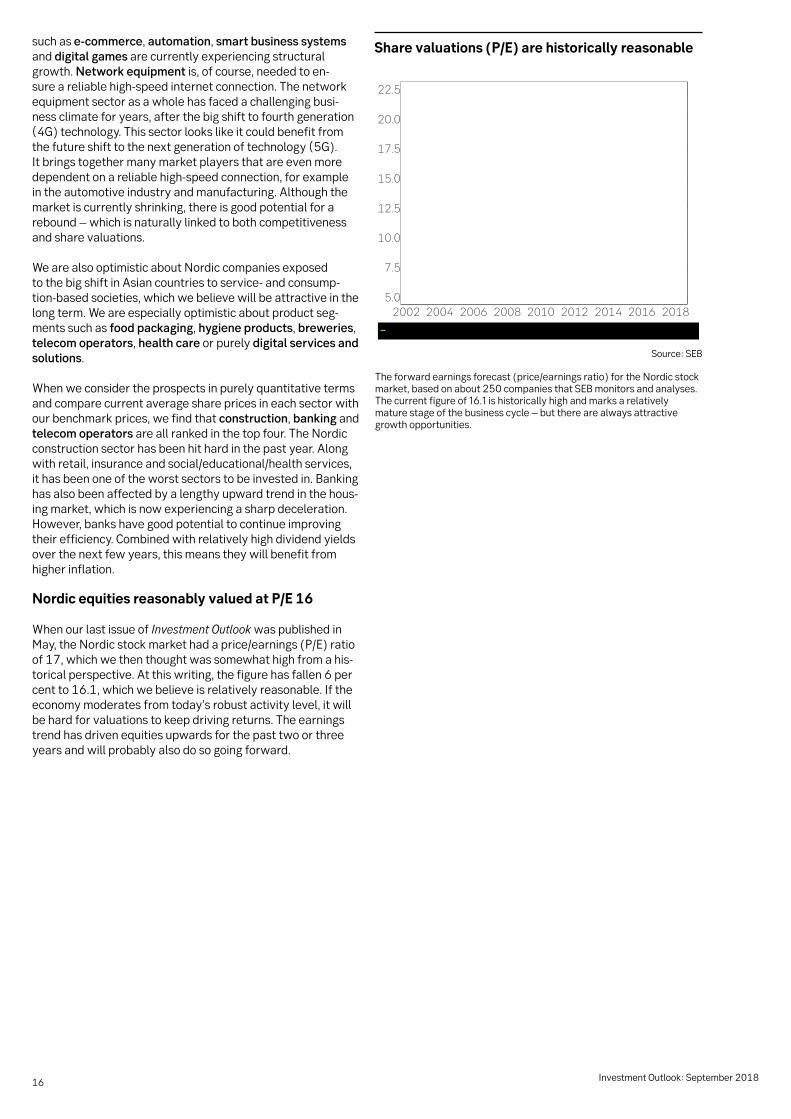
Nordic stock market gains well above trend – what is next?
TheabovechartshowsNordicearningssincethemid-1990s,adjusted for large changes in a few sectors where the under-lying economic cycle is hard to read. The rapidly deteriorating competitiveness of telecom equipment companies, extreme fluctuations in fossil energy and shipping, and massive chang-es in pharmaceutical companies are all examples of sectors we have excluded. One problem with trends, of course, is that they can change over time. In the 25 years covered here, earnings have rapidly surged above trend twice, during the cyclicalpeaksin2000and2006-2007.Atpresent,earningsare well above trend and have been for a relatively long time. Does this mean our future forecasts will have a negative outlook? Probably not, since we expect about 10 per cent av-erage earnings growth both in 2019 and 2020 for the more than250NordiccompaniesthatSEBanalyses.Meanwhileitis important not to forget the eternal excessive optimism of forecasters, also regarding GDP growth. Our earnings fore-casts for each of those years have been revised downward during the past year.
The sectors we believe in most
When we look around us – at home, at the office, in the car, at the factory or outdoors – it is easy to see the revolution-ary digitisation that is under way in every aspect of life. The digital economy still offers excellent growth potential, regardless of the state of the economy. Product segments
Source:SEB
Nordic stock market gains are above the historical trend
The historical performance of Nordic listed companies (adjusted for extremechanges)sincetheearly1990s.Asteadypositivetrendinrecentyears indicates a relatively mature business cycle.
Source:SEB
Telecoms Industrials Health care The Nordics
Paper and pulp Oil Retail
16 Investment Outlook: September 2018
such as e-commerce, automation, smart business systems and digital games are currently experiencing structural growth. Network equipment is, of course, needed to en-sureareliablehigh-speedinternetconnection.Thenetworkequipment sector as a whole has faced a challenging busi-ness climate for years, after the big shift to fourth generation (4G)technology.Thissectorlookslikeitcouldbenefitfromthefutureshifttothenextgenerationoftechnology(5G).It brings together many market players that are even more dependentonareliablehigh-speedconnection,forexamplein the automotive industry and manufacturing. Although the market is currently shrinking, there is good potential for a rebound – which is naturally linked to both competitiveness and share valuations.
We are also optimistic about Nordic companies exposed tothebigshiftinAsiancountriestoservice-andconsump-tion-basedsocieties,whichwebelievewillbeattractiveinthelong term. We are especially optimistic about product seg-ments such as food packaging, hygiene products, breweries, telecom operators, health care or purely digital services and solutions.
When we consider the prospects in purely quantitative terms and compare current average share prices in each sector with our benchmark prices, we find that construction, banking and telecom operators are all ranked in the top four. The Nordic construction sector has been hit hard in the past year. Along withretail,insuranceandsocial/educational/healthservices,ithasbeenoneoftheworstsectorstobeinvestedin.Bankinghas also been affected by a lengthy upward trend in the hous-ing market, which is now experiencing a sharp deceleration. However, banks have good potential to continue improving their efficiency. Combined with relatively high dividend yields over the next few years, this means they will benefit from higher inflation.
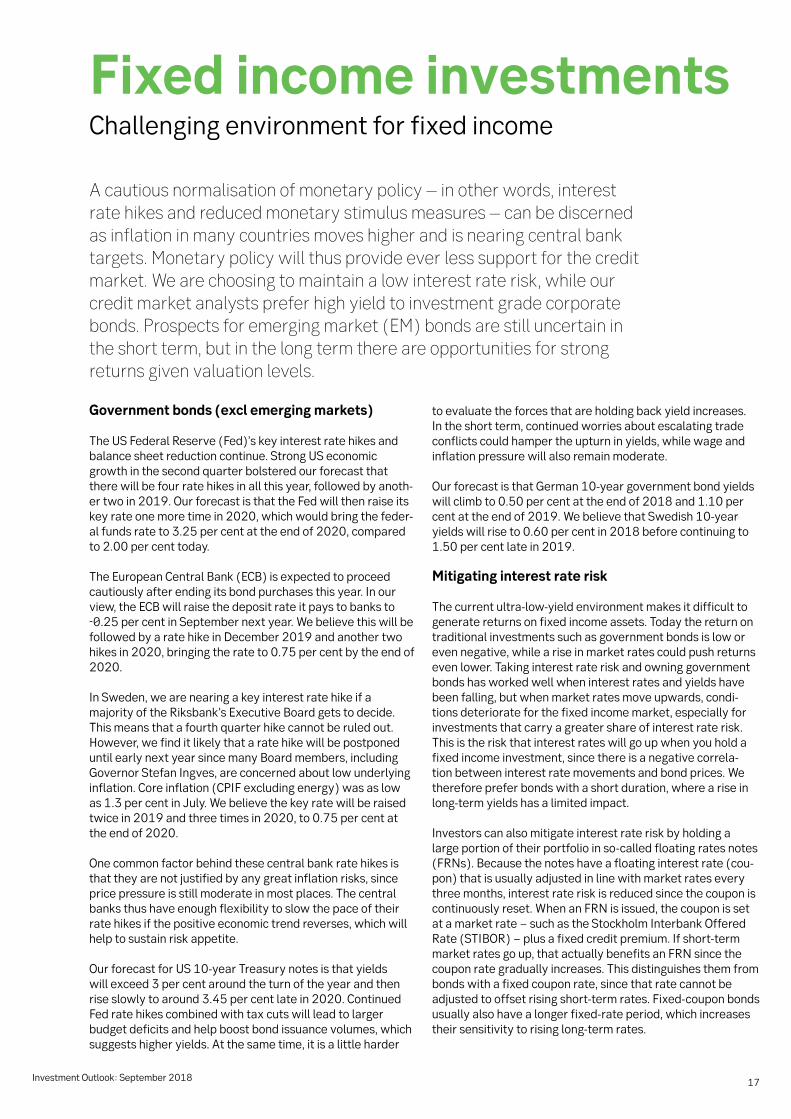
Nordic equities reasonably valued at P/E 16
When our last issue of Investment Outlook was published in May,theNordicstockmarkethadaprice/earnings(P/E)ratioof 17, which we then thought was somewhat high from a his-torical perspective. At this writing, the figure has fallen 6 per cent to 16.1, which we believe is relatively reasonable. If the economy moderates from today’s robust activity level, it will be hard for valuations to keep driving returns. The earnings trend has driven equities upwards for the past two or three years and will probably also do so going forward.
Share valuations (P/E) are historically reasonable
Theforwardearningsforecast(price/earningsratio)fortheNordicstockmarket,basedonabout250companiesthatSEBmonitorsandanalyses.Thecurrentfigureof16.1ishistoricallyhighandmarksarelatively mature stage of the business cycle – but there are always attractive growth opportunities.
Source:SEB
17Investment Outlook: September 2018
A cautious normalisation of monetary policy – in other words, interest rate hikes and reduced monetary stimulus measures – can be discerned as inflation in many countries moves higher and is nearing central bank targets. Monetary policy will thus provide ever less support for the credit market. We are choosing to maintain a low interest rate risk, while our credit market analysts prefer high yield to investment grade corporate bonds. Prospects for emerging market (EM) bonds are still uncertain in the short term, but in the long term there are opportunities for strong returns given valuation levels.
Government bonds (excl emerging markets)
The US Federal Reserve (Fed)’s key interest rate hikes and balance sheet reduction continue. Strong US economic growth in the second quarter bolstered our forecast that there will be four rate hikes in all this year, followed by anoth-er two in 2019. Our forecast is that the Fed will then raise its key rate one more time in 2020, which would bring the feder-al funds rate to 3.25 per cent at the end of 2020, compared to 2.00 per cent today.
TheEuropeanCentralBank(ECB)isexpectedtoproceedcautiously after ending its bond purchases this year. In our view,theECBwillraisethedepositrateitpaystobanksto-0.25percentinSeptembernextyear.Webelievethiswillbefollowed by a rate hike in December 2019 and another two hikes in 2020, bringing the rate to 0.75 per cent by the end of 2020.
In Sweden, we are nearing a key interest rate hike if a majorityoftheRiksbank’sExecutiveBoardgetstodecide.This means that a fourth quarter hike cannot be ruled out. However, we find it likely that a rate hike will be postponed untilearlynextyearsincemanyBoardmembers,includingGovernor Stefan Ingves, are concerned about low underlying inflation. Core inflation (CPIF excluding energy) was as low as 1.3 per cent in July. We believe the key rate will be raised twice in 2019 and three times in 2020, to 0.75 per cent at the end of 2020.
One common factor behind these central bank rate hikes is that they are not justified by any great inflation risks, since price pressure is still moderate in most places. The central banks thus have enough flexibility to slow the pace of their rate hikes if the positive economic trend reverses, which will help to sustain risk appetite.
OurforecastforUS10-yearTreasurynotesisthatyieldswill exceed 3 per cent around the turn of the year and then rise slowly to around 3.45 per cent late in 2020. Continued Fed rate hikes combined with tax cuts will lead to larger budget deficits and help boost bond issuance volumes, which suggests higher yields. At the same time, it is a little harder
to evaluate the forces that are holding back yield increases. In the short term, continued worries about escalating trade conflicts could hamper the upturn in yields, while wage and inflation pressure will also remain moderate.
OurforecastisthatGerman10-yeargovernmentbondyieldswill climb to 0.50 per cent at the end of 2018 and 1.10 per centattheendof2019.WebelievethatSwedish10-yearyields will rise to 0.60 per cent in 2018 before continuing to 1.50 per cent late in 2019.
Mitigating interest rate risk
Thecurrentultra-low-yieldenvironmentmakesitdifficulttogenerate returns on fixed income assets. Today the return on traditional investments such as government bonds is low or even negative, while a rise in market rates could push returns even lower. Taking interest rate risk and owning government bonds has worked well when interest rates and yields have been falling, but when market rates move upwards, condi-tions deteriorate for the fixed income market, especially for investments that carry a greater share of interest rate risk. This is the risk that interest rates will go up when you hold a fixed income investment, since there is a negative correla-tion between interest rate movements and bond prices. We therefore prefer bonds with a short duration, where a rise in long-termyieldshasalimitedimpact.
Investors can also mitigate interest rate risk by holding a largeportionoftheirportfolioinso-calledfloatingratesnotes(FRNs).Becausethenoteshaveafloatinginterestrate(cou-pon) that is usually adjusted in line with market rates every three months, interest rate risk is reduced since the coupon is continuously reset. When an FRN is issued, the coupon is set atamarketrate−suchastheStockholmInterbankOfferedRate(STIBOR)−plusafixedcreditpremium.Ifshort-termmarket rates go up, that actually benefits an FRN since the coupon rate gradually increases. This distinguishes them from bonds with a fixed coupon rate, since that rate cannot be adjustedtooffsetrisingshort-termrates.Fixed-couponbondsusuallyalsohavealongerfixed-rateperiod,whichincreasestheirsensitivitytorisinglong-termrates.
Fixed income investmentsChallenging environment for fixed income
18 Investment Outlook: September 2018
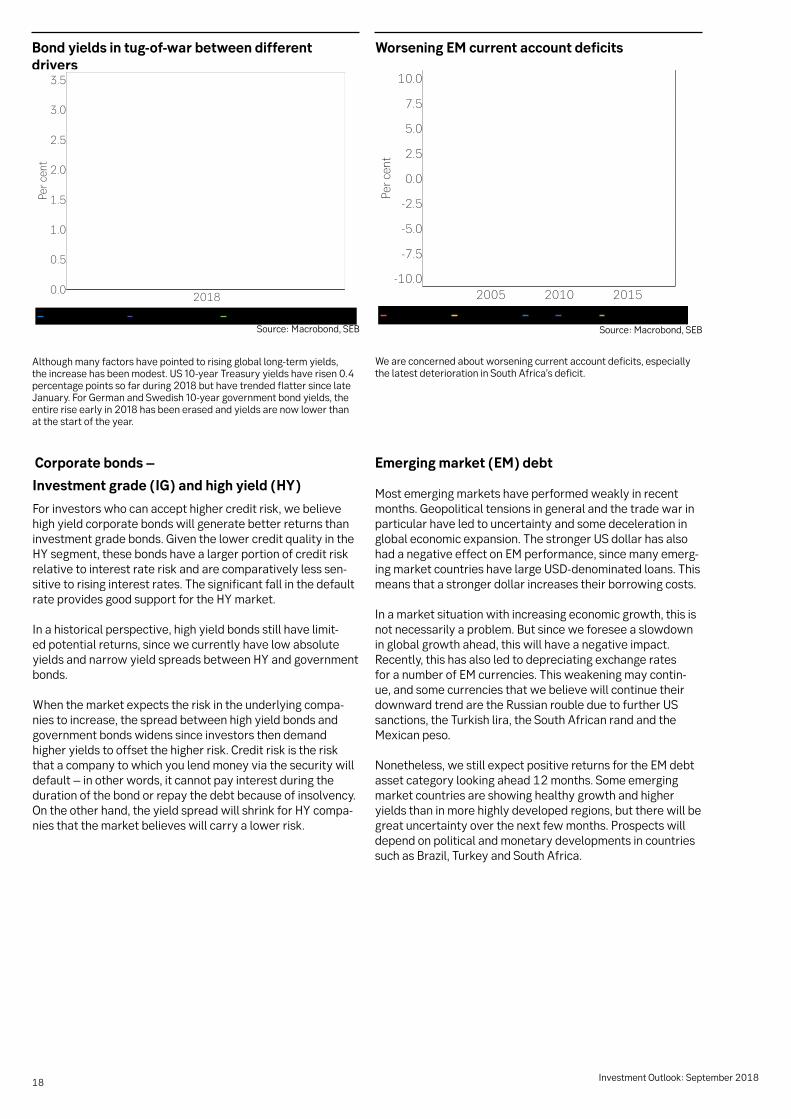
Bond yields in tug-of-war between different drivers
Worsening EM current account deficits
We are concerned about worsening current account deficits, especially the latest deterioration in South Africa’s deficit.
Althoughmanyfactorshavepointedtorisinggloballong-termyields,theincreasehasbeenmodest.US10-yearTreasuryyieldshaverisen0.4percentagepointssofarduring2018buthavetrendedflattersincelateJanuary.ForGermanandSwedish10-yeargovernmentbondyields,theentireriseearlyin2018hasbeenerasedandyieldsarenowlowerthanat the start of the year.
Source:Macrobond,SEB Source:Macrobond,SEB
Corporate bonds –
Investment grade (IG) and high yield (HY)
For investors who can accept higher credit risk, we believe high yield corporate bonds will generate better returns than investment grade bonds. Given the lower credit quality in the HYsegment,thesebondshavealargerportionofcreditriskrelative to interest rate risk and are comparatively less sen-sitive to rising interest rates. The significant fall in the default rateprovidesgoodsupportfortheHYmarket.
In a historical perspective, high yield bonds still have limit-ed potential returns, since we currently have low absolute yieldsandnarrowyieldspreadsbetweenHYandgovernmentbonds.
When the market expects the risk in the underlying compa-nies to increase, the spread between high yield bonds and government bonds widens since investors then demand higher yields to offset the higher risk. Credit risk is the risk that a company to which you lend money via the security will default – in other words, it cannot pay interest during the duration of the bond or repay the debt because of insolvency. Ontheotherhand,theyieldspreadwillshrinkforHYcompa-nies that the market believes will carry a lower risk.
Emerging market (EM) debt
Most emerging markets have performed weakly in recent months. Geopolitical tensions in general and the trade war in particular have led to uncertainty and some deceleration in global economic expansion. The stronger US dollar has also hadanegativeeffectonEMperformance,sincemanyemerg-ingmarketcountrieshavelargeUSD-denominatedloans.Thismeans that a stronger dollar increases their borrowing costs.
In a market situation with increasing economic growth, this is notnecessarilyaproblem.Butsinceweforeseeaslowdownin global growth ahead, this will have a negative impact. Recently, this has also led to depreciating exchange rates foranumberofEMcurrencies.Thisweakeningmaycontin-ue, and some currencies that we believe will continue their downward trend are the Russian rouble due to further US sanctions, the Turkish lira, the South African rand and the Mexican peso.
Nonetheless,westillexpectpositivereturnsfortheEMdebtasset category looking ahead 12 months. Some emerging market countries are showing healthy growth and higher yields than in more highly developed regions, but there will be great uncertainty over the next few months. Prospects will depend on political and monetary developments in countries suchasBrazil,TurkeyandSouthAfrica.
19Investment Outlook: September 2018
We are more than halfway through 2018, and from a hedge fund perspective market conditions have sometimes been good and sometimes difficult. The last quarter was dominated by two overarching themes with opposite effects on market sentiment. On the negative side are the trade war and the consequent geopolitical tensions. However, these are offset by the upside surprise provided by corporate earnings reports − not only in the US but also in Europe, with Sweden being a standout.
Hedge fundsIn contrast to 2017, volatility has sprung back to life this year. That is a critical factor for many hedge funds in their drive for returns and is the same factor that put a spanner in the works for most hedge funds seeking returns last year.
However, we have not experienced any extreme volatility this year. The difference compared to last year is instead attribut-able to the extreme calm in 2017.
Nonetheless, volatility is not always beneficial. Whether the effects of higher volatility will lead to an improved investment climate for hedge funds also depends on the original cause of the increase in volatility. It is difficult to predict sharp price movements stemming from trade wars and geopolitics but it is, if possible, even harder to forecast their market effects, real economic impact and duration.
In this case, the volatility that is being created is largely based on uncertainty, and at this stage it cannot be taken for grant-ed that returns can be generated. However, return prospects arebrighterwhentherehavebeenmis-pricingsatalatestageand the conditions for resuming some kind of normal situation are highly favourable.
Butifvolatilityisdrivenbysurprisingandbroadstrengthinthe corporate world, conditions look far better. In that case, share prices rise on a broad front while fundamental price dif-ferentials are created between both companies and sectors.
Equity long/short
The strength of stock markets since April has benefited equi-tylong/shortstrategiesThestrongsecondquarterreportsea-son contributed to fundamental price movements, which in turn created price differentials between both companies and sectors. However, in some cases isolated corporate events involving popular companies created problems. One example is Facebook, whose share price plunged by 18 per cent after
the release of its second quarter report. Given the somewhat more cautious outlook for stock market performance, there should be an advantage for funds employing this strategy that can vary their net exposure to the stock market over time.
Credits
While credit spreads – yield gaps between corporate bonds and government bonds – widened somewhat this year, they are still narrow in a historical comparison. Meanwhile con-ditions have deteriorated. This universe has been indirectly limitedforEuropeaninvestorsbuyingUScredits,giventhewideningspreadinshort-termyieldsbetweentheUSandEurope.Putsimply,thisisthecostthatEuropeaninvestorshave to pay to hedge their investments in US credits. As a result, prospects for this strategy depend somewhat on which market is the investor’s domestic market.
Event-driven
The global volume of corporate transactions continues to growandreachedanall-timehighduringthefirsthalfof2018. This bright picture will probably continue as long as the economy remains strong, as companies continue to buy growthandrealisevaluethroughmergers,spin-offs,buy-backs and restructurings.
One factor that makes this strategy less viable is the question of whether conditions can get much better. For published offers in the market as a whole, the difference between market price and offered price is relatively small, and cross-bordercorporatedealsarebecomingincreasingly difficult due to protectionist headwinds. Meanwhile gigantic corporate deals are more and more common, inflating aver-age business volume and increasing vulnerability if a deal is not completed.
Alternative investmentsUncertain prospects can both help and hurt
20 Investment Outlook: September 2018
CommoditiesOil prices near current levels for rest of 2018
Oil demand has been good this year. However, oil prices (Brentcrude)haveshownrathersharpfluctuations.Atthestartoftheyear,oilwasatUSD66/barrel,butthepricethensurgedduringthespring−reachingUSD80inlateMay−sustained by a somewhat tight market. Oil subsequently lost strength,fallingbacktoUSD70/barrel.ThemainreasonsforthepricedeclinewereproductionincreasesbyOPEC+(theOrganisationofthePetroleumExportingCountriesplus Russia,Mexico,Kazakhstan,Oman,Azerbaijan,Brunei, Malaysia,Sudan,SouthSudanandBahrain)andamovebyinvestors to close their positions after having bet on rising prices. Oil has now bounced back to around USD 75.
We believe that oil prices will remain at around current levels for the rest of 2018. Our forecast for 2019 is that prices will risetoUSD85/barrel,somewhathigherthanourpreviousforecast, and will remain there in 2020 as well. We expect OPEC+tocontinuecontrollingthesupplyanddemandsitu-ation this year and in 2019. Saudi Arabia’s strategy is price over volume. The country’s production is now at a high level, so there is ample room to reduce it and thus keep prices up.
One important consequence of the stronger USD is that crude oilinnon-dollartermshasbecomemoreandmoreexpensiveforglobalconsumers.OneexampleofthisisthatBrentcrude−inNOK/barrelterms−ispricedjustafewpercentagepointsbelowitsaveragepricein2011-2014,whenitwasUSD108/barrel.Soformanyconsumers,thecurrentpriceofUSD75/barrel is much higher in practice than it seems. There are defi-nitely growing concerns on the demand side of the equation, due to local foreign exchange costs for oil (a stronger USD), but also because of worries about the health of the world economy and global growth. For example, a stronger USD is not at all beneficial to emerging markets in general, so there may be a risk that demand will fall and demand forecasts may be lowered.
If there is no global recession, as our current forecasts assume, we see only a small downside risk for oil prices at today’s levels. That is also the market consensus. The view that oil prices will remain at current levels or slightly higher is supported by factors such as reduced output in Venezue-la, Mexico, Angola and other countries due to an extended period of underinvestment, lower US oil production due to a shortageofpipelinesinkeyareasandshrinkingOPECreservecapacity. Add US sanctions against Iran, which enter into force on November 4 and include a ban on almost all Iranian oil exports. Iran today accounts for about 4.5 per cent of globaloilproduction.OPECrecentlypublisheditsoildemandforecast for 2019, which is just over 100 million barrels a day, somewhat higher than demand in 2018. In 2020, a new international regulation limiting sulphur content in marine fuel oil will also take effect, which may lead to higher oil prices.
The broad hedge fund index trend
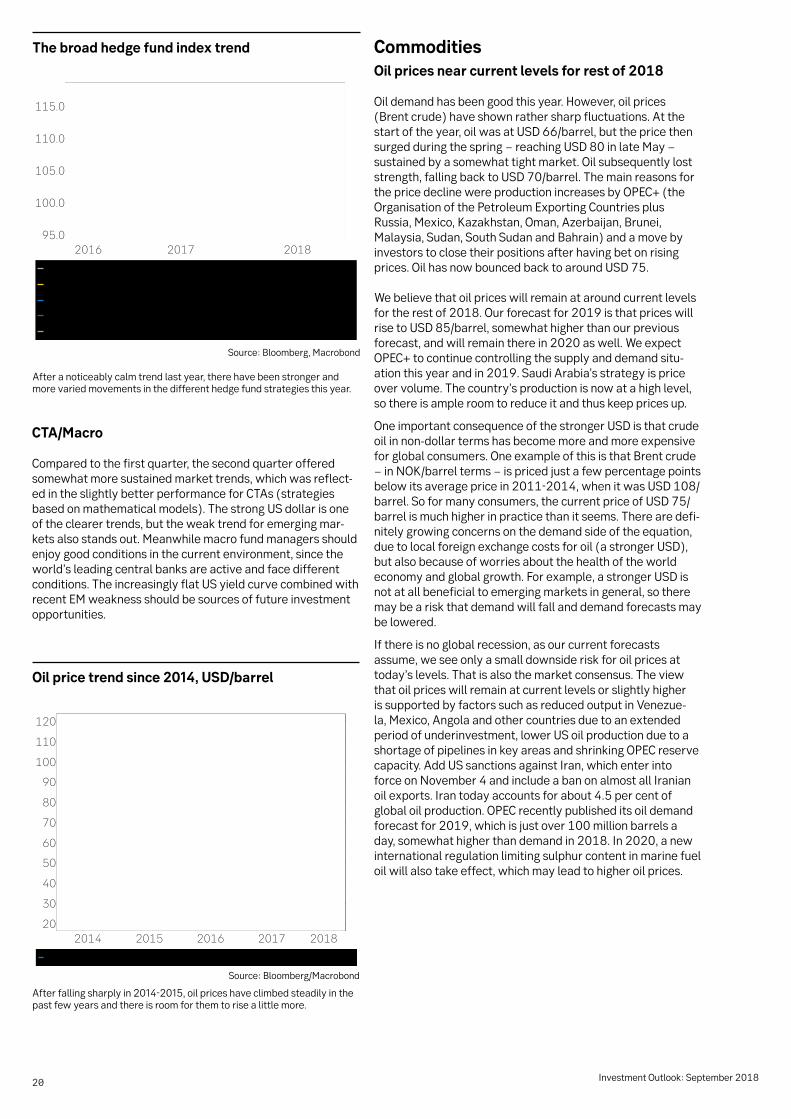
Oil price trend since 2014, USD/barrel
Afterfallingsharplyin2014-2015,oilpriceshaveclimbedsteadilyinthepast few years and there is room for them to rise a little more.
Source:Bloomberg/Macrobond
Source:Bloomberg,Macrobond
CTA/Macro
Compared to the first quarter, the second quarter offered somewhat more sustained market trends, which was reflect-ed in the slightly better performance for CTAs (strategies based on mathematical models). The strong US dollar is one of the clearer trends, but the weak trend for emerging mar-kets also stands out. Meanwhile macro fund managers should enjoy good conditions in the current environment, since the world’s leading central banks are active and face different conditions. The increasingly flat US yield curve combined with recentEMweaknessshouldbesourcesoffutureinvestmentopportunities.
After a noticeably calm trend last year, there have been stronger and more varied movements in the different hedge fund strategies this year.
21Investment Outlook: September 2018
This summer the foreign exchange (FX) market was characterised by a low level of activity, with major currencies trending flat. However, after Turkey’s financial crisis escalated, currencies started moving. The Turkish lira’s weakness had long been rather isolated, but when that crisis began to affect global risk appetite, other emerging market (EM) currencies were also hit. Defensive currencies such as the dollar and yen strengthened, mainly at the expense of smaller currencies such as the SEK. The FX market will probably continue this reaction pattern if crises in Turkey or other EM countries intensify again. As a result, currencies that lost ground in August have potential to strengthen if the situation in Turkey stabilises. The krona continues to suffer from negative Swedish interest rates and from short-term political uncertainty due to the Swedish general election. If the right-wing populist Sweden Democrats gain ground, the krona may lose a few per cent, but we believe such a movement would be very temporary.
Dollar set to top out
During the spring, the US dollar surged and, after a few months of stability, regained momentum when the crisis in Turkey escalated. We interpret the dollar’s movements so far this year as a sign of a changed reaction pattern. For a long time, the dollar was one of the currencies that benefited from growing risk appetite, but in 2018 its defensive characteris-tics resurfaced and will probably persist going forward. The USD is still adversely affected by continued reductions in cur-rencyreservemanagers’relativedollarexposure.Butglobalcurrency reserves decreased their proportion of USD holdings at a slower pace early in 2018 than in 2017. Furthermore, we believe that the Fed’s continued rate hikes will not support the USD much more in the future. President Donald Trump has clearly indicated that he dislikes a strong dollar, which could also have some psychological impact, but he does not have any concrete means of influencing the FX rate. With our fairly optimistic view of today’s international troubles, such asthecrisisinTurkey,weexpectthattheEUR/USDratemaystill move somewhat lower in the short term but will rebound and reach 1.15 at the end of 2018. In 2019 and 2020, we predict further dollar depreciation as other central banks narrow their interest rate spread against the US by initiating ratehikesoftheirown.TheEUR/USDratewillreach1.28bythe end of 2020.
CurrenciesChanges in risk appetite trigger large movements
Record interest rate support for the dollar
Source:Bloomberg/Macrobond
DuetotheprevailingwideyieldspreadbetweenUSandSwedishshort-terminterestrates,itisexpensivetocurrency-hedgeUSDexposures.
22 Investment Outlook: September 2018
Currency forecasts
Currency pair
Exchangerate Change, %
Today Q3 2018 Q4 2018 Q1 2019 Q2 2019 Q3 2018 Q4 2018 Q1 2019 Q2 2019
EUR/USD 1.17 1.12 1.15 1.16 1.18 -4.3 -1.7 -0.9 0.9
EUR/SEK 10.67 10.50 10.50 10.30 10.20 -1.6 -1.6 -3.4 -4.4
USD/SEK 9.12 9.38 9.13 8.88 8.64 2.8 0.2 -2.6 -5.2
EUR/NOK 9.73 9.50 9.30 9.20 9.10 -2.3 -4.4 -5.4 -6.4
USD/NOK 8.31 8.48 8.09 7.93 7.71 2.0 -2.7 -4.6 -7.2
EUR/CHF 1.14 1.16 1.18 1.20 1.22 1.5 3.2 5.0 6.7
USD/JPY 111.1 111 110 108 106 -0.1 -1.0 -2.8 -4.6
EUR/GBP 0.91 0.90 0.87 0.85 0.84 -0.8 -4.1 -6.3 -7.4
GBP/SEK 11.76 11.67 12.07 12.12 12.14 -0.8 2.7 3.1 3.3
CurrencyforecastsweremadebySEBResearch&StrategyasofAugust28,2018.Youarewelcometoaskforacopyofourlatestforecasts.
Pound will take beating but appreciate in long term
Developments in the United Kingdom’s negotiations to leave theEuropeanUnion(“Brexit”)remainthedominantdriverfortheBritishpound.Thissignificantlyundervaluedcurrency benefited from progress in the talks during the spring, but during the summer political conflicts within the UK govern-ment intensified, resulting in renewed depreciation. Despite major difficulties over issues such as future trade relations and the UK’s land border with Ireland, we are sticking to our positive outlook on the likelihood of an agreement being reached. Combined with support from tighter monetary policy, this will lead to a stronger pound in the long term. In the short term, the pound will probably take a further beating before an agreement is in place, and it may well be a while beforetheBankofEnglandfollowsuponitsAugustratehike.OurforecastisthattheEUR/GBPratewillexceed0.90intheshort term and then gradually fall back to 0.80 by the end of 2020, provided that negotiations lead to agreement on a “soft”,controlledBrexit.IfnegotiationsbreakdownoriftheagreementisrejectedbyanEUmemberortheUKParliament–causingtheUKtoleavetheEUnextyearwithoutanagree-ment−thereisariskthatthepoundwillweakensignificantly,especially against the USD.
Yen undervalued in long term
The defensive characteristics of the Japanese yen have been apparent so far this year. A stock market rally, trade policy tensions and market concerns about Turkey have all helped strengthentheyen.However,movementsintheUSD/JPYrate have been limited, since the dollar has behaved similarly. Our models suggest that the yen is still undervalued in the long term, but we still have a hard time foreseeing a clear yen appreciation in a world with decent economic growth and somewhat tighter monetary policy elsewhere. In our fore-cast,theUSD/JPYpairwilltradeinthe105-110rangethisyear and in 2019, then move towards 100 in the long term astheBankofJapanpreparestolaunchalessexpansionarymonetary policy.
Swedish krona towards 10.50 around year-end
For a long time, the Riksbank’s actions have had a negative effect on the krona. If the central bank lowers its interest rate path, there will still be uncertainty among market players about whether the right conditions are in place for the Riks-bank to justify a key interest rate hike. Negative interest rates are making krona investments unattractive, thus pushing down the currency. Ups and downs in the general election campaign, including alarmist reports in international media, may also have a negative impact on the krona, although the currency is normally relatively insensitive to political uncer-tainty. Looking at foreign ownership of Swedish assets (his-toricallyverylowintermsofinterest-bearinginstruments)and the state of the government budget and current account balance (both in surplus), it is hard to argue that the krona will be vulnerable to foreign portfolio outflows (investors selling assets) or that Sweden will have funding problems.
TheEUR/SEKexchangeratewillprobablyremainhighduringthe autumn, and due to election concerns it may reach a bit above 10.50. Although the political situation will be clearer bytheendoftheyear,weexpecttheEUR/SEKratetoremainataround10.50byyear-end,withthekronathenrecoveringsomewhat and strengthening to 10.00 per euro by the end of 2019.
Long-undervalued NOK should appreciate
The Norwegian krone has not reacted especially much to the country’s economic stabilisation following higher oil prices andtoNorgesBank’sclearsignalsofaninterestratehikeat its next policy meeting in September. The downturn in oil pricesfromjustbelowUSD80nearlytoUSD70/barrelthissummer, combined with reduced global risk appetite, may ex-plain why buyers are not attracted to the currency. However, prospects of somewhat higher oil prices going forward as well ascentralbankactionareexpectedtohelpthelong-under-valued krone start to appreciate. The currency will gradually beboostedbyoilpricesastheyheadtowardsUSD85/barrelin 2019 and by a wide yield spread between Norway and the eurozone/Germany.Inourview,theEUR/NOKratewillfallto 9.30 in 2018 and the NOK will then continue to gradually strengthen to 8.90 at the end of 2020.
23Investment Outlook: September 2018
Contributors to this issue of Investment Outlook
This report was published on September 11, 2018. Its contents are based on information and analysis available until September 4, 2018
Fredrik Öberg Chief Investment Officer Investment Strategy [email protected]
Johan Hagbarth Economist Investment Strategy [email protected]
Kai Svensson Portfolio Manager Investment Strategy [email protected]
Christopher Lyrhem EquityAnalyst Investment Strategy [email protected]
Louise Lundberg Economist Investment Strategy [email protected]
Henrik Larsson Portfolio Manager Investment Strategy [email protected]
Roger Törnkvist Economist Investment Strategy [email protected]
Carl Hammer Chief Currency Strategist Research [email protected]
Pernilla Busch Investment Communication Mgr Investment Strategy [email protected]
Cecilia Kohonen Investment Communication Mgr Investment Strategy [email protected]
ThisdocumentproducedbySEBcontainsgeneralmarketinginformationaboutitsinvestmentproducts.SEBistheglobalbrandnameofSkandinaviskaEnskildaBankenAB(publ)anditssubsidiariesandbranches.Neitherthematerialnortheproducts described herein are intended for distribution or sale in the United States of America or to persons resident in the UnitedStatesofAmerica,so-calledUSpersons,andanysuchdistributionmaybeunlawful.Althoughthecontentisbasedonsourcesjudgedtobereliable,SEBwillnotbeliableforanyomissionsorinaccuracies,orforanylosswhatsoeverwhicharises from reliance on it. If investment research is referred to, you should if possible read the full report and the disclo-surescontainedwithinit,orreadthedisclosuresrelatingtospecificcompaniesfoundonwww.seb.se/mb/disclaimers.Information relating to taxes may become outdated and may not fit your individual circumstances. Investment products produce a return linked to risk. Their value may fall as well as rise, and historic returns are no guarantee of future returns; in some cases, losses can exceed the initial amount invested. Where either the underlying funds or you invest in funds or securitiesdenominatedinaforeigncurrency,changesinexchangeratescanimpactthereturn.Youaloneareresponsiblefor your investment decisions and you should always obtain detailed information before taking them. For more informa-tion please see inter alia the Key Investor Information Document for funds and the information brochure for funds and for structured products, available at www.seb.se. If necessary, you should seek advice tailored to your individual circumstanc-esfromyourSEBadvisor.
Information about taxation: AsacustomerofourInternationalPrivateBankingofficesinLuxembourgandSingaporeyouare obliged to keep yourself informed of the tax rules applicable in the countries of your citizenship, residence or domicile withrespecttobankaccountsandfinancialtransactions.SEBdoesnotprovideanytaxreportingtoforeigncountries,which means that you must yourself provide concerned authorities with information as and when required.
Investment StrategySEBSE-10640Stockholm,Sweden