investment opportunities and challenges in the irish … opportunities and challenges in the irish...
TRANSCRIPT

Investment Opportunities and
Challenges in the Irish Potato Value Chain in
Uganda
RESEARCH REPORT NO. 14
JUNE 2016
Swaibu Mbowa and Francis Mwesigye
PASIC Project Output 1: Evidence Generation-Activity # 1.2 Value Chain Studies


i
Investment Opportunities and Challenges in the
Irish Potato Value Chain in Uganda
JUNE 2016
PASIC Project Output 1: Evidence Generation-Activity # 1.2 Value Chain Studies

In
ve
st
me
nt
O
pp
Or
tu
nI
tI
es
a
nd
C
ha
ll
en
ge
s
In
t
he
p
Ot
at
O
va
lu
e
Ch
aI
n
In
u
ga
nd
a
ii

In
ve
st
me
nt
O
pp
Or
tu
nI
tI
es
a
nd
C
ha
ll
en
ge
s
In
t
he
p
Ot
at
O
va
lu
e
Ch
aI
n
In
u
ga
nd
a
iii
Table of ContentsEXECUTIVE SUMMARY 1
1. INTRODUCTION 41.1 Background 41.2 Study Objectives 6
2. LITERATURE REVIEW 72.1 The Conceptual Framework of the Value Chain 72.2 Application of the value chain approach to the Irish Potato subsector in the Ugandan context 8
3. METHODOLOGY 113.1 Research Design 113.2 Study Area 113.3 Sampling methodology 123.4 Data Sources 133.4.1 Secondary Data Sources (administrative document review) 133.4.2 Primary Data 133.5 Participatory Value Chain Training 133.6 Data Analysis 14
4. RESULTS AND DISCUSSION 154.1 Irish Potato production and institutions supporting Irish Potato producers in Western Uganda 154.1.1 Characteristics of Irish Potato producers 154.1.2 Irish Potato Farmers’ Institutions 154.1.3 Irish Potato Varieties Grown 174.1.4 Influential Actors in Irish Potato Production 184.2 Ware Irish Potato Marketing at the Production (Farm) Level 194.2.1 The flow of ware Irish Potato from production to marketing 194.2.2 Points of sale and Irish Potato market arrangements 214.2.3 Irish Potato Grading at the Farm (production) level 224.2.4 Enabling Institutions linking farmers to markets 224.2.5 Financing of Irish Potato production (Sources of Credit) 234.2.6 Gender roles in Irish Potato production 244.2.7 Potential for Upgrading the Irish Potato Value Chain at the Production level 254.3 Technological Support Services and Investment Gaps 264.3.1 Seed Irish Potato Production System 264.3.2 Technology uptake and impact 304.3.3 Seed Irish Potato Multipliers’ capability and Investment gap 314.3.4 Dynamics in Seed Irish Potato Marketing 334.3.5. The economics of Seed Irish Potato production 344.3.6 Business Characteristics and Capabilities of Agro-Input Dealers 354.3.7 Category of inputs and Business Size of agro-input dealers 36

In
ve
st
me
nt
O
pp
Or
tu
nI
tI
es
a
nd
C
ha
ll
en
ge
s
In
t
he
p
Ot
at
O
va
lu
e
Ch
aI
n
In
u
ga
nd
a
iv
4.3.8. Classification of the agro-inputs market 374.3.9. Financing of agro-input trading 384.3.10. Organizations supporting agro-input dealers 394.4 Actors in Ware Irish Potato Trading and Marketing 404.4.1 Volumes of Ware Irish Potato Traded 404.4.2 Mapping Key Actors in Ware Irish Potato Trading 414.4.3 Flow of Ware Irish Potato Varieties Traded and Nature of Trade Linkages 424.4.4 Pricing and Grading Practices of Ware Irish Potato by Traders 454.4.5 Services and inputs Support to farmers by Traders (Backward Linkages) 464.4.6 Characterization of Transport and Storage 464.4.7 Employment from Ware Irish Potato Trading 474.4.8 Major challenges among ware Irish Potato traders 474.5 Irish Potato Processing and Value Addition 484.5.1. Business Characteristics of Irish Potato Processing Ventures 484.5.2 Pricing and Grading of Ware Irish Potato Purchased for Processing 504.5.3 The structure of the labour force and employment in Irish Potato processing 514.5.4 Financing Irish Potato processing 514.5.5 Key Constraints in Irish Potato Processing 524.6 Gross Margins Analysis in the Irish Potato value chain 57
5. CONCLUSIONS AND POLICY RECOMMENDATIONS 58References 61Appendix 63
LIST OF FIGURES
Figure 1: Irish Potato Production, Area and Yield Trends in Uganda (1970-2010) 4Figure 2: Value Chain Framework 7Figure 3: Irish Potato production (tons) by region 11Figure 4: Irish Potato growing districts in Southwestern Uganda 12Figure 5: Percentage of farmer groups started per year 16Figure 6: Footprint of Organizations Supporting Farmer-Based Irish Potato producer groups 16Figure 7: Percentage of farmers in a group reporting a cluster’s main activity 17Figure 8: Identified Potato Varieties grown in Kigezi sub-region (% of FGDs in Community survey) 18Figure 9: Percentage of farmers selling Irish Potato to each buyer category 20Figure 10: Reported (%) ware Irish Potato marketing arrangements at production 20Figure 11: Percentage of Irish Potatoes sold at each sale point 21Figure 12: FGD Reporting (%) on Key attributes in Irish Potato grading during marketing 22Figure 13: Source of Credit and interest rates 24Figure 14: Percentage contribution of men and women in Irish Potato production 25Figure 15: Indicative National Irish Potato Productivity and Income without and with intensification 26Figure 16: Seed Irish Potato varieties grown (% of private seed multipliers) 28Rankings of the preference for particular Irish Potato varieties based on a combination of attributes by private seed multipliers 28
In
ve
st
me
nt
O
pp
Or
tu
nI
tI
es
a
nd
C
ha
ll
en
ge
s
In
t
he
p
Ot
at
O
va
lu
e
Ch
aI
n
In
u
ga
nd
a
v
Figure 17: Level of Application of Recommended Technologies in Seed Irish Potato Multiplication 30Figure 18: Estimated Seed Irish Potato gap 32Figure 18 a: Effectiveness of organizations in Promoting Seed Irish Potato Production 32Figure 19: Enlisted (%) major Buyers of seed Irish Potato 33Figure 20: Seed Irish Potato Price differences between Varieties 34Figure 21: Observed Trends in Seed Irish Potato Production since 2012 35Figure 22: Registration status of agro-input dealers 36Figure 23: Amounts of agro-inputs stocked by a dealer in peak season (4 months) 37Figure 24: Predictions of market dynamics for inputs (% Self-reported) in the next 3 years 38Figure 25: Sources of funding to agro-input dealers 39Figure 26: Percentage of agro-input dealers obtaining support from the organization 40Figure 27: Volumes (%) of Respective Ware Irish Potato Traded by Variety 42Figure 28: Proportionate (%) role of value chain actors in the flow of ware Irish Potato from production to marketing. 43Figure 29: Responses (%) on contracting during ware Irish Potato transactions 44Figure 30: Period (years) in business with ware Irish Potato suppliers reported by Traders (%) 45Figure 31: Grading process, Reported Criteria (%), and Prices of Irish Potato Varieties 45Pic 1: Grading Process 45Figure 32: Traders (%) providing various forms of support to supplies. 46Figure 33: Ware Irish Potato buying points reported by Traders (%) 46Figure 34: Employment created at the Trading Level of the Ware Irish Potato Value Chain 47Figure 35: Major challenges among ware Irish Potato traders 48Figure 36: Processed Irish Potato products 49Figure 37: Ware Irish Potato quality attributes considered by processors 50Figure 38: Processors’ response (%) on adequacy in Irish Potato supplies across Seasons 52Figure 39: Sources of Processed Irish Potato 53Figure 40: Percentage of processors using a given variety 53Figure 41: Processors (%) reporting a contractual arrangement with Irish Potato suppliers 56Figure 42: Length of the trading relationship with the main Irish Potato suppliers 56Figure 43: Observed Trends in the volume of processed Irish Potato over the past 3 years 57Figure 1A: Contractual arrangements between Irish Potato farmers and buyers 65Figure 2A: Irish Potato Yield (MT/HA) Comparisions Across Countries 66Table 4A: Imputed, Yield, Actual and Potential Production, and Indicative Value of Irish Potato Produced in Uganda 67Figure 1B: Size, Yield and Production characteristics of Seed Irish Potato Farm 69Figure 2B: Enlisted main challenges encountered by seed Irish Potato multipliers 70Figure 1C: Responses (%) on contracting during ware Irish Potato transactions 70Figure 2C: Price differential, and Traders’ estimate (%) of quality of ware Irish Potato marketed 71Figure 3C: Ware Irish Potato Stock Holding Period (Days) 71Figure 4C: Labour distribution by gender at Trading Level of the Ware Irish Potato Value Chain 72Figure 5C: Employment distribution by age group at Trading Level of the Ware Irish Potato Value Chain 72

In
ve
st
me
nt
O
pp
Or
tu
nI
tI
es
a
nd
C
ha
ll
en
ge
s
In
t
he
p
Ot
at
O
va
lu
e
Ch
aI
n
In
u
ga
nd
a
vi
LIST OF TABLES
Table 1: Samples per district 13Table 2: Characteristics of farmers 15Table 3: The key actors that influence the production of Irish Potatoes in terms of [quality; quantity and price] 19Table 4: Percentage of groups ranking organizations 23Table 5: Range in Yield across Seed Irish Potato Varieties 30Table 6: Ranking of technologies according to effectiveness in improving yield, % 31Table 7: Descriptive Statistics for a Typical Seed Irish Potato Farm 31Table 8: Profitability of Seed Irish Potato Production 34Table 9: Characteristics of the agro-input dealers (business owners) 35Table 10: Agro-inputs traded and the Percentage of input dealers dealing in each input type 36Table 11: Sources of inputs and distance (minutes) to the source 37Table 12: Major buyers of Irish Potato agro-inputs 38Table 13: Collateral requirements, interest rate and amount borrowed from the credit source 39Table 14: Indicative weekly Volumes of Ware Irish Potato Traded 40Table 15: Mentioned (%) Key Actors in Ware Irish Potato Marketing 41Table 16: Proportion (%) response on Key factors in building trade relationships 44Table 17: Characteristics of processing owners 49Table 18: Scale of operation and capacity Utilization 50Table 19: Jobs created from Irish Potato processing 51Table 20: Sources of credit to processors 51Table 21: Gross Margins at different segments of the value chain (per 120-kg bag) 57Table 1A: Key Facts about Community Irish Potato Farmer Group Institutions 63Table 2A: Categorization of Irish Potato Varieties 63Table 3A: Responses (%) from Community level Rankings of (most preferred) varieties 64Table 4A: Imputed, Yield, Actual and Potential Production, and Indicative Value of Irish Potato Produced in Uganda
67Table B1: Indicative computations for the Seed Irish Potato Gap 68

In
ve
st
me
nt
O
pp
Or
tu
nI
tI
es
a
nd
C
ha
ll
en
ge
s
In
t
he
p
Ot
at
O
va
lu
e
Ch
aI
n
In
u
ga
nd
a
1
EXECUTIVE SUMMARYIrish Potato is an important crop for food and income generation in Uganda. Indeed, the potato is recognized in the 2010/11- 2014/15 Development Strategy and Investment Plan (DSIP) as a strategic commodity with the potential to make a remarkable contribution both to increasing rural incomes and livelihoods and to improving food and nutrition security. Despite its potential, intensification levels remain very low in the potato sub-sector, translating into a very low yield. Farmers increase production by expanding the land used to grow potatoes, not by intensifying their activity.
This study identified challenges and investment opportunities at various points along the potato value chain in Western Uganda (where more than 80% of the country’s potatoes are produced). The study adopted a value chain/multi-stage sampling method involving farmer groups, traders, processors, agro-input dealers, and seed potato multipliers. The value chain survey covered 51 farmer groups randomly selected from the sub-counties in which the International Food Policy Research Institute (IFPRI) has conducted a socio-economic survey. During the survey, 30 traders and 30 processors (identified by farmers as key potato buyers in the community) were randomly selected. To examine access to inputs, a sample of 30 agro-input dealers and 30 seed multipliers (also identified by farmers as suppliers of inputs) were randomly selected. Overall, 120 key informant interviews and 51 focus group discussions were conducted. The study thus charac-terizes the main players in the potato value chain in Western Uganda.
Key Findings
Potato production is primarily supported by numerous chain players: agro-input dealers, seed multipliers, farmers/pro-ducers, marketers (agents and traders), and processors. Although progress has been made at various levels of the value chain, challenges remain that must be addressed before Uganda can optimally exploit its full potato production potential and upgrade its entire value chain.
There has been a very low level of adoption of the technology that is crucial to upgrading the potato value chain at the production level, constricting potato production’s contribution to the Kigezi sub-region’s agricultural economy. Using IITA agronomic survey data (2015), this study demonstrates that the use of quality seed with fertilizer increases potato yield from 6.4 MT per hectare to 16.5 MT per hectare. This leads to an annual increase in potato production from 867 thousand MT to 2,234 thousand MT, increasing the monetary value of potato production by 157%, from Ugx 628 billion (USD 187 million) to Ugx 1,619 billion (USD 484 million) per annum. Therefore, the estimated implied loss of potential income by farmers is approximately Ugx 991 billion (U$ 298 million) per annum.
Value addition that would be critical in upgrading the entire potato value chain remains limited. For instance, a potato processing plant (Kisoro Potato Processing Industries Ltd.) that opened in 2011 still lacks the required potato varieties to support industrial-level processing and is thus operating far below capacity.
Investment opportunities
A seed potato shortage is identified as a major problem that affects the quality of potato production in the Kigezi sub-region. There are two dimensions of shortfalls in supply: (i) the limited volumes of clean seed produced, and (ii) inadequa-cies in the supply of the appropriate potato varieties to support industrial-level processing into crisps and high-quality frozen chips. The study shows that Uganda needs to produce approximately 25,400 metric tons of quality seed valued at Ugx 28.1 billion (US$ 8.2 million). It reveals that some of the seed supplied by private seed producers is of low quality; only 47% of the seed multipliers are registered, which points to the weaknesses in the seed regulatory system.

In
ve
st
me
nt
O
pp
Or
tu
nI
tI
es
a
nd
C
ha
ll
en
ge
s
In
t
he
p
Ot
at
O
va
lu
e
Ch
aI
n
In
u
ga
nd
a
2
Challenges to potato Production in the Sub-region
The potato value chain study established the challenges confronting players in different segments of the potato value chain in South-western Uganda, including input dealers (seed multipliers and agro-input traders), farmers, traders, and processors. Given that these players are interconnected, the following challenges must be addressed to aid in upgrading the entire potato value chain in the Kigezi sub-region.
1. Agro-inputs’ limited access and high cost hinder the use of production-enhancing inputs such as fertilizers. The agro-input dealers who directly supply farmers buy the inputs from distant places, incurring high transportation costs that translate to high-cost inputs. In addition, the agro-input markets are challenged by counterfeits that discourage farmers from using improved production technologies. Indeed, the study found that despite the high levels of soil exhaustion in the Kigezi sub-region, only 35% of farmers use fertilizers, 66% apply pesticides and fungicides, and 9% use improved seed.
2. There is limited access to improved seed because of the limited supply of seed potatoes from the Kachwekano Zonal Agriculture Research and Development Institute (KAZARDI), the institution mandated to produce basic seed. For instance, the study found that in 2015’s first growing season, the Kachwekano Zonal Agriculture Research and Development Institute (KAZARDI) produced 365 (80 kgs) bags for supply to seed multipliers, which is very low. Because there is only limited access to foundation seed, we found that 47% of seed multipliers recycle seed and only 53% use certified foundational seed.
3. Limited access to financing is also a challenge to potato production, marketing and processing. This study found that all of the actors on the value chain experience financial constraints because of collateral requirements and long loan application processes. As a result, actors primarily receive credit from informal credit sources such as village savings and loan associations (VSLAs), which charge higher interest rates and are less capitalized.
4. High seasonality in the production cycle and extreme weather conditions (drought) affects potato production. Long dry spells coupled with a lack of irrigation result in yield losses. The evidence suggests that although wholesalers sell an average of 280 bags of potatoes per week in the peak season, sales fall to 126 bags per week during the off-season. In addition, approximately 40% of processors reported a shortage of supply of potato for processing during the off-season.
5. A lack of organized storage affects farmers, traders and processors. Storage facilities are crucial in addressing the challenge of seasonality and price fluctuations, both of which affect profit margins at all levels of the potato value chain.
Recommendations
• Modalities to build the capacity of the agro-input dealerships—with ownership embedded within potato farming communi-ties—must be instituted to supply adequate amounts of quality requisite inputs (i.e., fungicides, fertilizers, and other criti-cal chemicals) in potato production. This can be operationalized through the promotion of group savings schemes that can purchase quality guaranteed inputs in bulk. Such saving schemes can be turned into potato production Savings and Credit Cooperative Societies (SACCOs) that extend financial services to farmers at relatively low interest rates.
• To address the challenge of limited seed potato supply, government and the private sector should build the capacity at seed

In
ve
st
me
nt
O
pp
Or
tu
nI
tI
es
a
nd
C
ha
ll
en
ge
s
In
t
he
p
Ot
at
O
va
lu
e
Ch
aI
n
In
u
ga
nd
a
3
production and multiplication by taking the following actions:(i) Expanding KAZARDI’s production capacity for basic seed potatoes;(ii) Intensifying the decentralization of seed multiplication by replicating the efforts of the International Fertilizer
Development Centre (IFDC) by constructing screen houses that will enable more farmers in all of the sub-counties across the three districts (Kabale, Kisoro and Kanungu) to become foundation potato seed mul-tipliers. Priority should be given to the production of marketable potato varieties—Kinigi, Rwangume and Victoria—and other varieties that are high-yield, rapidly maturing, disease resistant, and able to support industrial-scale processing businesses.
• Formal financial institutions should leverage on both high capitalization and the relatively low interest rates to de-sign credit packages for agricultural commodity value chain actors with shorter loan-application processes. Such credit packages need to match the loan-repayment periods with crop harvest times, which will alleviate farmers’ concern about the difficulty of servicing loans before the harvest and their potential failure to satisfy their obliga-tion of timely loan repayment.
• The government and the private sector can channel credit facilities through existing farmer groups to increase access to credit through either capitalizing farmer group-level VSLAs or lending to farmer groups instead of indi-viduals. The high level of cohesion within a group offers an incentive for loan repayment because the group exerts social pressure on potential defaulters to enforce loan repayment.
• The government and the private sector should support the construction of farmer-managed and -controlled stor-age facilities to promote a sense of ownership. This will help address the issue of price fluctuations and seasonal-ity at the marketing and processing levels.

In
ve
st
me
nt
O
pp
Or
tu
nI
tI
es
a
nd
C
ha
ll
en
ge
s
In
t
he
p
Ot
at
O
va
lu
e
Ch
aI
n
In
u
ga
nd
a
4
1. INTRODUCTION1.1 Background
Irish Potato is a food crop commodity that provides enormous investment opportunities to add value. It is one of the most productive food crops in the world in terms of its yields of edible energy and good-quality protein (Burton, 1989). Nutri-tionally, Irish Potato is considered a well-balanced major plant food with a good ratio protein and calories and substantial amounts of vitamins, especially vitamin C, minerals, and trace elements (Emana and Nigussie 2011). Internationally, the market for Irish Potato has five distinctive line segments that include seed Irish Potato, ware Irish Potato, frozen chips, crisps/snacks, and other miscellaneous products such as starch. Among the list, the frozen chips and snacks markets exhibited the highest rates of growth internationally (Ferris et al., 2001). Therefore, the two earmarked product segments (frozen chips and snacks) contribute to most of the value addition in the Irish Potato industry. Countries such as Holland that have been successful in developing the Irish Potato industry export 70% of their ware Irish Potato in the form of fresh tubers and Irish Potato products such as chips and flour (Kato, 2015). Uganda has the potential to produce and supply its domestic market with crisps and snacks, subject to product quality that is competitive with imports (Ferris et al., 2001).
Figure 1: Irish Potato Production, Area and Yield Trends in Uganda (1970-2010)
Source: FAO Stat 2014.
According to FAO (2014) statistics (see Figure 1), the annual Irish Potato output in Uganda is approximately 800,000 metric tons, produced on approximately 112,000 hectares with an average yield of 7.14 metric tons per hectare (Figure 1). Output (production) is a result of increased acreage instead of intensification (i.e., increasing productivity per unit area - yield). Extended productivity comparisons based on FAO (2014) data show that Uganda’s Irish Potato yields 7.14 metric tons per hectare, which is low in relation to figures of other countries such as Rwanda (14.2 tons), Kenya (20.3 tons), China (15.8 tons), and India (23.7 tons). This in itself is suggestive of unexploited potential to increase Uganda’s Irish Potato output, contributing to latent loss in aggregate income from Irish Potato accruing from the yield gap at the production level of the value chain. The yield gap is both a challenge and an investment opportunity for increasing the aggregate value contribution of the Irish Potato sub-sector to agricultural GDP.

In
ve
st
me
nt
O
pp
Or
tu
nI
tI
es
a
nd
C
ha
ll
en
ge
s
In
t
he
p
Ot
at
O
va
lu
e
Ch
aI
n
In
u
ga
nd
a
5
Statistics on the disposition of Irish Potato from the 2008/2009 Uganda Census of Agriculture indicate that approximately 40.5% of Uganda’s Irish Potato is sold, 39.1% is consumed on the farm, 6.8% is stored, and the remaining 12.9% is used for other purposes. Going by this distribution, the Irish Potato balance sheet shows that Irish Potato is essentially both a food security crop and a cash crop. However, with the steadily growing urban domestic markets for Irish Potato and its by-products (i.e., chips and crisps), the crop’s potential as a cash earner for farmers is high.
More importantly, Uganda, like many other African economies, is increasingly confronted with changing local and inter-national food and commodity markets because of globalization, economic liberalization and urbanization. This poses both new opportunities and challenges for the weakly linked (dis-functional) small-scale producers, traders, and processors that lead agricultural value chains (Hoeffler, 2005). The challenge stems from the potential exclusion of weakly linked African producers from global value chains because of strict quality standards and volume requirements that place them in a disadvantageous position (van der Meer & Kees, 2006).
The Irish Potato sub-sector, like many others in Uganda, is not well organized or integrated in that producers, transport-ers, and marketers are fragmented and tend not to cooperate (Ferris et al., 2001). The lack of organization is one of the probable factors that isolate the sector from regional or global markets. It has been shown that this sort of disintegrated functioning of the local value chain has a negative impact on growth in the overall agricultural sector. For example, the National Planning Authority (NPA), which is tasked with coordinating all of Uganda’s sector-strategic development plans in the country’s first (2010-2015) National Development Plan (NDP I), cited weak value chain linkages from production to processing to marketing. Limited access to extension support is seen as one of the major constraints on the efficient performance of the agricultural sector (NPA, 2010). Over the same period (2010-2015), the national agriculture sector’s Development Strategic Investment Plan (DSIP) of the Ministry of Agriculture’s Animal Industry and Fisheries (MAAIF) emphasised the commodity approach, promoting commodity value chains systems as pathways for spearheading ag-ricultural development in Uganda. This new thinking and focus (from the decision and policy makers), which is geared towards strengthening agricultural value chains, is carried over as among the priority development areas for agriculture in the second 2015-2020 National Development Plan (NPD II). In the NDP II, the four thematic priority development areas for agriculture include the following: (i) increasing production and productivity; (ii) addressing challenges to farm inputs; (iii) improving agricultural markets and value addition; and (iv) strengthening institutions. It is visibly evident that government is placing more emphasis on agribusiness as a pathway for agricultural development over the next five years.
There has been very limited success in developing functioning commodity value chains in Uganda, especially in the food crop sub-sector. In 2008, the FAO piloted the concept of the value chain approach to development of the Irish Potato sub-sector in Kabale and Kisoro (FAO Uganda, 2012). It has been reported that the farmers supported by the FAO at that time secured the lucrative ware Irish Potato market1 in Kampala and Rwanda from 2008-2012. In August 2012, the International Fertilizer Development Corporation (IFDC)—under the auspices of the Catalysed Accelerated Agricultural Intensification for Social and Environmental Stability (CATALIST)—project initiated action to strengthen Irish Potato value chain systems in South-western Uganda. These interventions by FAO and the IFDC-CATALIST projects provided the op-portunity for this study to generate evidence on what must be done to support sustainable development of Uganda’s Irish Potato value chains.
1 The lucrative market in Kampala included NANDOS, one of the largest international fast-food restaurant chains, Kabira Country Club, and numerous enterprises in Owino and Kalerwe (FAO, April-June 2012).

In
ve
st
me
nt
O
pp
Or
tu
nI
tI
es
a
nd
C
ha
ll
en
ge
s
In
t
he
p
Ot
at
O
va
lu
e
Ch
aI
n
In
u
ga
nd
a
6
1.2 Study Objectives
The main study objective is to identify constraints and investment opportunities in different segments of Uganda’s Irish Potato value chain. The study’s specific objectives include the following:(i) To analyse the structure of Irish Potato production, marketing and value addition in South-western Uganda;(ii) To identify key constraints along the Irish Potato value chain for producers, agro-input dealers, seed multipliers,
traders and processors; and(iii) To identify and document investment opportunities along the Irish Potato value chain that can be documented to
inform sub-regional zonal investment plans.

In
ve
st
me
nt
O
pp
Or
tu
nI
tI
es
a
nd
C
ha
ll
en
ge
s
In
t
he
p
Ot
at
O
va
lu
e
Ch
aI
n
In
u
ga
nd
a
7
2. LITERATURE REVIEW
2.1 The Conceptual Framework of the Value Chain
The literature refers to a value chain as a range of activities required to bring a product from conception through the dif-ferent stages of production to final delivery to consumers (Kaplinsky 1999; Kaplinsky and Morris 2001; Bammann, 2007; Wanene 2011; and Kirimi; et al,. 2011). DFID (2008) proposes the ‘broad’ approach to defining a value chain, looking at a complex range of activities implemented by various actors, including the primary producers, processors, traders, and service providers, to transform raw materials into final products. This study primarily focuses on identifying requisite pro-duction and marketing activities in the Irish Potato value chain to inform policy makers and private agribusiness actors of investment areas that are key to upgrading Uganda’s Irish Potato sub-sector. Figure 2 shows both the three broad levels of actors in a value chain framework (micro, meso and macro) and the requisite support system.
Figure 2: Value Chain Framework
The micro-level of value chain process actors includes input suppliers, farmers (producers), processors, traders (retail-ers and wholesalers), and consumers (Emana and Nigussie 2011). The micro-level actors own a product either as an input (e.g., fertilizer) or as Irish Potato seed or ware. The farmers within the context of this study grow Irish Potato; at the end of the value chain are the consumers who extract Irish Potato’s final value. The middle section of the micro level of the value chain consists of a multitude of firms, each of which performs a unique function on the chain (i.e., transport-ing, processing and packaging, storing, selling, buying, and grading), each making decisions to support the flow of the produced Irish Potato to the consumer. The meso level of the chain includes actors that provide a range of services (i.e., extension, research, finance, transport, innovation and communication, etc.). The macro-level component of the value chain framework is composed of the enablers, which primarily include institutions such as national and local govern-ments, regulatory bodies, and the World Trade Organization (WTO), among others, providing an enabling environment for effective operations along the value chain.
Micro Level
Meso Level
Macro Level
ChainActors
InputSuppliers
Information Research, Training & Extension
InfrastructureRoad, Water
Power
Policy &RegulatoryFramework
PoliticalEnvironment
Sector support
GlobalEnvironment
WTO/SPS
FinancialServices
BusinessDevelopment
ServicesPromotionProjects
Advocacy CommonInterest
Producers Traders Processors Consumers
SupportServices
EnablingEnvironment
Source: Adopted from Nicholas Shaheen (August 2012) and modified by authors

In
ve
st
me
nt
O
pp
Or
tu
nI
tI
es
a
nd
C
ha
ll
en
ge
s
In
t
he
p
Ot
at
O
va
lu
e
Ch
aI
n
In
u
ga
nd
a
8
Although value chains can be simple when producers directly sell to consumers, they can be long and complex when a multitude of actors play a role in buying, processing, transporting and selling to the end user (Emana and Nigussie, ibid). The complexity in a value chain can occur, for example, when the input supply function is crosscutting and affects all of the actors in the value chain, not just those at the farm level. Farm production flows to both distributors (traders) and processors: some farmers may deliver their crop either directly to a processing plant or directly to the final market (Tchale and Keyser, 2010). Nevertheless, it might be easy to trace added value following the stages of the value chain in Figure 2, pinpointing where value addition takes place. This flow along the value chain is critical when determining the distribution of the benefits at the different levels of value added in the chain.
The key objectives of this study were to analyse the functioning of the Irish Potato value chain; to identify constraints at various levels of the Irish Potato value chain, including actors (producers, agro-input dealers, seed multipliers, traders and processors), support services and the enabling environment; and to identify opportunities for investment in various segments of the Irish Potato value chain. To address these objectives, this research adopted the value chain approaches, tools and steps of M4P (2008). The tools included (i) mapping the Irish Potato value chain; (ii) analysing the performance of the value chain in terms of costs, prices, and margins; (iii) analysing technological, knowledge and upgrade possi-bilities by assessing gaps in Irish Potato production technologies, knowledge and existing opportunities; (iii) determin-ing value chain governance by identifying the stakeholders that influence governance, rules and regulations and their enforcement; and (iv) understanding linkages and relationships among the stakeholders in the Irish Potato value chain. 2.2 Application of the value chain approach to the Irish Potato subsector in the Ugandan
context
Few value chain studies have been conducted in Uganda’s Irish Potato sub-sector. Ferris et al., (2001), which is among the few pioneering studies on Uganda’s Irish Potato value chain, note that like many other commodities in Uganda, the Irish Potato sub-sector is not well organized or integrated in that producers, transporters, marketers, wholesalers and retailers are fragmented and tend not to cooperate. There are very few organizations, and those that do exist are small and young; this lack of organization isolates the Irish Potato sub-sector from regional and global markets. In a related study on promoting the Kenyan Irish Potato value chain, Hoeffler (2005), concludes that contract farming is viewed as an option for improving Irish Potato value chain performance both by reducing transaction costs and risk and by building trust in vertical cooperation. Gildemacher et al. (2009) have established that seed Irish Potato quality management, control of bacterial wilt and late blight, and soil fertility management were among the priority intervention areas that could result in improved Irish Potato productivity in Kenya, Uganda, and Ethiopia.
Ferris et al. (2001) provide an extensive description of Uganda’s ware Irish Potato trading and marketing chain, noting that 80% of Uganda’s Irish Potatoes produced were consumed locally, 10% were saved as seed, and 10% were wasted and therefore not accounted for. Most (70%) of the seed Irish Potato grown by farmers is saved from the previous crop. Ferris et al. (ibid) also report that Uganda’s marketing system was not well organized, with most farmers being price tak-ers. Almost all of the Irish Potatoes produced in Uganda were sold in domestic markets: although there were a few trading links with Rwanda, that trade was opportunistic and only filled short-term seasonal windows. The marketing constraints identified in this study included poor infrastructure, high transportation costs, the lack of product standards and grades, and poor organization of the marketing system. There is almost no processing of Uganda’s Irish Potatoes except for chips, whose demand has increased with the establishment of fast-food kiosks and South African food companies such as Nandos and Steers. At the time of the study, there was an obvious absence of adequate processors as key agents driving value addition in Uganda’s Irish Potato industry. In Ferris et al. (ibid), gross margins of different value chain actors were

In
ve
st
me
nt
O
pp
Or
tu
nI
tI
es
a
nd
C
ha
ll
en
ge
s
In
t
he
p
Ot
at
O
va
lu
e
Ch
aI
n
In
u
ga
nd
a
9
computed and travelling traders were taking the bulk of the profits in the chain (almost 64%).
The opportunity for intensification highlighted in Ferris et al. (2001) alludes to the fact that farmers had access to a range of improved varieties (Rutuku, Victoria, Kachpot1, Kachpot2, Kachpot3, Cruza 148 and Sangema). It is noted that barriers to intensification stem from the fact that there were very few organized seed producers. Likewise, most farmers do not use fertilizers, pesticides and certified seed. Accordingly, productivity and production underperform their achievable potential. Although Ferris (2002) expounds on the line of Irish Potato varieties produced, that study falls short in providing an account (evaluation) of whether the specific needs of consumers and processors are adequately considered by seed Irish Potato producers—in other words, whether the varieties that are highly demanded are produced, as strongly recommended by the CGIAR (2014). Inadequacies in the selection of varieties suitable for consumers’ needs are also reported by Emana and Nigussie (2011) in an Irish Potato value chain study in Ethiopia. According to Kato (2015), Uganda imported 23 new Irish Potato varieties from Holland to increase the selection of Irish Potato varieties available in the production system. If successful results are obtained from the testing trials, the country could diversify into production of the most sought-after, value-added Irish Potato products, which are critical to upgrading the Irish Potato value chain.
Okoboi and Ferris (2002) observe that Uganda’s Irish Potato production is also constrained by the lack of a reliable supply of quality inputs, including clean seed, fertilizers and pesticides. Uganda has neither commercial stores nor cold chain facilities. There is a general lack of organization in the marketing chain, particularly amongst producers, leading to a lack of coordination and subsequently, considerable price instability. Because of the lack of transparency and the poor market structure, brokers can charge excessive fees for their services and travelling traders make the bulk of the profit in the sup-ply chain. The study finds that most of Uganda’s Irish Potato farmers are subsistence oriented and produce Irish Potatoes using low-risk systems with no inputs, resulting in yields of 4-7 mt/ha. The study proposes interventions that include the following: (i) improving the seed supply system in terms of tissue-culture facilities for basic seed; (ii) improving facili-ties and increasing production of basic seed; (iii) promoting seed through a wide-spread demonstration programme that shows farmers the yield gains that can be made using ‘clean seed’, fertilizers and pesticides; and (iv) enabling improved access to credit such that farmers or co-operatives can purchase inputs and repay at harvest.
Irish Potatoes are susceptible to drought and water shortages, which can seriously limit yield (Okoboi and Ferris, ibid). Therefore, if Ugandan farmers are to attain their potential yield of 30 mt/ha, irrigation will be required. The use of valley bottom irrigation could also be upgraded to maximize yields and supply existing market gaps.
Okoboi and Ferris (ibid) note that most farmers pay little attention to product quality. At harvest, however, it is critical to maintain quality. Although dehalming is widely practiced, it is necessary to devote more attention to avoiding damage and curtailing waste. Standards need to be developed such that farmers produce for specific premiums within known grades and weights.
The processing of Irish Potatoes in Uganda continues to operate on a small scale and is limited to a few products for immediate consumption such as boiled vegetables, fried chips and crisps (Okoboi and Ferris, ibid). This situation is not unique to Uganda: Emana and Nigussie (2011) observe a similar situation in Ethiopia. Unlike in the developed world, Uganda’s food processing sector has not ventured into large commercial processing of Irish Potato products with good preservation attributes and value-added products such as Irish Potato flour, frozen chips and croquets. Processing or value addition is primarily carried out by street vendors, restaurants, and small- and medium-sized, home-based proces-sors who lack facilities such as appropriate equipment, packaging materials and adequate technological knowledge to ensure good-quality products (Okoboi and Ferris, 2002).

In
ve
st
me
nt
O
pp
Or
tu
nI
tI
es
a
nd
C
ha
ll
en
ge
s
In
t
he
p
Ot
at
O
va
lu
e
Ch
aI
n
In
u
ga
nd
a
10
The FAO (2012) documents group-marketing success stories in the field of Irish Potato farming in Kabale and Kisoro, Uganda’s major Irish Potato-producing districts. Groups of farmers supported by the FAO developed capacity to grow and sustain a lucrative ware Irish Potato market in Kampala and Rwanda over a five-year period. It is a matter of record that in 2001, one of the Irish Potato growers and marketing associations (Kamuganguzi) earned more than Ugx 300 million (US$ 120,000), earning Ugx 73 million (US$ 29,200) in January and March 2012 from sales to Nandos alone. A related Irish Potato value chain study by Bonabana-Wabbi et al. (2013) in South-western Uganda (Kabale and Kisoro districts) identifies farmers, traders (wholesalers, transporters, collectors, brokers), processors and consumers as the key actors in the Irish Potato value chain. However, that study ignores the key component of seed Irish Potato, which is a key input required by producers of ware Irish Potatoes. Although this study does not discuss production-level constraints, it does present and explain marketing constraints, with traders’ most serious constraints being low prices and high transport costs. Other constraints include the bulk nature of Irish Potatoes, low supply volumes, high perishability and the high in-cidence of pests and diseases. These constraints primarily occur at the farm and marketing levels, but the study provides little explanation of the root sources of some of these constraints.

In
ve
st
me
nt
O
pp
Or
tu
nI
tI
es
a
nd
C
ha
ll
en
ge
s
In
t
he
p
Ot
at
O
va
lu
e
Ch
aI
n
In
u
ga
nd
a
11
3. METHODOLOGY3.1 Research Design
The study was designed to take a value chain approach to aid us in understanding the constraints experienced by various players in Irish Potato production, marketing and processing. At the production level, the survey elicited information from farmer groups about production technologies, activities, financing, and marketing arrangements. The study also surveyed traders (retailers, wholesalers and agents) on Irish Potato marketing dynamics and processors on processing technolo-gies. We also extended the study to cover the source of inputs and thus surveyed agro-input dealers and seed Irish Potato multipliers. The value chain approach is crucial in providing an overall picture of the industry, unlike studies that focus on a single point of the commodity value chain.
3.2 Study Area
The study was conducted in the three districts of Kabale, Kisoro and Kanungu, in Southwestern Uganda. The sub-region was purposely selected because it is the Irish Potato hub where 87% of the country’s Irish Potato production takes place (UBOS, 2014; Figure 3).
Figure 3: Irish Potato production (tons) by region
Source: UBOS 2014 Statistical Abstract; Uganda Census of Agriculture (UCA) 2008/09.
Within this region, more than 53% of Irish Potato comes from Kabale, Kisoro and Kanungu; those districts account for 47% of the Irish Potato produced in Uganda. In terms of volumes and land area, Kabale is the leading producer, followed by Kisoro; Kanungu is the smallest producer of the three districts. In terms of acreage, in 2008 8,435 hectares were allocated to Irish Potato production in Kabale, whereas 2,675 hectares and 523 hectares were allocated to Irish Potato production in Kisoro and Kanungu, respectively (UCA, 2008/09).

In
ve
st
me
nt
O
pp
Or
tu
nI
tI
es
a
nd
C
ha
ll
en
ge
s
In
t
he
p
Ot
at
O
va
lu
e
Ch
aI
n
In
u
ga
nd
a
12
Figure 4: Irish Potato growing districts in Southwestern Uganda
3.3 Sampling methodology
A multi-stage sampling approach was adopted in this study, starting with the selection of communities that had been visited by the International Food Policy Research Institute (IFPRI) in its baseline survey. The Irish Potato value chain study was part of the survey series2 aimed at generating evidence of the extent of smallhold farmers’ crop intensifica-tion. The IFPRI conducted a socio-economic study and the International Institute for Tropical Agriculture (IITA) conducted an agronomic survey. The value chain study was carried out in the same sub-counties in which other surveys had been conducted. Within the study sub-counties, two farmer groups were randomly selected for focus group discussions (FGDs) from the list of Irish Potato farmer groups obtained from the district agricultural offices. Overall, 51 FGDs were selected from the three districts of Kabale, Kisoro and Kanungu. Each FGD consisted of 10-12 members, and except for situations in which groups were formed based on gender and age, we balanced the groups to include not only men and women but also members from all age categories.
The selection of key informants was done in such a way that various value chain actors who support the surveyed farm-ers in FGDs were sampled. This approach was intended to aid in understanding the entire value chain from producers to input sources to markets and value addition components. For instance, farmers were asked both to indicate their source of agro-inputs (seed, fertilizers, fungicides and insecticides) and to list the purchasers of their Irish Potatoes. A sample of 10 seed multipliers, 10 agro-input dealers, 10 traders and 10 processors per district was then randomly selected from
2 The surveys in these study areas (sub-counties) were a joint, collaborative effort between PASIC project partner institutions i.e., the Ministry of Agriculture, Animal Industry and Fisheries (MAAIF), IFPRI, IITA, and EPRC, each of which were mandated to collect the following information: (i) the socio-economic baseline survey conducted by the International Food Policy Research Institute (IFPRI); (ii) the agronomic survey undertaken by the International Institute of Tropical Agriculture (IITA); and (iii) the community and market value chain survey conducted by the Economic Policy Research Center.

In
ve
st
me
nt
O
pp
Or
tu
nI
tI
es
a
nd
C
ha
ll
en
ge
s
In
t
he
p
Ot
at
O
va
lu
e
Ch
aI
n
In
u
ga
nd
a
13
the list of actors mentioned by the farmers. Mapping of traders and processors was also done in the urban centres where they are concentrated, and the required number of traders and processors was randomly selected from the generated lists. Overall, 120 key informants were selected in three districts. Table 1 below shows the breakdown of all samples by actor and district.
Table 1: Samples per district
Value chain Actor Kabale Kisoro Kanungu TotalFGDs (Production) 23 13 15 51Seed multipliers 10 10 10 30Agro-input dealers 10 10 10 30Traders 10 10 10 30Processors 10 10 10 30
3.4 Data Sources
3.4.1 Secondary Data Sources (administrative document review)
The analysis started with review of the relevant literature on ware and seed Irish Potatoes. Project documents, reports, published and unpublished documents, publications of the International Irish Potato Centre (CIP), and national publica-tions were reviewed. For instance, we reviewed the Uganda Census of Agriculture (2008/09) report to ascertain the extent of Irish Potato production across various regions, the land acreage under Irish Potato production in Kigezi sub-region, and the total production and Irish Potato yield in the study region. Moreover, concepts of the value chain and value chain study tools were reviewed and used to train stakeholders not only for a clear understanding of the concepts and approach involved in building their capacity but also to apply that understanding in the collection of data used in this report. The reviewed literature is integrated into relevant sections of this report.
3.4.2 Primary Data
Primary data were collected through a structured questionnaire from the five main value chain actors: focus group dis-cussions (FGDs) to capture community responses related to Irish Potato production, agro-input dealers, seed multipliers, traders (wholesalers and retailers) and processors. For each actor, value chain trainees prepared and administered a separate questionnaire to the respondents. Before the survey, the questionnaires were pre-tested, and four-day question-naire training sessions were conducted from April 27-30, 2015. In the training, the field researchers reviewed all of the questionnaires, translated them into local languages spoken in the Irish Potato sub-region, and role played to aid in their understanding of the questionnaire. From May 1-26, the value chain survey was undertaken.
3.5 Participatory Value Chain Training
The data were collected in a participatory manner by involving project stakeholders from the Ministry of Agriculture, Animal Husbandry and Fisheries (MAAIF), the Kachwekano Zonal Agriculture Research Institute (KAZARDI), IFPRI, IITA and EPRC. For this purpose, a training workshop targeting all stakeholders was conducted between February 9 and 13, 2015. The workshop’s objective was to develop and strengthen the capacity of all of the stakeholders in the value chain analysis.

In
ve
st
me
nt
O
pp
Or
tu
nI
tI
es
a
nd
C
ha
ll
en
ge
s
In
t
he
p
Ot
at
O
va
lu
e
Ch
aI
n
In
u
ga
nd
a
14
The training involved concepts of the value chain, the purpose of the value chain, how the Irish Potato value chain benefits the poor in general and women and youth in particular, a general approach to value chain studies, the identification of value chain actors, an economic analysis of the Irish Potato value chain (including the actors’ margins), constraints on the Irish Potato value chain, and expert suggestions for interventions. The training approach involved the presentation of theory, concepts, and application tools by facilitators and group work by the participants. The results of the group work were presented to the plenary and discussed. Irish Potato value chain maps and the identification of actors and con-straints were performed during the workshop. 3.6 Data Analysis
The data collected from different sources were analysed using descriptive statistics. The analysis focused on both char-acterizing different value chain actors and identifying constraints and opportunities at different segments of the value chain. The results of the analysis are presented in the following chapters.
In
ve
st
me
nt
O
pp
Or
tu
nI
tI
es
a
nd
C
ha
ll
en
ge
s
In
t
he
p
Ot
at
O
va
lu
e
Ch
aI
n
In
u
ga
nd
a
15
4. RESULTS AND DISCUSSION4.1 Irish Potato production and institutions supporting Irish Potato producers in Western
Uganda
4.1.1 Characteristics of Irish Potato producers
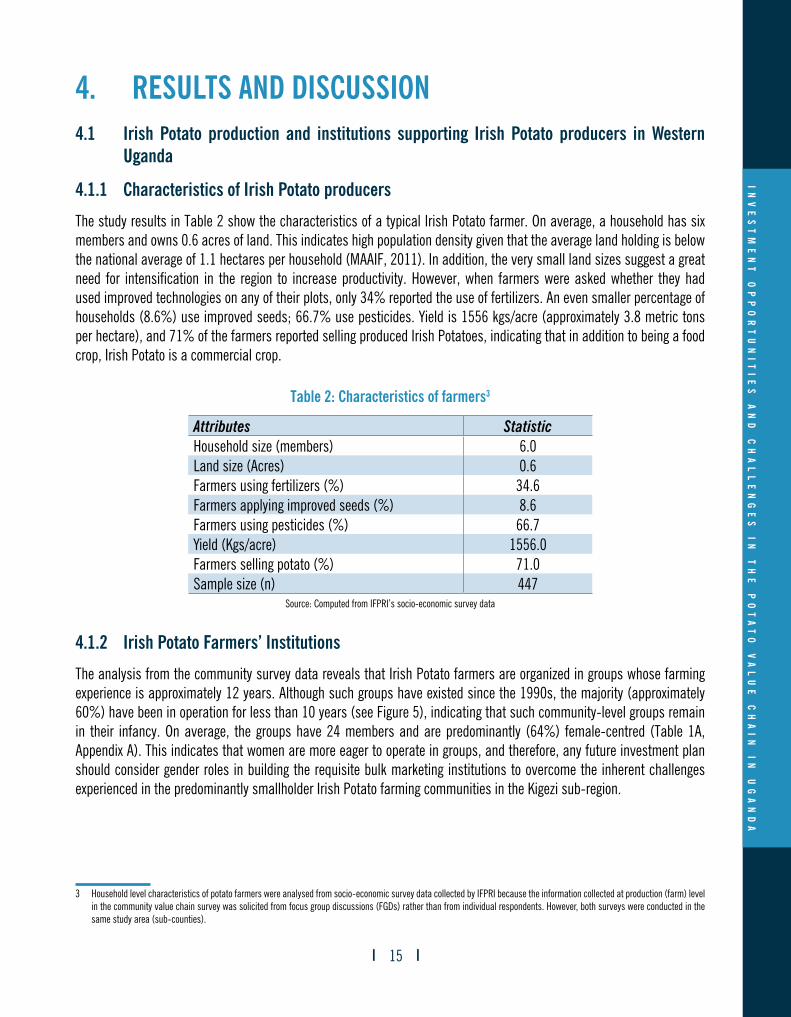
The study results in Table 2 show the characteristics of a typical Irish Potato farmer. On average, a household has six members and owns 0.6 acres of land. This indicates high population density given that the average land holding is below the national average of 1.1 hectares per household (MAAIF, 2011). In addition, the very small land sizes suggest a great need for intensification in the region to increase productivity. However, when farmers were asked whether they had used improved technologies on any of their plots, only 34% reported the use of fertilizers. An even smaller percentage of households (8.6%) use improved seeds; 66.7% use pesticides. Yield is 1556 kgs/acre (approximately 3.8 metric tons per hectare), and 71% of the farmers reported selling produced Irish Potatoes, indicating that in addition to being a food crop, Irish Potato is a commercial crop.
Table 2: Characteristics of farmers3
Attributes StatisticHousehold size (members) 6.0Land size (Acres) 0.6Farmers using fertilizers (%) 34.6Farmers applying improved seeds (%) 8.6Farmers using pesticides (%) 66.7Yield (Kgs/acre) 1556.0Farmers selling potato (%) 71.0Sample size (n) 447
Source: Computed from IFPRI’s socio-economic survey data
4.1.2 Irish Potato Farmers’ Institutions
The analysis from the community survey data reveals that Irish Potato farmers are organized in groups whose farming experience is approximately 12 years. Although such groups have existed since the 1990s, the majority (approximately 60%) have been in operation for less than 10 years (see Figure 5), indicating that such community-level groups remain in their infancy. On average, the groups have 24 members and are predominantly (64%) female-centred (Table 1A, Appendix A). This indicates that women are more eager to operate in groups, and therefore, any future investment plan should consider gender roles in building the requisite bulk marketing institutions to overcome the inherent challenges experienced in the predominantly smallholder Irish Potato farming communities in the Kigezi sub-region.
3 Household level characteristics of potato farmers were analysed from socio-economic survey data collected by IFPRI because the information collected at production (farm) level in the community value chain survey was solicited from focus group discussions (FGDs) rather than from individual respondents. However, both surveys were conducted in the same study area (sub-counties).

In
ve
st
me
nt
O
pp
Or
tu
nI
tI
es
a
nd
C
ha
ll
en
ge
s
In
t
he
p
Ot
at
O
va
lu
e
Ch
aI
n
In
u
ga
nd
a
16
Figure 5: Percentage of farmer groups started per year
Source: PASIC Community and Market Survey of Irish Potato VC actors (May 2015).
In South-western Uganda’s Irish Potato farming communities, many (46%) Irish Potato-based groups were created through self-initiative. This suggests that the formation of farmer groups is internally driven by farmers who aim to en-hance potato production and productivity by exploiting existing social networks (see Figure 6). External enablers of the formation of the farmer groups mentioned in the FGDs included Care International, the International Fertilizer Develop-ment Centre (IFDC) and the Uganda National Seed Irish Potato Producers Association (UNSPPA).
Figure 6: Footprint of Organizations Supporting Farmer-Based Irish Potato producer groups
Source: PASIC Community and Market Survey of Irish Potato VC actors (May 2015).
Additional information from FGDs noted that the reasons for forming farmer groups include enhancing production and commercial farming for food security and income generation, a growing need to work in groups for organized Irish Potato farming and collective marketing, positioning for better capacity to acquire knowledge and access government pro-grammes, and obtaining credit, saving and development. Approximately 70% of the 152 groups that were interviewed are registered by the local government authority, with the remaining 30% of the groups existing informally. The groups’ legal status is primarily (70%) obtained from the sub-county, with approximately 25% obtaining legal status from their districts and 6% obtaining their status from their town council authority (Table 1A, Annex A).
Farmer groups can emphasize the building of functioning, community-centred, farmer-nucleus business units for bulk marketing and the implementation of improved Irish Potato productivity-enhancing technologies. Such groups can not only support new innovations such as R&D in Irish Potato production but also form key platforms for business develop-ment in the Irish Potato-producing communities in the Kigezi sub-region.

In
ve
st
me
nt
O
pp
Or
tu
nI
tI
es
a
nd
C
ha
ll
en
ge
s
In
t
he
p
Ot
at
O
va
lu
e
Ch
aI
n
In
u
ga
nd
a
17
Information Box 1: The IFDC’s role in Strengthening Farmer GroupsEnablers: The IFDC has played an instrumental role both in organizing farmers into groups and in the formation of larger clusters that primarily focus on the marketing and value addition segments of the value chain. An average of 30 small groups comprise a cluster. More than 41% of the surveyed farmer groups reported that the clusters’ primary activity is training and knowledge sharing, followed by group farming (reported by 20% of groups), saving and obtaining credit (16%), and collective marketing (11%), among other activities (Figure 7).
Figure 7: Percentage of farmers in a group reporting a cluster’s main activity
Source: PASIC Community and Market Survey of Irish Potato VC actors (May 2015).
The farmer groups noted that the changes brought about by the clusters include the following: increased uptake of the best farming practices; appreciation and the conduct of farming as a business, for example, through record keeping; mobilizing savings and access to credit; and improving farmers’ mobilization, information flow and sharing.
Challenges: The clusters remain weak in terms of achieving their objective of improving market and finance access. The major comments noted during the value chain study include the following: the clusters’ informality given that many of them are not registered; members’ lack of commitment; and high default rates by the members who are given credit. Accordingly, there is a need both to formalize the clusters and to establish formal and binding laws and regulations to guide the clusters’ operation. In addition, there is a need to train cluster members to add value to their produce. The IFDC had been training a few selected farmers in how to make crisps and generally add value to their produce. However, most farmers cannot buy the necessary equipment for value addition. Accordingly, there is a need for financial support in the form of soft loans to enable cluster group members to invest in value-adding activities. These loans should target farmer groups, not individuals, thus increasing the likelihood of enhance loan repayment.
4.1.3 Irish Potato Varieties Grown
The study reveals that more than 11 Irish Potato varieties are grown in the Kigezi sub-region. Community-level responses from FGDs (Figure 8) show that Rwangume, Victoria, and Kinigi are the primary Irish Potato varieties grown by farming communities in the Kigezi sub-region. These three varieties are categorised as improved varieties by more than 78% of participants in the community-level FGDs (Table 2A, Annex A).

In
ve
st
me
nt
O
pp
Or
tu
nI
tI
es
a
nd
C
ha
ll
en
ge
s
In
t
he
p
Ot
at
O
va
lu
e
Ch
aI
n
In
u
ga
nd
a
18
Figure 8: Identified Potato Varieties grown in Kigezi sub-region (% of FGDs in Community survey)
Source: PASIC Community and Market Survey of potato VC actors (May, 2015)
This result is reinforced by the self-reported rankings4 of preferred Irish Potato varieties, as also reported in the FGDs (on behalf of the communities) in Table 2A, Annex A. However, there is a notable zonal variation in preference rankings among Irish Potato varieties across districts within the Kigezi sub-region. In the district of Kabale, 53% of farmers prefer Rwangume, a preference that is shared by 86% of farmers in Kanungu. In Kisoro, priority preference (93%) is placed on Kinigi (Appendix A, Table 2A). Interestingly, Kachpot 1, which is preferred for industrial-level processing into chips and crisps, does not feature among the list of preferred Irish Potato varieties grown by farmers in the Irish Potato hub. This complicates both the Irish Potato supply for value addition at the industrial level and the capacity to upgrade the Irish Potato value chain through value addition.
4.1.4 Influential Actors in Irish Potato Production
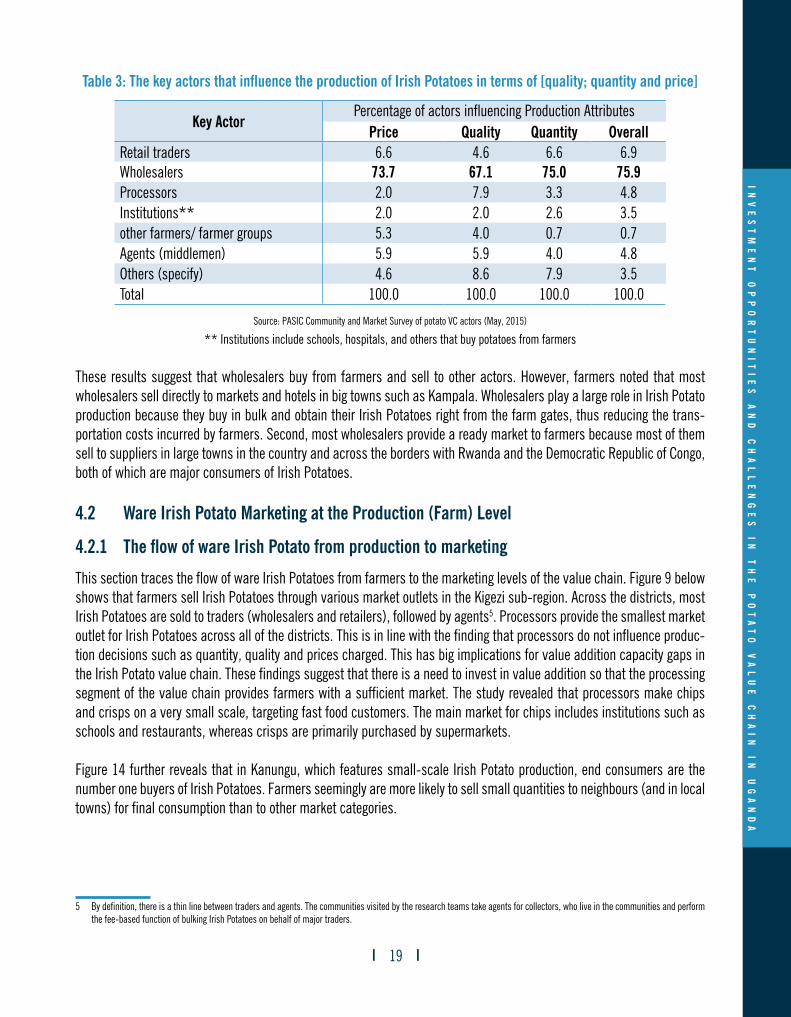
Farmers respond to market incentives translated through prices; they also improve the quality of the Irish Potato de-pending on what traders and processors demand. From the value chain study, the results in Table 3 reveal that 75% of the interviewed farmer groups indicated that wholesalers influence the quantity, price and quality of the produced Irish Potato. The rest of the actors play a minor role in influencing farmers’ decision making related to Irish Potato production. For instance (and important to this study), only 4.8% of the groups indicated that Irish Potato processors influence their production decisions. Moreover, this level of influence is driven by the quality attribute for 7.8% of the groups. The find-ings that processors play a minor role in Irish Potato production is consistent with the anecdotal evidence that there is limited value addition from Irish Potato production; moreover, they are in line with findings by Ferris, et al. (2001) that allude to the limited processing that occurs in Uganda’s Irish Potato value chain.
4 The rankings were captured on a Likert scale that set 1 as the most-preferred variety.
In
ve
st
me
nt
O
pp
Or
tu
nI
tI
es
a
nd
C
ha
ll
en
ge
s
In
t
he
p
Ot
at
O
va
lu
e
Ch
aI
n
In
u
ga
nd
a
19
Table 3: The key actors that influence the production of Irish Potatoes in terms of [quality; quantity and price]
Key ActorPercentage of actors influencing Production Attributes
Price Quality Quantity OverallRetail traders 6.6 4.6 6.6 6.9Wholesalers 73.7 67.1 75.0 75.9Processors 2.0 7.9 3.3 4.8Institutions** 2.0 2.0 2.6 3.5other farmers/ farmer groups 5.3 4.0 0.7 0.7Agents (middlemen) 5.9 5.9 4.0 4.8Others (specify) 4.6 8.6 7.9 3.5Total 100.0 100.0 100.0 100.0
Source: PASIC Community and Market Survey of potato VC actors (May, 2015)
** Institutions include schools, hospitals, and others that buy potatoes from farmers
These results suggest that wholesalers buy from farmers and sell to other actors. However, farmers noted that most wholesalers sell directly to markets and hotels in big towns such as Kampala. Wholesalers play a large role in Irish Potato production because they buy in bulk and obtain their Irish Potatoes right from the farm gates, thus reducing the trans-portation costs incurred by farmers. Second, most wholesalers provide a ready market to farmers because most of them sell to suppliers in large towns in the country and across the borders with Rwanda and the Democratic Republic of Congo, both of which are major consumers of Irish Potatoes.
4.2 Ware Irish Potato Marketing at the Production (Farm) Level
4.2.1 The flow of ware Irish Potato from production to marketing
This section traces the flow of ware Irish Potatoes from farmers to the marketing levels of the value chain. Figure 9 below shows that farmers sell Irish Potatoes through various market outlets in the Kigezi sub-region. Across the districts, most Irish Potatoes are sold to traders (wholesalers and retailers), followed by agents5. Processors provide the smallest market outlet for Irish Potatoes across all of the districts. This is in line with the finding that processors do not influence produc-tion decisions such as quantity, quality and prices charged. This has big implications for value addition capacity gaps in the Irish Potato value chain. These findings suggest that there is a need to invest in value addition so that the processing segment of the value chain provides farmers with a sufficient market. The study revealed that processors make chips and crisps on a very small scale, targeting fast food customers. The main market for chips includes institutions such as schools and restaurants, whereas crisps are primarily purchased by supermarkets.
Figure 14 further reveals that in Kanungu, which features small-scale Irish Potato production, end consumers are the number one buyers of Irish Potatoes. Farmers seemingly are more likely to sell small quantities to neighbours (and in local towns) for final consumption than to other market categories.
5 By definition, there is a thin line between traders and agents. The communities visited by the research teams take agents for collectors, who live in the communities and perform the fee-based function of bulking Irish Potatoes on behalf of major traders.

In
ve
st
me
nt
O
pp
Or
tu
nI
tI
es
a
nd
C
ha
ll
en
ge
s
In
t
he
p
Ot
at
O
va
lu
e
Ch
aI
n
In
u
ga
nd
a
20
Figure 9: Percentage of farmers selling Irish Potato to each buyer category
Source: PASIC Community and Market Survey of Irish Potato VC actors (May 2015).
The value chain survey also elicited information on the farmers’ selling method. Whereas group marketing has been encouraged as critical in enhancing farmers’ power to bargain for better prices, most farmers still sell individually. The study revealed that fewer than 30% of farmers interviewed at the community level conduct group sales in all districts (see Figure 10). Organizations such as the IFDC and the Africa 2000 Network are mobilizing farmers into groups and clusters to encourage group marketing. As our study suggests, however, little has been achieved. The reasons given by farmers for selling individually are as follows: individual income needs vary across farmers, forcing them to sell as the need arises; farmers plant and harvest at different times; and farmers do not produce in groups and therefore cannot easily sell in groups.
Figure 10: Reported (%)6 ware Irish Potato marketing arrangements at production
Source: PASIC Community and Market Survey of Irish Potato VC actors (May 2015).
6 The percentages do not total 100 because a farmer can simultaneously sell individually and in a group.

In
ve
st
me
nt
O
pp
Or
tu
nI
tI
es
a
nd
C
ha
ll
en
ge
s
In
t
he
p
Ot
at
O
va
lu
e
Ch
aI
n
In
u
ga
nd
a
21
4.2.2 Points of sale and Irish Potato market arrangements
Farmers usually sell Irish Potatoes in the local market and at the farm gate (Figure 11). The third most important selling point is the roadside. As with the farm gate, agents or known traders arrange with farmers to deliver Irish Potatoes to the accessible roadside, where they can be picked. This corroborates the findings that traders and agents are the main buyers of ware Irish Potato (in Figure 9). Approximately 32% of harvested Irish Potatoes are sold at the farm and in the local market within the same district. Less is sold across the border and in distant markets outside of the district but within the country.
These findings (in Figures 9, 10 and 11) suggest that the flow of ware Irish Potato from production points is rather complex and goes through a few different value chain actors before reaching the final consumer. For instance, agents buy from farmers at the farm gate and transport to traders, who sell to the final consumers and processors. The flow of Irish Po-tatoes through a multi-staged marketing channel is an indicator that profits are shared by many players along the chain. Moreover, given that farmers do not sell to final consumers, they lose a significant percentage of the profits to agents and traders. Group marketing, if promoted, can help increase the farmers’ bargaining capacity and thus increase their share of the profits.
Figure 11: Percentage of Irish Potatoes sold at each sale point
Source: PASIC Community and Market Survey of Irish Potato VC actors (May 2015).
Irish Potato marketing remains informal, with no contractual agreements between sellers and buyers (Figure 1A, Annex A). Indeed, in the focus group discussions (FGDs), farmers revealed that 80% of farmers have no contractual arrange-ments with their customers, 18% have informal arrangements, and only 3% have formal arrangements. The high level of informality in Irish Potato production hinders access to credit because unregistered and informal businesses cannot provide legal proof of their location and operations, restricting transactions to well-connected people who primarily trans-act based on trust.

In
ve
st
me
nt
O
pp
Or
tu
nI
tI
es
a
nd
C
ha
ll
en
ge
s
In
t
he
p
Ot
at
O
va
lu
e
Ch
aI
n
In
u
ga
nd
a
22
4.2.3 Irish Potato Grading at the Farm (production) level
Buyers grade Irish Potato based on numerous attributes, such as the level of damage or rottenness, variety, dry matter content and maturity. Of the 51 surveyed groups, approximately 25% reported the level of damage and size (26%)7 as the considered attributes, whereas 20% reported maturity and variety as important grading attributes (Figure 12). The small-sized Irish Potato is normally kept for seed, whereas the large size is sold on the market as the ware Irish Potato. Damage and rottenness were reported by 24.7% of the respondents, which is primarily an outcome of poor storage facili-ties with poor ventilation, the use of inappropriate transportation methods, and poor post-harvest handling. These issues result in damaged and rotted Irish Potatoes. This suggests that investments in improved Irish Potato storage are crucial in upgrading the quality of ware Irish Potato sold—which in turn translates into better prices. Additionally, given that variety and size are considered as key Irish Potato valuation attributes, there is a need for research institutes such as the Kachwekano Zonal Agriculture Research Development Institute (KAZARDI) to create robust Irish Potato varieties that meet the attributes preferred by the market.
Figure 12: FGD Reporting (%) on Key attributes in Irish Potato grading during marketing
Source: PASIC Community and Market Survey of Irish Potato VC actors (May 2015).
4.2.4 Enabling Institutions linking farmers to markets
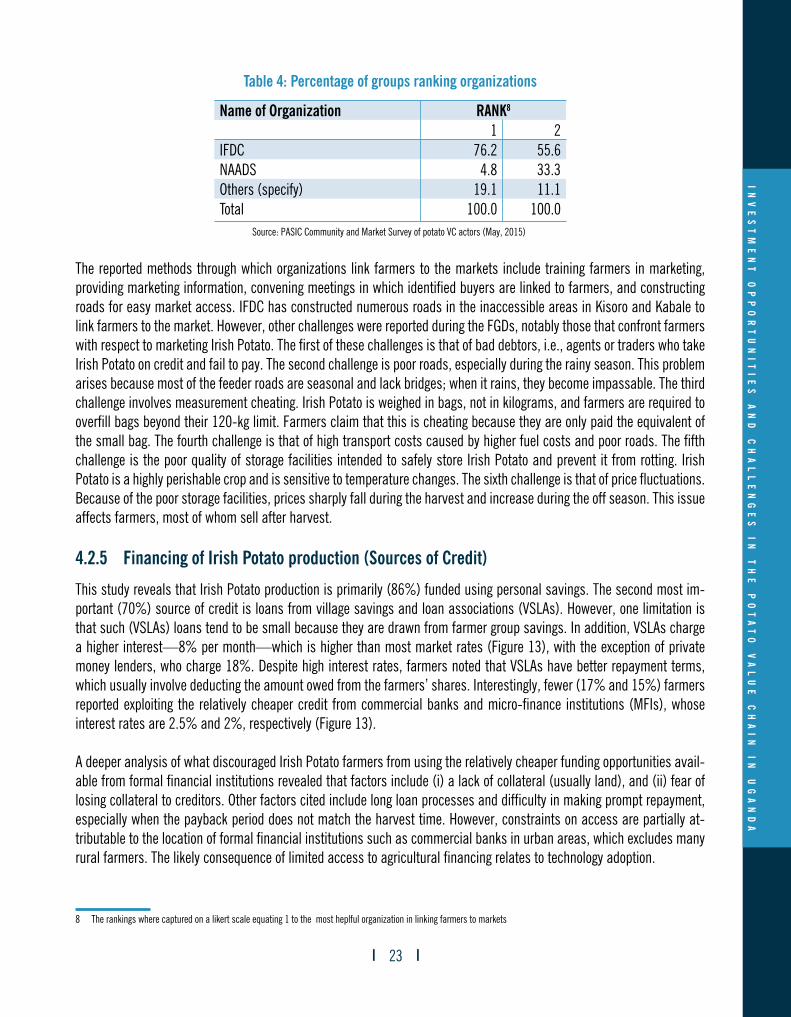
Numerous organizations have created interventions to link farmers to markets by providing market information and prices for Irish Potato markets across the country. Notable organizations include the IFDC and its partner organizations such as the International Rural Reconstruction Institute (IRRI); Excel consultants; and NAADS. Of the interviewed groups, 96% ranked the IFDC as number one in linking farmers to the markets, whereas only 5% ranked the NAADS as number one (Table 4).
7 This is the reason that farmers prefer varieties such as Rwangume, Kinigi and Victoria, which yield large Irish Potato tubers.
In
ve
st
me
nt
O
pp
Or
tu
nI
tI
es
a
nd
C
ha
ll
en
ge
s
In
t
he
p
Ot
at
O
va
lu
e
Ch
aI
n
In
u
ga
nd
a
23
Table 4: Percentage of groups ranking organizations
Name of Organization RANK8
1 2IFDC 76.2 55.6NAADS 4.8 33.3Others (specify) 19.1 11.1Total 100.0 100.0
Source: PASIC Community and Market Survey of potato VC actors (May, 2015)8
The reported methods through which organizations link farmers to the markets include training farmers in marketing, providing marketing information, convening meetings in which identified buyers are linked to farmers, and constructing roads for easy market access. IFDC has constructed numerous roads in the inaccessible areas in Kisoro and Kabale to link farmers to the market. However, other challenges were reported during the FGDs, notably those that confront farmers with respect to marketing Irish Potato. The first of these challenges is that of bad debtors, i.e., agents or traders who take Irish Potato on credit and fail to pay. The second challenge is poor roads, especially during the rainy season. This problem arises because most of the feeder roads are seasonal and lack bridges; when it rains, they become impassable. The third challenge involves measurement cheating. Irish Potato is weighed in bags, not in kilograms, and farmers are required to overfill bags beyond their 120-kg limit. Farmers claim that this is cheating because they are only paid the equivalent of the small bag. The fourth challenge is that of high transport costs caused by higher fuel costs and poor roads. The fifth challenge is the poor quality of storage facilities intended to safely store Irish Potato and prevent it from rotting. Irish Potato is a highly perishable crop and is sensitive to temperature changes. The sixth challenge is that of price fluctuations. Because of the poor storage facilities, prices sharply fall during the harvest and increase during the off season. This issue affects farmers, most of whom sell after harvest.
4.2.5 Financing of Irish Potato production (Sources of Credit)
This study reveals that Irish Potato production is primarily (86%) funded using personal savings. The second most im-portant (70%) source of credit is loans from village savings and loan associations (VSLAs). However, one limitation is that such (VSLAs) loans tend to be small because they are drawn from farmer group savings. In addition, VSLAs charge a higher interest—8% per month—which is higher than most market rates (Figure 13), with the exception of private money lenders, who charge 18%. Despite high interest rates, farmers noted that VSLAs have better repayment terms, which usually involve deducting the amount owed from the farmers’ shares. Interestingly, fewer (17% and 15%) farmers reported exploiting the relatively cheaper credit from commercial banks and micro-finance institutions (MFIs), whose interest rates are 2.5% and 2%, respectively (Figure 13).
A deeper analysis of what discouraged Irish Potato farmers from using the relatively cheaper funding opportunities avail-able from formal financial institutions revealed that factors include (i) a lack of collateral (usually land), and (ii) fear of losing collateral to creditors. Other factors cited include long loan processes and difficulty in making prompt repayment, especially when the payback period does not match the harvest time. However, constraints on access are partially at-tributable to the location of formal financial institutions such as commercial banks in urban areas, which excludes many rural farmers. The likely consequence of limited access to agricultural financing relates to technology adoption.
8 The rankings where captured on a likert scale equating 1 to the most heplful organization in linking farmers to markets

In
ve
st
me
nt
O
pp
Or
tu
nI
tI
es
a
nd
C
ha
ll
en
ge
s
In
t
he
p
Ot
at
O
va
lu
e
Ch
aI
n
In
u
ga
nd
a
24
Figure 13: Source of Credit and interest rates
Source: Source: PASIC Community and Market Survey of Irish Potato VC actors (May 2015).
These findings point to a gap in agriculture financing, which is an impediment to agricultural investment, technology adoption and, thus, agricultural productivity. Interventions that improve farmers’ access to cheap sources of financing should be enhanced. These interventions can involve formalizing land ownership by issuing land certificates and titles so that land can be used as collateral. However, it is noteworthy that even farmers with titles fear using land as collateral because the land can be confiscated if they fail to pay. Therefore, there is a need for commercial banks to offer loans at affordable rates and to train their clients on how they can better manage their loans. Reduced interest rates and the possession of land documents can enhance access to credit. In addition, strengthening and capitalizing farmer groups would help farmers raise enough money to fund agricultural improvements. Therefore, the government and other support organizations should promote the VSLA model of financing smallholder farmers. Farmers buy shares in small groups, and the money can be channelled to cover the debt in the event of a failure to pay. Furthermore, buying creates a sense of ownership that can reduce both intended default and loan repayment costs.
4.2.6 Gender roles in Irish Potato production
Although women play an important role in Irish Potato production, men and women engage in varying levels of participa-tion, depending on the activity. Women’s involvement exceeds that of men in activities such as land tillage, making lines, planting, weeding, and harvesting; however, women are less involved in produce marketing and crop choice (Figure 14). The findings show that women’s involvement in production outweighs that of men.

In
ve
st
me
nt
O
pp
Or
tu
nI
tI
es
a
nd
C
ha
ll
en
ge
s
In
t
he
p
Ot
at
O
va
lu
e
Ch
aI
n
In
u
ga
nd
a
25
Figure 14: Percentage contribution of men and women in Irish Potato production
Source: PASIC Community and Market Survey of Irish Potato VC actors (May 2015).
4.2.7 Potential for Upgrading the Irish Potato Value Chain at the Production level
Figure 15 shows that the use of poor quality seed-without fertilizer in Irish Potato farming yields only 6.4 metric tons9 per hectare from 135 thousand hectares, as cited in (NAADS, 2015) for national Irish Potato production. This level of produc-tivity would result in approximately 867 thousand metric tons of Irish Potato per annum, valued at approximately Ugx 628 billion (U$ 187 million). Figure 15 further shows that using poor quality seed-with fertilizer can increase productivity in Irish Potato production to 8.4 MT per hectare (i.e., by 31% from 867 to 1,137 thousand metric tons). Nevertheless, the use of good quality seed-without fertilizers can lead to a 73% increase in Irish Potato production and therefore in farm incomes nationwide (details in Table 4A, Annex A).
The use of quality seed with fertilizer produces the best options for intensification technology, with a yield of 16.5 MT per hectare and therefore a 158% increase from 867 to 2,23410 thousand metric tons and annual farm income nationwide valued at Ugx 1,619 billion (U$ 485 million). Such estimates suggest that the country’s Irish Potato sector is losing poten-tial income of approximately Ugx 991 (U$ 298 million) per annum because of limited intensification at the production level of the value chain. This result proves that increased productivity through intensification from individual crop commodities (such as Irish Potato) provides a pathway for growth in Uganda’s agricultural sector.
9 6.4 MT/Ha is the average yield in the Kigezi sub-region based on estimates from the agronomic survey conducted by the IITA in 2015 under the PASIC project. However, the aver-age national yield is 4.8 MT per hectare (NAADS, 2015).
10 If the national average Irish Potato yield of 4.8 MT per hectare were to be used as the base to illustrate the effects of intensification in the Irish Potato cropping system, the productivity gap would widen (taking into account different technology packages).

In
ve
st
me
nt
O
pp
Or
tu
nI
tI
es
a
nd
C
ha
ll
en
ge
s
In
t
he
p
Ot
at
O
va
lu
e
Ch
aI
n
In
u
ga
nd
a
26
Figure 15: Indicative National Irish Potato Productivity and Income without and with intensification
Source: Author’s computations based on PASIC agronomic survey data (IITA, 2015) & NAADS (2015).
4.3 Technological Support Services and Investment Gaps
4.3.1 Seed Irish Potato Production System
Uganda’s seed Irish Potato production system is supported by a mix of three actors at different levels of production and efficiency, including (i) the Kachwekano Zonal Agricultural Research Development Institute (KAZARDI), which is the mandated public agency under the auspices of the National Agricultural Research Organization (NARO); (ii) the informal and unregulated farmer-driven but handy system, dependent on recycling of retained seed; and (iii) the largely donor-supported team of private seed Irish Potato multipliers, as illustrated in Box 2.
What is apparent from the study is that having these three actors in place emanates from KAZARDI’s limited capacity to produce seed Irish Potato that meets Uganda’s ever-growing demand. This study proves that access to improved seed is one of the major constraining factors limiting the upgrading of the Irish Potato value chain (refer to Figure 19, Section 4.3.3). One of the strategies for backstopping KAZARDI’s limited capacity is the decentralization of seed multiplication to private sector actors. Enablers such as research programs initiated by the International Fertilizer Development Centre (IFDC) at KAZARDI have started a farmer-driven seed Irish Potato multiplication program. However, the remaining limita-tions associated with the private seed multipliers are that a sizeable number (47%) of these multipliers are not registered (see Box 2 for details). Ultimately, the gap in the seed Irish Potato supply has retrospectively been filled by the use of poor-quality seed Irish Potato largely generated by farmers through recycling as their last-resort option. Uncertified poor seed is widely sold in most of the rural markets and interestingly, both traders and farmers can identify the varieties of seed Irish Potato sold in the marketplace.
The study examined why Irish Potato-growing communities were inclined towards the three main varieties (Kinigi, Victoria, and Rwangume) and the limited-supply varieties such as Kachpot1, which are suitable for industrial-level processing.

In
ve
st
me
nt
O
pp
Or
tu
nI
tI
es
a
nd
C
ha
ll
en
ge
s
In
t
he
p
Ot
at
O
va
lu
e
Ch
aI
n
In
u
ga
nd
a
27
Figure (16a) shows that during the main season, KAZARDI produces approximately 364 bags—80 kgs—of different varieties of certified basic seed: Victoria, Kachpot1, Rwangume, Kinigi and Rutuku. This production pattern responds to the attributes of Irish Potato preferred by producers: rapidly maturing; highly demanded; disease resistant; available basic seed; and high yielding (Figure 3c). KAZARDI’s production pattern mirrors that followed by the private seed multipli-ers. This reinforces the view that KAZARDI’s capabilities and priorities for producing basic seed Irish Potato varieties are interlinked with those of private seed multipliers.
Value addition is constrained by the inconsistent supply of the varieties of Irish Potato seeds (such as Kachpot 1) that are suitable for the production of crisps. Figures 16a and 16b show that both KAZARDI and the private seed multipliers produce more varieties such as Rwangume, Kinigi, and Victoria, which tend to match the preference criteria in Figure 3c. However, seed for Kachport 1, which is a highly demanded variety for processing, is not adequately produced (Figures 16a and 16b). In particular, there is a mismatch between seed Irish Potato that is demanded for processing and what is produced.

In
ve
st
me
nt
O
pp
Or
tu
nI
tI
es
a
nd
C
ha
ll
en
ge
s
In
t
he
p
Ot
at
O
va
lu
e
Ch
aI
n
In
u
ga
nd
a
28
Figu
re 1
6: S
eed
Irish
Pot
ato
varie
ties g
rown
(% o
f priv
ate
seed
mul
tiplie
rs)
Sour
ce: P
ASIC
Com
mun
ity a
nd M
arke
t Sur
vey o
f Iris
h Po
tato
VC
acto
rs (M
ay 2
015)
.
Rank
ings
of t
he p
refe
renc
e fo
r par
ticul
ar Ir
ish P
otat
o va
rietie
s bas
ed o
n a
com
bina
tion
of
attrib
utes
by
priv
ate
seed
mul
tiplie
rs

In
ve
st
me
nt
O
pp
Or
tu
nI
tI
es
a
nd
C
ha
ll
en
ge
s
In
t
he
p
Ot
at
O
va
lu
e
Ch
aI
n
In
u
ga
nd
a
29
Box 2
: Fac
ts A
bout
the
Seed
Iris
h Po
tato
pro
duct
ion
and
Supp
ly S
yste
m1.
Lim
ited
capa
city a
t KAZ
ARDI
2. Th
e lar
gely
info
rmal
syst
em3.
Priv
ate s
eed
Irish
Pot
ato m
ultip
liers
Pic1
: Out
side a
seed
Irish
Pot
ato s
cree
n ho
use

In
ve
st
me
nt
O
pp
Or
tu
nI
tI
es
a
nd
C
ha
ll
en
ge
s
In
t
he
p
Ot
at
O
va
lu
e
Ch
aI
n
In
u
ga
nd
a
30
Figure 16c shows that private seed multipliers choose a particular variety of seed Irish Potato based on a combination of attributes, which include the following: (i) high yielding; (ii) resistant to diseases; (iii) highly demanded in the market; (iv) available basic seed; and (v) early maturity period. One factor per se (for example, yield) might not be paramount in the seed Irish Potato multiplication business. For example, it is clear that Rutuku, followed by Kinigi (on the criteria of yield) are the varieties of choice (Table 5). However, the responses in Figure 16c place Rwangume ahead of the other two varieties (Rutuku, and Kinigi).
Table 5: Range in Yield across Seed Irish Potato Varieties
VarietySelf-reported Range in Yield (120 Kg Bags)Per Acre
Reported as Realized Attainable if Best Practices are FollowedMean Min Max Obs. Mean Min Max Obs.
Kinigi 66.2 12.0 140.0 19 89.1 16.0 200.0 17Kachpot1 50.7 5.0 120.0 3 70.7 5.0 180.0 3Rutuku 68.3 30.0 95.0 3 100.0 60.0 140.0 3Rwangume 38.6 1.0 80.0 22 57.3 5.3 120.0 22Rwashaki 49.0 26.0 80.0 4 54.0 32.0 80.0 3Victoria 41.6 4.0 120.0 15 63.7 5.0 160.0 15
Source: PASIC Community and Market Survey of potato VC actors (May, 2015)
4.3.2 Technology uptake and impact
The study established that all (100%) of the seed multipliers interviewed reported the use of insecticides; 97% use inorganic fertilizer; and 67% use herbicides (Figure 17). It is important to note that only five of every 10 seed multipliers (53%) use the recommended basic or foundation seed, which is only available from KAZARDI. Therefore, approximately 47% of the private seed multipliers produce seed from previous carry-over seed (i.e., recycling) and are not using basic seed produced by scientists at KAZARDI. Other general challenges enlisted by the seed multipliers are given in Figure 2b, Annex B.
Therefore, it is apparent that disease control, soil health and weed management are among the priority crop-loss risk-management activities in seed Irish Potato producing agribusiness units in the Kigezi sub-region.
Figure 17: Level of Application of Recommended Technologies in Seed Irish Potato Multiplication
Source: PASIC Community and Market Survey of Irish Potato VC actors (May, 2015).

In
ve
st
me
nt
O
pp
Or
tu
nI
tI
es
a
nd
C
ha
ll
en
ge
s
In
t
he
p
Ot
at
O
va
lu
e
Ch
aI
n
In
u
ga
nd
a
31
The study also established that of the technologies used to improve yields in Irish Potato production, the seed producers interviewed mentioned and highly ranked the use of improved seed, inorganic fertilizer, and disease-control chemicals as the most effective interventions for improving Irish Potato yields (Table 6). These are also some of the implied best practices reported.
Table 6: Ranking of technologies according to effectiveness in improving yield, %
Technology Category Rank11 according to the most effective1 2 3 4 5 Total %
Fungicides/insecticides 32 20 30 10 8 100Inorganic fertilizers 33 45 18 4 0 100Improved Potato seeds 40 14 14 21 12 100Organic fertilizer 2 22 20 39 17 100Herbicides 3 11 14 38 35 100
Source: PASIC Community and Market Survey of potato VC actors (May, 2015)11
4.3.3 Seed Irish Potato Multipliers’ capability and Investment gap
The study shows that an average seed Irish Potato producer in the Kigezi sub-region operates a farm unit of 1.2 acres (Table 7). This result is based on information generated from the interviews of 30 private seed Irish Potato multipliers. Productivity (yield) per acre across the board is approximately 45 bags per acre (i.e., 13.4 metric tons per hectare). This translates to production in a major season of approximately 6 metric tons (51 bags) on such a farm.
Table 7: Descriptive Statistics for a Typical Seed Irish Potato Farm
Mean Std. Dev. Min Max Obs
Land under Seed Irish Potato 1.2 1.2 0.1 6.0 30
Yield (120 Kg Bags/Acre) 45.2 30.9 3.0 120.0 30
Total Harvested (120 kg Bags) 50.6 56.8 3.0 222.0 30
Source: PASIC Community and Market Survey of Irish Potato VC actors (May 2015).
Additional information (in Figure 1B, Annex B) shows that based on the earmarked attributes of a seed Irish Potato farm set forth above, approximately 75% of farms are less than 1.5 acres. Likewise, 62% of the farms produce fewer than 50 bags, and the yield on approximately 55% of the seed farms is less than 50 bags per acre. This limited capability in the seed Irish Potato production system has resulted in an inherent gap of approximately 16,700 metric seed Irish Potato production valued at Ugx 18.4 billion (US$ 5.6 million),12 as illustrated in Figure 18. The details of the computations of the estimated seed Irish Potato gap are set forth in Table 1B, Annex B).
11 The rankings where captured on a likert scale equating 1 to the most effective technology12 Detailed computations of the inferred seed Irish Potato investment gap are provided in Table 1B, Annex B.

In
ve
st
me
nt
O
pp
Or
tu
nI
tI
es
a
nd
C
ha
ll
en
ge
s
In
t
he
p
Ot
at
O
va
lu
e
Ch
aI
n
In
u
ga
nd
a
32
Figure 18: Estimated Seed Irish Potato gap
Source: Computed from UBOS- UCA (2008/09), Complemented by PASIC Community and Market Survey of Irish Potato VC actors (May 2015).
Box 3 Enablers of building seed Irish Potato multiplicationThis study identified numerous institutions that have been instrumental in building capacity for seed Irish Potato multiplication in the Kigezi Irish Potato hub. The IFDC was singled out on two fronts by the seed multipliers as the lead organization that is (i) the most effective (Figure 18a)13, in terms of the number of farmers helped; and (ii) at the forefront of inspecting seed Irish Potato farms (Figure 18b). The information set forth in Figure 18b has policy implications in that the footprint of the MAAIF (particularly the Department of Crop Protection and Inspection), which is mandated by the government to oversee this task, is not clear cut and is overshadowed. The MAAIF’s footprint can only be traced from proxies such as KAZARDI, NAADS, and the district local government. What is evidenced—and its implication—is that the role of inspection must be decentralized to the MAAIF proxy organizations that operate in close contact with the farmers (in this case, KAZARDI) or the district local MAAIF officials.
Recommendation: The major components of the zonal investment plan should replicate the IFDC’s work.
Figure 18 a: Effectiveness of organizations in Promoting Seed Irish Potato Production

In
ve
st
me
nt
O
pp
Or
tu
nI
tI
es
a
nd
C
ha
ll
en
ge
s
In
t
he
p
Ot
at
O
va
lu
e
Ch
aI
n
In
u
ga
nd
a
33
Source: PASIC Community and Market Survey of Irish Potato VC actors (May 2015).13
4.3.4 Dynamics in Seed Irish Potato Marketing
Study results from an end-market analysis (Figure 19) for seed produced by private multipliers reveal that more than 75% of the seed is sold to farmers (either as individuals or in groups). This is a large market base. The remainder is sold to organizations. This study result implies that the devolution of seed multiplication from KAZARDI to the auspices of private seed producers—which are strategically located within communities and operated by farmers, if developed effectively—will avert seed Irish Potato shortages in the Irish Potato sub-sector.
Figure 19: Enlisted (%) major Buyers of seed Irish Potato
Source: PASIC Community and Market Survey of Irish Potato VC actors (May 2015).
Interestingly, all (100%) of the 30 seed Irish Potato producers reported providing some type of technical support to their customers (who happen to be farmers) in the form of (i) training in good farming practices (i.e., selecting and preparing land that suits various Irish Potato varieties, sorting and grading quality seeds, applying fertilizer, controlling disease, spacing while planting, engaging in minimum tillage using herbicides such as Roundup, and determining how to handle seed from purchase to planting); (ii) linking farmers to trustworthy agro input dealers; and (iii) engaging in good Irish
13 Seed multipliers were tasked to rank on a Likert scale organizations according to the level of impact [where 1 = organization that has had the most impact] in supporting seed Irish Potato production in the Kigezi sub-region.
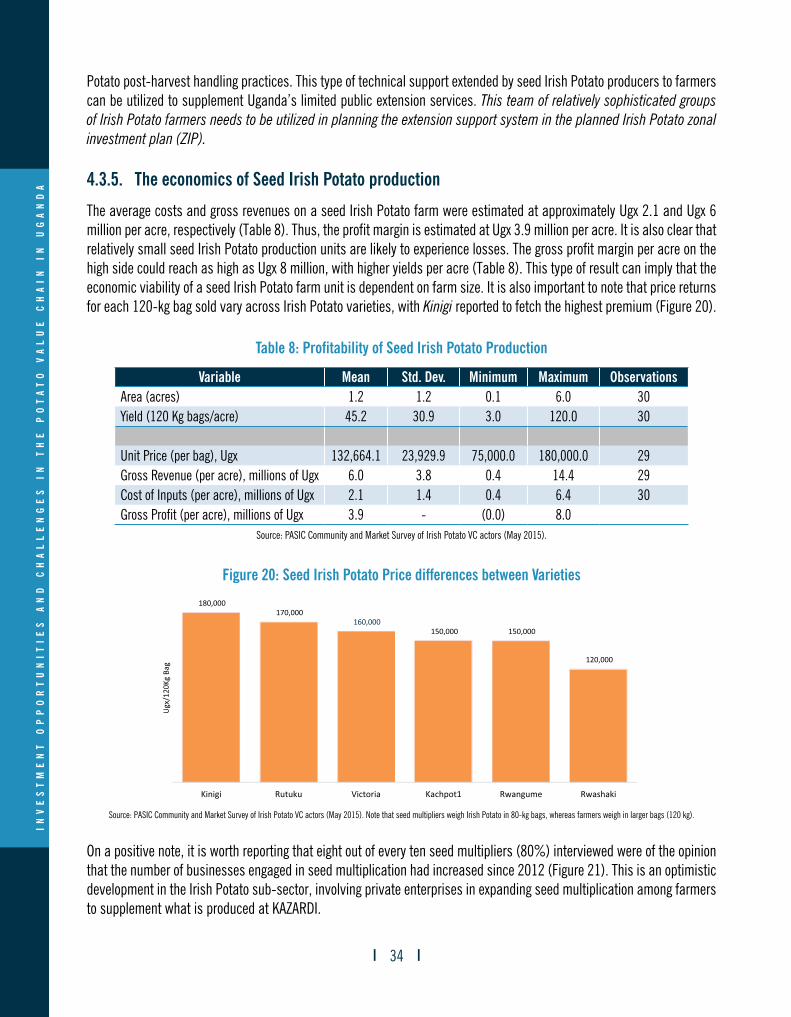
In
ve
st
me
nt
O
pp
Or
tu
nI
tI
es
a
nd
C
ha
ll
en
ge
s
In
t
he
p
Ot
at
O
va
lu
e
Ch
aI
n
In
u
ga
nd
a
34
Potato post-harvest handling practices. This type of technical support extended by seed Irish Potato producers to farmers can be utilized to supplement Uganda’s limited public extension services. This team of relatively sophisticated groups of Irish Potato farmers needs to be utilized in planning the extension support system in the planned Irish Potato zonal investment plan (ZIP).
4.3.5. The economics of Seed Irish Potato production
The average costs and gross revenues on a seed Irish Potato farm were estimated at approximately Ugx 2.1 and Ugx 6 million per acre, respectively (Table 8). Thus, the profit margin is estimated at Ugx 3.9 million per acre. It is also clear that relatively small seed Irish Potato production units are likely to experience losses. The gross profit margin per acre on the high side could reach as high as Ugx 8 million, with higher yields per acre (Table 8). This type of result can imply that the economic viability of a seed Irish Potato farm unit is dependent on farm size. It is also important to note that price returns for each 120-kg bag sold vary across Irish Potato varieties, with Kinigi reported to fetch the highest premium (Figure 20).
Table 8: Profitability of Seed Irish Potato Production
Variable Mean Std. Dev. Minimum Maximum ObservationsArea (acres) 1.2 1.2 0.1 6.0 30Yield (120 Kg bags/acre) 45.2 30.9 3.0 120.0 30
Unit Price (per bag), Ugx 132,664.1 23,929.9 75,000.0 180,000.0 29Gross Revenue (per acre), millions of Ugx 6.0 3.8 0.4 14.4 29Cost of Inputs (per acre), millions of Ugx 2.1 1.4 0.4 6.4 30Gross Profit (per acre), millions of Ugx 3.9 - (0.0) 8.0
Source: PASIC Community and Market Survey of Irish Potato VC actors (May 2015).
Figure 20: Seed Irish Potato Price differences between Varieties
Source: PASIC Community and Market Survey of Irish Potato VC actors (May 2015). Note that seed multipliers weigh Irish Potato in 80-kg bags, whereas farmers weigh in larger bags (120 kg).
On a positive note, it is worth reporting that eight out of every ten seed multipliers (80%) interviewed were of the opinion that the number of businesses engaged in seed multiplication had increased since 2012 (Figure 21). This is an optimistic development in the Irish Potato sub-sector, involving private enterprises in expanding seed multiplication among farmers to supplement what is produced at KAZARDI.

In
ve
st
me
nt
O
pp
Or
tu
nI
tI
es
a
nd
C
ha
ll
en
ge
s
In
t
he
p
Ot
at
O
va
lu
e
Ch
aI
n
In
u
ga
nd
a
35
Figure 21: Observed Trends in Seed Irish Potato Production since 2012
Source: PASIC Community and Market Survey of Irish Potato VC actors (May 2015).
The seed multipliers associated the positive trend in seed Irish Potato multiplication to factors such as (i) access to train-ing and technologies related to the Irish Potato seed production business (i.e., improved seeds, inorganic fertilizers, and best farm practices); (ii) the increasing need to expand Irish Potato production in communities in the Kigezi sub-region, spurred by the realization of the role of Irish Potato as an income-generating venture; (iii) the expanding market (demand) for Irish Potato in the recent past, leading to increased production; and (iv) the need to increase productivity given the limited land in the sub-region. Some of the seed producers mentioned being able to sell seed beyond the local market to neighbouring districts and across neighbouring countries such as Rwanda.
4.3.6 Business Characteristics and Capabilities of Agro-Input Dealers
The outcomes from the market survey reveal that most (70%) of the agro-input dealers interviewed are small-scale retailers. Only 30% reported that they are both retailers and wholesalers. A look at the demographic and gender dimen-sions of agro-input dealers reveals that most are middle-aged (42 years) and that 87% are men. Their average level of schooling is senior three (S.3) (Table 9).
Table 9: Characteristics of the agro-input dealers (business owners)
Attribute StatisticGender:• Male 87%• Female 13%Age (years) 42.4Years of schooling 10 (S.3)Level of business:• Retail 70% (Male owned=100%)• Both (Retail & Wholesale) 30% (Male owned=87%, Female owned=13%)
Source: PASIC Community and Market Survey of potato VC actors (May, 2015)
Like other value chain actors, agro-input businesses remain informal. The survey revealed that 59% of agro-input dealers are not registered (Figure 22). This means that unregistered dealers who are not certified cannot be monitored to ensure quality control.

In
ve
st
me
nt
O
pp
Or
tu
nI
tI
es
a
nd
C
ha
ll
en
ge
s
In
t
he
p
Ot
at
O
va
lu
e
Ch
aI
n
In
u
ga
nd
a
36
Figure 22: Registration status of agro-input dealers
Source: PASIC Community and Market Survey of Irish Potato VC actors (May 2015).
Of the registered (41%) agro-input dealers, 8% are registered by MAAIF, but the majority (67%) are registered with the Uganda National Agro-input dealers Association (UNADA). The remaining 25% reported having attained registration status from the registrar of companies. Ideally, MAAIF is mandated to certify and issue certificates of clearance to all of Uganda’s input dealers. These results suggest that UNADA’s capacity could be enhanced to play a complementary role (with MAAIF) registering and monitoring Uganda’s input dealerships.
4.3.7 Category of inputs and Business Size of agro-input dealers
The study reveals that the majority (97%) of agro-input shops in the Kigezi sub-region deal in insecticides/fungicides, followed by herbicides (87%), fertilizers, and improved seed, in that order (see Table 10 below). Agro-input dealers thus seem to be informed by the demand in stocking inputs. There is a high demand both for inputs that can control pests and diseases and for inputs that can replenish soils because soil exhaustion is a challenge to most Irish Potato farmers in the Kigezi sub-region.
Table 10: Agro-inputs traded and the Percentage of input dealers dealing in each input type
Inputs dealt in Percentage of agro-input dealers trading in a specific inputInsecticides & Fungicides 97Herbicides 87Fertilizers 77Improved seed 23
Source: PASIC Community and Market Survey of Irish Potato VC actors (May 2015).
However, the volumes of inputs stocked are small. The survey revealed that in a peak season, agro-input dealers stock approximate 800 litres of insecticides/fungicides, 225 litres of herbicides, 3,752 kg of fertilizers and 1,669 kg of improved seed (Figure 23). Given that there are few and sometimes no agro-input shops in rural communities, these quantities indicate that input supply is inadequate.

In
ve
st
me
nt
O
pp
Or
tu
nI
tI
es
a
nd
C
ha
ll
en
ge
s
In
t
he
p
Ot
at
O
va
lu
e
Ch
aI
n
In
u
ga
nd
a
37
Figure 23: Amounts of agro-inputs stocked by a dealer in peak season (4 months)
Source: PASIC Community and Market Survey of Irish Potato VC actors (May 2015).
The sources of agro inputs are far from the selling locations. For instance, the study found that approximately 40% of agro-input dealers get their input supplies from Kampala and travel for more than 700 minutes (round trip). Moreover, the remaining 30% of the agro-input dealers get their supplies from Kabale and travel for 136 minutes (round trip) (Table 11). These long distances lead to high transportation costs, which translate into high input costs. Long distances and thus high transaction costs contribute to large differences between buying and selling prices. The agro-input prices are generally high and the dealers sell at much higher prices than the prices at which they buy. For instance, the agro-input traders buy a litre of insecticide and herbicides at 15,756 and 12,857 Uganda shillings, respectively, and sell it at 19,007 and 15,552 Uganda shillings, respectively (Table 6). The reason for the large differences between the buying and selling costs might be high transportation costs. Additionally, the higher selling price might suggest the oligopolistic tendencies exhibited by the agro-input dealers because they are few compared to the available market. Therefore, efforts to bridge the distance between the sources and target markets of inputs should be a priority area in the Irish Potato zonal investment plan (ZIP).
Table 11: Sources of inputs and distance (minutes) to the source
4.3.8. Classification of the agro-inputs market
Individual farmers are the primary buyers of the agro-inputs. The Irish Potato value chain study found that 28 out of the 30 (93%) agro-input dealers sell to individual farmers. In addition, 63% sell to farmer groups, and 17% sell to organiza-tions such as NAADS (Table 12).
Sources of imputs and distance (minutes) to the source
Agro-input buying and selling prices
Source Percentage of inputs from source
Distance (minutes)
Category of input Average price (Ugx)Buying Selling Difference
Kampala 39.4 703 Insecticides (litres) 15,756 19,007 3,251Kabale 30.3 136 Herbicides (litres) 12,857 15,552 2,694Kisoro 21.1 32Rukungiri 6.6 40Rwanda 3.3 180
Source: PASIC Community and Market Survey of Irish Potato VC actors (May 2015).

In
ve
st
me
nt
O
pp
Or
tu
nI
tI
es
a
nd
C
ha
ll
en
ge
s
In
t
he
p
Ot
at
O
va
lu
e
Ch
aI
n
In
u
ga
nd
a
38
Table 12: Major buyers of Irish Potato agro-inputs
Major Input buyers Percent Distribution ObservationsFarmer groups 63 19Organizations 17 5Individual farmers 93 28Other (specify) 10 3
Source: PASIC Community and Market Survey of Irish Potato VC actors (May 2015)
Most agro-input dealers predict that the demand for agro-inputs will increase in the near future (Figure 24). For all agro-inputs on the market, more than 80% of the interviewed dealers reported that demand would increase in the next three years. All of the interviewed dealers believed that the demand for improved seed would increase, whereas 90% believed that the demand for insecticides would increase. Such optimism shows that the market for agro-inputs will expand in the future.
Figure 24: Predictions of market dynamics for inputs (% Self-reported) in the next 3 years
Source: PASIC Community and Market Survey of Irish Potato VC actors (May 2015).
4.3.9. Financing of agro-input trading
Agro-input dealers largely use their personal savings to invest in the business (Figure 25). However, compared to other value chain actors, a considerably larger number of agro-input dealers (30%) borrow from commercial banks and Sav-ings and Credit Cooperatives (SACCOs) (27%). Furthermore, compared to other actors, a sizeable percentage (27%) of dealers borrow from informal saving schemes. Indeed, the value chain survey found that 27% of agro-input dealers used credit from village savings and loan associations (VSLAs).

In
ve
st
me
nt
O
pp
Or
tu
nI
tI
es
a
nd
C
ha
ll
en
ge
s
In
t
he
p
Ot
at
O
va
lu
e
Ch
aI
n
In
u
ga
nd
a
39
Figure 25: Sources of funding to agro-input dealers
Source: PASIC Community and Market Survey of Irish Potato VC actors (May 2015).
All credit sources require collateral; only 25% of agro-input users who use VSLAs reported not needing collateral. The interest rates charged vary across the sources of credit (Table 13). For instance, agro-input dealers reported that VSLAs charge an interest rate of 6.1% per month, commercial banks charge 2.5%, SACCOs charge 3.1%, and micro-finance institutions charge 2.5%.
Many credit sources may not have enough money to lend. For instance, VSLAs normally depend on small contributions from members to raise money that can be lent to members. Furthermore, most micro-finance institutions are not well capitalized to satisfy their customers’ loan demands, as indicated by the amounts of money borrowed from each source. Larger amounts are borrowed from commercial banks, followed by SACCOs, whereas the smallest amounts are borrowed from micro-finance, followed by VSLAs (see Table 13). Such study results imply that formal financial institutions need to leverage both capitalization capacity and relatively low interest rates to design credit packages for agricultural commodity value chain actors with shorter loan application processes.
Table 13: Collateral requirements, interest rate and amount borrowed from the credit source
Sources of credit Percentage reporting that the source requires collateral
Interest rate charged
Amount ever borrowedMinimum Maximum
SACCOs 100 3.1 1,141,429 2,408,571Micro Finance 100 2.5 200,000 500,000Informal saving scheme (VSLAs) 75 6.1 425,000 587,500Commercial bank 100 2.5 4,275,000 5,575,000
Source: PASIC Community and Market Survey of Irish Potato VC actors (May 2015).
4.3.10. Organizations supporting agro-input dealers
Agro-input dealers are supported by numerous organizations. The support provided includes training on the use and proper handling of chemicals, linking agro-input dealers to quality input suppliers, sensitizing dealers to the registration process, and identifying how to detect and distinguish genuine from counterfeit products. UNADA was mentioned by 30% of agro-input dealers as the organization that provides support, followed by the IFDC, which was mentioned by 20% of the surveyed agro-input dealers (Figure 26). These findings suggest that the level of support extended to agro-input busi-nesses remains very low.
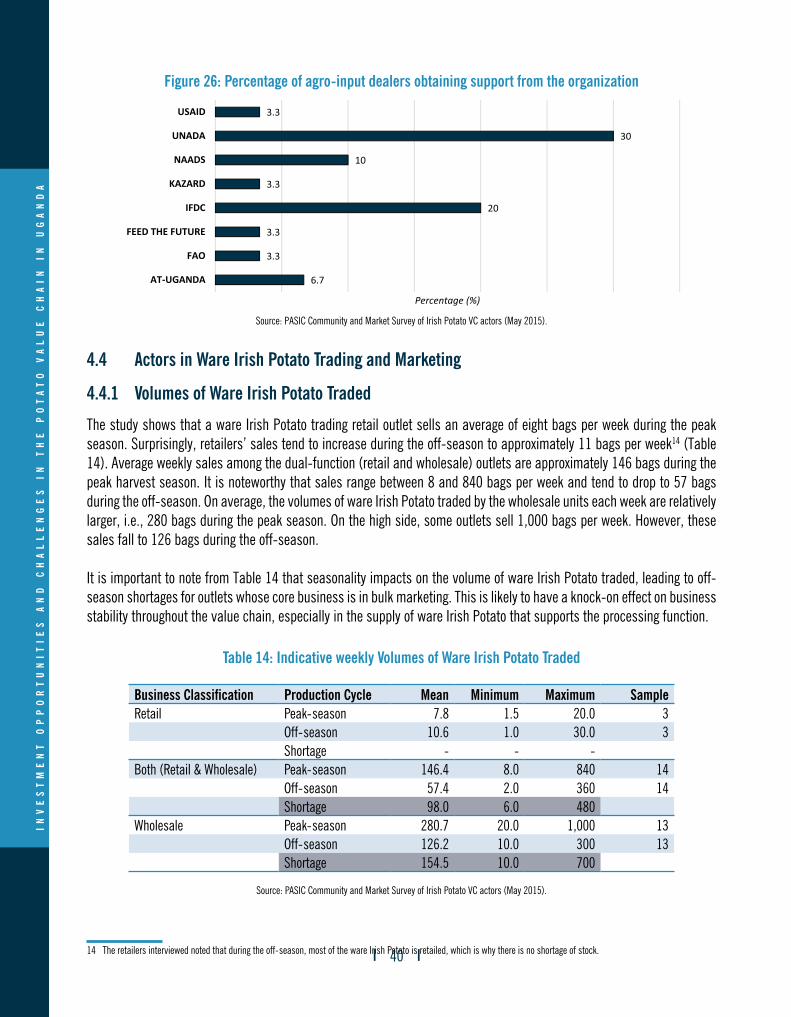
In
ve
st
me
nt
O
pp
Or
tu
nI
tI
es
a
nd
C
ha
ll
en
ge
s
In
t
he
p
Ot
at
O
va
lu
e
Ch
aI
n
In
u
ga
nd
a
40
Figure 26: Percentage of agro-input dealers obtaining support from the organization
Source: PASIC Community and Market Survey of Irish Potato VC actors (May 2015).
4.4 Actors in Ware Irish Potato Trading and Marketing
4.4.1 Volumes of Ware Irish Potato Traded
The study shows that a ware Irish Potato trading retail outlet sells an average of eight bags per week during the peak season. Surprisingly, retailers’ sales tend to increase during the off-season to approximately 11 bags per week14 (Table 14). Average weekly sales among the dual-function (retail and wholesale) outlets are approximately 146 bags during the peak harvest season. It is noteworthy that sales range between 8 and 840 bags per week and tend to drop to 57 bags during the off-season. On average, the volumes of ware Irish Potato traded by the wholesale units each week are relatively larger, i.e., 280 bags during the peak season. On the high side, some outlets sell 1,000 bags per week. However, these sales fall to 126 bags during the off-season.
It is important to note from Table 14 that seasonality impacts on the volume of ware Irish Potato traded, leading to off-season shortages for outlets whose core business is in bulk marketing. This is likely to have a knock-on effect on business stability throughout the value chain, especially in the supply of ware Irish Potato that supports the processing function.
Table 14: Indicative weekly Volumes of Ware Irish Potato Traded
Business Classification Production Cycle Mean Minimum Maximum SampleRetail Peak-season 7.8 1.5 20.0 3
Off-season 10.6 1.0 30.0 3Shortage - - -
Both (Retail & Wholesale) Peak-season 146.4 8.0 840 14Off-season 57.4 2.0 360 14Shortage 98.0 6.0 480
Wholesale Peak-season 280.7 20.0 1,000 13Off-season 126.2 10.0 300 13Shortage 154.5 10.0 700
Source: PASIC Community and Market Survey of Irish Potato VC actors (May 2015).
14 The retailers interviewed noted that during the off-season, most of the ware Irish Potato is retailed, which is why there is no shortage of stock.

In
ve
st
me
nt
O
pp
Or
tu
nI
tI
es
a
nd
C
ha
ll
en
ge
s
In
t
he
p
Ot
at
O
va
lu
e
Ch
aI
n
In
u
ga
nd
a
41
4.4.2 Mapping Key Actors in Ware Irish Potato Trading
The study results reveal that traders are the most influential actors in determining the volume and quality standard of traded Irish Potatoes and price outcomes in the Irish Potato subsector (Table 15). These observations relate to the fact that traders buy in bulk and have a larger customer base (in terms of numbers and scope); therefore, they determine the demand and price for Irish Potatoes. Fast-food restaurants came in at second (22%) because of their sizeable influence on quality, quantity and price in the Irish Potato market. Traders placed farmers in the third position (18%) because traders believe that the volumes harvested by farmers determine the market price; moreover, farmers are the primary controllers of quality.
Table 15: Mentioned (%) Key Actors in Ware Irish Potato Marketing
Market Attribute
Key Actor
Traders Fast food Restaurant
Final Consumer Farmers Others Total Observations
Quantity 46.7 20.0 10.0 16.7 6.7 100.0 30Quality 43.3 26.7 3.3 20.0 6.7 100.0 30Price 56.7 16.7 3.3 16.7 6.7 100.0 30Overall 46.2 26.9 3.9 19.2 3.9 100.0 26Total 48.3 22.4 5.2 18.1 6.0 100.0 116
Source: PASIC Community and Market Survey of Irish Potato VC actors (May 2015).
Traders influence the demand side of the Irish Potato market. It is understood that farmers’ influence is only fundamental on the supply side (i.e., in volume and quality harvested); farmers have minimal influence on price. Under the circum-stances, it will only be possible to improve farmer incentives by strengthening farmer-based marketing groups.

In
ve
st
me
nt
O
pp
Or
tu
nI
tI
es
a
nd
C
ha
ll
en
ge
s
In
t
he
p
Ot
at
O
va
lu
e
Ch
aI
n
In
u
ga
nd
a
42
4.4.3 Flow of Ware Irish Potato Varieties Traded and Nature of Trade Linkages
The study determined that the Kinigi constitutes the highest (58%) volumes in the ware Irish Potato traded, followed by Rwangume (41%). Victoria is the least-traded variety of Irish Potato (Figure 34). It is noteworthy that the list of high-value, tradeable Irish Potato varieties becomes smaller from the 11 varieties produced (see Figure 8, section 4.1.3). The implication is that more than five Irish Potato varieties are produced specifically for household food-security purposes. This implies that there is a need to maintain a delicate balance between the allocation of limited resources, especially land for Irish Potato production, to ensure both food security in the sub-region and the pursuit of the high-value tradeable varieties that are critical to upgrading the Irish Potato value chain.
Figure 27: Volumes (%) of Respective Ware Irish Potato Traded by Variety
Source: PASIC Community and Market Survey of Irish Potato VC actors (May 2015).
The flow of ware Irish Potato from the production points to middle traders to end buyers is illustrated in Figure 28. The traders interviewed indicated that farmers were the main (97%) suppliers of ware Irish Potatoes. Interestingly, production from traders (own production) plays an equally (40%) important role as that of middlemen (37%) in contributing to the volume of ware Irish Potato traded. Traders’ involvement in production is critical to the upgrading of the Irish Potato value chain in which some farmers are engaging in deeper value chain marketing activities. It is also noteworthy that farmer groups play a relatively smaller (13%) role in the flow of Irish Potato to the marketing level of the value chain (Figure 28).
Figure 28 further shows that traders are the main (70%) buyers of ware Irish Potato from mid-level trader-managed collection points. These traders transport ware Irish Potato out of the Kigezi sub-region, targeting distant urban markets from other regions of the country. Fast-food restaurants (43%) and end consumers (40%) form the next two layers of the market base for the traded ware Irish Potato within the Kigezi sub-region.

In
ve
st
me
nt
O
pp
Or
tu
nI
tI
es
a
nd
C
ha
ll
en
ge
s
In
t
he
p
Ot
at
O
va
lu
e
Ch
aI
n
In
u
ga
nd
a
43
Figu
re 2
8: P
ropo
rtion
ate
(%) r
ole
of va
lue
chai
n ac
tors
in th
e flo
w of
war
e Iri
sh P
otat
o fro
m p
rodu
ctio
n to
mar
ketin
g.
Sour
ce: P
ASIC
Com
mun
ity a
nd M
arke
t Sur
vey o
f Iris
h Po
tato
VC
acto
rs (M
ay 2
015)
.
Buye
rs of
war
e Iris
h Po
tato
from
Trad
ers
Supp
liers
of w
are I
rish
Pota
to to
Trad
ers
Mid
-leve
l Tra
ders
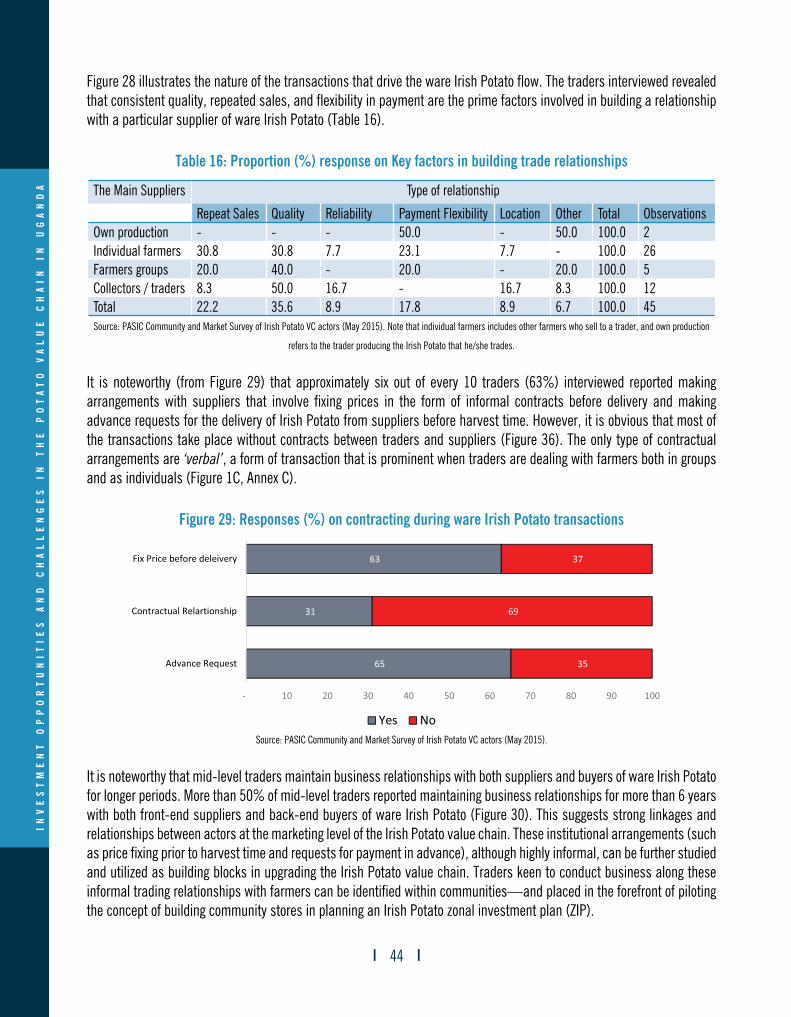
In
ve
st
me
nt
O
pp
Or
tu
nI
tI
es
a
nd
C
ha
ll
en
ge
s
In
t
he
p
Ot
at
O
va
lu
e
Ch
aI
n
In
u
ga
nd
a
44
Figure 28 illustrates the nature of the transactions that drive the ware Irish Potato flow. The traders interviewed revealed that consistent quality, repeated sales, and flexibility in payment are the prime factors involved in building a relationship with a particular supplier of ware Irish Potato (Table 16).
Table 16: Proportion (%) response on Key factors in building trade relationships
The Main Suppliers Type of relationship
Repeat Sales Quality Reliability Payment Flexibility Location Other Total ObservationsOwn production - - - 50.0 - 50.0 100.0 2Individual farmers 30.8 30.8 7.7 23.1 7.7 - 100.0 26Farmers groups 20.0 40.0 - 20.0 - 20.0 100.0 5Collectors / traders 8.3 50.0 16.7 - 16.7 8.3 100.0 12Total 22.2 35.6 8.9 17.8 8.9 6.7 100.0 45Source: PASIC Community and Market Survey of Irish Potato VC actors (May 2015). Note that individual farmers includes other farmers who sell to a trader, and own production
refers to the trader producing the Irish Potato that he/she trades.
It is noteworthy (from Figure 29) that approximately six out of every 10 traders (63%) interviewed reported making arrangements with suppliers that involve fixing prices in the form of informal contracts before delivery and making advance requests for the delivery of Irish Potato from suppliers before harvest time. However, it is obvious that most of the transactions take place without contracts between traders and suppliers (Figure 36). The only type of contractual arrangements are ‘verbal’, a form of transaction that is prominent when traders are dealing with farmers both in groups and as individuals (Figure 1C, Annex C).
Figure 29: Responses (%) on contracting during ware Irish Potato transactions
Source: PASIC Community and Market Survey of Irish Potato VC actors (May 2015).
It is noteworthy that mid-level traders maintain business relationships with both suppliers and buyers of ware Irish Potato for longer periods. More than 50% of mid-level traders reported maintaining business relationships for more than 6 years with both front-end suppliers and back-end buyers of ware Irish Potato (Figure 30). This suggests strong linkages and relationships between actors at the marketing level of the Irish Potato value chain. These institutional arrangements (such as price fixing prior to harvest time and requests for payment in advance), although highly informal, can be further studied and utilized as building blocks in upgrading the Irish Potato value chain. Traders keen to conduct business along these informal trading relationships with farmers can be identified within communities—and placed in the forefront of piloting the concept of building community stores in planning an Irish Potato zonal investment plan (ZIP).

In
ve
st
me
nt
O
pp
Or
tu
nI
tI
es
a
nd
C
ha
ll
en
ge
s
In
t
he
p
Ot
at
O
va
lu
e
Ch
aI
n
In
u
ga
nd
a
45
Figure 30: Period (years) in business with ware Irish Potato suppliers reported by Traders (%)
Source: PASIC Community and Market Survey of Irish Potato VC actors (May 2015).
4.4.4 Pricing and Grading Practices of Ware Irish Potato by Traders
This study shows that grading is adhered to both at the time of stocking (buying) and selling ware Irish Potato by traders, as revealed in Figure 38. The driving criterion for grading is size, followed by maturity and damaged amounts. Variety is also quite important to grading. Therefore, the area of focus in upgrading and adding value to ware Irish Potato traded in the zonal investment plan must involve confirming that Irish Potato produced is of the appropriate quality in terms of size, maturity, amount of damage (which goes to handling), and variety. Traders interviewed during the market survey report that on average, 69% of the Irish Potato traded in the Kigezi sub-region is of the appropriate quality (Figure 2C, Annex C).By the time of the survey, Kinigi, Rwangume, and Rwashaki were the three most highly valued Irish Potato varieties in the Kigezi sub-region, with an average cost of approximately 96,000/-, 89,000/-, and 86,000/-, respectively. The variation in prices across Irish Potato varieties is in line with the most-traded varieties in Figure 31.
Figure 31: Grading process, Reported Criteria (%), and Prices of Irish Potato Varieties
Source: PASIC Community and Market Survey of Irish Potato VC actors (May 2015).
Pic 1: Grading Process

In
ve
st
me
nt
O
pp
Or
tu
nI
tI
es
a
nd
C
ha
ll
en
ge
s
In
t
he
p
Ot
at
O
va
lu
e
Ch
aI
n
In
u
ga
nd
a
46
4.4.5 Services and inputs Support to farmers by Traders (Backward Linkages)
The study shows that traders provide some form of pre-financing to farmers that supply them with ware Irish Potato. Traders’ support for farmers is primarily in the form of cash credit, packaging materials, and agro-chemicals (Figure 32). This is important and implies that there are backward linkages at the trading level of the Irish Potato value chain, which strengthens the business relationships between traders and farmers.
Figure 32: Traders (%) providing various forms of support to supplies.
Source: PASIC Community and Market Survey of Irish Potato VC actors (May 2015).
4.4.6 Characterization of Transport and Storage
The study results (Figure 33) show that the primary buying points for ware Irish Potato traded in the Kigezi sub-region include the farm gate, the roadside, and deliveries at the trader’s business premises. The flow of Irish Potato from these buying points requires efficient means of transport.
Figure 33: Ware Irish Potato buying points reported by Traders (%)
Source: PASIC Community and Market Survey of Irish Potato VC actors (May 2015).
Upon further questioning about the transportation aspect, traders of ware Irish Potato reported that on average, it takes them more than two hours (132 minutes) to transport Irish Potato from the buying point to the selling point. The study established that 80% of traders store ware Irish Potato for a period of between 3 and 7 days (Figure 3C, Annex C). Extended storage periods (beyond a week) occur primarily as a response to depressed market conditions, i.e., low prices and demand.

In
ve
st
me
nt
O
pp
Or
tu
nI
tI
es
a
nd
C
ha
ll
en
ge
s
In
t
he
p
Ot
at
O
va
lu
e
Ch
aI
n
In
u
ga
nd
a
47
Nevertheless, five out of every ten traders interviewed reported operating without storage facilities. For those who had stores, two out of every five traders reported that storage space was neither adequate nor of the right standard (Table 1C, Annex C).
4.4.7 Employment from Ware Irish Potato Trading
A typical ware Irish Potato outlet in the Kigezi sub-region employs an average of two people. Outlets that engage in bulk (wholesale) marketing of ware Irish Potato employ an average of 8 employees and on the high end, 15 (Figure 42). A dual-purpose outlet employs from 2 to 14 people. Fewer jobs are created when business outlets are characterised in terms of the volume of ware Irish Potato handled in the course of their retail, wholesale and dual-purpose functions (retail and wholesale).
The study further reveals that the nature of jobs and activities linked to the mid-stream ware Irish Potato trading are male dominated, other than jobs involving sales and managing the storage facility (Figure 4C, Annex C). The study also reveals that at this level of the value chain, seven out every ten persons employed are youth (Figure 5C, Annex C). Therefore, any efforts directed towards upgrading the value chain at the mid-stream marketing level have the potential to benefit youth in the Kigezi sub-region.
Figure 34: Employment created at the Trading Level of the Ware Irish Potato Value Chain
Source: PASIC Community and Market Survey of Irish Potato VC actors (May 2015).
4.4.8 Major challenges among ware Irish Potato traders
Price fluctuation was the most reported challenge faced by Irish Potato traders (Figure 35), followed by high transporta-tion costs (attributed to mechanical breakdowns and bad roads). Among the other challenges mentioned, the issue of quality (in terms of size, maturity, damage, mixed varieties, and prematurity) also resonated with traders. The traders also mention the risk of losing money because of bad debt, along with insufficient capital to pay for labour, packing ma-terials, and stocking enough ware Irish Potato to satisfy demand. Storage and inconsistent measurements of ware Irish Potato bags15 were among the challenges mentioned by traders across the board (Figure 35).
15 It was established that a bag of ware Irish Potatoes ranges from 120 to 140 kg depending on the circumstances.

In
ve
st
me
nt
O
pp
Or
tu
nI
tI
es
a
nd
C
ha
ll
en
ge
s
In
t
he
p
Ot
at
O
va
lu
e
Ch
aI
n
In
u
ga
nd
a
48
Investment in appropriate storage facilities and enforcing quality can even out seasonal price fluctuations. With the right intervention, Irish Potato can be stored for longer periods to stagger supply during the harvesting period. Additional investment in the road network (as exemplified by IFDC interventions in Kisoro) can be a priority strategic component in the zonal investment plan (ZIP). The traders interviewed took the general view that possible solutions to challenges could include the following: (1) enforcing quality standards by rejecting poor quality and demanding good quality; (2) construct-ing community storage facilities; (3) introducing standardized measurements units for bags; (4) providing access to low-interest credit; (5) improving community access roads; and (6) drafting contracts to ensure that defaulters are forced to pay. All of these remedies were advanced by the traders interviewed as plausible solutions to major challenges.
Figure 35: Major challenges among ware Irish Potato traders
Source: PASIC Community and Market Survey of Irish Potato VC actors (May 2015).
4.5 Irish Potato Processing and Value Addition
4.5.1. Business Characteristics of Irish Potato Processing Ventures
The study found that women dominate the Irish Potato processing business. Survey results show that 59% of Irish Po-tato processing business owners are women and that 41% are men. The processors interviewed are middle-aged, with an average age of 35, and had 9 years of education, an equivalent of senior two, indicating that they are relatively well educated and trainable.
However, most businesses are informal. The survey found that only 13% of the processing businesses are registered, although a large number (67%) had trading licenses. In addition, these processing businesses have been in operation for an average of 4.5 years, suggesting that they are in their infancy (Table 17).

In
ve
st
me
nt
O
pp
Or
tu
nI
tI
es
a
nd
C
ha
ll
en
ge
s
In
t
he
p
Ot
at
O
va
lu
e
Ch
aI
n
In
u
ga
nd
a
49
Table 17: Characteristics of processing owners
Attribute Means Percent Frequencies (N=Sample)Ownership of processing business by gender:Men 40.6 13Women 59.4 19Socio-demographic information:Age of company head (years) 35Years of schooling 9Operating period (years) 4.5Registration Status:Registered 13.0Ownership of Trading license 67.0
Source: Community and Market Survey of Irish Potato VC actors (May 2015).
The Irish Potato processing business in the Kigezi sub-region remains small-scale, with 27 out of 32 (84%) processing businesses covered in the value chain survey falling into the small-scale category (Table 18). Study results show that although a typical Irish Potato processing firm has the capacity to process 98.4 kilograms of Irish Potatoes in a day, it processes only 45.9 kilograms (less than 50% of installed capacity). This suggests capacity utilization gaps that need to be exploited to upgrade the Irish Potato value chain in the Kigezi sub-region. The most important processed Irish Potato products are chips, with a small component of crisps (Figure 36). Making crisps is more technology intensive and requires more skills than making chips. The study reveals that most small-scale processors are not trained and cannot afford the requisite technology required to make crisps. The few existing chip makers were trained by the IFDC.
Figure 36: Processed Irish Potato products
The traders interviewed reported that on average, there are approximately 8 processors in each sub-country. This sug-gests that there are many fragmented small-scale producers in each sub-county and that the processing component of the Irish Potato value chain remains small-scale and fragmented.

In
ve
st
me
nt
O
pp
Or
tu
nI
tI
es
a
nd
C
ha
ll
en
ge
s
In
t
he
p
Ot
at
O
va
lu
e
Ch
aI
n
In
u
ga
nd
a
50
Table 18: Scale of operation and capacity Utilization
Means Percent Frequencies (N=Sample)Scale of operation• Small scale 84.4 27• Medium scale 15.6 5• Total 100.0 32Average estimated number of processors per sub-county 7.9Irish Potato Processing capacity: • Bags processed per day 45.9• Installed capacity with available equipment 98.4
Source: Community and Market Survey of Irish Potato VC actors (May 2015).
4.5.2 Pricing and Grading of Ware Irish Potato Purchased for Processing
The study shows that processors prefer Irish Potato varieties that are ‘big’ in size (Figure 43). The preferred varieties are Rwangume, Kinigi, and Kachport 1, which are among the most high-priced varieties on the list of Irish Potatoes pur-chased for processing. Therefore, having Irish Potato of the right variety and in the right size adds value to the Irish Potato value chain and can contribute to the upgrading of the Irish Potato value chain. Other preferred attributes are maturity and less damage. Because of their need for immediate cash, most farmers sell Irish Potatoes prematurely. While this may not present a substantial problem to people who purchase for direct consumption, it does affect people who purchase for processing.
Figure 37: Ware Irish Potato quality attributes considered by processors
Source: Community and Market Survey of Irish Potato VC actors (May 2015).
Therefore, improvements in the production of Irish Potato varieties targeting industrial processing must be a key element in the planned Irish Potato ZIP for the Kigezi sub-region.
Price differences by variety
Variety High Quality Low quality
Victoria 85333 70667
Rwangume 98563 82067
Kinigi 100456 80263
Rutuku 104667 84000
Rwashaki 89000 63000
Sutama 24000 14400
Kachporti 96000 84000
Petero 62000 58333

In
ve
st
me
nt
O
pp
Or
tu
nI
tI
es
a
nd
C
ha
ll
en
ge
s
In
t
he
p
Ot
at
O
va
lu
e
Ch
aI
n
In
u
ga
nd
a
51
Measures that can help farmers wait until Irish Potatoes mature would be helpful in improving the quality of traded and processed Irish Potatoes. These measures can involve arrangements through which processors advance payments to farmers even before the harvest, deducting those soft loans from the harvest. This loaned-out cash may help farmers wait for maturity. However, this arrangement might not be successful if Irish Potato trading and processing remains informal. Therefore, there is a need to formalize Irish Potato production activities so that farmers, traders and processors can be involved in binding agreements.
4.5.3 The structure of the labour force and employment in Irish Potato processing
One of the measures of the size of a business is the number of people it employs. Following this measure, Irish Potato processing activity in the Kigezi sub-region is very small. On average, an Irish Potato processing business has three em-ployees, the majority of whom are women (55%). Youth comprise the majority of employees (Table 19).
Table 19: Jobs created from Irish Potato processing
Indicator Overall
Distribution of EmployeesGender Age Groups
Men WomenYouth (18-35 Years)
Middle Aged (36-55)
Elderly (>55)
Employment:Mean 2.9 1.3 1.6 1.8 1 0.1Proportions (%) 45% 55% 62% 34% 4%
Source: Community and Market Survey of Irish Potato VC actors (May 2015).
4.5.4 Financing Irish Potato processing
The study shows that although the 30 processors interviewed obtain business loans from VSLAs, they largely rely on per-sonal savings. Indeed, even at the national level, the FINSCOPE III Survey 2013 findings indicated that the largest propor-tion of borrowers obtained funds from informal saving schemes (VSLAs). One major limitation of such lines of credit and financing is that the sizes of approved loans are usually smaller than required. Using the case of processors, we found that the maximum amount of money borrowed from VSLAs was 719,706 Uganda shillings only (Table 20).
Table 20: Sources of credit to processors
SourceProcessors using the source
Amount borrowed (UGx)Interest per month
Minimum MaximumPersonal Savings 30 (100%)VSLAS/ Informal Savings 17 (57%) 275,294 719,706 6.7SACCOs 2 (7%) 150,000 250,000 4.0Commercial Banks 3 (10%) 1,000,000 4,250,000 2.3
Source: Community and Market Survey of Irish Potato VC actors (May 2015).
This finding is similar to the FINSCOPE III Survey 2013 findings, which indicated that more than 85% of borrowers re-ceived loans not exceeding one million shillings. Obviously, processors have not exploited cheaper sources of financing for sizeable loans, notably commercial banks (see Table 20). The study found that only 10% of the surveyed processors had

In
ve
st
me
nt
O
pp
Or
tu
nI
tI
es
a
nd
C
ha
ll
en
ge
s
In
t
he
p
Ot
at
O
va
lu
e
Ch
aI
n
In
u
ga
nd
a
52
obtained loans from commercial banks, which is significantly lower than the 57% who have obtained loans from VSLAs. For those few processors that had borrowed from commercial banks, the maximum amount of the loan was 4,250,000 Uganda shillings, almost six times the maximum amount borrowed from VSLAs.
In addition to lending very small amounts, VSLAs charge a higher interest rate than commercial banks. The surveyed processors reported that VLSAs charged them interest of 6.65% per month, which is almost three times that charged by commercial banks (2.3% per month). This suggests that the processors experienced a huge funding constraint.
The interviewed processors reported that the reasons they use VSLAs and not other formal funding sources include the following: a) a lack of the collateral (usually land title) that is demanded by formal funders because most land in Uganda is not titled; and b) a fear of losing their collateral to the creditors.
Credit is necessary to finance investments in Irish Potato processing. To expand access to that credit, there is a need to sensitize value chain actors about the possibility of obtaining relatively affordable loans from commercial banks and MFIs, commercial banks should match the loan repayment periods with crop harvest times, and the government should capitalize the lines of credit that are easily accessed by different actors in the value chain, such as VSLAs.
4.5.5 Key Constraints in Irish Potato Processing
Seasonal Shortages in the Supply of Irish Potato The study assembles some evidence to show that a relatively large (63%) number of processors experience shortages in the Irish Potato supply during the off-season (Figure 38). This has implications for the general stability of the operations of the value addition component of the value chain, which itself has implications for the objective of up-grading the Irish Potato value chain in the Kigezi sub-region. Shortages in the ware Irish Potato supply stifle business operations that perform the trade function in the Irish Potato value chain (refer to Table 9, section 4.4.1).
There is a great need to expand capacity for storage infrastructure so that ware Irish Potato can be safely stored during the peak season and sold during the off-season. This would not only smooth the supply of Irish Potato but also curtail price fluctuations that hurt farmers. The Irish Potato zonal investment plan (ZIP) earmarks streamlining storage as one area of investment. Although Irish Potato processing is small-scale, the survey revealed that this part of the industry is growing. For instance, almost half of the 30 interviewed processors reported that the volumes of Irish Potato processed have increased over the last 3 years (i.e., since 2012), whereas only 23% reported a decline (see Figure 38).
Figure 38: Processors’ response (%) on adequacy in Irish Potato supplies across Seasons
Source: Community and Market Survey of Irish Potato VC actors (May 2015).

In
ve
st
me
nt
O
pp
Or
tu
nI
tI
es
a
nd
C
ha
ll
en
ge
s
In
t
he
p
Ot
at
O
va
lu
e
Ch
aI
n
In
u
ga
nd
a
53
The market survey results revealed that individual farmers are the main suppliers of ware Irish Potato that is processed (54%), 46% of which is supplied directly by individual farmers and 8% of which is supplied by farmer groups (Figure 39). This shows that group collective marketing by farmers remains limited. Middlemen (traders) supply sizeable amounts (32%) of the Irish Potato that is processed.
Figure 39: Sources of Processed Irish Potato
Source: Community and Market Survey of Irish Potato VC actors (May 2015).
Limited Supply of Irish Potato Varieties to Process The study also established that considering the many Irish Potato varieties produced and traded, only a limited number of Irish Potato varieties support substantive value addition. It seems that Kinigi and Rwangume are the two main options available for processing (Figure 40). The study found that one of the factors limiting value addition is that Kachport 1, the most preferred variety by processors, is supplied less often. The limited supply of Kachport 1 is rooted in the fact that among seed producers and farmers, it is one of the less-preferred Irish Potato varieties (see Figure 16c, Section 4.2.7). The reason is that Kachport 1 has limitations associated with the following issues: (i) it takes a long time to mature; (ii) it is susceptible to diseases, (iii) there is a limited supply of basic seed; and (iv) it has a low yield. All of these factors compound the problem in the supply of Irish Potato varieties to support industrial-level value addition in the Irish Potato value chain. The problem linked to the lack of Irish Potato varieties for processing at the industrial level was identified during a key informant interview with some of the staff working for the existing industrial-level Irish Potato processing plants in the Kigezi sub-region. These were the Kisoro Irish Potato Processing Industry (KPPIL) and the Business Incuba-tion and Value Addition Centre in Kabale district, as illustrated in Information Box 3.
Figure 40: Percentage of processors using a given variety
Source: Community and Market Survey of Irish Potato VC actors (May 2015).

In
ve
st
me
nt
O
pp
Or
tu
nI
tI
es
a
nd
C
ha
ll
en
ge
s
In
t
he
p
Ot
at
O
va
lu
e
Ch
aI
n
In
u
ga
nd
a
54
Box 3
: Fac
ilitie
s in
Kige
zi S
ub-r
egio
n In
tend
ed to
supp
ort I
ndus
trial
-Lev
el Ir
ish
Pota
to P
roce
ssin
g
Kiso
ro Ir
ish P
otat
o Pr
oces
sing I
ndus
try (K
PPIL
)
Busin
ess I
ncub
ation
and
Irish
Pot
ato
Valu
e Ad
ditio
n Ce
ntre
in K
abal
e di
stric
t

In
ve
st
me
nt
O
pp
Or
tu
nI
tI
es
a
nd
C
ha
ll
en
ge
s
In
t
he
p
Ot
at
O
va
lu
e
Ch
aI
n
In
u
ga
nd
a
55
Box 4: Challenges associated with processing Irish Potato Varieties
The high demand for Kachpot 1 (in Pic 1) is explained by its high dry matter content and smooth red skin, which is suitable for making crisps (Pic 2). Some industries, such as those owned by Uganda Industries Research Institute (UIRI), process Irish Potatoes into quality crisps branded ‘EMONDI’ (Box 3). However, an inadequate supply of Kachpot1 Irish Potato variety was cited as a major constraint on the value-added business operations of UIRI. Varieties such as Victoria (Pic 3) are unsuitable for processing crisps because they have a low level of dry matter and “deep eyes” that lead to wastage when peeling. Other varieties such as Kinigi are unsuitable for industrial-level processing. However, the crisp produced using Kinigi are poor quality because of ‘blemish rings colouring’ (Pic 4).
Pic 1: Kachpot1 has a Smooth & Red Skinned Variety with high dry matter content that is preferred in the Making of Crisps
Pic 2 Irish Potato variety that produces colouration in chips.
Pic 3: Deep-eyed Irish Potato varieties with low dry matter content such as Victoria are not preferred by processers.
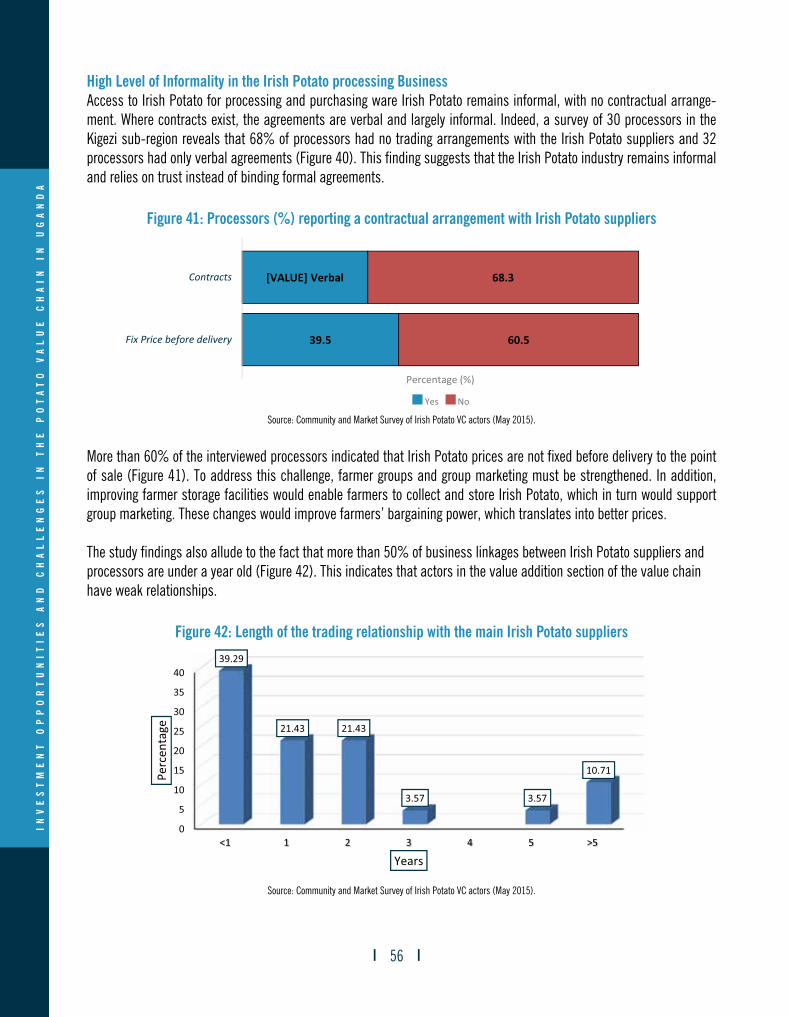
In
ve
st
me
nt
O
pp
Or
tu
nI
tI
es
a
nd
C
ha
ll
en
ge
s
In
t
he
p
Ot
at
O
va
lu
e
Ch
aI
n
In
u
ga
nd
a
56
High Level of Informality in the Irish Potato processing BusinessAccess to Irish Potato for processing and purchasing ware Irish Potato remains informal, with no contractual arrange-ment. Where contracts exist, the agreements are verbal and largely informal. Indeed, a survey of 30 processors in the Kigezi sub-region reveals that 68% of processors had no trading arrangements with the Irish Potato suppliers and 32 processors had only verbal agreements (Figure 40). This finding suggests that the Irish Potato industry remains informal and relies on trust instead of binding formal agreements.
Figure 41: Processors (%) reporting a contractual arrangement with Irish Potato suppliers
Source: Community and Market Survey of Irish Potato VC actors (May 2015).
More than 60% of the interviewed processors indicated that Irish Potato prices are not fixed before delivery to the point of sale (Figure 41). To address this challenge, farmer groups and group marketing must be strengthened. In addition, improving farmer storage facilities would enable farmers to collect and store Irish Potato, which in turn would support group marketing. These changes would improve farmers’ bargaining power, which translates into better prices.
The study findings also allude to the fact that more than 50% of business linkages between Irish Potato suppliers and processors are under a year old (Figure 42). This indicates that actors in the value addition section of the value chain have weak relationships.
Figure 42: Length of the trading relationship with the main Irish Potato suppliers
Source: Community and Market Survey of Irish Potato VC actors (May 2015).

In
ve
st
me
nt
O
pp
Or
tu
nI
tI
es
a
nd
C
ha
ll
en
ge
s
In
t
he
p
Ot
at
O
va
lu
e
Ch
aI
n
In
u
ga
nd
a
57
The findings in this section of this report indicate a weak but growing processing industry. The high potential of the processing segment of the value chain presents a good investment opportunity that, if exploited, could transform Irish Potato production.
Figure 43: Observed Trends in the volume of processed Irish Potato over the past 3 years
Source: Community and Market Survey of Irish Potato VC actors (May 2015).
4.6 Gross Margins Analysis in the Irish Potato value chain
The survey elicited information on the costs and revenues at different levels of the Irish Potato value chain. Table 21 shows the prices and gross margins from the 120-kg bag that each actor sells. On average, farmers earn less than traders and processors in terms of gross profits and prices. Farmers sell a 120-kg bag of Irish Potatoes for approximately 82,000 Uganda Shillings (Ugx), traders sell the same bag for Ugx 115,000, and processors sell crisps worth Ugx 304,524 from one bag. This suggests that value addition increases the gains from Irish Potato production and implies that the potential income earned by actors along the Irish Potato value chain can improve with high farm productivity, growth in trade busi-nesses, and value addition through processing (Table 21).
Table 21: Gross Margins at different segments of the value chain (per 120-kg bag)
Financial Indicator Farmers Traders Processor (Crisps Makers)Total revenue per bag 82,000 114,962 304,524Total cost per bag 29,949 104,195 94,013Gross profits per bag 52,051 10,767 210,511120-kg bags produced/traded/processed 18 179 7.7Observation (n) 422 30 30
Source: Computed by authors using PASIC value chain data, 2015.

In
ve
st
me
nt
O
pp
Or
tu
nI
tI
es
a
nd
C
ha
ll
en
ge
s
In
t
he
p
Ot
at
O
va
lu
e
Ch
aI
n
In
u
ga
nd
a
58
5. CONCLUSIONS AND POLICY RECOMMENDATIONSThe study establishes that an increase in the Irish Potato yield from the 7 metric tons per hectare recorded in Uganda to the recommended optimal yield of 21 metric tons per hectare would lead to an increase in annual Irish Potato production from 800 thousand metric tons to 2,300 thousand metric tons. This would increase the value of Irish Potato produced in the country from Ugx 580 billion (USD 175 million) to Ugx 1,700 billion (USD 504 million) per annum and implies that poor yields in Irish Potato production lead to an annual loss in agricultural revenues estimated at approximately Ugx 1,080 billion (USD 330 million) in the Kigezi sub-region.
Uganda’s yield remains low partially because of a low supply of improved seed Irish Potatoes. Indeed, there is a 66% (17,000 metric tons) gap (valued at approximately Ugx 18 billion) in Uganda’s supply of improved seed Irish Potato. The poor yields resulting from low levels of intensification are partially an outcome of the inadequate transfer and uptake of quality inputs—i.e., fertilizers, agro-chemicals and seed Irish Potato within the farming communities.
The study also shows that the private sector is increasingly playing a key role in supplementing the limited public capac-ity at KAZARDI in the production of seed Irish Potato through the private seed Irish Potato multiplier program. There is awareness within farming communities that high quality, appropriately sized Irish Potatoes are highly demanded by both traders and processors, attracting a favourable market price.
The study establishes that seed Irish Potato multipliers and farmers prefer to grow Irish Potato varieties with five at-tributes: early maturity, marketability, disease resistance, basic seed Irish Potato availability and high yielding. Currently, farmers produce more than 11 varieties, of which only six—Kinigi, Rwangume, Rwashaki, Rutuku, Mumba and Victoria—make it to the mid-stream marketing and down-stream processing levels of the chain. In any event, the three most highly valued Irish Potato varieties traded in the Kigezi sub-region are Kinigi, Rwangume, and Rwashaki.
Traders are identified as the most influential (lead) actors with respect to determination of the volume, quality, and pric-ing of ware Irish Potatoes at the midstream marketing level of the value chain. However, Irish Potato traders are affected by periodic shortages in the supply of ware Irish Potato during the off-season. This has a knock-on effect on the entire value chain, especially processors who depend on a reliable supply of ware Irish Potato. The quality of ware Irish Potatoes supplied is also a matter of concern. On average, only 69% of Irish Potatoes traded in the Kigezi sub-region are of the appropriate quality.
The study shows the presence of institutional linkages at the marketing level of the value chain that are characterized by informal business relationships with few written contracts. For example, written contracts would take the form of price determination before delivery, booking a supply before harvest and pre-financing in the form of cash credit, advances of packaging materials to farmers and agro-chemical inputs. Importantly, most (60%) of these informal trade linkages have existed for as long as 6 years or more.
Although farmer institutions such as farmer groups and agribusiness clusters do exist within farming communities, their capacity to galvanize the required effort to support the group marketing and processing (value addition) components of the value chain was weak. The report reveals that the IFDC is the only external enabler to have adopted the value chain approach to strengthening farmer groups.

In
ve
st
me
nt
O
pp
Or
tu
nI
tI
es
a
nd
C
ha
ll
en
ge
s
In
t
he
p
Ot
at
O
va
lu
e
Ch
aI
n
In
u
ga
nd
a
59
Product diversification in Irish Potato processing remains minimal, specializing in only two products: chips (75%) and crisps (25%). It was noted that the limited supply of Irish Potato varieties such as Kachpot 1 (the most suitable variety for processing) is holding back industrial-level value addition. Nevertheless, the study shows incremental growth in Irish Potato processing businesses over time.
Recommendations:To exploit the potential annual revenues, there is a need to leverage activities at the production level of the Irish Potato value chain by fast-tracking the promotion of farm-level crop intensification in the Kigezi sub-region. To achieve this goal, and based on the study results, we recommend a two-pronged approach:
1. Investments (both public and private) should be directed towards narrowing the gap in the seed Irish Potato supply by (i) expanding the production capacity of basic seed Irish Potato at KAZARDI; (ii) intensifying the de-centralization of seed Irish Potato multiplication by expanding and replicating IFDC-initiated efforts to construct screen houses to enable more farmers, in all of the sub-counties across the three districts (Kabale, Kisoro and Kanungu), to become foundation Irish Potato seed multipliers; and (iii) giving high priority to producing seeds for robust, market-demanded Irish Potato varieties—i.e., Kinigi, Rwangume and Victoria—and other varieties that can support industrial-scale processing businesses.
2. Modalities to build the capacity of the agro-input dealerships (with ownership embedded within Irish Potato farming communities) need to be instituted to supply adequate amounts of requisite inputs (fungicides, fertiliz-ers, and other critical chemicals) in Irish Potato production. This can be operationalized by promoting group sav-ings schemes to provide seed capital to purchase quality guaranteed inputs in bulk. Such saving schemes can be turned into Irish Potato production Savings and Credit Cooperative Societies (SACCOs) that extend financial services to farmers at relatively lower interest rates, parallel to the formal lenders (such as commercial banks) highlighted by this study.
The study recommends the training of farmers in the use of yield-enhancing technologies (such as improved seed, fertil-izers and agro-chemicals) to enhance the production of Irish Potatoes of the right grade, which considers size, variety and maturity.
There is a need to upgrade infrastructure—and more importantly, community stores—that support the functionality of the traders who are the key actors throughout the Irish Potato value chain. Therefore, the area of focus in upgrading and adding value to ware Irish Potato traded in the zonal investment plan (ZIP) should focus on the following three aspects: (1) quality enhancement in terms of size, variety and maturity; (2) proper handling of Irish Potatoes to reduce damage by supporting investments in building community stores; and (3) increased seed multiplication of tradable varieties, for example, Kinigi, Rwangume, and Rwashaki.
There is a need to strengthen community-level institutions that support the marketing function of traders that places farmers’ business interests at the forefront. This can be accomplished by identifying traders with a successful and proven track records in conducting credible businesses with front-end ware Irish Potato suppliers (mainly farmers) along these informal trading relationships. Such trusted traders within the farming communities can be entrusted in the management of community stores proposed to be incorporated in the Irish Potato zonal investment plan (ZIP). In addition, such stores can be upgraded to benefit from the warehouse receipt system that the government is supporting.

In
ve
st
me
nt
O
pp
Or
tu
nI
tI
es
a
nd
C
ha
ll
en
ge
s
In
t
he
p
Ot
at
O
va
lu
e
Ch
aI
n
In
u
ga
nd
a
60
There is a great deal of opportunity and value lost given the low level of processing in the Irish Potato sub-sector; this situation is primarily attributed to the lack of appropriate Irish Potato varieties. This gap needs to be plugged through increased R&D to quickly identify suitable Irish Potato varieties that conform to both farmers’ selection criteria and in-dustrial processors’ business needs.

In
ve
st
me
nt
O
pp
Or
tu
nI
tI
es
a
nd
C
ha
ll
en
ge
s
In
t
he
p
Ot
at
O
va
lu
e
Ch
aI
n
In
u
ga
nd
a
61
ReferencesBammann, H., (2007). Participatory value chain analysis for improved farmer incomes, employment opportunities and
food security, Pacific Economic Bulletin Volume 22 Number 3, Apia.M4P (2008). Making Value Chain Work Better for the Poor: A tool book for practitioners of value Chain Analysis. Version
3. Agricultural Development International: Phnom Penh, Cambodia.Bonabana-Wabbi, J., Ayo, S., Mugonola, B., Taylor, D.B., Kirinya, J. & Tenywa, M. (2013). The performance of Irish Potato
markets in south western Uganda. Journal of Development and Agricultural Economics, 5(6), pp. 225 – 235. Burton, (1989) In Emana, Bezibih and Nigussie, Mengistu (October 2011). Irish Potato Value Chain Analysis and Devel-
opment in Ethiopia. Case of Tigray and SNNP Regions. Supported by UASID, International Irish Potato Center (CIP-Ethiopia) c/O ILRI, Box 5689, Addis Ababa, Ethiopia; Tel +251 614 2290; www.ciIrish Potato.org.
Carswell, G. (1997). Agricultural intensification and rural sustainable livelihoods: A ‘think piece’, Institute of Development Studies Working Paper 64.
CGIAR (2014). Business Plan for Going to Scale with Quality Seed Irish Potato: Workshop Report. June 12-13, 2014, Masai Lodge, Nairobi, Kenya.
Desilles, S. (1999). Sustaining and managing private natural resources: the way to step out of the cycle of high-input agriculture. Paper for Conference on “Sustainable Agriculture: New Paradigms and Old Practices?” Bellagio Conference Center, Italy, 26-30 April, 1999.
Emana, Bezibih and Nigussie, Mengistu (October 2011). Irish Potato Value Chain Analysis and Development in Ethiopia. Case of Tigray and SNNP Regions. Supported by UASID, International Irish Potato Center (CIP-Ethiopia) c/O ILRI, Box 5689, Addis Ababa, Ethiopia; Tel +251 614 2290; www.ciIrish Potato.org.
FAO Uganda (April – June 2012). Improving Food Security in Cross-border Districts of Kabale, Kisoro and Kasese. FAO Uganda Information Bulletin, FAO-FIAT PANIS.
FAO Stats 2014. http://data.fao.org/database?entryId=262b79ca-279c-4517-93de-ee3b7c7cb553Ferris, R.S.B., Okoboi, G., Crissman C., Ewell, P. & Lemaga, B. (2001). Uganda’s Irish Irish Potato sector. Report prepared
for Government of Uganda’s Conference on Competitiveness of Selected Strategic Exports. IITA-FOODNET, CIP, PRAPACE CGIAR and ASARECA
Gildemacher, P.R., Kaguongo, W., Ortiz, O., Tesfaye, A. Woldegiorgis, G., Wagoire, W.W., Kakuhenzire, R., Kinyae, PM. Nyongesa, M., Struik P.C. and Leeuwis, C. (2999). Improving Irish Potato Production in Kenya, Uganda and Ethiopia: A System Diagnosis. Irish Potato Research (2009) 52: 173-205. DOI 10.1007/s 11540-009-9127-4.
Heong, K.L., Escalada, M.M., Huan, N.H., Chien, H.V. & Quynh, P.V. (2010). Scaling out communication to rural farmers – Lessons from the “Three Reductions, Three Gains” campaign in Vietnam. In F. Palis, G. Singleton, & M. Ca-simero (eds.) Research to Impact: Case Studies for Natural Resources Management of Irrigated Rice in Asia. International Rice Research Institute, Loa Banos, Philippines.
Hoeffler Heike (2005). Promoting The Kenyan Irish Potato Value Chain: Can Contract Farming Help Build Trust and Reduce Transaction Risks? Paper prepared for presentation at the 99th EAAE Seminar ‘Trust and Risks in Business Networks, February 8-10, 2006, Bonn, Germany. Copyright (2005). Ministry of Agriculture, P.O. Box 41607, 00100 Nairobi, Kenya [email protected] or [email protected]
Jones, K. (1999). Integrated pest and crop management in Sri Lanka. Paper for Conference on “Sustainable Agriculture: New Paradigms and Old Practices?”, Bellagio Conference Center, Italy, 26-30 April, 1999.
Kabir, H. & Uphoff, N. 2007. Results of Disseminating the System of Rive Intensification with Farmer Field Schools in Northern Myanmar. Experimental Agriculture, (43), pp 463-476.
Kaplinsky. R (1999). Globalisation and Unequalization: What ca be learned from Value Chain Analysis. Journal of Devel-opment Studies, 37 (2): 117-146.

In
ve
st
me
nt
O
pp
Or
tu
nI
tI
es
a
nd
C
ha
ll
en
ge
s
In
t
he
p
Ot
at
O
va
lu
e
Ch
aI
n
In
u
ga
nd
a
62
Kaplinsky, R., and Morris M., (2001), A Handbook for Value Chain Research. Brighton, United Kingdom, Institute of Development Studies, University of Sussex.
Kato, J. (2015). The Dutch Way of growing Irish Potatoes. New Vision, Monday December 7, 2015. www.newvision.co.ug/news/667683-the- dutch-way-of-growing-Irish Potatoes.html.
MAAIF (Ministry of Agriculture, Animal, Industry and Fisheries), 2010. Agriculture Sector Development Strategy and In-vestment Plan: 2010/11 – 2014/15.
MAAIF (Ministry of Agriculture, Animal, Industry and Fisheries), 2012. Proposed plan to operationalise the Non-ATAAS component of the Agriculture Sector Development Strategy and Investment Plan.
MAAIF (2011). Statistical Abstract. Agricultural Planning Department. Ministry of Agriculture Animal Husbandry and Fisheries (MAAIF). Entebbe, Uganda.
NAADS (2015). Agricultural Technology and Agribusiness Advisory Services (ATAAS). Baseline Survey Report 2015. National Agricultural Advisory Services.
NPA (2010). National Development Plan (NDP) 2010/11-2014/15. The National Planning Authority (NPA), P O Box 21434, Kampala, wwww.npa.ug.
Okoboi G. & Ferris, R.S.B. (2002). The export marketing potential of seed and ware Irish Potatoes in Uganda, Tanzania and Kenya with respect to the Rwandan market. IITA – FOODNET, pp. 57.
Shaheen, N. (2012). The Irish Irish Potato Business-In-Box. Piloting the New Project in Hoima. Village Enterprise. Avail-able at: <http://villageenterprise.org/archives/2100>
TRIAS (2012). Uganda’s Rice sub-sector analysis. Report prepared for TRIAS by SMJR Consult.Uganda Bureau of Statistics 2010, Uganda Census of Agriculture 2008/09. Van der Meer, L., Kees, C., (2006). Exclusion of small-scale farmers from coordinated supply chains, in: Hoeffler Heike
(2005).Wanene, G. 2011). Agricultural Value Chains and Agricultural Policy. Youth Agro-Environmental Initiative. http://yagrein.
blogspot.com/2011/09/blog –article – agriculture –value –chains.htmlWorld Bank (1993). Growing out of poverty: A World Bank Country Study (Uganda). World Bank, Washington D.C

In
ve
st
me
nt
O
pp
Or
tu
nI
tI
es
a
nd
C
ha
ll
en
ge
s
In
t
he
p
Ot
at
O
va
lu
e
Ch
aI
n
In
u
ga
nd
a
63
AppendixA: Production
Table 1A: Key Facts about Community Irish Potato Farmer Group Institutions
Focus Group Attributes Mean Percentage (%) Frequency (n)Legal Status of groups
• Registered 69.7 106• Not registered 30.3 46
Total 152Registrations Authority
• District 24.5• Sub-county 69.8• Town Council 5.7
Group Composition by Gender • Male 9.0• Females 16.0• Group Size 24.0
Age and Farming Experience:• Age 40.9• Farming Experience 11.9
Source: PASIC Community and Market Survey of Irish Potato VC actors (May, 2015)
Table 2A: Categorization of Irish Potato Varieties
Irish Potato Variety Response about whether Irish Potato variety is local or Improved
Local Improved Total ObservationsVictoria 10.9 89.1 100 46Rwangume 22.5 77.6 100 49Kinigi 20.9 79.1 100 43Rutuku - 100.0 100 7Rwashaki 52.6 47.4 100 19Sutama 100.0 - 100 13Mitare 100.0 - 100 1Kimuli 100.0 - 100 12Mumba 92.9 7.1 100 14Cruza 100.0 - 100 4Kachport - 100.0 100 3Others 88.9 11.1 100 9

In
ve
st
me
nt
O
pp
Or
tu
nI
tI
es
a
nd
C
ha
ll
en
ge
s
In
t
he
p
Ot
at
O
va
lu
e
Ch
aI
n
In
u
ga
nd
a
64
Table 3A: Responses (%) from Community level Rankings of (most preferred) varieties
Irish Potato Variety
Ranking according to the most preferred[Likert scale; One =1 for preferred]
Total % N
1 2 3 4 5 6 7Victoria 10.9 32.6 19.6 21.7 15.2 - - 100 46Rwangume 53.1 26.5 16.3 2.0 - 2.0 - 100 49Kinigi 34.9 20.9 20.9 7.0 16.3 - - 100 43Rutuku 14.3 28.6 28.6 28.6 - - - 100 7Rwashaki 10.5 36.8 10.5 31.6 10.5 - - 100 19Sutama - 15.4 30.8 38.5 7.7 7.7 - 100 13Mitare - - - 100.0 - - - 100 1Kimuli 16.7 8.3 41.7 33.3 - - - 100 12Mumba 7.1 7.1 21.4 35.7 28.6 - - 100 14Cruza - - - 50.0 - 25.0 25.0 100 4Kachport - - - 66.7 33.3 - - 100 3Others - - 22.2 33.3 33.3 11.1 - 100 9Nakpot1 - - - 100.0 - - - 100 1
Source: PASIC Community and Market Survey of Irish Potato VC actors (May, 2015)
KabaleIrish Potato
VarietyRanking according to the most preferred Total % N
1 2 3 4 5 6Victoria 9.1 36.4 22.7 27.3 4.6 - 100 22Rwangume 60.9 21.7 17.4 - - - 100 23Kinigi 13.6 18.2 27.3 9.1 31.8 - 100 22Rutuku - - - 100.0 - - 100 1Rwashaki 11.1 44.4 - 44.4 - - 100 9Sutama - - - - 100.0 - 100 1Kimuli 18.2 9.1 45.5 27.3 - - 100 11Mumba 7.7 7.7 15.4 38.5 30.8 - 100 13Cruza - - - - - 100.0 100 1Kachport1 - - - 100.0 - - 100 1
KisoroIrish Potato
VarietyRanking according to the most preferred Total
%N
1 2 3 4 5 6 7Victoria - 11.1 22.2 11.1 55.6 - - 100 9Rwangume - 58.3 25.0 8.3 - 8.3 - 100 12Kinigi 92.3 - 7.7 - - - - 100 13Rwashaki 11.1 33.3 11.1 22.2 22.2 - - 100 9Sutama - 16.7 33.3 41.7 - 8.3 - 100 12Mitare - - - 100.0 - - - 100 1
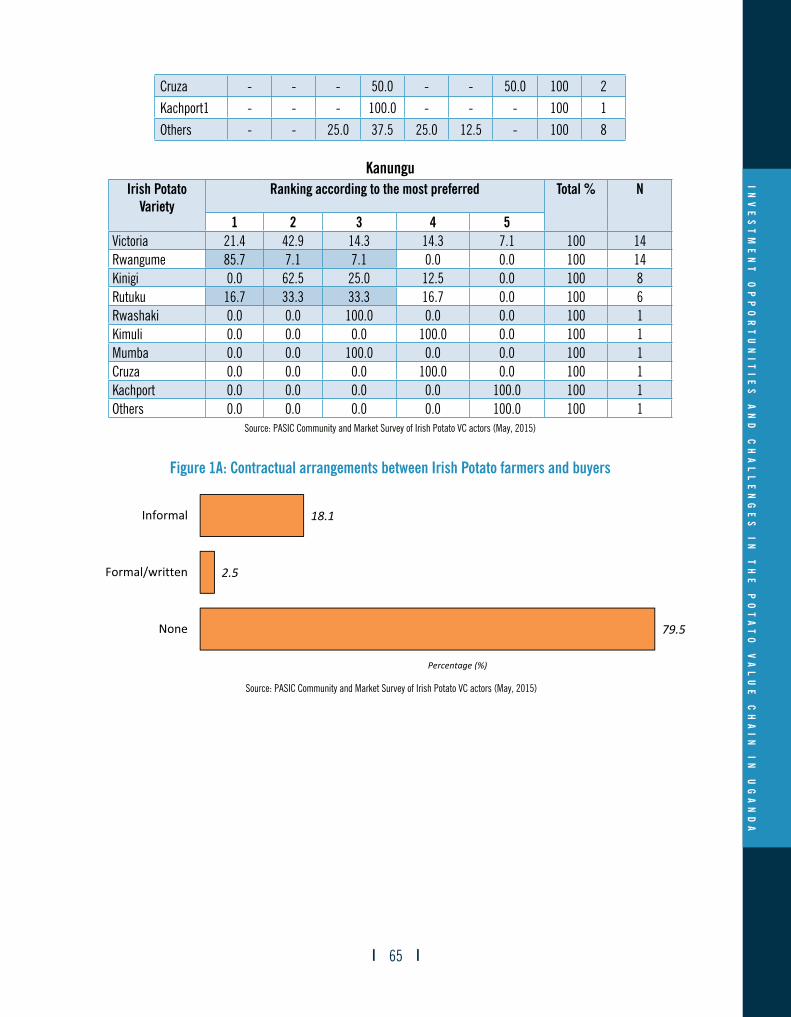
In
ve
st
me
nt
O
pp
Or
tu
nI
tI
es
a
nd
C
ha
ll
en
ge
s
In
t
he
p
Ot
at
O
va
lu
e
Ch
aI
n
In
u
ga
nd
a
65
Cruza - - - 50.0 - - 50.0 100 2Kachport1 - - - 100.0 - - - 100 1Others - - 25.0 37.5 25.0 12.5 - 100 8
KanunguIrish Potato
VarietyRanking according to the most preferred Total % N
1 2 3 4 5Victoria 21.4 42.9 14.3 14.3 7.1 100 14Rwangume 85.7 7.1 7.1 0.0 0.0 100 14Kinigi 0.0 62.5 25.0 12.5 0.0 100 8Rutuku 16.7 33.3 33.3 16.7 0.0 100 6Rwashaki 0.0 0.0 100.0 0.0 0.0 100 1Kimuli 0.0 0.0 0.0 100.0 0.0 100 1Mumba 0.0 0.0 100.0 0.0 0.0 100 1Cruza 0.0 0.0 0.0 100.0 0.0 100 1Kachport 0.0 0.0 0.0 0.0 100.0 100 1Others 0.0 0.0 0.0 0.0 100.0 100 1
Source: PASIC Community and Market Survey of Irish Potato VC actors (May, 2015)
Figure 1A: Contractual arrangements between Irish Potato farmers and buyers
Source: PASIC Community and Market Survey of Irish Potato VC actors (May, 2015)

In
ve
st
me
nt
O
pp
Or
tu
nI
tI
es
a
nd
C
ha
ll
en
ge
s
In
t
he
p
Ot
at
O
va
lu
e
Ch
aI
n
In
u
ga
nd
a
66
Figure 2A: Irish Potato Yield (MT/HA) Comparisions Across Countries
Source: FAO Stat (2014)

In
ve
st
me
nt
O
pp
Or
tu
nI
tI
es
a
nd
C
ha
ll
en
ge
s
In
t
he
p
Ot
at
O
va
lu
e
Ch
aI
n
In
u
ga
nd
a
67
Tabl
e 4A
: Im
pute
d, Yi
eld,
Act
ual a
nd P
oten
tial P
rodu
ctio
n, a
nd In
dica
tive
Valu
e of
Iris
h Po
tato
Pro
duce
d in
Uga
nda
Prod
uctio
n In
dica
tors
On-
Stati
onQ
ualit
y Se
ed +
so
rting
+ F
ertil
izer
appl
icati
on
Qua
lity
Seed
+sor
ting+
N
o Fe
rtiliz
er
appl
icati
on
Poor
Qua
lity
Seed
+sor
ting
+ Fe
rtiliz
er a
pplic
ation
Poor
Qua
lity
Seed
+sor
ting+
N
o Fe
rtiliz
er
appl
icati
on
Nati
onal
Ave
rage
(NAA
DS, 2
015)
Yiel
d 2
5.0
16.
5 1
1.1
8.4
6
.4
4.8
Area
(Ha)
135
,400
1
35,4
00
135
,400
1
35,4
00
135
,400
1
35,4
00
Prod
uctio
n (M
t) 3
,385
,000
2
,234
,100
1
,502
,940
1
,137
,360
8
66,5
60
649
,920
%
Cha
nge
in
prod
uctiv
ity (4
.8 M
T/Ha
ATA
AS n
ation
al
yiel
d) a
s Bas
e
420
.83
243
.75
131
.25
75.
00
33.
33
% C
hang
e in
pr
oduc
tivity
(6.4
MT/
Ha) a
s Bas
e 2
90.6
3 1
57.8
1 7
3.44
3
1.25
Aver
age
Valu
e (U
gx)
per 1
20kg
bag
86,
941
86,
941
86,
941
86,
941
86,
941
86,
941
Valu
e (U
gx) p
er M
T 7
24,5
04
724
,504
7
24,5
04
724
,504
7
24,5
04
724
,504
Annu
al V
alue
(Ugx
) of
Irish
Pot
ato
prod
uced
2,4
52,4
46,0
40,0
00 1
,618
,614
,386
,400
1,0
88,8
86,0
41,7
60 8
24,0
21,8
69,4
40
627
,826
,186
,240
4
70,8
69,6
39,6
80
USD
734
,265
,281
.44
484
,615
,085
.75
326
,013
,784
.96
246
,713
,134
.56
187
,971
,912
.05
140
,978
,934
.04
5
20.8
3 3
43.7
5 2
31.2
5 1
75.0
0 1
33.3
3
Sour
ce: A
utho
r’s c
ompu
tatio
ns b
ased
on
PASI
C ag
rono
mic
surv
ery d
ata
(IITA
, 201
5) &
NAA
DS (2
015)
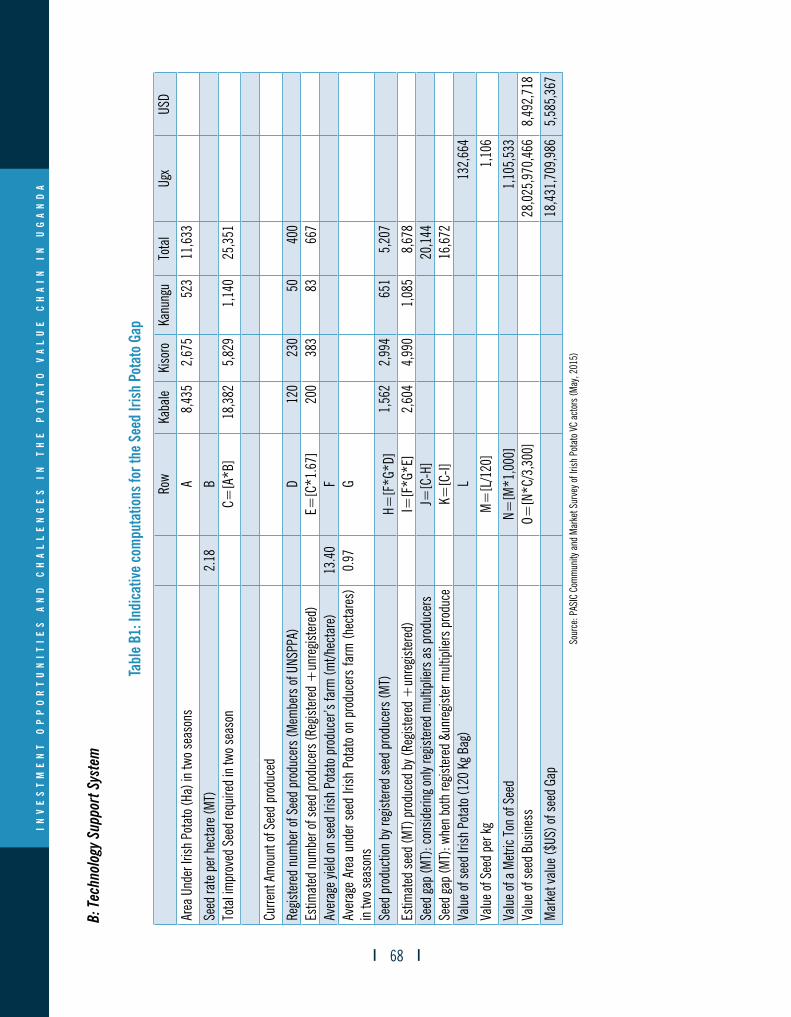
In
ve
st
me
nt
O
pp
Or
tu
nI
tI
es
a
nd
C
ha
ll
en
ge
s
In
t
he
p
Ot
at
O
va
lu
e
Ch
aI
n
In
u
ga
nd
a
68
B: T
echn
olog
y Sup
port
Sys
tem
Tabl
e B1
: Ind
icat
ive
com
puta
tions
for t
he S
eed
Irish
Pot
ato
Gap
Row
Kaba
leKi
soro
Kanu
ngu
Tota
lUg
xUS
D
Area
Und
er Ir
ish P
otat
o (Ha
) in
two s
easo
nsA
8,43
52,
675
523
11,6
33
Seed
rate
per
hec
tare
(MT)
2.18
BTo
tal im
prov
ed S
eed
requ
ired
in tw
o sea
son
C=[A
*B]
18,3
825,
829
1,14
025
,351
Curre
nt A
mou
nt of
See
d pr
oduc
ed
Regis
tere
d nu
mbe
r of S
eed
prod
ucer
s (M
embe
rs of
UNS
PPA)
D12
023
050
400
Estim
ated
num
ber o
f see
d pr
oduc
ers (
Regis
tere
d +
unre
giste
red)
E=[C
*1.6
7]20
038
383
667
Aver
age y
ield
on se
ed Ir
ish P
otat
o pro
duce
r’s fa
rm (m
t/hec
tare
)13
.40
FAv
erag
e Ar
ea u
nder
see
d Iri
sh P
otat
o on
pro
duce
rs fa
rm (h
ecta
res)
in
two s
easo
ns0.
97G
Seed
pro
duct
ion b
y reg
ister
ed se
ed p
rodu
cers
(MT)
H=[F
*G*D
]1,
562
2,99
465
15,
207
Estim
ated
seed
(MT)
pro
duce
d by
(Reg
ister
ed +
unre
giste
red)
I=[F
*G*E
]2,
604
4,99
01,
085
8,67
8Se
ed ga
p (M
T): c
onsid
erin
g onl
y reg
ister
ed m
ultip
liers
as p
rodu
cers
J=[C
-H]
20,1
44Se
ed ga
p (M
T): w
hen
both
regis
tere
d &u
nreg
ister
mul
tiplie
rs p
rodu
ceK=
[C-I]
16,6
72Va
lue o
f see
d Iri
sh P
otat
o (12
0 Kg
Bag
)L
132,
664
Valu
e of S
eed
per k
gM
=[L
/120
]1,
106
Valu
e of a
Met
ric To
n of
See
dN=
[M*1
,000
]1,
105,
533
Valu
e of s
eed
Busin
ess
O=[N
*C/3
,300
]28
,025
,970
,466
8,49
2,71
8
Mar
ket v
alue
($US
) of s
eed
Gap
18,4
31,7
09,9
865,
585,
367
Sour
ce: P
ASIC
Com
mun
ity a
nd M
arke
t Sur
vey o
f Iris
h Po
tato
VC
acto
rs (M
ay, 2
015)

In
ve
st
me
nt
O
pp
Or
tu
nI
tI
es
a
nd
C
ha
ll
en
ge
s
In
t
he
p
Ot
at
O
va
lu
e
Ch
aI
n
In
u
ga
nd
a
69
Figure 1B: Size, Yield and Production characteristics of Seed Irish Potato Farm
Source: PASIC Community and Market Survey of Irish Potato VC actors (May, 2015)
020
4060
80
Per
cent
0 2 4 6
Land Under Seed Potato (Acres)
020
4060
Per
cent
0 50 100 150 200 250
Volume of Seed Potato Produced (120Kg Bags)
Volume Produced
010
2030
40
Per
cent
0 50 100 150Yield (120Kg Bags/Acre)
Yield

In
ve
st
me
nt
O
pp
Or
tu
nI
tI
es
a
nd
C
ha
ll
en
ge
s
In
t
he
p
Ot
at
O
va
lu
e
Ch
aI
n
In
u
ga
nd
a
70
Figure 2B: Enlisted main challenges encountered by seed Irish Potato multipliers
Source: PASIC Community and Market Survey of Irish Potato VC actors (May, 2015)
When tasked to propose or suggest solutions to challenges, seed multipliers suggestions included: (i) support to build storage facilities; (ii) have access to quality inputs on the markets; (iii) the need for more research into pest and dis-ease resistant varieties; (iv) avail more improved seed on the market by encouraging more foundation seed multipliers/research centres in the district (v) reduce taxes on agriculture inputs; and (vi) improve road network.
C: Marketing
Figure 1C: Responses (%) on contracting during ware Irish Potato transactions
Source: PASIC Community and Market Survey of Irish Potato VC actors (May, 2015)

In
ve
st
me
nt
O
pp
Or
tu
nI
tI
es
a
nd
C
ha
ll
en
ge
s
In
t
he
p
Ot
at
O
va
lu
e
Ch
aI
n
In
u
ga
nd
a
71
Figure 2C: Price differential, and Traders’ estimate (%) of quality of ware Irish Potato marketed
Source: PASIC Community and Market Survey of Irish Potato VC actors (May, 2015)
Figure 3C: Ware Irish Potato Stock Holding Period (Days)
Source: PASIC Community and Market Survey of Irish Potato VC actors (May, 2015)
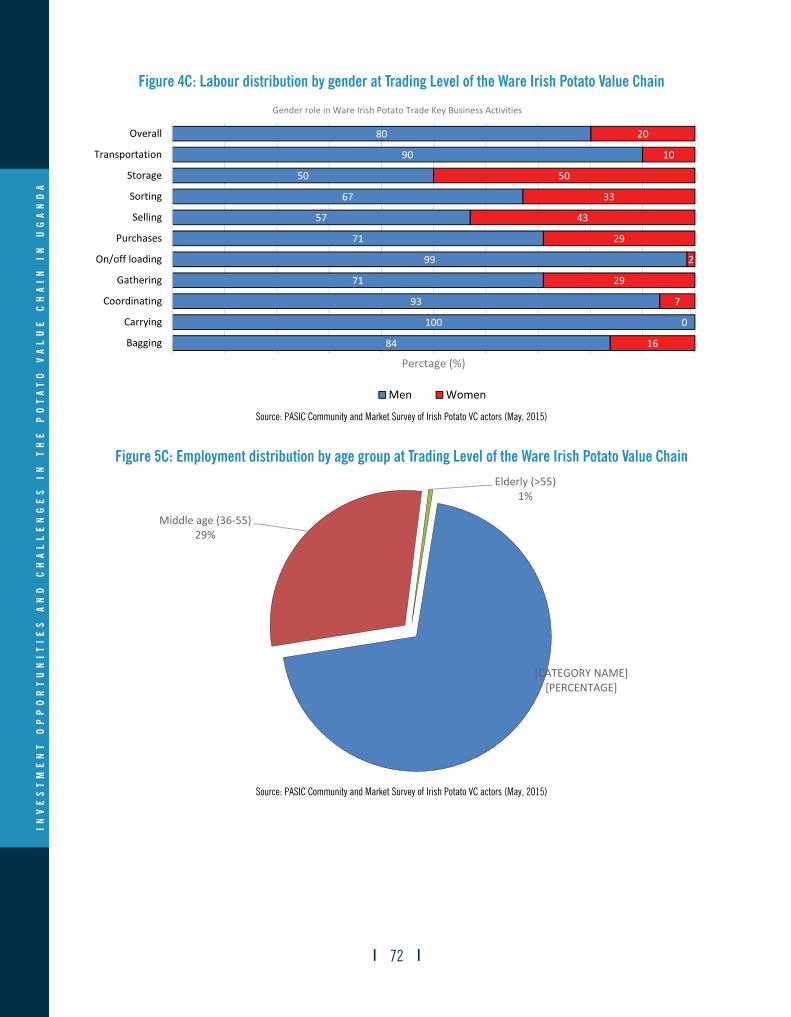
In
ve
st
me
nt
O
pp
Or
tu
nI
tI
es
a
nd
C
ha
ll
en
ge
s
In
t
he
p
Ot
at
O
va
lu
e
Ch
aI
n
In
u
ga
nd
a
72
Figure 4C: Labour distribution by gender at Trading Level of the Ware Irish Potato Value Chain
Source: PASIC Community and Market Survey of Irish Potato VC actors (May, 2015)
Figure 5C: Employment distribution by age group at Trading Level of the Ware Irish Potato Value Chain
Source: PASIC Community and Market Survey of Irish Potato VC actors (May, 2015)

In
ve
st
me
nt
O
pp
Or
tu
nI
tI
es
a
nd
C
ha
ll
en
ge
s
In
t
he
p
Ot
at
O
va
lu
e
Ch
aI
n
In
u
ga
nd
a
73


