investment manager summary management assets...apr 11, 2018 · these materials are directed at...
TRANSCRIPT
11
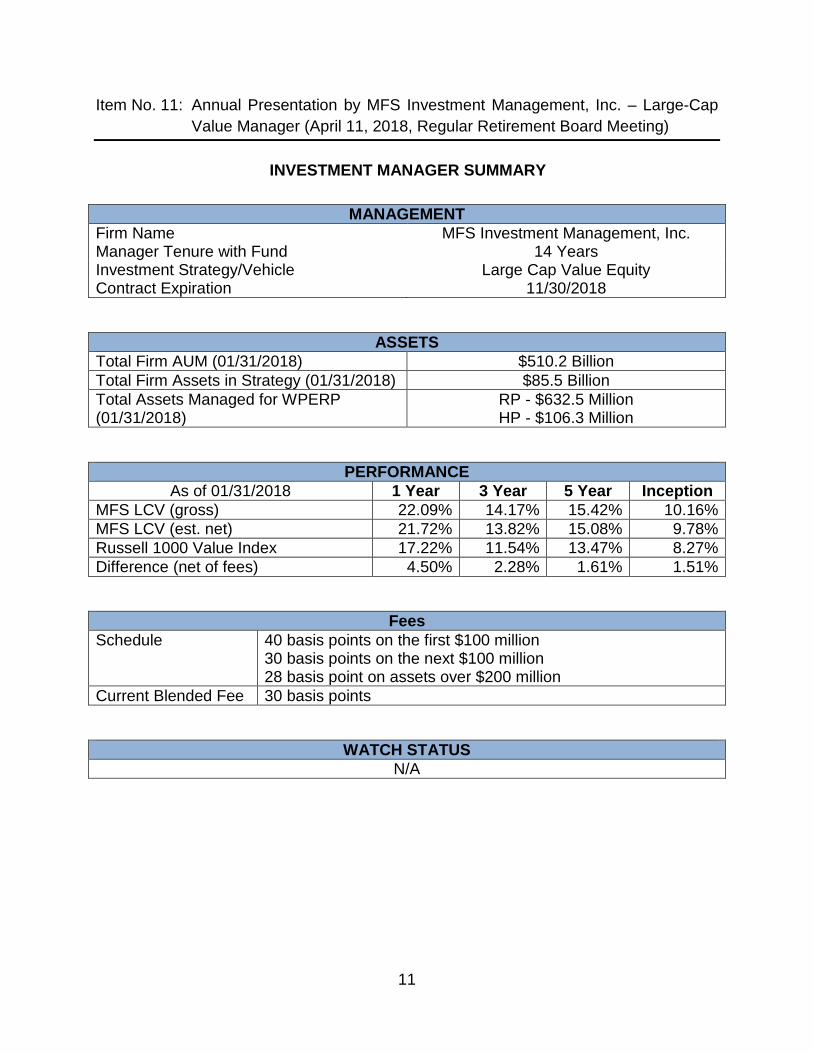
Item No. 11: Annual Presentation by MFS Investment Management, Inc. – Large-Cap Value Manager (April 11, 2018, Regular Retirement Board Meeting)
INVESTMENT MANAGER SUMMARY
MANAGEMENT Firm Name MFS Investment Management, Inc. Manager Tenure with Fund 14 Years Investment Strategy/Vehicle Large Cap Value Equity Contract Expiration 11/30/2018
ASSETS Total Firm AUM (01/31/2018) $510.2 Billion Total Firm Assets in Strategy (01/31/2018) $85.5 Billion Total Assets Managed for WPERP (01/31/2018)
RP - $632.5 Million HP - $106.3 Million
PERFORMANCE As of 01/31/2018 1 Year 3 Year 5 Year Inception
MFS LCV (gross) 22.09% 14.17% 15.42% 10.16% MFS LCV (est. net) 21.72% 13.82% 15.08% 9.78% Russell 1000 Value Index 17.22% 11.54% 13.47% 8.27% Difference (net of fees) 4.50% 2.28% 1.61% 1.51%
Fees Schedule 40 basis points on the first $100 million
30 basis points on the next $100 million 28 basis point on assets over $200 million
Current Blended Fee 30 basis points
WATCH STATUS N/A
22342.8 exp30Apr18FOR INSTITUTIONAL USE ONLY
MFS® LARGE CAP VALUE EQUITY
Presented to
Los Angeles Department of Water and Power14 March 2018
Frank Russell Company ("Russell") is the source and owner of the trademarks, service marks and copyrights related to the Russell Indexes. Russell® is a trademark of FrankRussell Company. Neither Russell nor its licensors accept any liability for any errors or omissions in the Russell Indexes and/or Russell ratings or underlying data and no partymay rely on any Russell Indexes and/or Russell ratings and/or underlying data contained in this communication. No further distribution of Russell Data is permitted withoutRussell's express written consent. Russell does not promote, sponsor or endorse the content of this communication.
LAW
ater
-299
-I-CT
-LCV
-14M
ar18
.581
425.
qxp
DRA
FT
M
ar 1
2 20
18 1
7:02
:24
MFS® Large Cap Value Equity299-I-CT-LCV-14Mar18.ii
For US Retirement Investors: These materials are directed at persons having professional experience related to investments and, if the investor is a retirement plan subject toERISA or an IRA ("Retirement Investor"), using such materials in their role as a fiduciary to such Retirement Investor. When presenting its products and services, MFS relies onthe exception in the Department of Labor's Fiduciary Rule for transactions with an independent fiduciary with financial expertise; such fiduciaries must be regulated financialinstitutions or manage at least $50 million. If you or your plan fiduciary (as applicable) does not meet the independent fiduciary requirements, please notify MFS. MFS does notprovide impartial or fiduciary investment advice as to the selection and use of its products as MFS will receive compensation in connection with any purchase of its financialproducts and services (collectively, "products") which creates a potential conflict of interest.
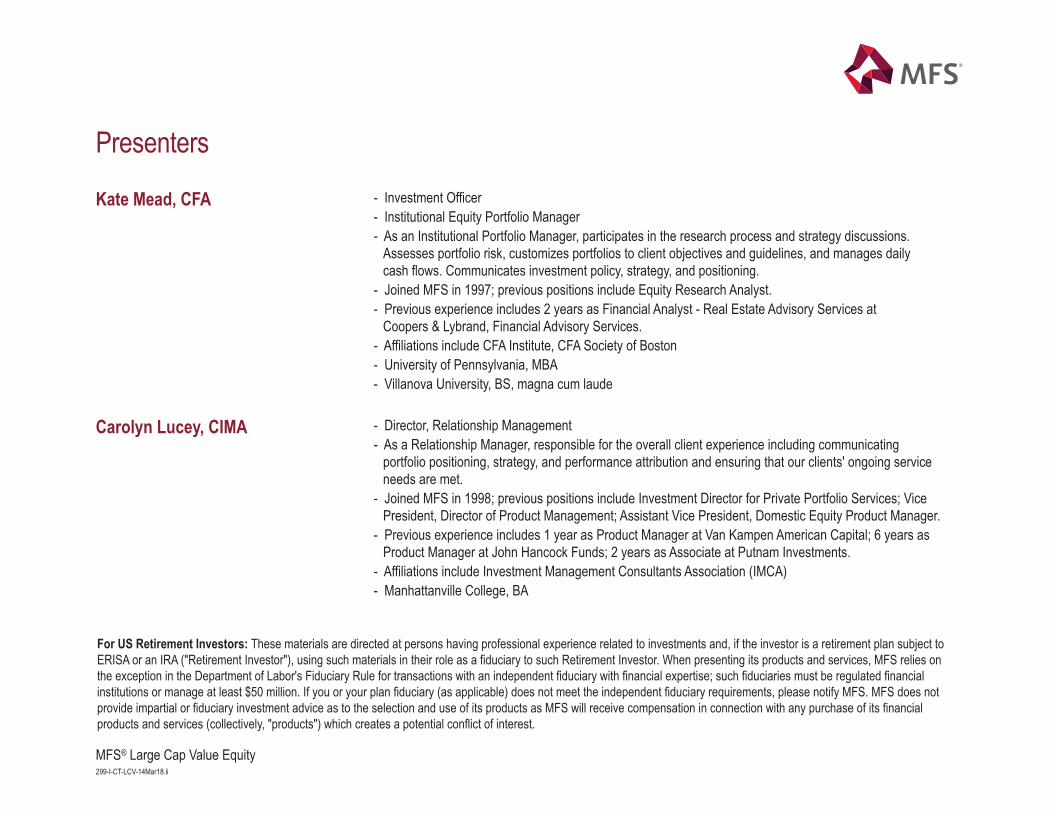
Presenters
Kate Mead, CFA - Investment Officer- Institutional Equity Portfolio Manager- As an Institutional Portfolio Manager, participates in the research process and strategy discussions.
Assesses portfolio risk, customizes portfolios to client objectives and guidelines, and manages dailycash flows. Communicates investment policy, strategy, and positioning.
- Joined MFS in 1997; previous positions include Equity Research Analyst.- Previous experience includes 2 years as Financial Analyst - Real Estate Advisory Services at
Coopers & Lybrand, Financial Advisory Services.- Affiliations include CFA Institute, CFA Society of Boston- University of Pennsylvania, MBA- Villanova University, BS, magna cum laude
Carolyn Lucey, CIMA - Director, Relationship Management- As a Relationship Manager, responsible for the overall client experience including communicating
portfolio positioning, strategy, and performance attribution and ensuring that our clients' ongoing serviceneeds are met.
- Joined MFS in 1998; previous positions include Investment Director for Private Portfolio Services; VicePresident, Director of Product Management; Assistant Vice President, Domestic Equity Product Manager.
- Previous experience includes 1 year as Product Manager at Van Kampen American Capital; 6 years asProduct Manager at John Hancock Funds; 2 years as Associate at Putnam Investments.
- Affiliations include Investment Management Consultants Association (IMCA)- Manhattanville College, BA
1MFS® Large Cap Value Equity299-I-CT-LCV-14Mar18.1
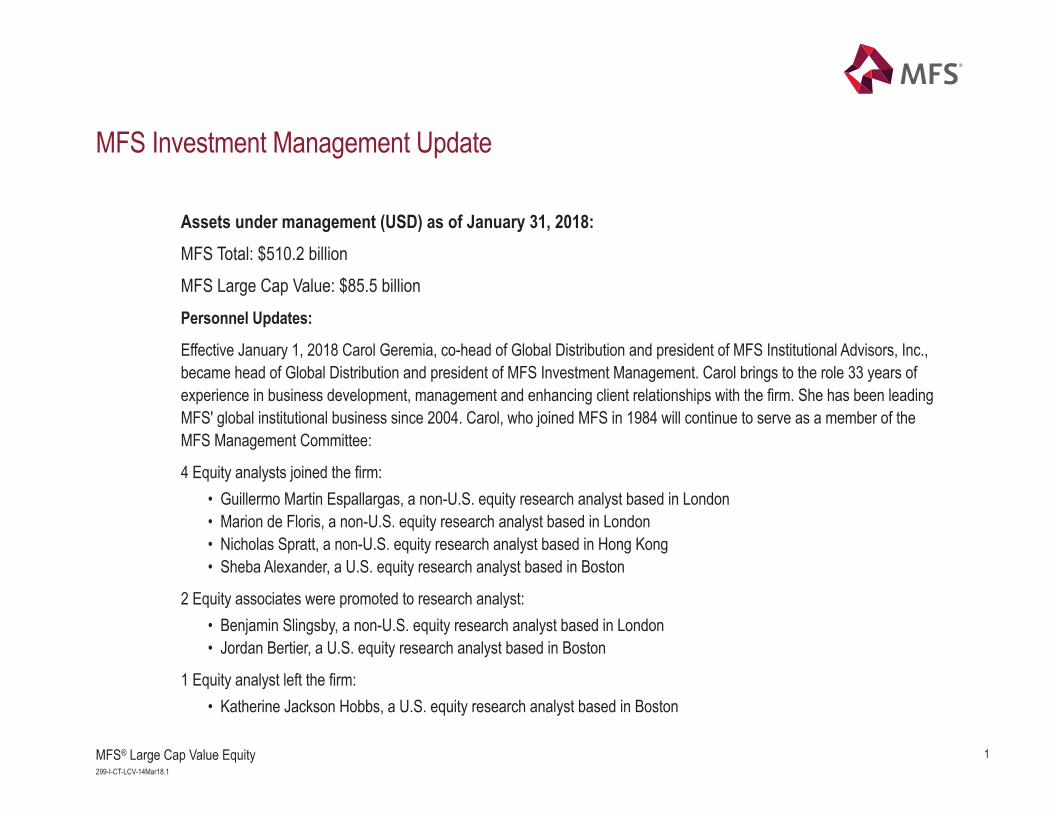
MFS Investment Management Update
Assets under management (USD) as of January 31, 2018:MFS Total: $510.2 billionMFS Large Cap Value: $85.5 billionPersonnel Updates:
Effective January 1, 2018 Carol Geremia, co-head of Global Distribution and president of MFS Institutional Advisors, Inc.,became head of Global Distribution and president of MFS Investment Management. Carol brings to the role 33 years ofexperience in business development, management and enhancing client relationships with the firm. She has been leadingMFS' global institutional business since 2004. Carol, who joined MFS in 1984 will continue to serve as a member of theMFS Management Committee:
4 Equity analysts joined the firm: • Guillermo Martin Espallargas, a non-U.S. equity research analyst based in London • Marion de Floris, a non-U.S. equity research analyst based in London • Nicholas Spratt, a non-U.S. equity research analyst based in Hong Kong • Sheba Alexander, a U.S. equity research analyst based in Boston
2 Equity associates were promoted to research analyst: • Benjamin Slingsby, a non-U.S. equity research analyst based in London • Jordan Bertier, a U.S. equity research analyst based in Boston
1 Equity analyst left the firm: • Katherine Jackson Hobbs, a U.S. equity research analyst based in Boston
2MFS® Large Cap Value Equity299-I-CT-LCV-14Mar18.2
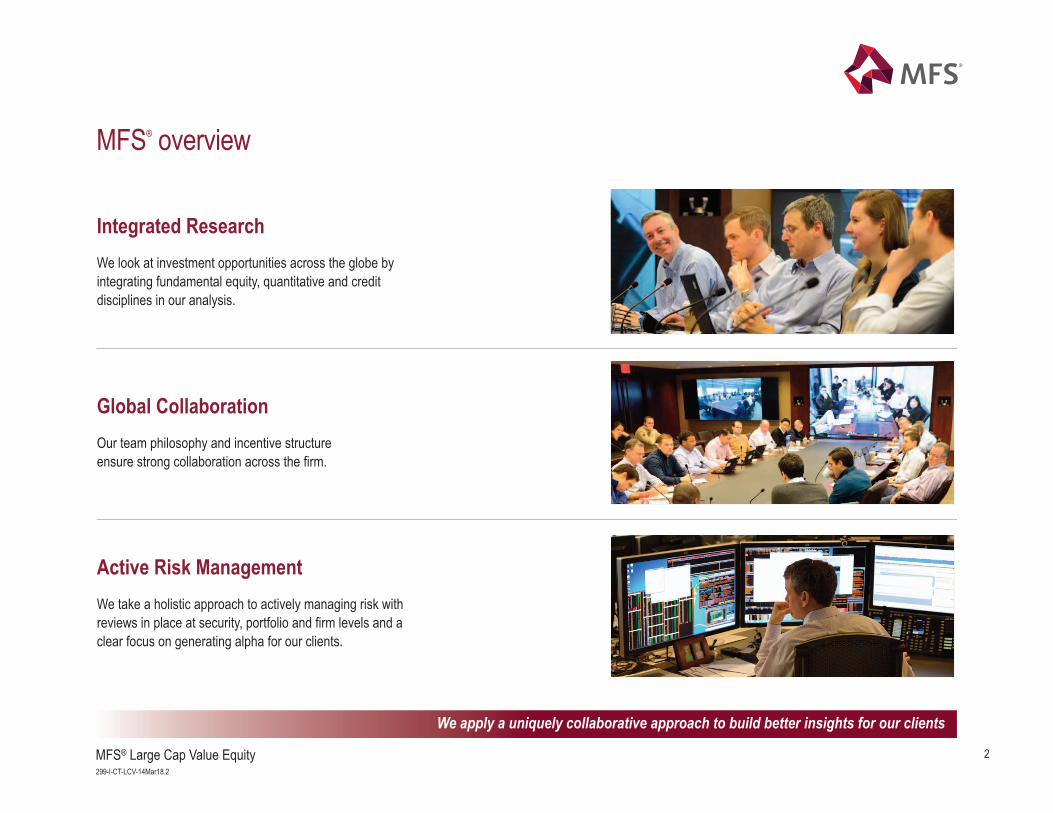
MFS® overview
We apply a uniquely collaborative approach to build better insights for our clients
Integrated ResearchWe look at investment opportunities across the globe byintegrating fundamental equity, quantitative and creditdisciplines in our analysis.
Global CollaborationOur team philosophy and incentive structure ensure strong collaboration across the firm.
Active Risk ManagementWe take a holistic approach to actively managing risk withreviews in place at security, portfolio and firm levels and aclear focus on generating alpha for our clients.
3MFS® Large Cap Value Equity299-I-CT-LCV-14Mar18.3
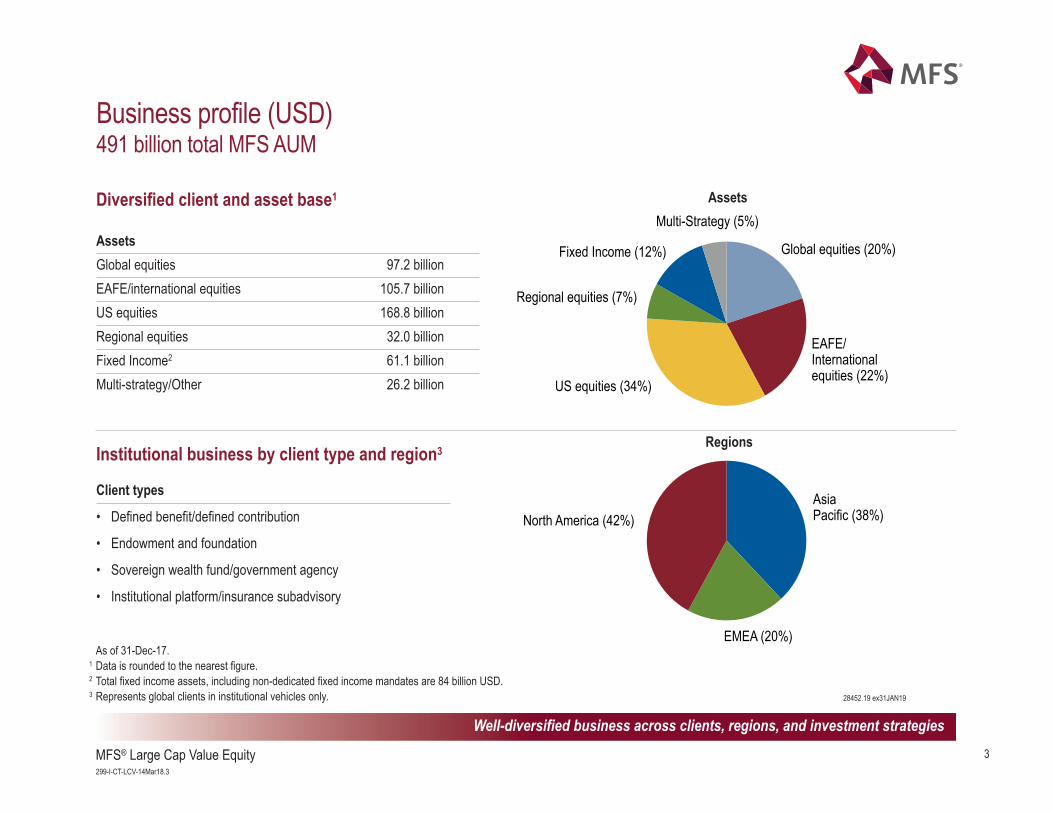
Business profile (USD)491 billion total MFS AUM
Global equities (20%)
EAFE/International equities (22%)
US equities (34%)
Regional equities (7%)
Fixed Income (12%)
Multi-Strategy (5%)
Asia Pacific (38%)
EMEA (20%)
North America (42%)
RegionsInstitutional business by client type and region3
Client types
• Defined benefit/defined contribution
• Endowment and foundation
• Sovereign wealth fund/government agency
• Institutional platform/insurance subadvisory
Well-diversified business across clients, regions, and investment strategies
Diversified client and asset base1
AssetsGlobal equities 97.2 billionEAFE/international equities 105.7 billionUS equities 168.8 billionRegional equities 32.0 billionFixed Income2 61.1 billionMulti-strategy/Other 26.2 billion
Assets
As of 31-Dec-17.1 Data is rounded to the nearest figure. 2 Total fixed income assets, including non-dedicated fixed income mandates are 84 billion USD.3 Represents global clients in institutional vehicles only. 28452.19 ex31JAN19
4MFS® Large Cap Value Equity299-I-CT-LCV-14Mar18.4
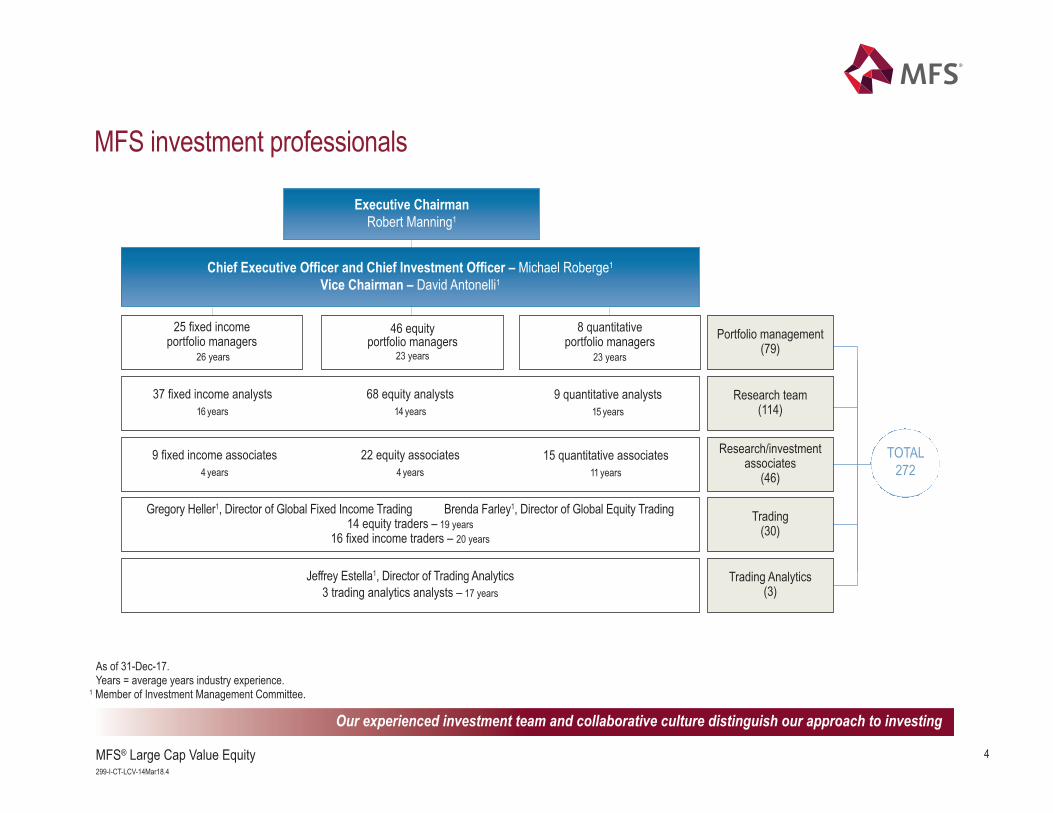
MFS investment professionals
Our experienced investment team and collaborative culture distinguish our approach to investing
As of 31-Dec-17.Years = average years industry experience.
1 Member of Investment Management Committee.
46 equity portfolio managers
23 years
Chief Executive Officer and Chief Investment Officer – Michael Roberge1
Vice Chairman – David Antonelli1
37 fixed income analysts 16 years
68 equity analysts 14 years
9 quantitative analysts 15 years
25 fixed income portfolio managers
26 years
8 quantitative portfolio managers
23 years
Portfolio management(79)
Research team(114)
Trading(30)
Trading Analytics(3)
Gregory Heller1, Director of Global Fixed Income Trading Brenda Farley1, Director of Global Equity Trading14 equity traders – 19 years
16 fixed income traders – 20 years
Jeffrey Estella1, Director of Trading Analytics3 trading analytics analysts – 17 years
Executive ChairmanRobert Manning1
9 fixed income associates 4 years
22 equity associates 4 years
15 quantitative associates 11 years
Research/investmentassociates
(46)
TOTAL272
5MFS® Large Cap Value Equity299-I-CT-LCV-14Mar18.5
Mark Garabedian, Transaction Cost SpecialistKhaled Shahin, Transaction Cost Specialist
Robb Mansi, Director of Global Investment and Client Support
Nancy MacDonaldBecky NanbergJulie O’Dette
Matthew SweeneySteven DonovanChristopher FrierMatthew Halperin
Trading and Analytics Investment Operations
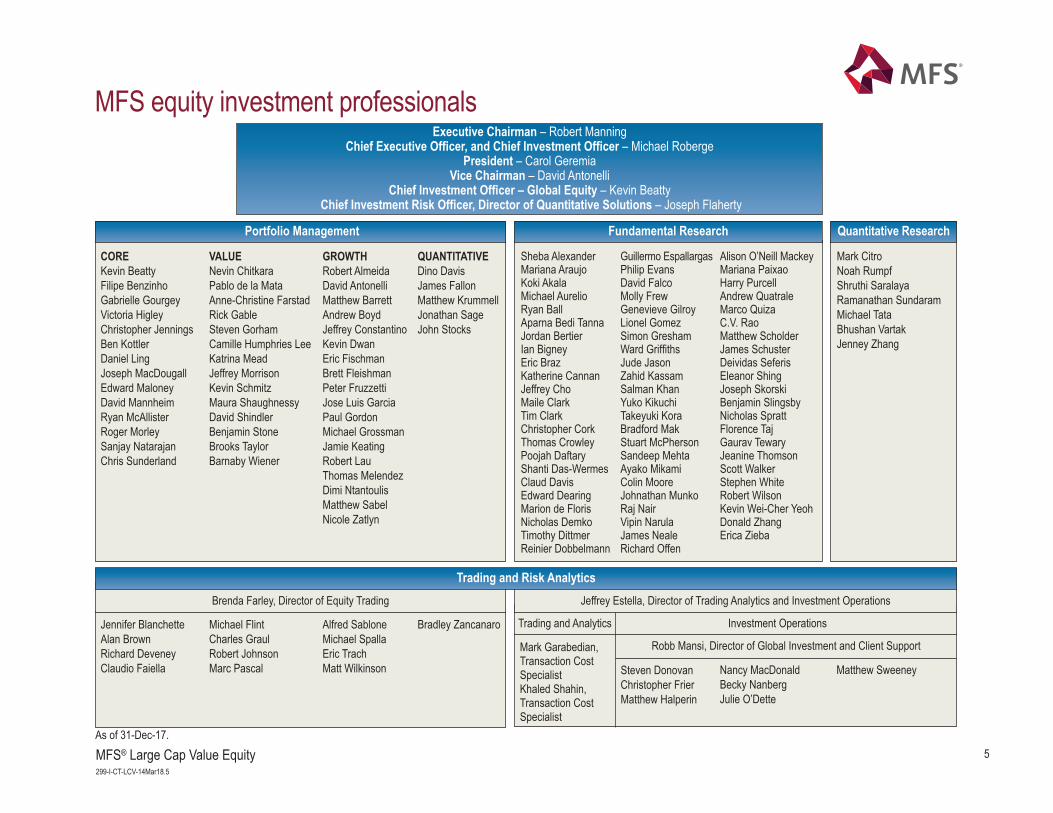
MFS equity investment professionals
Michael FlintCharles GraulRobert JohnsonMarc Pascal
Alfred SabloneMichael SpallaEric TrachMatt Wilkinson
Jennifer BlanchetteAlan BrownRichard DeveneyClaudio Faiella
Executive Chairman – Robert ManningChief Executive Officer, and Chief Investment Officer – Michael Roberge
President – Carol GeremiaVice Chairman – David Antonelli
Chief Investment Officer – Global Equity – Kevin BeattyChief Investment Risk Officer, Director of Quantitative Solutions – Joseph Flaherty
Brenda Farley, Director of Equity Trading
Fundamental Research
Guillermo EspallargasPhilip EvansDavid FalcoMolly Frew Genevieve Gilroy Lionel GomezSimon GreshamWard Griffiths Jude JasonZahid KassamSalman KhanYuko KikuchiTakeyuki KoraBradford Mak Stuart McPherson Sandeep MehtaAyako Mikami Colin MooreJohnathan MunkoRaj NairVipin NarulaJames NealeRichard Offen
Sheba AlexanderMariana AraujoKoki AkalaMichael AurelioRyan BallAparna Bedi TannaJordan BertierIan BigneyEric Braz Katherine CannanJeffrey ChoMaile ClarkTim ClarkChristopher CorkThomas Crowley Poojah DaftaryShanti Das-WermesClaud DavisEdward DearingMarion de FlorisNicholas DemkoTimothy Dittmer Reinier Dobbelmann
Alison O’Neill MackeyMariana PaixaoHarry PurcellAndrew QuatraleMarco QuizaC.V. RaoMatthew ScholderJames SchusterDeividas SeferisEleanor ShingJoseph Skorski Benjamin SlingsbyNicholas SprattFlorence TajGaurav TewaryJeanine ThomsonScott WalkerStephen WhiteRobert WilsonKevin Wei-Cher YeohDonald ZhangErica Zieba
QUANTITATIVE Dino DavisJames FallonMatthew KrummellJonathan SageJohn Stocks
Portfolio Management
VALUENevin ChitkaraPablo de la MataAnne-Christine FarstadRick GableSteven Gorham Camille Humphries LeeKatrina MeadJeffrey MorrisonKevin SchmitzMaura ShaughnessyDavid ShindlerBenjamin StoneBrooks TaylorBarnaby Wiener
COREKevin BeattyFilipe BenzinhoGabrielle GourgeyVictoria HigleyChristopher JenningsBen KottlerDaniel LingJoseph MacDougallEdward MaloneyDavid MannheimRyan McAllisterRoger MorleySanjay NatarajanChris Sunderland
GROWTHRobert AlmeidaDavid AntonelliMatthew BarrettAndrew BoydJeffrey ConstantinoKevin DwanEric FischmanBrett FleishmanPeter FruzzettiJose Luis GarciaPaul GordonMichael GrossmanJamie KeatingRobert LauThomas MelendezDimi NtantoulisMatthew SabelNicole Zatlyn
Bradley Zancanaro
Quantitative Research
Mark CitroNoah RumpfShruthi SaralayaRamanathan SundaramMichael TataBhushan VartakJenney Zhang
Jeffrey Estella, Director of Trading Analytics and Investment Operations
Trading and Risk Analytics
As of 31-Dec-17.
6MFS® Large Cap Value Equity299-I-CT-LCV-14Mar18.6
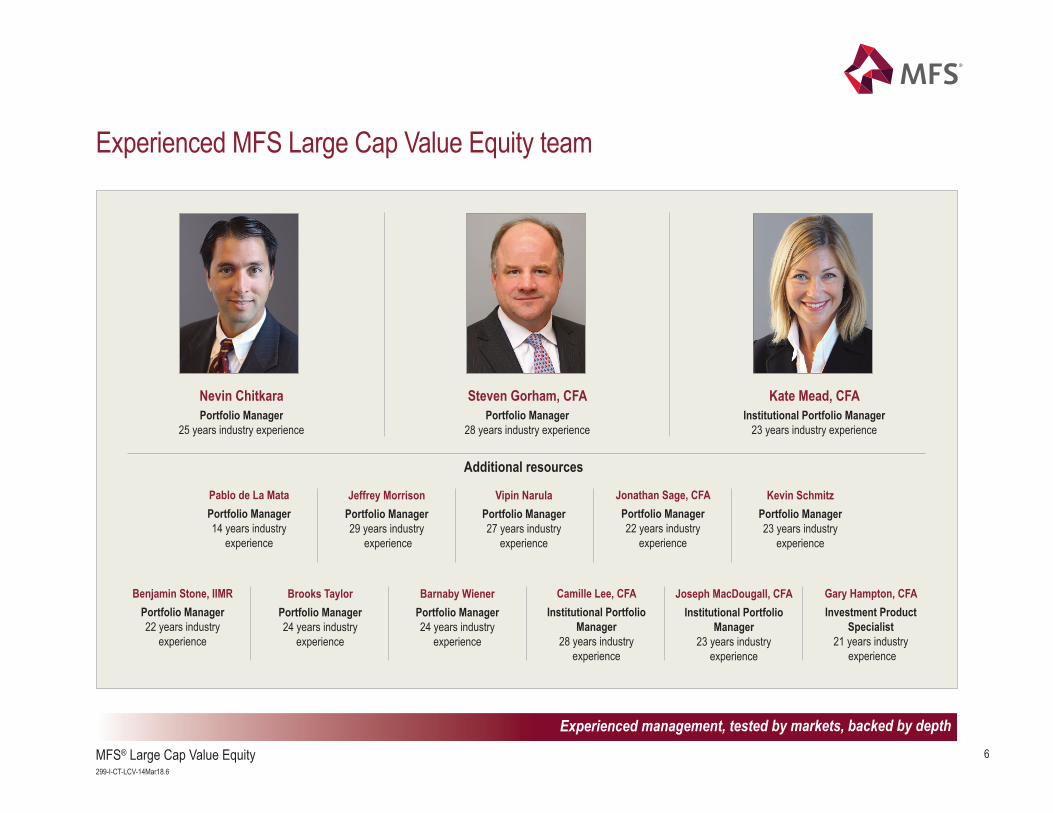
Experienced management, tested by markets, backed by depth
Nevin ChitkaraPortfolio Manager
25 years industry experience
Steven Gorham, CFAPortfolio Manager
28 years industry experience
Kate Mead, CFAInstitutional Portfolio Manager
23 years industry experience
Experienced MFS Large Cap Value Equity team
Additional resources
Pablo de La MataPortfolio Manager14 years industry
experience
Vipin NarulaPortfolio Manager27 years industry
experience
Jeffrey MorrisonPortfolio Manager29 years industry
experience
Jonathan Sage, CFAPortfolio Manager22 years industry
experience
Kevin SchmitzPortfolio Manager23 years industry
experience
Gary Hampton, CFAInvestment Product
Specialist21 years industry
experience
Benjamin Stone, IIMRPortfolio Manager22 years industry
experience
Barnaby WienerPortfolio Manager24 years industry
experience
Brooks TaylorPortfolio Manager24 years industry
experience
Camille Lee, CFAInstitutional Portfolio
Manager28 years industry
experience
Joseph MacDougall, CFAInstitutional Portfolio
Manager23 years industry
experience
7MFS® Large Cap Value Equity299-I-CT-LCV-14Mar18.7
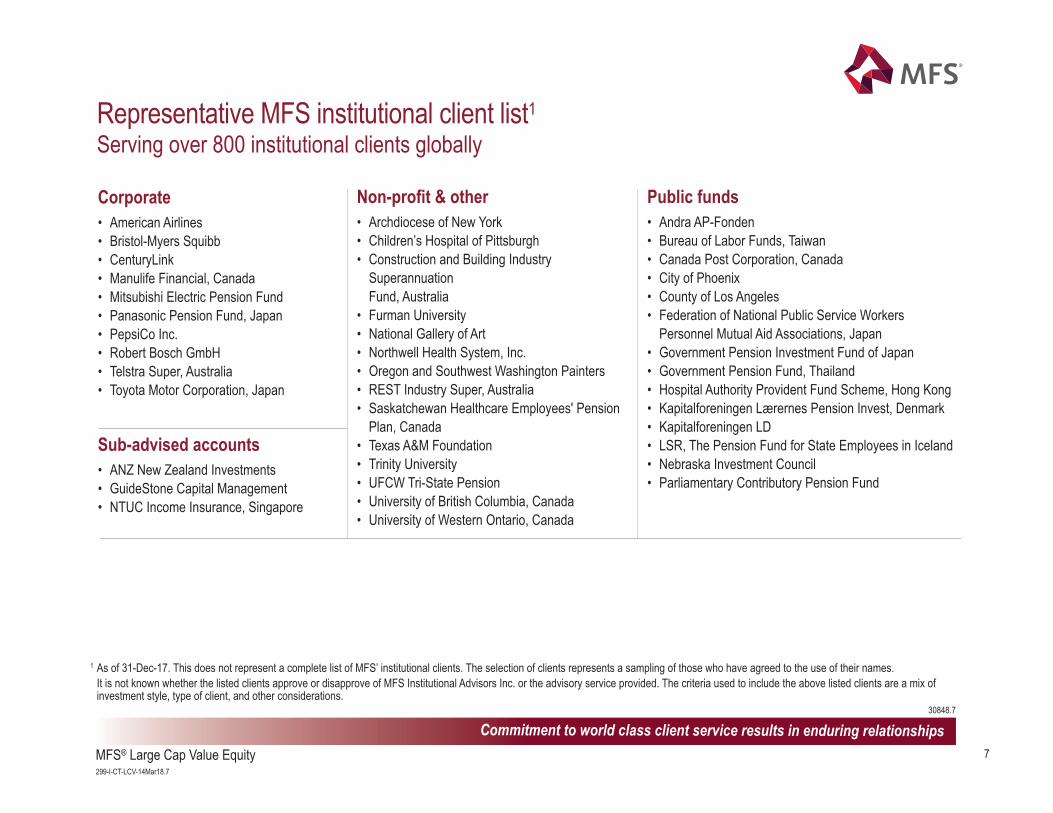
Commitment to world class client service results in enduring relationships
Representative MFS institutional client list1Serving over 800 institutional clients globally
Public funds • Andra AP-Fonden• Bureau of Labor Funds, Taiwan• Canada Post Corporation, Canada• City of Phoenix• County of Los Angeles• Federation of National Public Service Workers
Personnel Mutual Aid Associations, Japan• Government Pension Investment Fund of Japan• Government Pension Fund, Thailand• Hospital Authority Provident Fund Scheme, Hong Kong• Kapitalforeningen Lærernes Pension Invest, Denmark• Kapitalforeningen LD• LSR, The Pension Fund for State Employees in Iceland• Nebraska Investment Council• Parliamentary Contributory Pension Fund
1 As of 31-Dec-17. This does not represent a complete list of MFS’ institutional clients. The selection of clients represents a sampling of those who have agreed to the use of their names. It is not known whether the listed clients approve or disapprove of MFS Institutional Advisors Inc. or the advisory service provided. The criteria used to include the above listed clients are a mix of
investment style, type of client, and other considerations.
Corporate• American Airlines • Bristol-Myers Squibb• CenturyLink• Manulife Financial, Canada• Mitsubishi Electric Pension Fund• Panasonic Pension Fund, Japan• PepsiCo Inc.• Robert Bosch GmbH• Telstra Super, Australia• Toyota Motor Corporation, Japan
Sub-advised accounts• ANZ New Zealand Investments• GuideStone Capital Management• NTUC Income Insurance, Singapore
Non-profit & other• Archdiocese of New York• Children’s Hospital of Pittsburgh• Construction and Building Industry
Superannuation Fund, Australia
• Furman University• National Gallery of Art• Northwell Health System, Inc.• Oregon and Southwest Washington Painters• REST Industry Super, Australia• Saskatchewan Healthcare Employees' Pension
Plan, Canada• Texas A&M Foundation• Trinity University• UFCW Tri-State Pension• University of British Columbia, Canada• University of Western Ontario, Canada
30848.7
8MFS® Large Cap Value Equity299-I-CT-LCV-14Mar18.8
Your MFS relationship team
Carolyn LuceyDirectorRelationship Management
Phone: +1.617.954.5980Email: [email protected]
Erin Mandigo
Client Service Manager
Phone: +1.617.954.4046Email: [email protected]
MFS Institutional Advisors, Inc111 Huntington Avenue
Boston, MA 02199Tel: +1.617.965.5000
Boston • Hong Kong • London • Mexico City • Sao Paulo • Singapore • Sydney • Tokyo • Toronto
9MFS® Large Cap Value Equity299-I-CT-LCV-14Mar18.9
Disciplined focus on high quality, attractively valued companies to provide compelling long-term risk-adjusted returns
Goals • Outperform the Russell 1000® Value Index• Achieve a competitive ranking in relevant peer universes over full market cycles
PhilosophyThe tenets of our investment philosophy are based upon the following beliefs: • Valuation is one of the most important drivers of stock price performance • Quality is underappreciated by the market
Strategy
We leverage our bottom-up, global research platform to identify undervalued, high quality companies that: • Have sustainable, durable franchises • Generate significant free cash flow • Maintain strong balance sheets • Have strong management teams who are good stewards of capital
Our valuation approach is flexible, but we place a strong emphasis on cash flow and returns-basedmethodologies
We focus on downside risk management at the individual security level
Focus on quality and valuation has driven strong long-term risk-adjusted returns
10MFS® Large Cap Value Equity299-I-CT-LCV-14Mar18.10
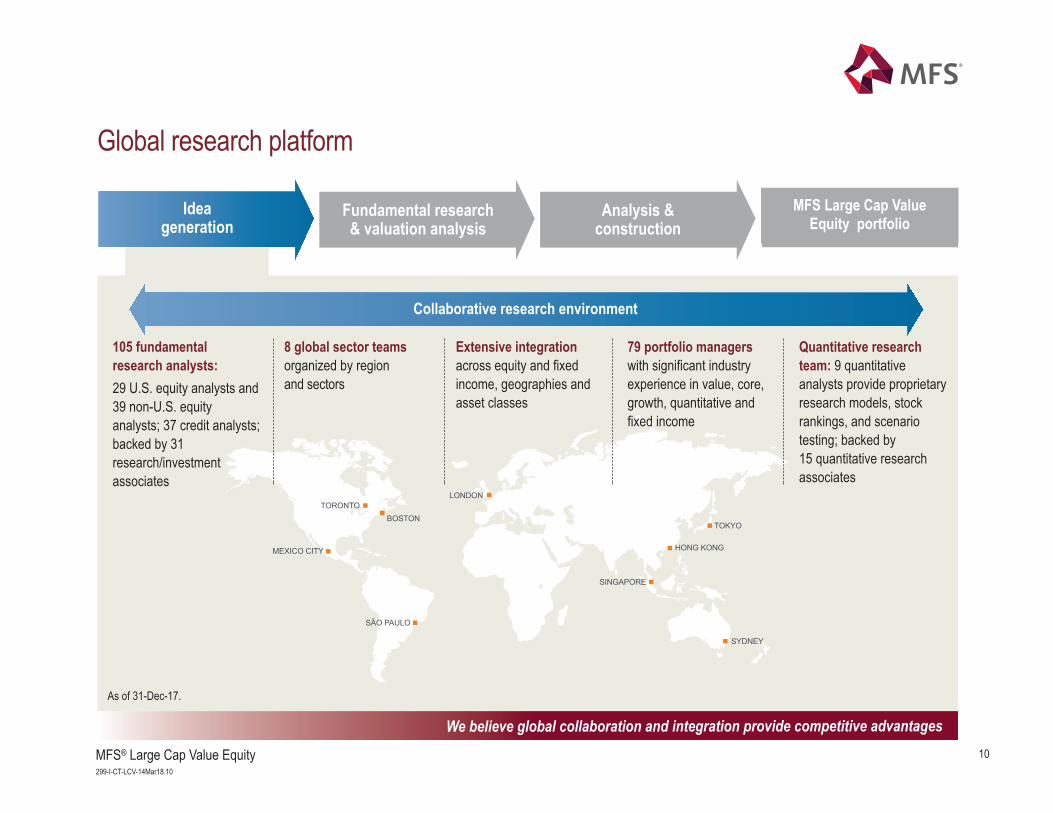
BOSTONTORONTO
MEXICO CITY
SÃO PAULO
SYDNEY
SINGAPORE
HONG KONG
TOKYO
LONDON
Idea generation
Collaborative research environment
105 fundamentalresearch analysts:29 U.S. equity analysts and39 non-U.S. equityanalysts; 37 credit analysts;backed by 31research/investmentassociates
8 global sector teamsorganized by region and sectors
Extensive integrationacross equity and fixedincome, geographies andasset classes
79 portfolio managerswith significant industryexperience in value, core,growth, quantitative andfixed income
Quantitative researchteam: 9 quantitativeanalysts provide proprietaryresearch models, stockrankings, and scenariotesting; backed by15 quantitative researchassociates
Fundamental research & valuation analysis
Analysis & construction
Global research platform
We believe global collaboration and integration provide competitive advantages
As of 31-Dec-17.
MFS Large Cap Value Equity portfolio
11MFS® Large Cap Value Equity299-I-CT-LCV-14Mar18.11
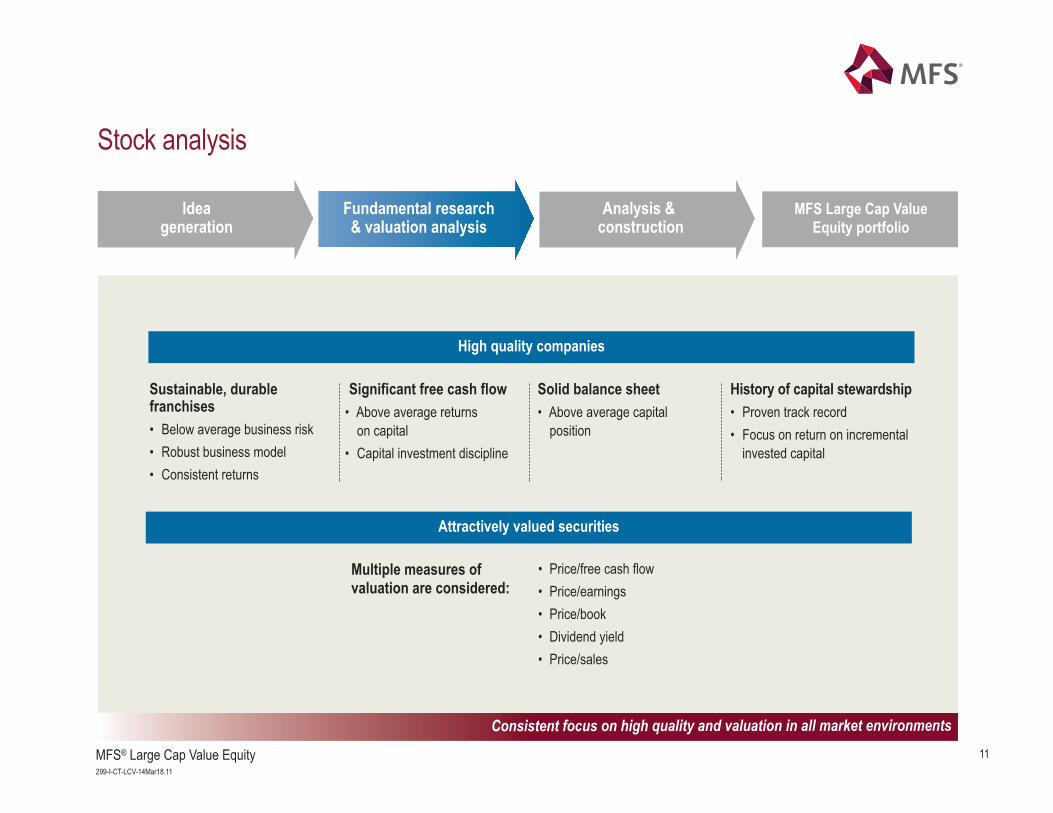
MFS Large Cap Value Equity portfolio
Fundamental research & valuation analysis
Idea generation
Analysis &construction
Sustainable, durable franchises• Below average business risk• Robust business model• Consistent returns
High quality companies
Significant free cash flow• Above average returns
on capital• Capital investment discipline
Solid balance sheet• Above average capital
position
History of capital stewardship• Proven track record• Focus on return on incremental
invested capital
Attractively valued securities
Multiple measures of valuation are considered:
• Price/free cash flow• Price/earnings• Price/book• Dividend yield• Price/sales
Stock analysis
Consistent focus on high quality and valuation in all market environments
12MFS® Large Cap Value Equity299-I-CT-LCV-14Mar18.12
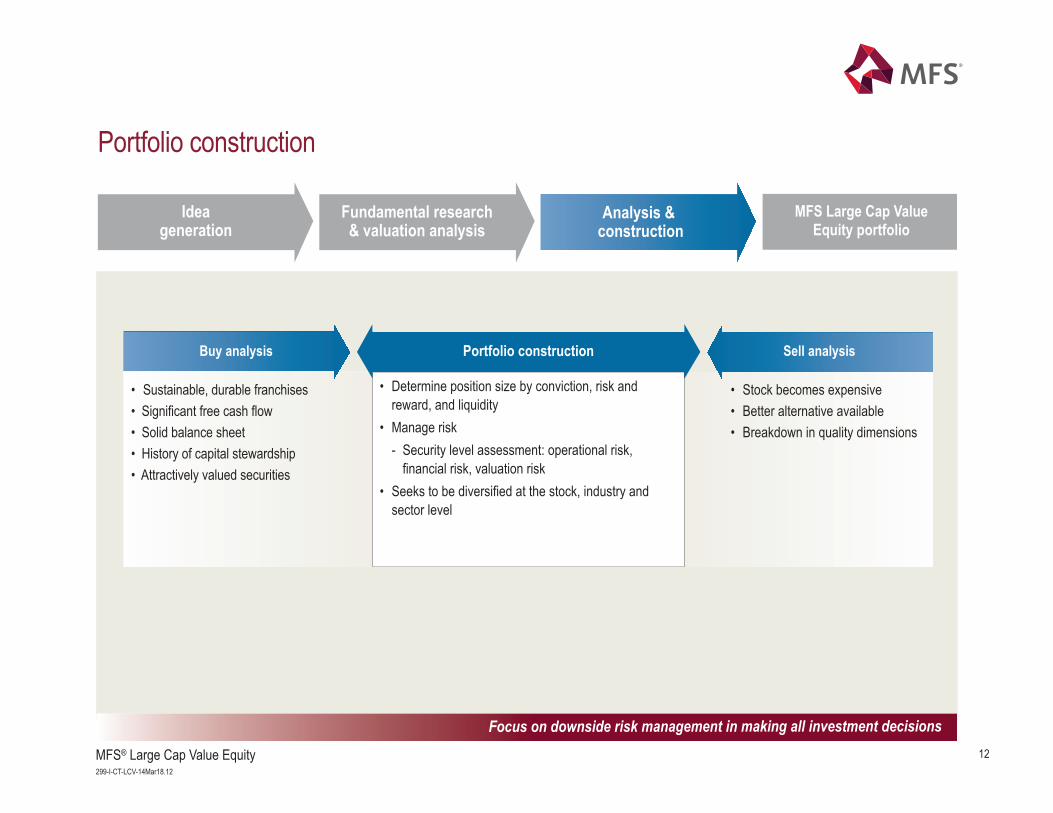
MFS Large Cap Value Equity portfolio
Buy analysis
• Sustainable, durable franchises• Significant free cash flow• Solid balance sheet• History of capital stewardship• Attractively valued securities
Sell analysis
• Stock becomes expensive• Better alternative available• Breakdown in quality dimensions
Portfolio construction
• Determine position size by conviction, risk and reward, and liquidity
• Manage risk- Security level assessment: operational risk,
financial risk, valuation risk• Seeks to be diversified at the stock, industry and
sector level
Focus on downside risk management in making all investment decisions
Portfolio construction
Idea generation
Fundamental research & valuation analysis
Analysis &construction
13MFS® Large Cap Value Equity299-I-CT-LCV-14Mar18.13
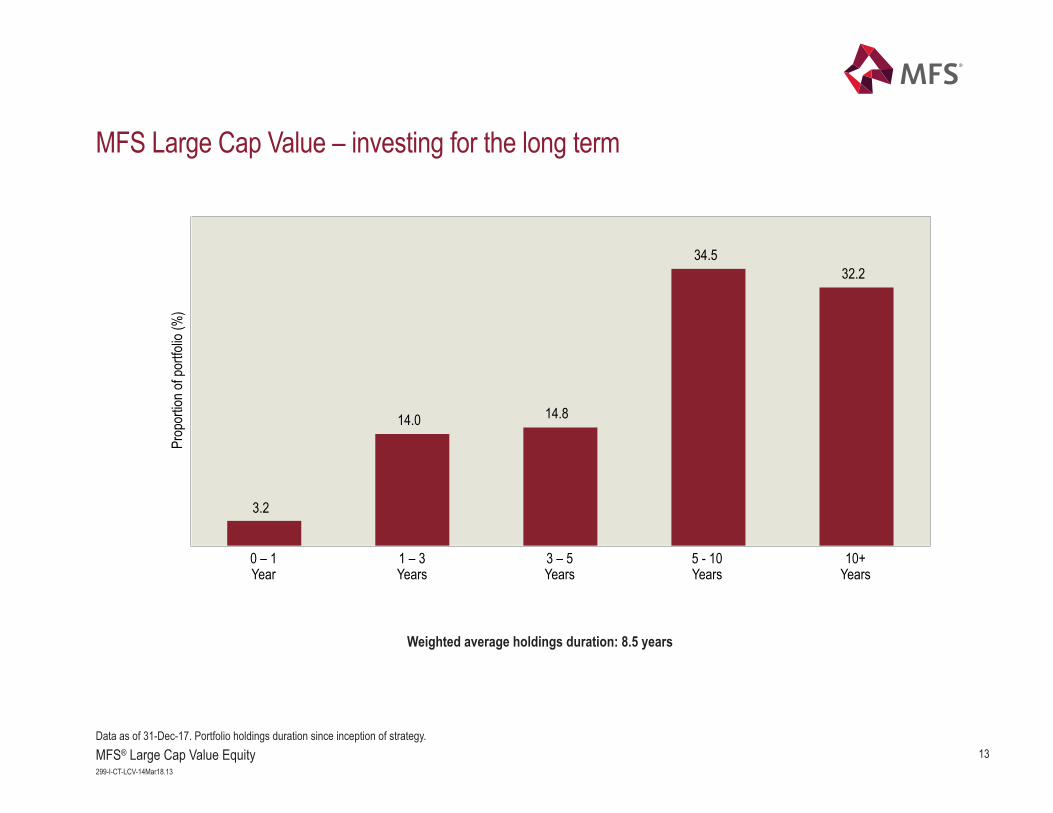
MFS Large Cap Value – investing for the long term
0 – 1Year
1 – 3Years
3 – 5Years
5 - 10Years
10+Years
Prop
ortio
n of p
ortfo
lio (%
)
3.2
14.0 14.8
34.532.2
Data as of 31-Dec-17. Portfolio holdings duration since inception of strategy.
Weighted average holdings duration: 8.5 years
14MFS® Large Cap Value Equity299-I-CT-LCV-14Mar18.14
1Q98
2Q
98
3Q98
4Q
98
1Q99
2Q
99
3Q99
4Q
99
1Q00
2Q
00
3Q00
4Q
00
1Q01
2Q
01
3Q01
4Q
01
1Q02
2Q
02
3Q02
4Q
02
1Q03
2Q
03
3Q03
4Q
03
1Q04
2Q
04
3Q04
4Q
04
1Q05
2Q
05
3Q05
4Q
051Q
062Q
063Q
064Q
061Q
072Q
073Q
074Q
071Q
082Q
083Q
084Q
081Q
092Q
093Q
094Q
091Q
102Q
103Q
104Q
101Q
112Q
113Q
114Q
111Q
122Q
123Q
124Q
121Q
132Q
133Q
134Q
131Q
142Q
143Q
144Q
141Q
152Q
153Q
154Q
151Q
162Q
163Q
164Q
161Q
172Q
173Q
174Q
17
-10
-5
0
5
10
15
Perc
ent (
%)
MFS Large Cap Value outperformed Russell 1000® Value Index MFS Large Cap Value underperformed Russell 1000® Value Index
200400600800
100012001400160018002000
Basis
poin
ts Decreased appetitefor risk
Decreased appetite for risk
Heightened appetite for risk
Heightened appetite for risk
Decreased appetite for risk
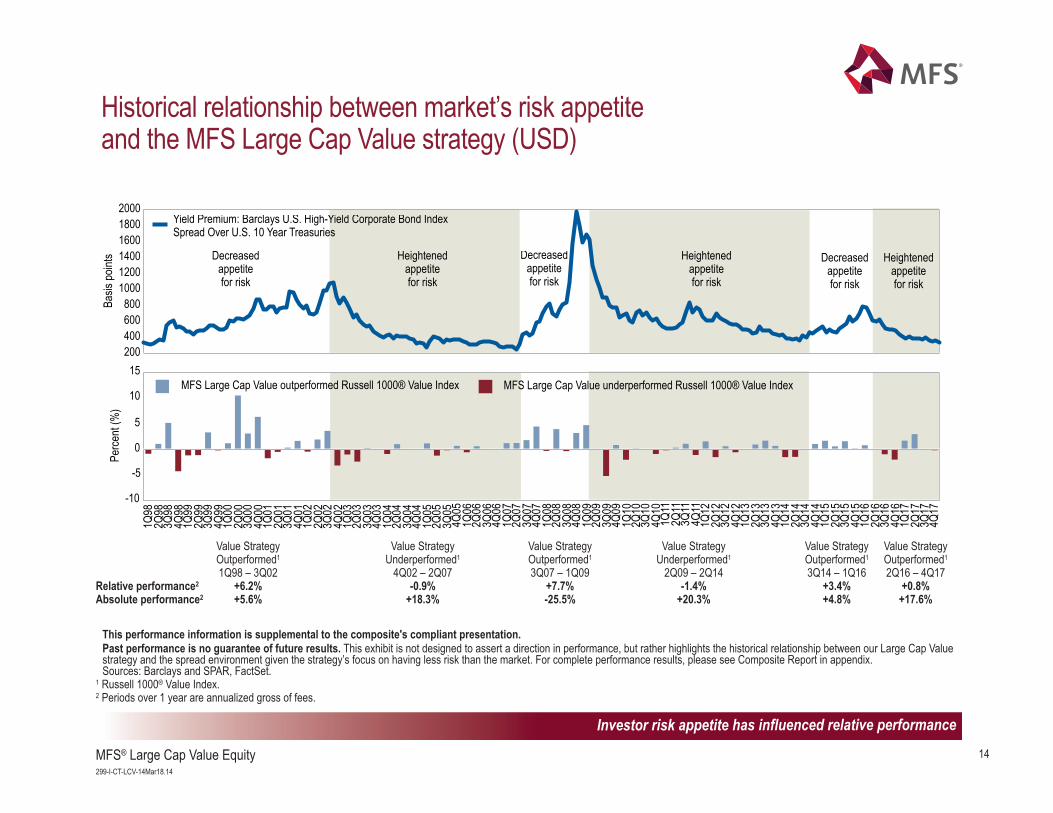
Yield Premium: Barclays U.S. High-Yield Corporate Bond Index Spread Over U.S. 10 Year Treasuries
Heightened appetite for risk
This performance information is supplemental to the composite's compliant presentation.Past performance is no guarantee of future results. This exhibit is not designed to assert a direction in performance, but rather highlights the historical relationship between our Large Cap Valuestrategy and the spread environment given the strategy’s focus on having less risk than the market. For complete performance results, please see Composite Report in appendix. Sources: Barclays and SPAR, FactSet.
1 Russell 1000® Value Index.2 Periods over 1 year are annualized gross of fees.
Value Strategy Value Strategy Value Strategy Value Strategy Value Strategy Value StrategyOutperformed1 Underperformed1 Outperformed1 Underperformed1 Outperformed1 Outperformed1
1Q98 – 3Q02 4Q02 – 2Q07 3Q07 – 1Q09 2Q09 – 2Q14 3Q14 – 1Q16 2Q16 – 4Q17Relative performance2 +6.2% -0.9% +7.7% -1.4% +3.4% +0.8%Absolute performance2 +5.6% +18.3% -25.5% +20.3% +4.8% +17.6%
Investor risk appetite has influenced relative performance
Historical relationship between market’s risk appetite and the MFS Large Cap Value strategy (USD)
15MFS® Large Cap Value Equity299-I-CT-LCV-14Mar18.15
Focused on downside risk management, upside participation
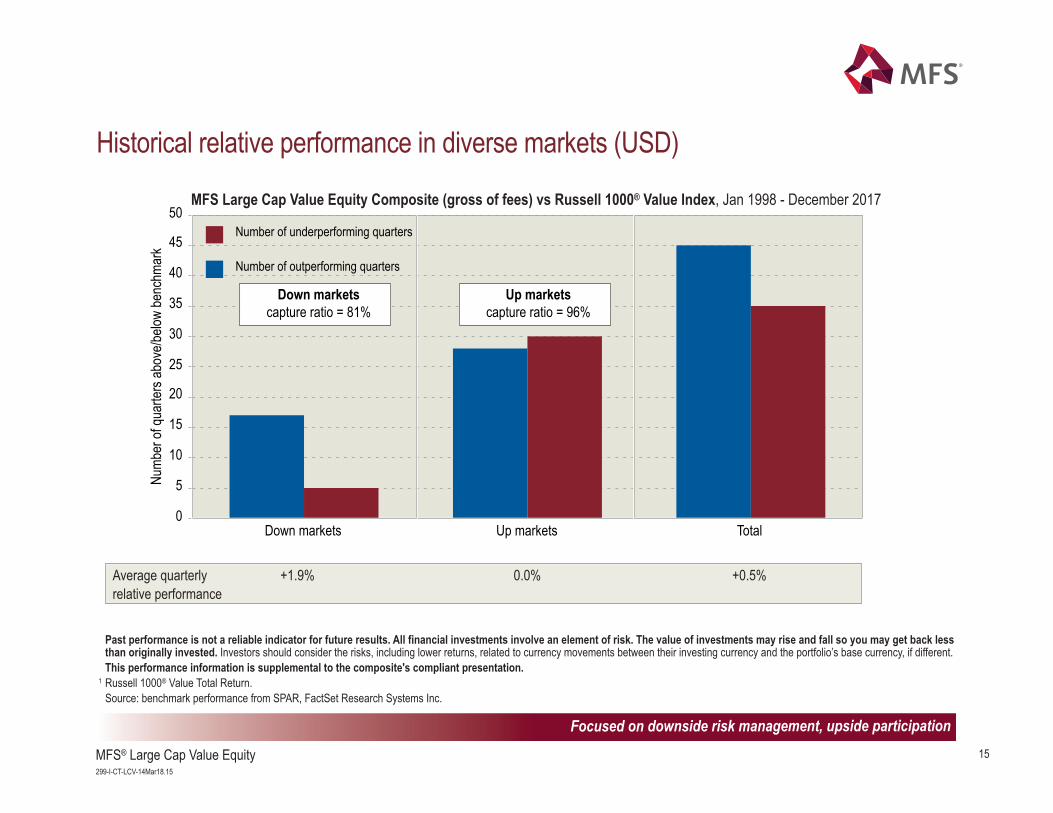
Historical relative performance in diverse markets (USD)
Past performance is not a reliable indicator for future results. All financial investments involve an element of risk. The value of investments may rise and fall so you may get back lessthan originally invested. Investors should consider the risks, including lower returns, related to currency movements between their investing currency and the portfolio’s base currency, if different.This performance information is supplemental to the composite's compliant presentation.
1 Russell 1000® Value Total Return.Source: benchmark performance from SPAR, FactSet Research Systems Inc.
Down markets Up markets Total0
5
10
15
20
25
30
35
40
45
50
Numb
er of
quar
ters a
bove
/below
benc
hmar
k
Number of outperforming quarters
Number of underperforming quarters
MFS Large Cap Value Equity Composite (gross of fees) vs Russell 1000® Value Index, Jan 1998 - December 2017
Average quarterly +1.9% 0.0% +0.5%relative performance
Up marketscapture ratio = 96%
Down marketscapture ratio = 81%
16MFS® Large Cap Value Equity299-I-CT-LCV-14Mar18.16
LADWP’s investment guidelines 1. The Portfolios shall be equity securities of companies doing business in the United States. It is expected that the Portfolios will
be fully invested (<5% cash) at all times. Equity securities shall be restricted to those issues listed on the New York, American,NASDAQ, or other nationally recognized United States stock exchanges.
2. The Board recognizes the Manager is an active manager investing in a universe of securities that resembles the Russell 1000®
Value Index. The Manager will adjust its Portfolios on an ongoing basis to attempt to outperform the investment results of theRussell 1000® Value Index.
3. The Manager shall not use derivatives within the Portfolios without the expressed written consent of the Plan. If the Managerelects to use derivatives as part of its investment strategy, the Plan requires that the Manager provide written documentation of the rationale for using such instruments. Use of derivatives for speculation is prohibited. Only exchange-traded derivativeswill be utilized.
4. For prudent diversification, no more than 5% of the Portfolios shall be invested in any one issue as of the time of purchase,unless that issue represents more than 5% of the Russell 1000® Value Index. In such cases, the maximum amount allowed is125% of the benchmark weight. At no time shall any specific issue represent more than 10% of the Portfolios. In addition, noissue shall be purchased in the Portfolios if more than 10% of the outstanding shares of that company are held by the Managerin the total of all of its accounts.
5. The Manager shall invest in securities specifically authorized in these written guidelines. Unauthorized investments includeforeign securities listed and traded on U.S. exchanges, including American Depository Receipts (ADRs). All foreign securitiesexcept for Benefit Driven Incorporations (BDIs) included in the Russell Indexes are unauthorized. Additional unauthorizedinvestments include short sales, futures, direct investment in raw commodities, and the use of non-approved derivativesecurities (i.e. equity futures and forward contracts), and/or the purchase of securities on margin.
17MFS® Large Cap Value Equity299-I-CT-LCV-14Mar18.17
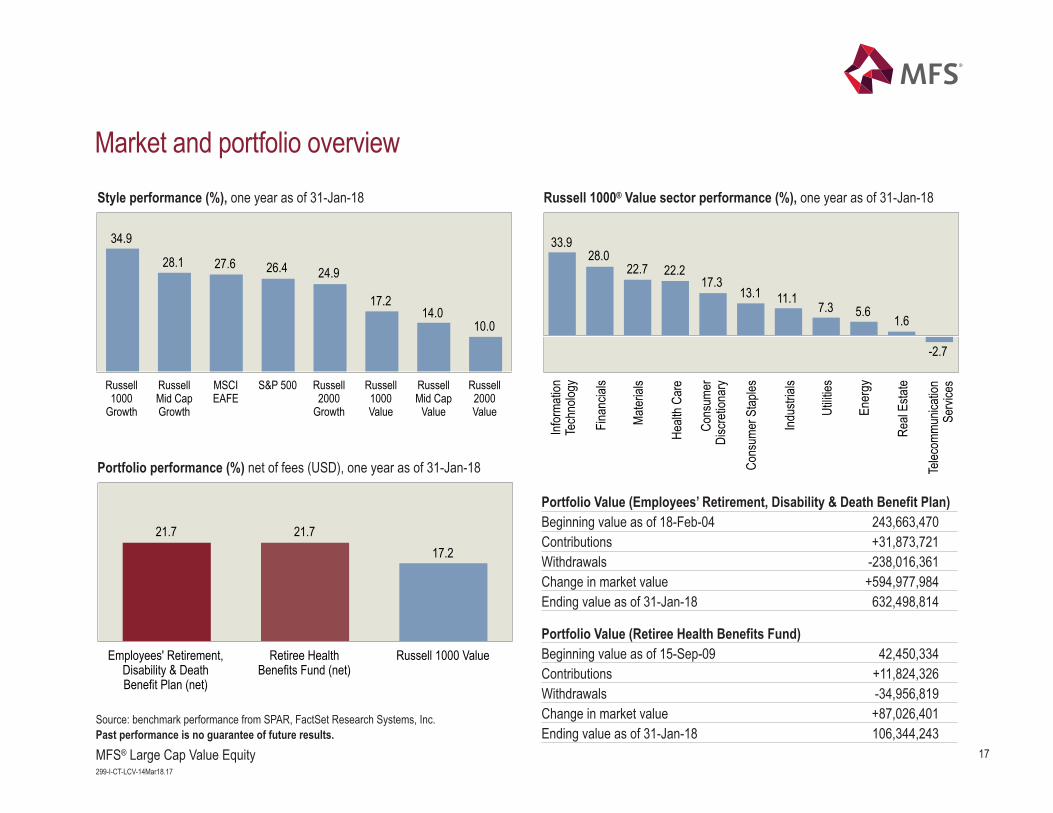
Style performance (%), one year as of 31-Jan-18 Russell 1000® Value sector performance (%), one year as of 31-Jan-18
Russell1000
Growth
RussellMid CapGrowth
MSCIEAFE
S&P 500 Russell2000
Growth
Russell1000Value
RussellMid Cap
Value
Russell2000Value
34.9
28.1 27.6 26.4 24.9
17.214.0
10.0
Infor
matio
nTe
chno
logy
Fina
ncial
s
Mater
ials
Healt
h Car
e
Cons
umer
Disc
retio
nary
Cons
umer
Stap
les
Indus
trials
Utilit
ies
Ener
gy
Real
Estat
e
Telec
ommu
nicati
onSe
rvice
s
33.928.0
22.7 22.217.3
13.1 11.17.3 5.6
1.6
-2.7
Market and portfolio overview
Portfolio performance (%) net of fees (USD), one year as of 31-Jan-18
Portfolio Value (Employees’ Retirement, Disability & Death Benefit Plan)Beginning value as of 18-Feb-04 243,663,470Contributions +31,873,721Withdrawals -238,016,361Change in market value +594,977,984Ending value as of 31-Jan-18 632,498,814
Source: benchmark performance from SPAR, FactSet Research Systems, Inc.Past performance is no guarantee of future results.
Employees' Retirement,Disability & DeathBenefit Plan (net)
Retiree HealthBenefits Fund (net)
Russell 1000 Value
21.7 21.717.2
Portfolio Value (Retiree Health Benefits Fund)Beginning value as of 15-Sep-09 42,450,334Contributions +11,824,326Withdrawals -34,956,819Change in market value +87,026,401Ending value as of 31-Jan-18 106,344,243
18MFS® Large Cap Value Equity299-I-CT-LCV-14Mar18.18
29023.31
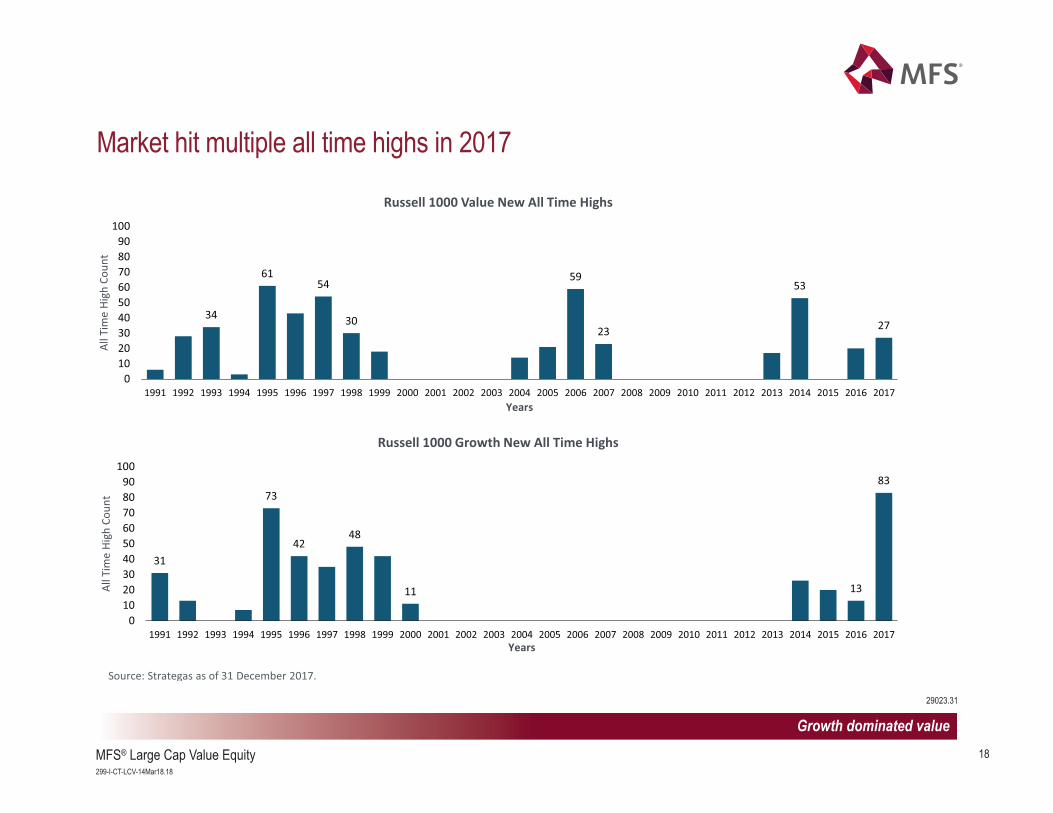
Market hit multiple all time highs in 2017
Growth dominated value
Source: Strategas as of 31 December 2017.
31
73
4248
11 13
83
0102030405060708090
100
1991 1992 1993 1994 1995 1996 1997 1998 1999 2000 2001 2002 2003 2004 2005 2006 2007 2008 2009 2010 2011 2012 2013 2014 2015 2016 2017
All T
ime
High
Cou
nt
Years
Russell 1000 Growth New All Time Highs
34
6154
30
59
23
53
27
0102030405060708090
100
1991 1992 1993 1994 1995 1996 1997 1998 1999 2000 2001 2002 2003 2004 2005 2006 2007 2008 2009 2010 2011 2012 2013 2014 2015 2016 2017
All T
ime
High
Cou
nt
Years
Russell 1000 Value New All Time Highs
19MFS® Large Cap Value Equity299-I-CT-LCV-14Mar18.19
29023.31
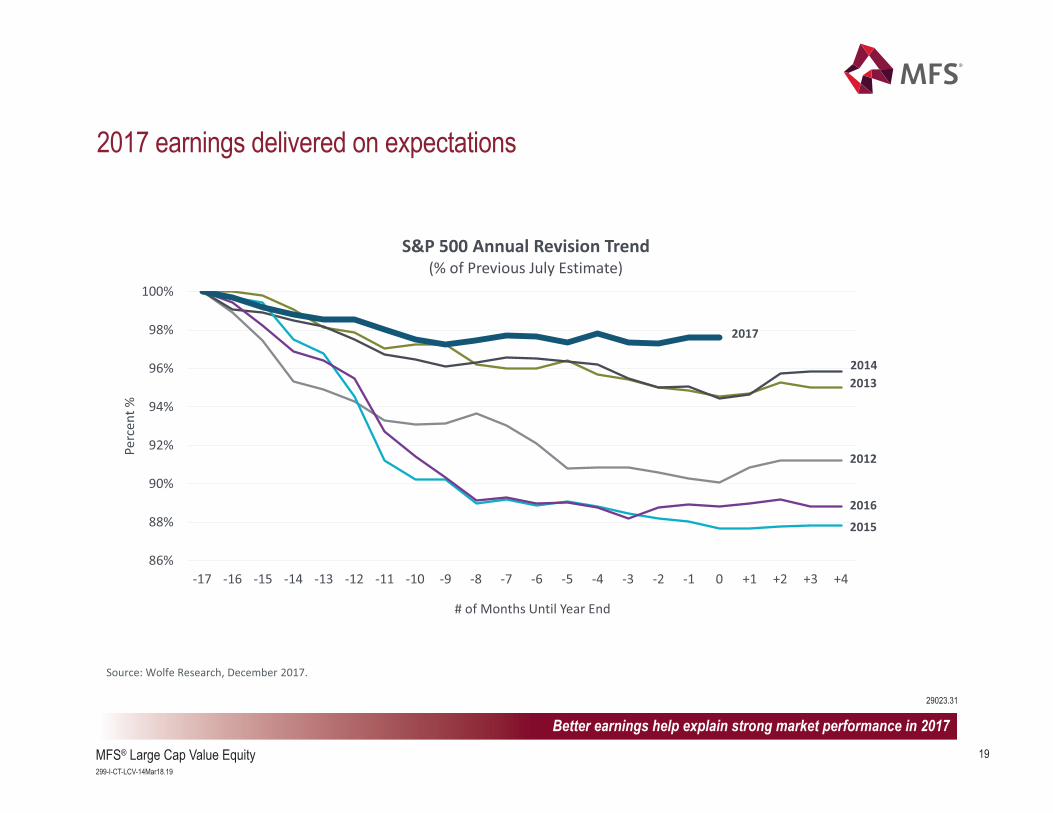
2017 earnings delivered on expectations
Better earnings help explain strong market performance in 2017
Source: Wolfe Research, December 2017.
86%
88%
90%
92%
94%
96%
98%
100%
-17 -16 -15 -14 -13 -12 -11 -10 -9 -8 -7 -6 -5 -4 -3 -2 -1 0 +1 +2 +3 +4
Perc
ent %
# of Months Until Year End
S&P 500 Annual Revision Trend(% of Previous July Estimate)
20132014
2012
2016
2015
2017
20MFS® Large Cap Value Equity299-I-CT-LCV-14Mar18.20
29023.31
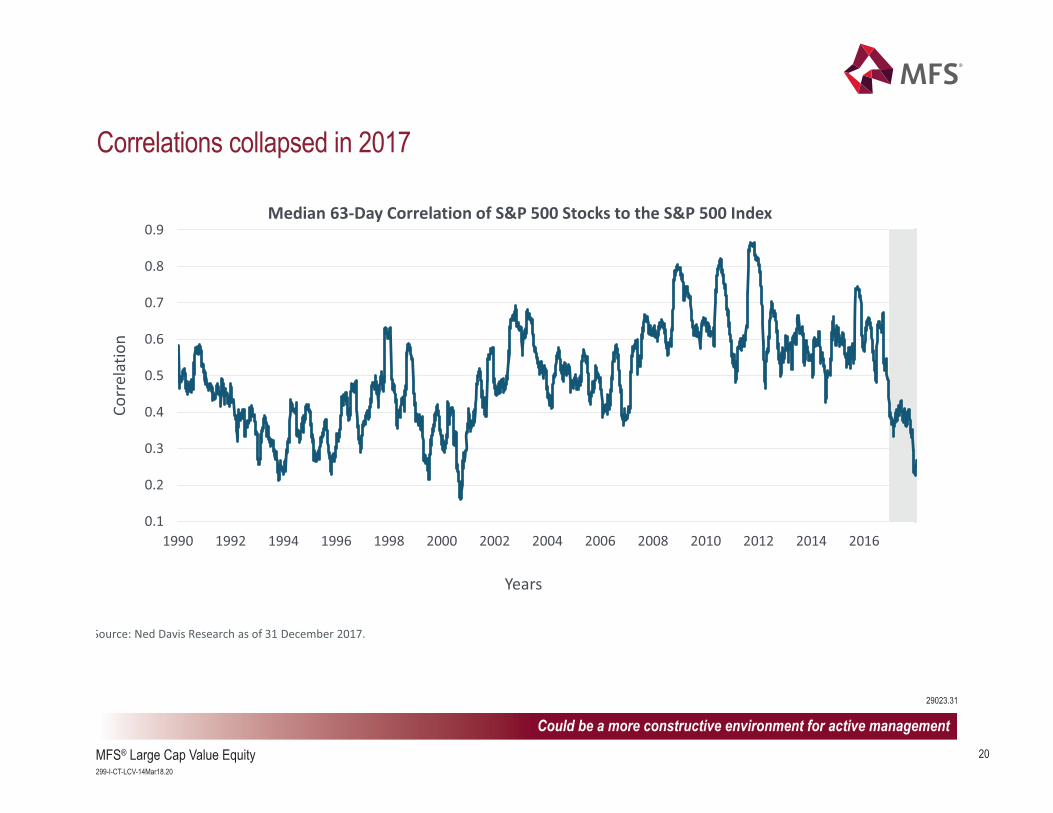
Correlations collapsed in 2017
Could be a more constructive environment for active management
Source: Ned Davis Research as of 31 December 2017.
0.1
0.2
0.3
0.4
0.5
0.6
0.7
0.8
0.9
1990 1992 1994 1996 1998 2000 2002 2004 2006 2008 2010 2012 2014 2016
Corr
elat
ion
Years
Median 63-Day Correlation of S&P 500 Stocks to the S&P 500 Index
21MFS® Large Cap Value Equity299-I-CT-LCV-14Mar18.21
29023.31
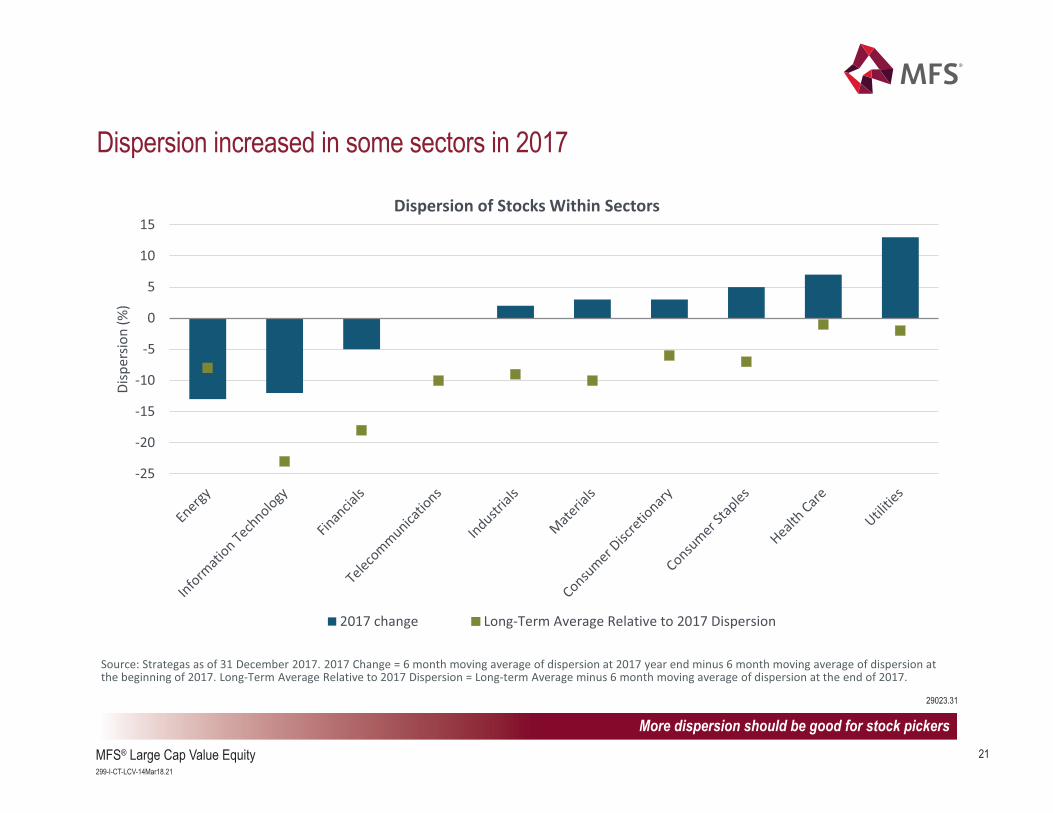
Dispersion increased in some sectors in 2017
More dispersion should be good for stock pickers
Source: Strategas as of 31 December 2017. 2017 Change = 6 month moving average of dispersion at 2017 year end minus 6 month moving average of dispersion at the beginning of 2017. Long-Term Average Relative to 2017 Dispersion = Long-term Average minus 6 month moving average of dispersion at the end of 2017.
-25
-20
-15
-10
-5
0
5
10
15
Disp
ersio
n (%
)
Dispersion of Stocks Within Sectors
2017 change Long-Term Average Relative to 2017 Dispersion
22MFS® Large Cap Value Equity299-I-CT-LCV-14Mar18.22
29023.31
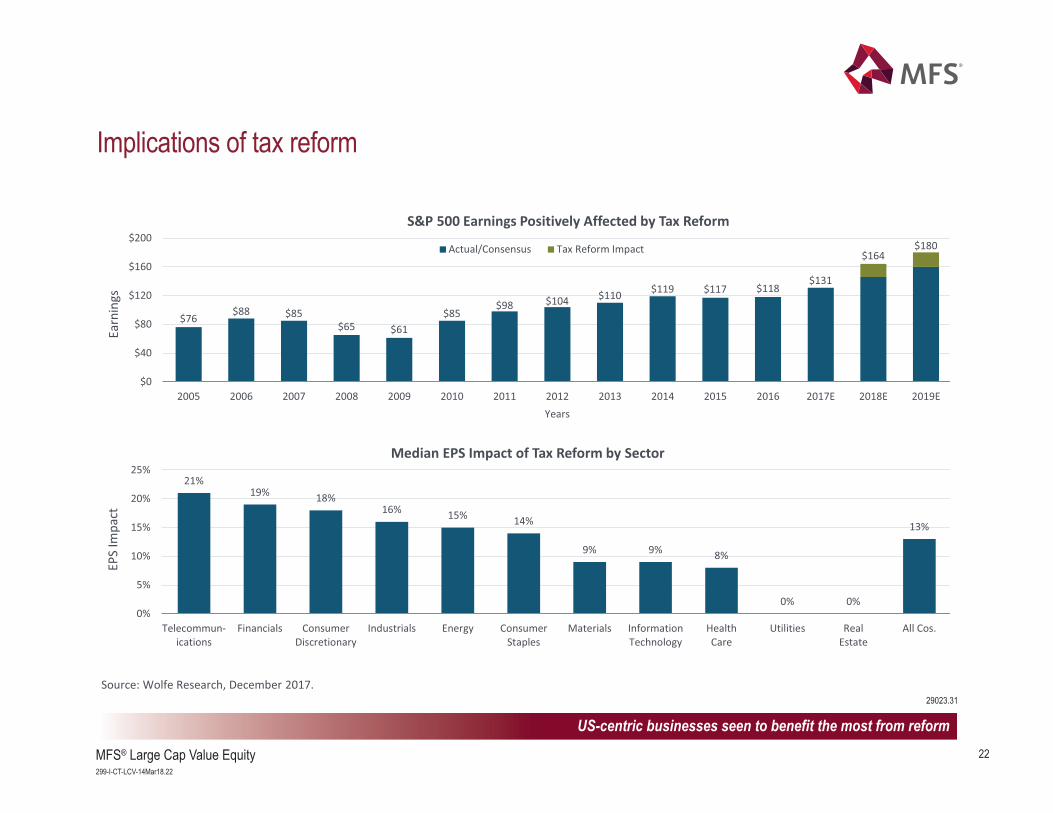
Implications of tax reform
US-centric businesses seen to benefit the most from reform
Source: Wolfe Research, December 2017.
21%19% 18%
16% 15% 14%
9% 9% 8%
0% 0%
13%
0%
5%
10%
15%
20%
25%
Telecommun-ications
Financials ConsumerDiscretionary
Industrials Energy ConsumerStaples
Materials InformationTechnology
HealthCare
Utilities RealEstate
All Cos.
EPS
Impa
ct
Median EPS Impact of Tax Reform by Sector
$76$88 $85
$65 $61$85
$98 $104 $110 $119 $117 $118$131
$164$180
$0
$40
$80
$120
$160
$200
2005 2006 2007 2008 2009 2010 2011 2012 2013 2014 2015 2016 2017E 2018E 2019E
Earn
ings
Years
S&P 500 Earnings Positively Affected by Tax Reform
Actual/Consensus Tax Reform Impact
23MFS® Large Cap Value Equity299-I-CT-LCV-14Mar18.23
Outlook As of 31 January 20182017 was a remarkable year. Global equity markets finished the year up over 23%, with international markets outpacing the US for the first time since 2012.2017 was the most record-setting year in history for the the Russell 1000 Growth and the Nasdaq with each notching over 70 new all-time highs during the year.While both the S&P 500 and Russell 1000 Value also hit several all-time highs, no records were broken and both were bested by the growthier equity indices(Russell 1000 Growth and Nasdaq). The S&P 500 posted positive returns in each month of the year for the first time since 1970. With this year being one of thecalmest in history, the Sharpe Ratio for the S&P 500 hit an astounding 5, which bests 99% of all observations going back to 1926. It was also a fantastic yearfor large cap growth stocks - particularly some of the largest technology companies who appreciated close to 50% in 2017. As a result, the Russell 1000Growth finished the year 1655bps ahead of the Russell 1000 Value, with both posting double digit returns. This year was a strong one for the MFS Large CapValue strategy, finishing up almost 18% as compared to 13.7% for the Russell 1000 Value. After a difficult finish to the year last year, all of this year's relativeoutperformance came during the first half of the year as the significant headwinds facing this strategy following the US Presidential elections abated andreversed course. Furthermore, a collapse in the correlations of stocks this year created a more favorable environment for active managers in the value spacewith approximately 75% of managers outpacing the Russell 1000 Value during the year. Encouragingly, we also started to see the dispersion of stocks withinsome sectors begin to increase. While the level of dispersion within all sectors remains below long term averages, sectors such as Utilities, Consumer Staples,Industrials and Health Care experienced more dispersion this year and are approaching their long term average. We are hopeful that the combination of lowercorrelations and increasing dispersion may usher in a more favorable environment for stock pickers over the coming years.
A late push to pass the largest tax reform bill since President Reagan overhauled the tax code in 1986 gave the market a further push in December. A permanent reduction in the US Corporate tax rate was viewed positively by investors and appears likely to have a favorable impact on the earnings growth ofmost US-based companies. Early estimates project that S&P 500 earnings could increase an incremental 11-12% for 2018 due to tax reform, with companies inthe Telecommunications, Financial Services and Consumer Discretionary seen to benefit the most. Sectors like Health Care and Technology, which generallyhave much lower-than-average effective tax rates, will benefit less, if at all. Within this portfolio, we expect that the impact should generally be neutral topositive. We haven't made changes to the portfolio as a result of changing tax policy and don't anticipate doing so moving forward.
The commentary included in this report was based on a representative fully discretionary portfolio for this product style; as such the commentary may include securities not held in your portfolio dueto account, fund, or other limits.
The views expressed are those of MFS and are subject to change at any time. These views should not be relied upon as investment advice, as securities recommendations, or as an indication oftrading intent on behalf of any other MFS investment product. No forecasts can be guaranteed.
Past performance is no guarantee of future results.34304.12
Our expectation is for a more muted absolute return environment moving forward, given the strength of returns experienced over the last several years.While it is impossible to predict the future, history has shown that buying high-quality companies at reasonable valuation adds value over the long-term.
24MFS® Large Cap Value Equity299-I-CT-LCV-14Mar18.25
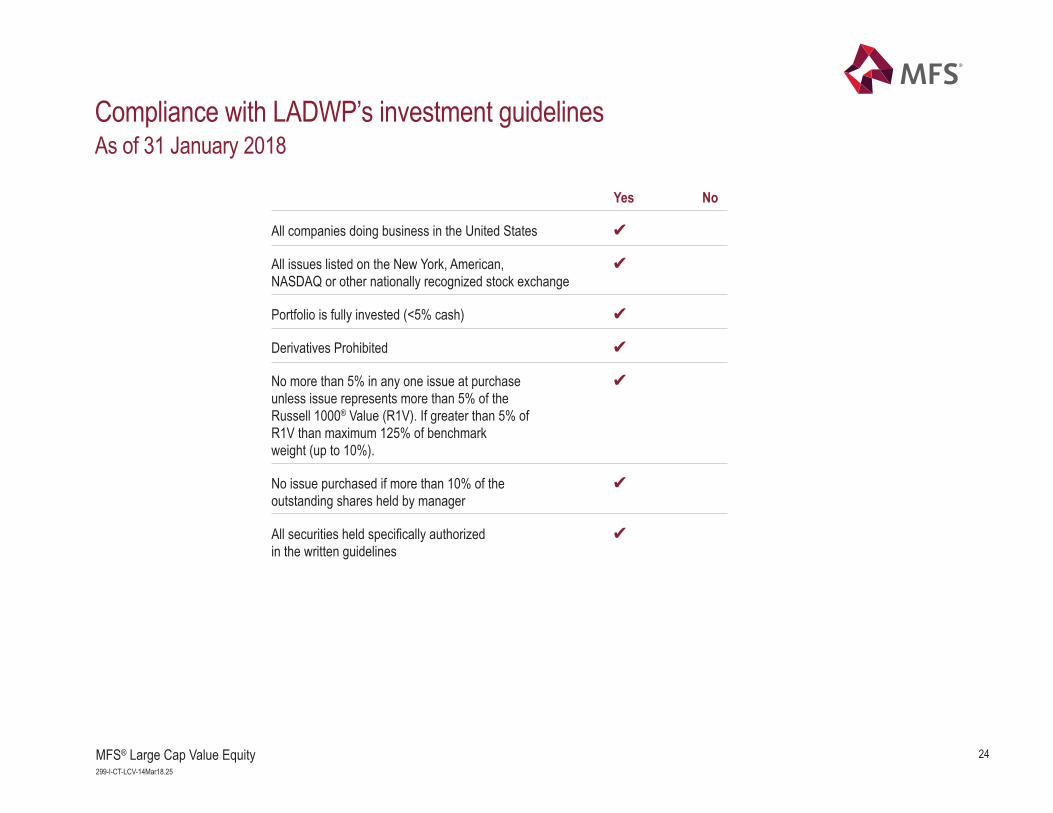
Compliance with LADWP’s investment guidelinesAs of 31 January 2018
Yes No
All companies doing business in the United States ✔All issues listed on the New York, American, ✔NASDAQ or other nationally recognized stock exchange
Portfolio is fully invested (<5% cash) ✔Derivatives Prohibited ✔No more than 5% in any one issue at purchase ✔unless issue represents more than 5% of the Russell 1000® Value (R1V). If greater than 5% of R1V than maximum 125% of benchmark weight (up to 10%).
No issue purchased if more than 10% of the ✔outstanding shares held by manager
All securities held specifically authorized ✔in the written guidelines
25MFS® Large Cap Value Equity299-I-CT-LCV-14Mar18.26
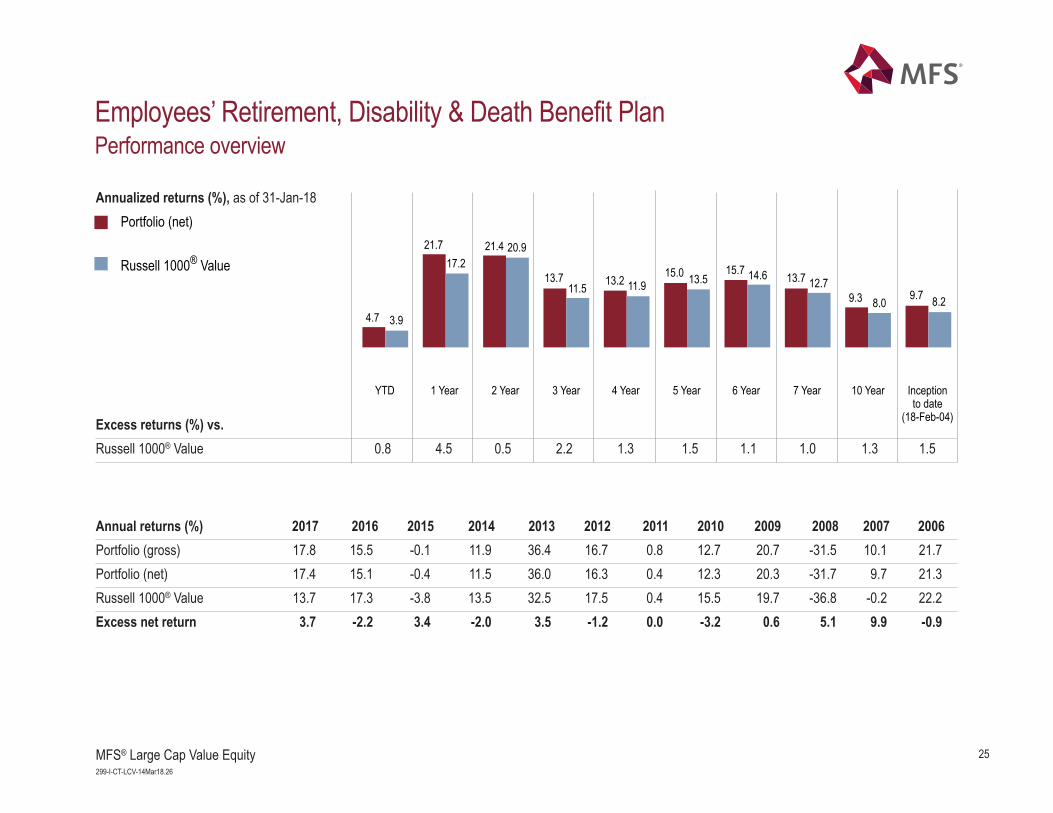
Employees’ Retirement, Disability & Death Benefit PlanPerformance overview
YTD 1 Year 2 Year 3 Year 4 Year 5 Year 6 Year 7 Year 10 Year Inception to date
(18-Feb-04)
4.7 3.9
21.717.2
21.4 20.9
13.711.5 13.2 11.9
15.0 13.515.7 14.6 13.7 12.7
9.3 8.0 9.7 8.2
Excess returns (%) vs.Russell 1000® Value 0.8 4.5 0.5 2.2 1.3 1.5 1.1 1.0 1.3 1.5
Annual returns (%) 2017 2016 2015 2014 2013 2012 2011 2010 2009 2008 2007 2006Portfolio (gross) 17.8 15.5 -0.1 11.9 36.4 16.7 0.8 12.7 20.7 -31.5 10.1 21.7Portfolio (net) 17.4 15.1 -0.4 11.5 36.0 16.3 0.4 12.3 20.3 -31.7 9.7 21.3Russell 1000® Value 13.7 17.3 -3.8 13.5 32.5 17.5 0.4 15.5 19.7 -36.8 -0.2 22.2Excess net return 3.7 -2.2 3.4 -2.0 3.5 -1.2 0.0 -3.2 0.6 5.1 9.9 -0.9
Portfolio (net)
Russell 1000® Value
Annualized returns (%), as of 31-Jan-18
26MFS® Large Cap Value Equity299-I-CT-LCV-14Mar18.27
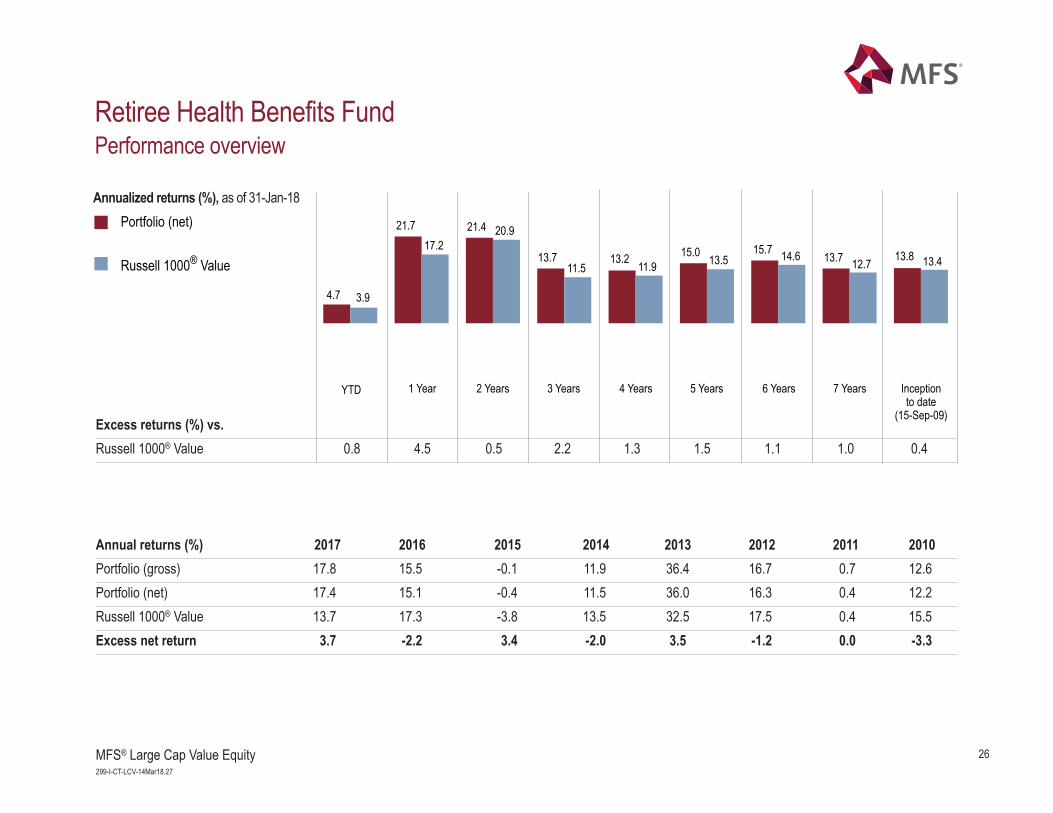
Retiree Health Benefits Fund Performance overview
Excess returns (%) vs.Russell 1000® Value 0.8 4.5 0.5 2.2 1.3 1.5 1.1 1.0 0.4
Portfolio (net)
Russell 1000® Value
Annualized returns (%), as of 31-Jan-18
Annual returns (%) 2017 2016 2015 2014 2013 2012 2011 2010Portfolio (gross) 17.8 15.5 -0.1 11.9 36.4 16.7 0.7 12.6Portfolio (net) 17.4 15.1 -0.4 11.5 36.0 16.3 0.4 12.2Russell 1000® Value 13.7 17.3 -3.8 13.5 32.5 17.5 0.4 15.5Excess net return 3.7 -2.2 3.4 -2.0 3.5 -1.2 0.0 -3.3
YTD 1 Year 2 Years 3 Years 4 Years 5 Years 6 Years 7 Years Inceptionto date
(15-Sep-09)
4.7 3.9
21.717.2
21.4 20.9
13.711.5
13.2 11.915.0 13.5
15.7 14.6 13.7 12.7 13.8 13.4
27MFS® Large Cap Value Equity299-I-CT-LCV-14Mar18.28
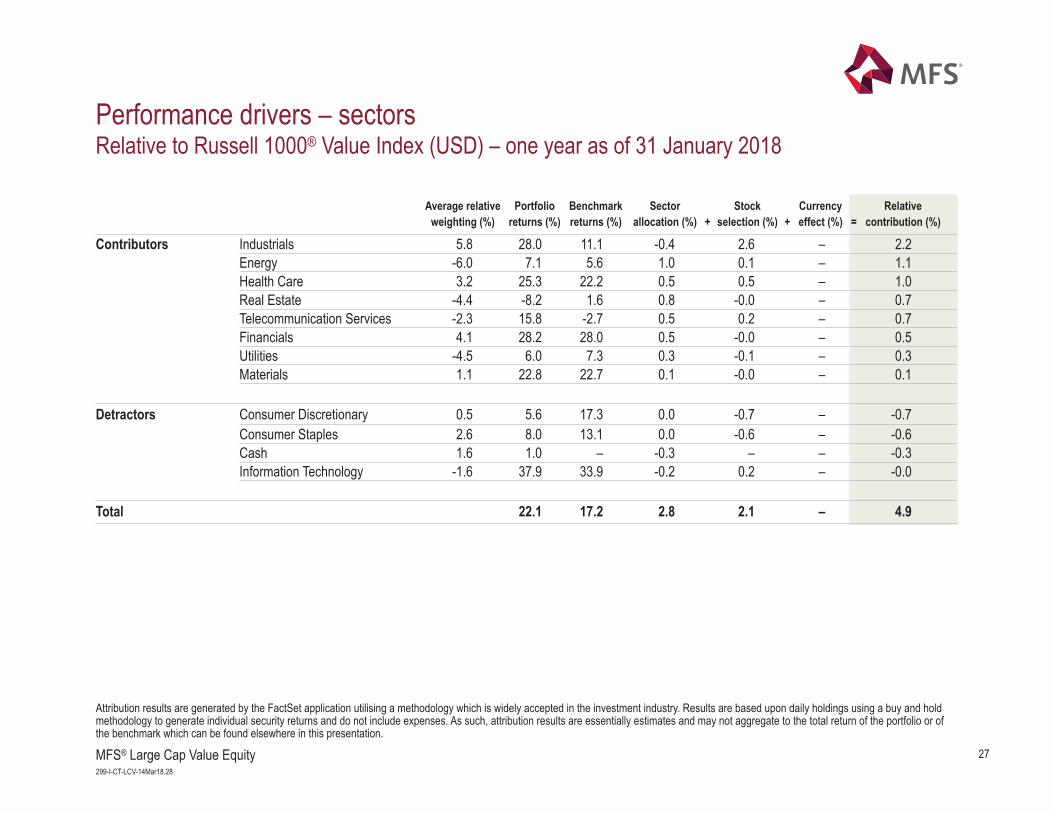
Performance drivers – sectorsRelative to Russell 1000® Value Index (USD) – one year as of 31 January 2018
Attribution results are generated by the FactSet application utilising a methodology which is widely accepted in the investment industry. Results are based upon daily holdings using a buy and holdmethodology to generate individual security returns and do not include expenses. As such, attribution results are essentially estimates and may not aggregate to the total return of the portfolio or ofthe benchmark which can be found elsewhere in this presentation.
Average relative Portfolio Benchmark Sector Stock Currency Relative weighting (%) returns (%) returns (%) allocation (%) + selection (%) + effect (%) = contribution (%)
Contributors Industrials 5.8 28.0 11.1 -0.4 2.6 .– 2.2Energy -6.0 7.1 5.6 1.0 0.1 .– 1.1Health Care 3.2 25.3 22.2 0.5 0.5 .– 1.0Real Estate -4.4 -8.2 1.6 0.8 -0.0 .– 0.7Telecommunication Services -2.3 15.8 -2.7 0.5 0.2 .– 0.7Financials 4.1 28.2 28.0 0.5 -0.0 .– 0.5Utilities -4.5 6.0 7.3 0.3 -0.1 .– 0.3Materials 1.1 22.8 22.7 0.1 -0.0 .– 0.1
Detractors Consumer Discretionary 0.5 5.6 17.3 0.0 -0.7 .– -0.7Consumer Staples 2.6 8.0 13.1 0.0 -0.6 .– -0.6Cash 1.6 1.0 .– -0.3 .– .– -0.3Information Technology -1.6 37.9 33.9 -0.2 0.2 .– -0.0
Total 22.1 17.2 2.8 2.1 .– 4.9
28MFS® Large Cap Value Equity299-I-CT-LCV-14Mar18.29
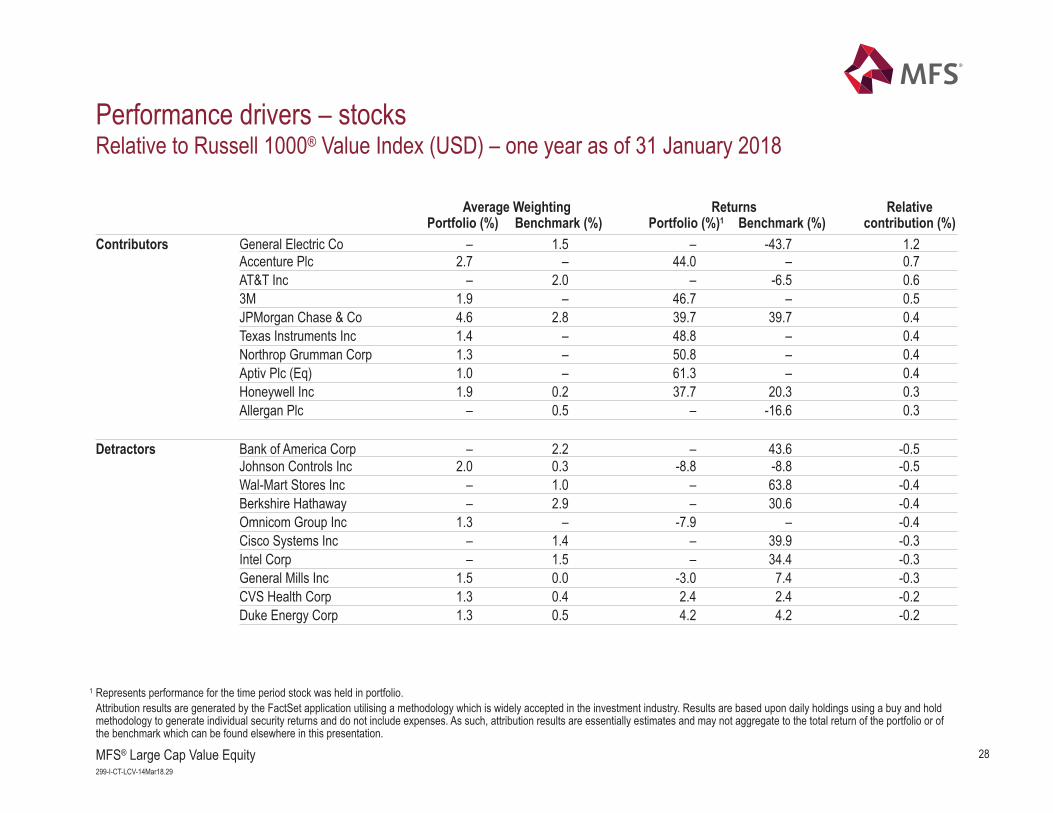
Performance drivers – stocksRelative to Russell 1000® Value Index (USD) – one year as of 31 January 2018
1 Represents performance for the time period stock was held in portfolio. Attribution results are generated by the FactSet application utilising a methodology which is widely accepted in the investment industry. Results are based upon daily holdings using a buy and holdmethodology to generate individual security returns and do not include expenses. As such, attribution results are essentially estimates and may not aggregate to the total return of the portfolio or ofthe benchmark which can be found elsewhere in this presentation.
Average Weighting Returns RelativePortfolio (%) Benchmark (%) Portfolio (%)1 Benchmark (%) contribution (%)
Contributors General Electric Co .– 1.5 .– -43.7 1.2Accenture Plc 2.7 .– 44.0 .– 0.7AT&T Inc .– 2.0 .– -6.5 0.63M 1.9 .– 46.7 .– 0.5JPMorgan Chase & Co 4.6 2.8 39.7 39.7 0.4Texas Instruments Inc 1.4 .– 48.8 .– 0.4Northrop Grumman Corp 1.3 .– 50.8 .– 0.4Aptiv Plc (Eq) 1.0 .– 61.3 .– 0.4Honeywell Inc 1.9 0.2 37.7 20.3 0.3Allergan Plc .– 0.5 .– -16.6 0.3
Detractors Bank of America Corp .– 2.2 .– 43.6 -0.5Johnson Controls Inc 2.0 0.3 -8.8 -8.8 -0.5Wal-Mart Stores Inc .– 1.0 .– 63.8 -0.4Berkshire Hathaway .– 2.9 .– 30.6 -0.4Omnicom Group Inc 1.3 .– -7.9 .– -0.4Cisco Systems Inc .– 1.4 .– 39.9 -0.3Intel Corp .– 1.5 .– 34.4 -0.3General Mills Inc 1.5 0.0 -3.0 7.4 -0.3CVS Health Corp 1.3 0.4 2.4 2.4 -0.2Duke Energy Corp 1.3 0.5 4.2 4.2 -0.2
29MFS® Large Cap Value Equity299-I-CT-LCV-14Mar18.30
Source: Barra. The Barra information may only be used for your internal use, may not be reproduced or redisseminated in any form and may not be used to create any financial instruments or products or any indices. The Barra information is provided on an "as is" basis and the user of this information assumes the entire risk of any use made of this information. Barra, each of its affiliates and each other person involved in or related to compiling, computing or creating any Barra information (collectively, the "Barra Parties") expressly disclaims all warranties (including
without limitation, any warranties of originality, accuracy, completeness, timeliness, non-infringement, merchantability and fitness for a particular purpose) with respect to this information. Without limiting any of the foregoing, in no event shall any Barra Party have any liability for any direct, indirect, special, incidental, punitive, consequential (including, without limitation, lost profits) or any other damages.
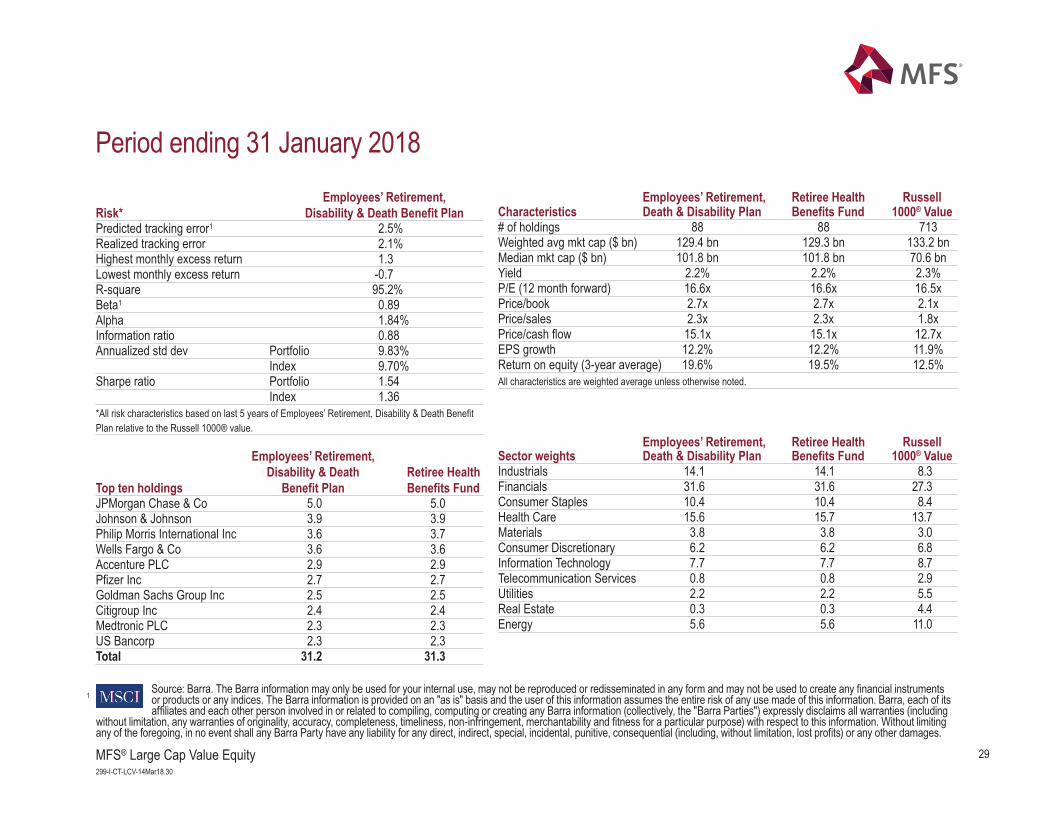
Period ending 31 January 2018Employees’ Retirement, Retiree Health Russell
Characteristics Death & Disability Plan Benefits Fund 1000® Value# of holdings 88 88 713Weighted avg mkt cap ($ bn) 129.4 bn 129.3 bn 133.2 bnMedian mkt cap ($ bn) 101.8 bn 101.8 bn 70.6 bnYield 2.2% 2.2% 2.3%P/E (12 month forward) 16.6x 16.6x 16.5xPrice/book 2.7x 2.7x 2.1xPrice/sales 2.3x 2.3x 1.8xPrice/cash flow 15.1x 15.1x 12.7xEPS growth 12.2% 12.2% 11.9%Return on equity (3-year average) 19.6% 19.5% 12.5%All characteristics are weighted average unless otherwise noted.
Employees’ Retirement, Retiree Health RussellSector weights Death & Disability Plan Benefits Fund 1000® ValueIndustrials 14.1 14.1 8.3Financials 31.6 31.6 27.3 Consumer Staples 10.4 10.4 8.4Health Care 15.6 15.7 13.7Materials 3.8 3.8 3.0Consumer Discretionary 6.2 6.2 6.8Information Technology 7.7 7.7 8.7Telecommunication Services 0.8 0.8 2.9 Utilities 2.2 2.2 5.5 Real Estate 0.3 0.3 4.4Energy 5.6 5.6 11.0
Employees’ Retirement, Risk* Disability & Death Benefit PlanPredicted tracking error1 2.5%Realized tracking error 2.1%Highest monthly excess return 1.3Lowest monthly excess return -0.7R-square 95.2%Beta1 0.89Alpha 1.84%Information ratio 0.88Annualized std dev Portfolio 9.83%
Index 9.70%Sharpe ratio Portfolio 1.54
Index 1.36*All risk characteristics based on last 5 years of Employees’ Retirement, Disability & Death BenefitPlan relative to the Russell 1000® value.
Employees’ Retirement,Disability & Death Retiree Health
Top ten holdings Benefit Plan Benefits FundJPMorgan Chase & Co 5.0 5.0Johnson & Johnson 3.9 3.9Philip Morris International Inc 3.6 3.7Wells Fargo & Co 3.6 3.6Accenture PLC 2.9 2.9Pfizer Inc 2.7 2.7Goldman Sachs Group Inc 2.5 2.5Citigroup Inc 2.4 2.4Medtronic PLC 2.3 2.3US Bancorp 2.3 2.3Total 31.2 31.3
1
30MFS® Large Cap Value Equity299-I-CT-LCV-14Mar18.31
Dec2000
Dec2001
Dec2002
Dec2003
Dec2004
Dec2005
Dec2006
Dec2007
Dec2008
Dec2009
Dec2010
Dec2011
Dec2012
Dec2013
Dec2014
Dec2015
Dec2016
Dec2017
75
100
125
150
175
200
225
Perce
nt (%
)
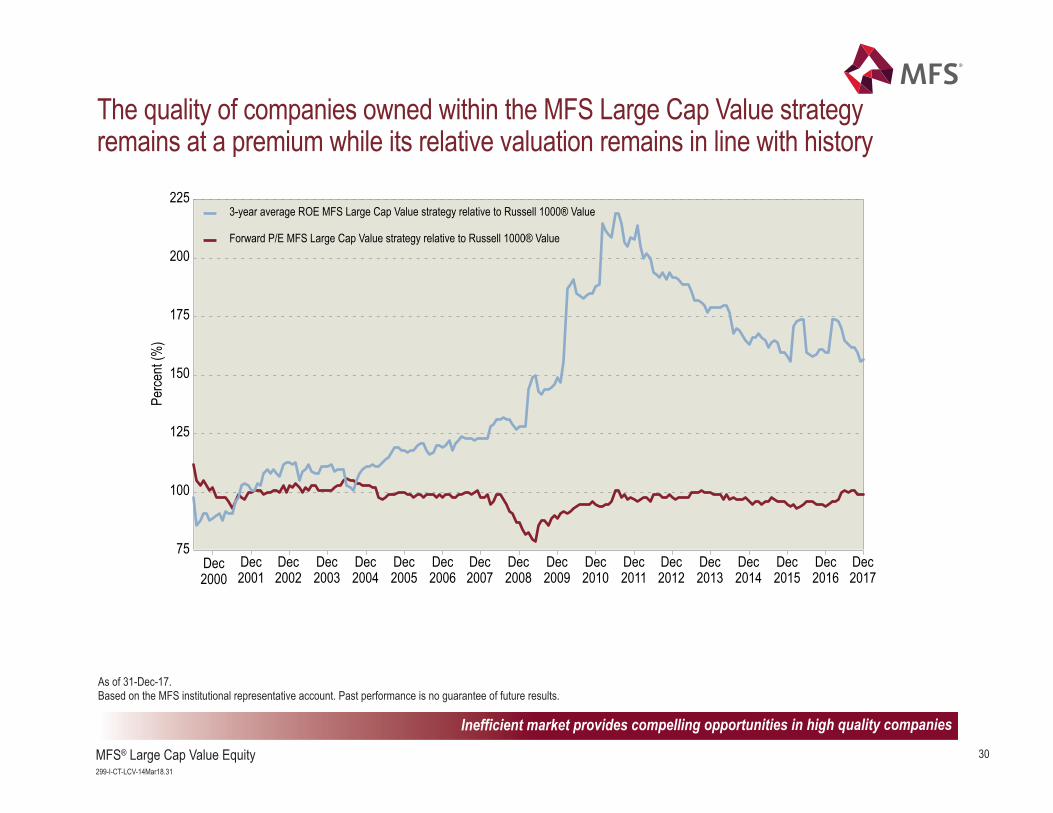
Forward P/E MFS Large Cap Value strategy relative to Russell 1000® Value
3-year average ROE MFS Large Cap Value strategy relative to Russell 1000® Value
As of 31-Dec-17.Based on the MFS institutional representative account. Past performance is no guarantee of future results.
The quality of companies owned within the MFS Large Cap Value strategy remains at a premium while its relative valuation remains in line with history
Inefficient market provides compelling opportunities in high quality companies
31MFS® Large Cap Value Equity299-I-CT-LCV-14Mar18.32
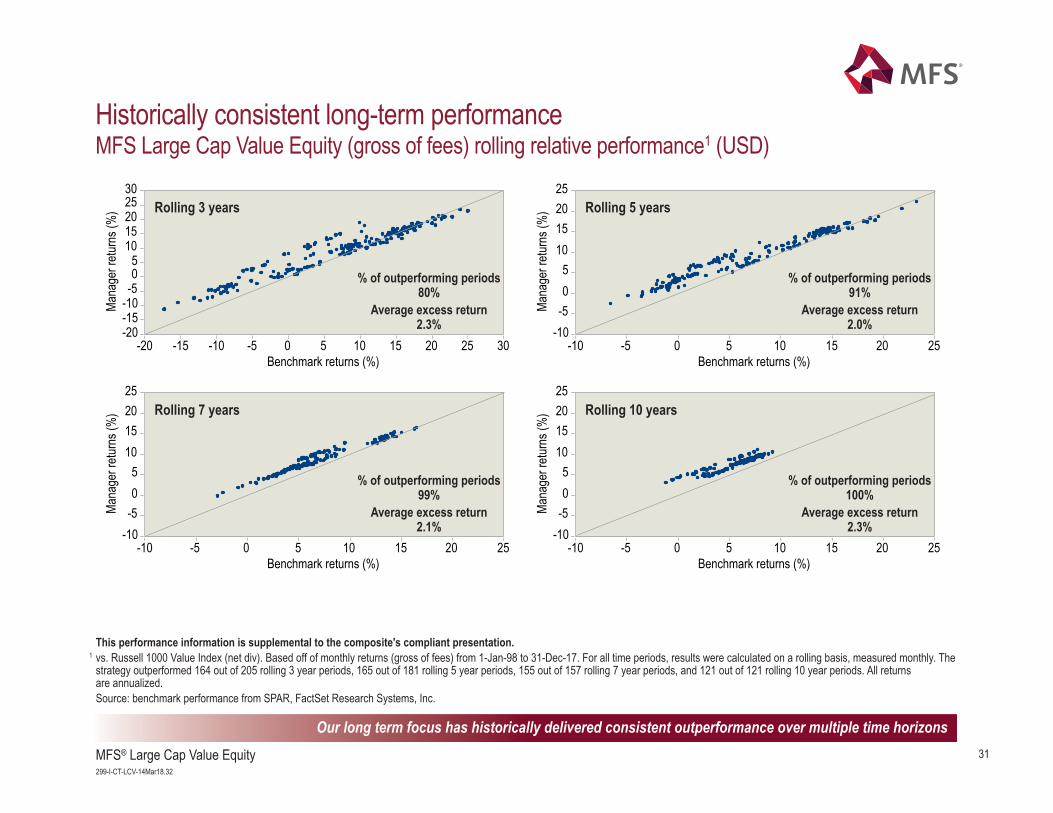
Historically consistent long-term performanceMFS Large Cap Value Equity (gross of fees) rolling relative performance1 (USD)
-20-15-10-505
1015202530
-20 -15 -10 -5 0 5 10 15 20 25 30
Mana
ger r
eturn
s (%
)
Benchmark returns (%)
-10-505
10152025
-10 -5 0 5 10 15 20 25
Mana
ger r
eturn
s (%
)
Benchmark returns (%)
-10-505
10152025
-10 -5 0 5 10 15 20 25
Mana
ger r
eturn
s (%
)
Benchmark returns (%)
-10-505
10152025
-10 -5 0 5 10 15 20 25Ma
nage
r retu
rns (
%)
Benchmark returns (%)
Rolling 3 years
This performance information is supplemental to the composite's compliant presentation.1 vs. Russell 1000 Value Index (net div). Based off of monthly returns (gross of fees) from 1-Jan-98 to 31-Dec-17. For all time periods, results were calculated on a rolling basis, measured monthly. The
strategy outperformed 164 out of 205 rolling 3 year periods, 165 out of 181 rolling 5 year periods, 155 out of 157 rolling 7 year periods, and 121 out of 121 rolling 10 year periods. All returns are annualized.
Source: benchmark performance from SPAR, FactSet Research Systems, Inc.
Our long term focus has historically delivered consistent outperformance over multiple time horizons
% of outperforming periods 80%
Average excess return2.3%
Rolling 5 years
% of outperforming periods 91%
Average excess return2.0%
Rolling 7 years
% of outperforming periods 99%
Average excess return2.1%
Rolling 10 years
% of outperforming periods 100%
Average excess return2.3%
32MFS® Large Cap Value Equity299-I-CT-LCV-14Mar18.33
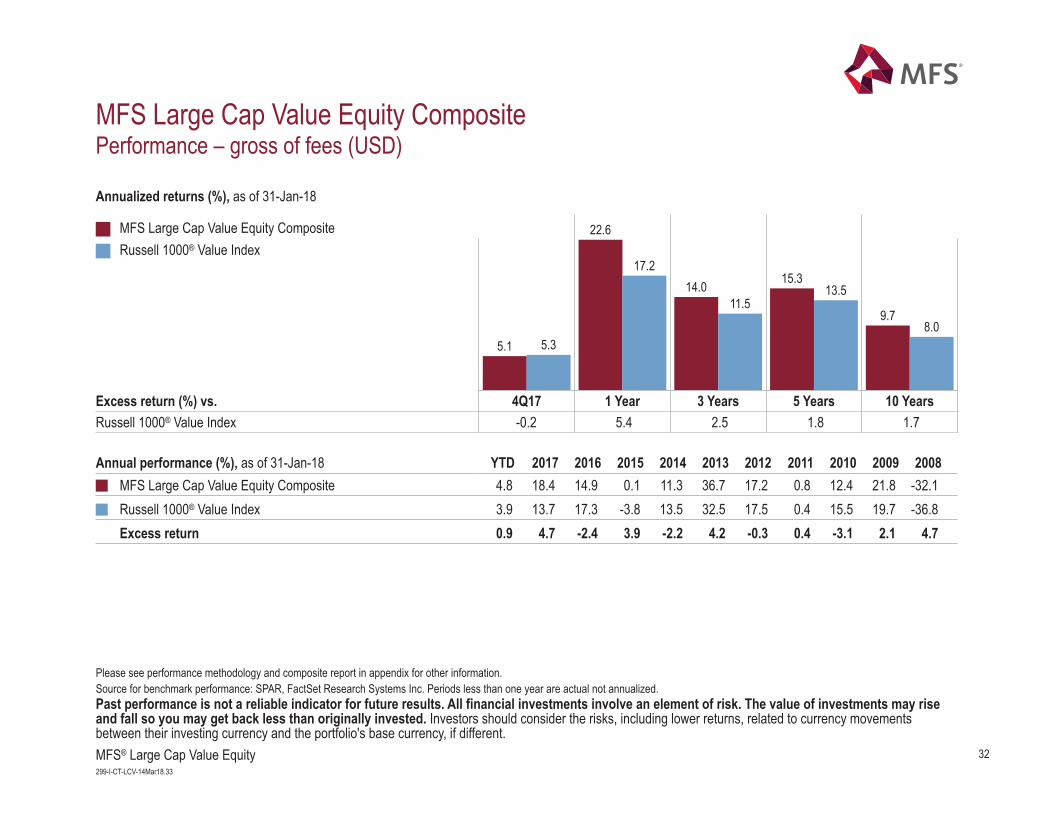
MFS Large Cap Value Equity CompositePerformance – gross of fees (USD)
Annualized returns (%), as of 31-Jan-18
Annual performance (%), as of 31-Jan-18 YTD 2017 2016 2015 2014 2013 2012 2011 2010 2009 2008
MFS Large Cap Value Equity CompositeRussell 1000® Value Index
5.1
22.6
14.0 15.3
9.7
5.3
17.2
11.513.5
8.0
4Q17 1 Year 3 Years 5 Years 10 YearsExcess return (%) vs.Russell 1000® Value Index -0.2 5.4 2.5 1.8 1.7
MFS Large Cap Value Equity Composite 4.8 18.4 14.9 0.1 11.3 36.7 17.2 0.8 12.4 21.8 -32.1 Russell 1000® Value Index 3.9 13.7 17.3 -3.8 13.5 32.5 17.5 0.4 15.5 19.7 -36.8 Excess return 0.9 4.7 -2.4 3.9 -2.2 4.2 -0.3 0.4 -3.1 2.1 4.7
Past performance is not a reliable indicator for future results. All financial investments involve an element of risk. The value of investments may riseand fall so you may get back less than originally invested. Investors should consider the risks, including lower returns, related to currency movementsbetween their investing currency and the portfolio's base currency, if different.
Please see performance methodology and composite report in appendix for other information. Source for benchmark performance: SPAR, FactSet Research Systems Inc. Periods less than one year are actual not annualized.
33MFS® Large Cap Value Equity299-I-CT-LCV-14Mar18.34
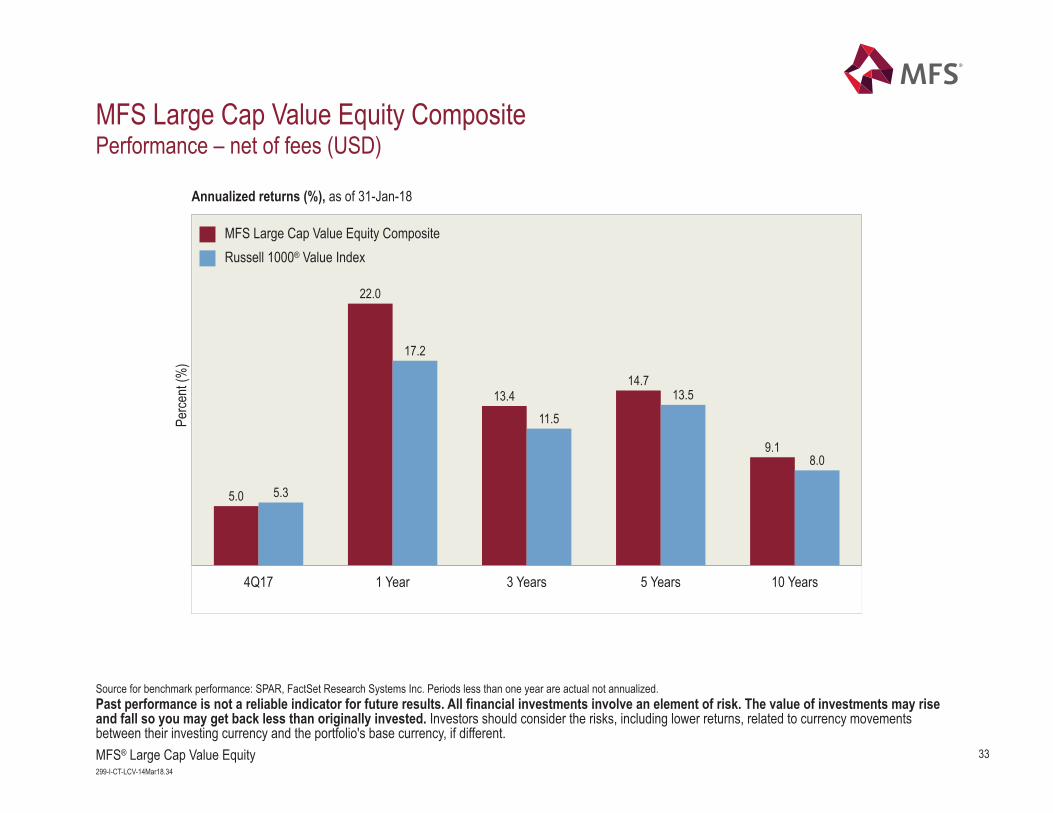
MFS Large Cap Value Equity CompositePerformance – net of fees (USD)
Annualized returns (%), as of 31-Jan-18
Past performance is not a reliable indicator for future results. All financial investments involve an element of risk. The value of investments may riseand fall so you may get back less than originally invested. Investors should consider the risks, including lower returns, related to currency movementsbetween their investing currency and the portfolio's base currency, if different.
Perce
nt (%
)
Source for benchmark performance: SPAR, FactSet Research Systems Inc. Periods less than one year are actual not annualized.
MFS Large Cap Value Equity CompositeRussell 1000® Value Index
5.0
22.0
13.414.7
9.1
5.3
17.2
11.5
13.5
8.0
4Q17 1 Year 3 Years 5 Years 10 Years
34MFS® Large Cap Value Equity299-I-CT-LCV-14Mar18.35
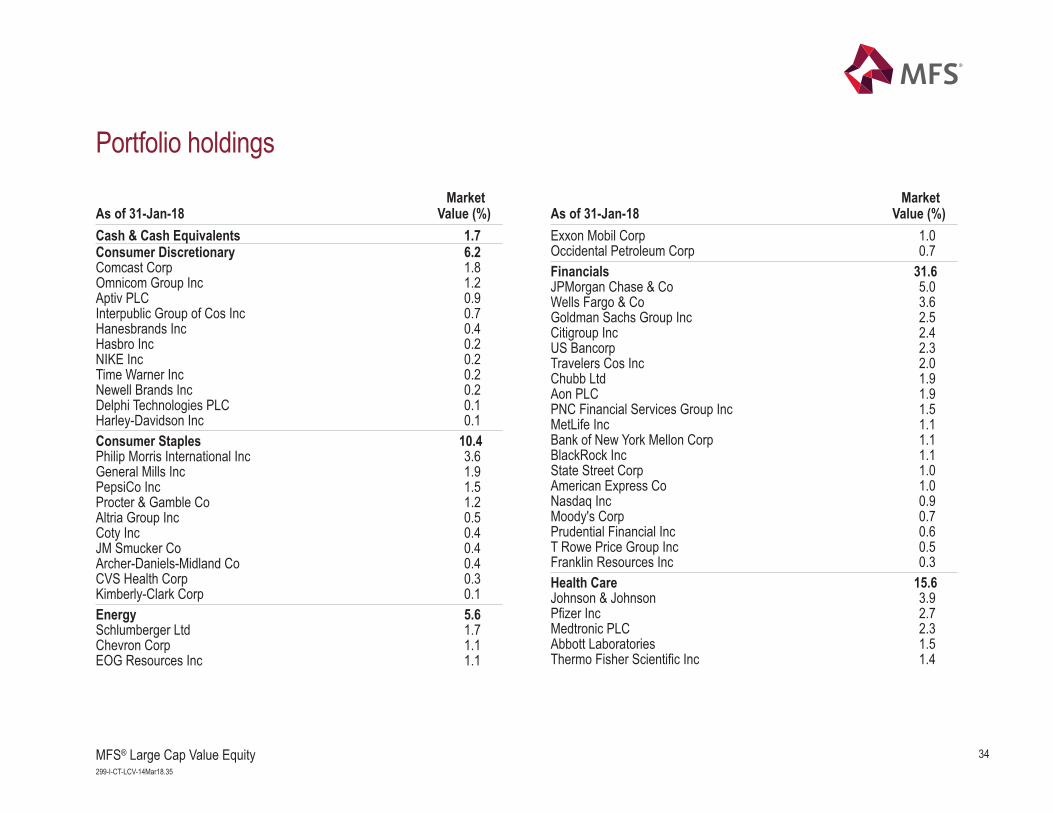
Portfolio holdingsMarket
As of 31-Jan-18 Value (%)Market
As of 31-Jan-18 Value (%)Cash & Cash Equivalents 1.7Consumer Discretionary 6.2Comcast Corp 1.8Omnicom Group Inc 1.2Aptiv PLC 0.9Interpublic Group of Cos Inc 0.7Hanesbrands Inc 0.4Hasbro Inc 0.2NIKE Inc 0.2Time Warner Inc 0.2Newell Brands Inc 0.2Delphi Technologies PLC 0.1Harley-Davidson Inc 0.1Consumer Staples 10.4Philip Morris International Inc 3.6General Mills Inc 1.9PepsiCo Inc 1.5Procter & Gamble Co 1.2Altria Group Inc 0.5Coty Inc 0.4JM Smucker Co 0.4Archer-Daniels-Midland Co 0.4CVS Health Corp 0.3Kimberly-Clark Corp 0.1Energy 5.6Schlumberger Ltd 1.7Chevron Corp 1.1EOG Resources Inc 1.1
Exxon Mobil Corp 1.0Occidental Petroleum Corp 0.7Financials 31.6JPMorgan Chase & Co 5.0Wells Fargo & Co 3.6Goldman Sachs Group Inc 2.5Citigroup Inc 2.4US Bancorp 2.3Travelers Cos Inc 2.0Chubb Ltd 1.9Aon PLC 1.9PNC Financial Services Group Inc 1.5MetLife Inc 1.1Bank of New York Mellon Corp 1.1BlackRock Inc 1.1State Street Corp 1.0American Express Co 1.0Nasdaq Inc 0.9Moody's Corp 0.7Prudential Financial Inc 0.6T Rowe Price Group Inc 0.5Franklin Resources Inc 0.3Health Care 15.6Johnson & Johnson 3.9Pfizer Inc 2.7Medtronic PLC 2.3Abbott Laboratories 1.5Thermo Fisher Scientific Inc 1.4
35MFS® Large Cap Value Equity299-I-CT-LCV-14Mar18.36
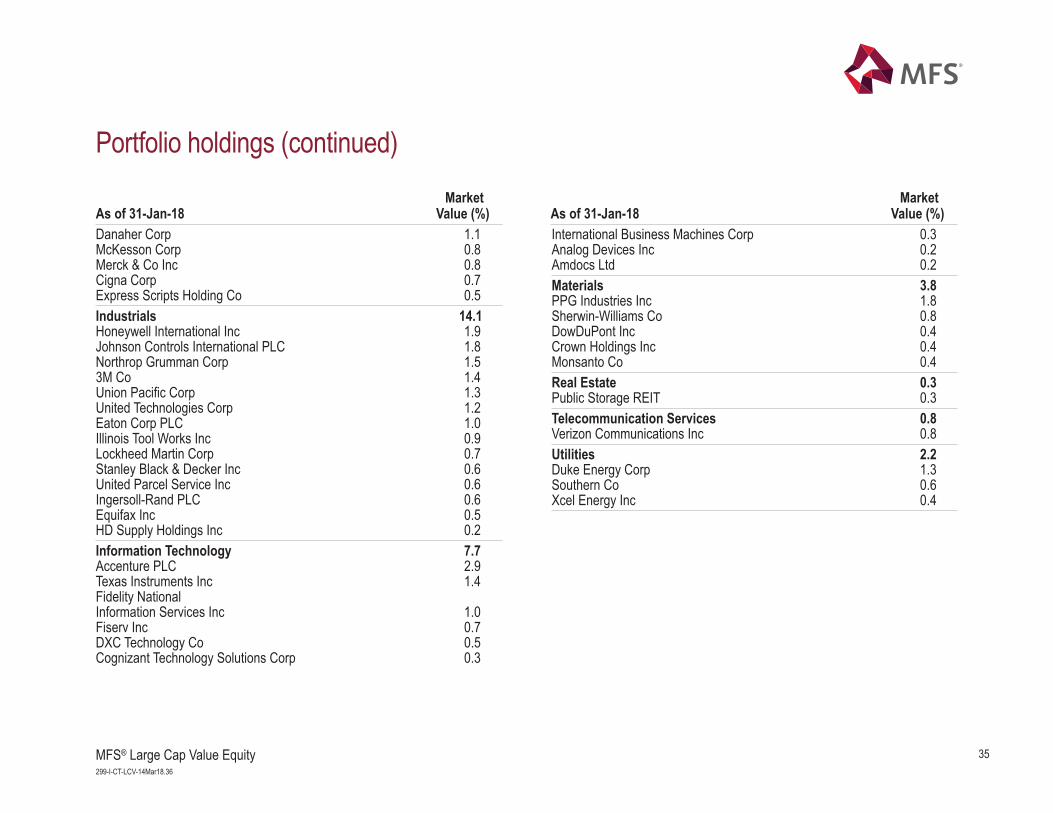
Portfolio holdings (continued)
Danaher Corp 1.1McKesson Corp 0.8Merck & Co Inc 0.8Cigna Corp 0.7Express Scripts Holding Co 0.5Industrials 14.1Honeywell International Inc 1.9Johnson Controls International PLC 1.8Northrop Grumman Corp 1.53M Co 1.4Union Pacific Corp 1.3United Technologies Corp 1.2Eaton Corp PLC 1.0Illinois Tool Works Inc 0.9Lockheed Martin Corp 0.7Stanley Black & Decker Inc 0.6United Parcel Service Inc 0.6Ingersoll-Rand PLC 0.6Equifax Inc 0.5HD Supply Holdings Inc 0.2Information Technology 7.7Accenture PLC 2.9Texas Instruments Inc 1.4Fidelity NationalInformation Services Inc 1.0Fiserv Inc 0.7DXC Technology Co 0.5Cognizant Technology Solutions Corp 0.3
International Business Machines Corp 0.3Analog Devices Inc 0.2Amdocs Ltd 0.2Materials 3.8PPG Industries Inc 1.8Sherwin-Williams Co 0.8DowDuPont Inc 0.4Crown Holdings Inc 0.4Monsanto Co 0.4Real Estate 0.3Public Storage REIT 0.3Telecommunication Services 0.8Verizon Communications Inc 0.8Utilities 2.2Duke Energy Corp 1.3Southern Co 0.6Xcel Energy Inc 0.4
MarketAs of 31-Jan-18 Value (%)
MarketAs of 31-Jan-18 Value (%)
36MFS® Large Cap Value Equity299-I-CT-LCV-14Mar18.37
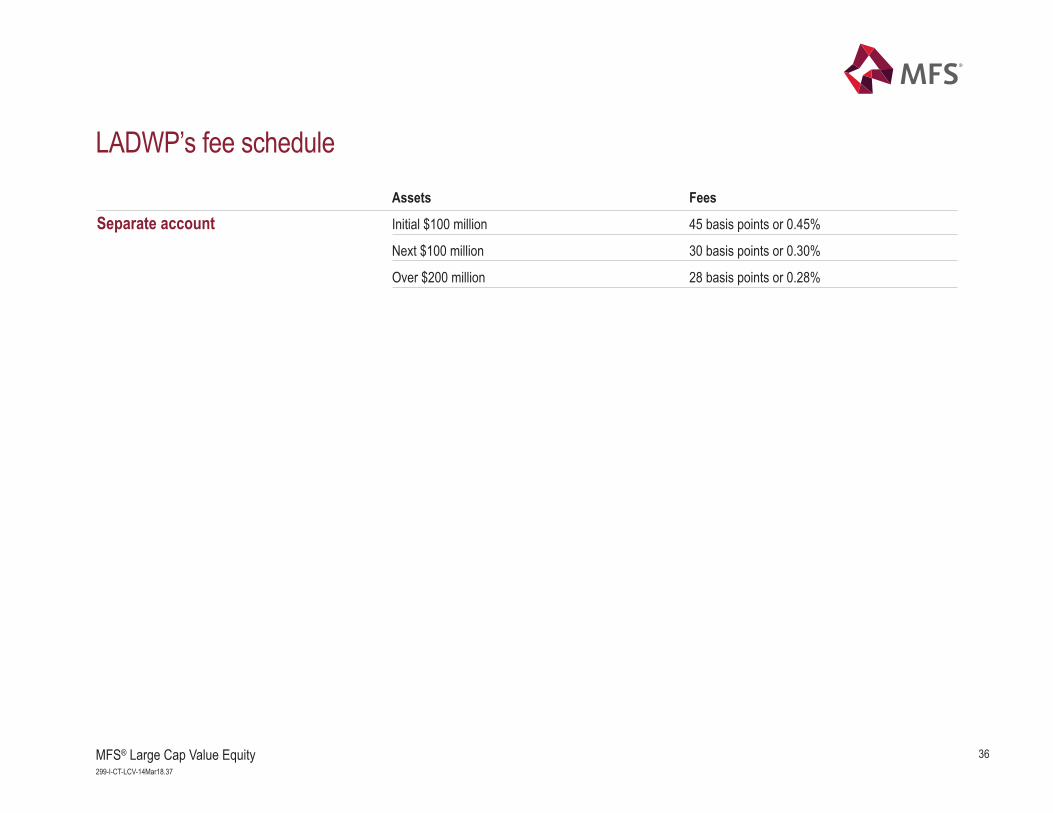
Assets Fees
Separate account Initial $100 million 45 basis points or 0.45%
Next $100 million 30 basis points or 0.30%
Over $200 million 28 basis points or 0.28%
LADWP’s fee schedule
37MFS® Large Cap Value Equity299-I-CT-LCV-14Mar18.38
AppendixContents Page
Glossary of terms 39
Composite report (USD) 42
38MFS® Large Cap Value Equity299-I-CT-LCV-14Mar18.39
Glossary of termsAlpha is a measure of the difference between a portfolio's actual returns and its expected performance, given its level of risk asmeasured by beta. A positive alpha figure indicates the portfolio has performed better than its beta would predict. In contrast, anegative alpha indicates the portfolio's underperformance, given the expectations established by the fund's beta.
Beta is a measure of a portfolio's sensitivity to market movements. The beta of the market is 1.00 by definition. A portfolio with abeta of 0.85 would indicate that the portfolio is expected to perform 15% worse that the market's excess return during up marketsand 15% better during down markets , assuming all other factors remain constant.
Earnings-per-share (EPS) growth represents the annualized rate of net-income-per-share growth over the trailing three-yearperiod for the stocks held by the portfolio. Earnings-per-share growth gives a good picture of the rate at which a company hasgrown its profitability per unit of equity.
Excess return is defined as the portfolio's achieved rate of return minus the benchmark return over the same period.
Information ratio is a measure of risk adjusted performance. Dividing the portfolio active return by portfolio tracking error givesyou the information ratio.
Predicted tracking error (also called active risk) is a measure of the expected deviation from the benchmark.
Price/book ratio of the portfolio is the weighted average of the price/book ratios of all the stocks in the portfolio. Book value is thetotal assets of a company, less total liabilities. A company's book value is calculated by dividing the market price of its outstandingstock by the company's book value, and then adjusting for the number of shares outstanding (Stocks with negative book valuesare excluded from this calculation.). The price/book ratio can tell investors approximately how much they're paying for acompany's assets, based on historical, rather than current, valuations.
Price/cash flow is a stock's current price divided by the trailing 12-month cash flow per share. For the portfolio this numberrepresents the weighted average of the price/cash-flow ratios of the stocks in the portfolio. Price/cash-flow represents the amountan investor is willing to pay for a dollar generated from a particular company's operations. Price/cash-flow shows the ability of abusiness to generate cash and acts as a gauge of liquidity and solvency.
39MFS® Large Cap Value Equity299-I-CT-LCV-14Mar18.40
Glossary of terms (continued)P/E (12 month forward) is a stock's current price divided by the company's trailing 12-month earnings per share. The (P/E) ratioof the portfolio is the weighted average of the price/earnings ratios of the stocks in the portfolio. The P/E ratio of a company,which is a comparison of the cost of the company's stock and its expected next 12-month earnings per share, is calculated bydividing these two figures.
Price/sales is a stock's current price divided by the company's trailing 12-month sales per share. For the portfolio this numberrepresents the weighted average of the price/sales ratios of the stocks in the portfolio. Price/sales represents the amount aninvestor is willing to pay for a dollar generated from a particular company's operations.
R-Squared is the measure of correlation between a portfolio and the market (benchmark). Values range between 0 and 1. Thehigher the value of R-Square, the greater the correlation between the two. R-squared can be used to determine the significanceof a particular beta or alpha. Generally, a higher R-squared will indicate a more useful beta figure. If the R-squared is lower, thenthe beta is less relevant to the fund's performance.
Realized tracking error (also called active risk) is a measure of the actual deviation from the benchmark.
Return on Equity (ROE) represents the amount of net income returned as a percentage of shareholders equity. Return on equitymeasures a corporation's profitability by revealing how much profit a company generates with the money shareholders haveinvested. ROE can be one measure of quality of a company.
Sharpe Ratio is calculated by using standard deviation and excess return to determine reward per unit of risk. The higher theSharpe ratio, the better the portfolio's historical risk-adjusted performance.
Standard Deviation is a statistical measurement of dispersion about an average and depicts how widely a portfolio's returnsvaried over a certain period of time. When a portfoliohas a high standard deviation, the predicted range of performance is wide,implying greater volatility.
40MFS® Large Cap Value Equity299-I-CT-LCV-14Mar18.41
DisclosureIssued in the United States by MFS Institutional Advisors, Inc., a U.S.-based investment advisor and subsidiary of Massachusetts Financial Services Company ("MFS"). Issued inCanada by MFS Investment Management Canada Limited. No securities commission or similar regulatory authority in Canada has reviewed this communication. Issued in theUnited Kingdom by MFS International (U.K.) Limited ("MIL UK"), a private limited company registered in England and Wales with the company number 03062718, and authorisedand regulated in the conduct of investment business by the UK Financial Conduct Authority. MIL UK, an indirect subsidiary of MFS®, has its registered office at One Carter Lane,London, EC4V 5ER and provides products and investment services to institutional investors globally. This material shall not be circulated or distributed to any person other than toprofessional investors (as permitted by local regulations) and should not be relied upon or distributed to persons where such reliance or distribution would be contrary to localregulation. Issued in Hong Kong by MFS International (Hong Kong) Limited ("MIL HK"), a private limited company licensed and regulated by the Hong Kong Securities andFutures Commission (the "SFC"). MIL HK is a wholly-owned, indirect subsidiary of Massachusetts Financial Services Company, a US-based investment advisor and fund sponsorregistered with the US Securities and Exchange Commission. MIL HK is approved to engage in dealing in securities and asset management regulated activities and may providecertain investment services to "professional investors" as defined in the Securities and Futures Ordinance ("SFO"). Issued in Singapore by MFS International Singapore Pte. Ltd.,a private limited company registered in Singapore with the company number 201228809M, and further licensed and regulated by the Monetary Authority of Singapore.
For investors in Australia: MFSI and MIL UK are exempt from the requirement to hold an Australian financial services licence under the Corporations Act 2001 in respect of thefinancial services they provide to Australian wholesale investors. MFS International Australia Pty Ltd (“MFS Australia”) holds an Australian financial services licence number485343. In Australia and New Zealand: MFSI is regulated by the SEC under US laws and MIL UK is regulated by the UK Financial Conduct Authority under UK laws, which differfrom Australian and New Zealand laws. MFS Australia is regulated by the Australian Securities and Investments Commission.
This material is directed at investment professionals for general information use only with no consideration given to the specific investment objective, financial situation andparticular needs of any specific person. Any securities and/or sectors mentioned herein are for illustration purposes and should not be construed as a recommendation forinvestment. Investment involves risk. Past performance is not indicative of future performance. The information contained herein may not be copied, reproduced or redistributedwithout the express consent of MFS Investment Management (“MFS”). While the information is believed to be accurate, it may be subject to change without notice. MFS does notwarrant or represent that it is free from errors or omissions or that the information is suitable for any particular person’s intended use. Except in so far as any liability under any lawcannot be excluded, MFS does not accept liability for any inaccuracy or for the investment decisions or any other actions taken by any person on the basis of the materialincluded. MFS does not authorise distribution to retail investors.
Unless otherwise indicated, logos, product and services names are trademarks of MFS and its affiliates and may be registered in certain countries.
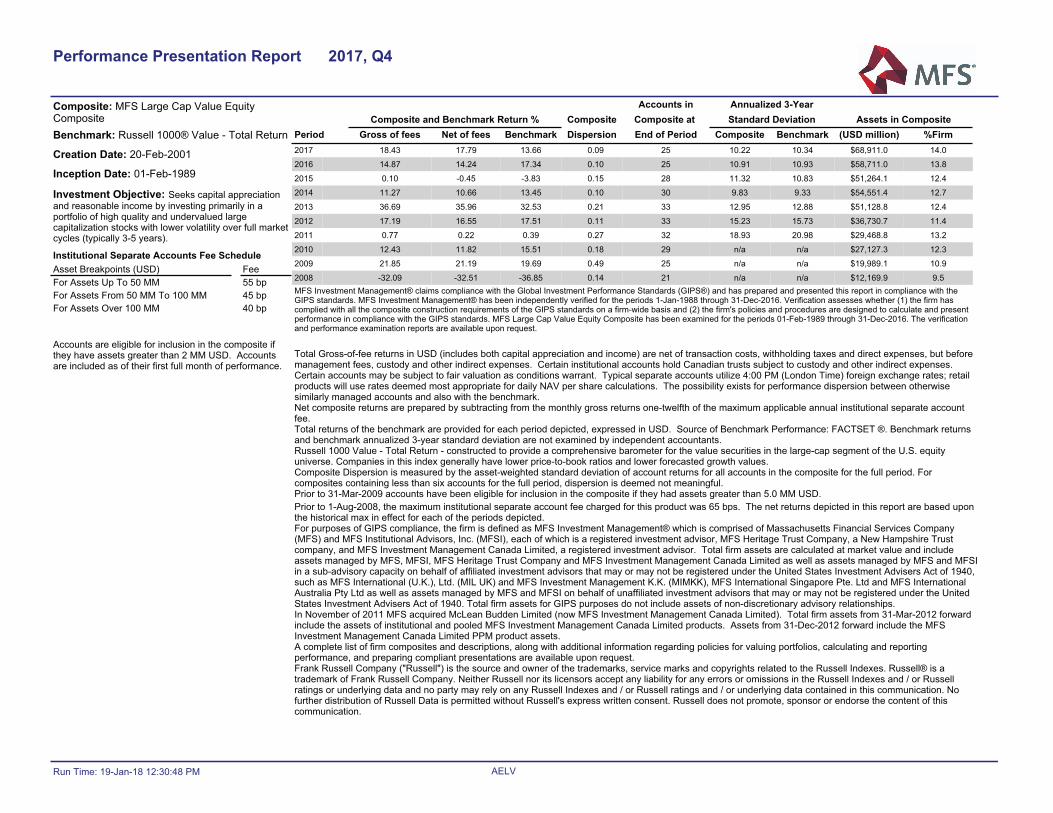
Composite: MFS Large Cap Value Equity CompositeBenchmark: Russell 1000® Value - Total Return
Creation Date: 20-Feb-2001
Inception Date: 01-Feb-1989
Investment Objective: Seeks capital appreciation and reasonable income by investing primarily in a portfolio of high quality and undervalued large capitalization stocks with lower volatility over full market cycles (typically 3-5 years).
Institutional Separate Accounts Fee ScheduleAsset Breakpoints (USD) FeeFor Assets Up To 50 MM 55 bpFor Assets From 50 MM To 100 MM 45 bpFor Assets Over 100 MM 40 bp
Accounts are eligible for inclusion in the composite if they have assets greater than 2 MM USD. Accounts are included as of their first full month of performance.
Accounts in Annualized 3-YearComposite and Benchmark Return % Composite Composite at Standard Deviation Assets in Composite
Period Gross of fees Net of fees Benchmark Dispersion End of Period Composite Benchmark (USD million) %Firm2017 18.43 17.79 13.66 0.09 25 10.22 10.34 $68,911.0 14.0
2016 14.87 14.24 17.34 0.10 25 10.91 10.93 $58,711.0 13.8
2015 0.10 -0.45 -3.83 0.15 28 11.32 10.83 $51,264.1 12.4
2014 11.27 10.66 13.45 0.10 30 9.83 9.33 $54,551.4 12.7
2013 36.69 35.96 32.53 0.21 33 12.95 12.88 $51,128.8 12.4
2012 17.19 16.55 17.51 0.11 33 15.23 15.73 $36,730.7 11.4
2011 0.77 0.22 0.39 0.27 32 18.93 20.98 $29,468.8 13.2
2010 12.43 11.82 15.51 0.18 29 n/a n/a $27,127.3 12.3
2009 21.85 21.19 19.69 0.49 25 n/a n/a $19,989.1 10.9
2008 -32.09 -32.51 -36.85 0.14 21 n/a n/a $12,169.9 9.5MFS Investment Management® claims compliance with the Global Investment Performance Standards (GIPS®) and has prepared and presented this report in compliance with the GIPS standards. MFS Investment Management® has been independently verified for the periods 1-Jan-1988 through 31-Dec-2016. Verification assesses whether (1) the firm has complied with all the composite construction requirements of the GIPS standards on a firm-wide basis and (2) the firm's policies and procedures are designed to calculate and present performance in compliance with the GIPS standards. MFS Large Cap Value Equity Composite has been examined for the periods 01-Feb-1989 through 31-Dec-2016. The verification and performance examination reports are available upon request.
Total Gross-of-fee returns in USD (includes both capital appreciation and income) are net of transaction costs, withholding taxes and direct expenses, but before management fees, custody and other indirect expenses. Certain institutional accounts hold Canadian trusts subject to custody and other indirect expenses. Certain accounts may be subject to fair valuation as conditions warrant. Typical separate accounts utilize 4:00 PM (London Time) foreign exchange rates; retail products will use rates deemed most appropriate for daily NAV per share calculations. The possibility exists for performance dispersion between otherwise similarly managed accounts and also with the benchmark. Net composite returns are prepared by subtracting from the monthly gross returns one-twelfth of the maximum applicable annual institutional separate account fee. Total returns of the benchmark are provided for each period depicted, expressed in USD. Source of Benchmark Performance: FACTSET ®. Benchmark returns and benchmark annualized 3-year standard deviation are not examined by independent accountants. Russell 1000 Value - Total Return - constructed to provide a comprehensive barometer for the value securities in the large-cap segment of the U.S. equity universe. Companies in this index generally have lower price-to-book ratios and lower forecasted growth values. Composite Dispersion is measured by the asset-weighted standard deviation of account returns for all accounts in the composite for the full period. For composites containing less than six accounts for the full period, dispersion is deemed not meaningful. Prior to 31-Mar-2009 accounts have been eligible for inclusion in the composite if they had assets greater than 5.0 MM USD. Prior to 1-Aug-2008, the maximum institutional separate account fee charged for this product was 65 bps. The net returns depicted in this report are based upon the historical max in effect for each of the periods depicted. For purposes of GIPS compliance, the firm is defined as MFS Investment Management® which is comprised of Massachusetts Financial Services Company (MFS) and MFS Institutional Advisors, Inc. (MFSI), each of which is a registered investment advisor, MFS Heritage Trust Company, a New Hampshire Trust company, and MFS Investment Management Canada Limited, a registered investment advisor. Total firm assets are calculated at market value and include assets managed by MFS, MFSI, MFS Heritage Trust Company and MFS Investment Management Canada Limited as well as assets managed by MFS and MFSI in a sub-advisory capacity on behalf of affiliated investment advisors that may or may not be registered under the United States Investment Advisers Act of 1940, such as MFS International (U.K.), Ltd. (MIL UK) and MFS Investment Management K.K. (MIMKK), MFS International Singapore Pte. Ltd and MFS International Australia Pty Ltd as well as assets managed by MFS and MFSI on behalf of unaffiliated investment advisors that may or may not be registered under the United States Investment Advisers Act of 1940. Total firm assets for GIPS purposes do not include assets of non-discretionary advisory relationships. In November of 2011 MFS acquired McLean Budden Limited (now MFS Investment Management Canada Limited). Total firm assets from 31-Mar-2012 forward include the assets of institutional and pooled MFS Investment Management Canada Limited products. Assets from 31-Dec-2012 forward include the MFS Investment Management Canada Limited PPM product assets. A complete list of firm composites and descriptions, along with additional information regarding policies for valuing portfolios, calculating and reporting performance, and preparing compliant presentations are available upon request. Frank Russell Company ("Russell") is the source and owner of the trademarks, service marks and copyrights related to the Russell Indexes. Russell® is a trademark of Frank Russell Company. Neither Russell nor its licensors accept any liability for any errors or omissions in the Russell Indexes and / or Russell ratings or underlying data and no party may rely on any Russell Indexes and / or Russell ratings and / or underlying data contained in this communication. No further distribution of Russell Data is permitted without Russell's express written consent. Russell does not promote, sponsor or endorse the content of this communication.
Run Time: 19-Jan-18 12:30:48 PM AELV
Performance Presentation Report 2017, Q4